Attached files
| file | filename |
|---|---|
| EX-32.2 - Shepherd's Finance, LLC | ex32-2.htm |
| EX-32.1 - Shepherd's Finance, LLC | ex32-1.htm |
| EX-31.2 - Shepherd's Finance, LLC | ex31-2.htm |
| EX-31.1 - Shepherd's Finance, LLC | ex31-1.htm |
UNITED STATES
SECURITIES AND EXCHANGE COMMISSION
WASHINGTON, DC 20549
FORM 10-K
[X] Annual Report Pursuant to Section 13 or 15(d) of the Securities Exchange Act of 1934
For the Fiscal Year Ended December 31, 2019
or
[ ] Transition Report Pursuant to Section 13 or 15(d) of the Securities Exchange Act of 1934
For the Transition Period From ________ to ________
Commission File Number 333-224557
SHEPHERD’S FINANCE, LLC
(Exact name of registrant as specified on its charter)
| Delaware | 36-4608739 | |
| (State or other jurisdiction of | (I.R.S. Employer | |
| Incorporation or organization) | Identification No.) |
13241 Bartram Park Blvd., Suite 2401, Jacksonville, Florida 32258
(Address of principal executive offices)
(302) 752-2688
(Registrant’s telephone number including area code)
Securities registered pursuant to Section 12(b) of the Act:
| Title of Each Class | Trading Symbol(s) | Name of Each Exchange on Which Registered | ||
| None | None | None |
Securities registered pursuant to Section 12(g) of the Act: None
Indicate by check mark if the registrant is a well-known seasoned issuer, as defined in Rule 405 of the Securities Act. Yes [ ] No [X]
Indicate by check mark if the registrant is not required to file reports pursuant to Section 13 or Section 15(d) of the Act. Yes [ ] No [X]
Indicate by check mark whether the registrant (1) has filed all reports required to be filed by section 13 or 15(d) of the Securities Exchange Act of 1934 during the preceding 12 months (or for such shorter period that the registrant was required to file such reports) and (2) has been subject to such filing requirements for the past 90 days. Yes [X] No [ ]
Indicate by check mark whether the registrant has submitted electronically every Interactive Data File required to be submitted pursuant to Rule 405 of Regulation S-T (§232.405 of this chapter) during the preceding 12 months (or for such shorter period that the registrant was required to submit such files). Yes [X] No [ ]
Indicate by check mark whether the registrant is a large accelerated filer, an accelerated filer, a non-accelerated filer, a smaller reporting company, or an emerging growth company. See the definitions of “large accelerated filer,” “accelerated filer,” “smaller reporting company,” and “emerging growth company” in Rule 12b-2 of the Exchange Act.
| Large accelerated filer | [ ] | Accelerated filer | [ ] | |
| Non-accelerated filer | [X] | Smaller reporting company | [X] | |
| Emerging growth company | [X] |
If an emerging growth company, indicate by check mark if the registrant has elected not to use the extended transition period for complying with any new or revised financial accounting standards provided pursuant to Section 13(a) of the Exchange Act. [X]
Indicate by check mark whether the registrant is a shell company (as defined in Rule 12b-2 of the Exchange Act). Yes [ ] No [X]
DOCUMENTS INCORPORATED BY REFERENCE:
None.
FORM 10-K
SHEPHERD’S FINANCE, LLC
TABLE OF CONTENTS
| 2 |
CAUTIONARY NOTE REGARDING FORWARD-LOOKING STATEMENTS
Certain statements contained in this Form 10-K of Shepherd’s Finance, LLC, other than historical facts, may be considered forward-looking statements within the meaning of the federal securities laws. Words such as “may,” “will,” “expect,” “anticipate,” “believe,” “estimate,” “continue,” “predict,” or other similar words identify forward-looking statements. Forward-looking statements appear in a number of places in this report, including without limitation, “Management’s Discussion and Analysis of Financial Condition and Results of Operations,” and include statements regarding our intent, belief or current expectation about, among other things, trends affecting the markets in which we operate, our business, financial condition and growth strategies. Although we believe that the expectations reflected in these forward-looking statements are based on reasonable assumptions, forward-looking statements are not guarantees of future performance and involve risks and uncertainties. Actual results may differ materially from those predicted in the forward-looking statements as a result of various factors, including but not limited to those set forth in “Item 1A. Risk Factors.” If any of the events described in “Risk Factors” occur, they could have an adverse effect on our business, consolidated financial condition, results of operations and cash flows.
When considering forward-looking statements, our risk factors, as well as the other cautionary statements in this report and in our Form S-1 Registration Statement, should be kept in mind. Do not place undue reliance on any forward-looking statement. We are not obligated to update forward-looking statements.
| 3 |
Purpose and History
Our business is focused on commercial lending to participants in the residential construction and development industry. We believe this market is underserved because of the lack of traditional lenders currently fully participating in the market. We were originally formed as a Pennsylvania limited liability company on May 10, 2007. To meet our business objectives, we changed our name to Shepherd’s Finance, LLC on December 2, 2011. We converted to a Delaware limited liability company on March 29, 2012. We are located in Jacksonville, Florida. As used in this report, “we,” “us,” “our,” and “Company” refer to Shepherd’s Finance, LLC. We have an Internet website at www.shepherdsfinance.com. We are not incorporating by reference into this report any material from our website. The reference to our website is an inactive textual reference to the uniform resource locator (URL) and is for your reference only.
The commercial loans we extend are secured by mortgages on the underlying real estate. We extend and service commercial loans to small-to-medium sized homebuilders for the purchase of lots and/or the construction of homes thereon. In some circumstances, the lot is purchased with an older home on the lot which is then either removed or rehabilitated. If the home is rehabilitated, the loan is referred to as a “rehab” loan. We also extend and service loans for the purchase of lots and undeveloped land and the development of that land into residential building lots. In addition, we may, depending on our cash position and the opportunities available to us, do none, any or all of the following: purchase defaulted unsecured debt from suppliers to homebuilders at a discount (and then secure that debt with real estate or other collateral), and purchase defaulted secured debt from financial institutions at a discount.
Experience and Resources
Our Chief Executive Officer (“CEO”), Mr. Wallach, has been in the housing industry since 1985. He was the Chief Financial Officer of a multi-billion-dollar supplier of building materials to home builders for 12 years. He also was responsible for that company’s lending business for 20 years. During those years, he was responsible for the creation and implementation of many secured lending programs to builders. Some of these were performed fully by that company, and some were performed in partnership with banks. In general, the creation of all loans, and the resolution of defaulted loans, was his responsibility, whether the loans were company loans or loans in partnership with banks. Through these programs, he was responsible for the creation of approximately $2,000,000,000 in loans which generated interest spread of $50,000,000, after deducting for loan losses. Through the years, he managed the development of systems for reducing and managing the risks and losses on defaulted loans. Mr. Wallach also was responsible for that company’s unsecured debt to builders, which reached over $300,000,000 at its peak. He also gained experience in securing defaulted unsecured debt.
In addition, our Executive Vice President of Operations has 14 years of experience in this type of lending. Our Acting Chief Financial Officer (“CFO”), who served as our CFO from January 2018 to May 2019 and was appointed Acting CFO in July 2019, has 14 years of public accounting experience. Our Executive Vice President of Sales has been in the housing industry for over 35 years years, including holding executive level positions for the majority of that time.
Opportunity, Strategy, and Approach
Background and Strategy
Finance markets are highly fragmented, with numerous large, mid-size, and small lenders and investment companies, such as banks, savings and loan associations, credit unions, insurance companies, and institutional lenders, all competing for investment opportunities. Many of these market participants have experienced losses, as a result of the housing market (which started to decline in 2006, reached its bottom in 2008, and is now getting back to historical norms as of December 31, 2019), and their participation in lending in it. As a result of credit losses and restrictive government oversight, the financial institutions are not participating in this market to the extent they had before the credit crisis (as evidenced by the general lack of availability of construction financing and the higher cost of financing for the deals actually done). We believe that these lenders, while increasing their willingness and capacity to lend, will be unable to satisfy the current demand for residential construction financing, creating attractive opportunities for niche lenders such as us for many years to come. Our goal is not to be a customer’s only source of commercial lending, but an extra, more user-friendly piece of their financing. In 2019, while more small banks returned to the construction lending market, the demand for our loan products has remained relatively constant. We attribute this to our sales staff, and an increase in the number of small home builders in the market.
| 4 |
Our loans are marketed by lending representatives who work for us and are driven to maintain long-term customer relationships. Compensation for loan originators is focused on the profitability of loans originated, not simply the volume of loans originated. As of December 31, 2019, we have retained 19 full-time employees (four of which are lending representatives) including our CEO. In his previous experience, our CEO had a nationwide staff of 20 lenders working in the field.
Our efforts are designed to create a loan portfolio that includes some or all of the following investment characteristics: (i) provides current income; (ii) is well-secured by residential real estate; (iii) is short term in nature; and (iv) provides high interest spreads.
Our investment policies may be amended or changed at any time by our board of managers. In the years ahead, we plan on continuing our expansion of lending, increasing our geographic diversity, growing our rehab lending program, and improving our financial performance. We will be adding systems and people to accomplish these goals.
As we continue to grow our business, we are focusing some of our efforts on our rehab program, which we believe in the long run will face less bank competition and have more stable demand than our new construction program.
Risk and Mitigation
We believe that while creating speculative construction loans is a high-risk venture, the reduction in competition, the differences in our lending versus typical small bank lending, and our loss mitigation techniques will all help this to continue to be a profitable business.
We engage in various activities to try to mitigate the risks inherent in this type of lending by:
| ● | Keeping the loan-to-value ratio (“LTV”), between 60% and 75% on a portfolio basis, however, individual loans may, from time to time, have a greater LTV; | |
| ● | Generally using deposits from the builder on home construction loans to ensure the completion of the home. Lending losses on defaulted loans are usually a higher percentage when the home is not built, or is only partially built; | |
| ● | Having a higher yield than other forms of secured real estate lending; | |
| ● | Using interest escrows for some of our loans; | |
| ● | Aggressively working with builders who are in default on their loan before and during foreclosure. This technique generally yields a reduced realized loss; and | |
| ● | Market grading. We review all lending markets, analyzing their historic housing start cycles. Then, the current position of housing starts is examined in each market. Markets are classified into volatile, average, or stable, and then graded based on that classification and our opinion of where the market is in its housing cycle. This grading is then used to determine the builder deposit amount, LTV, and yield. |
| 5 |
The following table contains items that we believe differentiate us from our competitors:
| Item | Our Methods | Comments | ||
| Lending Regulation | We follow various state and federal laws, but are not regulated and controlled by bank examiners from the government. We follow best practices we have learned through our experience, some of which are required of banks. | For instance, banks are not required to buy title insurance by law, but typically banks do purchase title insurance for the properties on which they lend. We generally do not, as it is very difficult to collect on title policies. Instead, we use title searches to protect our interests. | ||
| FDIC Insurance | We do not offer FDIC insurance to our unsecured notes investors. | Our yield to our customers, and our cost of funds is typically higher than that of most banks. We charge our borrowers higher interest rates than do most banks. We also save money by not paying for FDIC insurance. | ||
| Capital Structure | Typically, our unsecured notes offered through our notes program are due in one to four years, or when the Note matures. | This results in liquidity risk (i.e., funding borrowing requests or maturities of debt). | ||
| Community Reinvestment Act (CRA)(1) | We do not participate in the CRA. | Our sole purpose in making each individual loan is to maximize our returns while maintaining proper risk management. | ||
| Leverage | We try to maintain a 15% ratio of equity (including redeemable preferred equity) to loan assets. | Our equity to loan asset ratio was 13% as of December 31, 2019. The higher the ratio, the more potential losses the company can absorb without impacting debt holders. | ||
| Product Diversification | We generally make loans to builders to purchase lots and/or to construct or rehab homes. | We have extensive experience in our field. | ||
| Geographic Diversity | We lend in 21 states as of December 31, 2019. | We believe that this geographic diversity helps in down markets, as not all housing markets decrease at the same rate and time. | ||
| Governmental Bailouts | Most likely not eligible. | We are not likely to be eligible for bank bailouts, which have happened periodically. We maintain a better leverage ratio to counter this. | ||
| Underwriting | We focus on items that, in our experience, tend to predict risk. | These items include using collateral, controlling LTVs, controlling the number of loans in one subdivision, underwriting appraisals, conducting property inspections, maintaining certain files and documents similar to those that a bank might maintain. |
| (1) | The CRA subjects a bank who receives FDIC insurance to regulatory assessment to determine if the bank meets the credit needs of its entire community, and to consider that determination in its evaluation of any application made by the bank for, among other things, approval of the acquisition or establishment of a bank branch. |
| 6 |
Lines of Business
Our efforts are designed to create a portfolio that includes some or all of the following investment characteristics: (i) provides current income; (ii) is well-secured by residential real estate; (iii) is short term in nature; and (iv) provides high interest spreads. While we primarily provide commercial construction loans to homebuilders (for residential real estate), we may also purchase defaulted unsecured debt from suppliers to homebuilders at a discount (and then secure that debt with real estate or other collateral), purchase defaulted secured debt from financial institutions at a discount, and purchase real estate in which we will operate our business.
Our investment policies may be amended or changed at any time by our board of managers.
Commercial Construction Loans to Homebuilders
We extend and service commercial loans to small-to-medium sized homebuilders for the purchase of lots and/or the construction of homes thereon. Our customers generally benefit from doing business with us not just because they are able to sell additional homes (which we finance), but because, as they build additional homes, they are able to increase sales of homes that are built as contracted homes, where the eventual home owner obtains the loan. Builders generally have more success selling homes when a model or spec home is available for customers to see. We also extend and service loans for the purchase of undeveloped land and the development of that land into residential building lots. In addition, we lend money to purchase and rehabilitate older existing homes. Most of the loans are for “spec homes” or “spec lots,” meaning they are built or developed speculatively (with no specific end-user home owner in mind).
In a typical home construction transaction, a homebuilder obtains a loan to purchase a lot and build a home on that lot. In some cases, the builder has a contract with a customer to purchase the home upon its completion. In other cases, the home is built as a spec home, but the homebuilder believes it will sell before or shortly after completion, and therefore, building the home before it is under contract will increase the homebuilder’s sales and profitability. The builder may also believe that the construction of a spec home will increase the number of contract sales the homebuilder will have in a given year, as it may be easier to sell contract homes when the customer can see the builder’s work in the spec home. In some cases, these speculatively built homes are constructed with the intention to keep them as a model for a period of time, to increase contract sales, and then be sold. These are called model homes. While we may lend to a homebuilder for any of these types of new construction homes, as of December 31, 2019, about 78% of our construction loans have been spec homes and 22% have been contracts.
In a typical rehab transaction, we fund all of the purchase price, and then all or a portion of the cost to complete the project. In some circumstances, we are unable to see the inside of the home prior to closing, so we assume that anything from drywall to completion needs to be redone, as well as what we can see from the outside. Because we are flexible in our need to see the inside of the home, and we only use experienced builders as customers for this type of lending, we believe that this differentiates us from banks.
We fund the loans that we originate using available cash resources that are generated primarily from borrowings, our purchase and sale agreements, proceeds from the fixed rate subordinated notes (“Notes”) offered pursuant to our public offering (“Notes Program”), equity, and net operating cash flow. We intend to continue funding loans we originate using the same sources.
There is a seasonal aspect to home construction, and this affects our monthly cash flow. In general, since the home construction loans, we create will last less than a year on average, and since we are geographically diverse, the seasonality impact is somewhat mitigated.
Generally, our real estate loans are secured by one or more of the following:
| ● | the parcels of land to be developed; | |
| ● | finished lots; | |
| ● | new or rehabbed single-family homes; and/or | |
| ● | in most cases, personal guarantees of the principals of the borrower entity. |
| 7 |
Most of our lending is based on the following general policies:
| Customer Type | Small-to-Medium Size Homebuilders |
| Loan Type | Commercial |
| Loan Purpose | Construction/Rehabilitation of Homes or Development of Lots |
| Security | Homes, Lots, and/or Land |
| Priority | Generally, our loans are secured by a first priority mortgage lien; however, we may make loans secured by a second or other lower priority mortgage lien. |
| Loan-to-Value Averages | 60-75% |
| Loan Amounts | Average home construction loan is $300,000. Development loans vary greatly. |
| Term | Demand, however most home construction loans typically payoff in under one year, and development loans are typically three to five-year projects. |
| Rate | Cost of Funds (“COF”) plus 3%, minimum rate of 7% |
| Origination Fee | 5% for home construction loans, development loans on a case by case basis |
| Title Insurance | Only on high risk loans and rehabs |
| Hazard Insurance | Always |
| General Liability Insurance | Always |
| Credit | Builder should have significant building experience in the market, be building in the market currently, be able to make payments of interest, be able to make the required deposit, have acceptable personal credit, and have open lines of credit (unsecured) with suppliers reasonably within terms. Required deposits may be able to be avoided if we do not fund the purchase of land. We generally do not advertise to find customers, but use our loan representatives. We believe this approach will allow us to focus our efforts on builders that meet our acceptable risk profile. |
| Third Party Guarantor | None, however the loans are generally guaranteed by the owners of the borrower. |
We may change these policies at any time based on then-existing market conditions or otherwise, at the discretion of our CEO and board of managers.
| 8 |
The following is a summary of our loan portfolio to builders for home construction loans as of December 31, 2019:
(All dollar [$] amounts shown in table in thousands.)
| State | Number of | Number of | Value
of Collateral (1) | Commitment Amount | Gross Amount | Loan
to Ratio (2) | Loan Fee | |||||||||||||||||||||
| Colorado | 1 | 1 | $ | 630 | $ | 425 | $ | 424 | 67 | % | 5 | % | ||||||||||||||||
| Connecticut | 1 | 1 | 340 | 224 | 55 | 66 | % | 5 | % | |||||||||||||||||||
| Florida | 17 | 112 | 32,259 | 24,031 | 16,826 | 74 | % | 5 | % | |||||||||||||||||||
| Georgia | 3 | 4 | 2,085 | 1,343 | 917 | 64 | % | 5 | % | |||||||||||||||||||
| Idaho | 1 | 1 | 310 | 217 | 173 | 70 | % | 5 | % | |||||||||||||||||||
| Indiana | 2 | 3 | 1,687 | 1,083 | 383 | 64 | % | 5 | % | |||||||||||||||||||
| Michigan | 4 | 11 | 3,696 | 2,566 | 1,820 | 69 | % | 5 | % | |||||||||||||||||||
| New Jersey | 3 | 6 | 1,925 | 1,471 | 1,396 | 76 | % | 5 | % | |||||||||||||||||||
| New York | 2 | 3 | 1,370 | 940 | 743 | 69 | % | 5 | % | |||||||||||||||||||
| North Carolina | 6 | 20 | 5,790 | 4,009 | 2,471 | 69 | % | 5 | % | |||||||||||||||||||
| Ohio | 3 | 9 | 4,117 | 2,664 | 2,153 | 65 | % | 5 | % | |||||||||||||||||||
| Oregon | 1 | 2 | 1,137 | 796 | 739 | 70 | % | 5 | % | |||||||||||||||||||
| Pennsylvania | 3 | 24 | 20,791 | 13,322 | 11,772 | 64 | % | 5 | % | |||||||||||||||||||
| South Carolina | 11 | 25 | 8,809 | 6,419 | 4,786 | 73 | % | 5 | % | |||||||||||||||||||
| Tennessee | 3 | 4 | 1,367 | 1,069 | 503 | 78 | % | 5 | % | |||||||||||||||||||
| Texas | 3 | 4 | 1,984 | 1,270 | 843 | 64 | % | 5 | % | |||||||||||||||||||
| Utah | 2 | 4 | 1,862 | 1,389 | 1,000 | 75 | % | 5 | % | |||||||||||||||||||
| Virginia | 1 | 3 | 1,245 | 815 | 734 | 65 | % | 5 | % | |||||||||||||||||||
| Washington | 1 | 2 | 1,040 | 728 | 445 | 70 | % | 5 | % | |||||||||||||||||||
| Wisconsin | 1 | 1 | 539 | 332 | 285 | 62 | % | 5 | % | |||||||||||||||||||
| Wyoming | 1 | 1 | 228 | 160 | 143 | 70 | % | 5 | % | |||||||||||||||||||
| Total | 70 | 241 | $ | 93,211 | $ | 65,273 | $ | 48,611 | 70 | %(3) | 5 | % | ||||||||||||||||
| (1) | The value is determined by the appraised value. | |
| (2) | The loan to value ratio is calculated by taking the commitment amount and dividing by the appraised value. | |
| (3) | Represents the weighted average loan to value ratio of the loans. |
| 9 |
The following is a summary of our loan portfolio to builders for home construction loans as of December 31, 2018:
(All dollar [$] amounts shown in table in thousands.)
| State | Number of | Number of | Value
of Collateral (1) | Commitment Amount | Gross Amount | Loan
to Ratio (2) | Loan Fee | |||||||||||||||||||||
| Arizona | 1 | 1 | $ | 1,140 | $ | 684 | $ | 214 | 60 | % | 5 | % | ||||||||||||||||
| Colorado | 2 | 4 | 2,549 | 1,739 | 1,433 | 68 | % | 5 | % | |||||||||||||||||||
| Florida | 18 | 104 | 32,381 | 22,855 | 12,430 | 71 | % | 5 | % | |||||||||||||||||||
| Georgia | 5 | 6 | 5,868 | 3,744 | 2,861 | 64 | % | 5 | % | |||||||||||||||||||
| Idaho | 1 | 2 | 605 | 424 | 77 | 70 | % | 5 | % | |||||||||||||||||||
| Indiana | 2 | 5 | 1,567 | 1,097 | 790 | 70 | % | 5 | % | |||||||||||||||||||
| Michigan | 4 | 26 | 5,899 | 3,981 | 2,495 | 67 | % | 5 | % | |||||||||||||||||||
| New Jersey | 5 | 15 | 4,999 | 3,742 | 2,820 | 75 | % | 5 | % | |||||||||||||||||||
| New York | 2 | 4 | 1,555 | 1,089 | 738 | 70 | % | 5 | % | |||||||||||||||||||
| North Carolina | 5 | 12 | 3,748 | 2,580 | 1,712 | 69 | % | 5 | % | |||||||||||||||||||
| North Dakota | 1 | 1 | 375 | 263 | 227 | 70 | % | 5 | % | |||||||||||||||||||
| Ohio | 2 | 3 | 3,220 | 1,960 | 1,543 | 61 | % | 5 | % | |||||||||||||||||||
| Pennsylvania | 3 | 34 | 24,808 | 14,441 | 10,087 | 58 | % | 5 | % | |||||||||||||||||||
| South Carolina | 15 | 29 | 9,702 | 6,738 | 4,015 | 69 | % | 5 | % | |||||||||||||||||||
| Tennessee | 1 | 2 | 750 | 525 | 347 | 70 | % | 5 | % | |||||||||||||||||||
| Texas | 1 | 1 | 179 | 125 | 26 | 70 | % | 5 | % | |||||||||||||||||||
| Utah | 4 | 4 | 1,788 | 1,206 | 486 | 67 | % | 5 | % | |||||||||||||||||||
| Virginia | 3 | 6 | 1,675 | 1,172 | 806 | 70 | % | 5 | % | |||||||||||||||||||
| Total | 75 | 259 | $ | 102,808 | $ | 68,365 | $ | 43,107 | 67 | %(3) | 5 | % | ||||||||||||||||
| (1) | The value is determined by the appraised value. | |
| (2) | The loan to value ratio is calculated by taking the commitment amount and dividing by the appraised value. | |
| (3) | Represents the weighted average loan to value ratio of the loans. |
2020 Outlook
In 2020, we anticipate using proceeds from the Notes Program, the loan purchase and sale agreements, and other sources to generate additional loans (mostly spec home construction loans), increase loan balances, and increase our customer and geographic diversity. We anticipate that the rehab program will grow as a percentage of our origination volume.
Commercial Loans – Real Estate Development Loan Portfolio Summary
In a typical development transaction, a homebuilder/developer purchases a specific parcel or parcels of land. Developers must secure financing in order to pay the purchase price for the land as well as to pay expenses incurred while developing the lots. This is the financing we provide. Once financing has been secured, the lot developers create individual lots. Developers secure permits allowing the property to be developed and then design and build roads and utility systems for water, sewer, gas, and electricity to service the property. The individual lots are then sold before a home is built on them; paid off, built on and then sold; or built on, then sold and paid off (in these cases, we may subordinate our loan to the home construction loan).
The following is a summary of our loan portfolio to builders for land development as of December 31, 2019:
(All dollar [$] amounts shown in table and footnotes in thousands.)
| States | Number of Borrowers | Number of Loans | Value of Collateral(1) | Commitment Amount(2) | Gross
Amount Outstanding | Loan to Value Ratio(3) | Interest Spread | |||||||||||||||||||||
| Pennsylvania | 1 | 3 | $ | 10,191 | 7,000 | $ | 7,389 | 73 | % | 7 | % | |||||||||||||||||
| Florida | 2 | 3 | 1,301 | 1,356 | 891 | 68 | % | 7 | % | |||||||||||||||||||
| North Carolina | 1 | 1 | 400 | 260 | 99 | 25 | % | 7 | % | |||||||||||||||||||
| South Carolina | 1 | 2 | 1,115 | 1,250 | 618 | 55 | % | 7 | % | |||||||||||||||||||
| Total | 5 | 9 | $ | 13,007 | $ | 9,866 | $ | 8,997 | 69 | %(4) | 7 | % | ||||||||||||||||
| (1) | The value is determined by the appraised value adjusted for remaining costs to be paid and third-party mortgage balances. Part of this collateral is $1,470 of preferred equity in our Company. In the event of a foreclosure on the property securing these loans, the portion of our collateral that is preferred equity in our Company might be difficult to sell, which could impact our ability to eliminate the loan balance. |
| 10 |
| (2) | The commitment amount does not include unfunded letters of credit. |
| (3) | The loan to value ratio is calculated by taking the outstanding amount and dividing by the appraised value calculated as described above. |
| (4) | Represents the weighted average loan to value ratio of the loans. |
The following is a summary of our loan portfolio to builders for land development as of December 31, 2018:
| States | Number of Borrowers | Number of Loans | Value of Collateral(1) | Commitment Amount(2) | Gross
Amount Outstanding | Loan to Value Ratio(3) | Interest Spread | |||||||||||||||||||||
| Pennsylvania | 1 | 3 | $ | 8,482 | $ | 5,000 | $ | 5,037 | 59 | % | 7 | % | ||||||||||||||||
| Florida | 2 | 4 | 537 | 1,206 | 501 | 93 | % | 7 | % | |||||||||||||||||||
| South Carolina | 1 | 2 | 1,115 | 1,250 | 482 | 43 | % | 7 | % | |||||||||||||||||||
| Total | 4 | 9 | $ | 10,134 | $ | 7,456 | $ | 6,020 | 59 | %(4) | 7 | % | ||||||||||||||||
| (1) | The value is determined by the appraised value adjusted for remaining costs to be paid and third-party mortgage balances. Part of this collateral is $1,320 of preferred equity in our Company. In the event of a foreclosure on the property securing these loans, the portion of our collateral that is preferred equity in our Company might be difficult to sell, which could impact our ability to eliminate the loan balance. |
| (2) | The commitment amount does not include unfunded letters of credit. |
| (3) | The loan to value ratio is calculated by taking the outstanding amount and dividing by the appraised value calculated as described above. |
| (4) | Represents the weighted average loan to value ratio of the loans. |
Credit Quality Information
See the notes to our financial statements for credit quality information.
Competition
Historically, our industry has been highly competitive. We compete for opportunities with numerous public and private investment vehicles, including financial institutions, specialty finance companies, mortgage banks, pension funds, opportunity funds, hedge funds, REITs, and other institutional investors, as well as individuals. Many competitors are significantly larger than us, have well-established operating histories and may have greater access to capital, resources and other advantages over us. These competitors may be willing to accept lower returns on their investments or to modify underwriting standards and, as a result, our origination volume and profit margins could be adversely affected.
We believe that this is a good time to extend commercial loans to builders in the residential real estate market because, currently, this market appears underserved, home values are average, and many of our competitors have sustained losses due to declines in home values in the second half of the previous decade and, therefore, are reluctant to lend in this space at this time. We expect our loans to be different than other lenders in the markets in which we are active. Typically, the differences are:
| ● | our loans may have a higher fee; |
| 11 |
| ● | our loans typically require a small deposit which is refundable, versus a large upfront payment for the lot which is not refundable; and | |
| ● | some of our loans may have lower costs as a result of not requiring title insurance. |
Regulatory Matters
Financial Regulation
Our operations are not subject to the stringent regulatory requirements imposed upon the operations of commercial banks, savings banks, and thrift institutions. We are not subject to periodic compliance examinations by federal or state banking regulators. Further, our Notes are not certificates of deposit or similar obligations or guaranteed by any depository institution and are not insured by the FDIC or any governmental or private insurance fund, or any other entity.
The Investment Company Act of 1940
An investment company is defined under the Investment Company Act of 1940, as amended (the “Investment Company Act”), to include any issuer engaged primarily in the business of investing, reinvesting, or trading in securities. Absent an exemption, investment companies are required to register as such with the SEC and to comply with various governance and operational requirements. If we were considered an “investment company” within the meaning of the Investment Company Act, we would be subject to numerous requirements and restrictions relating to our structure and operation. If we were required to register as an investment company under the Investment Company Act and to comply with these requirements and restrictions, we may have to make significant changes in our structure and operations to comply with exemption from registration, which could adversely affect our business. Such changes may include, for example, limiting the range of assets in which we may invest. We intend to conduct our operations so as to fit within an exemption from registration under the Investment Company Act for purchasing or otherwise acquiring mortgages and other liens on and interest in real estate. In order to satisfy the requirements of such exemption, we may need to restrict the scope of our operations.
Environmental Compliance
We do not believe that compliance with federal, state, or local laws relating to the protection of the environment will have a material effect on our business in the foreseeable future. However, loans we extend or purchase are secured by real property. In the course of our business, we may own or foreclose and take title to real estate that could be subject to environmental liabilities with respect to these properties. We (or our loan customers) may be held liable to a governmental entity or to third parties for property damage, personal injury, investigation, and clean-up costs incurred by these parties in connection with environmental contamination or may be required to investigate or clean up hazardous or toxic substances or chemical release at a property. The costs associated with the investigation or remediation activities could be substantial. In addition, if we become the owner of or discover that we were formerly the owner of a contaminated site, we may be subject to common law claims by third-parties based on damages and costs resulting from environmental contamination emanating from the property. To date, we have not incurred any significant costs related to environmental compliance and we do not anticipate incurring any significant costs for environmental compliance in the future. Generally, when we are lending on property which is being developed into single family building lots, an environmental assessment is done by the builder for the various governmental agencies. When we lend for new construction on newly developed lots, the lots have generally been reviewed while they were being developed. We also perform our own physical inspection of the lot, which includes assessing potential environmental issues. Before we take possession of a property through foreclosure, we again assess the property for possible environmental concerns, which, if deemed to be a significant risk compared to the value of the property, could cause us to forego foreclosure on the property and to seek other avenues for collection.
Below are risks and uncertainties that could adversely affect our operations that we believe are material to investors. Other risks and uncertainties may exist that we do not consider material based on the information currently available to us at this time.
| 12 |
Risks Related to our Business
Our business is not industry-diversified. The United States economy is experiencing a slow recovery after the significant downturn in the homebuilding industry beginning in 2007, which was one of the worst credit and liquidity crises since the 1930s. Further deterioration in industry or economic conditions could further decrease demand and pricing for new homes and residential home lots. A decline in housing values similar to the recent national downturn in the real estate market would have a negative impact on our business. Smaller value declines will also have a negative impact on our business. These factors may decrease the likelihood we will be able to generate enough cash to repay the Notes.
Developers and homebuilders to whom we may make loans use the proceeds of our loans to develop raw land into residential home lots and construct homes. The developers obtain the money to repay our development loans by selling the residential home lots to homebuilders or individuals who will build single-family residences on the lots, or by obtaining replacement financing from other lenders. A developer’s ability to repay our loans is based primarily on the amount of money generated by the developer’s sale of its inventory of single-family residential lots. Homebuilders obtain the money to repay our loans by selling the homes they construct or by obtaining replacement financing from other lenders, and thus, the homebuilders’ ability to repay our loans is based primarily on the amount of money generated by the sale of such homes.
The homebuilding industry is cyclical and is significantly affected by changes in industry conditions, as well as in general and local economic conditions, such as:
| ● | employment level and job growth; | |
| ● | demographic trends, including population increases and decreases and household formation; | |
| ● | availability of financing for homebuyers; | |
| ● | interest rates; | |
| ● | affordability of homes; | |
| ● | consumer confidence; | |
| ● | levels of new and existing homes for sale, including foreclosed homes and homes held by investors and speculators; and | |
| ● | housing demand generally. |
These conditions may occur on a national scale or may affect some of the regions or markets in which we operate more than others.
We generally lend a percentage of the values of the homes and lots. These values are determined shortly prior to the lending. If the values of homes and lots in markets in which we lend drop fast enough to cause the builders losses that are greater than their equity in the property, we will be forced to liquidate the loan in a fashion which will cause us to lose money. If these losses when combined and added to our other expenses are greater than our revenue from interest charged to our customers, we will lose money overall, which will hurt our ability to pay interest and principal on the Notes. Values are typically affected by demand for homes, which can change due to many factors, including but not limited to, demographics, interest rates, overall economy, cost of building materials and labor, availability of financing for end-users, inventory of homes available and governmental action or inaction. The tightening credit markets have made it more difficult for potential homeowners to obtain financing to purchase homes. If housing prices decline or sales in the housing market decline, our customers may have a hard time selling their homes at a profit. This could cause the amount of defaulted loans that we will own to increase. An increase in defaulted loans would reduce our revenue and could lead to losses on our loans. A decline in housing prices will further increase our losses on defaulted loans. If the amount of defaulted loans or the loss per defaulted loan is large enough, we will operate at a loss, which will decrease our equity. This could cause us to become insolvent, and we will not be able to pay back Note holders’ principal and interest on the Notes.
| 13 |
The homebuilding industry could experience adverse conditions, and the industry’s implementation of strategies in response to such conditions may not be successful.
The United States homebuilding industry experienced a significant downturn beginning in 2007. During the course of the downturn, many homebuilders focused on generating positive operating cash flow, resizing and reshaping their product for a more price-conscious consumer and adjusting finished new home inventories to meet demand, and did so in many cases by significantly reducing the new home prices and increasing the level of sales incentives. Notwithstanding these strategies, homebuilders continued to experience an elevated rate of sales contract cancelations, as many of the factors that affect new sales and cancelation rates are beyond the control of the homebuilding industry. Although the homebuilding industry has recently experienced positive gains, there can be no assurance that these gains will continue. The homebuilding industry could suffer similar, or worse, adverse conditions in the future. Continued decreases in new home sales would increase the likelihood of defaults on our loans and, consequently, reduce our ability to repay Note holders’ principal and interest on the Notes.
We have $55,369,000 of loan assets as of December 31, 2019. A 35% reduction in total collateral value would reduce our earnings and net worth by $4,657,000. Larger reductions would result in lower earnings and lower net worth.
As of December 31, 2019, we had $55,369,000 of loan assets on our books. These assets are recorded on our balance sheet at the lower of the loan amount or the value of the collateral after deduction for expected selling expenses. A reduction in the value of the underlying collateral could result in significant losses. A 35% reduction, for instance, would result in a $4,657,000 loss. Accordingly, our business is subject to risk of a loss of a portion of our Note holders’ investments if such a reduction were to occur.
We have $8,997,000 of development loan assets as of December 31, 2019, which unlike our construction loans, are long term loans. This longer duration as well as the nature of collateral (raw ground and lots) creates more risk for that portion of our portfolio.
Development loans are riskier than construction loans for two reasons: the duration of the loan and the nature of the collateral. The duration (being three to five years as compared to generally less than one year on construction loans) allows for a greater period of time over which the collateral value could decrease. Also, the collateral value of development loans is more likely to change in greater percentages than that of built homes. For example, during a 70% reduction in housing starts, newly completed homes still have value, but lots may be worthless. This added risk to this portion of our portfolio adds risk to our investors as our net worth would be significantly impacted by losses.
Currently, we are reliant on a single developer and homebuilder, the Hoskins Group, who is concentrated in the Pittsburgh, Pennsylvania market, for a significant portion of our revenues and a portion of our capital. Our second largest customer is in the Orlando, Florida market and is also a significant portion of our portfolio.
As of December 31, 2019, 25% of our outstanding loan commitments consisted of loans made to Benjamin Marcus Homes, LLC and Investor’s Mark Acquisitions, LLC, both of which are owned by Mark Hoskins (collectively all three parties are referred to herein as the “Hoskins Group”). We refer to the loans to the Hoskins Group as the “Pennsylvania Loans.” The Hoskins Group is concentrated in the Pittsburgh, Pennsylvania market. The Hoskins Group also has a preferred equity interest in us. Therefore, currently, we are reliant upon a single developer and homebuilder who is concentrated in a single city, for a significant portion of our revenues and a portion of our capital. Any event of bankruptcy, insolvency, or general downturn in the business of this developer and homebuilder or in the Pittsburgh housing market generally will have a substantial adverse financial impact on our business and our ability to pay back Note holders’ investments in the Notes in the long term. Adverse conditions affecting the local housing market could include, but are not limited to, declines in new housing starts, declines in new home prices, declines in new home sales, increases in the supply of available building lots or built homes available for sale, increases in unemployment, and unfavorable demographic changes. One of our independent managers, Gregory L. Sheldon, also serves an advisor to the Hoskins Group and, consequently, Mr. Sheldon may face conflicts of interest in the advice that he provides to us and the Hoskins Group, including if any such adverse condition were to materialize.
| 14 |
Also, as of December 31, 2019, 15% of our outstanding loan commitments consisted of loans made to a customer in Orlando, Florida.
We have foreclosed assets as of December 31, 2019, which unlike our loans, are recorded on our balance sheet at the value of the collateral, net of estimated selling expenses.
A reduction in the value of the underlying collateral of our foreclosed assets could result in significant losses. For example, a 35% reduction in the value of the underlying collateral (net of estimated selling expenses) would result in a $1,720,000 loss. Our business is subject to increased risk of not being able to repay timely our Note holders’ investments if such a reduction were to occur.
Increases in interest rates, reductions in mortgage availability, or increases in other costs of home ownership could prevent potential customers from buying new homes and adversely affect our business and financial results.
Most new home purchasers finance their home purchases through lenders providing mortgage financing. Immediately prior to 2007, interest rates were at historically low levels and a variety of mortgage products were available. As a result, home ownership became more accessible. The mortgage products available included features that allowed buyers to obtain financing for a significant portion or all of the purchase price of the home, had very limited underwriting requirements or provided for lower initial monthly payments. Accordingly, more people were qualified for mortgage financing.
Since 2007, the mortgage lending industry has experienced significant instability, beginning with increased defaults on subprime loans and other nonconforming loans and compounded by expectations of increasing interest payment requirements and further defaults. This, in turn, resulted in a decline in the market value of many mortgage loans and related securities. Lenders, regulators and others questioned the adequacy of lending standards and other credit requirements for several loan products and programs offered in recent years. Credit requirements tightened, and investor demand for mortgage loans and mortgage-backed securities declined. In general, fewer loan products, tighter loan qualifications, and a reduced willingness of lenders to make loans make it more difficult for many buyers to finance the purchase of homes. These factors served to reduce the pool of qualified homebuyers and made it more difficult to sell to first-time and move-up buyers.
Mortgage rates may rise significantly over the next several years. The benefit of recent trends loosening credit to potential end users of homes may be outweighed by the rise of interest rates for those borrowers, which might lower demand for new homes.
A reduction in the demand for new homes may reduce the amount and price of the residential home lots sold by the developers and homebuilders to which we loan money and/or increase the amount of time such developers and homebuilders must hold the home lots in inventory. These factors increase the likelihood of defaults on our loans, which would adversely affect our business and consolidated financial results.
Most of our assets are commercial construction loans to homebuilders and/or developers which are a higher than average credit risk, and therefore could expose us to higher rates of loan defaults, which could impact our ability to repay amounts owed to Note holders.
Our primary business is extending commercial construction loans to homebuilders, along with some loans for land development. These loans are considered higher risk because the ability to repay depends on the homebuilder’s ability to sell a newly built home. These homes typically are not sold by the homebuilder prior to commencement of construction. Therefore, we may have a higher risk of loan default among our customers than other commercial lending companies. If we suffer increased loan defaults, in any given period, our operations could be materially adversely affected, and we may have difficulty making our principal and interest payments on the Notes.
| 15 |
If we lose or are unable to hire or retain competent personnel, we may be delayed or unable to implement our business plan, which would adversely affect our ability to repay the Notes.
We do not have an employment agreement with any of our employees and cannot guarantee that they will remain affiliated with us. We do not have key man insurance on any of our employees. If any of our key employees were to cease their affiliation with us, our consolidated operating results could suffer. We believe that our future success depends, in part, upon our ability to hire and retain additional personnel. We cannot assure Note holders that we will be successful in attracting and retaining such personnel, which could hinder our ability to implement our business plan.
Employee misconduct could harm us by subjecting us to monetary loss, significant legal liability, regulatory scrutiny, and reputational harm.
Our reputation is critical to maintaining and developing relationships with our existing and potential customers and third parties with whom we do business. There is a risk that our employees could engage in misconduct that adversely affects our business. For example, if an employee were to engage-or be accused of engaging-in illegal or suspicious activities including fraud or theft, we could suffer direct losses from the activity, and in addition we could be subject to regulatory sanctions and suffer serious harm to our reputation, financial condition, customer relationships, and ability to attract future customers or employees. Employee misconduct could prompt regulators to allege or to determine based upon such misconduct that we have not established adequate supervisory systems and procedures to inform employees of applicable rules or to detect and deter violations of such rules. It is not always possible to deter employee misconduct, and the precautions we take to detect and prevent misconduct may not be effective in all cases. Misconduct by our employees, or even unsubstantiated allegations of misconduct, could result in a material adverse effect on our reputation and our business.
A failure in, or breach of, our operational or security systems or infrastructure, or those of our third-party vendors, including as a result of cyber-attacks, could disrupt our business, result in the disclosure or misuse of confidential or proprietary information, damage our reputation, increase our costs, and cause losses.
We rely heavily on communications and information systems to conduct our business. Information security risks for our business have generally increased in recent years in part because of the proliferation of new technologies; the use of the Internet and telecommunications technologies to process, transmit, and store electronic information, including the management and support of a variety of business processes, including financial transactions and records, personally identifiable information, and customer and investor data; and the increased sophistication and activities of organized crime, hackers, terrorists, activists, and other external parties. As customer, public, and regulatory expectations regarding operational and information security have increased, our operating systems and infrastructure must continue to be safeguarded and monitored for potential failures, disruptions, and breakdowns. Certain of our software and technology systems have been developed internally and may be vulnerable to unauthorized access or disclosure. Our business, financial, accounting, and data processing systems, or other operating systems and facilities, may stop operating properly or become disabled or damaged as a result of a number of factors, including events that are wholly or partially beyond our control. For example, there could be electrical or telecommunication outages; natural disasters such as earthquakes, tornadoes, and hurricanes; disease pandemics; events arising from local or larger scale political or social matters, including terrorist acts; and, as described below, cyber-attacks.
Our business relies on its digital technologies, computer and email systems, software, and networks to conduct its operations. Although we have information security procedures and controls in place, our technologies, systems, and networks and, because the nature of our business involves the receipt and retention of personal information about our customers, our customers’ personal accounts may become the target of cyber-attacks or information security breaches that could result in the unauthorized release, gathering, monitoring, misuse, loss, or destruction of our customers’, or other third parties’ confidential information. Third parties with whom we do business or who facilitate our business activities, including intermediaries or vendors that provide service or security solutions for our operations, and other third parties, could also be sources of operational and information security risk to us, including from breakdowns or failures of their own systems or capacity constraints. In addition, hardware, software, or applications we develop or procure from third parties may contain defects in design or manufacture or other problems that could unexpectedly compromise information security.
| 16 |
While we have disaster recovery and other policies and procedures designed to prevent or limit the effect of the failure, interruption, or security breach of our information systems, there can be no assurance that any such failures, interruptions, or security breaches will not occur or, if they do occur, that they will be adequately addressed. Our risk and exposure to these matters remain heightened because of the evolving nature of these threats. As a result, cyber security and the continued development and enhancement of our controls, processes, and practices designed to protect our systems, computers, software, data, and networks from attack, damage, or unauthorized access remain a focus for us. As threats continue to evolve, we may be required to expend additional resources to continue to modify or enhance our protective measures or to investigate and remediate information security vulnerabilities. Disruptions or failures in the physical infrastructure or operating systems that support our business and customers, or cyber-attacks or security breaches of the networks or systems, could result in regulatory fines, penalties or intervention, reputation damage, reimbursement or other compensation costs, and/or additional compliance costs, any of which could have a material effect on our results of operations or financial condition. Furthermore, if such attacks are not detected immediately, their effect could be compounded.
We are susceptible to customer fraud, which could cause us to suffer losses on our loan portfolio.
Because most of our customers do not publicly report their financial condition and therefore typically are not required to be audited on a regular basis, we are susceptible to a customer’s fraud, which could cause us to suffer losses on our loan portfolio. The failure of a customer to accurately report its financial position, compliance with loan covenants, or eligibility for additional borrowings could result in our providing loans that do not meet our underwriting criteria, defaults in loan payments, and the loss of some or all of the principal of a particular loan or loans. Customer fraud can come in other forms, including but not limited to fraudulent invoices for work done, appraisal fraud, and fraud related to inspections done by third parties.
We have entered into loan purchase and sale agreements with third parties to sell them portions of some of our loans. This increases our leverage. While the agreements are intended to increase our profitability, large loan losses and/or idle cash, could actually reduce our profitability, which could impair our ability to pay principal and/or interest on the Notes.
The loan purchase and sale agreements we entered into have allowed us to increase our loan assets and debt. If loans that we create have significant losses, the benefit of larger balances can be outweighed by the additional loan losses. Also, while these transactions are booked as secured financing, they are not lines of credit. Accordingly, we will have increased our loan balances without increasing our lines of credit, which can cause a decrease in liquidity. One solution to this liquidity problem is having idle cash for liquidity, which then could reduce our profitability. If either of these problems is persistent and/or significant, our ability to pay interest and principal on our Notes may be impaired.
Additional competition may decrease our profitability, which would adversely affect our ability to repay the Notes.
We may experience increased competition for business from other companies and financial institutions that are willing to extend the same types of loans that we extend at lower interest rates and/or fees. These competitors also may have substantially greater resources, lower cost of funds, and a better-established market presence. If these companies increase their marketing efforts to our market niche of borrowers, or if additional competitors enter our markets, we may be forced to reduce our interest rates and fees in order to maintain or expand our market share. Any reduction in our interest rates, interest income, or fees could have an adverse impact on our profitability and our ability to repay the Notes.
Our real estate loans are illiquid, which could restrict our ability to respond rapidly to changes in economic conditions.
The real estate loans we currently hold and intend to extend are illiquid. As a result, our ability to sell under-performing loans in our portfolio or respond to changes in economic, financial, investment, and other conditions may be very limited. We cannot predict whether we will be able to sell any real estate loan for the price or on the terms set by us, or whether any price or other terms offered by a prospective purchaser would be acceptable to us. We also cannot predict the length of time needed to find a willing purchaser and to close the sale of a loan. The relative illiquidity of our loan assets may impair our ability to generate sufficient cash to make required interest and principal payments on the Notes.
| 17 |
Our systems and procedures might be inadequate to handle our potential growth. Failure to successfully improve our systems and procedures would adversely affect our ability to repay the Notes.
We may experience growth that could place a significant strain upon our operational systems and procedures. Initially, all of our computer systems used electronic spreadsheets and we utilized other methods that a small company would use. Over time, we added a loan document system which many banks use to produce closing documents for loans. During March 2018, we replaced our previous electronic spreadsheet system for Notes investors with a proprietary system. In addition, during July 2019, we replaced our loan asset tracking system with a new proprietary system. We may fail to implement these systems effectively. Additionally, our efforts to make these improvements may divert the focus of our personnel. If any of these systems fail, we could have a material adverse effect on our business, financial condition, results of operations, and, ultimately, our ability to repay principal and interest on the Notes.
If we do not meet the requirements to maintain effective internal controls over financial reporting, our ability to raise new capital will be harmed.
If we do not maintain effective internal controls over our financial reporting in accordance with Section 404 of the Sarbanes-Oxley Act of 2002, then it could result in delaying future SEC filings or future offerings. If future SEC filings or future offerings are delayed, it could have an extreme negative impact on our cash flow causing us to default on our obligations, including on the Notes.
We are subject to risk of significant losses on our loans because we do not require our borrowers to insure the title of their collateral for our loans.
It is customary for lenders extending loans secured by real estate to require the borrower to provide title insurance with minimum coverage amounts set by the lender. We do not require most of our homebuilders to provide title insurance on their collateral for our loans to them. This represents an additional risk to us as the lender. The homebuilder may have a title problem which normally would be covered by insurance, but may result in a loss on the loan because insurance proceeds are not available.
If a large number of our current and prospective borrowers are unable to repay their loans within a normal average number of months, we will experience a significant reduction in our income and liquidity, and may not be able to repay the Notes as they become due.
Construction loans that we extend are expected to be repaid in a normal average number of months, typically nine months, depending on the size of the loan. Development loans are expected to last for many years. We have interest paid on a monthly basis, but also charge a fee which will be earned over the life of the loan. If these loans are repaid over a longer period of time, the amount of income that we receive on these loans expressed as a percentage of the outstanding loan amount will be reduced, and fewer loans with new fees will be able to be made, since the cash will not be available. This will reduce our income as a percentage of the Notes, and if this percentage is significantly reduced it could impair our ability to pay principal and interest on the Notes.
Our cost of funds is substantially higher than that of banks.
Because we do not offer FDIC insurance, and because we want to grow our Notes Program faster than most banks want to grow their CD base, our Notes offer significantly higher rates than bank CDs. Our cost of funds is higher than banks’ cost of funds due to, among other factors, the higher rate that we pay on our Notes and other sources of financing. This may make it more difficult for us to compete against banks when they rejoin our niche lending market in large numbers. This could result in losses which could impair or eliminate our ability to pay interest and principal on our outstanding Notes.
| 18 |
We are subject to the general market risks associated with real estate construction and development.
Our financial performance depends on the successful construction and/or development and sale of the homes and real estate parcels that serve as security for the loans we make to homebuilders and developers. As a result, we are subject to the general market risks of real estate construction and development, including weather conditions, the price and availability of materials used in construction of homes and development of lots, environmental liabilities and zoning laws, and numerous other factors that may materially and adversely affect the success of the projects.
Our operations are not subject to the stringent banking regulatory requirements designed to protect investors, so repayment of Note holders’ investments is completely dependent upon our successful operation of our business.
Our operations are not subject to the stringent regulatory requirements imposed upon the operations of commercial banks, savings banks, and thrift institutions, and are not subject to periodic compliance examinations by federal or state banking regulators. For example, we will not be well diversified in our product risk, and we cannot benefit from government programs designed to protect regulated financial institutions. Therefore, an investment in our Notes does not have the regulatory protections that the holder of a demand account or a certificate of deposit at a bank does. The return on any Notes purchased by a Note holder is completely dependent upon our successful operations of our business. To the extent that we do not successfully operate our business, our ability to pay interest and principal on the Notes will be impaired.
We are an “emerging growth company” under the federal securities laws and are subject to reduced public company reporting requirements.
We are an “emerging growth company,” as defined in the Jumpstart Our Business Startups Act, or the JOBS Act, and are eligible to take advantage of certain exemptions from, or reduced disclosure obligations relating to, various reporting requirements that are normally applicable to public companies.
We will remain an “emerging growth company” until the earliest of (1) the last day of the first fiscal year in which we have total annual gross revenues of $1.07 billion or more, (2) the last day of the fiscal year following the fifth anniversary of the date of the first sale of our common equity securities pursuant to an effective registration statement, (3) the date on which we become a “large accelerated filer” as defined in Rule 12b-2 under the Exchange Act (which would occur if the market value of our common equity held by non-affiliates exceeds $700 million, measured as of the last business day of our most recently completed second fiscal quarter, and we have been publicly reporting for at least 12 months) or (4) the date on which we have issued more than $1 billion in non-convertible debt during the preceding three-year period. Under the JOBS Act, emerging growth companies are not required to (1) provide an auditor’s attestation report on management’s assessment of the effectiveness of internal control over financial reporting, pursuant to Section 404 of the Sarbanes-Oxley Act, (2) comply with new requirements adopted by the Public Company Accounting Oversight Board, or the PCAOB, which require mandatory audit firm rotation or a supplement to the auditor’s report in which the auditor must provide additional information about the audit and the issuer’s financial statements, (3) comply with new audit rules adopted by the PCAOB after April 5, 2012 (unless the SEC determines otherwise), (4) provide certain disclosures relating to executive compensation generally required for larger public companies or (5) hold shareholder advisory votes on executive compensation.
Additionally, the JOBS Act provides that an “emerging growth company” may take advantage of an extended transition period for complying with new or revised accounting standards that have different effective dates for public and private companies. This means an “emerging growth company” can delay adopting certain accounting standards until such standards are otherwise applicable to private companies. However, we have elected to “opt out” of such extended transition period, and will therefore comply with new or revised accounting standards on the applicable dates on which the adoption of such standards is required for non-emerging growth companies. Section 107 of the JOBS Act provides that our decision to opt out of such extended transition period for compliance with new or revised accounting standards is irrevocable.
| 19 |
We are required to devote resources to comply with various provisions of the Sarbanes-Oxley Act, including Section 404 relating to internal controls testing, and this may reduce the resources we have available to focus on our core business.
Pursuant to Section 404 of the Sarbanes-Oxley Act and the related rules adopted by the SEC and the Public Company Accounting Oversight Board, or PCAOB, our management is required to report on the effectiveness of our internal controls over financial reporting. We may encounter problems or delays in completing any changes necessary to our internal controls over financial reporting. Among other things, we may not be able to conclude on an ongoing basis that we have effective internal controls over financial reporting in accordance with Section 404. Any failure to comply with the various requirements of the Sarbanes-Oxley Act may require significant management time and expenses and divert attention or resources away from our core business. In addition, we may encounter problems or delays in completing the implementation of any requested improvements provided by our independent registered public accounting firm.
We are exposed to risk of environmental liabilities with respect to properties of which we take title. Any resulting environmental remediation expense may reduce our ability to repay the Notes.
In the course of our business, we may foreclose and take title to real estate that could be subject to environmental liabilities. We may be held liable to a governmental entity or to third parties for property damage, personal injury, investigation and clean-up costs incurred by these parties in connection with environmental contamination, or may be required to investigate or clean up hazardous or toxic substances or chemical release at any property. The costs associated with investigation or remediation activities could be substantial. In addition, as the owner or former owner of a contaminated site, we may be subject to common law claims by third parties based on damages and costs resulting from environmental contamination emanating from the property. If we ever become subject to significant environmental liabilities, our business, financial condition, liquidity, and results of operations could be materially and adversely affected.
Our underwriting standards and procedures are more lenient than conventional lenders.
We invest in loans with borrowers who will not be required to meet the credit standards of conventional mortgage lenders, which is riskier than investing in loans made to borrowers who are required to meet those higher credit standards. Because we generally approve loans more quickly than some other lenders or providers of capital, there may be a risk that the due diligence we perform as part of our underwriting procedures will not reveal the need for additional precautions. If so, the interest rate that we charge and the collateral that we require may not adequately protect us or generate adequate returns for the risk undertaken.
The collateral securing our real estate loans may not be sufficient to pay back the principal amount in the event of a default by the borrowers.
In the event of default, our real estate loan investments are generally dependent entirely on the loan collateral to recover our investment. Our loan collateral consists primarily of a mortgage on the underlying property. In the event of a default, we may not be able to recover the premises promptly and the proceeds we receive upon sale of the property may be adversely affected by risks generally related to interests in real property, including changes in general or local economic conditions and/or specific industry segments, declines in real estate values, increases in interest rates, real estate tax rates and other operating expenses including energy costs, changes in governmental rules, regulations and fiscal policies (including environmental legislation), acts of God, and other factors which are beyond our or our borrowers’ control. Current market conditions may reduce the proceeds we are able to receive in the event of a foreclosure on our collateral. Our remedies with respect to the loan collateral may not provide us with a recovery adequate to recover our investment.
| 20 |
Risks Related to Conflicts of Interest
Our CEO (who is also on our board of managers) will face conflicts of interest as a result of the secured lines of credit made to us, which could result in actions that are not in the best interests of our Note holders.
We have two lines of credit from Daniel M. Wallach (our CEO and chairman of the board of managers) and his affiliates. The first line of credit has a maximum principal borrowing amount of $1,250,000 and is payable to Mr. Wallach and his wife, Joyce S. Wallach, as tenants by the entirety (the “Wallach LOC”). The second line of credit has a maximum principal borrowing amount of $250,000 and is payable to the 2007 Daniel M. Wallach Legacy Trust (the “Wallach Trust LOC,” and together with the Wallach LOC, the “Wallach Affiliate LOCs”). As of December 31, 2019, we borrowed $0 on the Wallach Trust LOC, with availability on that line of credit of $250,000, and $44,000 on the Wallach LOC, with remaining availability on that line of credit of $1,206,000. The interest rates on the Wallach Affiliate LOCs generally equal the prime rate plus 3% and were 7.75% as of December 31, 2019. The Wallach Affiliate LOCs are collateralized by a lien against all of our assets. The Notes are subordinated in right of payment to all secured debt, including these Wallach Affiliate LOCs. Pursuant to the promissory note for each Wallach Affiliate LOC, the lenders have the option of funding any amount up to the face amount of the note, in the lender’s sole and absolute discretion. Therefore, Mr. Wallach will face conflicts of interest in deciding whether and when to exercise any rights pursuant to the Wallach Affiliate LOCs. If these Wallach affiliates exercise their rights to collect on their collateral upon a default by us, we could lose some or all of our assets, which could have a negative effect on our ability to repay the Notes.
Some of our employees and managers may face conflicts of interest as a result of their and their relatives’ investment in the Notes, which could result in actions that are not in your best interests.
Employees, managers, members, and relatives of managers and members have invested in the Notes, with $3,849,000 outstanding as of December 31, 2019. While investment in the Notes by our affiliates may align their interests with those of other Note holders, it could also create conflicts of interest by influencing those employees’ or managers’ actions during times of financial difficulties. For example, the fact that certain of our managers hold Notes, and the value of Notes they hold, could influence their decision to redeem Notes at a time or times when it would be prudent to use our cash resources to build capital, pay down other outstanding obligations, or grow our business. There may be other situations not presently foreseeable in which the ownership of Notes by related persons may create conflicts of interest. These conflicts of interest could result in action or inaction by management that is adverse to other holders of the Notes.
As a result of his large equity ownership in the Company, our CEO will face a conflict of interest in deciding the amount of distributions to equity owners, which could result in actions that are not in the best interests of Note holders.
As of December 31, 2019, our CEO (who is also on the board of managers) beneficially owned 80.7% of the common equity of the Company. He and his wife also own 48% the Series C cumulative preferred units outstanding as of December 31, 2019. Since the Company is taxed as a partnership for federal income tax purposes, all profits and losses flow through to the equity owners. Therefore, Mr. Wallach and his affiliated equity owners of the Company will be motivated to distribute profits to the equity owners on an annual basis, rather than retain earnings in the Company for Company purposes. There is currently no limit in the indenture or otherwise on the amount of funds that may be distributed by the Company to its equity owners. If substantial funds are distributed to the equity owners, the liquidity and capital resources of the Company will be reduced and our ability to repay the Notes may be negatively impacted.
We have three lines of credit from affiliates which allow us to incur a significant amount of secured debt. These lines are collateralized by a lien against all of our assets. Our purchase and sale agreements function as secured debt as well. We expect to incur a significant amount of additional debt in the future, including issuance of the Notes, which will subject us to increased risk of loss.
As of December 31, 2019, we had $189,000 of secured debt outstanding on our senior debt lines of credit from affiliates of $2,500,000 and the capacity to sell portions of many loans under the terms of our loan purchase and sale agreements. The affiliate loans are collateralized by a lien against all of our assets. The loan purchase and sale agreements and other secured debt are with third-parties and are collateralized by loans. In addition, we expect to incur a significant amount of additional debt in the future, including issuance of the Notes, borrowing under credit facilities and other arrangements. The Notes will be subordinated in right of payment to all secured debt, including the affiliate loans. Therefore, in the event of a default on the secured debt, affiliates of our Company, including Mr. Wallach, have the right to receive payment ahead of Note holders, as do other secured debt holders, such as the loan purchasers under the purchase and sale agreements. Accordingly, our business is subject to increased risk of a total loss of our Note holders’ investments if we are unable to repay all of our secured debt.
| 21 |
Risks Related to Liquidity
We depend on the availability of significant sources of credit to meet our liquidity needs and our failure to maintain these sources of credit could materially and adversely affect our liquidity in the future.
We plan to maintain our loan purchase and sale agreements and our lines of credit from affiliates so that we may draw funds when necessary to meet our obligation to redeem maturing Notes, pay interest on the Notes, meet our commitments to lend money to our customers, and for other general corporate purposes. Certain features of the loan purchase and sale agreements with third parties have added liquidity and flexibility, which have lessened the need for the lines of credit from affiliates. If we fail to maintain liquidity through our loan purchase and sale agreements and lines of credit, we will be more dependent on the proceeds from the Notes for our continued liquidity. If the sale of the Notes is significantly reduced or delayed for any reason and we fail to obtain or renew a line of credit, or we default on any of our lines of credit, then our ability to meet our obligations, including our Note obligations, could be materially adversely affected, and we may not have enough cash to pay back Note holders’ investments. Also, the failure to maintain an active line of credit (and therefore using cash for liquidity instead of a borrowing line), will reduce our earnings, because we will be paying interest on the Notes, while we are holding cash instead of reducing our borrowings.
We have unfunded commitments to builders as of December 31, 2019. If every builder borrowed every amount allowed (which would mean all of their homes were complete) and no builders paid us back, we would need to fund that amount. While some of that amount would automatically come from our loan purchase and sale agreements, the rest would have to come from our Notes Program and/or our lines of credit. Therefore, we may not have the ability to fund our commitments to builders.
As of December 31, 2019, we have $16,662,000 of unfunded commitments to builders. If every builder borrowed every amount allowed and no builders repaid us then we would need to fund that amount. Lines of credit, loan purchase and sale agreements, payoffs from builders, and immediate investments in our Notes may not be enough to fund our commitments to builders as they become payable. If we default on these obligations, then we may face any one or more of the following: a higher default rate, lawsuits brought by customers, an eventual lack of business from borrowers, missed principal and interest payments to Note holders and holders of other debt, and a lack of desire for investors to invest in our Notes Program. Therefore, we could default on our repayment obligations to our Note holders.
We have a secured line of credit which expires in 2020, and the unsecured portion of a line of credit which also expires in 2020. Failure of those lines to renew could strain our ability to pay other obligations.
We have a $1,325,000 line of credit due in July 2020 (the “Shuman LOC”). The Shuman LOC was fully borrowed as of December 31, 2019. We do not know whether the Shuman LOC will be renewed. We also have a $7,000,000 line of credit, a portion of which is unsecured (the “Unsecured Swanson LOC”). The balance on the Unsecured Swanson LOC as of December 31, 2019 was $1,176,000, $1,000,000 of which is due in June 2020 with the remainder due in November 2020. We do not know whether the Unsecured Swanson LOC will be renewed. If we are unable to renegotiate or extend these lines of credit, then we may default on one or both of those lines of credit. Therefore, we could default on repayment obligations to some of our debt holders, including our Note holders.
| 22 |
If the proceeds from the issuance of the Notes exceed the cash flow needed to fund the desirable business opportunities that are identified, we may not be able to invest all of the funds in a manner that generates sufficient income to pay the interest and principal on the Notes.
Our ability to pay interest on our debt, including the Notes, pay our expenses, and cover loan losses is dependent upon interest and fee income we receive from loans extended to our customers. If we are not able to lend to a sufficient number of customers at high enough interest rates, we may not have enough interest and fee income to meet our obligations, which could impair our ability to pay interest and principal on the Notes. If money brought in from new Notes and from repayments of loans from our customers exceeds our short-term obligations such as expenses, Note interest and redemptions, and line of credit principal and interest, then it is likely to be held as cash, which will have a lower return than the interest rate we are paying on the Notes. This will lower earnings and may cause losses which could impair our ability to repay the principal and interest on the Notes.
The indenture does not contain the type of covenants restricting our actions, such as restrictions on creating senior debt, paying distributions to our owners, merging, recapitalizing, and/or entering into highly leveraged transactions. The indenture does not contain provisions requiring early payment of Notes in the event we suffer a material adverse change in our business or fail to meet certain financial standards. Therefore, the indenture provides very little protection of Note holders’ investments.
The Notes do not have the benefit of extensive covenants. The covenants in the indenture are not designed to protect Note holders’ investments if there is a material adverse change in our consolidated financial condition, results of operations, or cash flows. For example, the indenture does not contain any restrictions on our ability to create or incur senior debt or other debt to pay distributions to our equity holders, including our Chief Executive Officer and our Executive Vice President of Sales. It also does not contain any financial covenants (such as a fixed charge coverage or a minimum amount of equity) to help ensure our ability to pay interest and principal on the Notes. The indenture does not contain provisions that permit Note holders to require that we redeem the Notes if there is a takeover, recapitalization or similar restructuring. In addition, the indenture does not contain covenants specifically designed to protect Note holders if we engage in a highly leveraged transaction. Therefore, the indenture provides very little protection of Note holders’ investments.
Payment on the Notes is subordinate to the payment of our outstanding present and future senior debt, if any. Since there is no limit to the amount of senior debt we may incur, our present and future senior debt may make it difficult to repay the Notes.
Our loan purchase and sale agreements and secured lines of credit with third-parties also function as senior debt. The balance on those loan purchase and sale agreements and other secured debt, net of deferred financing costs was $26,991,000 on December 31, 2019, and is expected to grow in the future. We also have senior subordinated notes which are senior to the Notes of $1,407,000 as of December 31, 2019. In addition, we entered into a line of credit agreement which is senior unsecured, with a maximum outstanding balance of $500,000. The Notes are subordinate and junior in priority to any and all of our senior debt and senior subordinated debt, and equal to any and all non-senior debt, including other Notes. The Notes are senior to junior subordinated notes. There are no restrictions in the indenture regarding the amount of senior debt or other indebtedness that we may incur. Upon the maturity of our senior debt, by lapse of time, acceleration or otherwise, the holders of our senior debt have first right to receive payment, in full, prior to any payments being made to a Note holder or to other non-senior debt. Therefore, upon such maturity of our senior debt Note holders would only be repaid in full if the senior debt is satisfied first and, following satisfaction of the senior debt, if there is an amount sufficient to fully satisfy all amounts owed under the Notes and any other non-senior debt.
Additional competition for investment dollars may decrease our liquidity, which would adversely affect our ability to repay the Notes.
We could experience increased competition for investment dollars from other companies and financial institutions that are willing to offer higher interest rates. We may be forced to increase our interest rates in order to maintain or increase the issuance of Notes. Any increase in our interest rates could have an adverse impact on our liquidity and our ability to meet a debt covenant under any future lines of credit obtained and/or to repay the Notes.
| 23 |
If we are unable to meet our Note maturity and redemption obligations, and we are unable to obtain additional financing or other sources of capital, we may be forced to sell off our operating assets or we might be forced to cease our operations, and Note holders could lose some or all of their investment.
Our Notes have maturities ranging from one year to four years. In addition, holders of our Notes may request redemption upon death and we would be obligated to fulfill such redemption request. Holders of a 36 month Note issued on or after February 4, 2020 may request redemption at any time and, subject to certain limitations, we would be obligated to fulfill such redemption request. We intend to pay our Note maturity and redemption obligations using our normal cash sources, such as collections on our loans to customers, as well as proceeds from the Notes Program. We may experience periods in which our Note maturity and redemption obligations are high. Since our loans are generally repaid when our borrower sells a real estate asset, our operations and other sources of funds may not provide sufficient available cash flow to meet our continued Note maturity and redemption obligations. While we have secured lines of credit from affiliates of up to $2,500,000 with $189,000 borrowed as of December 31, 2019, our affiliates are not obligated to fund our borrowing requests. For all of these reasons we may be substantially reliant upon the net offering proceeds we receive from the Notes Program to pay these obligations. If we are unable to repay or redeem the principal amount of the Notes when due, and we are unable to obtain additional financing or other sources of capital, we may be forced to sell off our operating assets or we might be forced to cease our operations, and Note holders could lose some or all of their investment.
There is no “early warning” on the Notes if we perform poorly. Only interest and principal payment defaults on the Notes can trigger a default on the Notes prior to a bankruptcy.
There are a limited number of performance covenants to be maintained under the Notes and/or the indenture. Therefore, no “early warning” of a possible default by us exists. Under the indenture, only (i) the non-payment of interest and/or principal on the Notes by us when payments are due, (ii) our bankruptcy or insolvency, or (iii) a failure to comply with provisions of the Notes or the indenture (if such failure is not cured or waived within 60 days after receipt of a specific notice) could cause a default to occur.
Note holders do not have the opportunity to evaluate our investments before they are made.
We intend to use the net offering proceeds in accordance with the “Use of Proceeds” section of our prospectus, including investment in secured real estate loans for the acquisition and development of parcels of real property as single-family residential lots and/or the construction of single-family homes. Since we have not identified any investments that we will make with the net proceeds of this offering, we are generally unable to provide Note holders with information to evaluate the potential investments we may make with the net offering proceeds before purchasing the Notes. Note holders must rely on our management to evaluate our investment opportunities, and we are subject to the risk that our management may not be able to achieve our objectives, may make unwise decisions or may make decisions that are not in our best interest.
A portion of our collateral securing the Pennsylvania Loans is preferred equity in our Company. In the event of a foreclosure on the properties securing the Pennsylvania Loans, a portion of our collateral is preferred equity in our Company, it would be difficult to sell the preferred equity in order to reduce the loan balance.
Some of the collateral securing the Pennsylvania Loans is preferred equity in our Company, which has a book value of $1,470,000 as of December 31, 2019. If the borrower defaults on any of the Pennsylvania Loans and we are forced to use collateral to repay any of the Pennsylvania Loans, we will need to sell this preferred interest in us to a third party. There is no liquid market for this instrument, so we can give no assurance as to our ability to generate any amount of proceeds from that collateral.
Because we require a substantial amount of cash to service our debt, we may not be able to pay our obligations under the Notes.
To service our total indebtedness, we require a significant amount of cash. Our ability to generate cash depends on many factors, including our successful financial and operating performance. We cannot assure Note holders that our business plans will succeed or that we will achieve our anticipated financial results, which may prevent us from being able to pay our obligations under the Notes.
| 24 |
The indenture and terms of our Notes do not restrict our use of leverage. A relatively small loss can cause over leveraged companies to suffer a material adverse change in their financial position. If this happened to us, it may make it difficult to repay the Notes.
Financial institutions which are federally insured typically have 8-12% of their total assets in equity. A reduction in their loan assets due to losses of 2% reduces their equity by roughly 20%. Our company had 13% and 12% of our loan assets in equity as of December 31, 2019 and 2018, respectively. If we allow our assets to increase without increasing our equity, we could have a much lower equity as a percentage of assets than we have today, which would increase our risk of nonpayment on the Notes. Note holders have no structural mechanism to protect them from this action, and rely solely on us to keep equity at a satisfactory ratio.
We expect to be substantially reliant upon the net offering proceeds we receive from the sale of our Notes to meet principal and interest obligations on previously issued Notes.
We intend to use the net offering proceeds from the sale of Notes to, among other things, make payments on other borrowings, fund redemption obligations, make interest payments on the Notes, and to run our business to the extent that other sources of liquidity from our operations (e.g., repayment of loans we have previously extended to our customers) and our credit lines are inadequate. However, these other sources of liquidity are subject to risks. Our operations alone may not produce a sufficient return on investment to repay interest and principal on our outstanding Notes. We may not be able to obtain an additional line of credit when needed or retain one or more of our existing lines of credit. We may not be able to attract new investors, have sufficient loan repayments, or have sufficient borrowing capacity when we need additional funds to repay principal and interest on our outstanding Notes or redeem our outstanding Notes. If any of these things occur, our liquidity and capital needs may be severely affected, and we may be forced to sell off our loan receivables and other operating assets, or we may be forced to cease our operations.
If we default in our Note payment obligations, the indenture agreements provide that the trustee could accelerate all payments due under the Notes, which would further negatively affect our consolidated financial position and cash flows.
Our obligations with respect to the Notes are governed by the terms of indenture agreements with U.S. Bank National Association as trustee. Under the indentures, in addition to other possible events of default, if we fail to make a payment of principal or interest under any Note and this failure is not cured within 30 days, then we will be deemed in default. Upon such a default, the trustee or holders of 25% in principal of the outstanding Notes could declare all principal and accrued interest immediately due and payable. If our total assets do not cover these payment obligations, then we would most likely be unable to make all payments under the Notes when due, and we might be forced to cease our operations.
There is no sinking fund to ensure repayment of the Notes at maturity, so Note holders are totally reliant upon our ability to generate adequate cash flows.
We do not contribute funds to a separate account, commonly known as a sinking fund, to repay the Notes upon maturity. Because funds are not set aside periodically for the repayment of the Notes over their respective terms, Note holders must rely on our consolidated cash flows from operations, investing and financing activities and other sources of financing for repayment, such as funds from sale of the Notes, loan repayments, and other borrowings. To the extent cash flows from operations and other sources are not sufficient to repay the Notes, Note holders may lose all or part of their investment.
If we have a large number of repayments on the Notes, whether because of maturity or redemption, we may be unable to make such repayments.
We are obligated to redeem a Note without any interest penalty (i) upon the death of an investor, if requested by the executor or administrator of the investor’s estate (or if the Note is held jointly, by the surviving joint investor), and (ii) subject to certain limitations, upon request by an investor holding a 36 month Note issued on or after February 4, 2020. Such redemption requests are not subject to our consent but are subject to restrictions in the indenture. We may be faced with a large number of such redemption requests at one time. We are also required to repay all of the Notes upon their maturity. If the amounts of those repayments are too high, and we cannot offset them with loan repayments, secure new financing, or issue additional Notes, we may not have the liquidity to repay the investments.
| 25 |
We have a significant amount of debt and expect to incur a significant amount of additional debt in the future, including issuance of the Notes, which will subject us to increased risk of loss. Our present and future senior debt may make it difficult to repay the Notes.
We have a significant amount of debt and expect to incur a significant amount of additional debt in the future. As of December 31, 2019, we have approximately $53,511,000 of debt. Our primary sources of debt include our lines of credit, loan purchase and sale agreements, and the Notes. As of December 31, 2019, we have a total outstanding balance of $10,216,000 on our lines of credit and $16,146,000 on our loan purchase and sale agreements. We also have the capacity to sell portions of many loans under the terms of our loan purchase and sale agreements. The loan purchase and sale agreements and other secured debt are with third parties and all but one of the lines of credit are collateralized by loans that we have issued to builders. The Notes are subordinate and junior in priority to any and all of our senior debt and senior subordinated debt, and equal to any and all non-senior debt, including other Notes. There are no restrictions in the indenture regarding the amount of senior debt or other indebtedness that we may incur. Upon the maturity of our senior debt, by lapse of time, acceleration or otherwise, the holders of our senior debt have first right to receive payment, in full, prior to any payments being made to a Note holder or to other non-senior debt. Therefore, upon such maturity of our senior debt Note holders would only be repaid in full if the senior debt is satisfied first and, following satisfaction of the senior debt, if there is an amount sufficient to fully satisfy all amounts owed under the Notes and any other non-senior debt.
In addition, we expect to incur a significant amount of additional debt in the future, including issuance of the Notes, borrowing under credit facilities, and other arrangements. The Notes will be subordinated in right of payment to all secured debt, including the Wallach Affiliate LOCs, the loan purchase and sale agreements, the senior subordinated note discussed in the prior paragraph, and the line of credit discussed in the prior paragraph. Therefore, in the event of a default on the secured debt, affiliates of our Company, including Mr. Wallach, have the right to receive payment ahead of Note holders, as do other secured debt holders, such as the loan purchasers under the loan purchase and sale agreements. Accordingly, our business is subject to increased risk of a total loss of Note holders’ investment if we are unable to repay all of our secured debt.
Increases in interest rates would increase the amount of debt payments under the Wallach Affiliate LOCs which could impair our ability to repay the principal and interest on the Notes.
The interest rate under the Wallach Affiliate LOCs is generally equal to the prime rate plus three percent. Increases in interest rates will increase the applicable prime rate and therefore, the interest rate under the Wallach Affiliate LOCs will increase. An increase in the interest rate would increase the amount of debt payments under the Wallach Affiliate LOCs which would reduce our cash flows and could impair our ability to repay the principal and interest on the Notes.
We incurred indebtedness secured by our office property, which may result in foreclosure.
The debt incurred by us in connection with our office property is secured by a mortgage. If we default on our secured indebtedness, the lender may foreclose and the entire investment in the office property could be lost, which could adversely affect our ability to repay the principal and interest on the Notes.
ITEM 1B. UNRESOLVED STAFF COMMENTS
Not applicable.
As of December 31, 2019, we operate an office in Jacksonville, Florida, which we own. We entered into a mortgage on our office building for $660,000 in January 2018 after a majority of the construction was completed. As of December 31, 2019, our mortgage payable balance was $634,000.
| (a) | As of the date of this filing, we are not aware that we or our members are a party to any pending or threatened legal proceeding or proceeding by a governmental authority that would have a material adverse effect on our business. | |
| (b) | None. |
ITEM 4. MINE SAFETY DISCLOSURES
Not applicable.
| 26 |
ITEM 5. MARKET FOR REGISTRANT’S COMMON EQUITY, RELATED STOCK HOLDER MATTERS, AND ISSUER PURCHASES OF EQUITY SECURITIES
(All dollar [$] amounts shown in thousands.)
| (a) | Common Equity |
As of December 31, 2019, we had 2,629 Class A common membership units (“Class A Common Units”) outstanding, held by our eight members. There is no established public trading market for our Class A Common Units. As of December 31, 2019, 80.7% of our outstanding Class A Common Units are beneficially owned by our CEO (who is also on our board of managers), Daniel M. Wallach, and his wife, Joyce S. Wallach.
Preferred Equity
Series B Preferred Units
We previously entered into an agreement with the Hoskins Group (consisting of Benjamin Marcus Homes, LLC, Investor’s Mark Acquisitions, LLC, and Mark L. Hoskins) pursuant to which we sell the Hoskins Group 0.1 Series B cumulative preferred units (“Series B Preferred Units”) upon the closing of certain lots. We issued 0.2 Series B Preferred Units to the Hoskins Group in December, 2019 for $20,000.
There is no established public trading market for our Series B Preferred Units. The Series B Preferred Units are redeemable by the Company at any time. The Series B Preferred Units have a fixed value which is their purchase price, and preferred liquidation and distribution rights. Yearly distributions of 10% of the Series B Preferred Units’ value (providing profits are available) will be made quarterly. The Hoskins Group’s Series B Preferred Units are also used as collateral for that group’s loans to the Company.
The transactions in Series B Preferred Units described above were effected in private transactions exempt from the registration requirements of the Securities Act under Section 4(a)(2) of the Securities Act. The transactions described above did not involve any public offering, were made without general solicitation or advertising, and the buyer represented to us that it is an “accredited investor’’ within the meaning of Rule 501 of Regulation D promulgated under the Securities Act, with access to all relevant information necessary to evaluate the investment in the Series B Preferred Units.
Series C Preferred Units
As of December 31, 2019, we had 29.59 Series C cumulative preferred units (“Series C Preferred Units”) outstanding, held by nine investors. There is no established public trading market for our Series C Preferred Units. As of December 31, 2019, 48.1% of our outstanding Series C Preferred Units are beneficially owned by our CEO (who is also on our board of managers), Daniel M. Wallach, and his wife, Joyce S. Wallach.
Investors in the Series C Preferred Units may elect to reinvest their distributions in additional Series C Preferred Units (the “Series C Reinvestment Program”). Pursuant to the Series C Reinvestment Program, we issued the following Series C Preferred Units during the quarter ended December 31, 2019:
| Recipient | Units Issued | Distribution Proceeds | ||||||
| Daniel M. Wallach and Joyce S. Wallach | 1.5995326 | $ | 159.95326 | |||||
| Gregory L. Sheldon and Madeline M. Sheldon | 0.2903015 | 29.03015 | ||||||
| BLDR Holdings, LLC | 0.5174969 | 51.74969 | ||||||
| Jeffrey L. Eppinger | 0.4866401 | 48.66401 | ||||||
| Fernando Ascencio and Lorraine Carol Ascencio | 0.1400246 | 14.00246 | ||||||
| Schultz Family Revocable Living Trust | 0.1287337 | 12.87337 | ||||||
| Total | 3.1627294 | $ | 316.27294 | |||||
| 27 |
The proceeds received from the sales of the Series C Preferred Units discussed above were used for the funding of construction loans. The transactions in Series C Preferred Units described above were effected in private transactions exempt from the registration requirements of the Securities Act under Section 4(a)(2) of the Securities Act. The transactions described above did not involve any public offering, were made without general solicitation or advertising, and the buyer represented to us that they were an “accredited investor” within the meaning of Rule 501 of Regulation D promulgated under the Securities Act, with access to all relevant information necessary to evaluate the investment in the Series C Preferred Units.
| (b) | Notes Program |
We registered up to $70,000 in Fixed Rate Subordinated Notes in our public offering (SEC File No. 333-203707, effective September 29, 2015). As of December 31, 2019, we had issued a gross amount of $8,411 in Notes pursuant to our public offering. From March 23, 2019 through December 31, 2019, we incurred expenses of $359 in connection with the issuance and distribution of the Notes, which were paid to third parties. These expenses were not for underwriters or discounts, but were for advertising, printing, and professional services. Net offering proceeds as of December 31, 2019 were $8,052, and primarily used to increase loan balances.
| (c) | None. |
ITEM 6. SELECTED FINANCIAL DATA
(All dollar [$] amounts shown in thousands.)
The following selected consolidated financial data should be read together with our consolidated financial statements and accompanying notes and “Management Discussion and Analysis of Financial Condition and Results of Operations” appearing elsewhere in this document. The selected consolidated financial data in this section is not intended to replace our consolidated financial statements and the accompanying notes. Our historical results and information are not necessarily indicative of our future results.
The summary consolidated financial data as of and for the fiscal years ended December 31, 2019 and 2018 is derived from our audited consolidated financial statements included elsewhere in this document. The summary consolidated financial data as of and for the fiscal years ended December 31, 2017, 2016, and 2015 is derived from our audited consolidated financial statements not included in this document.
| 28 |
As of and for the years ended December 31,
| 2019 | 2018 | 2017 | 2016 | 2015 | ||||||||||||||||
| (Audited) | (Audited) | (Audited) | (Audited) | (Audited) | ||||||||||||||||
| Operations Data | ||||||||||||||||||||
| Net interest income | ||||||||||||||||||||
| Interest and fee income on loans | $ | 10,131 | $ | 7,764 | $ | 5,812 | $ | 3,640 | $ | 1,863 | ||||||||||
| Interest expense | 5,780 | 4,296 | 2,707 | 1,748 | 864 | |||||||||||||||
| Provision for Loan losses | 222 | 89 | 44 | 16 | 59 | |||||||||||||||
| Net interest income after loan loss provision | 4,129 | 3,379 | 3,061 | 1,876 | 940 | |||||||||||||||
| Non-Interest Income | ||||||||||||||||||||
| Gain on foreclosure of assets | 203 | 19 | 77 | 72 | 105 | |||||||||||||||
| Non-Interest Expense | ||||||||||||||||||||
| Selling, general and administrative expenses | 2,486 | 2,112 | 2,090 | 1,319 | 547 | |||||||||||||||
| Loss on sale of foreclosed assets | 274 | 103 | – | – | – | |||||||||||||||
| Impairment loss on foreclosed assets | 558 | 515 | 266 | 111 | – | |||||||||||||||
| Net income | $ | 1,014 | $ | 668 | $ | 782 | $ | 518 | $ | 498 | ||||||||||
| Balance Sheet Data | ||||||||||||||||||||
| Cash and cash equivalents | $ | 1,883 | $ | 1,401 | $ | 3,478 | $ | 1,566 | $ | 1,341 | ||||||||||
| Accrued interest on loans | 1,031 | 568 | 720 | 280 | 146 | |||||||||||||||
| Premises and equipment | 936 | 1,051 | 1,020 | 69 | ||||||||||||||||
| Other assets | 202 | 327 | 58 | 82 | 14 | |||||||||||||||
| Loans receivable, net | 55,369 | 46,490 | 30,043 | 20,091 | 14,060 | |||||||||||||||
| Foreclosed assets | 4,916 | 5,973 | 1,036 | 2,798 | 965 | |||||||||||||||
| Total assets | 64,337 | 55,810 | 36,355 | 24,886 | 16,526 | |||||||||||||||
| Customer interest escrow | 643 | 939 | 935 | 812 | 498 | |||||||||||||||
| Accounts payable, accrued interest payable and other accrued expenses | 2,999 | 2,864 | 2,058 | 1,363 | 539 | |||||||||||||||
| Notes payable unsecured, net of deferred financing costs | 26,520 | 22,635 | 16,904 | 11,962 | 8,497 | |||||||||||||||
| Notes payable secured, net of deferred financing costs | 26,991 | 23,258 | 11,644 | 7,322 | 3,683 | |||||||||||||||
| Due to preferred equity member | 37 | 32 | 31 | 28 | 25 | |||||||||||||||
| Total liabilities | 57,190 | 49,728 | 31,572 | 21,487 | 13,242 | |||||||||||||||
| Redeemable preferred equity | 2,959 | 2,385 | 1,097 | – | – | |||||||||||||||
| Members’ capital | 4,188 | 3,697 | 3,686 | 3,399 | 3,284 | |||||||||||||||
| Members’ contributions | 150 | 80 | 90 | 140 | 10 | |||||||||||||||
| Members’ distributions | (357 | ) | (737 | ) | (585 | ) | (543 | ) | (281 | ) | ||||||||||
ITEM 7. MANAGEMENT’S DISCUSSION AND ANALYSIS OF FINANCIAL CONDITION AND RESULTS OF OPERATIONS
(All dollar [$] amounts shown in thousands.)
The following Management’s Discussion and Analysis of Financial Condition and Results of Operations should be read in conjunction with our consolidated financial statements and the notes thereto contained elsewhere in this report. See also “Cautionary Note Regarding Forward-Looking Statements” preceding Part I.
Overview
We were organized in the Commonwealth of Pennsylvania in 2007 under the name 84 RE Partners, LLC and changed our name to Shepherd’s Finance, LLC on December 2, 2011. We converted to a Delaware limited liability company on March 29, 2012. Our business is focused on commercial lending to participants in the residential construction and development industry. We believe this market is underserved because of the lack of traditional lenders currently participating in the market. We are located in Jacksonville, Florida. Our operations are governed pursuant to our operating agreement.
The commercial loans we extend are secured by mortgages on the underlying real estate. We extend and service commercial loans to small-to-medium sized homebuilders for the purchase of lots and/or the construction of homes thereon. In some circumstances, the lot is purchased with an older home on the lot which is then either removed or rehabilitated. If the home is rehabilitated, the loan is referred to as a “rehab” loan. We also extend and service loans for the purchase of lots and undeveloped land and the development of that land into residential building lots. In addition, we may, depending on our cash position and the opportunities available to us, do none, any or all of the following: purchase defaulted unsecured debt from suppliers to homebuilders at a discount (and then secure that debt with real estate or other collateral), purchase defaulted secured debt from financial institutions at a discount, and purchase real estate in which we will operate our business.
| 29 |
Economic and Industry Dynamics
We found a niche in the home construction financing industry, to become the lender of choice or secondary lender to residential homebuilders during the absence of sufficient lending at the homebuilder’s local financial institution or community bank. Our customers increase their sales and profits by borrowing from us and, in return we generate positive returns on secured loans we make to them.
Perceived Challenges and Anticipated Responses
The following is not intended to represent a comprehensive list or description of the risks or challenges facing the Company. Currently, our management is most focused on the following challenges along with the corresponding actions to address those challenges:
| Perceived Challenges and Risks | Anticipated Management Actions/Response | ||
| Potential loan value-to-collateral value issues (i.e., being underwater on particular loans) | We manage this challenge by risk-rating both the geographic region and the builder, and then adjusting the loan-to-value (i.e., the loan amount versus the value of the collateral) based on risk assessments. Additionally, we collect a deposit up-front for construction loans. Despite these efforts, if values in a particular area of the country drop by 60%, we will have loaned more than the value of the collateral. We have found that the best solution to this risk is a speedy resolution of the loan, and helping the builder finish the home rapidly rather than foreclosing on the partially built home. Our experience in this area will help us limit, but not eliminate, the negative effects in the event of another economic downturn. | ||
| Concentration of loan portfolio (i.e., how many of the loans are of or with any particular type, customer, or geography) | As of December 31, 2019 and 2018, 25% and 23% of our outstanding loan commitments consist of loans to one borrower, and the collateral is in one real estate market, Pittsburgh, Pennsylvania. Accordingly, the ultimate collectability of a significant portion of these loans is susceptible to changes in market conditions in that area. As of December 31, 2019, our next two largest customers make up 15% and 3% of our loan commitments, with loans in Orlando, Florida and Cape Coral, Florida, respectively. As of December 31, 2018, our next two largest customers made up 13% and 4% of our loan commitments, with loans in Sarasota, Florida and Savannah, Georgia, respectively. In the upcoming years, we plan on continuing to increase our geographic and builder diversity while continuing to focus on our residential homebuilder customers. | ||
| Not having funds available to us to service the commitments we have | The typical construction loan has about 75% of its loan amount outstanding on average. That means that on average, about 25% of the commitment is not loaned, usually because the house is not complete. As of December 31, 2019, unfunded commitments totaled $16,662, which we will fund along with our purchase and sale agreement participants. However, if we are short on cash, we could do the following:
● raise interest rates on the Notes we offer to our investors to attract new Note investments;
● sell more secured interest on our loans; or
● draw down on our lines of credit from our affiliates. | ||
| Nonpayment of interest by our customers | Most of our customers pay interest on a monthly basis, and these funds are used to, among other things, pay interest on our debt monthly. While we have the liquidity to withstand some nonpayment of interest, if a high percentage of our customers were not paying interest, it will impede our ability to pay our debts on time. | ||
| Nonperforming assets | As of December 31, 2019, nonperforming assets were approximately $6,411 (defined as impaired loans and/or loans on nonaccrual plus foreclosed assets). However, we do have the ability to repay most of our debt without penalty, if we believe that is appropriate. |
| 30 |
Opportunities
Although we can give no assurance as to our success, in the future, our management will focus its efforts on the following opportunities:
| ● | receiving money from the Notes and other sources of capital, sufficient to operate our business and allow for growth and diversification in our loan portfolio; | |
| ● | growing loan assets, staffing, and infrastructure to handle it. We hire office staff as loan volume grows, and hire the origination staff, which is field-based, as our liquidity allows for new loan originations. The goal for the field staff is to have a geographic coverage that eventually covers most of the continental U.S.; | |
| ● | obtaining lines of credit from financial institutions. We would like the maximum amount (the credit limit) to be 20% of our asset size, and our outstanding amounts to average 10% of our asset size; and | |
| ● | retaining a portion of earnings to grow the equity of the Company. |
Critical Accounting Estimates
To assist in evaluating our consolidated financial statements, we describe below the critical accounting estimates that we use. We consider an accounting estimate to be critical if: (1) the accounting estimate requires us to make assumptions about matters that were highly uncertain at the time the accounting estimate was made, and (2) changes in the estimate that are reasonably likely to occur from period to period, or use of different estimates that we reasonably could have used, would have a material impact on our consolidated financial condition or results of operations.
Loan Losses
Future losses on current loans are estimated in our financial statements. This estimate is important because it is on our largest asset (loans receivable). It is impossible to know what these losses will be, as the condition of the market cannot be determined, and specific situations with each loan are unpredictable and change constantly. Loan losses, as applicable, are accounted for both on the consolidated balance sheets and the consolidated statements of operations. On the consolidated statements of operations, management estimates the amount of losses to capture during the current year. This current period amount incurred is referred to as the loan loss provision. The calculation of our allowance for loan losses, which appears on our consolidated balance sheets as a reduction to Loans receivable, net and is detailed in the notes to our financial statements, requires us to compile relevant data for use in a systematic approach to assess and estimate the amount of probable losses inherent in our commercial lending operations and to reflect that estimated risk in our allowance calculations. We use the policy summarized as follows:
We establish a collective reserve for all loans which are not more than 60 days past due at the end of each quarter. This collective reserve includes both a quantitative and qualitative analysis. In addition to historical loss information, the analysis incorporates collateral value, decisions made by management and staff, percentage of aging spec loans, policies, procedures, and economic conditions.
We individually analyze for impairment all loans which are more than 60 days past are due at the end of each quarter. We also review for impairment all loans to one borrower with greater than or equal to 10% of our total committed balances. If required, the analysis includes a comparison of estimated collateral value to the principal amount of the loan.
For impaired loans, if the value determined is less than the principal amount due (less any builder deposit), then the difference is included in the allowance for loan loss. As values change, estimated loan losses may be provided for more or less than the previous period, and some loans may not need a loss provision based on payment history. For homes which are partially complete, we appraise on an as-is and completed basis and use the one that more closely aligns with our planned method of disposal for the property.
| 31 |
For loans greater than 12 months in age that are individually evaluated for impairment, appraisals have been prepared within the last 13 months. For all loans individually evaluated for impairment, there is also a broker’s opinions of value (“BOV”) prepared, if the appraisal is more than six months old. The lower of any BOV prepared in the last six months, or the most recent appraisal, is used, unless we determine a BOV to be invalid based on the comparable sales used. If we determine a BOV to be invalid, we will use the appraised value. Appraised values are adjusted down for estimated costs associated with asset disposal. Broker’s opinion of selling price, currently valid sales contracts on the subject property, or representative recent actual closings by the builder on similar properties may be used in place of a broker’s opinion of value.
Appraisers are state certified, and are selected by first attempting to utilize the appraiser who completed the original appraisal report. If that appraiser is unavailable or unreasonably expensive, we use another appraiser who appraises routinely in that geographic area. BOVs are created by real estate agents. We try to first select an agent we have worked with, and then, if that fails, we select another agent who works in that geographic area.
Currently, fair value of collateral has the potential to impact the calculation of the loan loss provision. Specifically, relevant to the allowance for loan loss reserve is the fair value of the underlying collateral supporting the outstanding loan balances. Fair value measurements are an exit price, representing the amount that would be received to sell an asset or paid to transfer a liability in an orderly transaction between market participants. Due to a rapidly changing economic market, an erratic housing market, the various methods that could be used to develop fair value estimates, and the various assumptions that could be used, determining the collateral’s fair value requires significant judgment.
| December 31, 2019 | ||||
| Loan Loss Provision | ||||
| Change in Fair Value Assumption | Higher/(Lower) | |||
| Increasing fair value of the real estate collateral by 35%* | $ | – | ||
| Decreasing fair value of the real estate collateral by 35%** | $ | 4,657 | ||
* Increases in the fair value of the real estate collateral do not impact the loan loss provision, as the value generally is not “written up.”
** If the loans were nonperforming, assuming a book amount of the loans outstanding of $55,369, and the fair value of the real estate collateral on all outstanding loans was reduced by 35%.
Foreclosed Assets
Foreclosed assets, as applicable, are accounted for both on the consolidated balance sheets and the consolidated statements of operations. On the consolidated statements of operations, management estimates the amount of impairment to capture when a loan is converted to a foreclosed asset, the impairment when the value of an asset drops below the carrying amount, and any loss or gain upon final disposition of the asset. The calculation of the impairment, which appears on our consolidated balance sheets as a reduction in the asset, requires us to compile relevant data for use in a systematic approach to assess and estimate the value of the asset and therefore any required impairment thereof. We use the policy summarized as follows:
| 32 |
For properties which exist in the condition in which we intend to sell them, we obtain an appraisal of the assets current value. We reduce the appraised value by 10% to account for estimated selling costs. This amount is used to initially book the asset. Typically, prior to the initial booking of the foreclosed asset, the loan has already been reserved to this level. If during ownership, the value of the foreclosed asset drops, an additional impairment is recorded. For assets that need to be improved prior to sale, we adjust the portion of the appraised value related to construction improvements for the percentage of the improvements which have not yet been made.
The fair value of real estate will impact our foreclosed asset value, which is recorded at 100% of fair value (after selling costs are deducted). Fair value measurements are an exit price, representing the amount that would be received to sell an asset or paid to transfer a liability in an orderly transaction between market participants.
| December 31, 2019 | ||||
Foreclosed Assets | ||||
| Change in Fair Value Assumption | Higher/(Lower) | |||
| Increasing fair value of the foreclosed asset by 35%* | $ | – | ||
| Decreasing fair value of the foreclosed asset by 35% | $ | 1,720 | ||
* Increases in the fair value of the foreclosed assets do not impact the carrying value, as the value generally is not “written up.” Those gains would be recognized at the sale of the asset. However, the increase in fair value may be recognized up to the cost basis of the foreclosed asset which was determined at the foreclosure date.
Other Loss Contingencies
Other loss contingencies are recorded as liabilities when it is probable that a liability has been incurred and the amount of the loss is reasonably estimable. Disclosure is required when there is a reasonable possibility that the ultimate loss will exceed the recorded provision. Contingent liabilities are often resolved over long time periods. Estimating probable losses requires analysis of multiple forecasts that often depend on judgments about potential actions by third parties such as courts, arbitrators, juries, or regulators.
Accounting and Auditing Standards Applicable to “Emerging Growth Companies”
We are an “emerging growth company” under the recently enacted JOBS Act. For as long as we are an “emerging growth company,” we are not required to: (1) comply with any new or revised financial accounting standards that have different effective dates for public and private companies until those standards would otherwise apply to private companies, (2) provide an auditor’s attestation report on management’s assessment of the effectiveness of internal control over financial reporting pursuant to Section 404 of the Sarbanes-Oxley Act, (3) comply with any new requirements adopted by the Public Company Accounting Oversight Board, or the PCAOB, requiring mandatory audit firm rotation or a supplement to the auditor’s report in which the auditor would be required to provide additional information about the audit and the financial statements of the issuer or (4) comply with any new audit rules adopted by the PCAOB after April 5, 2012, unless the SEC determines otherwise. However, we have elected to “opt out” of the extended transition period discussed in (4), and will therefore comply with new or revised accounting standards on the applicable dates on which the adoption of such standards is required for non-emerging growth companies. Section 107 of the JOBS Act provides that our decision to opt out of such extended transition period for compliance with new or revised accounting standards is irrevocable.
Other Significant Accounting Policies
Other significant accounting policies, not involving the same level of measurement uncertainties as those discussed above, are nevertheless important to an understanding of the consolidated financial statements. Policies related to credit quality information, fair value measurements, offsetting assets and liabilities, related party transactions and revenue recognition require difficult judgments on complex matters that are often subject to multiple and recent changes in the authoritative guidance. Certain of these matters are among topics currently under reexamination or have recently been addressed by accounting standard setters and regulators. Specific conclusions have not been reached by these standard setters, and outcomes cannot be predicted with confidence. Also, see Note 2 of our consolidated financial statements, as they discuss accounting policies that we have selected from acceptable alternatives.
| 33 |
Consolidated Results of Operations
Key financial and operating data for the years ended December 31, 2019 and 2018 are set forth below. For a more complete understanding of our industry, the drivers of our business, and our current period results, this discussion should be read in conjunction with our consolidated financial statements, including the related notes and the other information contained in this document.
Accounting principles generally accepted in the United States of America (U.S. GAAP) require that we report financial and descriptive information about reportable segments and how these segments were determined. Our management determines the allocation and performance of resources based on operating income, net income and operating cash flows. Segments are identified and aggregated based on the products sold or services provided and the market(s) they serve. Based on these factors, management has determined that our ongoing operations are in one segment, commercial lending.
Below is a summary of our statement of operations for the years ended December 31, 2019 and 2018:
| 2019 | 2018 | |||||||
| Net Interest Income | ||||||||
| Interest and fee income on loans | $ | 10,131 | $ | 7,764 | ||||
| Interest expense: | ||||||||
| Interest related to secured borrowings | 2,948 | 2,114 | ||||||
| Interest related to unsecured borrowings | 2,832 | 2,182 | ||||||
| Interest expense | $ | 5,780 | $ | 4,296 | ||||
| Net interest income | 4,351 | 3,468 | ||||||
| Less: Loan loss expense | 222 | 89 | ||||||
| Net interest income after loan loss expense | 4,129 | 3,379 | ||||||
| Non-Interest Income | ||||||||
| Gain on foreclosure of assets | $ | 203 | $ | 19 | ||||
| Total non-interest income | 203 | 19 | ||||||
| Income | 4,332 | 3,398 | ||||||
| Non-Interest Expense | ||||||||
| Selling, general and administrative | $ | 2,394 | $ | 2,030 | ||||
| Depreciation and amortization | 92 | 82 | ||||||
| Loss on the sale of foreclosed assets | 274 | 103 | ||||||
| Impairment loss on foreclosed assets | 558 | 515 | ||||||
| Total non-interest expense | 3,318 | 2,730 | ||||||
| Net income | $ | 1,014 | $ | 668 | ||||
| Earned distribution to preferred equity holder | 457 | 292 | ||||||
| Net income attributable to common equity holders | $ | 557 | $ | 376 | ||||
| 34 |
Net income for the year ended December 31, 2019 increased $346 when compared to the same period of 2018. The increase in net income was mainly due to an increase in net interest income of $883 to $4,351 for the year ended December 31, 2019 compared to the same period of 2018. Net interest income increased primarily due to the additional gross amount outstanding on our development loans of $2,977 which increased to $8,997 as of December 31, 2019 compared to the same period of 2019. Our development loans margin is fixed at 7%. In addition, the gross amount outstanding on our construction loans increased $5,504 to $48,611 as of December 31, 2019 compared to the same period of 2018. For construction loans, the margin is fixed at 3% which increased from 2% for loans originated after July 1, 2018. Our increase in interest income was offset by an increase in non-interest expense.
Non-interest expense increased as follows for the year ended December 31, 2019 compared to the same period of 2018:
| ● | Selling, general and administrative expenses (“SG&A”) increased $364 when compared to the same period of 2018. The increase in SG&A was primarily due to increases in salaries and related expenses; and | |
| ● | Loss on the sale of foreclosed assets increased $171 due to the sale of a certain foreclosed property during August 2019 for sale proceeds of $4,543. |
In addition, we had $55,369 and $46,490 in loan assets, net as of December 31, 2019 and 2018, respectively. As of December 31, 2019, we had 241 construction loans in 21 states with 70 borrowers and nine development loans in four states with five borrowers.
Interest Spread
The following table displays a comparison of our interest income, expense, fees and spread for the years ended December 31, 2019 and 2018:
| 2019 | 2018 | |||||||||||||||
| Interest Income | * | * | ||||||||||||||
| Interest income on loans | $ | 7,601 | 14 | % | $ | 5,694 | 14 | % | ||||||||
| Fee income on loans | 2,530 | 5 | % | 2,070 | 5 | % | ||||||||||
| Interest and fee income on loans | 10,131 | 19 | % | 7,764 | 19 | % | ||||||||||
| Interest expense – secured | 2,948 | 6 | % | 2,114 | 5 | % | ||||||||||
| Interest expense – unsecured | 2,671 | 5 | % | 1,998 | 4 | % | ||||||||||
| Offering costs expense | 161 | - | % | 184 | 1 | % | ||||||||||
| Interest expense | 5,780 | 11 | % | 4,296 | 10 | % | ||||||||||
| Net interest income (spread) | 4,351 | 8 | % | 3,468 | 9 | % | ||||||||||
| Weighted average outstanding loan asset balance | $ | 53,308 | $ | 41,341 | ||||||||||||
*annualized amount as percentage of weighted average outstanding gross loan balance
There are three main components that can impact our interest spread:
● Difference between the interest rate received (on our loan assets) and the interest rate paid (on our borrowings). The loans we have originated have interest rates which are based on our cost of funds, with a minimum cost of funds of 7%. For most loans, the margin is fixed at 3%; however, for our development loans the margin is fixed at 7%. Loans originated prior to July 1, 2018 have a 2% margin. This component is also impacted by the lending of money with no interest cost (our equity). For the years ended December 31, 2019, the difference between interest income and interest expense was 3% compared to 4% as of the year ended December 31, 2018. The decrease relates to a 1% increase of interest in both our secured and unsecured borrowings which increased $7,618 to $53,511 which increased our average cost of funds to 10.81% for the year ended December 31, 2019 compared to 10.06% for the same period of 2018. In addition, during 2018 we had more loans paying default rate interest compared to 2019. Our average construction loan lasts for ten months, with a weighted average of twelve months. Those that go beyond twelve months pay a higher rate of interest, even though they are paying interest on time. The increase in secured and unsecured interest expense was offset by a 1% decrease in offering costs.
| 35 |
● Fee income. Our construction loans have a 5% fee on the amount that we commit to lend, which is amortized over the expected life of each of those loans; however, we do not recognize a loan fee on our development loans. When loans pay back quicker than their expected life, the remaining unrecognized fee is recognized upon the termination of the loan. Fee income was 5% for both 2019 and 2018, of the average outstanding balance on all loans. In the future, we anticipate that fee income will continue at the same historical rates.
● Amount of nonperforming assets. Generally, we have two types of nonperforming assets that negatively affect interest spread which are loans not paying interest and foreclosed assets.
As of December 31, 2019, all loans were paying interest with the exception of four impaired loans which were classified as non-accruing compared to 23 impaired loans classified as non-accruing as of December 31, 2018.
Foreclosed assets do not provide a monthly interest return. During the year ended December 31, 2019 and December 31, 2018, we recorded $3,352 and $4,494, respectively, from loans receivables, net to foreclosed assets on the balance sheet which resulted in a negative impact on our interest spread.
Loan Loss Provision
We recorded $222 and $89 in the years ended December 31, 2019 and 2018, respectively. The provision was comprised of approximately $219 and $75 related to loans without specific reserves for the years ended December 31, 2019 and 2018, respectively. We anticipate that the collective and specific reserves will increase as our loan balances rise throughout 2020.
Non-Interest Income
We recognized foreclosed gains of $203 and $19 in the years ended December 31, 2019 and 2018, respectively, from the initial foreclosure of assets. This represents the difference between our loan book value and the appraised value, net of selling costs, of the real estate.
SG&A Expenses
The following table displays our SG&A expenses for the years ended December 31, 2019 and 2018:
| 2019 | 2018 | |||||||
| Selling, general and administrative expenses | ||||||||
| Legal and accounting | $ | 240 | $ | 340 | ||||
| Salaries and related expenses | 1,387 | 1,090 | ||||||
| Board related expenses | 91 | 70 | ||||||
| Advertising | 128 | 87 | ||||||
| Rent and utilities | 57 | 37 | ||||||
| Loan and foreclosed asset expenses | 211 | 150 | ||||||
| Travel | 138 | 102 | ||||||
| Other | 142 | 154 | ||||||
| Total SG&A | $ | 2,394 | $ | 2,030 | ||||
Loss on the Sale of Foreclosed Assets
We recorded a loss on the sale of foreclosed assets of $274 and $103 for the years ended December 31, 2019 and 2018, respectively. During August 2019, we sold one of our foreclosed assets for sale proceeds of $4,543. During 2018, we sold two of our foreclosed assets located in Louisiana which resulted in the loss for that year.
| 36 |
Impairment Loss on Foreclosed Assets
We recorded $558 and $515 for the years ended December 31, 2019 and 2018, respectively, in impairment losses of our foreclosed assets (real estate taken in foreclosure). These losses are primarily due to decreases in value or cost overruns in completion. We may incur additional impairment in 2020 either on our existing or acquired foreclosed assets.
Consolidated Financial Position
Cash and Cash Equivalents
We try to avoid borrowing on our lines of credit from affiliates. To accomplish this, we must carry some cash for liquidity. This amount generally grows as our Company grows. At December 31, 2019 and 2018, we had $1,883 and $1,401, respectively, in cash. See our Liquidity and Capital Resources section for more information.
Loans Receivable
Commercial Loans – Construction Loan Portfolio Summary
The following is a summary of our loan portfolio to builders for home construction loans as of December 31, 2019:
| State | Number of | Number of | Value
of Collateral(1) | Commitment Amount | Gross Amount | Loan
to Ratio(2) | Loan Fee | |||||||||||||||||||||
| Colorado | 1 | 1 | $ | 630 | $ | 425 | $ | 424 | 67 | % | 5 | % | ||||||||||||||||
| Connecticut | 1 | 1 | 340 | 224 | 55 | 66 | % | 5 | % | |||||||||||||||||||
| Florida | 17 | 112 | 32,259 | 24,031 | 16,826 | 74 | % | 5 | % | |||||||||||||||||||
| Georgia | 3 | 4 | 2,085 | 1,343 | 917 | 64 | % | 5 | % | |||||||||||||||||||
| Idaho | 1 | 1 | 310 | 217 | 173 | 70 | % | 5 | % | |||||||||||||||||||
| Indiana | 2 | 3 | 1,687 | 1,083 | 383 | 64 | % | 5 | % | |||||||||||||||||||
| Michigan | 4 | 11 | 3,696 | 2,566 | 1,820 | 69 | % | 5 | % | |||||||||||||||||||
| New Jersey | 3 | 6 | 1,925 | 1,471 | 1,396 | 76 | % | 5 | % | |||||||||||||||||||
| New York | 2 | 3 | 1,370 | 940 | 743 | 69 | % | 5 | % | |||||||||||||||||||
| North Carolina | 6 | 20 | 5,790 | 4,009 | 2,471 | 69 | % | 5 | % | |||||||||||||||||||
| Ohio | 3 | 9 | 4,117 | 2,664 | 2,153 | 65 | % | 5 | % | |||||||||||||||||||
| Oregon | 1 | 2 | 1,137 | 796 | 739 | 70 | % | 5 | % | |||||||||||||||||||
| Pennsylvania | 3 | 24 | 20,791 | 13,322 | 11,772 | 64 | % | 5 | % | |||||||||||||||||||
| South Carolina | 11 | 25 | 8,809 | 6,419 | 4,786 | 73 | % | 5 | % | |||||||||||||||||||
| Tennessee | 3 | 4 | 1,367 | 1,069 | 503 | 78 | % | 5 | % | |||||||||||||||||||
| Texas | 3 | 4 | 1,984 | 1,270 | 843 | 64 | % | 5 | % | |||||||||||||||||||
| Utah | 2 | 4 | 1,862 | 1,389 | 1,000 | 75 | % | 5 | % | |||||||||||||||||||
| Virginia | 1 | 3 | 1,245 | 815 | 734 | 65 | % | 5 | % | |||||||||||||||||||
| Washington | 1 | 2 | 1,040 | 728 | 445 | 70 | % | 5 | % | |||||||||||||||||||
| Wisconsin | 1 | 1 | 539 | 332 | 285 | 62 | % | 5 | % | |||||||||||||||||||
| Wyoming | 1 | 1 | 228 | 160 | 143 | 70 | % | 5 | % | |||||||||||||||||||
| Total | 70 | 241 | $ | 93,211 | $ | 65,273 | $ | 48,611 | 70 | %(3) | 5 | % | ||||||||||||||||
| (1) | The value is determined by the appraised value. | |
| (2) | The loan to value ratio is calculated by taking the commitment amount and dividing by the appraised value. | |
| (3) | Represents the weighted average loan to value ratio of the loans. |
| 37 |
The following is a summary of our loan portfolio to builders for home construction loans as of December 31, 2018:
| State | Number of | Number of | Value
of Collateral(1) | Commitment Amount | Gross Amount | Loan
to Ratio(2) | Loan Fee | |||||||||||||||||||||
| Arizona | 1 | 1 | $ | 1,140 | $ | 684 | $ | 214 | 60 | % | 5 | % | ||||||||||||||||
| Colorado | 2 | 4 | 2,549 | 1,739 | 1,433 | 68 | % | 5 | % | |||||||||||||||||||
| Florida | 18 | 104 | 32,381 | 22,855 | 12,430 | 71 | % | 5 | % | |||||||||||||||||||
| Georgia | 5 | 6 | 5,868 | 3,744 | 2,861 | 64 | % | 5 | % | |||||||||||||||||||
| Idaho | 1 | 2 | 605 | 424 | 77 | 70 | % | 5 | % | |||||||||||||||||||
| Indiana | 2 | 5 | 1,567 | 1,097 | 790 | 70 | % | 5 | % | |||||||||||||||||||
| Michigan | 4 | 26 | 5,899 | 3,981 | 2,495 | 67 | % | 5 | % | |||||||||||||||||||
| New Jersey | 5 | 15 | 4,999 | 3,742 | 2,820 | 75 | % | 5 | % | |||||||||||||||||||
| New York | 2 | 4 | 1,555 | 1,089 | 738 | 70 | % | 5 | % | |||||||||||||||||||
| North Carolina | 5 | 12 | 3,748 | 2,580 | 1,712 | 69 | % | 5 | % | |||||||||||||||||||
| North Dakota | 1 | 1 | 375 | 263 | 227 | 70 | % | 5 | % | |||||||||||||||||||
| Ohio | 2 | 3 | 3,220 | 1,960 | 1,543 | 61 | % | 5 | % | |||||||||||||||||||
| Pennsylvania | 3 | 34 | 24,808 | 14,441 | 10,087 | 58 | % | 5 | % | |||||||||||||||||||
| South Carolina | 15 | 29 | 9,702 | 6,738 | 4,015 | 69 | % | 5 | % | |||||||||||||||||||
| Tennessee | 1 | 2 | 750 | 525 | 347 | 70 | % | 5 | % | |||||||||||||||||||
| Texas | 1 | 1 | 179 | 125 | 26 | 70 | % | 5 | % | |||||||||||||||||||
| Utah | 4 | 4 | 1,788 | 1,206 | 486 | 67 | % | 5 | % | |||||||||||||||||||
| Virginia | 3 | 6 | 1,675 | 1,172 | 806 | 70 | % | 5 | % | |||||||||||||||||||
| Total | 75 | 259 | $ | 102,808 | $ | 68,365 | $ | 43,107 | 67 | %(3) | 5 | % | ||||||||||||||||
| (1) | The value is determined by the appraised value. | |
| (2) | The loan to value ratio is calculated by taking the commitment amount and dividing by the appraised value. | |
| (3) | Represents the weighted average loan to value ratio of the loans. |
Commercial Loans – Real Estate Development Loan Portfolio Summary
The following is a summary of our loan portfolio to builders for land development as of December 31, 2019:
| States | Number of Borrowers | Number of Loans | Value of Collateral(1) | Commitment Amount(2) | Gross
Amount Outstanding | Loan to Value Ratio(3) | Interest Spread | |||||||||||||||||||||
| Pennsylvania | 1 | 3 | $ | 10,191 | 7,000 | $ | 7,389 | 73 | % | 7 | % | |||||||||||||||||
| Florida | 2 | 3 | 1,301 | 1,356 | 891 | 68 | % | 7 | ||||||||||||||||||||
| North Carolina | 1 | 1 | 400 | 260 | 99 | 25 | % | 7 | ||||||||||||||||||||
| South Carolina | 1 | 2 | 1,115 | 1,250 | 618 | 55 | % | 7 | ||||||||||||||||||||
| Total | 5 | 9 | $ | 13,007 | $ | 9,866 | $ | 8,997 | 69 | %(4) | 7 | % | ||||||||||||||||
| (1) | The value is determined by the appraised value adjusted for remaining costs to be paid and third-party mortgage balances. Part of this collateral is $1,470 of preferred equity in our Company. In the event of a foreclosure on the property securing these loans, the portion of our collateral that is preferred equity in our Company might be difficult to sell, which could impact our ability to eliminate the loan balance. |
| (2) | The commitment amount does not include unfunded letters of credit. |
| (3) | The loan to value ratio is calculated by taking the outstanding amount and dividing by the appraised value calculated as described above. |
| (4) | Represents the weighted average loan to value ratio of the loans. |
| 38 |
The following is a summary of our loan portfolio to builders for land development as of December 31, 2018:
| States | Number of Borrowers | Number of Loans | Value of Collateral(1) | Commitment Amount(2) | Gross
Amount Outstanding | Loan to Value | Interest Spread | |||||||||||||||||||||
| Pennsylvania | 1 | 3 | $ | 8,482 | $ | 5,000 | $ | 5,037 | 59 | % | 7 | % | ||||||||||||||||
| Florida | 2 | 4 | 537 | 1,206 | 501 | 93 | % | 7 | % | |||||||||||||||||||
| South Carolina | 1 | 2 | 1,115 | 1,250 | 482 | 43 | % | 7 | % | |||||||||||||||||||
| Total | 4 | 9 | $ | 10,134 | $ | 7,456 | $ | 6,020 | 59 | %(4) | 7 | % | ||||||||||||||||
| (1) | The value is determined by the appraised value adjusted for remaining costs to be paid and third-party mortgage balances. Part of this collateral is $1,320 of preferred equity in our Company. In the event of a foreclosure on the property securing these loans, the portion of our collateral that is preferred equity in our Company might be difficult to sell, which could impact our ability to eliminate the loan balance. |
| (2) | The commitment amount does not include unfunded letters of credit. |
| (3) | The loan to value ratio is calculated by taking the outstanding amount and dividing by the appraised value calculated as described above. |
| (4) | Represents the weighted average loan to value ratio of the loans. |
Financing receivables are comprised of the following:
| December 31, 2019 | December 31, 2018 | |||||||
| Loans receivable, gross | $ | 57,608 | $ | 49,127 | ||||
| Less: Deferred loan fees | (856 | ) | (1,249 | ) | ||||
| Less: Deposits | (1,352 | ) | (1,510 | ) | ||||
| Plus: Deferred origination costs | 204 | 308 | ||||||
| Less: Allowance for loan losses | (235 | ) | (186 | ) | ||||
| Loans receivable, net | $ | 55,369 | $ | 46,490 | ||||
The allowance for loan losses at December 31, 2019 is $235, of which $230 related to loans without specific reserves. At December 31, 2018, the allowance was $186, of which $172 related to loans without specific reserves. During the year ended December 31, 2019, we incurred $173 in direct charge-offs. No charge-offs occurred during the year ended December 31, 2018.
| 39 |
In 2019, we anticipate continued growth in loans receivable, net, and all of the items that comprise it (seen in the chart above).
Roll forward of commercial loans:
| December 31, 2019 | December 31, 2018 | |||||||
| Beginning balance | $ | 46,490 | $ | 30,043 | ||||
| Originations | 56,842 | 54,145 | ||||||
| Principal collections | (45,009 | ) | (32,899 | ) | ||||
| Transferred to foreclosed assets | (3,352 | ) | (4,494 | ) | ||||
| Change in deferred origination costs | (104 | ) | 199 | |||||
| Change in builder deposit | 157 | (12 | ) | |||||
| Change in loan loss provision | (49 | ) | (89 | ) | ||||
| Loan fees, net | 394 | (403 | ) | |||||
| Ending balance | $ | 55,369 | $ | 46,490 | ||||
Credit Quality Information
Finance Receivables – By risk rating:
| December 31, 2019 | December 31, 2018 | |||||||
| Pass | $ | 53,542 | $ | 43,402 | ||||
| Special mention | 2,571 | 3,222 | ||||||
| Classified – accruing | – | – | ||||||
| Classified – nonaccrual | 1,495 | 2,503 | ||||||
| Total | $ | 57,608 | $ | 49,127 | ||||
Please see our notes to consolidated financial statements for more information about the ratings in the table above.
Finance Receivables – Method of impairment calculation:
| December 31, 2019 | December 31, 2018 | |||||||
| Performing loans evaluated individually | $ | 26,233 | $ | 19,037 | ||||
| Performing loans evaluated collectively | 29,880 | 27,587 | ||||||
| Non-performing loans without a specific reserve | 1,467 | 2,204 | ||||||
| Non-performing loans with a specific reserve | 28 | 299 | ||||||
| Total evaluated collectively for loan losses | $ | 57,608 | $ | 49,127 | ||||
At December 31, 2019 and 2018, there were no loans acquired with deteriorated credit.
The following is a summary of our impaired non-accrual (non-performing) commercial construction loans as of December 31, 2019 and 2018:
| December 31, 2019 | December 31, 2018 | |||||||
| Unpaid principal balance (contractual obligation from customer) | $ | 1,495 | $ | 2,503 | ||||
| Charge-offs and payments applied | - | - | ||||||
| Gross value before related allowance | 1,495 | 2,503 | ||||||
| Related allowance | (8 | ) | (20 | ) | ||||
| Value after allowance | $ | 1,487 | $ | 2,483 | ||||
| 40 |
Below is an aging schedule of loans receivable as of December 31, 2019, on a recency basis:
| No.
Loans | Unpaid Balances | % | ||||||||||
| Current loans (current accounts and accounts on which more than 50% of an original contract payment was made in the last 59 days) | 246 | $ | 56,113 | 97 | % | |||||||
| 60-89 days | - | - | - | % | ||||||||
| 90-179 days | 4 | 1,495 | 3 | % | ||||||||
| 180-269 days | - | - | - | % | ||||||||
| Subtotal | 250 | $ | 57,608 | 100 | % | |||||||
| Interest only accounts (Accounts on which interest, deferment, extension and/or default charges were received in the last 60 days) | - | $ | - | - | % | |||||||
| Partial Payment accounts (Accounts on which the total received in the last 60 days was less than 50% of the original contractual monthly payment. “Total received” to include interest on simple interest accounts, as well as late charges on deferment charges on pre-computed accounts.) | - | $ | - | - | % | |||||||
| Total | 250 | $ | 57,608 | 100 | % | |||||||
Below is an aging schedule of loans receivable as of December 31, 2018, on a recency basis:
| No.
Loans | Unpaid Balances | % | ||||||||||
| Current loans (current accounts and accounts on which more than 50% of an original contract payment was made in the last 59 days) | 265 | $ | 48,144 | 98 | % | |||||||
| 60-89 days | – | – | – | % | ||||||||
| 90-179 days | 1 | 299 | 1 | % | ||||||||
| 180-269 days | 2 | 684 | 1 | % | ||||||||
| Subtotal | 268 | $ | 49,127 | 100 | % | |||||||
| Interest only accounts (Accounts on which interest, deferment, extension and/or default charges were received in the last 60 days) | – | $ | – | – | % | |||||||
| Partial Payment accounts (Accounts on which the total received in the last 60 days was less than 50% of the original contractual monthly payment. “Total received” to include interest on simple interest accounts, as well as late charges on deferment charges on pre-computed accounts.) | – | $ | – | – | % | |||||||
| Total | 268 | $ | 49,127 | 100 | % | |||||||
| 41 |
Below is an aging schedule of loans receivable as of December 31, 2019, on a contractual basis:
| No.
Loans | Unpaid Balances | % | ||||||||||
| Contractual Terms - All current Direct Loans and Sales Finance Contracts with installments past due less than 60 days from due date. | 246 | $ | 56,113 | 97 | % | |||||||
| 60-89 days | - | - | - | % | ||||||||
| 90-179 days | 4 | 1,495 | 3 | % | ||||||||
| 180-269 days | - | - | - | % | ||||||||
| Subtotal | 250 | $ | 57,608 | 100 | % | |||||||
| Interest only accounts (Accounts on which interest, deferment, extension and/or default charges were received in the last 60 days) | - | $ | - | - | % | |||||||
| Partial Payment accounts (Accounts on which the total received in the last 60 days was less than 50% of the original contractual monthly payment. “Total received” to include interest on simple interest accounts, as well as late charges on deferment charges on pre-computed accounts.) | - | $ | - | - | % | |||||||
| Total | 250 | $ | 57,608 | 100 | % | |||||||
Below is an aging schedule of loans receivable as of December 31, 2018, on a contractual basis:
| No.
Loans | Unpaid Balances | % | ||||||||||
| Contractual Terms - All current Direct Loans and Sales Finance Contracts with installments past due less than 60 days from due date. | 265 | $ | 48,144 | 98 | % | |||||||
| 60-89 days | – | – | – | % | ||||||||
| 90-179 days | 1 | 299 | 1 | % | ||||||||
| 180-269 days | 2 | 684 | 1 | % | ||||||||
| Subtotal | 268 | $ | 49,127 | 100 | % | |||||||
| Interest only accounts (Accounts on which interest, deferment, extension and/or default charges were received in the last 60 days) | – | $ | – | – | % | |||||||
| Partial Payment accounts (Accounts on which the total received in the last 60 days was less than 50% of the original contractual monthly payment. “Total received” to include interest on simple interest accounts, as well as late charges on deferment charges on pre-computed accounts.) | – | $ | – | – | % | |||||||
| Total | 268 | $ | 49,127 | 100 | % | |||||||
| 42 |
Foreclosed Assets
Roll forward of foreclosed assets for the years ended December 31, 2019 and 2018:
| December 31, 2019 | December 31, 2018 | |||||||
| Beginning balance | $ | 5,973 | $ | 1,036 | ||||
| Additions from loans | 3,352 | 4,737 | ||||||
| Additions for construction/development | 763 | 1,608 | ||||||
| Sale proceeds | (4,543 | ) | (809 | ) | ||||
| Loss on sale of foreclosed assets | (274 | ) | (103 | ) | ||||
| Gain on foreclosure | 203 | 19 | ||||||
| Impairment loss on foreclosed assets | (558 | ) | (515 | ) | ||||
| Ending balance | $ | 4,916 | $ | 5,973 | ||||
During the year ended December 31, 2019 we reclassed 27 construction loan assets to foreclosed assets. Eighteen of the assets related to a borrower are from one customer where the owner of the company died in November 2018. During 2019, we recognized a $203 gain on foreclosure related to seven of the properties and a $385 loss on foreclosure related to the remaining 20 properties. We recorded additional impairment losses on foreclosed assets of $173 for the year ended December 31, 2019. We recorded a loss on the sale of foreclosed assets of $274 and $103 for the years ended December 31, 2019 and 2018, respectively. During August 2019, we sold one of our foreclosed assets for sale proceeds of $4,543. During 2018, we sold two of our foreclosed assets located in Louisiana which resulted in the loss for that year.
During the year ended December 31, 2018 we recorded four deeds in lieu of foreclosure. Three of the four were with a certain borrower with a completed home and two lots. The fourth was with a borrower who defaulted on a loan by failing to make interest payments. As a result, we reclassed $4,737 to foreclosed assets consisting of $4,494 of principal from loans receivable, net and $243 from accrued interest receivable. We sold the two foreclosed assets in Louisiana, with sales proceeds of $809 and losses on the sales of $103.
Total investment in construction and development costs for foreclosed assets during 2019 and 2018 were $763 and $1,608, respectively. We anticipate additional construction costs in 2020 due to the development of foreclosed assets.
Customer Interest Escrow
The Pennsylvania Loans called for a funded interest escrow account which was funded with proceeds from the Pennsylvania Loans. The initial funding on that interest escrow was $450. The balance as of December 31, 2019 and 2018 was $370 and $219, respectively. To the extent the balance is available in the interest escrow, interest due on certain loans is deducted from the interest escrow on the date due. The interest escrow is increased by 20% of lot payoffs on the same loans, and by interest and/or distributions on a loan in which we are the borrower and Investor’s Mark Acquisitions, LLC is the lender and on the Series B preferred equity. All of these transactions are noncash to the extent that the total escrow amount does not need additional funding.
We have 19 and 40 other loans active as of December 31, 2019 and 2018, respectively, which also have interest escrows. The cumulative balance of all interest escrows other than the Pennsylvania Loans was $273 and $720 as of December 31, 2019 and 2018, respectively.
| 43 |
Roll forward of interest escrow for the years ended December 31, 2019 and 2018:
| 2019 | 2018 | |||||||
| Beginning balance | $ | 939 | $ | 935 | ||||
| Preferred equity dividends | 136 | 125 | ||||||
| Additions from Pennsylvania Loans | 1,107 | 362 | ||||||
| Additions from other loans | 768 | 1,214 | ||||||
| Interest, fees, principal or repaid to borrower | (2,307 | ) | (1,697 | ) | ||||
| Ending balance | $ | 643 | $ | 939 | ||||
Secured Borrowings
Loan Purchase and Sale Agreements
We have two loan purchase and sale agreements where we are the seller of portions of loans we create. The two purchasers are Builder Finance, Inc. (“Builder Finance”) and S.K. Funding, LLC (“S.K. Funding”). Generally, the purchasers buy between 50% and 75% of each loan sold. They receive interest rates ranging from our cost of funds to the interest rate charged to the borrower (interest rates were between 9% and 13% for both 2019 and 2018). The purchasers generally do not receive any of the loan fees we charge. We have the right to call some of the loans sold, with some restrictions. Once sold, the purchaser must fund their portion of the loans purchased. We service the loans. Also, there are limited put options in some cases, whereby the purchaser can cause us to repurchase a loan. The loan purchase and sale agreements are recorded as secured borrowings.
In January 2019, we entered into the Tenth Amendment (the “Tenth Amendment”) to our Loan Purchase and Sale Agreement with S.K. Funding. The purpose of the Tenth Amendment was to allow S.K. Funding to purchase a portion of the Pennsylvania Loans.
The timing of the Company’s principal and interest payments to S.K. Funding under the Tenth Amendment, and S.K. Funding’s obligation to fund the Pennsylvania Loans, vary depending on the total principal amount of the Pennsylvania Loans outstanding at any time, as follows:
| ● | If the total principal amount exceeds $1,500, S.K. Funding must fund the amount between $1,500 and less than or equal to $4,500. | |
| ● | If the total principal amount is less than $4,500, then the Company will also repay S.K. Funding’s principal as principal payments are received on the Pennsylvania Loans from the underlying borrowers in the amount by which the total principal amount is less than $4,500 until S.K. Funding’s principal has been repaid in full. | |
| ● | The interest rate accruing to S.K. Funding under the Tenth Amendment is 10.0% calculated on a 365/366-day basis. |
The Tenth Amendment has a term of 24 months and will automatically renew for an additional six-month term unless either party gives written notice of its intent not to renew at least nine months prior to the end of a term. S.K. Funding will have a priority position as compared to the Company in the case of a default by any of the borrowers.
Lines of Credit
Lines of Credit with Mr. Wallach and His Affiliates
During June 2018, we entered into the First Amendment to the line of credit with our Chief Executive Officer and his wife (the “Wallach LOC”) which modified the interest rate on the Wallach LOC to generally equal the prime rate plus 3%. The interest rate for the Wallach LOC was 7.75% and 8.5% as of December 31, 2019 and 2018, respectively. As of December 31, 2019, we borrowed $44 against the Wallach LOC and $1,206 remained available. Interest expense was $8 and $23 for the year ended December 31, 2019 and December 31, 2018, respectively. There were no borrowings on the Wallach LOC as of December 31, 2018. The maximum outstanding on the Wallach LOC is $1,250 and the loan is a demand loan.
| 44 |
During June 2018, we also entered into the First Amendment to the line of credit with the 2007 Daniel M. Wallach Legacy Trust, which is our CEO’s trust (the “Wallach Trust LOC”) which modified the interest rate on the Wallach Trust LOC to generally equal the prime rate plus 3%. The interest rate for this borrowing was $7.75 and 8.5% as of December 31, 2019 and 2018, respectively. There were no amounts borrowed against the Wallach Trust LOC as of December 31, 2019 and 2018. The maximum outstanding on the Wallach Trust LOC is $250 and the loan is a demand loan.
Line of Credit with William Myrick
During June 2018, we entered into a line of credit agreement (the “Myrick LOC Agreement”) with our Executive Vice President (“EVP”) of Sales, William Myrick. Pursuant to the Myrick LOC Agreement, Mr. Myrick provides us with a line of credit (the “Myrick LOC”) with the following terms:
| ● | Principal not to exceed $1,000; | |
| ● | Secured by a lien against all of our assets; | |
| ● | Cost of funds to us of prime rate plus 3%; and | |
| ● | Due upon demand. |
As of December 31, 2019, we borrowed $145 against the Myrick LOC and $855 remained available. For the years ended December 31, 2019 and 2018 interest expense were $30 and $19, respectively.
Line of Credit with Shuman
During July 2017, we entered into a line of credit agreement (the “Shuman LOC Agreement”) with Steven K. Shuman, which is now held by Cindy K. Shuman as widow and devisee of Mr. Shuman (“Shuman”). Pursuant to the Shuman LOC Agreement, Shuman provides us with a revolving line of credit (the “Shuman LOC”) with the following terms:
| ● | Principal not to exceed $1,325; | |
| ● | Secured with assignments of certain notes and mortgages; | |
| ● | Cost of funds to us of 10%; and | |
| ● | Due in July 2020, but will automatically renew for additional 12-month periods, unless either party gives notice to not renew. |
The Shuman LOC was fully borrowed as of December 31, 2019. Interest expense was $134 for both the years ended December 31, 2019 and 2018, respectively.
Line of Credit with Paul Swanson
During December 2018, we entered into a Master Loan Modification Agreement (the “Swanson Modification Agreement”) with Paul Swanson which modified the line of credit agreement between us and Mr. Swanson dated October 23, 2017. Pursuant to the Swanson Modification Agreement, Mr. Swanson provides us with a revolving line of credit (the “Swanson LOC”) with the following terms:
| ● | Principal not to exceed $7,000; | |
| ● | Secured with assignments of certain notes and mortgages; | |
| ● | Cost of funds to us of 9%; and | |
| ● | Automatic renewal in March 2020 and extended for 15 months. |
The Swanson LOC was fully borrowed as of December 31, 2019. Interest expense was $705 and $624 for the years ended December 31, 2019 and 2018, respectively.
New Lines of Credit
During 2019, we entered into four line of credit agreements (the “New LOC Agreements”). Pursuant to the New LOC Agreements, the lenders provide us with revolving lines of credit with the following terms:
| ● | Principal not to exceed $5,000; | |
| ● | Secured with assignments of certain notes and mortgages; and | |
| ● | Terms generally allow the lenders to give one month notice after which the principal balance of a New LOC Agreement will reduce to a zero over the next six months. |
| 45 |
The total balance of the New LOC Agreements was $2,878 as of December 31, 2019. Interest expense was $168 for the year ended December 31, 2019.
London Financial
During September 2018, we entered into a Master Loan Agreement (“London Loan”) with London Financial Company, LLC (“London Financial”).
During August 2019, we sold our largest foreclosed asset with sales proceeds of $4,543 and a portion of the proceeds were used to pay off the London Loan. For the years ended December 31, 2019 and 2018, interest expense was $219 and $89, respectively.
Mortgage Payable
During January 2018, we entered into a commercial mortgage on our office building with the following terms:
| ● | Principal not to exceed $660; | |
| ● | Interest rate at 5.07% per annum based on a year of 360 days; and | |
| ● | Due in January 2033. |
The principal amount of the Company’s commercial mortgage was $634 as of December 31, 2019. For the years ended December 31, 2019 and 2018, interest expense was $33 and $41, respectively.
Secured Borrowings Secured by Loan Assets
Borrowings secured by loan assets are summarized below:
| December 31, 2019 | December 31, 2018 | |||||||||||||||
| Book Value of Loans which Served as Collateral | Due from Shepherd’s Finance to Loan Purchaser or Lender | Book Value of Loans which Served as Collateral | Due from Shepherd’s Finance to Loan Purchaser or Lender | |||||||||||||
| Loan Purchaser | ||||||||||||||||
| Builder Finance | $ | 13,711 | 9,375 | $ | 8,742 | $ | 5,294 | |||||||||
| S.K. Funding | 10,394 | 6,771 | 11,788 | 6,408 | ||||||||||||
| Lender | ||||||||||||||||
| Shuman | 1,785 | 1,325 | 2,051 | 1,325 | ||||||||||||
| Jeff Eppinger | 1,821 | 1,000 | - | - | ||||||||||||
| Hardy Enterprises, Inc. | 1,684 | 1,000 | - | - | ||||||||||||
| Gary Zentner | 472 | 250 | - | - | ||||||||||||
| R. Scott Summers | 841 | 628 | - | - | ||||||||||||
| Paul Swanson | 8,377 | 5,824 | 8,079 | 5,986 | ||||||||||||
| Total | $ | 39,085 | 26,173 | $ | 30,660 | $ | 19,013 | |||||||||
| 46 |
Unsecured Borrowings
Unsecured Notes through the Public Offering (“Notes Program”)
The effective interest rate on the Notes borrowings at December 31, 2019 and 2018 was 10.56% and 10.41%, respectively, not including the amortization of deferred financing costs. There are limited rights of early redemption. We generally offer four durations at any given time, ranging from 12 to 48 months. The following table shows the roll forward of our Notes Program:
| December 31, 2019 | December 31, 2018 | |||||||
| Gross Notes outstanding, beginning of period | $ | 17,348 | $ | 14,121 | ||||
| Notes issued | 11,127 | 9,645 | ||||||
| Note repayments / redemptions | (8,167 | ) | (6,418 | ) | ||||
| Gross Notes outstanding, end of period | 20,308 | 17,348 | ||||||
| Less deferred financing costs, net | 416 | 212 | ||||||
| Notes outstanding, net | $ | 19,892 | $ | 17,136 | ||||
The following is a roll forward of deferred financing costs:
| December 31, 2019 | December 31, 2018 | |||||||
| Deferred financing costs, beginning balance | $ | 1,212 | $ | 1,102 | ||||
| Additions | 365 | 117 | ||||||
| Disposals | (791 | ) | (7 | ) | ||||
| Deferred financing costs, ending balance | $ | 786 | $ | 1,212 | ||||
| Less accumulated amortization | (370 | ) | (1,000 | ) | ||||
| Deferred financing costs, net | $ | 416 | $ | 212 | ||||
The following is a roll forward of the accumulated amortization of deferred financing costs:
| December 31, 2019 | December 31, 2018 | |||||||
| Accumulated amortization, beginning balance | $ | 1,000 | $ | 816 | ||||
| Additions | 161 | 184 | ||||||
| Disposals | (791 | ) | - | |||||
| Accumulated amortization, ending balance | $ | 370 | $ | 1,000 | ||||
| 47 |
Other Unsecured Debts
Our other unsecured debts are detailed below:
| Principal Amount Outstanding as of | ||||||||||||||
| Loan | Maturity Date | Interest Rate(1) | December 31, 2019 | December 31, 2018 | ||||||||||
| Unsecured Note with Seven Kings Holdings, Inc. | Demand(2) | 9.5 | % | $ | 500 | $ | 500 | |||||||
| Unsecured Line of Credit from Builder Finance, Inc. | January 2020 | 10.0 | % | - | 500 | |||||||||
| Unsecured Line of Credit from Paul Swanson | June 2020(6) | 10.0 | % | 1,176 | 1,014 | |||||||||
| Subordinated Promissory Note | September 2020 | 9.5 | % | 563 | 1,125 | |||||||||
| Subordinated Promissory Note | December 2021 | 10.5 | % | 146 | 113 | |||||||||
| Subordinated Promissory Note | April 2020 | 10.0 | % | 100 | 100 | |||||||||
| Subordinated Promissory Note | April 2021 | 10.0 | % | 174 | 150 | |||||||||
| Subordinated Promissory Note | August 2022 | 11.0 | % | 200 | - | |||||||||
| Subordinated Promissory Note | September 2023 | 11.0 | % | 169 | - | |||||||||
| Subordinated Promissory Note | April 2020 | 6.5 | % | 500 | - | |||||||||
| Subordinated Promissory Note | February 2021 | 11.0 | % | 600 | - | |||||||||
| Subordinated Promissory Note | Demand | 5.0 | % | 500 | - | |||||||||
| Subordinated Promissory Note | Demand | 5.0 | % | 3 | - | |||||||||
| Senior Subordinated Promissory Note | March 2022(3) | 10.0 | % | 400 | 400 | |||||||||
| Senior Subordinated Promissory Note | March 2022(4) | 1.0 | % | 728 | 728 | |||||||||
| Junior Subordinated Promissory Note | March 2022(4) | 22.5 | % | 417 | 417 | |||||||||
| Senior Subordinated Promissory Note | October 2020(5) | 1.0 | % | 279 | 279 | |||||||||
| Junior Subordinated Promissory Note | October 2020(5) | 20.0 | % | 173 | 173 | |||||||||
| $ | 6,628 | $ | 5,499 | |||||||||||
(1) Interest rate per annum, based upon actual days outstanding and a 365/366-day year.
(2) Due six months after lender gives notice.
(3) Lender may require us to repay $20 of principal and all unpaid interest with 10 days’ notice.
(4) These notes were issued to the same holder and, when calculated together, yield a blended return of 11% per annum.
(5) These notes were issued to the same holder and, when calculated together, yield a blended return of 10% per annum.
(6) Amount due in June 2020 is $1,000 with the remainder due November 2020.
Priority of Borrowings
The following table displays our borrowings and a ranking of priority. The lower the number, the higher the priority:
| Priority Rank | December 31, 2019 | December 31, 2018 | ||||||||
| Borrowing Source | ||||||||||
| Purchase and sale agreements and other secured borrowings | 1 | $ | 26,806 | $ | 22,521 | |||||
| Secured line of credit from affiliates | 2 | 189 | 816 | |||||||
| Unsecured line of credit (senior) | 3 | 500 | 500 | |||||||
| Other unsecured debt (senior subordinated) | 4 | 1,407 | 1,407 | |||||||
| Unsecured Notes through our public offering, gross | 5 | 20,308 | 17,348 | |||||||
| Other unsecured debt (subordinated) | 5 | 4,131 | 3,002 | |||||||
| Other unsecured debt (junior subordinated) | 6 | 590 | 590 | |||||||
| Total | $ | 53,931 | $ | 46,184 | ||||||
| 48 |
Liquidity and Capital Resources
Our primary liquidity management objective is to meet expected cash flow needs while continuing to service our business and customers. As of December 31, 2019 and 2018, we had 250 and 268, respectively, in combined loans outstanding, which totaled $57,608 and $49,127, respectively, in gross loan receivables outstanding. Unfunded commitments to extend credit, which have similar collateral, credit and market risk to our outstanding loans, were $16,662 and $25,258 as of December 31, 2019 and 2018, respectively. We anticipate a significant increase in our gross loan receivables over the 12 months subsequent to December 31, 2019 by directly increasing originations to new and existing customers.
To fund our combined loans, we rely on secured debt, unsecured debt, and equity, which are described in the following table:
| Source of Liquidity | As
of December 31, 2019 | As
of December 31, 2018 | ||||||
| Secured debt | $ | 26,991 | $ | 23,258 | ||||
| Unsecured debt | 26,520 | 22,635 | ||||||
| Equity | 7,147 | 6,082 | ||||||
Secured debt, net of deferred financing costs increased $3,733 during the year ended December 31, 2019 compared to the same period of 2018. We anticipate increasing our secured debt by roughly half of the increase in loan asset balances over the 12 months subsequent to December 31, 2019 through our existing loan purchase and sale agreements.
The other half of the loan asset growth will come from a combination of increases in our unsecured debt and equity. Unsecured debt, net of deferred financing costs increased $3,885 during the year ended December 31, 2019, which consisted of an increase in our Notes Program of $2,756 and an increase in the balances of other unsecured lines of credit of $1,129. We anticipate an increase in our unsecured debt through increased sales in the Notes Program to cover most of the increase in loan assets not covered by increases in our secured debt during the 12 months subsequent to December 31, 2019.
Equity increased $1,065 during the year ended December 31, 2019, which consisted of increases in Series C cumulative preferred units (“Series C Preferred Units”), Series B cumulative preferred units, and Common A equity of $573, $150, and $342, respectively. We anticipate an increase in our equity during the 12 months subsequent to December 31, 2019 through the issuance of additional Series C Preferred Units and increases in retained earnings. If we are not able to increase our equity through the issuance of additional Series C Preferred Units, we will then attempt to raise additional funds through the Notes Program. If we anticipate the ability to not fund our projected increases in loan balances as discussed above, we may reduce new loan originations to reduce the need for additional funds.
Cash provided by operations decreased $1,150 to $1,101 as of December 31, 2019 compared to $2,251 for the same period of 2018. The decrease was primarily due to an increase in loans receivable of $8,879 to $55,369 as of December 31, 2019 compared to the same period of 2018, which was offset by a decrease in interest escrow of $296 to $643 as of December 31, 2019 compared to the same period of 2018. We had 20 active loans with interest escrows as of December 31, 2019 compared to 41 for the same period of 2018.
Contractual Obligations
The following table shows the maturity of outstanding debt as of December 31, 2019:
| Year Maturing | Total Amount Maturing | Public Offering | Other Unsecured | Secured Borrowings |
||||||||||||
| 2020 | $ | 34,736 | $ | 4,566 | $ | 3,793 | $ | 26,377 | ||||||||
| 2021 | 13,842 | 12,906 | 920 | 16 | ||||||||||||
| 2022 | 3,905 | 2,143 | 1,746 | 16 | ||||||||||||
| 2023 | 878 | 693 | 169 | 16 | ||||||||||||
| 2024 and thereafter | 570 | - | - | 570 | ||||||||||||
| Total | $ | 53,931 | $ | 20,308 | $ | 6,628 | $ | 26,995 | ||||||||
| 49 |
The total amount maturing through year ending December 31, 2020 is $34,736, which consists of secured borrowings of $26,377 and unsecured borrowings of $8,359.
Secured borrowings maturing through the year ending December 31, 2020 significantly consists of loan purchase and sale agreements with two loan purchasers (Builder Finance and S. K. Funding) and six lenders. Our secured borrowings mature by 2020 due primarily to their related demand loan collateral. The following are secured facilities listed as maturing in 2020 with actual maturity and renewal dates:
| ● | Swanson – $5,824 due March 2020 and automatically renews unless notice given; | |
| ● | Shuman – $1,325 due July 2020 and automatically renews unless notice is given; | |
| ● | S. K. Funding – $3,500 of the total due July 2020; | |
| ● | S.K. Funding – $3,271 no expiration date; | |
| ● | 1st Financial Bank USA – $9,375 no expiration date; | |
| ● | New LOC Agreements – one month notice and six months to reduce principal balance to zero; | |
| ● | Myrick Line of Credit – $145 no expiration date; | |
| ● | Wallach Line of Credit – $44 no expiration date; and | |
| ● | Mortgage Payable – $15. |
Unsecured borrowings due on December 31, 2020 consist of Notes issued pursuant to the Notes Program and other unsecured debt of $4,566 and $3,793, respectively. To the extent that Notes issued pursuant to the Notes Program are not reinvested upon maturity, we will be required to fund the maturities, which we anticipate funding through the issuance of new Notes in our Notes Program. Historically, approximately 75% of our Note holders reinvest upon maturity. Our other unsecured debt has historically renewed. For more information on other unsecured borrowings, see Note 6 – Borrowings. If other unsecured borrowings are not renewed in the future, we anticipate funding such maturities through investments in our Notes Program.
Summary
We have the funding available to address the loans we have today, including our unfunded commitments. We anticipate growing our assets through the net sources and uses (12-month liquidity) listed above as well as future capital increases from debt, redeemable preferred equity, and regular equity. Although our secured debt is all listed as currently due because of the underlying collateral being demand notes, the vast majority of our secured debt is either contractually set to automatically renew unless notice is given or, in the case of purchase and sale agreements, has no end date as to when the purchasers will not purchase new loans (although they are never required to purchase additional loans).
Inflation, Interest Rates, and Housing Starts
Since we are in the housing industry, we are affected by factors that impact that industry. Housing starts impact our customers’ ability to sell their homes. Faster sales mean higher effective interest rates for us, as the recognition of fees we charge is spread over a shorter period. Slower sales mean lower effective interest rates for us. Slower sales are likely to increase the default rate we experience.
Housing inflation has a positive impact on our operations. When we lend initially, we are lending a percentage of a home’s expected value, based on historical sales. If those estimates prove to be low (in an inflationary market), the percentage we loaned of the value actually decreases, reducing potential losses on defaulted loans. The opposite is true in a deflationary housing price market. It is our opinion that values are average in many of the housing markets in the U.S. today, and our lending against these values is safer than loans made by financial institutions in 2006 to 2008.
| 50 |
Interest rates have several impacts on our business. First, rates affect housing (starts, home size, etc.). High long-term interest rates may decrease housing starts, having the effects listed above. Higher interest rates will also affect our investors. We believe that there will be a spread between the rate our Notes yield to our investors and the rates the same investors could get on deposits at FDIC insured institutions. We also believe that the spread may need to widen if these rates rise. For instance, if we pay 7% above average CD rates when CDs are paying 1.5%, when CDs are paying 3%, we may need a larger than 7% difference. This may cause our lending rates, which are based on our cost of funds, to be uncompetitive. High interest rates may also increase builder defaults, as interest payments may become a higher portion of operating costs for the builder. Below is a chart showing three-year U.S. treasury rates, which are being used by us here to approximate CD rates. Short term interest rates have risen slightly but are generally low historically.
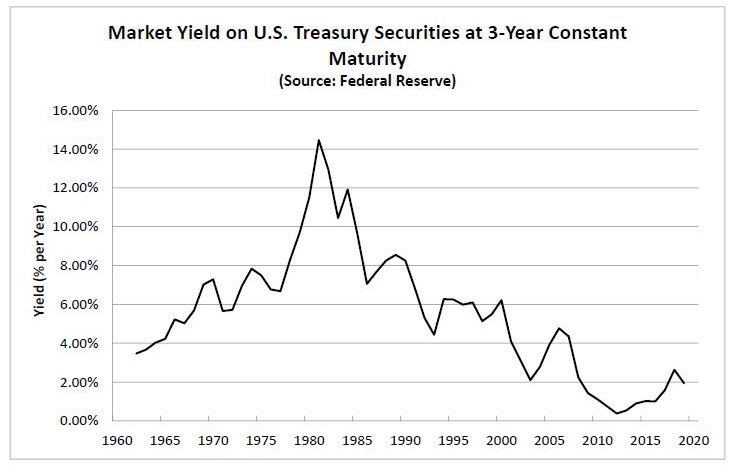
Housing prices are also generally correlated with housing starts, so that increases in housing starts usually coincide with increases in housing values, and the reverse is generally true. Below is a graph showing single family housing starts from 2000 through today.
| 51 |
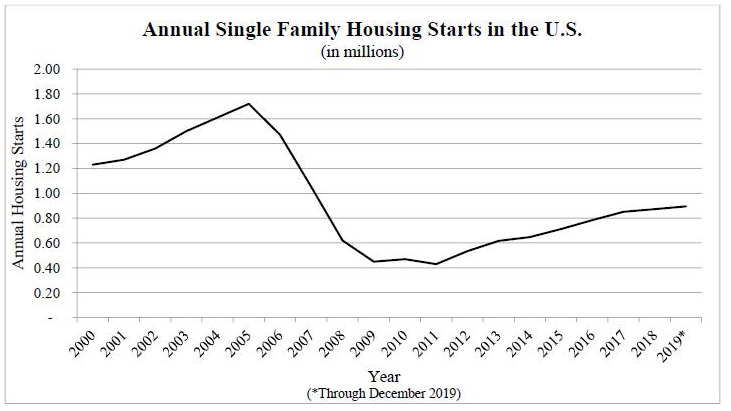
(Source: U.S. Census Bureau)
To date, changes in housing starts, CD rates, and inflation have not had a material impact on our business.
Off-Balance Sheet Arrangements
As of December 31, 2019, we had no off-balance sheet transactions, nor do we currently have any such arrangements or obligations.
Recent Accounting Pronouncements
See Note 2 to our consolidated financial statements for a description of new or recent accounting pronouncements.
Subsequent Events
See Note 13 to our consolidated financial statements for subsequent events.
ITEM 7A. QUANTITATIVE AND QUALITATIVE DISCLOSURES ABOUT MARKET RISK
We are a smaller reporting company as defined by Rule 12b-2 of the Securities Exchange Act of 1934 and are not required to provide the information under this item.
ITEM 8. FINANCIAL STATEMENTS AND SUPPLEMENTARY DATA
The consolidated financial statements and supplementary data filed as part of this annual report are set forth beginning on page F-1 of this report.
ITEM 9. CHANGES IN AND DISAGREEMENTS WITH ACCOUNTANTS ON ACCOUNTING AND FINANCIAL DISCLOSURE.
None.
| 52 |
ITEM 9A. CONTROLS AND PROCEDURES
Disclosure Controls and Procedures
As of the end of the period covered by this report, management including our CEO (our principal executive officer) and Acting CFO (our principal financial officer) evaluated the effectiveness of the design and operation of our disclosure controls and procedures. Based upon, and as of the date of, the evaluation, our CEO (our principal executive officer) and Acting CFO (our principal financial officer) concluded that the disclosure controls and procedures were effective as of the end of the period covered by this report to ensure that information required to be disclosed in the reports we file and submit under the Securities Exchange Act of 1934, as amended (the “Exchange Act”), is recorded, processed, summarized and reported as and when required. Disclosure controls and procedures include, without limitation, controls and procedures designed to ensure that information required to be disclosed by us in the reports we file and submit under the Exchange Act is accumulated and communicated to our management, including our CEO (our principal executive officer) and Acting CFO (our principal financial officer), as appropriate to allow timely decisions regarding required disclosure.
Internal Control over Financial Reporting
Our management is responsible for establishing and maintaining adequate internal control over financial reporting (as defined in Exchange Act Rules 13a-15(f) and 15d-15(f)) for us. Management evaluated, as of December 31, 2019, the effectiveness of our internal control over financial reporting. In making this assessment, management used the criteria set forth by the Committee of Sponsoring Organizations of the Treadway Commission (“COSO”) in Internal Control—Integrated Framework (2013). Based on this evaluation, management concluded that our internal control over financial reporting was effective as of December 31, 2019.
There has been no change in our internal control over financial reporting during the quarter ended December 31, 2019, that has materially affected, or is reasonably likely to materially affect, our internal control over financial reporting.
During the fourth quarter of 2019, there was no information required to be disclosed in a report on Form 8-K which was not disclosed in a report on Form 8-K.
ITEM 10. DIRECTORS, EXECUTIVE OFFICERS AND CORPORATE GOVERNANCE
Managers and Executive Officers
Included below is certain information about our managers and executive officers. Mr. Wallach was initially elected to a three-year term that expired in March 2016 and his current three-year term expires in March 2022, Mr. Summers was initially elected to a two-year term that expired in March 2014 and his current three-year term expires in March 2020, Mr. Rauscher was initially elected to a three-year term that expired in March 2018 and his current three-year term expires in March 2021, and Mr. Sheldon was initially elected to a one-year term that expires in March 2020.
Daniel M. Wallach, age 52, is our CEO and a manager. He has been our CEO since our Company was founded and, prior to the addition of two independent managers in March 2012, he was our sole manager. Mr. Wallach has over 25 years of experience in finance and real estate. Prior to his time with us, most recently, from May 2011 to July 2011, Mr. Wallach was an Executive Vice President for ProBuild Holdings, a building material supplier to homebuilders. Before that, from 1985 to 1989, and 1990 to April 2011, Mr. Wallach held various positions with 84 Lumber Company and affiliates, including Chief Financial Officer and Director. 84 Lumber is a building material supplier to homebuilders and was, at that time, one of our affiliates. At 84 Lumber, Mr. Wallach oversaw the company’s financial and accounting function, including all aspects related to financial reporting, debt financing, customer financing, customer credit and management information systems. Mr. Wallach was also intimately involved with the creation of 84 FINANCIAL, L.P., a finance company affiliated with and owned by 84 Lumber, which had investment objectives similar to ours. Mr. Wallach has also held operational and finance positions with a mortgage brokerage firm and a building contractor. He graduated from Washington and Jefferson College in Washington, Pennsylvania with a B.A. in Business Administration.
| 53 |
Barbara L. Harshman, age 44, is our Executive Vice President of Operations, a position to which she was appointed in July 2015. She was hired in August 2012 as Vice President of Operations. Prior to joining the Company, from 2005 to 2012, Ms. Harshman worked in various positions in 84 Lumber Company’s lending operations, including Vice President of Lending. Ms. Harshman also worked as a credit manager for 84 Lumber during 2004 and 2005, where she managed a portfolio of $35,000,000 of unsecured debt owed by builders. Ms. Harshman graduated from Baylor University with a B.A. in Anthropology.
Catherine Loftin, age 41, is our Acting Chief Financial Officer, a position to which she was appointed in July 2019. Ms. Loftin served as our Chief Financial Officer from January 2018 to May 2019, and has continued to serve as our employee since May 2019. Ms. Loftin previously served as our Controller from November 2017 until her appointment as Chief Financial Officer. Prior to joining the Company, Ms. Loftin was the Corporate Controller for Lucas Group from November 2017 to June 2018. Prior to Lucas Group, Ms. Loftin was a Division Controller for Pulte Group from July 2014 through November 2017. Prior to Pulte Group, Ms. Loftin was the Director of Financial Reporting for DS Services Holdings, Inc. from November 2013 to April 2014. Ms. Loftin spent a majority of her career with Simmons Bedding Company as Manager of Financial Reporting from 2006 to 2013. Ms. Loftin started her accounting career with PricewaterhouseCoopers, after an internship with PricewaterhouseCoopers. Ms. Loftin received her Bachelors of Business of Administration from the Terry College of Business School at the University of Georgia, and her Masters of Accounting from Kennesaw State University’s Cole’s College of Business.
William Myrick, age 58, is our Executive Vice President of Sales, a position to which he was appointed in March 2018. Mr. Myrick was one of our independent managers from March 2012 to March 2018. He has been involved in lumber and building materials for over 35 years. From July 2012 through December 2017, Mr. Myrick was the CEO of American Builders Supply, a building material supplier to homebuilders, where he was responsible for all aspects of the management of that business. From January 2007 to July 2011, he held various executive officer positions with ProBuild Holdings, including, most recently, CEO, and was responsible for all aspects of the management of ProBuild’s business. From 1982 to January 2007, Mr. Myrick was with 84 Lumber Company, where he held positions including, most recently, Chief Operating Officer. Mr. Myrick served as a director of ProBuild from July 2010 to July 2011, and currently serves as a director of American Builders Supply, a position he has held since July 2012. He is a graduate of the Advanced Management Program from Harvard Business School.
Kenneth R. Summers, age 73, is one of the independent managers, to which he was elected in March 2012. Mr. Summers retired from United Bank, Inc. of Morgantown, West Virginia in December 2019. Prior to retirement, he had been an Executive Vice President for United Bank since 2001. In that role he was responsible for the expansion and recognition of the bank’s franchise in north central West Virginia. Mr. Summers has over 30 years of experience as a community bank executive. He graduated from the University of Charleston with a B.S. in Accounting and Management.
Eric A. Rauscher, age 54, is one of the independent managers, to which he was elected in March 2015. Mr. Rauscher is a licensed insurance sales person and has worked in that industry since 1999. Prior to that, he spent over ten years as a field sales engineer. He graduated from Case Western Reserve University with a B.S. in Electrical Engineering and Applied Physics, with a minor in Economics.
Gregory L. Sheldon, age 61, has been one of our independent managers since March 2019. Mr. Sheldon brings almost 40 years of business experience building global corporations and integrating acquisitions across Finance, Supply Chain, Manufacturing and Corporate functions. Most recently he served as the Chief Information Officer for Mylan from October 2008 to March 2013, the CIO for Duquesne Light Company from August 2013 to March 2015, and, since October 2018, has been serving as the Interim CIO for MiMedx Group, Inc., a biopharmaceutical company developing, manufacturing and marketing regenerative biologics utilizing human placental allografts for multiple sectors of healthcare. Since July 2014, Mr. Sheldon has been an owner of two companies which invest in land acquisition, development and the construction of residential homes: White Column Investments, LLC, where he is the President and Managing Member, and Sheldon Investments, LLC. Since 2017, he has served as a non-compensated advisor to Mark Hoskins, who owns Benjamin Marcus Homes, LLC and Investor’s Mark Acquisitions, LLC, which are companies that design, develop, and build single family homes, and which are also two of our customers. Mr. Sheldon has been the owner of Greg Sheldon and Associates, LLC, a consultant and strategic advisor to clients in the life sciences and consumer products industries, since April 2015. Mr. Sheldon has held numerous other leadership positions with leading, global companies including Kraft General Foods, Georgia-Pacific, and Pfizer Inc., and was involved in the start-up of The Georgia Lottery. He graduated from Georgia State University with a Master of Science in Management and from Georgia Institute of Technology with a Bachelor of Science in Industrial Management.
| 54 |
Code of Ethics
Our board of managers adopted an amended Code of Ethics and Business Conduct on November 8, 2018 (the “Code of Ethics”), which contains general guidelines applicable to our employees, executive officers and the members of our board of managers with the purpose of promoting the following: (1) honest and ethical conduct, including the ethical handling of actual or apparent conflicts of interest between personal and professional relationships; (2) full, fair, accurate, timely and understandable disclosure in reports and documents that we file with, or submit to, the SEC and in other public communications made by us; (3) compliance with applicable laws and governmental rules and regulations; (4) the prompt internal reporting of violations of the Code of Ethics to an appropriate person or persons identified in the Code of Ethics; and (5) accountability for adherence to the Code of Ethics. A copy of the Code of Ethics is posted on our website at www.shepherdsfinance.com.
Audit Committee
Our board of managers has established a separately-designated audit committee, whose charter was adopted on August 9, 2012 and amended on November 8, 2018. The purpose of the audit committee is to oversee the Company’s accounting and financial reporting processes and the audit of the Company’s consolidated financial statements. Our audit committee consists of Messrs. Rauscher, Summers, and Sheldon, our three independent managers. We have no “audit committee financial expert” (as such term is defined in Item 407(d)(5)(ii) of Regulation S-K). We believe the cost to retain a financial expert at this time is prohibitive. However, our board of managers believes that each member of the audit committee has sufficient knowledge and relevant background experience to serve on the audit committee.
ITEM 11. EXECUTIVE COMPENSATION
Executive Officer Compensation
This discussion describes our compensation philosophy and policies for our executive officers, which currently includes our CEO, Acting CFO, EVP of Operations, and our EVP of Sales.
Objectives of Executive Officer Compensation Program
The objectives of our executive compensation program are to attract, retain, and motivate highly talented executives and to align each executive’s incentives with our short-term and long-term objectives, while maintaining a healthy and stable financial position. Specifically, our executive compensation program is designed to accomplish the following goals and objectives:
| ● | maintain a compensation program that is equitable in our marketplace; | |
| ● | provide opportunities that integrate pay with the short-term and long-term performance goals; | |
| ● | encourage and reward achievement of strategic objectives, while properly balancing a controlled risk-taking behavior; and | |
| ● | maintain an appropriate balance between base salary and short-term and long-term incentive opportunity. |
| 55 |
Determining Executive Officer Compensation
The compensation committee of our board of managers is responsible for determining all aspects of our executive compensation program. The determination and assessment of executive compensation are primarily driven by the following three factors: (1) market data based on the compensation levels, programs and practices of other comparable companies for comparable positions, (2) our financial performance, and (3) executive officer performance. We believe these three factors provide a reasonably measurable assessment of executive performance in light of building value and creating a healthy financial position for us. We rely upon the judgment of the members of the compensation committee and not on rigid formulas or short-term changes in business performance in determining the amount and mix of compensation elements and whether each element provides the appropriate incentive and reward for performance that sustains and enhances our long-term growth.
Executive Officer Compensation Components
Base Salary
We provide each of our paid executive officers with a base salary to compensate such officer for services rendered throughout the year. Salaries are established annually based on the individual’s position, experience, performance, past and potential contribution to us, and level of responsibility, as well as our overall financial performance. No specific weighting is applied to any one factor considered, and the independent managers use their judgment and expertise in determining appropriate salaries within the parameters of the compensation philosophy.
Bonus
We pay each of our full time executive officers a team bonus mostly based on our overall profitability, which rewarded each of them $6,700 in 2019.
Membership Interests
As the beneficial owner of 80.7% (as of March 1, 2020) of our outstanding common membership interests, Mr. Wallach’s interests are closely aligned with our success. Our Executive Vice President of Operations owns 2% of our outstanding common membership interests and our Executive Vice President of Sales owns 15.3% of our outstanding common membership interests. As we hire additional executive officers, we may use membership interests in some fashion as part of their compensation.
The following table provides a summary of the compensation received by our named executive officers for the last two completed fiscal years:
| Name and Position | Year | Salary | Bonus(1) | Stock Awards | Option Awards | Non-Equity Incentive Plan Compensation | Non-Qualified Deferred Compensation Earnings | All Other Compensation(2) |
Total | |||||||||||||||||||||||||||
| Daniel Wallach, | 2019 | 63,781 | 6,700 | – | – | – | – | 12,453 | 82,934 | |||||||||||||||||||||||||||
| CEO | 2018 | 49,434 | 12,060 | – | – | – | – | 36,172 | 488,130 | |||||||||||||||||||||||||||
| Barbara Harshman, | 2019 | 97,949 | 6,700 | – | – | – | – | 18,476 | 123,125 | |||||||||||||||||||||||||||
| EVP Operations | 2018 | 74,698 | 70,494 | – | – | – | – | 15,271 | 160,463 | |||||||||||||||||||||||||||
| William Myrick, | 2019 | 149,356 | 6,700 | – | – | – | – | 27,552 | 183,608 | |||||||||||||||||||||||||||
| EVP Sales(3) | 2018 | 119,833 | 6,660 | – | – | – | – | 20,952 | 147,445 | |||||||||||||||||||||||||||
(1) Amounts in the Bonus column represent amounts earned in the period.
(2) Qualified Retirement Plan Contributions are shown here when funds are earned.
(3) Mr. Myrick served as an independent manager from March 2012 to March 2018. Of the $20,952 listed in the 2018 “All Other Compensation” column for Mr. Myrick, $4,111 were fees earned or paid in cash for his services as a manager during part of 2018.
| 56 |
Changes for 2020
Mr. Wallach will receive a base salary of $72,240 for 2020. In addition, Mr. Wallach will receive the Company’s team bonus which will range between $0 and $4,700. Ms. Harshman, our Executive Vice President of Operations, will receive a base salary of $112,550 for 2020. In addition, Ms. Harshman will receive the Company’s team bonus which will range between $0 and $4,700 and will receive an additional bonus based on Company operational management. Ms. Loftin, our Acting CFO, will be compensated based on an hourly rate in 2020. Mr. Myrick, our Executive Vice President of Sales, will receive a base salary of $154,781 for 2020. In addition, Mr. Myrick will receive the team bonus, which will reward between $0 and $4,700.
Board of Managers Compensation
The following table provides a summary of the compensation received by our managers for the year ended December 31, 2019:
| Name | Fees Earned or Paid in Cash | Stock Awards | Option Awards |
Non-Equity Incentive Plan Compensation | Change in Pension Value and Nonqualified Deferred Compensation | All Other Compensation | Total | |||||||||||||||||||||
| Daniel M. Wallach | $ | – | $ | – | $ | – | $ | – | $ | – | $ | – | $ | – | ||||||||||||||
| Kenneth R. Summers | 33,000 | – | – | – | – | – | 33,000 | |||||||||||||||||||||
| Eric A. Rauscher | 33,000 | – | – | – | – | – | 33,000 | |||||||||||||||||||||
| Gregory L. Sheldon(1) | 24,750 | – | – | – | – | – | 24,750 | |||||||||||||||||||||
| Total | $ | 90,750 | – | – | – | – | – | $ | 90,750 | |||||||||||||||||||
| (1) | Mr. Sheldon was appointed to the board of managers in March 2019. |
We paid each of the independent managers an annual retainer of $25,000, with the exception of Mr. Sheldon who received a lesser retainer due to only serving as a manager for part of the year. Our independent managers also receive fees of $2,000 for the first day and $1,200 for any additional days for meetings of the board of managers and committees attended in person, all or a portion of which may be allocated as reimbursement of expenses incurred in connection with attendance at meetings. The independent managers do not receive separate reimbursement of out-of-pocket expenses incurred in connection with attendance at meetings. Mr. Wallach receives no compensation for his services as a manager.
| 57 |
ITEM 12. SECURITY OWNERSHIP OF CERTAIN BENEFICIAL OWNERS AND MANAGEMENT AND RELATED STOCKHOLDER MATTERS
The following table sets forth the ownership of certain of our outstanding membership interests as of December 31, 2019:
| Title of Class | Name and Address of Owner(1) | Number of Units | Percent of Class | Dollar Value | Percentage of Total Equity | |||||||||||||
| Class A Common Units | Daniel M. Wallach and Joyce S. Wallach | 87.53 | 3.4 | % | $ | 90,506 | 1.3 | % | ||||||||||
| Class A Common Units | 2007 Daniel M. Wallach Legacy Trust | 2,033.43 | 77.3 | % | 2,102,164 | 29.4 | % | |||||||||||
| Class A Common Units | Kenneth R. Summers | 26.29 | 1.0 | % | 27,178 | 0.3 | % | |||||||||||
| Class A Common Units | Eric A. Rauscher | 26.29 | 1.0 | % | 27,178 | 0.3 | % | |||||||||||
| Class A Common Units | William Myrick | 402.88 | 15.3 | % | 416,487 | 6.0 | % | |||||||||||
| Class A Common Units | Barbara Harshman | 52.58 | 2.0 | % | 54,357 | 0.7 | % | |||||||||||
| Subtotal of Common Voting Equity | 2,629.00 | 100 | % | 2,717,870 | 38.0 | % | ||||||||||||
| Series C Preferred Units | Daniel M. Wallach and Joyce S. Wallach | 14.21 | 48.1 | % | 1,421,165 | 19.9 | % | |||||||||||
| Series C Preferred Units | Gregory L. Sheldon and Madeline M. Sheldon | 3.36 | 11.4 | % | 337,151 | 4.7 | % | |||||||||||
| Series C Preferred Units | Other Holders of Series C Preferred Units | 12.00 | 40.5 | % | 1,200,291 | 16.8 | % | |||||||||||
| Subtotal of Series C Preferred Units | 29.59 | 100.0 | % | 2,958,607 | 41.4 | % | ||||||||||||
| Series B Preferred Units | Holders of Series B Preferred Units | 14.70 | 100.0 | % | 1,470,000 | 20.6 | % | |||||||||||
| Total Members’ Capital and Redeemable Preferred Equity | 2,673.29 | $ | 7,146,477 | 100 | % | |||||||||||||
| (1) | The addresses of each Class A Common Unit owner named above are: The addresses of Daniel and Joyce Wallach, the 2007 Daniel M. Wallach Legacy Trust, William Myrick, and Barbara Harshman are 13241 Bartram Park Blvd Suite 2401, Jacksonville, FL 32256; Kenneth R. Summers is PO Box 995 Morgantown, WV 26507; and Eric A. Rauscher is 2706 South Park Rd. Bethel Park, PA 15102.
The address of each Series C Preferred Unit owner named above are: Daniel and Joyce Wallach, and the 2007 Daniel M. Wallach Legacy is 13241 Bartram Park Blvd. Suite, 2401, Jacksonville, FL, 32092; and Gregory L. Sheldon and Madeline M. Sheldon is 104 Windsor Ct Venetia, PA 15367. |
| 58 |
ITEM 13. CERTAIN RELATIONSHIPS AND RELATED TRANSACTIONS, AND DIRECTOR INDEPENDENCE
Transactions with Affiliates
Lines of Credit
On December 30, 2011, we obtained two demand loans from Mr. and Mrs. Wallach to finance our operations. These demand loans are collateralized by a lien against all of our assets and are senior in right of payment to the Notes. Mr. Wallach, our CEO (who is also on our board of managers), is the beneficial owner of 80.7% of our outstanding common membership interests.
The first loan, in the original principal amount of $1,250,000, is payable to Daniel M. Wallach and Joyce S. Wallach, as tenants by the entirety (the “Wallach LOC”). The second loan, in the original principal amount of $250,000, is payable to the 2007 Daniel M. Wallach Legacy Trust (the “Wallach Trust LOC”). The total outstanding balance on the Wallach LOC at December 31, 2019 and 2018 was $44,000 and $332,000, respectively. Interest paid on the Wallach LOC was $8,000 and $23,000 for the years ended December 31, 2019 and 2018, respectively. The total outstanding balance on the Wallach Trust LOC as of both December 31, 2019 and 2018 was $0. We have had no borrowings on the Wallach Trust LOC in 2019 or 2018. Each of the lines of credit is evidenced by a promissory note, is payable upon demand of the lender, and generally bears an interest rate equal to the prime rate plus 3%. Pursuant to each promissory note, the lender has the option of funding any amount up to the face amount of the note, in the lender’s sole and absolute discretion. As of December 31, 2019, and 2018, the interest rate was 7.75% and 8.50%, respectively, for both the Wallach LOC and the Wallach Trust LOC.
The original entries into the Wallach LOC and the Wallach Trust LOC were approved by Mr. Wallach in his capacity as sole manager prior to the time we had independent managers. As the demand loans were made at rates equal to the lenders’ cost of funds, Mr. Wallach determined the terms of the demand loans to be as favorable to us as those generally available from unaffiliated third parties. The independent managers ratified and approved these transactions subsequent to the formation of the board of managers. See “Risk Factors — Risks Related to Conflicts of Interest — Our CEO (who is also one of our managers) will face conflicts of interest as a result of the secured affiliated loans made to us, which could result in actions that are not in the best interests of our Note holders.” In June 2018, the Company’s board of managers (with Mr. Wallach abstaining) approved amendments to the Wallach LOC and Wallach Trust LOC to change the interest rate on each to generally equal the prime rate plus 3%.
During June 2018, we entered into a line of credit agreement (the “Myrick LOC Agreement”) with our EVP of Sales, William Myrick. The Company’s board of managers approved the Company entering into the Myrick LOC Agreement. Pursuant to the Myrick LOC Agreement, Mr. Myrick provides us with a line of credit (the “Myrick LOC”) secured by a lien against all of our assets with the following terms with principal not to exceed $1,000,000. The interest rate on the Myrick LOC is generally equal to the prime rate plus 3%. The Myrick LOC is due upon demand. As of December 31, 2019 and 2018, we borrowed $145,000 and $485,000; respectively against the Myrick LOC. Interest expense was $30,000 and $19,000 for the years ended December 31, 2019 and 2018, respectively.
| 59 |
Notes Program Investments
The Company has accepted new investments under the Notes Program from employees, managers, members, and relatives of managers and members, with $3,849,000 outstanding at December 31, 2019. For the years ended December 31, 2019 and 2018 our investments from affiliates which exceed $120,000 through our Notes Program and other unsecured debt are detailed below:
(All dollar [$] amounts shown in table in thousands.)
| Relationship to | Amount invested as of | Weighted average interest rate as of |
Interest earned during the year ended |
|||||||||||||||||||
| Shepherd’s | December 31, | December 31, | December 31, | December 31, | ||||||||||||||||||
| Investor | Finance | 2019 | 2018 | 2019 | 2019 | 2018 | ||||||||||||||||
| Eric A. Rauscher | Independent Manager | $ | 475 | $ | 475 | 10.00 | % | $ | 47 | $ | 49 | |||||||||||
| Wallach Family Irrevocable Educational Trust | Trustee is Member | 294 | 200 | 9.50 | % | 27 | 19 | |||||||||||||||
| David Wallach | Father of Member | 635 | 635 | 10.36 | % | 66 | 43 | |||||||||||||||
| Gregory L. Sheldon | Independent Manager | 1,000 | 850 | 10.50 | % | 105 | 70 | |||||||||||||||
| R. Scott Summers | Son of Independent Manager | 500 | 475 | 5.0 | % | 3 | 25 | |||||||||||||||
| Joseph Rauscher | Parent of Independent Manager | 195 | 195 | 11.0 | % | 21 | 13 | |||||||||||||||
| Kenneth Summers | Independent Manager | 189 | 79 | 10.73 | % | 20 | 3 | |||||||||||||||
| Lydle Mandrona | Mother-in-Law of Independent Manager | - | 150 | 10.50 | % | - | 10 | |||||||||||||||
| Kimberly Bedford | Employee | 143 | 143 | 11.0 | % | 16 | 8 | |||||||||||||||
| Lamar Sheldon | Parent of Independent Manager | 203 | 100 | 10.67 | % | 17 | 2 | |||||||||||||||
Hoskins Group’s Series B Preferred Equity
The Series B cumulative preferred membership units (“Series B Preferred Units”) of our membership interests were first issued to the Hoskins Group through a reduction in the SF Loan. They are redeemable only at the option of the Company or upon a change or control or liquidation. The Series B Preferred Units have a fixed value which is their purchase price, and preferred liquidation and distribution rights. Yearly distributions of 10% of the Series B Preferred Units’ value (providing profits are available) will be made quarterly. The Hoskins Group’s Series B Preferred Units are also used as collateral for that group’s loans to the Company. There is no liquid market for the Series B Preferred Units, so we can give no assurance as to our ability to generate any amount of proceeds from that collateral. In December 2015, the Hoskins Group agreed to purchase 0.1 Series B Preferred Units upon each closing of a lot sale in the subdivisions in which we lend the Hoskins Group development funds. The Hoskins Group purchased 1.5 and 0.8 Series B Preferred Units in 2019 and 2018, respectively.
Series C Preferred Equity
On October 13, 2019, we issued one Series C cumulative preferred unit (“Series C Preferred Unit”) to Gregory L. Sheldon, an independent manager, for the total purchase price of $100,000.
Investors in the Series C cumulative preferred units (“Series C Preferred Units”) may elect to reinvest their distributions in additional Series C Preferred Units (the “Series C Reinvestment Program”). Pursuant to the Series C Reinvestment Program, as of December 31, 2019, we have issued approximately 14.21 Series C Preferred Units to Daniel M. Wallach, our CEO, for distribution proceeds of approximately $1,421,000 and we have issued approximately 3.36 Series C Preferred Units to Gregory L. Sheldon for distribution proceeds of approximately $337,000.
The Series C Preferred Units have a fixed value which is their purchase price and preferred liquidation and distribution rights. Yearly distributions of 12% of the Series C Preferred Units’ value (provided profits are available) will be made on a quarterly basis. This rate can increase if any interest rate on our public Notes offering rises above 12%. Dividends can be reinvested monthly into additional Series C Preferred Units. The Series C Preferred Units have the same preferential rights as the Series B Preferred Units as more fully described above.
| 60 |
Sale of Commercial Loans
In September 2018, the Company sold three loans to Mr. Wallach at their gross loans receivable balance of $281,000 and as such, no gain or loss was recognized on the sale. Cash received was $104,000 and the remaining purchase price was funded through a $177,000 reduction in the principal balance of the line of credit extended by Mr. Wallach to the Company. The Company continues to service these loans. In November 2018, one of the loans paid off for $174,000. As of December 31, 2018, we had $11,000 in builder deposits related to these loans, and the principal balance being serviced was $222,000.
In June 2019, two of the loans owned by Mr. Wallach paid off for approximately $375,000. Additionally, during June 2019, Mr. Wallach purchased two additional loans for approximately $286,000. During December 2019, Mr. Wallach sold one of his loans to Mr. Myrick for approximately $254,000.
In September 2018, we sold two loans to Mr. Myrick at their gross loans receivable balance of $394,000 and as such, no gain or loss was recognized on the sale. Cash received was $94,000 and the remaining purchase price was funded through a $300,000 reduction in the principal balance of the line of credit extended by Mr. Myrick to the Company. As of December 31, 2018, we had $6,000 in builder deposits related to these loans, and the principal balance being serviced was $469,000.
During 2019, three of Mr. Myrick’s loans paid off for approximately $765,000. In addition, during 2019 Mr. Myrick purchased two loans for approximately $456,000. In December 2019, Mr. Myrick purchased one loan from Mr. Wallach for approximately $254,000.
Under all arrangements stated above with Mr. Wallach and Mr. Myrick, the Company will continue to service the loans.
Affiliate Transaction Policy
Our operating agreement provides that any future transaction involving the Company and an affiliate must be approved by a majority vote of independent managers not otherwise interested in the transaction upon a determination of such independent managers that the transaction is on terms no less favorable to the Company than could be obtained from an independent third party. An approval pursuant to this policy shall be set forth in the minutes of the Company and shall include a description of the transaction approved. The responsibility for reviewing and approving affiliate transactions has been delegated to the nominating and corporate governance committee of our board of managers, which is comprised entirely of independent managers.
Pursuant to our operating agreement, we must provide the independent managers with access, at our expense, to our legal counsel or independent legal counsel, as needed.
Board of Managers Independence
We have no securities listed for trading on a national securities exchange or in an automated inter-dealer quotation system of a national securities association, which has requirements that a majority of our board of managers be independent. For purposes of complying with the disclosure requirements of the Securities and Exchange Commission, we have adopted the definition of independence used by the New York Stock Exchange (NYSE). Under the NYSE’s definition of independence, Messrs. Summers, Rauscher, and Sheldon each meet the definition of “independent.”
ITEM 14. PRINCIPAL ACCOUNTING FEES AND SERVICES
On January 10, 2019, the Company dismissed Carr, Riggs & Ingram, LLC (“CRI”) as the Company’s independent registered public accounting firm. The dismissal of CRI was approved by the audit committee of the Company’s board of managers (the “Audit Committee”). CRI’s audit report on the financial statements of the Company for each of the fiscal years ended December 31, 2017 did not contain an adverse opinion or disclaimer of opinion, nor was it qualified or modified as to uncertainty, audit scope, or accounting principles. Subsequent to the dismissal of CRI, the Audit Committee engaged Warren Averett, LLC (“Warren Averett”) as its independent registered public accounting firm on January 10, 2019.
| 61 |
Our Audit Committee reviewed the audit and non-audit services performed by Warren Averett for 2019 and 2018, as well as the non-audit service fees charged by Warren Averett during 2019 and CRI during 2018. In its review of the non-audit service fees, the Audit Committee considered whether the provision of such services is compatible with maintaining the independence of both Warren Averett and CRI. The aggregate agreed-upon and billed fees for professional accounting services provided by Warren Averett and CRI, including the audit of our annual consolidated financial statements, for the years ended December 31, 2019 and 2018, are set forth in the table below.
Warren Averett 2019 |
CRI 2019 |
Warren Averett 2018 |
CRI 2018 |
|||||||||||||
| Audit Fees | $ | 126,500 | $ | - | $ | - | $ | 157,173 | ||||||||
| Audit-Related Fees* | - | 7,650 | - | 19,608 | ||||||||||||
| Tax Fees | - | - | - | - | ||||||||||||
| All Other Fees | 1,425 | - | - | 2,414 | ||||||||||||
| Total | $ | 127,925 | $ | 7,650 | $ | - | $ | 179,195 | ||||||||
* Public offering assistance
For purposes of the preceding table, the professional fees are classified as follows:
| ● | Audit Fees — These are fees for professional services performed for the audit of our annual financial statements and the required review of our quarterly financial statements and other procedures performed by the independent auditors to be able to form an opinion on our consolidated financial statements. These fees also cover services that are normally provided by independent auditors in connection with statutory and regulatory filings or engagements, and services that generally only an independent auditor reasonably can provide, such as services associated with filing registration statements, periodic reports, and other filings with the SEC. | |
| ● | Audit-Related Fees — These are fees for assurance and related services that traditionally are performed by an independent auditor, such as such as attestation services not required by statute or regulation, and internal control reviews and consultation concerning financial accounting and reporting standards. | |
| ● | Tax Fees — These are fees for all professional services performed by our independent auditor for tax compliance, tax advice, and tax planning, but would not include those services related to the audit of our financial statements. These would include federal, state and local tax issues and may also include assistance with tax audits and appeals before the Internal Revenue Service (IRS) and similar state and local agencies. | |
| ● | All Other Fees — These are fees for other permissible work performed that do not meet one of the above-described categories. |
Pre-Approval Policies
The Audit Committee charter imposes a duty on the Audit Committee to pre-approve all auditing services performed for us by our independent auditors, as well as all permitted non-audit services (including the fees and terms thereof) in order to ensure that the provision of such services does not impair the auditor’s independence. In determining whether or not to pre-approve services, the Audit Committee considers whether the service is permissible under applicable SEC rules. The Audit Committee may, in its discretion, delegate one or more of its members the authority to pre-approve any services to be performed by our independent registered public accounting firm, provided such pre-approval is presented to the full audit committee at its next scheduled meeting.
All services rendered by Warren Averett for the year ended December 31, 2019 were pre-approved in accordance with the policies set forth above.
| 62 |
ITEM 15. EXHIBITS, FINANCIAL STATEMENT SCHEDULES
| (a) | List of Documents Filed. | ||
| 1. | The list of the financial statements contained herein is set forth on page F-1 hereof. | ||
| 2. | All schedules for which provision is made in the applicable accounting regulations of the SEC are not required under the related instructions or are not applicable and therefore have been omitted. | ||
| 3. | The Exhibits filed in response to Item 601 of Regulation S-K are listed on the Exhibit Index below. | ||
| (b) | See (a)3 above. | ||
| (c) | See (a)2 above. | ||
None.
EXHIBIT INDEX
The following exhibits are included in this Annual Report on Form 10-K for the year ended December 31, 2019 (and are numbered in accordance with Item 601 of Regulation S-K).
| 63 |
| 64 |
| 65 |
| 101.INS** | XBRL Instance Document | |
| 101.SCH** | XBRL Schema Document | |
| 101.CAL** | XBRL Calculation Linkbase Document | |
| 101.DEF** | XBRL Definition Linkbase Document | |
| 101.LAB** | XBRL Label Linkbase Document | |
| 101.PRE** | XBRL Presentation Linkbase Document |
* Filed herewith.
** Pursuant to Regulation 406T of Regulation S-T, these Interactive data files are deemed not filed or part of a registration statement or prospectus for purposes of Section 11 or 12 of the Securities Act of 1933, as amended, or Section 18 of the Securities Exchange Act of 1934, as amended, and are otherwise not subject to liability.
| 66 |
Pursuant to the requirements of the Securities Exchange Act of 1934, the Registrant has duly caused this report to be signed on its behalf by the undersigned thereunto duly authorized.
| SHEPHERD’S FINANCE, LLC | ||
| (Registrant) | ||
| Dated: March 12, 2020 | By: | /s/ Daniel M. Wallach |
| Daniel M. Wallach | ||
| CEO and Manager | ||
Pursuant to the requirements of the Securities Exchange Act of 1934, this report has been signed below by the following persons on behalf of the registrant and in the capacities and on the dates indicated:
| Signature | Title | Date | ||
| /s/ Daniel M. Wallach | Chief Executive Officer and Manager | March 12, 2020 | ||
| Daniel M. Wallach | (Principal Executive Officer) | |||
| /s/ Catherine Loftin | Acting Chief Financial Officer | March 12, 2020 | ||
| Catherine Loftin | (Principal Financial Officer and Principal Accounting Officer) | |||
| /s/ Kenneth R. Summers | Manager | March 12, 2020 | ||
| Kenneth R. Summers | ||||
| /s/ Eric A. Rauscher | Manager | March 12, 2020 | ||
| Eric A. Rauscher | ||||
| /s/ Gregory L. Sheldon | Manager | March 12, 2020 | ||
| Gregory L. Sheldon |
Supplemental Information to be Furnished With Reports Filed Pursuant to Section 15(d) of the Act by Registrants Which Have Not Registered Securities Pursuant to Section 12 of the Act
No annual report relating to the fiscal year ended December 31, 2019 or proxy statement with respect to any annual or other meeting of security holders has been sent to security holders.
| 67 |
INDEX TO FINANCIAL STATEMENTS
| Audited Consolidated Financial Statements as of and for the years ended December 31, 2019 and 2018: | ||
| Report of Independent Registered Public Accounting Firm on Financial Statements | F-2 | |
| Consolidated Balance Sheets as of December 31, 2019 and 2018 | F-3 | |
| Consolidated Statements of Operations for the Years Ended December 31, 2019 and 2018 | F-4 | |
| Consolidated Statements of Changes in Members’ Capital for the Years Ended December 31, 2019 and 2018 | F-5 | |
| Consolidated Statements of Cash Flows for the Years Ended December 31, 2019 and 2018 | F-6 | |
| Notes to Consolidated Financial Statements | F-7 |
| F-1 |
REPORT OF INDEPENDENT REGISTERED PUBLIC ACCOUNTING FIRM
To the Board of Managers and
Members of Shepherd’s Finance, LLC
Jacksonville, Florida
Opinion on the Financial Statements
We have audited the accompanying consolidated balance sheets of Shepherd’s Finance, LLC as of December 31, 2019 and 2018 and the related consolidated statements of operations, changes in members’ capital, and cash flows for the years then ended, and the related notes (collectively referred to as the consolidated financial statements). In our opinion, the consolidated financial statements present fairly, in all material respects, the financial position of Shepherd’s Finance, LLC as of December 31, 2019 and 2018, and the results of its operations and its cash flows for the years then ended in conformity with accounting principles generally accepted in the United States of America.
Basis for Opinion
These consolidated financial statements are the responsibility of Shepherd’s Finance, LLC’s management. Our responsibility is to express an opinion on Shepherd’s Finance, LLC’s consolidated financial statements based on our audits. We are a public accounting firm registered with the Public Company Accounting Oversight Board (United States) (PCAOB) and are required to be independent with respect to Shepherd’s Finance, LLC in accordance with the U.S. federal securities laws and the applicable rules and regulations of the Securities and Exchange Commission and the PCAOB.
We conducted our audits in accordance with the standards of the PCAOB. Those standards require that we plan and perform the audit to obtain reasonable assurance about whether the consolidated financial statements are free of material misstatement, whether due to error or fraud. The Company is not required to have, nor were we engaged to perform, an audit of its internal control over financial reporting. As part of our audits, we are required to obtain an understanding of internal control over financial reporting, but not for the purpose of expressing an opinion on the effectiveness of the Company’s internal control over financial reporting. Accordingly, we express no such opinion.
Our audits included performing procedures to assess the risks of material misstatement of the consolidated financial statements, whether due to error or fraud, and performing procedures that respond to those risks. Such procedures included examining, on a test basis, evidence regarding the amounts and disclosures in the consolidated financial statements. Our audits also included evaluating the accounting principles used and significant estimates made by management, as well as evaluating the overall presentation of the consolidated financial statements. We believe that our audits provide a reasonable basis for our opinion.
| /s/ Warren Averett, LLC |
We have served as Shepherd’s Finance, LLC’s auditor since 2018.
Birmingham, Alabama
March 12, 2020
| F-2 |
Consolidated Balance Sheets
As of December 31, 2019, and 2018
| (in thousands of dollars) | 2019 | 2018 | ||||||
| Assets | ||||||||
| Cash and cash equivalents | $ | 1,883 | $ | 1,401 | ||||
| Accrued interest receivable | 1,031 | 568 | ||||||
| Loans receivable, net | 55,369 | 46,490 | ||||||
| Foreclosed assets | 4,916 | 5,973 | ||||||
| Premises and equipment | 936 | 1,051 | ||||||
| Other assets | 202 | 327 | ||||||
| Total assets | $ | 64,337 | $ | 55,810 | ||||
| Liabilities and Members’ Capital | ||||||||
| Customer interest escrow | $ | 643 | $ | 939 | ||||
| Accounts payable and accrued expenses | 466 | 724 | ||||||
| Accrued interest payable | 2,533 | 2,140 | ||||||
| Notes payable secured, net of deferred financing costs | 26,991 | 23,258 | ||||||
| Notes payable unsecured, net of deferred financing costs | 26,520 | 22,635 | ||||||
| Due to preferred equity member | 37 | 32 | ||||||
| Total liabilities | $ | 57,190 | $ | 49,728 | ||||
| Commitments and Contingencies (Note 10) | ||||||||
| Redeemable Preferred Equity | ||||||||
| Series C preferred equity | $ | 2,959 | $ | 2,385 | ||||
| Members’ Capital | ||||||||
| Series B preferred equity | 1,470 | 1,320 | ||||||
| Class A common equity | 2,718 | 2,377 | ||||||
| Members’ capital | $ | 4,188 | $ | 3,697 | ||||
| Total liabilities, redeemable preferred equity and members’ capital | $ | 64,337 | $ | 55,810 | ||||
The accompanying notes are an integral part of these consolidated financial statements.
| F-3 |
Consolidated Statements of Operations
For the years ended December 31, 2019 and 2018
| (in thousands of dollars) | 2019 | 2018 | ||||||
| Net Interest Income | ||||||||
| Interest and fee income on loans | $ | 10,131 | $ | 7,764 | ||||
| Interest expense: | ||||||||
| Interest related to secured borrowings | 2,948 | 2,114 | ||||||
| Interest related to unsecured borrowings | 2,832 | 2,182 | ||||||
| Interest expense | $ | 5,780 | $ | 4,296 | ||||
| Net interest income | 4,351 | 3,468 | ||||||
| Less: Loan loss provision | 222 | 89 | ||||||
| Net interest income after loan loss provision | 4,129 | 3,379 | ||||||
| Non-Interest Income | ||||||||
| Gain on foreclosure of assets | $ | 203 | $ | 19 | ||||
| Total non-interest income | 203 | 19 | ||||||
| Income | 4,332 | 3,398 | ||||||
| Non-Interest Expense | ||||||||
| Selling, general and administrative | $ | 2,394 | $ | 2,030 | ||||
| Depreciation and amortization | 92 | 82 | ||||||
| Loss on the sale of foreclosed assets | 274 | 103 | ||||||
| Impairment loss on foreclosed assets | 558 | 515 | ||||||
| Total non-interest expense | 3,318 | 2,730 | ||||||
| Net income | $ | 1,014 | $ | 668 | ||||
| Earned distribution to preferred equity holder | 457 | 292 | ||||||
| Net income attributable to common equity holders | $ | 557 | $ | 376 | ||||
The accompanying notes are an integral part of these consolidated financial statements.
| F-4 |
Consolidated Statements of Changes in Members’ Capital
For the years ended December 31, 2019 and 2018
| (in thousands of dollars) | 2019 | 2018 | ||||||
| Members’ capital, beginning balance | $ | 3,697 | $ | 3,686 | ||||
| Net income less distributions to Series C preferred equity holders of $316 and $164 | 698 | 504 | ||||||
| Contributions from Series B preferred equity holders | 150 | 80 | ||||||
| Earned distributions to Series B preferred equity holders | (141 | ) | (128 | ) | ||||
| Distributions to common equity holders | (216 | ) | (445 | ) | ||||
| Members’ capital, ending balance | $ | 4,188 | $ | 3,697 | ||||
The accompanying notes are an integral part of these consolidated financial statements.
| F-5 |
Consolidated Statements of Cash Flows
For the years ended December 31, 2019 and 2018
| (in thousands of dollars) | 2019 | 2018 | ||||||
| Cash flows from operations | ||||||||
| Net income | $ | 1,014 | $ | 668 | ||||
| Adjustments to reconcile net income to net cash provided by operating activities: | ||||||||
| Amortization of deferred financing costs | 235 | 209 | ||||||
| Provision for loan losses | 222 | 89 | ||||||
| Change in loan origination fees, net | (290 | ) | 204 | |||||
| Impairment of foreclosed assets | 558 | 515 | ||||||
| Depreciation and amortization | 115 | 82 | ||||||
| Gain on foreclosed assets | (203 | ) | (19 | ) | ||||
| Loss on sale of foreclosed assets | 274 | 103 | ||||||
| Net change in operating assets and liabilities: | ||||||||
| Other assets | (64 | ) | (269 | ) | ||||
| Accrued interest receivable | (463 | ) | (91 | ) | ||||
| Customer interest escrow | (432 | ) | 4 | |||||
| Accounts payable and accrued expenses | 135 | 756 | ||||||
| Net cash provided by operating activities | 1,101 | 2,251 | ||||||
| Cash flows from investing activities | ||||||||
| Loan originations and principal collections, net | (13,159 | ) | (21,234 | ) | ||||
| Investment in foreclosed assets | (763 | ) | (1,608 | ) | ||||
| Proceeds from sale of foreclosed assets | 4,543 | 809 | ||||||
| Premises and equipment additions | - | (64 | ) | |||||
| Net cash used in investing activities | (9,379 | ) | (22,097 | ) | ||||
| Cash flows from financing activities | ||||||||
| Contributions from preferred equity holders | 450 | 2,300 | ||||||
| Distributions to redeemable preferred equity holders | (42 | ) | (1,222 | ) | ||||
| Distributions to common equity holders | (216 | ) | (445 | ) | ||||
| Proceeds from secured note payable | 23,111 | 24,663 | ||||||
| Repayments of secured note payable | (18,294 | ) | (12,969 | ) | ||||
| Proceeds from unsecured notes payable | 14,309 | 13,465 | ||||||
| Redemptions/repayments of unsecured notes payable | (10,382 | ) | (7,808 | ) | ||||
| Deferred financing costs paid | (176 | ) | (215 | ) | ||||
| Net cash provided by financing activities | 8,760 | 17,769 | ||||||
| Net increase (decrease) in cash and cash equivalents | 482 | (2,077 | ) | |||||
| Cash and cash equivalents | ||||||||
| Beginning of period | 1,401 | 3,478 | ||||||
| End of period | $ | 1,883 | $ | 1,401 | ||||
| Supplemental disclosure of cash flow information | ||||||||
| Cash paid for interest | $ | 5,386 | $ | 3,395 | ||||
| Non-cash investing and financing activities | ||||||||
| Reinvested earnings of Series B preferred equity held in interest escrow | $ | 136 | $ | 125 | ||||
| Change in accumulated Series B preferred equity | $ | 4 | $ | 3 | ||||
| Foreclosure of assets transferred from loans receivable, net | $ | 3,352 | $ | 4,494 | ||||
| Accrued interest reduction due to foreclosure | $ | - | $ | 243 | ||||
| Earned but not paid distributions of Series C preferred equity holders | $ | 316 | $ | 164 | ||||
| Secured transferred to unsecured notes payable | $ | (162 | ) | $ | - | |||
| Construction loans purchase through the reduction of Secured LOC Principal Balance | $ | 996 | $ | 377 | ||||
| Reclassification of deferred financing costs from other assets | $ | 189 | $ | - | ||||
The accompanying notes are an integral part of these interim condensed consolidated financial statements.
| F-6 |
Notes to Consolidated Financial Statements
Information presented throughout these notes to the consolidated financial statements is in thousands of dollars.
1. Description of Business
Shepherd’s Finance, LLC and subsidiary (the “Company”, “we”, or “our”) was originally formed as a Pennsylvania limited liability company on May 10, 2007. We are the sole member of a consolidating subsidiary, 84 REPA, LLC. The Company operates pursuant to its Second Amended and Restated Operating Agreement by and among Daniel M. Wallach and the other members of the Company effective as of March 16, 2017.
As of December 31, 2019, the Company extends commercial loans to residential homebuilders (in 21 states) to:
| ● | construct single family homes, | |
| ● | develop undeveloped land into residential building lots, and | |
| ● | purchase and improve for sale older homes. |
2. Summary of Significant Accounting Policies
Principles of Consolidation
These consolidated financial statements include the consolidated accounts of the Company’s subsidiary and reflect all adjustments (all of which are normal recurring accruals) which are, in the opinion of management, necessary for a fair presentation of the consolidated financial position, operating results, and cash flows for the periods. All intercompany balances and transactions have been eliminated.
Use of Estimates
The preparation of consolidated financial statements in conformity with accounting principles generally accepted in the United States of America (“U.S. GAAP”) requires management to make estimates and assumptions that affect the reported amounts of assets and liabilities and disclosure of contingent assets and liabilities at the date of the consolidated financial statements and the reported amounts of revenues and expenses during the reporting period. Actual results could differ from those estimates. It is reasonably possible that market conditions could deteriorate, which could materially affect our consolidated financial position, results of operations and cash flows. Among other effects, such changes could result in the need to increase the amount of our allowance for loan losses and impair our foreclosed assets.
Operating Segments
Financial Accounting Standards Board (“FASB”) Accounting Standards Codification Topic (“ASC”) 280, Segment Reporting, requires that the Company report financial and descriptive information about reportable segments and how these segments were determined. We determine the allocation of resources and performance of business units based on operating income, net income and operating cash flows. Segments are identified and aggregated based on products sold or services provided. Based on these factors, we have determined that the Company’s operations are in one segment, commercial lending.
Revenue Recognition
Interest income generally is recognized on an accrual basis. The accrual of interest is generally discontinued on all loans past due 90 days or more. All interest accrued but not collected for loans that are placed on nonaccrual or charged off is reversed against interest income, unless management believes that the accrued interest is recoverable through liquidation of collateral. Interest received on nonaccrual loans is applied against principal. Interest on accruing impaired loans is recognized as long as such loans do not meet the criteria for nonaccrual status. Our construction loans charge a fee on the amount that we commit to lend, which is amortized over the expected life of each of those loans.
| F-7 |
The Company records revenue when control of the promised services is transferred to the customer, in an amount that reflects the consideration we expect to be entitled to receive in exchange for those products or services. Our performance obligations to customers are primarily satisfied over time as the services are performed and provided to the customer.
Advertising
Advertising costs are expensed as incurred and are included in selling, general and administrative. Advertising expenses were $128 and $87 for the years ended December 31, 2019 and 2018, respectively.
Cash and Cash Equivalents
Management considers highly-liquid investments with original maturities of three months or less to be cash equivalents. The Company maintains its cash account in a deposit account which, at times, may exceed federally insured limits. The Company monitors this bank account and does not expect to incur any losses from such accounts.
Fair Value Measurements
The Company follows the guidance of FASB ASC 825, Financial Instruments (ASC 825), and FASB ASC 820, Fair Value Measurements (ASC 820). ASC 825 permits entities to measure many financial instruments and certain other items at fair value. The objective is to improve financial reporting by providing entities with the opportunity to mitigate volatility in reported earnings caused by measuring related assets and liabilities differently without having to apply complex hedge accounting provisions. ASC 820 clarifies that fair value is an exit price, representing the amount that would be received to sell an asset or paid to transfer a liability in an orderly transaction between market participants. Under this guidance, fair value measurements are not adjusted for transaction costs. This guidance establishes a fair value hierarchy that prioritizes the inputs to valuation techniques used to measure fair value. The hierarchy gives the highest priority to unadjusted quoted prices in active markets for identical assets or liabilities (Level 1 measurements) and the lowest priority to unobservable inputs (Level 3 measurements).
Loans Receivable
Loans are stated at the amount of unpaid principal, net of any allowances for loan losses, and adjusted for (1) the net unrecognized portion of direct costs and nonrefundable loan fees associated with lending, and (2) deposits made by the borrowers used as collateral for a loan and due back to the builder at or prior to loan payoff. The net amount of nonrefundable loan origination fees and direct costs associated with the lending process, including commitment fees, is deferred and accreted to interest income over the lives of the loans using a method that approximates the interest method.
A loan is classified as nonaccrual, and the accrual of interest on such loan is discontinued, when the contractual payment of principal or interest becomes 90 days past due. In addition, a loan may be placed on nonaccrual at any other time management has serious doubts about further collectability of principal or interest according to the contractual terms, even though the loan is currently performing. A loan may remain on accrual status if it is in the process of collection or well-secured (i.e., the loan has sufficient collateral value). Loans are restored to accrual status when the obligation is brought current or has performed in accordance with the contractual terms for a reasonable period of time and the ultimate collectability of the total contractual principal and interest is no longer in doubt.
A loan is considered impaired when, based on current information and events, it is probable that the Company will be unable to collect the scheduled payments of principal or interest when due according to the contractual terms of the loan agreement. Impaired loans, or portions thereof, are charged off when deemed uncollectible. Once a loan is 90 days past due, management begins a workout plan with the borrower or commences its foreclosure process on the collateral.
| F-8 |
Allowance for Loan Losses
The allowance for loan losses is maintained at a level believed adequate by management to absorb probable losses inherent in the loan portfolio.
The Company establishes a collective reserve for all loans which are not more than 60 days past due at the end of each quarter. This collective reserve includes both a quantitative and qualitative analysis. In addition to historical loss information, the analysis incorporates collateral value, decisions made by management and staff, percentage of aging spec loans, policies, procedures, and economic conditions.
The Company individually analyzes for impairment all loans which are more than 60 days past are due at the end of each quarter. We also review for impairment all loans to one borrower with greater than or equal to 10% of our total committed balances. If required, the analysis includes a comparison of estimated collateral value to the principal amount of the loan.
Impaired loans, if the value determined is less than the principal amount due (less any builder deposit), then the difference is included in the allowance for loan loss. As values change, estimated loan losses may be provided for more or less than the previous period, and some loans may not need a loss provision based on payment history. As for homes which are partially complete, the Company will appraise on an as-is and completed basis, and use the appraised value that more closely aligns with our planned method of disposal for the property.
Impaired Loans
A loan is considered to be impaired when it is probable the Company will be unable to collect all principal and interest payments due in accordance with the contractual terms of the loan agreement.
Foreclosed Assets
When a foreclosed asset is acquired in the settlement of a loan, the asset is recorded at the as-is fair value minus expected selling costs establishing a new cost basis. The gain or loss is recorded on our consolidated statement of operations as non-interest income or expense. If the fair value of the asset declines, a write-down is recorded through non-interest expense. While the initial valuation is done on an as-is basis, subsequent values are based on our plan for the asset. Assets which are not going to be improved are still evaluated on an as-is basis. Assets we intend to improve, are improving, or have improved are appraised based on the to-be-completed value, minus reasonable selling costs, and we adjust the portion of the appraised value related to construction improvements for the percentage of the improvements which have not yet been made. Subsequently, if a foreclosed asset has an increase in fair value the increase may be recognized up to the cost basis which was determined at the foreclosure date.
Deferred Financing Costs, Net
Deferred financing cost consist of certain costs associated with financing activities related to the issuance of debt securities (deferred financing costs). These costs consist primarily of professional fees incurred related to the transactions. Deferred financing costs are amortized into interest expense over the life of the related debt. The deferred financing costs are reflected as a reduction in the unsecured notes offering liability.
Income Taxes
The entities included in the consolidated financial statements are organized as pass-through entities under the Internal Revenue Code. As such, taxes are the responsibility of the members. Other significant taxes for which the Company is liable are recorded on an accrual basis.
| F-9 |
The Company applies FASB ASC 740, Income Taxes (ASC 740). ASC 740 provides guidance for how uncertain tax positions should be recognized, measured, presented and disclosed in the consolidated financial statements and requires the evaluation of tax positions taken or expected to be taken in the course of preparing the Company’s consolidated financial statements to determine whether the tax positions are “more-likely-than-not” to be sustained by the applicable tax authority. Tax positions with respect to income tax at the LLC level not deemed to meet the “more-likely-than-not” threshold would be recorded as a tax benefit or expense in the appropriate period. Management concluded that there are no uncertain tax positions that should be recognized in the consolidated financial statements. With few exceptions, the Company is no longer subject to income tax examinations for years prior to 2014.
The Company’s policy is to record interest and penalties related to taxes in interest expense on the consolidated statements of operations. There have been no significant interest or penalties assessed or paid.
Risks and Uncertainties
The Company is subject to many of the risks common to the commercial lending and real estate industries, such as general economic conditions, decreases in home values, decreases in housing starts, increases in interest rates, and competition from other lenders. At December 31, 2019, our loans were significantly concentrated in a suburb of Pittsburgh, Pennsylvania, so the housing starts and prices in that area are more significant to our business than other areas until and if more loans are created in other markets.
Concentrations
Financial instruments that potentially subject the Company to concentrations of credit risk consist principally of loans receivable. Our concentration risks for our top three customers listed by geographic real estate market are summarized in the table below:
| December 31, 2019 | December 31, 2018 | |||||||||||
| Percent of | Percent of | |||||||||||
| Borrower | Loan | Borrower | Loan | |||||||||
| City | Commitments | City | Commitments | |||||||||
| Highest concentration risk | Pittsburgh, PA | 25 | % | Pittsburgh, PA | 23 | % | ||||||
| Second highest concentration risk | Orlando, FL | 15 | % | Sarasota, FL | 13 | % | ||||||
| Third highest concentration risk | Cape Coral, FL | 3 | % | Orlando, FL | 4 | % | ||||||
Recent Accounting Pronouncements
The FASB issued Accounting Standards Update (“ASU”) 2016-01, “Financial Instruments - Overall (Subtopic 825-10): Recognition and Measurement of Financial Assets and Financial Liabilities (An Amendment of FASB ASC 825)” in January 2016. ASU 2016-01 was intended to enhance the reporting model for financial instruments to provide users of financial statements with improved decision-making information. The amendments of ASU 2016-01 include: (i) requiring equity investments, except those accounted for under the equity method of accounting or those that result in the consolidation of an investee, to be measured at fair value, with changes in fair value recognized in net income; (ii) requiring a qualitative assessment to identify impairment of equity investments without readily determinable fair values; and (iii) clarifying that an entity should evaluate the need for a valuation allowance on a deferred tax asset related to available-for-sale securities in combination with the entity’s other deferred tax assets. ASU 2016-01 became effective for the Company on January 1, 2018. The adoption of ASU 2016-01 did not have a material impact on the Company’s consolidated financial statements.
The FASB issued ASU 2014-09, “Revenue from Contracts with Customers (Topic 606)” in May 2014, which added FASB ASC Topic 606, “Revenue from Contracts with Customers,” and superseded revenue recognition requirements in FASB ASC Topic 605, “Revenue Recognition,” and certain cost guidance in FASB ASC Topic 605-35, “Revenue Recognition – Construction-Type and Production-Type Contracts.” ASU 2014-09 requires an entity to recognize revenue when (or as) an entity transfers control of goods or services to a customer at the amount to which the entity expects to be entitled. Depending on whether certain criteria are met, revenue should be recognized either over time, in a manner that depicts the entity’s performance, or at a point in time, when control of the goods or services is transferred to the customer. ASU 2014-09 became effective for the Company on January 1, 2018. The adoption of ASU 2014-09 did not have a material impact on the Company’s consolidated financial statements.
| F-10 |
On January 1, 2018, the Company implemented ASU 2014-09, codified at ASC Topic 606. The Company adopted the ASC Topic 606 using the modified retrospective transition method. The guidance was applied only to contracts which were not completed at the date of initial application. No cumulative transition adjustment was recorded to the beginning balance of members’ capital as a result of implementation. Results for reporting periods beginning January 1, 2018 are presented under ASC Topic 606, while prior period amounts continue to be reported under legacy U.S. GAAP.
The majority of the Company’s revenue is generated through interest earned on financial instruments, including loans, which falls outside the scope of ASC Topic 606. All of the Company’s revenue that is subject to ASC Topic 606 would be included in non-interest income; however, not all non-interest income is subject to ASC Topic 606. The Company had no contract liabilities or unsatisfied performance obligations with customers as of December 31, 2019.
The FASB issued ASU 2018-13, “Fair Value Measurement (Topic 820): Disclosure Framework – Changes to the Disclosure Requirements for Fair Value Measurement.” This ASU amends the disclosure requirements of Topic 820, Fair Value Measurement, to remove disclosure of transfers between Level 1 and Level 2 of the fair value hierarchy and to include disclosure of the range and weighted average used in Level 3 fair value measurements, among other amendments. The ASU applies to all entities that are required to provide disclosures about recurring or non-recurring fair value measurements. Amendments should be applied retrospectively to all periods presented, except for certain amendments, which should be applied prospectively for only the most recent interim or annual period presented in the initial fiscal year of adoption. The effective date for the additional disclosures for calendar year-end public companies is January 1, 2020.
ASU 2016-13, “Financial Instruments-Credit Losses: Measurement of Credit Losses on Financial Instruments”. The amendments in ASU 2016-13 introduce a new current expected credit loss (“CECL”) model for certain financial assets, including mortgage loans and reinsurance receivables. The new model will not apply to debt securities classified as available-for-sale. For assets within the scope of the new model, an entity will recognize as an allowance against earnings its estimate of the contractual cash flows not expected to be collected on day one of the asset’s acquisition. The allowance may be reversed through earnings if a security recovers in value. This differs from the current impairment model, which requires recognition of credit losses when they have been incurred and recognizes a security’s subsequent recovery in value in other comprehensive income. ASU 2016-13 also makes targeted changes to the current impairment model for available-for-sale debt securities, which comprise the majority of the Company’s invested assets. Similar to the CECL model, credit loss impairments will be recorded in an allowance against earnings that may be reversed for subsequent recoveries in value. The amendments in ASU 2016-13, along with related amendments in ASU No. 2018-19 - Codification Improvements to Topic 326, Financial Instruments-Credit Losses, are effective for annual and interim periods beginning after December 15, 2019 on a modified retrospective basis. For smaller reporting companies, the effective date for annual and interim periods is January 1, 2023. The Company is reviewing its policies and processes to ensure compliance with the requirements in ASU 2016-13.
Reclassifications
Certain prior year amounts have been reclassed for consistency with current period presentation.
3. Fair Value
Utilizing ASC 820, the Company has established a framework for measuring fair value under U.S. GAAP using a hierarchy, which requires the Company to maximize the use of observable inputs and minimize the use of unobservable inputs. Fair value measurements are an exit price, representing the amount that would be received to sell an asset or paid to transfer a liability in an orderly transaction between market participants. Three levels of inputs are used to measure fair value, as follows:
| Level 1 – | quoted prices in active markets for identical assets or liabilities; | |
| Level 2 – | quoted prices in active markets for similar assets and liabilities and inputs that are observable for the asset or liability; or | |
| Level 3 – | unobservable inputs, such as discounted cash flow models or valuations. |
| F-11 |
A financial instrument’s level within the fair value hierarchy is based on the lowest level of input that is significant to the fair value measurement.
Fair Value Measurements of Non-Financial Instruments on a Recurring Basis
The Company has no non-financial instruments measured at fair value on a recurring basis.
Fair Value Measurements of Non-Financial Instruments on a Non-recurring Basis
Certain assets are measured at fair value on a non-recurring basis when there is evidence of impairment. The fair values of impaired loans with specific allocations of the allowance for loan losses are generally based on recent real estate appraisals of the collateral less estimated cost to sell. Declines in the fair values of other real estate owned subsequent to their initial acquisitions are also based on recent real estate appraisals less selling costs.
Impaired Loans
The appraisals used to establish the value of impaired loans are based on similar properties at similar times; however due to the differences in time and properties, the impaired loans are classified as Level 3. There were four and 23 impaired loan assets as of December 31, 2019 and December 31, 2018, respectively. Of the 23 impaired loan assets in 2018, 20 are from one customer where the owner of the company died in November 2018.
Foreclosed Assets
Foreclosed assets (upon initial recognition or subsequent impairment) are measured at fair value on a non-recurring basis.
Foreclosed assets, upon initial recognition, are measured and reported at fair value less cost to sell. Each reporting period, the Company remeasures the fair value of its significant foreclosed assets. Fair value is based upon independent market prices, appraised values of the foreclosed assets or management’s estimates of value, which the Company classifies as a Level 3 evaluation.
The following tables present the balances of non-financial instruments measured at fair value on a non-recurring basis as of December 31, 2019 and 2018:
Quoted Prices in Active Markets for |
Significant Other | Significant | ||||||||||||||||||
| December 31, 2019 | Identical | Observable | Unobservable | |||||||||||||||||
| Carrying | Estimated | Assets | Inputs | Inputs | ||||||||||||||||
| Amount | Fair Value | Level 1 | Level 2 | Level 3 | ||||||||||||||||
| Foreclosed assets | $ | 4,916 | $ | 4,916 | $ | – | $ | – | $ | 4,916 | ||||||||||
| Impaired loans, net | 1,487 | 1,487 | – | – | 1,487 | |||||||||||||||
| Total | $ | 6,403 | $ | 6,403 | $ | – | $ | – | $ | 6,403 | ||||||||||
| F-12 |
Quoted Prices in Active Markets for |
Significant Other | Significant | ||||||||||||||||||
| December 31, 2018 | Identical | Observable | Unobservable | |||||||||||||||||
| Carrying | Estimated | Assets | Inputs | Inputs | ||||||||||||||||
| Amount | Fair Value | Level 1 | Level 2 | Level 3 | ||||||||||||||||
| Foreclosed assets | $ | 5,973 | $ | 5,973 | $ | – | $ | – | $ | 5,973 | ||||||||||
| Impaired loans, net | 2,483 | 2,483 | – | – | 2,483 | |||||||||||||||
| Total | $ | 8,456 | $ | 8,456 | $ | – | $ | – | $ | 8,456 | ||||||||||
Fair Value of Financial Instruments
ASC 825 requires disclosure of fair value information about financial instruments, whether or not recognized on the face of the balance sheet, for which it is practicable to estimate that value. The following methods and assumptions were used by the Company in estimating the fair value of its financial instruments:
Cash and Cash Equivalents
The carrying amount approximates fair value because of the short maturity of these instruments.
Loans Receivable and Commitments to Extend Credit
For variable rate loans that reprice frequently with no significant change in credit risk, estimated fair values of collateral are based on carrying values at both December 31, 2019 and 2018. Because the loans are demand loan and therefore have no known time horizon, there is no significant impact from fluctuating interest rates. For unfunded commitments to extend credit, because there would be no adjustment between fair value and carrying amount for the amount if actually loaned, there is no adjustment to the amount before it is loaned. The amount for commitments to extend credit is not listed in the tables below because there is no difference between carrying value and fair value, and the amount is not recorded on the consolidated balance sheets as a liability.
Interest Receivable
Interest receivable from our customers is due approximately 15 days after it is billed; therefore, the carrying amount approximates fair value for the years ended December 31, 2019 and 2018.
Customer Interest Escrow
The customer interest escrow does not yield interest to the customer, but the fair value approximates the carrying value at both December 31, 2019 and 2018 because: 1) the customer loans are demand loans, 2) it is not possible to estimate how long the escrow will be in place, and 3) the interest rate which could be used to discount this amount is negligible.
Borrowings under Credit Facilities
The fair value of the Company’s borrowings under credit facilities is estimated based on the expected cash flows discounted using the current rates offered to the Company for debt of the same remaining maturities. As all of the borrowings under credit facilities or the Notes are either payable on demand or at similar rates to what the Company can borrow funds for today, the fair value of the borrowings is determined to approximate carrying value at both December 31, 2019 and 2018. The interest on our Notes offering is paid to our Note holders either monthly or at the end of their investment, compounded on a monthly basis. For the same reasons as the determination for the principal balances on the Notes, the fair value approximates the carrying value for the interest as well.
| F-13 |
The table below is a summary of fair value estimates for financial instruments:
| December 31, 2019 | December 31, 2018 | |||||||||||||||
| Carrying | Estimated | Carrying | Estimated | |||||||||||||
| Amount | Fair Value | Amount | Fair Value | |||||||||||||
| Financial Assets | ||||||||||||||||
| Cash and cash equivalents | $ | 1,883 | $ | 1,883 | $ | 1,401 | $ | 1,401 | ||||||||
| Loans receivable, net | 55,369 | 55,369 | 46,490 | 46,490 | ||||||||||||
| Accrued interest on loans | 1,031 | 1,031 | 568 | 568 | ||||||||||||
| Financial Liabilities | ||||||||||||||||
| Customer interest escrow | 643 | 643 | 939 | 939 | ||||||||||||
| Notes payable secured, net | 26,991 | 26,991 | 23,258 | 23,258 | ||||||||||||
| Notes payable unsecured, net | 26,520 | 26,520 | 22,635 | 22,635 | ||||||||||||
| Accrued interest payable | 2,533 | 2,533 | 2,140 | 2,140 | ||||||||||||
4. Financing Receivables
Financing receivables are comprised of the following as of December 31, 2019 and 2018:
| December 31, 2019 | December 31, 2018 | |||||||
| Loans receivable, gross | $ | 57,608 | $ | 49,127 | ||||
| Less: Deferred loan fees | (856 | ) | (1,249 | ) | ||||
| Less: Deposits | (1,352 | ) | (1,510 | ) | ||||
| Plus: Deferred origination costs | 204 | 308 | ||||||
| Less: Allowance for loan losses | (235 | ) | (186 | ) | ||||
| Loans receivable, net | $ | 55,369 | $ | 46,490 | ||||
The allowance for loan losses at December 31, 2019 is $235, of which $230 related to loans without specific reserves. At December 31, 2018, the allowance was $186, of which $172 related to loans without specific reserves. During the year ended December 31, 2019, we incurred $173 in direct charge-offs. No charge-offs occurred during the year ended December 31, 2018.
Commercial Construction and Development Loans
Construction Loan Portfolio Summary
As of December 31, 2019, we have 75 borrowers, all of whom, borrow money for the purpose of building new homes. The loans typically involve funding of the lot and a portion of construction costs, for a total of between 50% and 70% of the completed value of the new home. As the home is built during the course of the loan, the loan balance increases. The loans carry an interest rate of 3% above our cost of funds for loans originated after July 1, 2018, and 2% above our cost of funds for loans originated prior to July 1, 2018. In addition, we charge a 5% loan fee. The cost of funds was 10.97% as of December 31, 2019 and the interest rate charged to most customers was 13.97%. The loans are demand loans. Most have a deposit from the builder during construction to help offset the risk of partially built homes, and some have an interest escrow to offset payment of monthly interest risk.
| F-14 |
The following is a summary of the loan portfolio to builders for home construction loans as of December 31, 2019 and 2018:
| Year | Number of States |
Number of Borrowers |
Number of Loans |
Value of Collateral(1) | Commitment Amount | Gross Amount Outstanding |
Loan to Value Ratio(2) |
Loan Fee | ||||||||||||||||||||||||
| 2019 | 21 | 70 | 241 | $ | 93,211 | $ | 65,273 | $ | 48,611 | 70 | %(3) | 5 | % | |||||||||||||||||||
| 2018 | 18 | 75 | 259 | $ | 102,808 | $ | 68,364 | $ | 43,107 | 67 | %(3) | 5 | % | |||||||||||||||||||
| (1) | The value is determined by the appraised value. |
| (2) | The loan to value ratio is calculated by taking the commitment amount and dividing by the appraised value. |
| (3) | Represents the weighted average loan to value ratio of the loans. |
Real Estate Development Loan Portfolio Summary
The following is a summary of our loan portfolio to builders for land development as of December 31, 2019 and 2018:
| Year | Number
of States |
Number of Borrowers |
Number of |
Gross
Value of Collateral(1) |
Commitment Amount(3) | Gross Amount Outstanding |
Loan to Value Ratio(2) |
Interest Spread | ||||||||||||||||||||||||
| 2019 | 4 | 5 | 9 | $ | 13,007 | $ | 9,866 | $ | 8,997 | 69 | %(4) | 7 | % | |||||||||||||||||||
| 2018 | 3 | 4 | 9 | $ | 10,134 | $ | 7,456 | $ | 6,020 | 59 | %(4) | % | ||||||||||||||||||||
| (1) | The value is determined by the appraised value adjusted for remaining costs to be paid. A portion of this collateral is $1,470 and $1,320 as of December 31, 2019 and 2018, respectively, of preferred equity in our Company. In the event of a foreclosure on the property securing these loans, the portion of our collateral that is preferred equity might be difficult to sell, which may impact our ability to recover the loan balance. In addition, a portion of the collateral value is estimated based on the selling prices anticipated for the homes. |
| (2) | The loan to value ratio is calculated by taking the outstanding amount and dividing by the appraised value calculated as described above. |
| (3) | The commitment amount does not include letters of credit and cash bonds. |
| (4) | Represents the weighted average loan to value ratio of the loans. |
Credit Quality Information
The following table presents credit-related information at the “class” level in accordance with FASB ASC 310-10-50, Disclosures about the Credit Quality of Finance Receivables and the Allowance for Credit Losses. A class is generally a disaggregation of a portfolio segment. In determining the classes, the Company considered the finance receivable characteristics and methods it applies in monitoring and assessing credit risk and performance.
The following table summarizes finance receivables by the risk ratings that regulatory agencies utilize to classify credit exposure and which are consistent with indicators the Company monitors. Risk ratings are reviewed on a regular basis and are adjusted as necessary for updated information affecting the borrowers’ ability to fulfill their obligations.
The definitions of these ratings are as follows:
| ● | Pass – finance receivables in this category do not meet the criteria for classification in one of the categories below. | |
| ● | Special mention – a special mention asset exhibits potential weaknesses that deserve management’s close attention. If left uncorrected, these potential weaknesses may, at some future date, result in the deterioration of the repayment prospects. | |
| ● | Classified – a classified asset ranges from: 1) assets that are inadequately protected by the current sound worth and paying capacity of the borrower, and are characterized by the distinct possibility that some loss will be sustained if the deficiencies are not corrected to 2) assets with weaknesses that make collection or liquidation in full unlikely on the basis of current facts, conditions, and values. Assets in this classification can be accruing or on non-accrual depending on the evaluation of these factors. |
| F-15 |
Finance Receivables – By risk rating:
| December 31, 2019 | December 31, 2018 | |||||||
| Pass | $ | 53,542 | $ | 43,402 | ||||
| Special mention | 2,571 | 3,222 | ||||||
| Classified – accruing | – | – | ||||||
| Classified – nonaccrual | 1,495 | 2,503 | ||||||
| Total | $ | 57,608 | $ | 49,127 | ||||
Finance Receivables – Method of impairment calculation:
| December 31, 2019 | December 31, 2018 | |||||||
| Performing loans evaluated individually | $ | 26,233 | $ | 19,037 | ||||
| Performing loans evaluated collectively | 29,880 | 27,587 | ||||||
| Non-performing loans without a specific reserve | 1,467 | 2,204 | ||||||
| Non-performing loans with a specific reserve | 28 | 299 | ||||||
| Total evaluated collectively for loan losses | $ | 57,608 | $ | 49,127 | ||||
At December 31, 2019 and 2018, there were no loans acquired with deteriorated credit quality.
There were four impaired loan assets as of December 31, 2019 compared to 23 impaired loans assets as of December 31, 2018. Of the 23 impaired loans in 2018, 20 are from one customer where the owner of the company died in November of 2018.
The following is a summary of our impaired non-accrual commercial construction loans as of December 31, 2019 and 2018:
| December 31, 2019 | December 31, 2018 | |||||||
| Unpaid principal balance (contractual obligation from customer) | $ | 1,495 | $ | 2,503 | ||||
| Charge-offs and payments applied | - | - | ||||||
| Gross value before related allowance | 1,495 | 2,503 | ||||||
| Related allowance | (8 | ) | (20 | ) | ||||
| Value after allowance | $ | 1,487 | $ | 2,483 | ||||
| F-16 |
5. Foreclosed Assets
Roll forward of foreclosed assets for the years ended December 31, 2019 and 2018:
| December 31, 2019 | December 31, 2018 | |||||||
| Beginning balance | $ | 5,973 | $ | 1,036 | ||||
| Additions from loans | 3,352 | 4,737 | ||||||
| Additions for construction/development | 763 | 1,608 | ||||||
| Sale proceeds | (4,543 | ) | (809 | ) | ||||
| Loss on sale of foreclosed assets | (274 | ) | (103 | |||||
| Gain on foreclosure | 203 | 19 | ||||||
| Impairment loss on foreclosed assets | (558 | ) | (515 | ) | ||||
| Ending balance | $ | 4,916 | $ | 5,973 | ||||
During the year ended December 31, 2019, we reclassed 27 construction loan assets to foreclosed assets. Eighteen of the assets related to a borrower are from one customer where the owner of the company died in November 2018. During 2019, we recognized a $203 gain on foreclosure related to seven of the properties and a $385 loss on foreclosure related to the remaining 20 properties. We recorded additional impairment losses on foreclosed assets of $173 for the year ended December 31, 2019. In addition, we recorded a loss on the sale of foreclosed assets of $274 and $103 for the years ended December 31, 2019 and 2018, respectively. During August 2019, we sold one of our foreclosed assets for sale proceeds of $4,543.
Total investment in construction and development costs for foreclosed assets during 2019 and 2018 were $763 and $1,608, respectively. We anticipate incurring additional construction costs in 2020 through the development of foreclosed assets.
6. Borrowings
The following table displays our borrowings and a ranking of priority:
| Priority Rank |
December 31, 2019 | December 31, 2018 | ||||||||
| Borrowing Source | ||||||||||
| Purchase and sale agreements and other secured borrowings | 1 | $ | 26,806 | $ | 22,521 | |||||
| Secured line of credit from affiliates | 2 | 189 | 816 | |||||||
| Unsecured line of credit (senior) | 3 | 500 | 500 | |||||||
| Other unsecured debt (senior subordinated) | 4 | 1,407 | 1,407 | |||||||
| Unsecured Notes through our public offering, gross | 5 | 20,308 | 17,348 | |||||||
| Other unsecured debt (subordinated) | 5 | 4,131 | 3,002 | |||||||
| Other unsecured debt (junior subordinated) | 6 | 590 | 590 | |||||||
| Total | $ | 53,931 | $ | 46,184 | ||||||
The following table shows the maturity of outstanding debt as of December 31, 2019:
| Year Maturing | Total Amount Maturing | Public Offering | Other Unsecured | Secured Borrowings |
||||||||||||
| 2020 | $ | 34,736 | $ | 4,566 | $ | 3,793 | $ | 26,377 | ||||||||
| 2021 | 13,842 | 12,906 | 920 | 16 | ||||||||||||
| 2022 | 3,905 | 2,143 | 1,746 | 16 | ||||||||||||
| 2023 | 878 | 693 | 169 | 16 | ||||||||||||
| 2024 and thereafter | 570 | - | - | 570 | ||||||||||||
| Total | $ | 53,931 | $ | 20,308 | $ | 6,628 | $ | 26,995 | ||||||||
| F-17 |
Secured Borrowings
Loan Purchase and Sale Agreements
We have two loan purchase and sale agreements where we are the seller of portions of loans we create. The two purchasers are Builder Finance, Inc. (“Builder Finance”) and S.K. Funding, LLC (“S.K. Funding”). Generally, the purchasers buy between 50% and 75% of each loan sold. They receive interest rates ranging from our cost of funds to the interest rate charged to the borrower (interest rates were between 9% and 13% for both 2019 and 2018). The purchasers generally do not receive any of the loan fees we charge. We have the right to call some of the loans sold, with some restrictions. Once sold, the purchaser must fund their portion of the loans purchased. We service the loans. Also, there are limited put options in some cases, whereby the purchaser can cause us to repurchase a loan. The loan purchase and sale agreements are recorded as secured borrowings.
In January 2019, we entered into the Tenth Amendment (the “Tenth Amendment”) to our Loan Purchase and Sale Agreement with S.K. Funding. The purpose of the Tenth Amendment was to allow S.K. Funding to purchase a portion of the Pennsylvania Loans.
The timing of the Company’s principal and interest payments to S.K. Funding under the Tenth Amendment, and S.K. Funding’s obligation to fund the Pennsylvania Loans, vary depending on the total principal amount of the Pennsylvania Loans outstanding at any time, as follows:
| ● | If the total principal amount exceeds $1,500, S.K. Funding must fund the amount between $1,500 and less than or equal to $4,500. | |
| ● | If the total principal amount is less than $4,500, then the Company will also repay S.K. Funding’s principal as principal payments are received on the Pennsylvania Loans from the underlying borrowers in the amount by which the total principal amount is less than $4,500 until S.K. Funding’s principal has been repaid in full. | |
| ● | The interest rate accruing to S.K. Funding under the Tenth Amendment is 10.0% calculated on a 365/366-day basis. |
The Tenth Amendment has a term of 24 months and will automatically renew for an additional six-month term unless either party gives written notice of its intent not to renew at least nine months prior to the end of a term. S.K. Funding will have a priority position as compared to the Company in the case of a default by any of the borrowers.
Lines of Credit
Lines of Credit with Mr. Wallach and His Affiliates
During June 2018, we entered into the First Amendment to the line of credit with our Chief Executive Officer and his wife (the “Wallach LOC”) which modified the interest rate on the Wallach LOC to generally equal the prime rate plus 3%. The interest rate for the Wallach LOC was 7.75% and 8.5% as of December 31, 2019 and 2018, respectively. As of December 31, 2019, we borrowed $44 against the Wallach LOC and $1,206 remained available. Interest expense was $8 and $23 for the year ended December 31, 2019 and December 31, 2018, respectively. There were no borrowings on the Wallach LOC as of December 31, 2018. The maximum outstanding on the Wallach LOC is $1,250 and the loan is a demand loan.
During June 2018, we also entered into the First Amendment to the line of credit with the 2007 Daniel M. Wallach Legacy Trust, which is our CEO’s trust (the “Wallach Trust LOC”) which modified the interest rate on the Wallach Trust LOC to generally equal the prime rate plus 3%. The interest rate for this borrowing was 7.75% and 8.5% as of December 31, 2019 and 2018, respectively. There were no amounts borrowed against the Wallach Trust LOC as of December 31, 2019 and 2018. The maximum outstanding on the Wallach Trust LOC is $250 and the loan is a demand loan.
| F-18 |
Line of Credit with William Myrick
During June 2018, we entered into a line of credit agreement (the “Myrick LOC Agreement”) with our Executive Vice President (“EVP”) of Sales, William Myrick. Pursuant to the Myrick LOC Agreement, Mr. Myrick provides us with a line of credit (the “Myrick LOC”) with the following terms:
| ● | Principal not to exceed $1,000; | |
| ● | Secured by a lien against all of our assets; | |
| ● | Cost of funds to us of prime rate plus 3%; and | |
| ● | Due upon demand. |
As of December 31, 2019, we borrowed $145 against the Myrick LOC and $854 remained available. For the years ended December 31, 2019 and 2018 interest expense was $30 and $19, respectively.
Line of Credit with Shuman
During July 2017, we entered into a line of credit agreement (the “Shuman LOC Agreement”) with Steven K. Shuman, which is now held by Cindy K. Shuman as widow and devisee of Mr. Shuman (“Shuman”). Pursuant to the Shuman LOC Agreement, Shuman provides us with a revolving line of credit (the “Shuman LOC”) with the following terms:
| ● | Principal not to exceed $1,325; | |
| ● | Secured with assignments of certain notes and mortgages; | |
| ● | Cost of funds to us of 10%; and | |
| ● | Due in July 2020, but will automatically renew for additional 12-month periods, unless either party gives notice to not renew. |
The Shuman LOC was fully borrowed as of December 31, 2019. Interest expense was $134 for each of the years ended December 31, 2019 and 2018, respectively.
Line of Credit with Paul Swanson
During December 2018, we entered into a Master Loan Modification Agreement (the “Swanson Modification Agreement”) with Paul Swanson which modified the line of credit agreement between us and Mr. Swanson dated October 23, 2017. Pursuant to the Swanson Modification Agreement, Mr. Swanson provides us with a revolving line of credit (the “Swanson LOC”) with the following terms:
| ● | Principal not to exceed $7,000; | |
| ● | Secured with assignments of certain notes and mortgages; | |
| ● | Cost of funds to us of 9%; and | |
| ● | Automatic renewal in March 2020 and extended for 15 months. |
The Swanson LOC was fully borrowed as of December 31, 2019. Interest expense was $705 and $624 for the years ended December 31, 2019 and 2018, respectively.
New Lines of Credit
During the 2019, we entered into four line of credit agreements (the “New LOC Agreements”). Pursuant to the New LOC Agreements, the lenders provide us with revolving lines of credit with the following terms:
| ● | Principal not to exceed $5,000; | |
| ● | Secured with assignments of certain notes and mortgages; and | |
| ● | Terms generally allow the lenders to give one month notice after which the principal balance of a New LOC Agreement will reduce to a zero over the next six months. |
As of December 31, 2019, we borrowed $2,878 against the New LOC Agreements and $2,122 remained available. Interest expense was $168 for the year ended December 31, 2019.
| F-19 |
London Financial
During September 2018, we entered into a Master Loan Agreement (“London Loan”) with London Financial Company, LLC (“London Financial”).
During August 2019, we sold our largest foreclosed asset with sales proceeds of $4,543 and a portion of the proceeds were used to pay off the London Loan. For the years ended December 31, 2019 and 2018, interest expense was $219 and $89, respectively.
Mortgage Payable
During January 2018, we entered into a commercial mortgage on our office building with the following terms:
| ● | Principal not to exceed $660; | |
| ● | Interest rate at 5.07% per annum based on a year of 360 days; and | |
| ● | Due in January 2033. |
The principal amount of the Company’s commercial mortgage was $634 as of December 31, 2019. For the years ended December 31, 2019 and 2018, interest expense was $33 and $41, respectively.
Secured Borrowings Secured by Loan Assets
Borrowings secured by loan assets are summarized below:
| Book Value of Loans which Served as Collateral | Due from Shepherd’s Finance to Loan Purchaser or Lender | Book Value of Loans which Served as Collateral |
Due from Shepherd’s Finance to Loan Purchaser or Lender | |||||||||||||
| Loan Purchaser | ||||||||||||||||
| Builder Finance | $ | 13,711 | 9,375 | $ | 8,742 | $ | 5,294 | |||||||||
| S.K. Funding | 10,394 | 6,771 | 11,788 | 6,408 | ||||||||||||
| Lender | ||||||||||||||||
| Shuman | 1,785 | 1,325 | 2,051 | 1,325 | ||||||||||||
| Jeff Eppinger | 1,821 | 1,000 | - | - | ||||||||||||
| Hardy Enterprises, Inc. | 1,684 | 1,000 | - | - | ||||||||||||
| Gary Zentner | 472 | 250 | - | - | ||||||||||||
| R. Scott Summers | 841 | 628 | - | - | ||||||||||||
| Paul Swanson | 8,377 | 5,824 | 8,079 | 5,986 | ||||||||||||
| Total | $ | 39,085 | 26,173 | $ | 30,660 | $ | 19,013 | |||||||||
| F-20 |
Unsecured Borrowings
Unsecured Notes through the Public Offering (“Notes Program”)
The effective interest rate on borrowings through our Notes Program at December 31, 2019 and 2018 was 10.56% and 10.41%, respectively, not including the amortization of deferred financing costs. There are limited rights of early redemption. We generally offer four durations at any given time, ranging from 12 to 48 months. The following table shows the roll forward of our Notes Program:
| December 31, 2019 | December 31, 2018 | |||||||
| Gross notes outstanding, beginning of period | $ | 17,348 | $ | 14,121 | ||||
| Notes issued | 11,127 | 9,645 | ||||||
| Note repayments / redemptions | (8,167 | ) | (6,418 | ) | ||||
| Gross Notes outstanding, end of period | 20,308 | 17,348 | ||||||
| Less deferred financing costs, net | 416 | 212 | ||||||
| Notes outstanding, net | $ | 19,892 | $ | 17,136 | ||||
The following is a roll forward of deferred financing costs:
| December 31, 2019 | December 31, 2018 | |||||||
| Deferred financing costs, beginning balance | $ | 1,212 | $ | 1,102 | ||||
| Additions | 365 | 117 | ||||||
| Disposals | (791 | ) | (7 | ) | ||||
| Deferred financing costs, ending balance | $ | 786 | $ | 1,212 | ||||
| Less accumulated amortization | (370 | ) | (1,000 | ) | ||||
| Deferred financing costs, net | $ | 416 | $ | 212 | ||||
The following is a roll forward of the accumulated amortization of deferred financing costs:
| December 31, 2019 | December 31, 2018 | |||||||
| Accumulated amortization, beginning balance | $ | 1,000 | $ | 816 | ||||
| Additions | 161 | 184 | ||||||
| Disposals | (791 | ) | - | |||||
| Accumulated amortization, ending balance | $ | 370 | $ | 1,000 | ||||
| F-21 |
Other Unsecured Debts
Our other unsecured debts are detailed below:
| Principal Amount Outstanding as of | ||||||||||||||
| Loan | Maturity Date | Interest Rate(1) | December 31, 2019 | December 31, 2018 | ||||||||||
| Unsecured Note with Seven Kings Holdings, Inc. | Demand(2) | 9.5 | % | $ | 500 | $ | 500 | |||||||
| Unsecured Line of Credit from Builder Finance, Inc. | January 2020 | 10.0 | % | - | 500 | |||||||||
| Unsecured Line of Credit from Paul Swanson | June 2020(6) | 10.0 | % | 1,176 | 1,014 | |||||||||
| Subordinated Promissory Note | September 2020 | 9.5 | % | 563 | 1,125 | |||||||||
| Subordinated Promissory Note | December 2021 | 10.5 | % | 146 | 113 | |||||||||
| Subordinated Promissory Note | April 2020 | 10.0 | % | 100 | 100 | |||||||||
| Subordinated Promissory Note | April 2021 | 10.0 | % | 174 | 150 | |||||||||
| Subordinated Promissory Note | August 2022 | 11.0 | % | 200 | - | |||||||||
| Subordinated Promissory Note | September 2023 | 11.0 | % | 169 | - | |||||||||
| Subordinated Promissory Note | April 2020 | 6.5 | % | 500 | - | |||||||||
| Subordinated Promissory Note | February 2021 | 11.0 | % | 600 | - | |||||||||
| Subordinated Promissory Note | Demand | 5.0 | % | 500 | - | |||||||||
| Subordinated Promissory Note | Demand | 5.0 | % | 3 | - | |||||||||
| Senior Subordinated Promissory Note | March 2022(3) | 10.0 | % | 400 | 400 | |||||||||
| Senior Subordinated Promissory Note | March 2022(4) | 1.0 | % | 728 | 728 | |||||||||
| Junior Subordinated Promissory Note | March 2022(4) | 22.5 | % | 417 | 417 | |||||||||
| Senior Subordinated Promissory Note | October 2020(5) | 1.0 | % | 279 | 279 | |||||||||
| Junior Subordinated Promissory Note | October 2020(5) | 20.0 | % | 173 | 173 | |||||||||
| $ | 6,628 | $ | 5,499 | |||||||||||
| (1) | Interest rate per annum, based upon actual days outstanding and a 365/366-day year. |
| (2) | Due six months after lender gives notice. |
| (3) | Lender may require us to repay $20 of principal and all unpaid interest with 10 days’ notice. |
| (4) | These notes were issued to the same holder and, when calculated together, yield a blended return of 11% per annum. |
| (5) | These notes were issued to the same holder and, when calculated together, yield a blended return of 10% per annum. |
| (6) | Amount due in June 2020 is $1,000 with the remainder due November 2020. |
7. Redeemable Preferred Equity
Series C cumulative preferred units (“Series C Preferred Units”) are redeemable by the Company at any time, upon a change of control or liquidation, or by the investor any time after 6 years from the initial date of purchase. The Series C Preferred Units have a fixed value which is their purchase price and preferred liquidation and distribution rights. Yearly distributions of 12% of the Series C Preferred Units’ value (provided profits are available) will be made on a quarterly basis. This rate may increase if any interest rate on our public Notes offering rises above 12%. Dividends may be reinvested monthly into additional Series C Preferred Units. The Series C Preferred Units have the same preferential rights as the Series B Preferred Units as more fully described in the following note.
Roll forward of redeemable preferred equity:
| December 31, 2019 | December 31, 2018 | |||||||
| Beginning balance | $ | 2,385 | $ | 1,097 | ||||
| Additions from new investment | 300 | 2,300 | ||||||
| Redemptions | - | (1,177 | ) | |||||
| Distributions | (42 | ) | - | |||||
| Additions from reinvestment | 316 | 165 | ||||||
| Ending balance | $ | 2,959 | $ | 2,385 | ||||
On July 31, 2018, we redeemed all of our outstanding Series C Preferred Units, which were held by two investors. On August 1, 2018, we sold 12 of our Preferred Units to Daniel M. Wallach, our CEO and chairman of our board of managers, and his wife, Joyce S. Wallach, for the total price of $1,200.
| F-22 |
The following table shows the earliest redemption options for investors in Series C Preferred Units as of December 31, 2019:
| Year Maturing | Total
Amount Redeemable |
|||
| 2024 | 2,745 | |||
| 2025 | $ | 214 | ||
| Total | $ | 2,959 | ||
8. Members’ Capital
There are currently two classes of equity units outstanding that the Company classifies as Members’ Capital: Class A common units (“Class A Common Units”) and Series B cumulative preferred units (“Series B Preferred Units”).
As of December 31, 2019, the Class A Common Units are held by eight members, all of whom have no personal liability. All Class A common members have voting rights in proportion to their capital account. There were 2,629 Class A Common Units outstanding at both December 31, 2019 and 2018.
The Series B Preferred Units were issued to the Hoskins Group through a reduction in a loan issued by the Hoskins Group to the Company. In December 2015, the Hoskins Group agreed to purchase 0.1 Series B Preferred Units for $10 at each closing of a lot to a third party in the Hamlets and Tuscany subdivision. As of December 31, 2019 and 2018, the Hoskins Group owns a total of 14.7 and 13.2 Series B Preferred Units, respectively, which were issued for a total of $1,470 and $1,320, respectively.
Both the Series B Preferred Units and the Series C Preferred Units have the same basic preferential status as compared to the Class A Common Units, and are pari passu with each other. Both Preferred Unit types include a liquidation preference and a dividend preference, as well as a 12-month recovery period for a shortfall in earnings.
There are two additional authorized unit classes: Class A preferred units and Class B profit units. Once Class B profit units are issued, the existing Class A common units will become Class A preferred units. Class A Preferred units will receive preferred treatment in terms of distributions and liquidation proceeds.
9. Related Party Transactions
The Company has two loan agreements with Daniel M. Wallach, our CEO, and his wife, pursuant to which they provide the Company with the Wallach LOC and the Wallach Trust LOC. The agreements lay out the terms under which those members can lend money to us, providing that we desire the funds and the members wish to lend. The interest rate on both the Wallach LOC and the Wallach Trust LOC generally equals prime plus 3%, as more fully described in Note 6.
The Company has a loan agreement with William Myrick, our EVP of Sales (the “Myrick LOC Agreement”), pursuant to which Mr. Myrick provides us with the Myrick LOC. The Myrick LOC Agreement lays out the terms under which Mr. Myrick can lend money to us, providing that we desire the funds and Mr. Myrick wish to lend. The rate on the Myrick LOC generally equals prime plus 3%, as more fully described in Note 6.
Two of our managers each own 1% of our Class A common units. Barbara L. Harshman, our EVP of Operations, owns 2% of our Class A common units. Mr. Myrick owns 15.3% of our Class A common units.
| F-23 |
Mr. Wallach and his wife’s parents own 14.21 and 1.14 of our Series C Preferred Units, respectively. One of our independent managers, Gregory L. Sheldon, owns 3.37 of our Series C Preferred Units.
The Company has a Senior Subordinated Promissory Note with the parents of Mr. Wallach for $400. The interest rate on the promissory note is 10% and the lender may require us to repay $40 of principal and all unpaid interest with 10 days’ notice, as more fully described in Note 6.
One of our independent managers, Kenneth R. Summers, and his son are minor participants in the Shuman LOC, which is more fully described in Note 6. In addition, Mr. Summers’ son is a lender to the Company pursuant to a New LOC Agreement, with principal not to exceed $2,000.
In September 2018, the Company sold three loans to Mr. Wallach at their gross loans receivable balance of $281, and as such, no gain or loss was recognized on the sale. Cash received was $104 and the remaining purchase price was funded through a $177 reduction in the principal balance of the line of credit extended by Mr. Wallach to the Company. The Company continues to service these loans. In November 2018, one of the loans paid off for $174. As of December 31, 2018, we had $11 in builder deposits related to these loans, and the principal balance being serviced was $222.
In June 2019, two of the loans owned by Mr. Wallach paid off for approximately $375. Additionally, during June 2019, Mr. Wallach purchased two additional loans for approximately $286. During December 2019, Mr. Wallach sold one of his loans to Mr. Myrick for approximately $254.
In September 2018, we sold two loans to Mr. Myrick at their gross loans receivable balance of $394 and as such, no gain or loss was recognized on the sale. Cash received was $94 and the remaining purchase price was funded through a $300 reduction in the principal balance of the line of credit extended by Mr. Myrick to the Company. As of December 31, 2018, we had $6 in builder deposits related to these loans, and the principal balance being serviced was $469.
During 2019, three of Mr. Myrick’s loans paid off for approximately $765. In addition, during 2019 Mr. Myrick purchased two loans for approximately $456. In December 2019, Mr. Myrick purchased one loan from Mr. Wallach for approximately $254.
Under all arrangements stated above with Mr. Wallach and Mr. Myrick, the Company will continue to service the loans.
The Company has loan agreements with the Hoskins Group, as more fully described in Note 4 – Commercial Loans – Real Estate Development Loan Portfolio Summary.
The Hoskins Group has a preferred equity interest in the Company, as more fully described in Note 8.
| F-24 |
The Company has accepted investments under the Notes Program from employees, managers, members, and relatives of managers and members, with $3,849 outstanding at December 31, 2019. For the years ended December 31, 2019 and 2018 our investments from affiliates which exceed $120 through our Notes Program and other unsecured debt are detailed below:
| Relationship to | Amount invested as of | Weighted average interest rate as of |
Interest earned during the year ended |
|||||||||||||||||||
| Shepherd’s | December 31, | December 31, | December 31, | December 31, | ||||||||||||||||||
| Investor | Finance | 2019 | 2018 | 2019 | 2019 | 2018 | ||||||||||||||||
| Eric A. Rauscher | Independent Manager | $ | 475 | $ | 475 | 10.00 | % | $ | 47 | $ | 49 | |||||||||||
| Wallach Family Irrevocable Educational Trust | Trustee is Member | 294 | 200 | 9.50 | % | 27 | 19 | |||||||||||||||
| David Wallach | Father of Member | 635 | 635 | 10.36 | % | 66 | 43 | |||||||||||||||
| Gregory L. Sheldon | Independent Manager | 1,000 | 850 | 10.50 | % | 105 | 70 | |||||||||||||||
| R. Scott Summers | Son of Independent Manager | 500 | 475 | 5.0 | % | 3 | 25 | |||||||||||||||
| Joseph Rauscher | Parent of Independent Manager | 195 | 195 | 11.0 | % | 21 | 13 | |||||||||||||||
| Kenneth Summers | Independent Manager | 189 | 79 | 10.73 | % | 20 | 3 | |||||||||||||||
| Lydle Mandrona | Mother-in-Law of Independent Manager | - | 150 | 10.50 | % | - | 10 | |||||||||||||||
| Kimberly Bedford | Employee | 143 | 143 | 11.0 | % | 16 | 8 | |||||||||||||||
| Lamar Sheldon | Parent of Independent Manager | 203 | 100 | 10.67 | % | 17 | 2 | |||||||||||||||
10. Commitments and Contingencies
In the normal course of business there may be outstanding commitments to extend credit that are not included in the consolidated financial statements. Commitments to extend credit are agreements to lend to a customer as long as there is no violation of any condition established in the contract. Commitments generally have fixed expiration dates or other termination clauses and may require payment of a fee. Since many of the commitments are expected to expire without being drawn upon and some of the funding may come from the earlier repayment of the same loan (in the case of revolving lines), the total commitment amounts do not necessarily represent future cash requirements. The financial instruments involve, to varying degrees, elements of credit and interest rate risk in excess of amounts recognized in the consolidated financial statements. The Company evaluates each customer’s creditworthiness on a case-by-case basis. Unfunded commitments to extend credit, which have similar collateral, credit risk and market risk to our outstanding loans, were $16,662 and $25,258 at December 31, 2019 and 2018, respectively.
11. Selected Quarterly Condensed Consolidated Financial Data (Unaudited)
Summarized unaudited quarterly condensed consolidated financial data for the quarters of 2019 and 2018 are as follows:
| Quarter 4 |
Quarter 3 |
Quarter 2 |
Quarter 1 |
Quarter 4 |
Quarter 3 |
Quarter 2 |
Quarter 1 |
|||||||||||||||||||||||||
| 2019 | 2019 | 2019 | 2019 | 2018 | 2018 | 2018 | 2018 | |||||||||||||||||||||||||
| Net interest income after loan loss provision | $ | 1,117 | $ | 1,115 | $ | 818 | $ | 1,079 | $ | 914 | $ | 783 | $ | 876 | $ | 806 | ||||||||||||||||
| Non-interest income | 22 | 86 | 95 | - | (1 | ) | 20 | – | – | |||||||||||||||||||||||
| SG&A expense | 447 | 703 | 620 | 624 | 403 | 559 | 571 | 497 | ||||||||||||||||||||||||
| Depreciation and amortization | 26 | 21 | 22 | 23 | 21 | 23 | 21 | 17 | ||||||||||||||||||||||||
| Loss on sale of foreclosed assets | – | 274 | – | – | 100 | 3 | – | – | ||||||||||||||||||||||||
| Impairment loss on foreclosed assets | 282 | – | 196 | 80 | 379 | 51 | 80 | 5 | ||||||||||||||||||||||||
| Net income | $ | 384 | $ | 203 | $ | 75 | $ | 352 | $ | 10 | $ | 167 | $ | 204 | $ | 287 | ||||||||||||||||
| F-25 |
12. Non-Interest Expense Detail
The following table displays our selling, general and administrative expenses for the years ended December 31, 2019 and 2018:
| 2019 | 2018 | |||||||
| Selling, general and administrative expenses | ||||||||
| Legal and accounting | $ | 240 | $ | 340 | ||||
| Salaries and related expenses | 1,387 | 1,090 | ||||||
| Board related expenses | 91 | 70 | ||||||
| Advertising | 128 | 87 | ||||||
| Rent and utilities | 57 | 37 | ||||||
| Loan and foreclosed asset expenses | 211 | 150 | ||||||
| Travel | 138 | 102 | ||||||
| Other | 142 | 154 | ||||||
| Total SG&A | $ | 2,394 | $ | 2,030 | ||||
13. Subsequent Events
Management of the Company has evaluated subsequent events through March 12, 2020, the date these consolidated financial statements were issued.
On February 4, 2020, the Company entered into Amendment No. 1 (the “Amendment”) to the Indenture (the “Indenture”) with U.S. Bank National Association (“U.S. Bank”), as trustee. Pursuant to the Amendment, the Company added additional redemption options in the Indenture for holders of a fixed rate subordinated note (a “Note”) with a 36-month duration that is purchased on or after February 4, 2020. The Company also made other minor revisions to the Indenture.
Unless the subordination provisions in the Indenture restrict the Company’s ability to make the redemption, for Notes with a 36-month maturity only purchased on or February 4, 2020, the holder of such a Note may require the Company to redeem all or a portion of such Note for a redemption price equal to the principal amount plus an amount equal to the unpaid interest thereon for such Note at the stated rate to the redemption date, as follows:
| (1) | Upon seven days’ advance notice to the Company, the holder may require redemption of up to $10 of such Note; |
| (2) | Upon 30 days’ advance notice to the Company, the holder may require redemption of up to an additional $90 of such Note; |
| (3) | Upon 90 days’ advance notice to the Company, the holder may require redemption of any remaining amount of such Note requested to be redeemed; and |
| (4) | Upon one business day’s advance notice to the Company, the holder may require redemption of all or a portion of the Note, regardless of amount, but only if the holder immediately upon redemption invests the entirety of the proceeds from such redemption in another security then-offered by the Company, including in a Note issued in the current public offering of Notes. |
For purposes of determining the length of time within which the Company must redeem all or a portion of a Note as described above, the dollar amount of a given redemption request will be added to any amount or amounts of such Note previously requested to be redeemed that were redeemed by the Company.
These redemption options are in addition to the redemption options described in the Indenture.
| F-26 |