Attached files
| file | filename |
|---|---|
| EX-99.1 - EX-99.1 - CENTURY CASINOS INC /CO/ | cnty-20200312xex99_1.htm |
| 8-K - 8-K - CENTURY CASINOS INC /CO/ | cnty-20200312x8k.htm |
Exhibit 99.2
CENTURY CASINOS Financial Results 2019 Century Casinos 1
Forward-Looking Statements, Business Environment and Risk Factors. This presentation may contain “forward-looking statements” within the meaning of Section 27A of the Securities Act of 1933, as amended, Section 21E of the Securities Exchange Act of 1934, as amended (the “Exchange Act”), and the Private Securities Litigation Reform Act of 1995. In addition, Century Casinos, Inc. (together with its subsidiaries, the “Company”) may make other written and oral communications from time to time that contain such statements. Forward-looking statements include statements as to industry trends and future expectations of the Company and other matters that do not relate strictly to historical facts and are based on certain assumptions by management at the time such statements are made. Forward-looking statements in this presentation include statements regarding future results of operations including the impact of the Acquisition (as defined herein) on the Company’s results, the impact of the current coronavirus (COVID-19) pandemic, operating efficiencies, synergies and operational performance, the integration of the Acquired Casinos (as defined herein) into the Company’s business, the prospects for and timing and costs of new projects, projects in development and other opportunities, the Macquarie Credit Agreement (as defined herein), debt repayment, investments in joint ventures, outcomes of legal proceedings, changes in our tax provisions or exposure to additional income tax liabilities, and plans for our casinos and our Company. These statements are often identified by the use of words such as “may,” “will,” “expect,” “believe,” “anticipate,” “intend,” “could,” “estimate,” or “continue,” and similar expressions or variations. These statements are based on the beliefs and assumptions of the management of the Company based on information currently available to management. Such forward-looking statements are subject to risks, uncertainties and other factors that could cause actual results to differ materially from future results expressed or implied by such forward-looking statements. Important factors that could cause actual results to differ materially from the forward-looking statements include, among others, the risks described in the section entitled “Risk Factors” under Item 1A in our Annual Report on Form 10-K for the year ended December 31, 2019 (the “2019 Annual Report”) and our subsequent periodic and current reports filed with the SEC. We caution the reader to carefully consider such factors. Furthermore, such forward-looking statements speak only as of the date on which such statements are made. We undertake no obligation to update any forward-looking statements to reflect events or circumstances after the date of such statements.
Century Casinos 2
Notes on Presentation In this presentation the term “USD” refers to US dollars, the term “CAD” refers to Canadian dollars, the term “PLN” refers to Polish zloty and the term “GBP” refers to the British pound. Adjusted EBITDA and Adjusted EBITDA margin are non-GAAP financial measures. See Appendix A for the definition and reconciliation of Adjusted EBITDA and Adjusted EBITDA margin. Amounts presented are rounded. As such, rounding differences could occur in period-over-period changes and percentages reported throughout this presentation. The names of the Company’s subsidiaries and certain reporting units are abbreviated on certain of the following slides. See Appendix A for a list of the subsidiaries and their abbreviations. Century Casinos 3
2019 Highlights On December 6, 2019, the Company completed its acquisition (the “Acquisition”) of the operations of Isle Casino Cape Girardeau, located in Cape Girardeau, Missouri, Lady Luck Caruthersville, located in Caruthersville, Missouri, and Mountaineer Casino, Racetrack and Resort located in New Cumberland, West Virginia (collectively, the “Acquired Casinos”), from Eldorado Resorts, Inc. for an aggregate purchase price of approximately $107.0 million (subject to an adjustment based on the Acquired Casinos’ working capital and cash at closing). Immediately prior to the Acquisition, the real estate assets underlying the Acquired Casinos were sold to an affiliate of VICI Properties Inc. (“VICI PropCo”). On the closing date, the Company and VICI PropCo entered into a triple net lease agreement (the “Master Lease”) for the three Acquired Casino properties. The Master Lease has an initial annual rent of approximately $25.0 million and an initial term of 15 years, with four five-year renewal options. The Company financed the Acquisition with $170.0 million borrowed under a credit agreement with a group of lenders led by Macquarie Capital (“Macquarie Credit Agreement”), which also replaced the Company’s credit agreement with the Bank of Montreal. Century Casinos 4
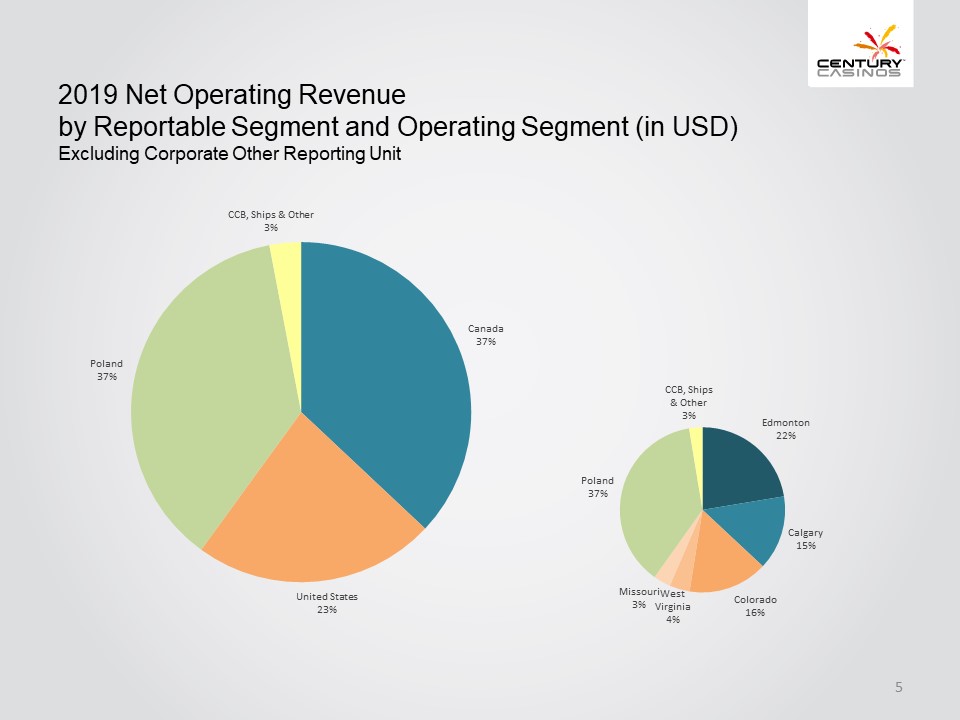
2019 Net Operating Revenue by Reportable Segment and Operating Segment (in USD) Excluding Corporate Other Reporting Unit CCB, Ships & Other 3% Canada 37% United States 23% Poland 37% CCB, Ships & Other 3% Edmonton 22% Calgary 15% Colorado 16% West Virginia 4% Missouri 3% Poland 37% Century Casinos 5
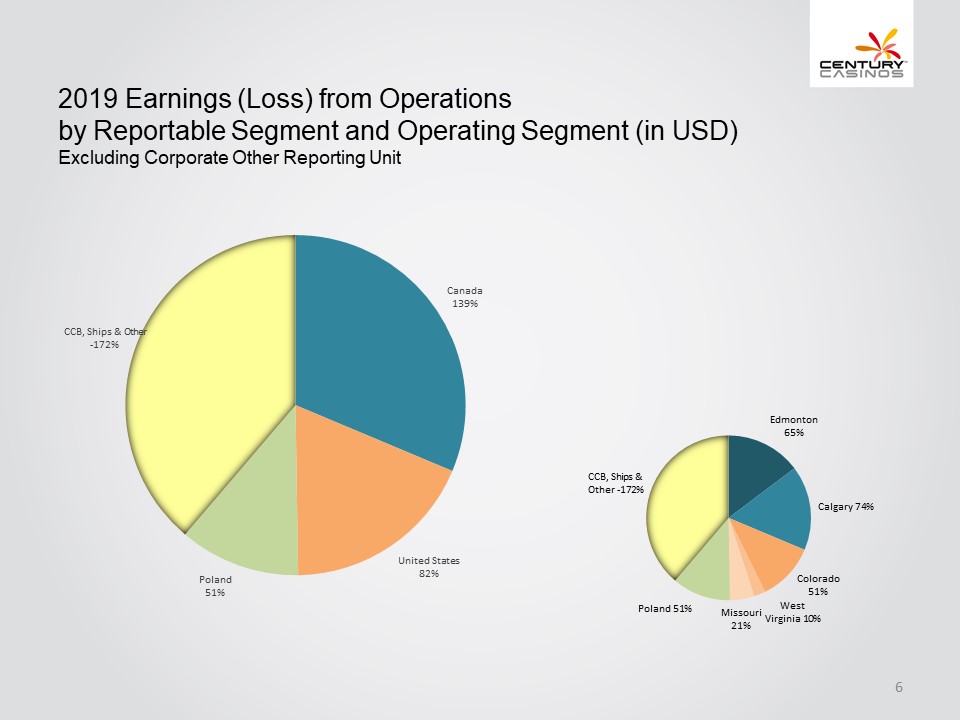
2019 Earnings (Loss) from Operations by Reportable Segment and Operating Segment (in USD) Excluding Corporate Other Reporting Unit CCB, Ships & Other -172% Canada 139% United States 82% Poland 51% CCB, Ships & Other -172% Edmonton 65% Calgary 74% Colorado 51% West Virginia 10% Missouri 21% Poland 51% Century Casinos 6
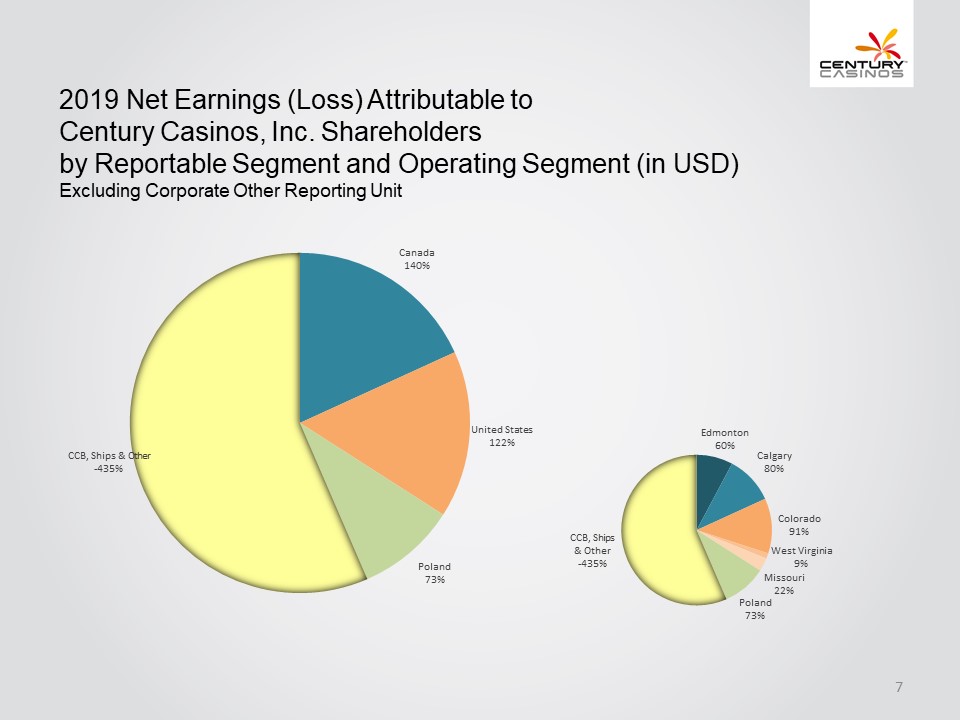
2019 Net Earnings (Loss) Attributable to Century Casinos, Inc. Shareholders by Reportable Segment and Operating Segment (in USD) Excluding Corporate Other Reporting Unit CCB, Ships & Other -435% Poland 73% United States 122% Canada 140% CCB, Ships & Other -435% Edmonton 60% Calgary 80% Colorado 91% West Virginia 9% Missouri 22% Poland 73% Century Casinos 7
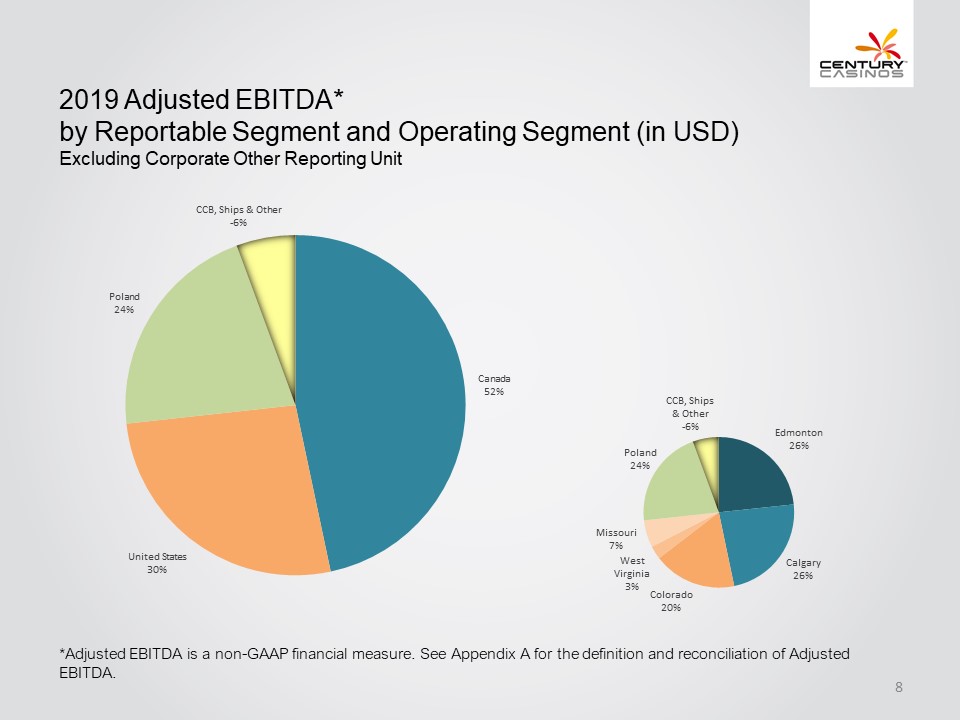
2019 Adjusted EBITDA* by Reportable Segment and Operating Segment (in USD) Excluding Corporate Other Reporting Unit CCB, Ships & Other -6% Canada 52% United States 30% Poland 24% CCB, Ships & Other -6% Edmonton 26% Calgary 26% Colorado 20% West Virginia 3% Missouri 7% Poland 24% *Adjusted EBITDA is a non-GAAP financial measure. See Appendix A for the definition and reconciliation of Adjusted EBITDA. Century Casinos 8
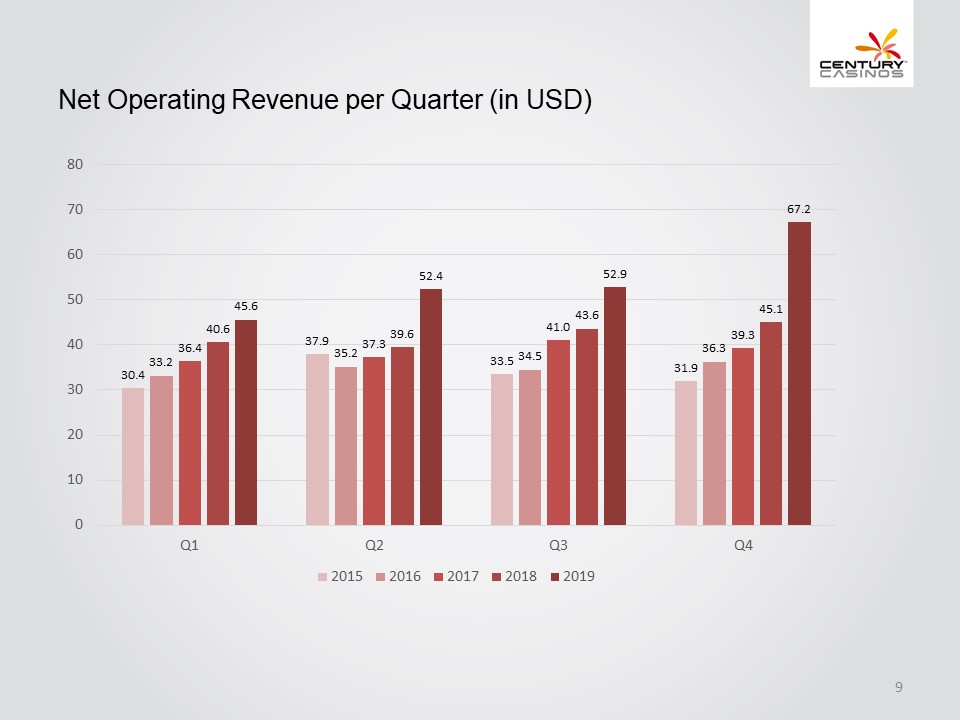
Net Operating Revenue per Quarter (in USD) 0 10 20 30 40 50 60 70 80 Q1 30.4 33.2 36.4 40.6 45.6 Q2 37.9 35.2 37.3 39.6 52.4 Q3 33.5 34.5 41.0 43.6 52.9 Q4 31.9 36.3 39.3 45.1 67.2 2015 2016 2017 2018 2019 Century Casinos 9
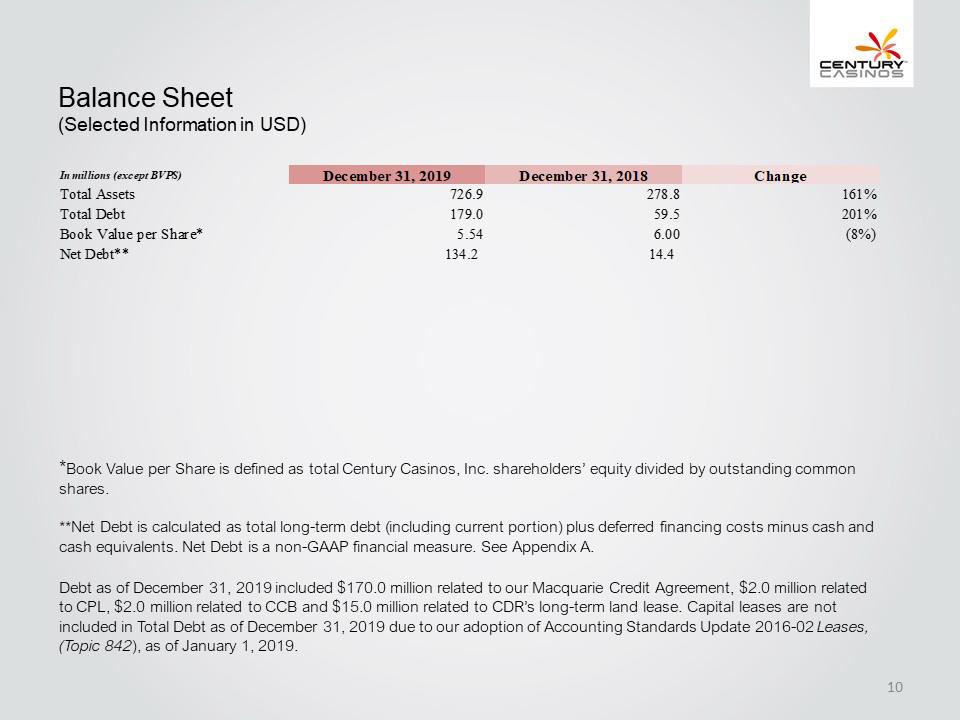
Balance Sheet (Selected Information in USD) In million (except BVPS) Total Assets Total Debt Book Value per Share* Net Debt** December 31.2018 726.9 179.0 5.54 134.2 278.8 59.5 6.00 14.4 Change 161% 201% (8%) *Book Value per Share is defined as total Century Casinos, Inc. shareholders’ equity divided by outstanding common shares. **Net Debt is calculated as total long-term debt (including current portion) plus deferred financing costs minus cash and cash equivalents. Net Debt is a non-GAAP financial measure. See Appendix A. Debt as of December 31, 2019 included $170.0 million related to our Macquarie Credit Agreement, $2.0 million related to CPL, $2.0 million related to CCB and $15.0 million related to CDR’s long-term land lease. Capital leases are not included in Total Debt as of December 31, 2019 due to our adoption of Accounting Standards Update 2016-02 Leases, (Topic 842), as of January 1, 2019. Century Casinos 10
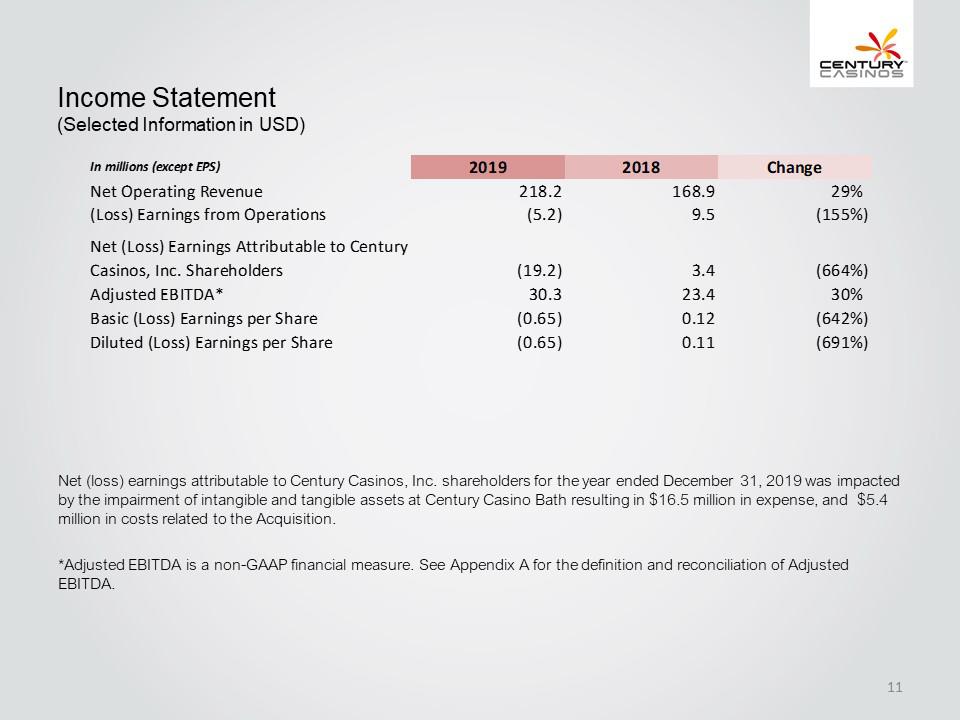
Income Statement (Selected Information in USD) In mlllons (except EPS) Net Operating Revenue (Loss) Earnings from Operations Net (Loss) Earnings Attributable to Century Casinos, Inc. Shareholders Adjusted EBITDA* Basic (Loss) Earnings per Share Diluted (Loss) Earnings per Share 2019 2018 Change 218.2 168.9 29% (5.2) 9.5 (155%) (19.2) 3.4 (664%) 30.3 23.4 30% (0.65) 0.12 (642%) (0.65) 0.11 (691%) Net (loss) earnings attributable to Century Casinos, Inc. shareholders for the year ended December 31, 2019 was impacted by the impairment of intangible and tangible assets at Century Casino Bath resulting in $16.5 million in expense, and $5.4 million in costs related to the Acquisition. *Adjusted EBITDA is a non-GAAP financial measure. See Appendix A for the definition and reconciliation of Adjusted EBITDA.. Century Casinos 11
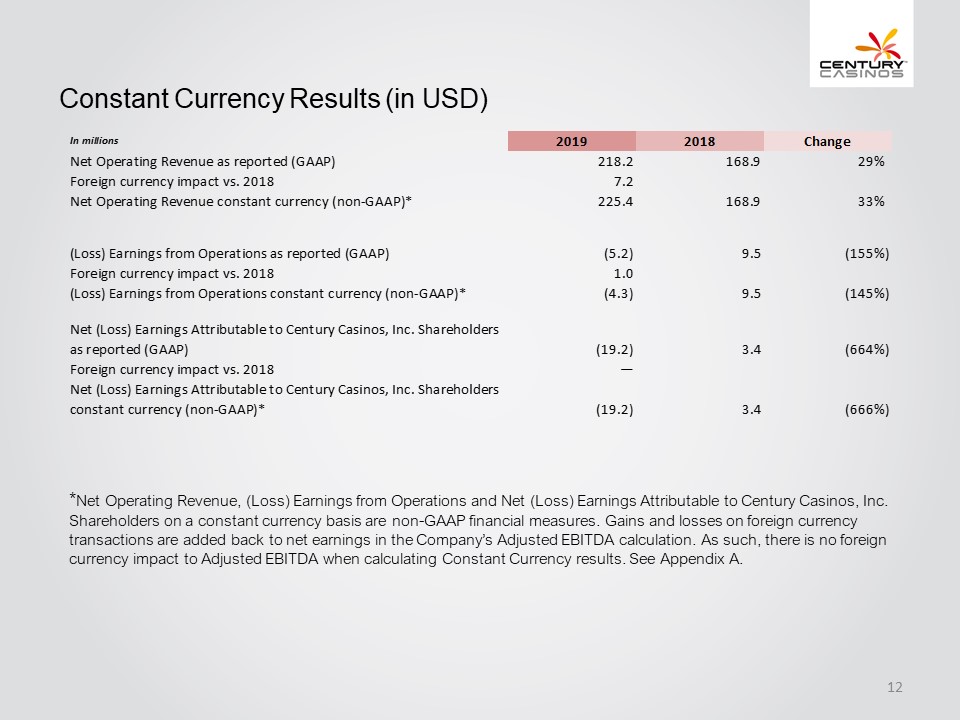
Constant Currency Results (in USD) in millions Net Operating Revenue as reported (GAAP) Foreign currency impact vs. 2018 Net Operating Revenue constant currency (non-GAAP)* (Loss) Earnings from Operations as reported (GAAP) Foreign currency impact vs. 2018 (Loss) Earnings from Operations constant currency (non-GAAP)* Net (Loss) Earnings Attributable to Century Casinos, Inc. Shareholders as reported (GAAP) Foreign currency impact vs. 2018 Net (Loss) Earnings Attributable to Century Casinos, Inc. Shareholders constant currency (non-GAAP)* 2019 2018 Change 218.2 168.9 29% 7.2 225.4 168.9 33% (5.2) 9.5 (155%) 1.0 (4.3) 9.5 (145%) (19.2) 3.4 (664%) (19.2) 3.4 (666%) *Net Operating Revenue, (Loss) Earnings from Operations and Net (Loss) Earnings Attributable to Century Casinos, Inc. Shareholders on a constant currency basis are non-GAAP financial measures. Gains and losses on foreign currency transactions are added back to net earnings in the Company’s Adjusted EBITDA calculation. As such, there is no foreign currency impact to Adjusted EBITDA when calculating Constant Currency results. See Appendix A. Century Casinos 12
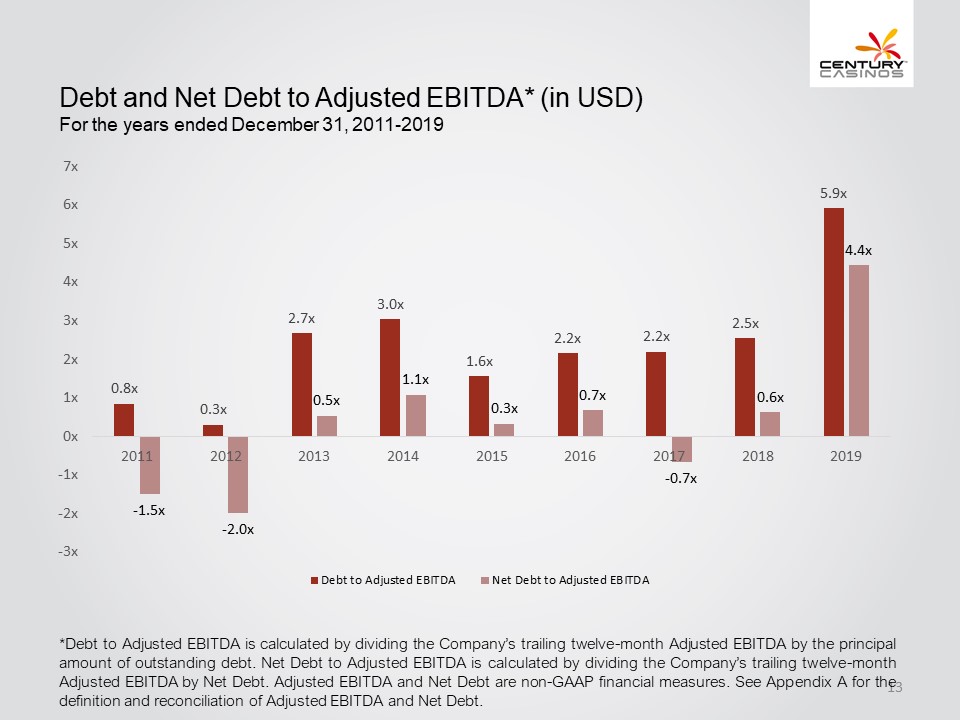
Debt and Net Debt to Adjusted EBITDA* (in USD) For the years ended December 31, 2011-2019 7x 6x 5x 4x 3x 2x 1x 0x -1x -2x -3x 2011 0.8x -1.5x 2012 0.3x -2.0x 2013 2.7x 0.5x 2014 3.0x 1.1x 2015 1.6x 0.3x 2016 2.2x 0.7x 2017 2.2x -0.7x 2018 2.5x 0.6x 2019 5.9x 4.4x Debt to Adjusted EBITDA Net Debt to Adjusted EBITDA *Debt to Adjusted EBITDA is calculated by dividing the Company’s trailing twelve-month Adjusted EBITDA by the principal amount of outstanding debt. Net Debt to Adjusted EBITDA is calculated by dividing the Company’s trailing twelve-month Adjusted EBITDA by Net Debt. Adjusted EBITDA and Net Debt are non-GAAP financial measures. See Appendix A for the definition and reconciliation of Adjusted EBITDA and Net Debt. Century Casinos 13
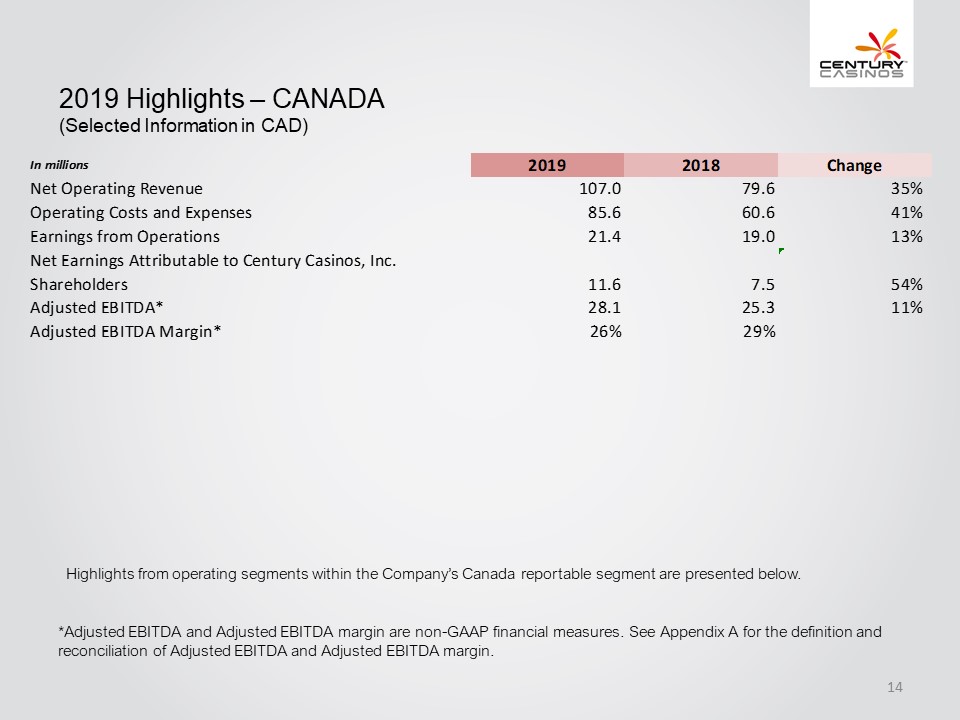
2019 Highlights – CANADA (Selected Information in CAD) In millions Net Operating Revenue Operating Costs and Expenses Earnings from Operations Net Earnings Attributable to Century Casinos, Inc. Shareholders Adjusted EBITDA* Adjusted EBITDA Margin* 2019 2018 Change 107.0 79.6 35% 85.6 60.6 41% 21.4 19.0 13% 11.6 7.5 54% 28.1 25.3 11% 26% 29% Highlights from operating segments within the Company’s Canada reportable segment are presented below. *Adjusted EBITDA and Adjusted EBITDA margin are non-GAAP financial measures. See Appendix A for the definition and reconciliation of Adjusted EBITDA and Adjusted EBITDA margin. Century Casinos 14
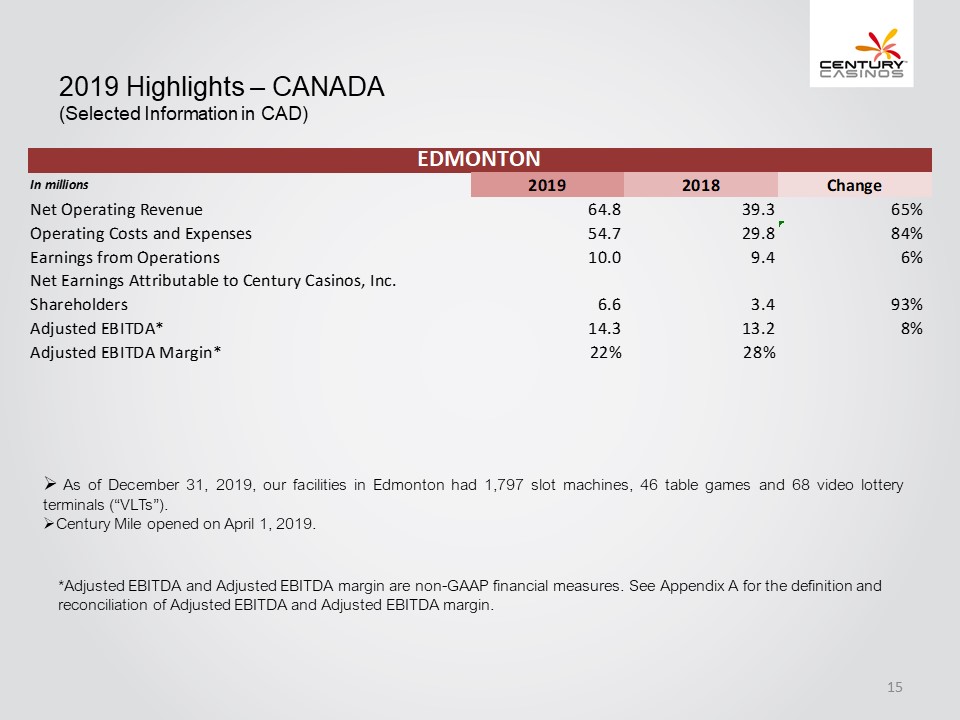
2019 Highlights – CANADA (Selected Information in CAD) EDMONTON In millions 2019 2018 Change Net Operating Revenue 64.8 39.3 65% Operating Costs and Expenses 54.7 29.8 84% Earnings from Operations Net Earnings Attributable to Century Casinos, Inc. 10.0 9.4 6% Shareholders 6.6 3.4 93% Adjusted EBITDA* 14.3 13.2 8% Adjusted EBITDA Margin* 22% 28% As of December 31, 2019, our facilities in Edmonton had 1,797 slot machines, 46 table games and 68 video lottery terminals (“VLTs”). Century Mile opened on April 1, 2019. *Adjusted EBITDA and Adjusted EBITDA margin are non-GAAP financial measures. See Appendix A for the definition and reconciliation of Adjusted EBITDA and Adjusted EBITDA margin. Century Casinos 15
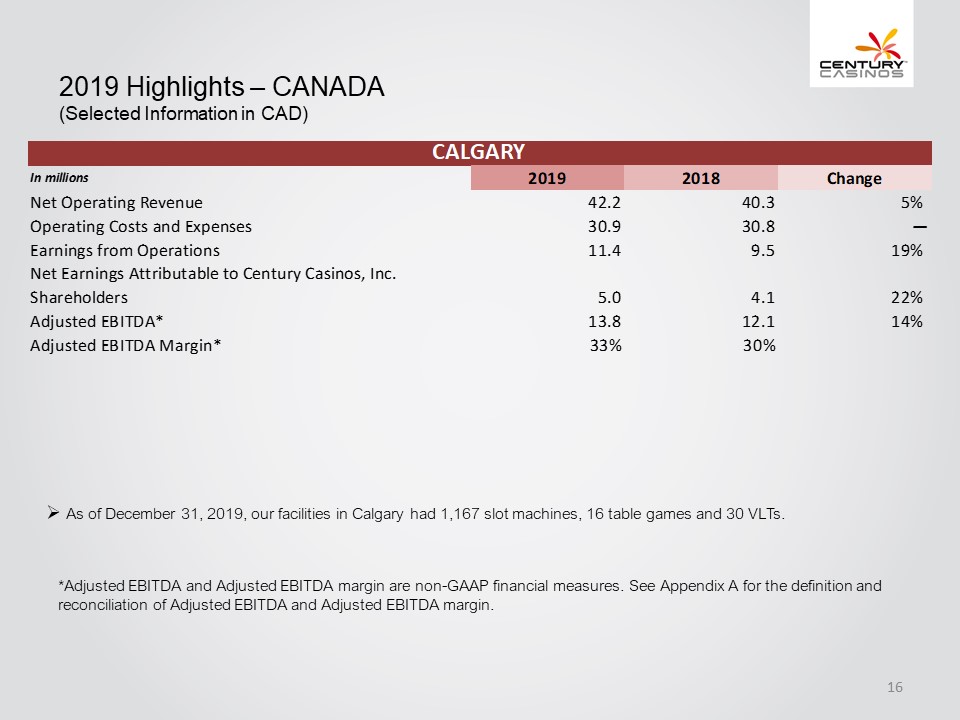
2019 Highlights – CANADA (Selected Information in CAD) CALGARY In millions 2019 2018 Change Net Operating Revenue 42.2 40.3 5% Operating Costs and Expenses 30.9 30.8 — Earnings from Operations Net Earnings Attributable to Century Casinos, Inc. 11.4 9.5 19% Shareholders 5.0 4.1 22% Adjusted EBITDA* 13.8 12.1 14% Adjusted EBITDA Margin* 33% 30% As of December 31, 2019, our facilities in Calgary had 1,167 slot machines, 16 table games and 30 VLTs. *Adjusted EBITDA and Adjusted EBITDA margin are non-GAAP financial measures. See Appendix A for the definition and reconciliation of Adjusted EBITDA and Adjusted EBITDA margin. Century Casinos 16
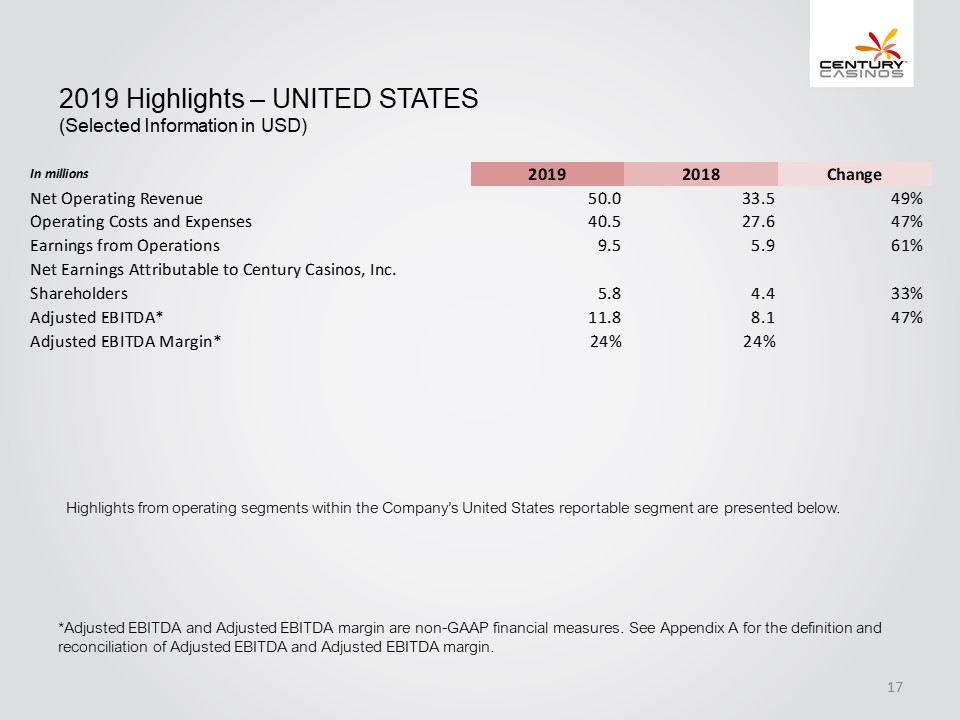
2019 Highlights – UNITED STATES (Selected Information in USD) In mlllons Net Operating Revenue Operating Costs and Expenses Earnings from Operations Net Earnings Attributable to Century Casinos, Inc. Shareholders Adjusted EBITDA* Adjusted EBITDA Margin* 2019 2018 Change 50.0 33.5 49% 40.5 27.6 47% 9.5 5.9 61% 5.8 4.4 33% 11.8 8.1 47% 24% 24% Highlights from operating segments within the Company’s United States reportable segment are presented below. *Adjusted EBITDA and Adjusted EBITDA margin are non-GAAP financial measures. See Appendix A for the definition and reconciliation of Adjusted EBITDA and Adjusted EBITDA margin. Century Casinos 17
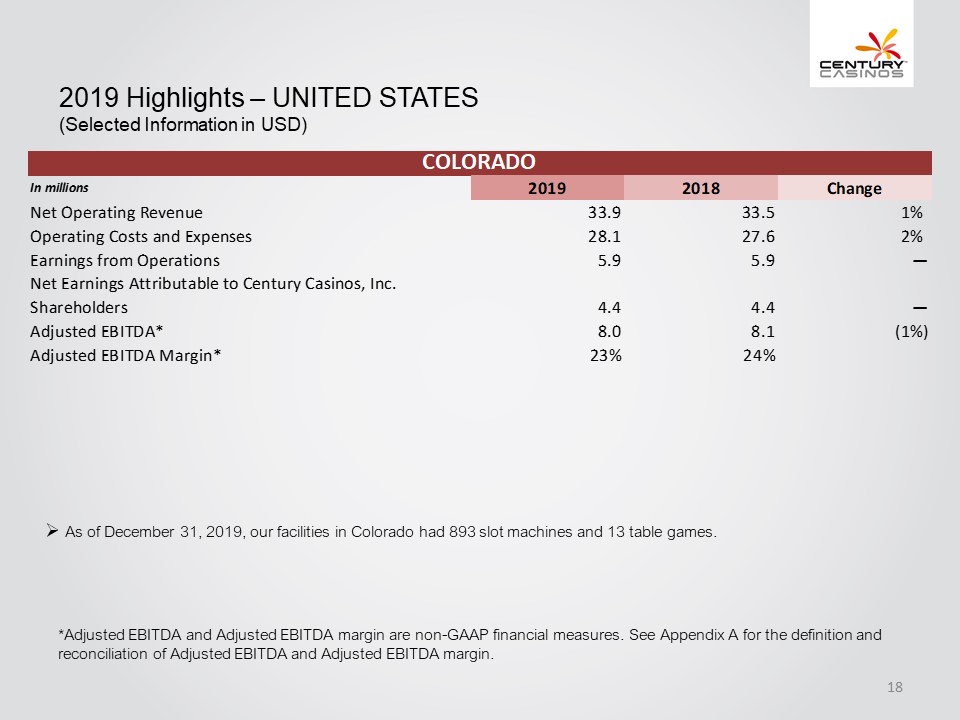
2019 Highlights – UNITED STATES (Selected Information in USD) COLORADO In mIlions 2019 2018 Change Net Operating Revenue 33.9 33.5 1% Operating Costs and Expenses 28.1 27.6 2% Earnings from Operations Net Earnings Attributable to Century Casinos, Inc. 5.9 5.9 — Shareholders 4.4 4.4 — Adjusted EBITDA* 8.0 8.1 (1%) Adjusted EBITDA Margin* 23% 24% As of December 31, 2019, our facilities in Colorado had 893 slot machines and 13 table games. *Adjusted EBITDA and Adjusted EBITDA margin are non-GAAP financial measures. See Appendix A for the definition and reconciliation of Adjusted EBITDA and Adjusted EBITDA margin. Century Casinos 18
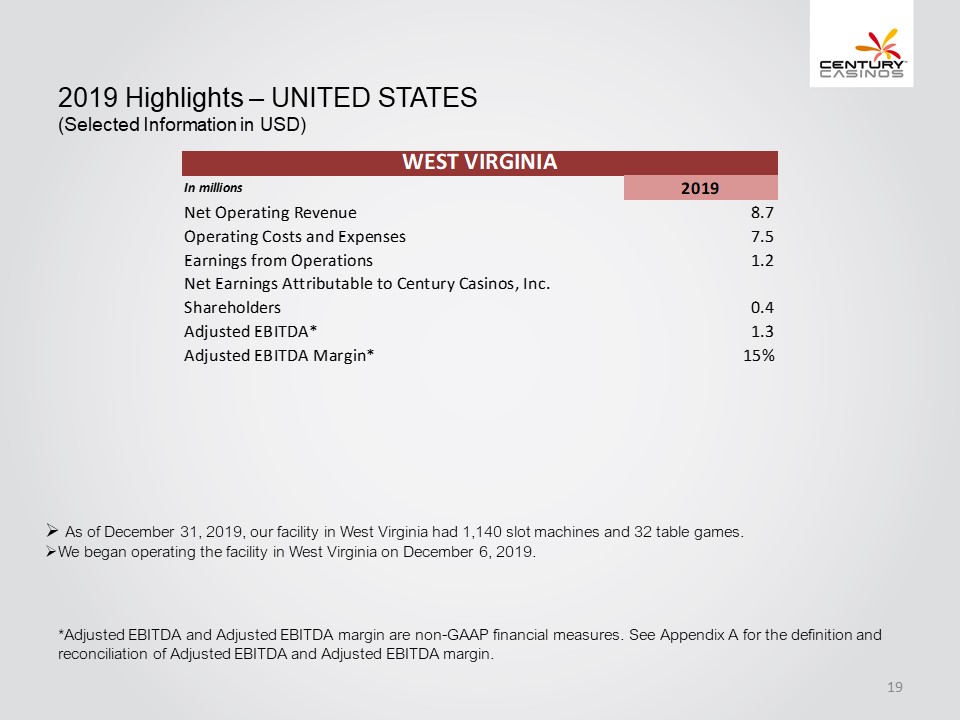
2019 Highlights – UNITED STATES (Selected Information in USD) WEST VIRGINIA ln milfons 2019 Net Operating Revenue 8.7 Operating Costs and Expenses 7.5 Earnings from Operations 1.2 Net Earnings Attributable to Century Casinos, Inc. Shareholders 0.4 Adjusted EBITDA*' 1.3 Adjusted EBITDA Margin* 15% As of December 31, 2019, our facility in West Virginia had 1,140 slot machines and 32 table games. We began operating the facility in West Virginia on December 6, 2019. *Adjusted EBITDA and Adjusted EBITDA margin are non-GAAP financial measures. See Appendix A for the definition and reconciliation of Adjusted EBITDA and Adjusted EBITDA margin. Century Casinos 19
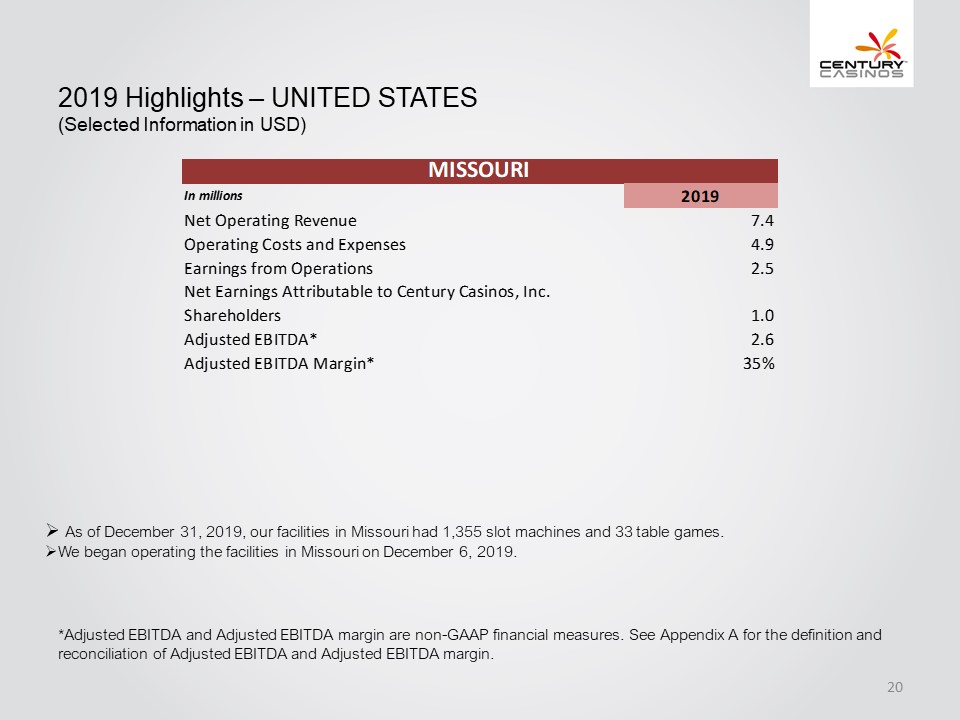
2019 Highlights – UNITED STATES (Selected Information in USD) MISSOURI ln milfons 2019 Net Operating Revenue 7.4 Operating Costs and Expenses 4.9 Earnings from Operations 2.5 Net Earnings Attributable to Century Casinos, Inc. Shareholders 1.0 Adjusted EBITDA*' 2.6 Adjusted EBITDA Margin* 35% As of December 31, 2019, our facilities in Missouri had 1,355 slot machines and 33 table games. We began operating the facilities in Missouri on December 6, 2019. *Adjusted EBITDA and Adjusted EBITDA margin are non-GAAP financial measures. See Appendix A for the definition and reconciliation of Adjusted EBITDA and Adjusted EBITDA margin. Century Casinos 20

2019 Highlights – POLAND (Selected Information in PLN) In mlllons Net Operating Revenue Operating Costs and Expenses Earnings from Operations Net Earnings (Loss) Attributable to Century Casinos, Inc. Shareholders Adjusted EBITDA* Adjusted EBITDA Margin* 2019 2018 Change 314.3 246.7 27% 289.3 246.2 18% 24.9 0.4 5918% 12.8 (0.8) 1656% 36.0 17.6 105% 11% 7% As of December 31, 2019, our facilities in Poland had 523 slot machines and 118 table games at eight locations. *Adjusted EBITDA and Adjusted EBITDA margin are non-GAAP financial measures. See Appendix A for the definition and reconciliation of Adjusted EBITDA and Adjusted EBITDA margin. Century Casinos 21
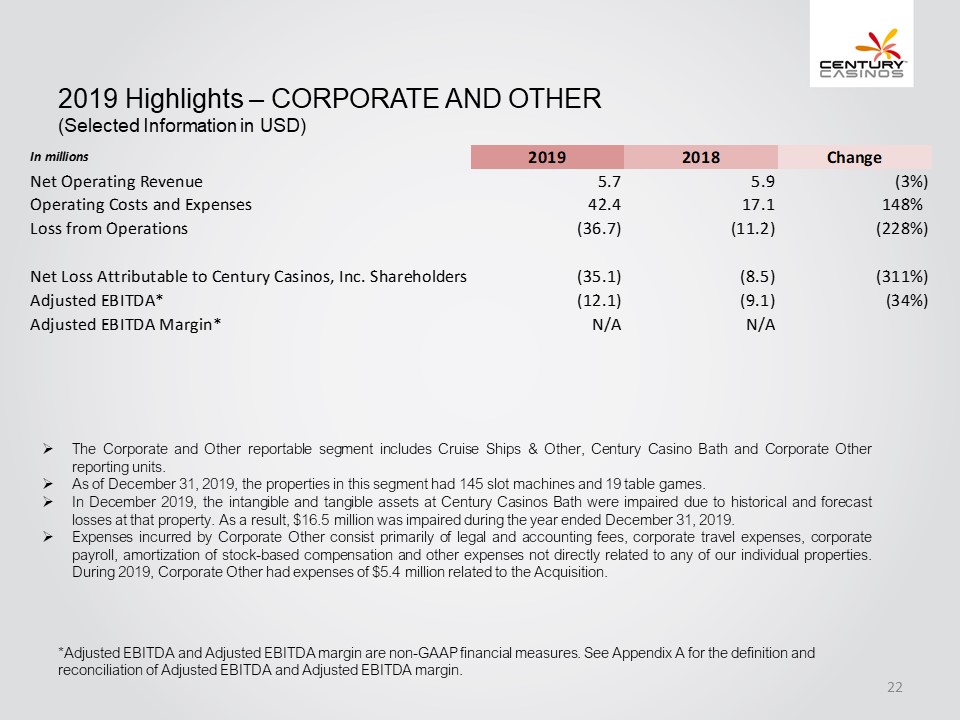
2019 Highlights – CORPORATE AND OTHER (Selected Information in USD) In mlllons Net Operating Revenue Operating Costs and Expenses Loss from Operations Net Loss Attributable to Century Casinos, Inc. Shareholders Adjusted EBITDA* Adjusted EBITDA Margin* 2019 2018 Change 5.7 5.9 (3%) 42.4 17.1 148% (36.7) (11.2) (228%) (35.1) (8.5) (311%) (12.1) (9.1) (34%) N/A N/A The Corporate and Other reportable segment includes Cruise Ships & Other, Century Casino Bath and Corporate Other reporting units. As of December 31, 2019, the properties in this segment had 145 slot machines and 19 table games. In December 2019, the intangible and tangible assets at Century Casinos Bath were impaired due to historical and forecast losses at that property. As a result, $16.5 million was impaired during the year ended December 31, 2019. Expenses incurred by Corporate Other consist primarily of legal and accounting fees, corporate travel expenses, corporate payroll, amortization of stock-based compensation and other expenses not directly related to any of our individual properties. During 2019, Corporate Other had expenses of $5.4 million related to the Acquisition. *Adjusted EBITDA and Adjusted EBITDA margin are non-GAAP financial measures. See Appendix A for the definition and reconciliation of Adjusted EBITDA and Adjusted EBITDA margin. Century Casinos 22
2019 Highlights – ADDITIONAL PROJECTS UNDER DEVELOPMENT Bermuda In August 2017, the Company announced that, together with Hamilton Properties Limited, it had submitted a casino license application to the Bermudan government for a casino at the Hamilton Princess Hotel & Beach Club in Hamilton, Bermuda. The Company’s subsidiary, CRM, entered into a long-term management agreement with Hamilton Properties Limited pursuant to which the Company will assist with the license application and manage the operations of the casino for which it will receive a management fee, should the license be awarded. In September 2017, the Bermuda Casino Gaming Commission granted a provisional casino gaming license, which is subject to certain conditions and approvals including the adoption of certain rules and regulations by the Bermudan government. The Parliament of Bermuda has not yet adopted these rules and regulations. Century Casinos 23
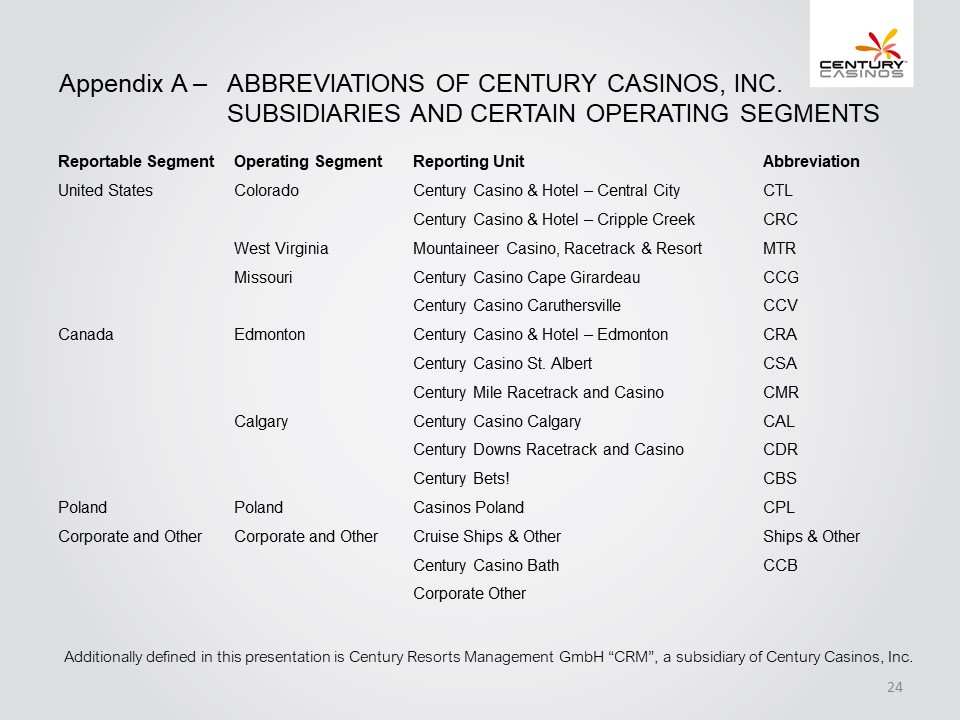
Appendix A – ABBREVIATIONS OF CENTURY CASINOS, INC. SUBSIDIARIES AND CERTAIN OPERATING SEGMENTS Reportable Segment Operating Segment Reporting Unit Abbreviation United States Colorado Century Casino & Hotel – Central City CTL Century Casino & Hotel – Cripple Creek CRC West Virginia Mountaineer Casino, Racetrack & Resort MTR Missouri Century Casino Cape Girardeau CCG Century Casino Caruthersville CCV Canada Edmonton Century Casino & Hotel – Edmonton CRA Century Casino St. Albert CSA Century Mile Racetrack and Casino CMR Calgary Century Casino Calgary CAL Century Downs Racetrack and Casino CDR Century Bets! CBS Poland Poland Casinos Poland CPL Corporate and Other Corporate and Other Cruise Ships & Other Ships & Other Century Casino Bath CCB Corporate Other Additionally defined in this presentation is Century Resorts Management GmbH “CRM”, a subsidiary of Century Casinos, Inc. Century Casinos 24
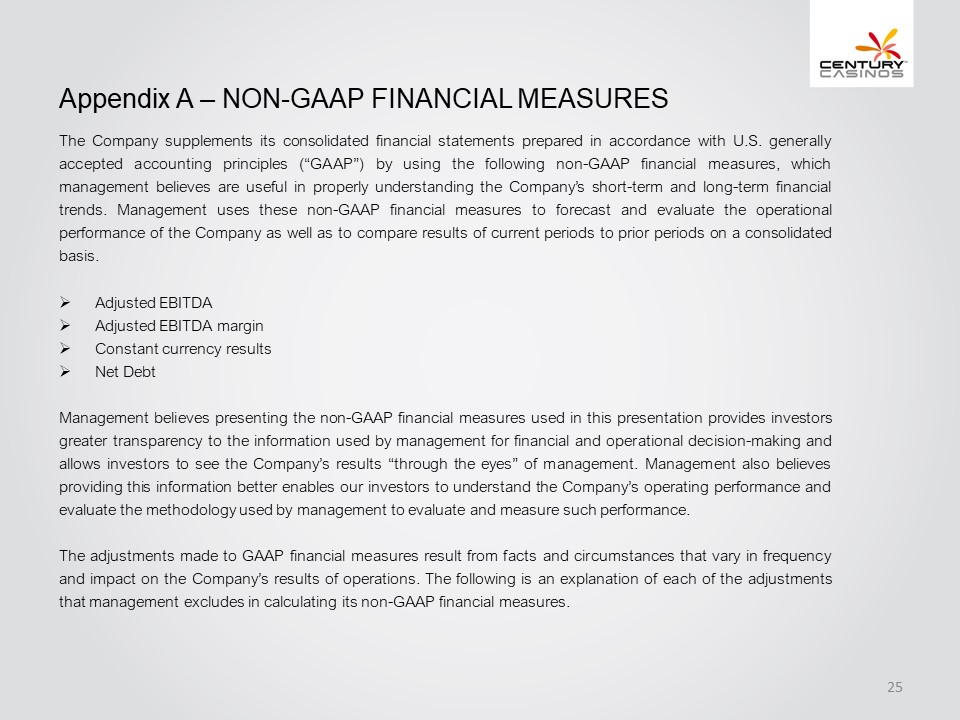
Appendix A – NON-GAAP FINANCIAL MEASURES The Company supplements its consolidated financial statements prepared in accordance with U.S. generally accepted accounting principles (“GAAP”) by using the following non-GAAP financial measures, which management believes are useful in properly understanding the Company’s short-term and long-term financial trends. Management uses these non-GAAP financial measures to forecast and evaluate the operational performance of the Company as well as to compare results of current periods to prior periods on a consolidated basis. Adjusted EBITDA Adjusted EBITDA margin Constant currency results Net Debt Management believes presenting the non-GAAP financial measures used in this presentation provides investors greater transparency to the information used by management for financial and operational decision-making and allows investors to see the Company’s results “through the eyes” of management. Management also believes providing this information better enables our investors to understand the Company’s operating performance and evaluate the methodology used by management to evaluate and measure such performance. The adjustments made to GAAP financial measures result from facts and circumstances that vary in frequency and impact on the Company’s results of operations. The following is an explanation of each of the adjustments that management excludes in calculating its non-GAAP financial measures. Century Casinos 25
Appendix A – NON-GAAP FINANCIAL MEASURES The Company defines Adjusted EBITDA as net earnings (loss) attributable to Century Casinos, Inc. shareholders before interest expense (income), net, income taxes (benefit), depreciation and amortization, non-controlling interests net earnings (loss) and transactions, pre-opening expenses, acquisition costs, non-cash stock-based compensation charges, asset impairment costs, (gain) loss on disposition of fixed assets, discontinued operations, (gain) loss on foreign currency transactions, cost recovery income and other, gain on business combination and certain other one-time items, such as acquisition and disposition costs and gain or loss. Expenses related to the Company’s Master Lease are included in the interest expense (income), net, line item. Intercompany transactions consisting primarily of management and royalty fees and interest, along with their related tax effects, are excluded from the presentation of net earnings (loss) attributable to Century Casinos, Inc. shareholders and Adjusted EBITDA reported for each segment. Not all of the aforementioned items occur in each reporting period, but have been included in the definition based on historical activity. These adjustments have no effect on the consolidated results as reported under GAAP. Adjusted EBITDA is not considered a measure of performance recognized under GAAP. Management believes that Adjusted EBITDA is a valuable measure of the relative performance of the Company and its properties. The gaming industry commonly uses Adjusted EBITDA as a method of arriving at the economic value of a casino operation. Management uses Adjusted EBITDA to compare the relative operating performance of separate operating units by eliminating the above mentioned items associated with the varying levels of capital expenditures for infrastructure required to generate revenue and the often high cost of acquiring existing operations. Adjusted EBITDA is used by the Company’s lending institution to gauge operating performance. The Company’s computation of Adjusted EBITDA may be different from, and therefore may not be comparable to, similar measures used by other companies within the gaming industry. Please see the reconciliation of Adjusted EBITDA to net earnings (loss) attributable to Century Casinos, Inc. shareholders below. The Company defines Adjusted EBITDA margin as Adjusted EBITDA divided by net operating revenue. Management uses this margin as one of several measures to evaluate the efficiency of the Company’s casino operations. Century Casinos 26
Appendix A – NON-GAAP FINANCIAL MEASURES The impact of foreign exchange rates is highly variable and difficult to predict. The Company uses a Constant Currency basis to show the impact from foreign exchange rates on current period financial information compared to prior period financial information using the prior period’s foreign exchange rates. In order to properly understand the underlying business trends and performance of the Company’s ongoing operations, management believes that investors may find it useful to consider the impact of excluding changes in foreign exchange rates from the Company’s net operating revenue, earnings (loss) from operations and net earnings (loss) attributable to Century Casinos, Inc. shareholders. Constant currency results are calculated by dividing the current year to date local currency segment results excluding the local currency impact of foreign currency gains and losses, by the prior year’s average exchange rate for the year to date and comparing them to actual U.S. dollar results for the prior year to date. The average exchange rates for the current and prior year are reported in Note 2 to the Consolidated Financial Statements included in Part II, Item 8, “Financial Statements and Supplementary Data” of the Company’s Annual Report on Form 10-K. Constant currency information is not a measure of financial performance under GAAP and should not be considered a substitute for net operating revenue, earnings (loss) from operations or net earnings (loss) attributable to Century Casinos, Inc. shareholders as determined in accordance with GAAP. The Company defines Net Debt as total long-term debt (including current portion) plus deferred financing costs minus cash and cash equivalents. Net Debt is not considered a liquidity measure recognized under GAAP. Management believes that Net Debt is a valuable measure of our overall financial situation. Net Debt provides investors with an indication of our ability to pay off all of our long-term debt if it became due simultaneously. Century Casinos 27
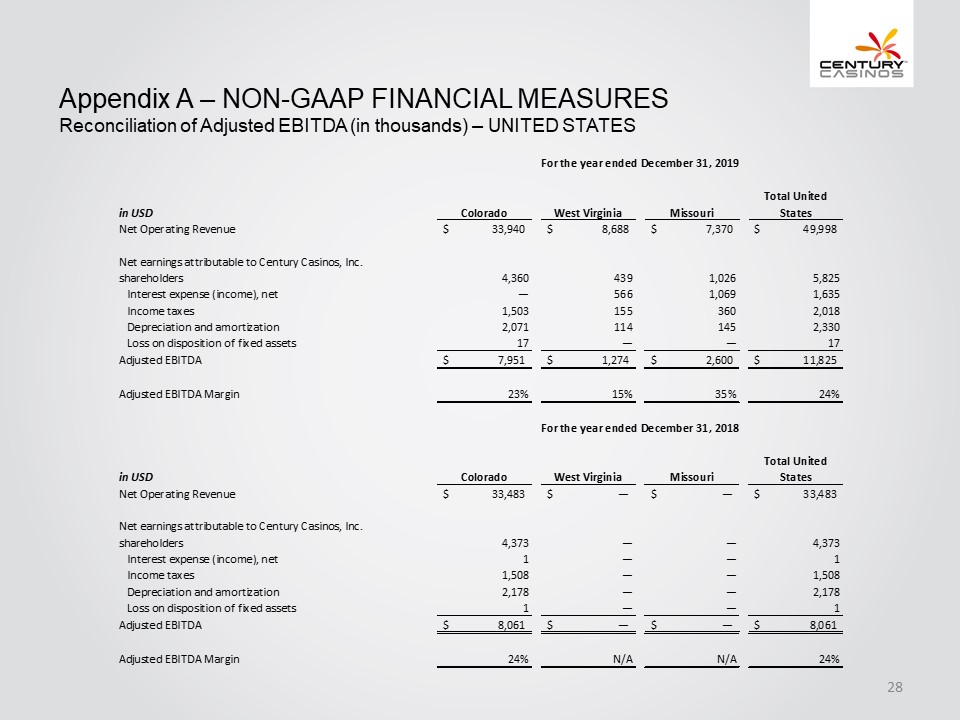
Appendix A – NON-GAAP FINANCIAL MEASURES Reconciliation of Adjusted EBITDA (in thousands) – UNITED STATES For the year ended December 31, 2019 in USD Colorado West Virginia Missouri Total United States Net Operating Revenue $ 33,940 $ 8,688 $ 7,370 $ 49,998 Net earnings attributable to Century Casinos, Inc. shareholders 4,360 439 1,026 5,825 Interest expense (income), net — 566 1,069 1,635 Income taxes 1,503 155 360 2,018 Depreciation and amortization 2,071 114 145 2,330 Loss on disposition of fixed assets 17 — — 17 Adjusted EBITDA $ 7,951 $ 1,274 $ 2,600 $ 11,825 Adjusted EBITDA Margin 23% 15% 35% 24% For the year ended December 31, 2018 Total United in USD Colorado West Virginia Missouri States Net Operating Revenue $ 33,483 $ — $ — $ 33,483 Net earnings attributable to Century Casinos, Inc. shareholders 4,373 — — 4,373 Interest expense (income), net 1 — — 1 Income taxes 1,508 — — 1,508 Depreciation and amortization 2,178 — — 2,178 Loss on disposition of fixed assets 1 — — 1 Adjusted EBITDA $ 8,061 $— $— $ 8,061 24% N/A N/A 24% Adjusted EBITDA Margin Century Casinos 28
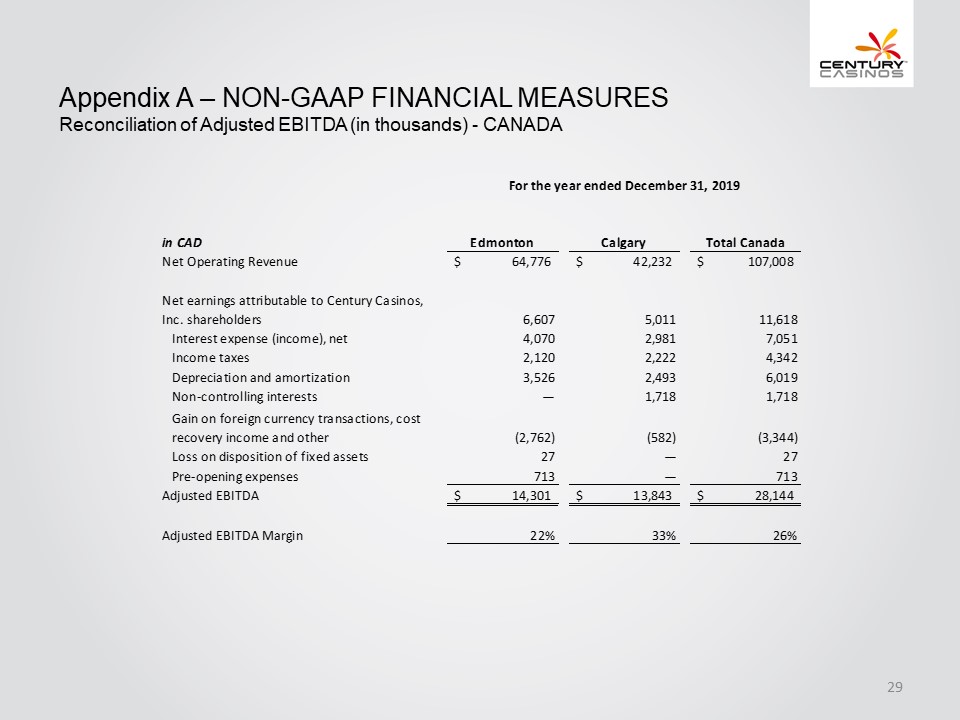
Appendix A – NON-GAAP FINANCIAL MEASURES Reconciliation of Adjusted EBITDA (in thousands) – CANADA For the year ended December 31, 2019 in CAD Edmonton Calgary Total Canada Net Operating Revenue $ 64,776 $ 42,232 $ 107,008 Net earnings attributable to Century Casinos, Inc. shareholders 6,607 5,011 11,618 Interest expense (income), net 4,070 2,981 7,051 Income taxes 2,120 2,222 4,342 Depreciation and amortization 3,526 2,493 6,019 Non-controlling interests — 1,718 1,718 Gain on foreign currency transactions, cost recovery income and other (2,762) (582) (3,344) Loss on disposition of fixed assets 27 — 27 Pre-opening expenses 713 — 713 Adjusted EBITDA $ 14,301 $ 13,843 $ 28,144 22% 33% 26% Adjusted EBITDA Margin Century Casinos 29
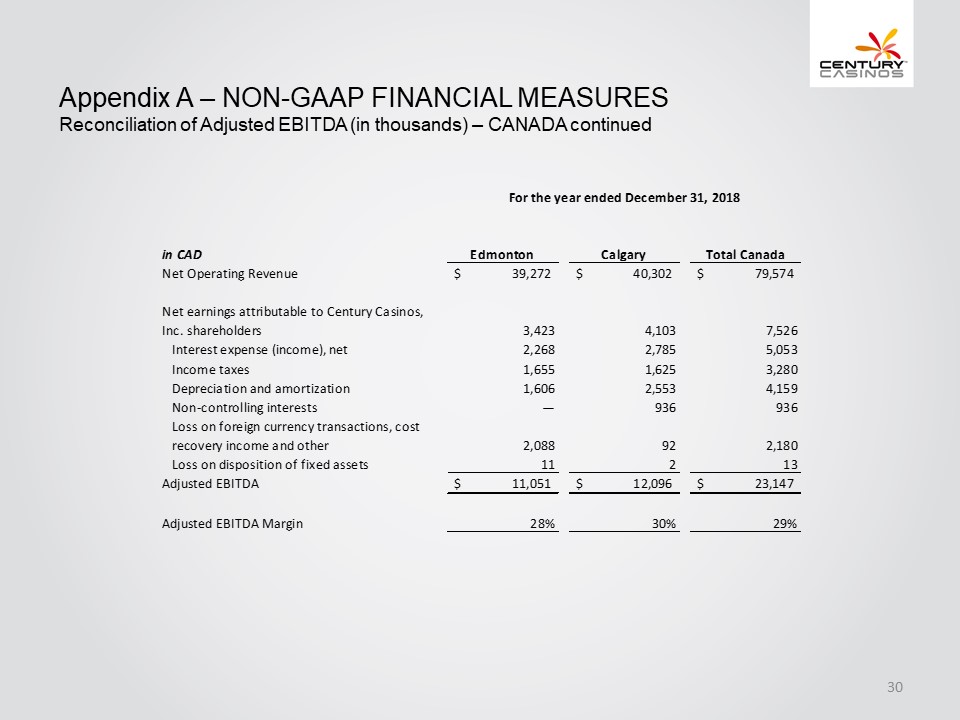
Appendix A – NON-GAAP FINANCIAL MEASURES Reconciliation of Adjusted EBITDA (in thousands) – CANADA continued in CAD Net Operating Revenue Net earnings attributable to Century Casinos, Inc. shareholders Interest expense (income), net Income taxes Depreciation and amortization Non-controlling interests Loss on foreign currency transactions, cost recovery income and other Loss on disposition of fixed assets Adjusted EBITDA Adjusted EBITDA Margin For the year ended December 31, 2018 Edmonton Calgary Total Canada $ 39,272 $ 40,302 $ 79,574 3,423 4,103 7,526 2,268 2,785 5,053 1,655 1,625 3,280 1,606 2,553 4,159 — 936 936 2,088 92 2,180 11 2 13 $ 11,051 $ 12,096 $ 23,147 28% 30% 29% Century Casinos 30
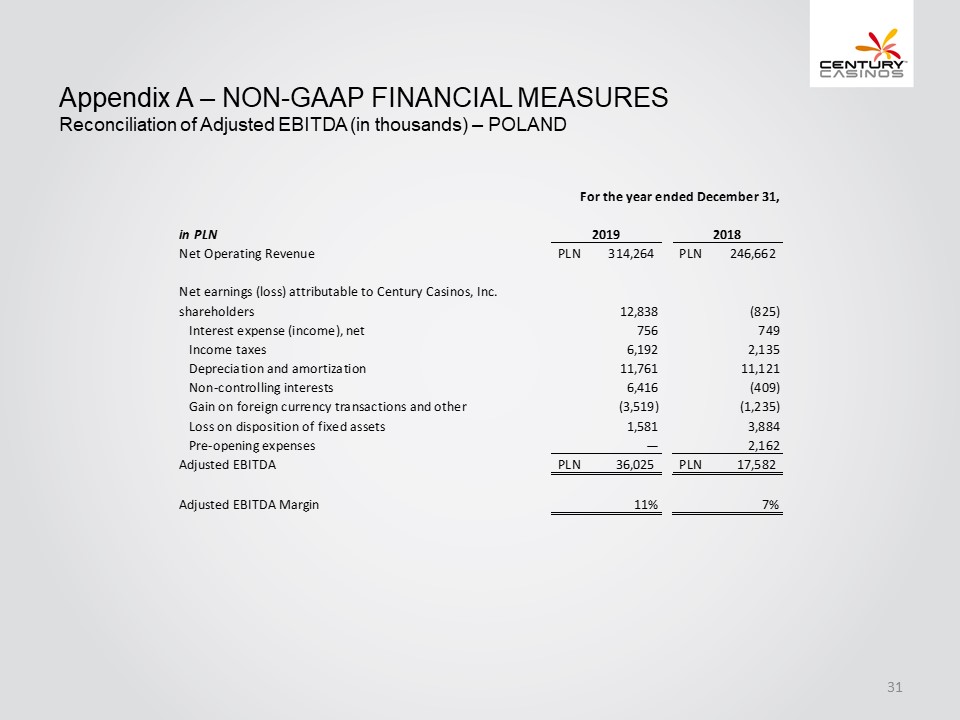
Appendix A – NON-GAAP FINANCIAL MEASURES Reconciliation of Adjusted EBITDA (in thousands) – POLAND in PLN Net Operating Revenue Net earnings (loss) attributable to Century Casinos, Inc shareholders Interest expense (income), net Income taxes Depreciation and amortization Non-controlling interests Gain on foreign currency transactions and other Loss on disposition of fixed assets Pre-opening expenses Adjusted EBITDA Adjusted EBITDA Margin For the year ended December 31, 2019 PLN 314,264 12,838 756 6,192 11,761 6,416 (3,519) 1,581 PLN 36,025 2018 PLN 246,662 (825) 749 2,135 11,121 (409) (1,235) 3,884 2,162 PLN 17,582 11% 7% Century Casinos 31
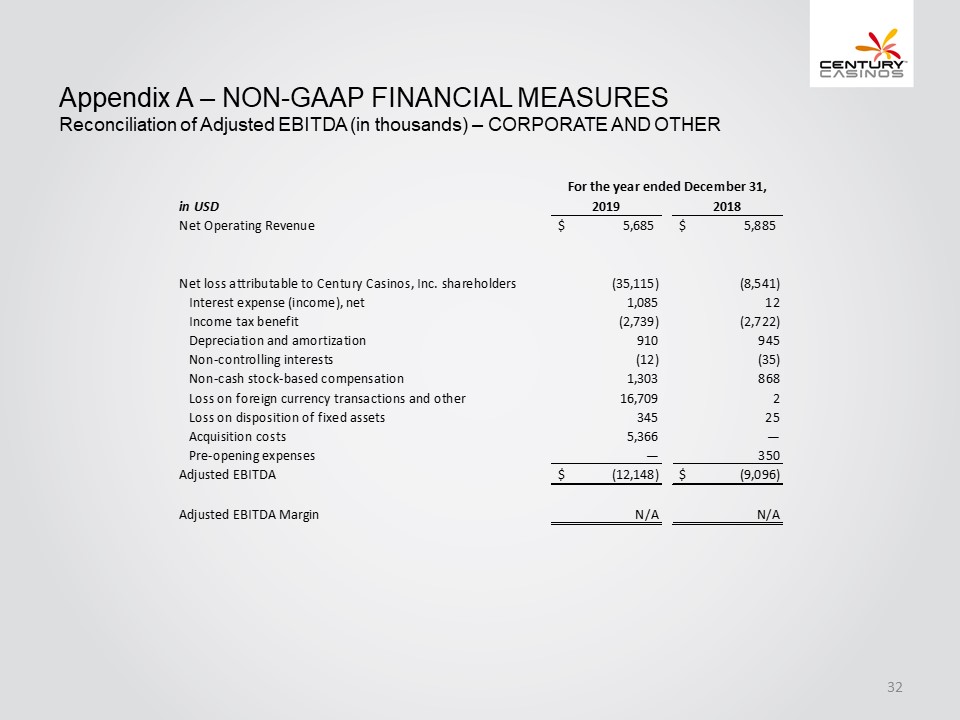
Appendix A – NON-GAAP FINANCIAL MEASURES Reconciliation of Adjusted EBITDA (in thousands) – CORPORATE AND OTHER in USD Net Operating Revenue Net loss attributable to Century Casinos, Inc. shareholders Interest expense (income), net Income tax benefit Depreciation and amortization Non-controlling interests Non-cash stock-based compensation Loss on foreign currency transactions and other Loss on disposition of fixed assets Acquisition costs Pre-opening expenses Adjusted EBITDA Adjusted EBITDA Margin For the year ended December 31, 2019 2018 $ 5,685 $ 5,885 (35,115) (8,541) 1,085 12 (2,739) (2,722) 910 945 (12) (35) 1,303 868 16,709 2 345 25 5,366 — — 350 $ (12,148) $ ( 9,096) N/A N/A Century Casinos 32
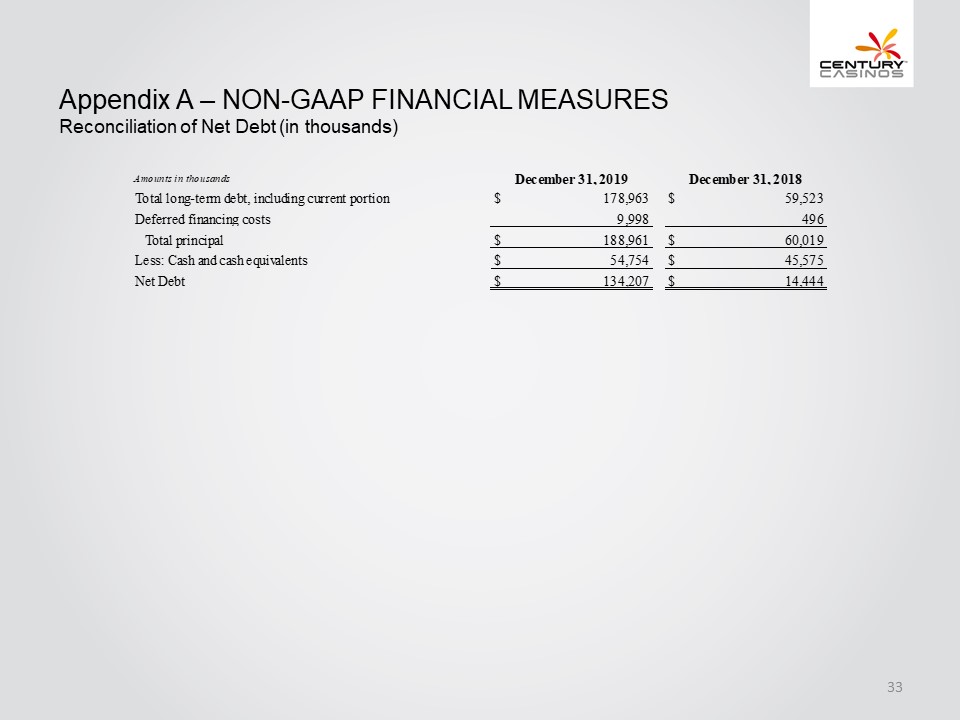
Appendix A – NON-GAAP FINANCIAL MEASURES Reconciliation of Net Debt (in thousands) Amounts in thousands Total long-term debt, including current portion Deferred financing costs Total principal Less: Cash and cash equivalents Net Debt December 31, 2019 $ 178.963 9,998 $ 188.961 $ 54.754 $ 134,207 December 31, 2018 $ 59,523 496 $ 60.019 $ 45,575 $ 14,444 Century Casunos 33