Attached files
| file | filename |
|---|---|
| EX-32.2 - EX-32.2 - CENTURY BANCORP INC | d827661dex322.htm |
| EX-32.1 - EX-32.1 - CENTURY BANCORP INC | d827661dex321.htm |
| EX-31.2 - EX-31.2 - CENTURY BANCORP INC | d827661dex312.htm |
| EX-31.1 - EX-31.1 - CENTURY BANCORP INC | d827661dex311.htm |
| EX-23.1 - EX-23.1 - CENTURY BANCORP INC | d827661dex231.htm |
| EX-21 - EX-21 - CENTURY BANCORP INC | d827661dex21.htm |
| EX-4.4 - EX-4.4 - CENTURY BANCORP INC | d827661dex44.htm |
Table of Contents
UNITED STATES
SECURITIES AND EXCHANGE COMMISSION
Washington, D.C. 20549
Form 10-K
(Mark One)
| ☑ | ANNUAL REPORT PURSUANT TO SECTION 13 OR 15(d) OF THE SECURITIES EXCHANGE ACT OF 1934 |
For the fiscal year ended December 31, 2019
| ☐ | TRANSITION REPORT PURSUANT TO SECTION 13 OR 15(d) OF THE SECURITIES EXCHANGE ACT OF 1934 |
For the transition period from to
Commission file number 0-15752
CENTURY BANCORP, INC.
(Exact name of registrant as specified in its charter)
| COMMONWEALTH OF MASSACHUSETTS | 04-2498617 | |
| (State or other jurisdiction of incorporation or organization) |
(I.R.S. Employer Identification number) | |
| 400 MYSTIC AVENUE, MEDFORD, MA | 02155 | |
| (Address of principal executive offices) | (Zip Code) | |
Registrant’s telephone number including area code:
(781) 391-4000
Securities registered pursuant to Section 12(b) of the Act:
| Title of class |
Trading Symbol(s) |
Name of exchange | ||
| Class A Common Stock, $1.00 par value | CNBKA | Nasdaq Global Market |
Indicate by check mark whether the registrant is a well-known seasoned issuer, as defined in Rule 405 of the Securities Act. Yes ☐ No ☑
Indicate by check mark whether the registrant is not required to file reports pursuant to Section 13 or Section 15(d) of the Act. Yes ☐ No ☑
Indicate by check mark whether the registrant (1) has filed all reports required to be filed by section 13 or 15(d) of the Securities Exchange Act of 1934 during the preceding 12 months (or for such shorter period that the registrant was required to file such reports), and (2) has been subject to such filing requirements for the past 90 days. Yes ☑ No ☐
Indicate by check mark whether the registrant has submitted electronically, every Interactive Data File required to be submitted pursuant to Rule 405 of Regulations S-T (232.405 of this chapter) during the preceding 12 months (or for such shorter period that the registrant was required to submit such files). Yes ☑ No ☐
Indicate by check mark whether the registrant is a large accelerated filer, an accelerated filer, a non-accelerated filer, or a smaller reporting company. See the definitions of “large accelerated filer,” “accelerated filer” and “smaller reporting company” in Rule 12b-2 of the Exchange Act. (Check one):
| Large accelerated filer | ☐ |
Accelerated filer |
☑ | |||
| Non-accelerated filer | ☐ | Smaller reporting company |
☐ | |||
| Emerging growth company | ☐ | |||||
If an emerging growth company, indicate by check mark if the registrant has elected not to use the extended transition period for complying with any new or revised financial accounting standards provided pursuant to Section 13(a) of the Exchange Act. ☐
Indicate by check mark whether the registrant is a shell company (as defined in Rule 12b-2 of the Act). Yes ☐ No ☑
State the aggregate market value of the registrant’s voting and nonvoting stock held by nonaffiliates, computed using the closing price as reported on Nasdaq as of June 30, 2019 was $319,749,083.
Indicate the number of shares outstanding of each of the registrant’s classes of common stock as of February 29, 2020:
Class A Common Stock, $1.00 par value 3,652,349 Shares
Class B Common Stock, $1.00 par value 1,915,560 Shares
DOCUMENTS INCORPORATED BY REFERENCE
List hereunder the following documents if incorporated by reference and the Part of the Form 10-K (e.g., Part I, Part II, etc.) into which the document is incorporated: (1) Any annual report to security holders; (2) Any proxy or information statement; and (3) Any prospectus filed pursuant to Rule 424(b) or (c) under the Securities Act of 1933. The listed documents should be clearly described for identification purposes (e.g., annual report to security holders for fiscal year ended December 24, 1980).
| (1) | Portions of the Registrant’s Annual Report to Stockholders for the fiscal year ended December 31, 2019 are incorporated into Part II, Items 5-8 of this Form 10-K. |
Table of Contents
CENTURY BANCORP INC.
FORM 10-K
| Page | ||||||
| PART I | ||||||
| ITEM 1 |
1-6 | |||||
| ITEM 1A |
6-7 | |||||
| ITEM 1B |
7 | |||||
| ITEM 2 |
8 | |||||
| ITEM 3 |
8 | |||||
| ITEM 4 |
8 | |||||
| PART II | ||||||
| ITEM 5 |
9 | |||||
| ITEM 6 |
9 | |||||
| ITEM 7 |
MANAGEMENT’S DISCUSSION AND ANALYSIS OF RESULTS OF OPERATIONS AND FINANCIAL CONDITION |
9 | ||||
| ITEM 7A |
10 | |||||
| ITEM 8 |
10 | |||||
| ITEM 9 |
CHANGES IN AND DISAGREEMENTS WITH ACCOUNTANTS ON ACCOUNTING AND FINANCIAL DISCLOSURE |
10 | ||||
| ITEM 9A |
10 | |||||
| ITEM 9B |
10 | |||||
| PART III | ||||||
| ITEM 10 |
97-102 | |||||
| ITEM 11 |
102-112 | |||||
| ITEM 12 |
SECURITY OWNERSHIP OF CERTAIN BENEFICIAL OWNERS AND MANAGEMENT AND RELATED STOCKHOLDER MATTERS |
112-113 | ||||
| ITEM 13 |
CERTAIN RELATIONSHIPS AND RELATED TRANSACTIONS AND DIRECTOR INDEPENDENCE |
113-114 | ||||
| ITEM 14 |
114 | |||||
| PART IV | ||||||
| ITEM 15 |
115-117 | |||||
| ITEM 16 |
117 | |||||
| 118 | ||||||
i
Table of Contents
PART I
| ITEM 1. | BUSINESS |
The Company
Century Bancorp, Inc. (together with its bank subsidiary, unless the context otherwise requires, the “Company”) is a Massachusetts state-chartered bank holding company headquartered in Medford, Massachusetts. The Company is a Massachusetts corporation formed in 1972 and has one banking subsidiary (the “Bank”): Century Bank and Trust Company formed in 1969. At December 31, 2019, the Company had total assets of $5.5 billion. Currently, the Company operates 27 banking offices in 20 cities and towns in Massachusetts, ranging from Braintree in the south to Andover in the north. The Bank’s customers consist primarily of small and medium-sized businesses and retail customers in these communities and surrounding areas, as well as local governments and large healthcare and higher education institutions throughout Massachusetts, New Hampshire, Rhode Island, Connecticut, and New York.
The Company’s results of operations are largely dependent on net interest income, which is the difference between the interest earned on loans and securities and interest paid on deposits and borrowings. The results of operations are also affected by the level of income and fees from loans, deposits, as well as operating expenses, the provision for loan losses, the impact of federal and state income taxes and the relative levels of interest rates and economic activity.
The Company offers a wide range of services to commercial enterprises, state and local governments and agencies, non-profit organizations and individuals. It emphasizes service to small and medium-sized businesses and retail customers in its market area. The Company makes commercial loans, real estate and construction loans and consumer loans, and accepts savings, time, and demand deposits. In addition, the Company offers to its corporate and institutional customers automated lock box collection services, cash management services and account reconciliation services, and actively promotes the marketing of these services to the municipal market. Also, the Company provides full service securities brokerage services through a program called Investment Services at Century Bank, which is supported by LPL Financial, a third party full-service securities brokerage business.
The Company has municipal cash management client engagements in Massachusetts, New Hampshire and Rhode Island comprised of approximately 298 government entities.
Availability of Company Filings
Under the Securities Exchange Act of 1934, Sections 13 and 15(d), periodic and current reports must be filed with the Securities and Exchange Commission (the “SEC”). The Company electronically files with the SEC its periodic and current reports, as well as other filings it makes with the SEC from time to time. The SEC maintains an Internet site that contains reports and other information regarding issuers, including the Company, that file electronically with the SEC, at www.sec.gov, in which all forms filed electronically may be accessed. Additionally, our annual report on Form 10-K, quarterly reports on Form 10-Q and current reports on Form 8-K and additional shareholder information are available free of charge on the Company’s website: www.centurybank.com.
Employees
As of December 31, 2019, the Company had 404 full-time and 56 part-time employees. The Company’s employees are not represented by any collective bargaining unit. The Company believes that its employee relations are good.
Financial Services Modernization
On November 12, 1999, President Clinton signed into law The Gramm-Leach-Bliley Act (“Gramm-Leach”) which significantly altered banking laws in the United States. Gramm-Leach enables combinations among banks,
1
Table of Contents
securities firms and insurance companies beginning March 11, 2000. As a result of Gramm Leach, many of the depression-era laws that restricted these affiliations and other activities that may be engaged in by banks and bank holding companies were repealed. Under Gramm-Leach, bank holding companies are permitted to offer their customers virtually any type of financial service that is financial in nature or incidental thereto, including banking, securities underwriting, insurance (both underwriting and agency) and merchant banking.
In order to engage in these financial activities, a bank holding company must qualify and register with the Federal Reserve Board as a “financial holding company” by demonstrating that each of its bank subsidiaries is “well capitalized,” “well managed,” and has at least a “satisfactory” rating under the Community Reinvestment Act of 1977 (the “CRA”). The Company has not elected to become a financial holding company under Gramm-Leach.
These financial activities authorized by Gramm-Leach may also be engaged in by a “financial subsidiary” of a national or state bank, except for insurance or annuity underwriting, insurance company portfolio investments, real estate investment and development and merchant banking, which must be conducted in a financial holding company. In order for the new financial activities to be engaged in by a financial subsidiary of a national or state bank, Gramm-Leach requires each of the parent bank (and any bank affiliates) to be “well capitalized” and “well managed;” the aggregate consolidated assets of all of that bank’s financial subsidiaries may not exceed the lesser of 45% of its consolidated total assets or $50 billion; the bank must have at least a satisfactory CRA rating; and, if the bank is one of the 100 largest banks, it must meet certain financial rating or other comparable requirements. The Company does not currently conduct activities through a financial subsidiary.
Gramm-Leach establishes a system of functional regulation, under which the federal banking agencies will regulate the banking activities of financial holding companies and banks’ financial subsidiaries, the SEC will regulate their securities activities, and state insurance regulators will regulate their insurance activities. Gramm-Leach also provides new protections against the transfer and use by financial institutions of consumers’ nonpublic, personal information.
Holding Company Regulation
The Company is a bank holding company as defined by the Bank Holding Company Act of 1956, as amended (the “Holding Company Act”), and is registered as such with the Board of Governors of the Federal Reserve Bank (the “FRB”), which is responsible for administration of the Holding Company Act. Although the Company may meet the qualifications for electing to become a financial holding company under Gramm-Leach, the Company has elected to retain its pre-Gramm-Leach status for the present time under the Holding Company Act. As required by the Holding Company Act, the Company files with the FRB an annual report regarding its financial condition and operations, management and intercompany relationships of the Company and the Bank. It is also subject to examination by the FRB and must obtain FRB approval before (i) acquiring direct or indirect ownership or control of more than 5% of the voting stock of any bank, unless it already owns or controls a majority of the voting stock of that bank, (ii) acquiring all or substantially all of the assets of a bank, except through a subsidiary which is a bank, or (iii) merging or consolidating with any other bank holding company. A bank holding company must also give the FRB prior written notice before purchasing or redeeming its equity securities, if the gross consideration for the purchase or redemption, when aggregated with the net consideration paid by the company for all such purchases or redemptions during the preceding 12 months, is equal to 10% or more of the company’s consolidated net worth.
The Holding Company Act prohibits a bank holding company, with certain exceptions, from (i) acquiring direct or indirect ownership or control of more than 5% of any class of voting shares of any company which is not a bank or a bank holding company, or (ii) engaging in any activity other than managing or controlling banks, or furnishing services to or performing services for its subsidiaries. A bank holding company may own, however, shares of a company engaged in activities which the FRB has determined are so closely related to banking or managing or controlling banks as to be a proper incident thereto.
2
Table of Contents
The Company and its subsidiaries are examined by federal and state regulators. The FRB has regulatory authority over holding company activities and performed a review of the Company and its subsidiaries as of September 2017.
USA PATRIOT Act
Under Title III of the USA PATRIOT Act, also known as the “International Money Laundering Abatement and Anti-Terrorism Act of 2001”, all financial institutions are required in general to identify their customers, adopt formal and comprehensive anti-money laundering programs, scrutinize or prohibit altogether certain transactions of special concern, and be prepared to respond to inquiries from U.S. law enforcement agencies concerning their customers and their transactions. Additional information-sharing among financial institutions, regulators, and law enforcement authorities is encouraged by the presence of an exemption from the privacy provisions of the Gramm-Leach Act for financial institutions that comply with this provision and the authorization of the Secretary of the Treasury to adopt rules to further encourage cooperation and information-sharing. The effectiveness of a financial institution in combating money laundering activities is a factor to be considered in any application submitted by the financial institution under the Holding Company Act or Bank Merger Act.
Sarbanes-Oxley Act
The Sarbanes-Oxley Act, signed into law July 30, 2002, addresses, among other issues, corporate governance, auditor independence and accounting standards, executive compensation, insider loans, whistleblower protection and enhanced and timely disclosure of corporate information. The SEC has adopted a substantial number of implementing rules and the Financial Industry Regulatory Authority (FINRA) has adopted corporate governance rules that have been approved by the SEC and are applicable to the Company. The changes are intended to allow stockholders to monitor more effectively the performance of companies and management. As directed by Section 302(a) of the Sarbanes-Oxley Act, the Company’s Chief Executive Officer and Chief Financial Officer are each required to certify that the Company’s quarterly and annual reports do not contain any untrue statement of a material fact. This requirement has several parts, including certification that these officers are responsible for establishing, maintaining and regularly evaluating the effectiveness of the Company’s disclosure controls and procedures and internal controls over financial reporting; that they have made certain disclosures to the Company’s auditors and the Board of Directors about the Company’s disclosure controls and procedures and internal control over financial reporting, and that they have included information in the Company’s quarterly and annual reports about their evaluation of the Company’s disclosure controls and procedures and internal control over financial reporting, and whether there have been significant changes in the Company’s internal disclosure controls and procedures or in other factors that could significantly affect such controls and procedures subsequent to the evaluation and whether there have been any significant changes in the Company’s internal control over financial reporting that have materially affected or reasonably likely to materially affect the Company’s internal control over financial reporting, and compliance with certain other disclosure objectives. Section 906 of the Sarbanes-Oxley Act requires an additional certification that each periodic report containing financial statements fully complies with the requirements of Section 13(a) and 15(d) of the Securities Exchange Act of 1934 and that the information in the report fairly presents, in all material respects, the financial conditions and results of operations of the Company.
Dodd-Frank Wall Street Reform and Consumer Protection Act
On July 21, 2010, the Dodd-Frank Wall Street Reform and Consumer Protection Act (the “D-F Act”) became law. The D-F Act was intended to address many issues arising in the recent financial crisis and is exceedingly broad in scope, affecting many aspects of bank and financial market regulation. The D-F Act requires, or permits by implementing regulation, enhanced prudential standards for banks and bank holding companies inclusive of capital, leverage, liquidity, concentration and exposure measures. In addition, traditional bank regulatory principles such as restrictions on transactions with affiliates and insiders were enhanced. The D-F Act also contains reforms of consumer mortgage lending practices and creates a Bureau of Consumer Financial Protection, which is granted broad authority over consumer financial practices of banks and others. It is expected as the specific new or incremental requirements applicable to the Company become effective that the costs and
3
Table of Contents
difficulties of remaining compliant with all such requirements will increase. The D-F Act broadened the base for FDIC assessments to average consolidated assets less tangible equity of financial institutions and also permanently raises the current standard maximum FDIC deposit insurance amount to $250,000. The Act extended unlimited deposit insurance on non-interest bearing transaction accounts through December 31, 2012.
In addition, the D-F Act added a new Section 13 to the Bank Holding Company Act, the so-called “Volcker Rule,” (the “Rule”) which generally restricts certain banking entities such as the Company and its subsidiaries or affiliates, from engaging in proprietary trading activities and owning equity in or sponsoring any private equity or hedge fund. The Rule became effective July 21, 2012. The final implementing regulations for the Rule were issued by various regulatory agencies in December 2013 and under an extended conformance regulation compliance was required to be achieved by July 21, 2015. The conformance period for investments in and relationships with certain “legacy covered funds” was extended to July 21, 2017. Under the Rule, the Company may be restricted from engaging in proprietary trading, investing in third party hedge or private equity funds or sponsoring new funds unless it qualifies for an exemption from the rule. The Company has little involvement in prohibited proprietary trading or investment activities in covered funds and the Company does not expect that complying with the requirements of the Rule will have any material effect on the Company’s financial condition or results of operation. The federal banking agencies have issued amendments to the Rule to provide greater clarity and certainty about what activities are prohibited and to improve the effective allocation of compliance resources, and to conform the Rule to the EGRRCPA (discussed below). The federal banking agencies have also issued a notice of proposed rulemaking to liberalize the covered fund rules.
Tax Cuts and Jobs Act
On December 22, 2017, the Tax Cuts and Jobs Act (the “Tax Act”) was enacted, which represents the most comprehensive reform to the U.S. tax code in over thirty years. The majority of the provisions of the Tax Act took effect on January 1, 2018. The Tax Act lowered the Company’s federal tax rate from 34% to 21%. Also, for tax years beginning after December 31, 2017, the corporate Alternative Minimum Tax (“AMT”) has been repealed. For 2018 through 2021, the AMT credit carryforward can offset regular tax liability and is refundable in an amount equal to 50% (100% for 2021) of the excess of the minimum tax credit for the tax year over the amount of the credit allowable for the year against regular tax liability. Accordingly, it is anticipated that the full amount of the alternative minimum tax credit carryforward will be recovered in tax years beginning before 2022. The Tax Act also contains other provisions that may affect the Company currently or in future years. Among these are changes to the deductibility of meals and entertainment, the deductibility of executive compensation, the dividend received deduction and net operating loss carryforwards. Tax Act changes for individuals include lower tax rates, mortgage interest and state and local tax limitations as well as an increase in the standard deduction, among others.
Economic Growth, Regulatory Relief, and Consumer Protection Act
On May 24, 2018, the Economic Growth, Regulatory Relief, and Consumer Protection Act, or the EGRRCPA, became law. This is arguably the most significant financial institution legislation since the D-F Act. The EGRRCPA changes certain of the regulatory requirements of the D-F Act and includes provisions intended to relieve the regulatory burden on “community banks.” Among other things, for qualifying community banks with less than $10 billion in total consolidated assets, the EGRRCPA contains a safe harbor from the D-F Act “ability to repay” mortgage requirements, an exemption from the Volcker Rule, may permit filing of simplified Call Reports, and potentially will result in some alleviation of the D-F Act and U.S. Basel III capital mandates. The EGRRCPA requires the federal banking agencies to develop a community bank leverage ratio (defined as the ratio of tangible equity capital to average total consolidated assets) for banks and holding companies with total consolidated assets of less than $10 billion and an appropriate risk profile. The required regulations must specify a minimum community bank leverage ratio of not less than 8% and not more than 10%. The federal banking agencies jointly issued a final rule, effective January 1, 2020, which would set the minimum ratio at 9%. Qualifying banks that exceed the minimum community bank leverage ratio will be deemed to be in compliance
4
Table of Contents
with all other capital and leverage requirements including the capital ratio requirements that are required to be considered well capitalized under Section 38 of Federal Deposit Insurance Act.
Deposit Insurance Premiums
The Bank’s deposits have the benefit of FDIC insurance up to applicable limits. The FDIC’s Deposit Insurance Fund is funded by assessments on insured depository institutions, which depend on the risk category of an institution and the amount of assets that it holds. The FDIC may increase or decrease the assessment rate schedule on a semi-annual basis.
On September 29, 2009, the FDIC adopted a Notice of Proposed Rulemaking (NPR) that required insured institutions to prepay their estimated quarterly risk-based assessments for the fourth quarter of 2009 and for all of 2010, 2011 and 2012. The FDIC Board voted to adopt a uniform three-basis point increase in assessment rates effective on January 1, 2011 and extend the restoration period from seven to eight years. This rule was finalized on November 2, 2009. The Company’s quarterly risk-based deposit insurance assessments were paid from this amount until June 30, 2013. The Company received a refund of $2.4 million of prepaid FDIC assessments in June 2013.
In February 2011, the FDIC approved a rule to change the assessment base from adjusted domestic deposits to average consolidated total assets minus average tangible equity. The rule has kept the overall amount collected from the industry very close to the amount collected prior to the new calculation.
In December 2018, the FDIC issued a final rule to implement the EGRRCPA providing a limited exception for a capped amount of reciprocal deposits from treatment as brokered deposits for qualifying institutions.
On January 24, 2019, the FDIC notified the Company that $1.2 million of small bank assessment credits were available to offset quarterly FDIC assessment charges. The FDIC Deposit Insurance Fund Reserve Ratio reached 1.40% as of June 30, 2019, and the FDIC first applied small bank credits on the September 30, 2019 assessment invoice (for the second quarter of 2019). The FDIC will continue to apply small bank credits so long as the Reserve Ratio is at least 1.35%. After applying small bank credits for four quarters, the FDIC will remit the value of any remaining small bank credits in the next assessment period in which the Reserve Ratio is at least 1.35%. The Company’s remaining small bank assessment credit was $485,000 on December 31, 2019.
Risk-Based Capital Guidelines
Federal banking regulators have issued risk-based capital guidelines, which assign risk factors to asset categories and off-balance-sheet items. Also, the Basel Committee has issued capital standards entitled “Basel III: A global regulatory framework for more resilient banks and banking systems” (“Basel III”). The Federal Reserve Board has finalized its rule implementing the Basel III regulatory capital framework. The rule that came into effect in January 2015 sets the Basel III minimum regulatory capital requirements for all organizations. It included a new common equity Tier I ratio of 4.5 percent of risk-weighted assets, raised the minimum Tier I capital ratio from 4 percent to 6 percent of risk-weighted assets and would set a new conservation buffer of 2.5 percent of risk-weighted assets. The implementation of the framework did not have a material impact on the Company’s financial condition or results of operations.
Competition
The Company experiences substantial competition in attracting deposits and making loans from commercial banks, thrift institutions and other enterprises such as insurance companies and mutual funds. These competitors include several major commercial banks whose greater resources may afford them a competitive advantage by enabling them to maintain numerous branch offices and mount extensive advertising campaigns. A number of these competitors are not subject to the regulatory oversight that the Company is subject to, which increases these competitors’ flexibility.
5
Table of Contents
Forward-Looking Statements
Certain statements contained herein are not based on historical facts and are “forward-looking statements” within the meaning of Section 21A of the Securities Exchange Act of 1934. Forward-looking statements, which are based on various assumptions (some of which are beyond the Company’s control), may be identified by reference to a future period or periods, or by the use of forward-looking terminology, such as “may,” “will,” “believe,” “expect,” “estimate,” “anticipate,” “continue” or similar terms or variations on those terms, or the negative of these terms. Actual results could differ materially from those set forth in forward-looking statements due to a variety of factors, including, but not limited to, those related to the economic environment, particularly in the market areas in which the Company operates, competitive products and pricing, fiscal and monetary policies of the U.S. Government, changes in government regulations affecting financial institutions, including regulatory fees and capital requirements, changes in prevailing interest rates, acquisitions and the integration of acquired businesses, credit risk management, asset/liability management, the financial and securities markets, and the availability of and costs associated with sources of liquidity. The Company does not undertake, and specifically disclaims any obligation, to publicly release the result of any revisions which may be made to any forward-looking statements to reflect the occurrence of anticipated or unanticipated events or circumstances after the date of such statements.
| ITEM 1A. | RISK FACTORS |
The risk factors that may affect the Company’s performance and results of operations include the following:
| i. | the Company’s business is dependent upon general economic conditions in Massachusetts, New Hampshire, Rhode Island, Connecticut, and New York. The national and local economies may adversely affect the Company’s performance and results of operations; |
| ii. | the Company’s earnings depend, to a great extent, upon the level of net interest income generated by the Company, and therefore the Company’s results of operations may be adversely affected by increases or decreases in interest rates or by the shape of the yield curve; |
| iii. | the banking business is highly competitive and the profitability of the Company depends upon the Company’s ability to attract loans and deposits in Massachusetts, New Hampshire, Rhode Island, Connecticut, and New York, where the Company competes with a variety of traditional banking companies, some of which have vastly greater resources, and nontraditional institutions such as credit unions and finance companies; |
| iv. | at December 31, 2019, approximately 65.9% of the Company’s loan portfolio was comprised of commercial and commercial real estate loans, exposing the Company to the risks inherent in financings based upon analyses of credit risk, the value of underlying collateral, including real estate, and other more intangible factors, which are considered in making commercial loans; |
| v. | at December 31, 2019, approximately 27.9% of the Company’s loan portfolio was comprised of residential real estate and home equity loans, exposing the Company to the risks inherent in financings based upon analyses of credit risk and the value of underlying collateral. Accordingly, the Company’s profitability may be negatively impacted by errors in risk analyses, by loan defaults and the ability of certain borrowers to repay such loans may be adversely affected by any downturn in general economic conditions; |
| vi. | economic conditions and interest rate risk could adversely impact the fair value and the ultimate collectibility of the Company’s investments. Should an investment be deemed “other than temporarily impaired”, the Company would be required to write-down the carrying value of the investment through earnings. Such write-down(s) may have a material adverse effect on the Company’s financial condition and results of operations; |
| vii. | write-down of goodwill and other identifiable intangible assets would negatively impact our financial condition and results of operations. At December 31, 2019, our goodwill and other identifiable intangible assets were approximately $2.7 million; |
6
Table of Contents
| viii. | natural disasters can disrupt our operations, result in damage to the Company’s properties, reduce or destroy the value of the collateral for the Company’s loans and negatively affect the economies in which the Company operates, which could have a material adverse effect on the Company’s results of operations and financial condition. A significant natural disaster, such as a tornado, hurricane, earthquake, fire or flood, could have a material adverse impact on the Company’s ability to conduct business, and the Company’s insurance coverage may be insufficient to compensate for losses that may occur. Acts of terrorism, war, civil unrest or pandemics, including COVID 19, could cause disruptions to the Company’s business or the economy as a whole. While the Company has established and regularly test disaster recovery procedures, the occurrence of any such event could have a material adverse effect on the Company’s business, operations and financial condition. |
| ix. | changes in the extensive laws, regulations and policies governing companies generally and bank holding companies and their subsidiaries, such as the Act and the Tax Act, could alter the Company’s business environment or affect the Company’s operations; |
| x. | the potential need to adapt to industry changes in information technology systems, on which the Company is highly dependent to secure bank and customer financial information, could present operational issues, require significant capital spending or impact the Company’s reputation; |
| xi. | in the ordinary course of our business, we collect and store sensitive data, including intellectual property, our proprietary business information and that of our customers, and business partners, and personally identifiable information of our customers and employees, in our data centers and on our networks. The secure processing, maintenance and transmission of this information is critical to our operations and business strategy. Despite our security measures, our information technology and infrastructure may be vulnerable to attacks by hackers or breached due to employee error, malfeasance or other disruptions. Any such breach could compromise our networks and the information stored there could be accessed, publicly disclosed, lost or stolen. Any such access, disclosure or other loss of information could result in legal claims or proceedings, liability under laws that protect the privacy of personal information, and regulatory penalties, disrupt our operations and the services we provide to customers, and damage our reputation, and cause a loss of confidence in our products and services, which could adversely affect our results of operations and competitive position; |
| xii. | the Company’s loan customers may not repay loans according to their terms, and the collateral securing the payment of loans may be insufficient to assure repayment or cover losses. If loan customers fail to repay loans according to the terms of the loans, the Company may experience significant credit losses which could have a material adverse effect on its operating results and capital ratios; |
| xiii. | the Company is subject to extensive regulation, supervision and examination. Any change in the laws or regulations or failure by the Company to comply with applicable law and regulation, or a change in regulators’ supervisory policies or examination procedures, whether by the Massachusetts Commissioner of Banks, the FDIC, the Federal Reserve Board, other state or federal regulators, the United States Congress, or the Massachusetts legislature could have a material adverse effect on the Company’s business, financial condition, results of operations, and cash flows. Changes in accounting policies, practices and standards, as may be adopted by the regulatory agencies as well as the Public Company Accounting Oversight Board, the Financial Accounting Standards Board, and other accounting standard setters, could also impact the Company’s financial results; and |
These factors, as well as general economic and market conditions in the United States of America, may materially and adversely affect the Company’s performance, results of operations and the market price of shares of the Company’s Class A common stock.
| ITEM 1B. | UNRESOLVED STAFF COMMENTS |
No written comments received by the Company from the SEC regarding the Company’s periodic or current reports remain unresolved.
7
Table of Contents
| ITEM 2. | PROPERTIES |
The Company owns its main banking office, headquarters, and operations center in Medford, Massachusetts, which were expanded in 2004, and 11 of the 26 other facilities in which its branch offices are located. The remaining offices are occupied under leases expiring on various dates from 2020 to 2028. The Company believes that its banking offices are in good condition.
During the third quarter of 2019, the Company purchased the existing Boylston Street, Brookline branch location that the Company was leasing. Also, during the third quarter, the Company purchased a future branch location in Salem, New Hampshire. The Company plans to open this branch during the fourth quarter of 2020.
| ITEM 3. | LEGAL PROCEEDINGS |
The Company and its subsidiaries are parties to various claims and lawsuits arising in the course of their normal business activities. Although the ultimate outcome of these suits cannot be ascertained at this time, it is the opinion of management that none of these matters, even if it resolved adversely to the Company, will have a material adverse effect on the Company’s consolidated financial position.
| ITEM 4. | MINE SAFETY DISCLOSURES |
Not applicable.
8
Table of Contents
PART II
| ITEM 5. | MARKET FOR REGISTRANT’S COMMON EQUITY, RELATED STOCKHOLDER MATTERS AND ISSUER PURCHASES OF EQUITY SECURITIES |
| (a) | The Class A Common Stock of the Company is traded on the NASDAQ National Global Market under the symbol “CNBKA.” The Company’s Class B Common Stock is not traded on any national securities exchange or other public trading market. |
The shares of Class A Common Stock are generally not entitled to vote on any matter, including in the election of Company Directors, but, in limited circumstances, may be entitled to vote as a class on certain extraordinary transactions, including any merger or consolidation (other than one in which the Company is the surviving corporation or one which by law may be approved by the directors without any stockholder vote) or the sale, lease, or exchange of all or substantially all of the property and assets of the Company. Since the vote of a majority of the shares of the Company’s Class B Common Stock, voting as a separate class, is required to approve certain extraordinary corporate transactions, the holders of Class B Common Stock have the power to prevent any takeover of the Company not approved by them.
| (b) | Approximate number of equity security holders as of December 31, 2019: |
| Title of Class |
Approximate Number of Record Holders |
|||
| Class A Common Stock |
900 | |||
| Class B Common Stock |
150 | |||
| (c) | The following schedule provides information with respect to the Company’s equity compensation plans under which shares of Class A Common Stock are authorized for issuance as of December 31, 2019: |
| Equity Compensation Plan Information | ||||||||||||
| Plan Category |
Number of Shares to be Issued Upon Exercise of Outstanding Options (a) |
Weighted-Average Exercise Price of Outstanding Options (b) |
Number of Shares Remaining Available for Future Issuance Under Equity Compensation Plans (Excluding Shares Reflected in Column (a)) (c) |
|||||||||
| Equity compensation plans approved by security holders |
— | $ | — | 233,934 | ||||||||
| Equity compensation plans not approved by security holders |
— | — | — | |||||||||
|
|
|
|
|
|
|
|||||||
| Total |
— | $ | — | 233,934 | ||||||||
| (d) | The performance graph information required herein is shown on page 10. |
| ITEM 6. | SELECTED FINANCIAL DATA |
The information required herein is shown on pages 12 through 14.
| ITEM 7. | MANAGEMENT’S DISCUSSION AND ANALYSIS OF RESULTS OF OPERATIONS AND FINANCIAL CONDITION |
The information required herein is shown on pages 15 through 38.
9
Table of Contents
| ITEM 7A. | QUANTITATIVE AND QUALITATIVE DISCLOSURES ABOUT MARKET RISK |
The information required herein is shown on page 35.
| ITEM 8. | FINANCIAL STATEMENTS AND SUPPLEMENTARY DATA |
The information required herein is shown on pages 39 through 92.
| ITEM 9. | CHANGES IN AND DISAGREEMENTS WITH ACCOUNTANTS ON ACCOUNTING AND FINANCIAL DISCLOSURE |
None.
| ITEM 9A. | CONTROLS AND PROCEDURES |
The Company’s principal executive officer and principal financial officer have evaluated the Company’s disclosure controls and procedures as of December 31, 2019. Based on this evaluation, the principal executive officer and principal financial officer have concluded that the Company’s disclosure controls and procedures are effective. The Company’s disclosure controls and procedures also effectively ensure that information required to be disclosed in the Company’s filings and submissions with the Securities and Exchange Commission under the Securities Exchange Act of 1934 is accumulated and reported to Company management (including the principal executive officer and principal financial officer) and is recorded, processed, summarized and reported within the time periods specified by the Securities and Exchange Commission. In addition, the Company has reviewed its internal control over financial reporting and there have been no changes that occurred during the fourth fiscal quarter that have materially affected, or are reasonably likely to materially affect its internal control over financial reporting or in other factors that could significantly affect its internal control over financial reporting.
On May 14, 2013, the Committee of Sponsoring Organizations of the Treadway Commission (COSO) released an updated version of its Internal Control — Integrated Framework (2013) (2013 Framework). The 2013 Framework’s internal control components (i.e., control environment, risk assessment, control activities, information and communication, and monitoring activities) remain predominantly the same as those in the 1992 Framework. However, the 2013 Framework was expanded to include 17 principles which must be present and functioning in order to have an effective system of internal controls. The Company implemented the 2013 Framework effective December 31, 2014.
Management’s report on internal control over financial reporting is shown on page 96. The audit report of the registered public accounting firm is shown on page 94.
| ITEM 9B. | OTHER INFORMATION |
None.
10
Table of Contents
Table of Contents
| 2019 | 2018 | 2017 | 2016 | 2015 | ||||||||||||||||
| (dollars in thousands, except share data) |
||||||||||||||||||||
| FOR THE YEAR |
||||||||||||||||||||
| Interest income |
$ | 159,139 | $ | 137,056 | $ | 113,436 | $ | 96,699 | $ | 90,093 | ||||||||||
| Interest expense |
63,350 | 44,480 | 27,820 | 22,617 | 20,134 | |||||||||||||||
|
|
|
|
|
|
|
|
|
|
|
|||||||||||
| Net interest income |
95,789 | 92,576 | 85,616 | 74,082 | 69,959 | |||||||||||||||
| Provision for loan losses |
1,250 | 1,350 | 1,790 | 1,375 | 200 | |||||||||||||||
|
|
|
|
|
|
|
|
|
|
|
|||||||||||
| Net interest income after provision for loan losses |
94,539 | 91,226 | 83,826 | 72,707 | 69,759 | |||||||||||||||
| Other operating income |
18,399 | 16,248 | 16,552 | 16,222 | 15,993 | |||||||||||||||
| Operating expenses |
72,129 | 69,693 | 67,119 | 64,757 | 62,198 | |||||||||||||||
|
|
|
|
|
|
|
|
|
|
|
|||||||||||
| Income before income taxes |
40,809 | 37,781 | 33,259 | 24,172 | 23,554 | |||||||||||||||
| Provision for income taxes |
1,110 | 1,568 | 10,958 | (362 | ) | 533 | ||||||||||||||
|
|
|
|
|
|
|
|
|
|
|
|||||||||||
| Net income |
$ | 39,699 | $ | 36,213 | $ | 22,301 | $ | 24,534 | $ | 23,021 | ||||||||||
|
|
|
|
|
|
|
|
|
|
|
|||||||||||
| Core earnings—Non-GAAP (1) |
$ | 39,699 | $ | 36,213 | $ | 30,749 | $ | 24,534 | $ | 23,021 | ||||||||||
|
|
|
|
|
|
|
|
|
|
|
|||||||||||
| Average shares outstanding Class A, basic |
3,633,044 | 3,608,179 | 3,604,029 | 3,600,729 | 3,600,729 | |||||||||||||||
| Average shares outstanding Class B, basic |
1,934,865 | 1,959,730 | 1,963,880 | 1,967,180 | 1,967,180 | |||||||||||||||
| Average shares outstanding Class A, diluted |
5,567,909 | 5,567,909 | 5,567,909 | 5,567,909 | 5,567,909 | |||||||||||||||
| Average shares outstanding Class B, diluted |
1,934,865 | 1,959,730 | 1,963,880 | 1,967,180 | 1,967,180 | |||||||||||||||
| Total shares outstanding at year-end |
5,567,909 | 5,567,909 | 5,567,909 | 5,567,909 | 5,567,909 | |||||||||||||||
| Earnings per share: |
||||||||||||||||||||
| Basic, Class A |
$ | 8.63 | $ | 7.89 | $ | 4.86 | $ | 5.35 | $ | 5.02 | ||||||||||
| Basic, Class B |
$ | 4.31 | $ | 3.95 | $ | 2.43 | $ | 2.68 | $ | 2.51 | ||||||||||
| Diluted, Class A |
$ | 7.13 | $ | 6.50 | $ | 4.01 | $ | 4.41 | $ | 4.13 | ||||||||||
| Diluted, Class B |
$ | 4.31 | $ | 3.95 | $ | 2.43 | $ | 2.68 | $ | 2.51 | ||||||||||
| Dividend payout ratio—Non-GAAP (1) |
5.6 | % | 6.1 | % | 9.9 | % | 9.0 | % | 9.6 | % | ||||||||||
| AT YEAR-END |
||||||||||||||||||||
| Assets |
$ | 5,492,424 | $ | 5,163,935 | $ | 4,785,572 | $ | 4,462,608 | $ | 3,947,441 | ||||||||||
| Loans |
2,426,119 | 2,285,578 | 2,175,944 | 1,923,933 | 1,731,536 | |||||||||||||||
| Deposits |
4,400,111 | 4,406,964 | 3,916,967 | 3,653,218 | 3,075,060 | |||||||||||||||
| Stockholders’ equity |
332,581 | 300,439 | 260,297 | 240,041 | 214,544 | |||||||||||||||
| Book value per share |
$ | 59.73 | $ | 53.96 | $ | 46.75 | $ | 43.11 | $ | 38.53 | ||||||||||
| SELECTED FINANCIAL PERCENTAGES |
||||||||||||||||||||
| Return on average assets |
0.76 | % | 0.74 | % | 0.48 | % | 0.57 | % | 0.59 | % | ||||||||||
| Return on average stockholders’ equity |
12.44 | % | 13.05 | % | 8.75 | % | 10.80 | % | 11.26 | % | ||||||||||
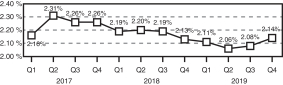
| Net interest margin, taxable equivalent |
2.10 | % | 2.18 | % | 2.25 | % | 2.12 | % | 2.18 | % | ||||||||||
| Net charge-offs (recoveries) as a percent of average loans |
0.01 | % | (0.04 | )% | 0.00 | % | 0.00 | % | (0.04 | )% | ||||||||||
| Average stockholders’ equity to average assets |
6.12 | % | 5.71 | % | 5.50 | % | 5.29 | % | 5.25 | % | ||||||||||
| Efficiency ratio—Non-GAAP (1) |
58.4 | % | 59.2 | % | 57.8 | % | 62.7 | % | 64.1 | % | ||||||||||
| (1) | Non-GAAP Financial Measures are reconciled in the following tables: |
12
Table of Contents
Financial Highlights
| 2019 | 2018 | 2017 | 2016 | 2015 | ||||||||||||||||
| Calculation of Efficiency Ratio: |
||||||||||||||||||||
| Total Operating Expenses |
$ | 72,129 | $ | 69,693 | $ | 67,119 | $ | 64,757 | $ | 62,198 | ||||||||||
| Less: Other Real Estate Owned Expenses |
(134 | ) | (59 | ) | — | — | — | |||||||||||||
|
|
|
|
|
|
|
|
|
|
|
|||||||||||
| Total Adjusted Operating Expenses (numerator) |
$ | 71,995 | $ | 69,634 | $ | 67,119 | $ | 64,757 | $ | 62,198 | ||||||||||
|
|
|
|
|
|
|
|
|
|
|
|||||||||||
| Net Interest Income |
95,789 | 92,576 | 85,616 | 74,082 | 69,959 | |||||||||||||||
| Total Other Operating Income |
18,399 | 16,248 | 16,552 | 16,222 | 15,993 | |||||||||||||||
| Tax Equivalent Adjustment |
9,068 | 8,854 | 13,979 | 12,917 | 11,140 | |||||||||||||||
|
|
|
|
|
|
|
|
|
|
|
|||||||||||
| Total Income (denominator) |
$ | 123,256 | $ | 117,678 | $ | 116,147 | $ | 103,221 | $ | 97,092 | ||||||||||
|
|
|
|
|
|
|
|
|
|
|
|||||||||||
| Efficiency Ratio, Year—Non-GAAP |
58.4 | % | 59.2 | % | 57.8 | % | 62.7 | % | 64.1 | % | ||||||||||
|
|
|
|
|
|
|
|
|
|
|
|||||||||||
| 2019 | 2018 | 2017 | 2016 | 2015 | ||||||||||||||||
| Calculation of Dividend Payout Ratio: |
||||||||||||||||||||
| Dividends Paid (numerator) |
$ | 2,207 | $ | 2,203 | $ | 2,200 | $ | 2,201 | $ | 2,200 | ||||||||||
|
|
|
|
|
|
|
|
|
|
|
|||||||||||
| Net Income (denominator) |
$ | 39,699 | $ | 36,213 | $ | 22,301 | $ | 24,534 | $ | 23,021 | ||||||||||
|
|
|
|
|
|
|
|
|
|
|
|||||||||||
| Dividend Payout Ratio—Non-GAAP |
5.6 | % | 6.1 | % | 9.9 | % | 9.0 | % | 9.6 | % | ||||||||||
|
|
|
|
|
|
|
|
|
|
|
|||||||||||
| 2019 | 2018 | 2017 | 2016 | 2015 | ||||||||||||||||
| Calculation of Core Earnings: |
||||||||||||||||||||
| Net Income |
$ | 39,699 | $ | 36,213 | $ | 22,301 | $ | 24,534 | $ | 23,021 | ||||||||||
|
|
|
|
|
|
|
|
|
|
|
|||||||||||
| Add: Deferred Tax Remeasurement Charge |
— | — | 8,448 | — | — | |||||||||||||||
|
|
|
|
|
|
|
|
|
|
|
|||||||||||
| Core earnings—Non-GAAP |
$ | 39,699 | $ | 36,213 | $ | 30,749 | $ | 24,534 | $ | 23,021 | ||||||||||
|
|
|
|
|
|
|
|
|
|
|
|||||||||||
The stock performance graph below compares the cumulative total shareholder return of the Company’s Class A Common Stock from December 31, 2014 to December 31, 2019 with the cumulative total return of the NASDAQ Market Index (U.S. Companies) and the NASDAQ Bank Stock Index. The lines in the graph represent monthly index levels derived from compounded daily returns that include all dividends. If the monthly interval, based on the fiscal year-end, was not a trading day, the preceding trading day was used.
13
Table of Contents
Financial Highlights
Comparison of Five-Year
Cumulative Total Return*
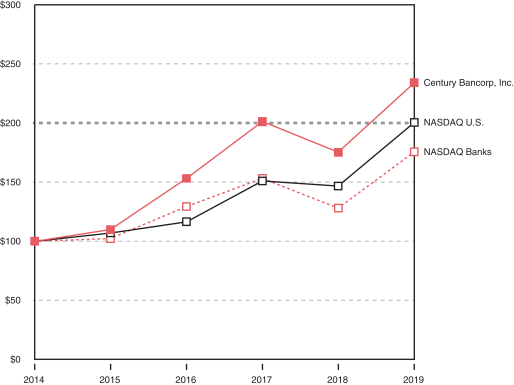
| Value of $100 Invested on December 31, 2014 at: |
2015 | 2016 | 2017 | 2018 | 2019 | |||||||||||||||
| Century Bancorp, Inc. |
$ | 109.76 | $ | 153.14 | $ | 201.10 | $ | 175.20 | $ | 234.04 | ||||||||||
| NASDAQ Banks |
102.21 | 129.34 | 153.13 | 128.02 | 175.61 | |||||||||||||||
| NASDAQ U.S. |
106.96 | 116.45 | 150.96 | 146.67 | 200.49 | |||||||||||||||
| * | Assumes that the value of the investment in the Company’s Common Stock and each index was $100 on December 31, 2014 and that all dividends were reinvested. |
14
Table of Contents
Table of Contents
Management’s Discussion and Analysis of Results of Operations and Financial Condition
16
Table of Contents
Management’s Discussion and Analysis of Results of Operations and Financial Condition
17
Table of Contents
Management’s Discussion and Analysis of Results of Operations and Financial Condition
18
Table of Contents
Management’s Discussion and Analysis of Results of Operations and Financial Condition
19
Table of Contents
Management’s Discussion and Analysis of Results of Operations and Financial Condition
The following table sets forth the fair value and percentage distribution of securities available-for-sale at the dates indicated.
Fair Value of Securities Available-for-Sale
| At December 31, | 2019 | 2018 | 2017 | |||||||||||||||||||||
| Amount | Percent | Amount | Percent | Amount | Percent | |||||||||||||||||||
| (dollars in thousands) | ||||||||||||||||||||||||
| U.S. Treasury |
$ | — | 0.0 | % | $ | 1,992 | 0.6 | % | $ | 1,984 | 0.5 | % | ||||||||||||
| U.S. Government Sponsored Enterprises |
— | 0.0 | % | 3,915 | 1.2 | % | — | 0.0 | % | |||||||||||||||
| SBA Backed Securities |
54,211 | 20.8 | % | 70,194 | 20.9 | % | 80,950 | 20.5 | % | |||||||||||||||
| U.S. Government Agency and Sponsored Enterprises Mortgage-Backed Securities |
184,187 | 70.7 | % | 162,890 | 48.4 | % | 225,775 | 57.0 | % | |||||||||||||||
| Privately Issued Residential Mortgage-Backed Securities |
396 | 0.2 | % | 672 | 0.2 | % | 892 | 0.2 | % | |||||||||||||||
| Obligations Issued by States and Political Subdivisions |
18,076 | 6.9 | % | 93,503 | 27.7 | % | 82,600 | 20.9 | % | |||||||||||||||
| Other Debt Securities |
3,632 | 1.4 | % | 3,593 | 1.0 | % | 3,629 | 0.9 | % | |||||||||||||||
|
|
|
|
|
|
|
|
|
|
|
|
|
|||||||||||||
| Total |
$ | 260,502 | 100.0 | % | $ | 336,759 | 100.0 | % | $ | 395,830 | 100.0 | % | ||||||||||||
|
|
|
|
|
|
|
|
|
|
|
|
|
|||||||||||||
The majority of the Company’s securities AFS are classified as Level 2, as defined in Note 1 of the “Notes to Consolidated Financial Statements.” The fair values of these securities are obtained from a pricing service, which provides the Company with a description of the inputs generally utilized for each type of security. These inputs include benchmark yields, reported trades, broker/dealer quotes, issuer spreads, two-sided markets, benchmark securities, bids, offers and reference data. Management’s understanding of a pricing service’s pricing methodologies includes obtaining an understanding of the valuation risks, assessing its qualification, verification of sources of information and processes used to develop prices and identifying, documenting, and testing controls. Management’s validation of a vendor’s pricing methodology includes establishing internal controls to determine that the pricing information received by a pricing service and used by management in the valuation process is relevant and reliable. Market indicators and industry and economic events are also monitored. The decline in fair value from amortized cost for individual available-for-sale securities that are temporarily impaired is not attributable to changes in credit quality. Because the Company does not intend to sell any of its debt securities and it is not more likely than not that it will be required to sell the debt securities before the anticipated recovery of their remaining amortized cost, the Company does not consider these investments to be other-than-temporarily impaired at December 31, 2019.
Securities available-for-sale totaling $13,301,000, or 0.2% of assets, are classified as Level 3, as defined in Note 1 of the “Notes to Consolidated Financial Statements.” These securities are generally municipal securities with no readily determinable fair value. The Company also utilizes internal pricing analysis on various municipal securities using market rates on comparable securities. The securities are carried at fair value with periodic review of underlying financial statements and credit ratings to assess the appropriateness of these valuations.
Debt securities of Government Sponsored Enterprises refer primarily to debt securities of Fannie Mae and Freddie Mac.
20
Table of Contents
Management’s Discussion and Analysis of Results of Operations and Financial Condition
The following table sets forth the amortized cost and percentage distribution of securities held-to-maturity at the dates indicated.
Amortized Cost of Securities Held-to-Maturity
| At December 31, | 2019 | 2018 | 2017 | |||||||||||||||||||||
| Amount | Percent | Amount | Percent | Amount | Percent | |||||||||||||||||||
| (dollars in thousands) | ||||||||||||||||||||||||
| U.S. Treasury |
$ | — | 0.0 | % | $ | 9,960 | 0.5 | % | $ | — | 0.0 | % | ||||||||||||
| U.S. Government Sponsored Enterprises |
98,867 | 4.2 | % | 234,228 | 11.5 | % | 104,653 | 6.2 | % | |||||||||||||||
| SBA Backed Securities |
44,379 | 1.9 | % | 52,051 | 2.5 | % | 57,235 | 3.4 | % | |||||||||||||||
| U.S. Government Sponsored Enterprise Mortgage-Backed Securities |
2,207,874 | 93.9 | % | 1,750,408 | 85.5 | % | 1,539,345 | 90.4 | % | |||||||||||||||
|
|
|
|
|
|
|
|
|
|
|
|
|
|||||||||||||
| Total |
$ | 2,351,120 | 100.0 | % | $ | 2,046,647 | 100.0 | % | $ | 1,701,233 | 100.0 | % | ||||||||||||
|
|
|
|
|
|
|
|
|
|
|
|
|
|||||||||||||
The following two tables set forth contractual maturities of the Bank’s securities portfolio at December 31, 2019. Actual maturities may differ from contractual maturities because borrowers may have the right to call or prepay obligations with or without call or prepayment penalties.
Fair Value of Securities Available-for-Sale Amounts Maturing
| Within One Year |
% of Total |
Weighted Average Yield |
One Year to Five Years |
% of Total |
Weighted Average Yield |
Five Years to Ten Years |
% of Total |
Weighted Average Yield |
Over Ten Years |
% of Total |
Weighted Average Yield |
Total | % of Total |
Weighted Average Yield |
||||||||||||||||||||||||||||||||||||||||||||||
| (dollars in thousands) | ||||||||||||||||||||||||||||||||||||||||||||||||||||||||||||
| U.S. Treasury |
$ | — | 0.0 | % | 0.00 | % | $ | — | 0.0 | % | 0.00 | % | $ | — | 0.0 | % | 0.00 | % | $ | — | 0.0 | % | 0.00 | % | $ | — | 0.0 | % | 0.00 | % | ||||||||||||||||||||||||||||||
| U.S. Government Sponsored Enterprises |
— | 0.0 | % | |||||||||||||||||||||||||||||||||||||||||||||||||||||||||
| SBA Backed Securities |
— | 0.0 | % | 0.00 | % | 33,796 | 13.0 | % | 1.97 | % | 15,598 | 6.0 | % | 2.23 | % | 4,817 | 1.8 | % | 2.26 | % | 54,211 | 20.8 | % | 2.07 | % | |||||||||||||||||||||||||||||||||||
| U.S. Government Agency and Sponsored Enterprise Mortgage-Backed Securities |
164 | 0.1 | % | 2.14 | % | 77,472 | 29.7 | % | 2.16 | % | 106,551 | 40.9 | % | 2.27 | % | — | 0.0 | % | 0.00 | % | 184,187 | 70.7 | % | 2.22 | % | |||||||||||||||||||||||||||||||||||
| Privately Issued Residential Mortgage-Backed Securities |
396 | 0.2 | % | 2.20 | % | — | 0.0 | % | 0.00 | % | — | 0.0 | % | 0.00 | % | — | 0.0 | % | 0.00 | % | 396 | 0.2 | % | 2.20 | % | |||||||||||||||||||||||||||||||||||
| Obligations of States and Political Subdivisions |
17,616 | 6.7 | % | 2.48 | % | 385 | 0.1 | % | 3.92 | % | 75 | 0.1 | % | 4.04 | % | — | 0.0 | % | 0.00 | % | 18,076 | 6.9 | % | 2.24 | % | |||||||||||||||||||||||||||||||||||
| Other Debt Securities |
300 | 0.1 | % | 1.92 | % | 1,282 | 0.6 | % | 2.08 | % | 2,050 | 0.7 | % | 6.00 | % | — | 0.0 | % | 0.00 | % | 3,632 | 1.4 | % | 4.24 | % | |||||||||||||||||||||||||||||||||||
|
|
|
|
|
|
|
|
|
|
|
|
|
|
|
|
|
|
|
|
|
|
|
|
|
|
|
|
|
|
|
|||||||||||||||||||||||||||||||
| Total |
$ | 18,476 | 7.1 | % | 2.46 | % | $ | 112,935 | 43.4 | % | 2.11 | % | $ | 124,274 | 47.7 | % | 2.33 | % | $ | 4,817 | 1.8 | % | 2.26 | % | $ | 260,502 | 100.0 | % | 2.22 | % | ||||||||||||||||||||||||||||||
|
|
|
|
|
|
|
|
|
|
|
|
|
|
|
|
|
|
|
|
|
|
|
|
|
|
|
|
|
|
|
|||||||||||||||||||||||||||||||
21
Table of Contents
Management’s Discussion and Analysis of Results of Operations and Financial Condition
Amortized Cost of Securities Held-to-Maturity
Amounts Maturing
| Within One Year |
% of Total |
Weighted Average Yield |
One Year to Five Years |
% of Total |
Weighted Average Yield |
Five Years to Ten Years |
% of Total |
Weighted Average Yield |
Over Ten Years |
% of Total |
Weighted Average Yield |
Total | % of Total |
Weighted Average Yield |
||||||||||||||||||||||||||||||||||||||||||||||
| (dollars in thousands) | ||||||||||||||||||||||||||||||||||||||||||||||||||||||||||||
| U.S. Treasury |
$ | — | 0.0 | % | 0.00 | % | $ | — | 0.0 | % | 0.00 | % | $ | — | 0.0 | % | 0.00 | % | $ | — | 0.0 | % | 0.00 | % | $ | — | 0.0 | % | 0.00 | % | ||||||||||||||||||||||||||||||
| U.S. Government Sponsored Enterprises |
34,934 | 1.5 | % | 2.33 | % | 63,933 | 2.7 | % | 2.48 | % | — | 0.0 | % | 0.00 | % | — | 0.0 | % | 0.00 | % | 98,867 | 4.2 | % | 2.43 | % | |||||||||||||||||||||||||||||||||||
| SBA Backed Securities |
— | 0.0 | % | 0.00 | % | 6,782 | 0.3 | % | 1.82 | % | 37,597 | 1.6 | % | 2.40 | % | — | 0.0 | % | 0.00 | % | 44,379 | 1.9 | % | 2.31 | % | |||||||||||||||||||||||||||||||||||
| U.S. Government Sponsored Enterprise Mortgage- Backed Securities |
38,642 | 1.6 | % | 2.51 | % | 1,820,328 | 77.5 | % | 2.60 | % | 336,474 | 14.3 | % | 2.60 | % | 12,430 | 0.5 | % | 2.81 | % | 2,207,874 | 93.9 | % | 2.60 | % | |||||||||||||||||||||||||||||||||||
|
|
|
|
|
|
|
|
|
|
|
|
|
|
|
|
|
|
|
|
|
|
|
|
|
|
|
|
|
|
|
|||||||||||||||||||||||||||||||
| Total |
$ | 73,576 | 3.1 | % | 2.42 | % | $ | 1,891,043 | 80.5 | % | 2.59 | % | $ | 374,071 | 15.9 | % | 2.58 | % | $ | 12,430 | 0.5 | % | 2.81 | % | $ | 2,351,120 | 100.0 | % | 2.59 | % | ||||||||||||||||||||||||||||||
|
|
|
|
|
|
|
|
|
|
|
|
|
|
|
|
|
|
|
|
|
|
|
|
|
|
|
|
|
|
|
|||||||||||||||||||||||||||||||
At December 31, 2019 and 2018, the Bank had no investments in obligations of individual states, counties, municipalities or nongovernment corporate entities which exceeded 10% of stockholders’ equity. In 2019, sales of securities totaling $17,478,000 in gross proceeds resulted in a net realized gain of $61,000. In 2018, sales of securities totaling $27,517,000 in gross proceeds resulted in a net realized gain of $302,000. There were no sales of state, county or municipal securities during 2019, 2018 and 2017.
Management reviews the investment portfolio for other-than-temporary impairment of individual securities on a regular basis. The results of such analysis are dependent upon general market conditions and specific conditions related to the issuers of our securities.
Loans
The Company’s lending activities are conducted principally in Massachusetts, New Hampshire, Rhode Island, Connecticut and New York. The Company grants single-family and multi-family residential loans, commercial and commercial real estate loans, municipal loans, and a variety of consumer loans. To a lesser extent, the Company grants loans for the construction of residential homes, multi-family properties, commercial real estate properties and land development. Most loans granted by the Company are secured by real estate collateral. The ability and willingness of commercial real estate, commercial, construction, residential and consumer loan borrowers to honor their repayment commitments are generally dependent on the health of the real estate market in the borrowers’ geographic areas and of the general economy.
22
Table of Contents
Management’s Discussion and Analysis of Results of Operations and Financial Condition
The following summary shows the composition of the loan portfolio at the dates indicated.
| December 31, | 2019 | 2018 | 2017 | 2016 | 2015 | |||||||||||||||||||||||||||||||||||
| Amount | Percent of Total |
Amount | Percent of Total |
Amount | Percent of Total |
Amount | Percent of Total |
Amount | Percent of Total |
|||||||||||||||||||||||||||||||
| (dollars in thousands) |
||||||||||||||||||||||||||||||||||||||||
| Construction and land development |
$ | 8,992 | 0.4 | % | $ | 13,628 | 0.6 | % | $ | 18,931 | 0.9 | % | $ | 14,928 | 0.8 | % | $ | 27,421 | 1.6 | % | ||||||||||||||||||||
| Commercial and industrial |
812,417 | 33.5 | % | 761,625 | 33.3 | % | 763,807 | 35.1 | % | 612,503 | 31.8 | % | 452,235 | 26.1 | % | |||||||||||||||||||||||||
| Municipal |
120,455 | 5.0 | % | 97,290 | 4.3 | % | 106,599 | 4.9 | % | 135,418 | 7.0 | % | 85,685 | 4.9 | % | |||||||||||||||||||||||||
| Commercial real estate |
786,102 | 32.4 | % | 750,362 | 32.8 | % | 732,491 | 33.7 | % | 696,173 | 36.2 | % | 721,506 | 41.7 | % | |||||||||||||||||||||||||
| Residential real estate |
371,897 | 15.3 | % | 348,250 | 15.2 | % | 287,731 | 13.2 | % | 241,357 | 12.5 | % | 255,346 | 14.7 | % | |||||||||||||||||||||||||
| Consumer |
21,071 | 0.9 | % | 21,359 | 0.9 | % | 18,458 | 0.8 | % | 11,013 | 0.6 | % | 10,744 | 0.6 | % | |||||||||||||||||||||||||
| Home equity |
304,363 | 12.5 | % | 292,340 | 12.9 | % | 247,345 | 11.4 | % | 211,857 | 11.0 | % | 178,020 | 10.3 | % | |||||||||||||||||||||||||
| Overdrafts |
822 | 0.0 | % | 724 | 0.0 | % | 582 | 0.0 | % | 684 | 0.1 | % | 579 | 0.1 | % | |||||||||||||||||||||||||
|
|
|
|
|
|
|
|
|
|
|
|
|
|
|
|
|
|
|
|
|
|||||||||||||||||||||
| Total |
$ | 2,426,119 | 100.0 | % | $ | 2,285,578 | 100.0 | % | $ | 2,175,944 | 100.0 | % | $ | 1,923,933 | 100.0 | % | $ | 1,731,536 | 100.0 | % | ||||||||||||||||||||
|
|
|
|
|
|
|
|
|
|
|
|
|
|
|
|
|
|
|
|
|
|||||||||||||||||||||
At December 31, 2019, 2018, 2017, 2016 and 2015, loans were carried net of (premiums) discounts of $(292,000), $(364,000), $46,000, $313,000 and $360,000, respectively. Net deferred loan fees of $220,000, $496,000, $588,000, $641,000 and $988,000 were carried in 2019, 2018, 2017, 2016 and 2015, respectively.
The following table summarizes the remaining maturity distribution of certain components of the Company’s loan portfolio on December 31, 2019. The table excludes loans secured by 1–4 family residential real estate, loans for household and family personal expenditures, and municipal loans. Maturities are presented as if scheduled principal amortization payments are due on the last contractual payment date.
| Remaining Maturities of Selected Loans at December 31, 2019 |
||||||||||||||||
| One Year or Less | One to Five Years | Over Five Years | Total | |||||||||||||
| (dollars in thousands) | ||||||||||||||||
| Construction and land development |
$ | 568 | $ | — | $ | 8,424 | $ | 8,992 | ||||||||
| Commercial and industrial |
45,963 | 33,963 | 732,491 | 812,417 | ||||||||||||
| Commercial real estate |
31,485 | 105,580 | 649,037 | 786,102 | ||||||||||||
|
|
|
|
|
|
|
|
|
|||||||||
| Total |
$ | 78,016 | $ | 139,543 | $ | 1,389,952 | $ | 1,607,511 | ||||||||
|
|
|
|
|
|
|
|
|
|||||||||
The following table indicates the rate variability of the above loans due after one year.
| December 31, 2019 | One to Five Years | Over Five Years | Total | |||||||||
| (dollars in thousands) | ||||||||||||
| Predetermined interest rates |
$ | 99,014 | $ | 378,347 | $ | 477,361 | ||||||
| Floating or adjustable interest rates |
40,529 | 1,011,605 | 1,052,134 | |||||||||
|
|
|
|
|
|
|
|||||||
| Total |
$ | 139,543 | $ | 1,389,952 | $ | 1,529,495 | ||||||
|
|
|
|
|
|
|
|||||||
The Company’s commercial and industrial (“C&I”) loan customers include large healthcare and higher education institutions. During 2017, the Company increased its lending activities to these types of organizations. This increase may expose the Company to concentration risks inherent in financings based upon analysis of credit risk, the value of underlying collateral, and other more intangible factors, which are considered in originating commercial loans. The percentage of these types of organizations to total C&I loans has remained stable at 87% at December 31, 2019, compared to 86% at December 31, 2018.
23
Table of Contents
Management’s Discussion and Analysis of Results of Operations and Financial Condition
C&I loan customers also include various small and middle-market established businesses involved in manufacturing, distribution, retailing and services. Most clients are privately owned with markets that range from local to national in scope. Many of the loans to this segment are secured by liens on corporate assets and the personal guarantees of the principals. The regional economic strength or weakness impacts the relative risks in this loan category. There is little concentration in any one business sector, and loan risks are generally diversified among many borrowers.
Commercial real estate loans are extended to educational institutions, hospitals and other non-profit organizations. Loans are normally extended in amounts up to a maximum of 80% of appraised value and normally for terms between three and thirty years. Also included in commercial real estate loans are loans extended to finance various manufacturing, warehouse, light industrial, office, retail and residential properties in the Bank’s market area, which generally includes Massachusetts, New Hampshire, and Rhode Island.
Amortization schedules are long term and thus a balloon payment is generally due at maturity. Under most circumstances, the Bank will offer to rewrite or otherwise extend the loan at prevailing interest rates. During recent years, the Bank has emphasized nonresidential-type owner-occupied properties. This complements our C&I emphasis placed on the operating business entities and will continue. The regional economic environment affects the risk of both nonresidential and residential mortgages.
Municipal loans customers include loans to municipalities or related interests, primarily for infrastructure projects. The Company had increased its lending activities to municipalities through 2016. Municipal loans decreased during 2017 and 2018 as a result of loan payoffs. Municipal loans increased during 2019 as a result of increased loan originations.
Residential real estate (1–4 family) includes two categories of loans. Included in residential real estate are approximately $48,023,000 of C&I type loans secured by 1–4 family real estate. Primarily, these are small businesses with modest capital or shorter operating histories where the collateral mitigates some risk. This category of loans shares similar risk characteristics with the C&I loans, notwithstanding the collateral position.
The other category of residential real estate loans is mostly 1–4 family residential properties located in the Bank’s market area. General underwriting criteria are largely the same as those used by Fannie Mae. The Bank utilizes mortgage insurance to provide lower down payment products and has provided a “First Time Homebuyer” product to encourage new home ownership. Residential real estate loan volume has increased and remains a core consumer product. The economic environment impacts the risks associated with this category.
Home equity loans are extended as both first and second mortgages on owner-occupied residential properties in the Bank’s market area. Loans are underwritten to a maximum loan to property value of 75%.
Bank officers evaluate the feasibility of construction projects based on independent appraisals of the project, architects’ or engineers’ evaluations of the cost of construction and other relevant data. As of December 31, 2019, the Company was obligated to advance a total of $11,062,000 to complete projects under construction.
Loans are placed on nonaccrual status when any payment of principal and/or interest is 90 days or more past due, unless the collateral is sufficient to cover both principal and interest and the loan is in the process of collection. The Company monitors closely the performance of its loan portfolio. In addition to internal loan review, the Company has contracted with an independent organization to review the Company’s commercial and commercial real estate loan portfolios. This independent review was performed in each of the past five years. The status of delinquent loans, as well as situations identified as potential problems, is reviewed on a regular basis by senior management and monthly by the Board of Directors of the Bank.
24
Table of Contents
Management’s Discussion and Analysis of Results of Operations and Financial Condition
Nonaccrual loans remained relatively stable from 2016 through 2019. Nonaccrual loans decreased during 2016, primarily as a result of a decrease in home equity and residential real estate nonperforming loans.
The composition of nonperforming assets is as follows:
| December 31, |
2019 | 2018 | 2017 | 2016 | 2015 | |||||||||||||||
| (dollars in thousands) | ||||||||||||||||||||
| Total nonperforming loans |
$ | 2,014 | $ | 1,313 | $ | 1,684 | $ | 1,084 | $ | 2,336 | ||||||||||
| Other real estate owned |
— | 2,225 | — | — | — | |||||||||||||||
|
|
|
|
|
|
|
|
|
|
|
|||||||||||
| Total nonperforming assets |
$ | 2,014 | $ | 3,538 | $ | 1,684 | $ | 1,084 | $ | 2,336 | ||||||||||
|
|
|
|
|
|
|
|
|
|
|
|||||||||||
| Accruing troubled debt restructured loans |
$ | 2,361 | $ | 2,559 | $ | 2,749 | $ | 3,526 | $ | 2,893 | ||||||||||
| Loans past due 90 and still accruing |
— | — | — | — | — | |||||||||||||||
| Nonperforming loans as a percent of gross loans |
0.08 | % | 0.15 | % | 0.08 | % | 0.06 | % | 0.13 | % | ||||||||||
| Nonperforming assets as a percent of total assets |
0.04 | % | 0.07 | % | 0.04 | % | 0.02 | % | 0.06 | % | ||||||||||
The composition of impaired loans is as follows:
| 2019 | 2018 | 2017 | 2016 | 2015 | ||||||||||||||||
| Residential real estate, multi-family |
$ | — | $ | — | $ | 4,212 | $ | 198 | $ | 916 | ||||||||||
| Home equity |
— | — | — | — | 90 | |||||||||||||||
| Commercial real estate |
2,346 | 2,650 | 2,554 | 3,149 | 1,678 | |||||||||||||||
| Construction and land development |
— | — | — | 94 | 98 | |||||||||||||||
| Commercial and industrial |
906 | 401 | 348 | 389 | 443 | |||||||||||||||
|
|
|
|
|
|
|
|
|
|
|
|||||||||||
| Total impaired loans |
$ | 3,252 | $ | 3,051 | $ | 7,114 | $ | 3,830 | $ | 3,225 | ||||||||||
|
|
|
|
|
|
|
|
|
|
|
|||||||||||
At December 31, 2019, 2018, 2017, 2016 and 2015 impaired loans had specific reserves of $102,000, $145,000, $164,000, $173,000 and $250,000, respectively.
The Company was servicing mortgage loans sold to others without recourse of approximately $204,690,000, $209,160,000, $229,533,000, $229,730,000 and $185,299,000 at December 31, 2019, 2018, 2017, 2016 and 2015, respectively. The Company had no loans held for sale at December 31, 2019, 2018, 2017, 2016 and 2015.
Servicing assets are recorded at fair value and recognized as separate assets when rights are acquired through sale of loans with servicing rights retained. Mortgage servicing assets (“MSA”) are amortized into non-interest income in proportion to, and over the period of, the estimated net servicing income. Upon sale, the mortgage servicing asset is established, which represents the then-current estimated fair value based on market prices for comparable mortgage servicing contracts, when available, or alternatively, is based on a valuation model that calculates the present value of estimated future net servicing income. The valuation model incorporates assumptions that market participants would use in estimating future net servicing income, such as the cost to service, the discount rate, an inflation rate, ancillary income, prepayment speeds and default rates and losses. Servicing rights are assessed for impairment based on fair value at each reporting date. MSAs are reported in other assets in the consolidated balance sheets. MSAs totaled $1,202,000 at December 31, 2019, $1,226,000 at December 31, 2018, $1,525,000 at December 31, 2017, $1,629,000 at December 31, 2016 and $1,305,000 at December 31, 2015.
Directors and officers of the Company and their associates are customers of, and have other transactions with, the Company in the normal course of business. All loans and commitments included in such transactions were made on substantially the same terms, including interest rates and collateral, as those prevailing at the time for comparable transactions with other persons and do not involve more than normal risk of collection or present other unfavorable features.
25
Table of Contents
Management’s Discussion and Analysis of Results of Operations and Financial Condition
The Company continues to monitor closely $31,631,000 and $31,728,000 at December 31, 2019 and 2018, respectively, of loans for which management has concerns regarding the ability of the borrowers to perform. The majority of the loans are secured by real estate and are considered to have adequate collateral value to cover the loan balances at December 31, 2019, although such values may fluctuate with changes in the economy and the real estate market. The decrease is primarily attributable to two loan relationships secured by real estate.
Allowance for Loan Losses
The Company maintains an allowance for loan losses in an amount determined by management on the basis of the character of the loans, loan performance, financial condition of borrowers, the value of collateral securing loans and other relevant factors. The following table summarizes the changes in the Company’s allowance for loan losses for the years indicated.
| Year Ended December 31, |
2019 | 2018 | 2017 | 2016 | 2015 | |||||||||||||||
| (dollars in thousands) | ||||||||||||||||||||
| Year-end loans outstanding |
||||||||||||||||||||
| (net of unearned discount and deferred loan fees) |
$ | 2,426,119 | $ | 2,285,578 | $ | 2,175,944 | $ | 1,923,933 | $ | 1,731,536 | ||||||||||
|
|
|
|
|
|
|
|
|
|
|
|||||||||||
| Average loans outstanding |
||||||||||||||||||||
| (net of unearned discount and deferred loan fees) |
$ | 2,341,190 | $ | 2,222,946 | $ | 2,059,797 | $ | 1,838,136 | $ | 1,507,546 | ||||||||||
|
|
|
|
|
|
|
|
|
|
|
|||||||||||
| Balance of allowance for loan losses at the beginning of year |
$ | 28,543 | $ | 26,255 | $ | 24,406 | $ | 23,075 | $ | 22,318 | ||||||||||
|
|
|
|
|
|
|
|
|
|
|
|||||||||||
| Loans charged-off: |
||||||||||||||||||||
| Commercial and industrial |
137 | 67 | 49 | — | — | |||||||||||||||
| Construction |
— | — | — | — | 172 | |||||||||||||||
| Commercial real estate |
— | — | — | — | 298 | |||||||||||||||
| Residential real estate |
22 | 450 | — | 27 | — | |||||||||||||||
| Consumer |
295 | 316 | 341 | 362 | 311 | |||||||||||||||
|
|
|
|
|
|
|
|
|
|
|
|||||||||||
| Total loans charged-off |
454 | 833 | 390 | 389 | 781 | |||||||||||||||
|
|
|
|
|
|
|
|
|
|
|
|||||||||||
| Recovery of loans previously charged-off: |
||||||||||||||||||||
| Commercial and industrial |
60 | 57 | 110 | 132 | 212 | |||||||||||||||
| Construction |
— | 1,436 | — | — | 780 | |||||||||||||||
| Real estate |
— | 75 | 84 | 6 | 91 | |||||||||||||||
| Consumer |
186 | 203 | 255 | 296 | 255 | |||||||||||||||
|
|
|
|
|
|
|
|
|
|
|
|||||||||||
| Total recoveries of loans previously charged-off: |
246 | 1,771 | 449 | 434 | 1,338 | |||||||||||||||
|
|
|
|
|
|
|
|
|
|
|
|||||||||||
| Net loan charge-offs (recoveries) |
208 | (938 | ) | (59 | ) | (45 | ) | (557 | ) | |||||||||||
| Provision charged to operating expense |
1,250 | 1,350 | 1,790 | 1,375 | 200 | |||||||||||||||
| Reclassification to other liabilities |
— | — | — | (89 | ) | — | ||||||||||||||
|
|
|
|
|
|
|
|
|
|
|
|||||||||||
| Balance at end of year |
$ | 29,585 | $ | 28,543 | $ | 26,255 | $ | 24,406 | $ | 23,075 | ||||||||||
|
|
|
|
|
|
|
|
|
|
|
|||||||||||
| Ratio of net charge-offs (recoveries) during the year to average loans outstanding |
0.01 | % | (0.04 | )% | 0.00 | % | 0.00 | % | (0.04 | )% | ||||||||||
|
|
|
|
|
|
|
|
|
|
|
|||||||||||
| Ratio of allowance for loan losses to loans outstanding |
1.22 | % | 1.25 | % | 1.21 | % | 1.27 | % | 1.33 | % | ||||||||||
|
|
|
|
|
|
|
|
|
|
|
|||||||||||
26
Table of Contents
Management’s Discussion and Analysis of Results of Operations and Financial Condition
The amount of the allowance for loan losses results from management’s evaluation of the quality of the loan portfolio considering such factors as loan status, specific reserves on impaired loans, collateral values, financial condition of the borrower, the state of the economy and other relevant information. The level of the charge-offs depends on many factors, including the national and regional economy. Cyclical lagging factors may result in charge-offs being higher than historical levels. Charge-offs declined in 2015 and 2016 as a result of the overall decrease in the level of nonaccrual loans. Charge-offs increased in 2018 primarily as a result of one residential real estate loan. During 2018, there was also a large recovery of a construction loan that was previously charged-off. The dollar amount of the allowance for loan losses increased primarily as a result of an increase in loan balances offset, somewhat, by lower historical loss factors.
During 2015, the Company enhanced its approach to the development of the historical loss factors and qualitative factors used on certain loan portfolios. The methodology enhancement was in response to the changes in the risk characteristics of the Company’s new loan originations, as the Company has continued to increase its exposure to larger loan originations to large institutions with strong credit quality. The Company has limited internal loss history experience with these types of loans, and has determined a more appropriate representation of loss expectation is to utilize external historical loss factors based on public credit ratings, as there is a great deal of default and loss data available on these types of loans from the credit rating agencies. As of June 30, 2015, the Company incorporated this information into the development of the historical loss rates for these loan types. The combination of the enhancements made to the allowance methodology to address the changing risk profile of the Company’s new loan originations and the increase in these loan types as a percentage of the overall portfolio. For 2016 and 2017, the change in the ratio of the allowance for loan losses to loans outstanding, was primarily due to changes in portfolio composition, lower historical loss rates, and qualitative factor adjustments. For 2018, the ratio increased, primarily as a result of changes in qualitative factors related to general economic factors pertaining to certain industries. For 2019, the ratio decreased primarily as a result of improvements in historical loss factors.
In addition, the Company monitors the outlook for the industries in which these institutions operate. Healthcare and higher education are the primary industries. The Company also monitors the volatility of the losses within the historical data.
By combining the credit rating, the industry outlook and the loss volatility, the Company arrives at the quantitative loss factor for each credit grade.
Credit ratings issued by national organizations were utilized as credit quality indicators as presented in the following table at December 31, 2019.
| Commercial and Industrial |
Municipal | Commercial Real Estate |
Total | |||||||||||||
| (in thousands) | ||||||||||||||||
| Credit Rating: |
||||||||||||||||
| Aaa-Aa3 |
$ | 523,644 | $ | 53,273 | $ | 40,437 | $ | 617,354 | ||||||||
| A1-A3 |
186,044 | 7,354 | 148,346 | 341,744 | ||||||||||||
| Baa1-Baa3 |
— | 51,133 | 144,711 | 195,844 | ||||||||||||
| Ba2 |
— | 5,895 | — | 5,895 | ||||||||||||
|
|
|
|
|
|
|
|
|
|||||||||
| Total |
$ | 709,688 | $ | 117,655 | $ | 333,494 | $ | 1,160,837 | ||||||||
|
|
|
|
|
|
|
|
|
|||||||||
27
Table of Contents
Management’s Discussion and Analysis of Results of Operations and Financial Condition
| Credit ratings issued by national organizations were utilized as credit quality indicators as presented in the following table at December 31, 2018.
|
| |||||||||||||||
| Commercial and Industrial |
Municipal | Commercial Real Estate |
Total | |||||||||||||
| (in thousands) | ||||||||||||||||
| Credit Rating: |
||||||||||||||||
| Aaa-Aa3 |
$ | 491,247 | $ | 54,105 | $ | 42,790 | $ | 588,142 | ||||||||
| A1-A3 |
172,472 | 7,605 | 151,381 | 331,458 | ||||||||||||
| Baa1-Baa3 |
— | 26,970 | 118,197 | 145,167 | ||||||||||||
| Ba2 |
— | 6,810 | — | 6,810 | ||||||||||||
|
|
|
|
|
|
|
|
|
|||||||||
| Total |
$ | 663,719 | $ | 95,490 | $ | 312,368 | $ | 1,071,577 | ||||||||
|
|
|
|
|
|
|
|
|
|||||||||
The allowance for loan losses is an estimate of the amount needed for an adequate reserve to absorb losses in the existing loan portfolio. This amount is determined by an evaluation of the loan portfolio, including input from an independent organization engaged to review selected larger loans, a review of loan experience and current economic conditions. Although the allowance is allocated between categories, the entire allowance is available to absorb losses attributable to all loan categories. At December 31 of each year listed below, the allowance is comprised of the following:
| 2019 | 2018 | 2017 | 2016 | 2015 | ||||||||||||||||||||||||||||||||||||
| Amount | Percent of Loans in Each Category to Total Loans |
Amount | Percent of Loans in Each Category to Total Loans |
Amount | Percent of Loans in Each Category to Total Loans |
Amount | Percent of Loans in Each Category to Total Loans |
Amount | Percent of Loans in Each Category to Total Loans |
|||||||||||||||||||||||||||||||
| (dollars in thousands) | ||||||||||||||||||||||||||||||||||||||||
| Construction and land development |
$ | 331 | 0.4 | % | $ | 1,092 | 0.6 | % | $ | 1,645 | 0.9 | % | $ | 1,012 | 0.8 | % | $ | 2,041 | 1.6 | % | ||||||||||||||||||||
| Commercial and industrial |
11,596 | 33.5 | % | 10,998 | 33.3 | % | 9,651 | 35.1 | % | 6,972 | 31.8 | % | 5,899 | 26.1 | % | |||||||||||||||||||||||||
| Municipal |
2,566 | 5.0 | % | 1,838 | 4.3 | % | 1,720 | 4.9 | % | 1,612 | 7.1 | % | 994 | 4.9 | % | |||||||||||||||||||||||||
| Commercial real estate |
11,464 | 32.4 | % | 10,663 | 32.8 | % | 9,728 | 33.7 | % | 11,135 | 36.2 | % | 10,589 | 41.7 | % | |||||||||||||||||||||||||
| Residential real estate |
2,194 | 15.3 | % | 2,190 | 15.2 | % | 1,873 | 13.2 | % | 1,698 | 12.5 | % | 1,320 | 14.7 | % | |||||||||||||||||||||||||
| Consumer and other |
312 | 0.9 | % | 365 | 0.9 | % | 373 | 0.8 | % | 582 | 0.6 | % | 644 | 0.7 | % | |||||||||||||||||||||||||
| Home equity |
1,065 | 12.5 | % | 1,111 | 12.9 | % | 989 | 11.4 | % | 1,102 | 11.0 | % | 1,077 | 10.3 | % | |||||||||||||||||||||||||
| Unallocated |
57 | 286 | 276 | 293 | 511 | |||||||||||||||||||||||||||||||||||
|
|
|
|
|
|
|
|
|
|
|
|
|
|
|
|
|
|
|
|
|
|||||||||||||||||||||
| Total |
$ | 29,585 | 100.0 | % | $ | 28,543 | 100.0 | % | $ | 26,255 | 100.0 | % | $ | 24,406 | 100.0 | % | $ | 23,075 | 100.0 | % | ||||||||||||||||||||
|
|
|
|
|
|
|
|
|
|
|
|
|
|
|
|
|
|
|
|
|
|||||||||||||||||||||
Management believes that the allowance for loan losses is adequate. In addition, various regulatory agencies, as part of the examination process, periodically review the Company’s allowance for loan losses. Such agencies may require the Company to recognize additions to the allowance based on their judgments about information available to them at the time of their examination. The enhancements described above have resulted in a lower level of unallocated allowance for loan losses. Further information regarding the allocation of the allowance is contained within Note 6 of the “Notes to Consolidated Financial Statements.”
28
Table of Contents
Management’s Discussion and Analysis of Results of Operations and Financial Condition
Deposits
The Company offers savings accounts, NOW accounts, demand deposits, time deposits and money market accounts. Additionally, the Company offers cash management accounts which provide either automatic transfer of funds above a specified level from the customer’s checking account to a money market account or short-term borrowings. Also, an account reconciliation service is offered whereby the Company provides a report balancing the customer’s checking account.
Interest rates on deposits are set twice per month by the Bank’s rate-setting committee, based on factors including loan demand, maturities and a review of competing interest rates offered. Interest rate policies are reviewed periodically by the Executive Management Committee.
The following table sets forth the average balances of the Bank’s deposits for the periods indicated.
| 2019 | 2018 | 2017 | ||||||||||||||||||||||
| Amount | Percent | Amount | Percent | Amount | Percent | |||||||||||||||||||
| (dollars in thousands) | ||||||||||||||||||||||||
| Demand Deposits |
$ | 760,420 | 17.4 | % | $ | 753,604 | 18.5 | % | $ | 687,853 | 18.0 | % | ||||||||||||
| Savings and Interest Checking |
1,810,481 | 41.5 | % | 1,514,259 | 37.1 | % | 1,457,872 | 38.2 | % | |||||||||||||||
| Money Market |
1,273,389 | 29.2 | % | 1,230,010 | 30.2 | % | 1,105,072 | 28.9 | % | |||||||||||||||
| Time Certificates of Deposit |
519,761 | 11.9 | % | 577,975 | 14.2 | % | 566,940 | 14.9 | % | |||||||||||||||
|
|
|
|
|
|
|
|
|
|
|
|
|
|||||||||||||
| Total |
$ | 4,364,051 | 100.0 | % | $ | 4,075,848 | 100.0 | % | $ | 3,817,737 | 100.0 | % | ||||||||||||
|
|
|
|
|
|
|
|
|
|
|
|
|
|||||||||||||
Time Deposits of $100,000 or more as of December 31, are as follows:
| 2019 | 2018 | |||||||
| (dollars in thousands) | ||||||||
| Three months or less |
$ | 84,940 | $ | 141,500 | ||||
| Three months through six months |
94,562 | 110,189 | ||||||
| Six months through twelve months |
146,830 | 100,446 | ||||||
| Over twelve months |
130,719 | 107,182 | ||||||
|
|
|
|
|
|||||
| Total |
$ | 457,051 | $ | 459,317 | ||||
|
|
|
|
|
|||||
Borrowings
The Bank’s borrowings consisted primarily of Federal Home Loan Bank of Boston (“FHLBB”) borrowings collateralized by a blanket pledge agreement on the Bank’s FHLBB stock, certain qualified investment securities, deposits at the FHLBB and residential mortgages held in the Bank’s portfolios. The Bank’s borrowings from the FHLBB totaled $370,955,000, an increase of $168,577,000 from the prior year. The Bank’s remaining term borrowing capacity at the FHLBB at December 31, 2019, was approximately $245,138,000. In addition, the Bank has a $14,500,000 line of credit with the FHLBB. See Note 12 of the notes to consolidated financial statements, “Other Borrowed Funds and Subordinated Debentures,” for a schedule, including related interest rates and other information.
Subordinated Debentures
In December 2004, the Company consummated the sale of a Trust Preferred Securities offering, in which it issued $36,083,000 of subordinated debt securities due 2034 to its newly formed unconsolidated subsidiary, Century Bancorp Capital Trust II.
29
Table of Contents
Management’s Discussion and Analysis of Results of Operations and Financial Condition
Century Bancorp Capital Trust II then issued 35,000 shares of Cumulative Trust Preferred Securities with a liquidation value of $1,000 per share. These securities paid dividends at an annualized rate of 6.65% for the first ten years and then converted to the three-month LIBOR rate plus 1.87% for the remaining 20 years. The coupon rate on these securities was 3.76% at December 31, 2019. The Company is using the proceeds primarily for general business purposes.
Securities Sold Under Agreements to Repurchase
The Bank’s remaining borrowings consist primarily of securities sold under agreements to repurchase. Securities sold under agreements to repurchase totaled $266,045,000, an increase of $111,805,000 from the prior year. See Note 11 of the notes to consolidated financial statements, “Securities Sold Under Agreements to Repurchase,” for a schedule, including related interest rates and other information.
RESULTS OF OPERATIONS
Net Interest Income
The Company’s operating results depend primarily on net interest income and fees received for providing services. Net interest income on a fully taxable equivalent basis increased 3.4% in 2019 to $104,857,000, compared with $101,430,000 in 2018. The increase in net interest income for 2019 was mainly due to a 7.2% increase in the average balances of earning assets, combined with a similar increase in deposits and prepayment penalties collected. The increase in net interest income for 2018 was mainly due to a 5.1% increase in the average balances of earning assets, combined with a similar increase in deposits. The level of interest rates, the ability of the Company’s earning assets and liabilities to adjust to changes in interest rates and the mix of the Company’s earning assets and liabilities affect net interest income. The net interest margin on a fully taxable equivalent basis decreased to 2.10% in 2019 and decreased to 2.18% in 2018 from 2.25% in 2017. The decrease in the net interest margin for 2019 was primarily attributable to an increase in rates paid on deposits. The decrease in the net interest margin for 2018 was primarily the result of a decrease in the federal corporate tax rate from 34% to 21% as well as lower prepayment penalties collected during 2018. The decrease in the tax rate results in a lower tax equivalent yield on tax-exempt assets. The Company collected approximately $1,456,000, $39,000 and $907,000, respectively, of prepayment penalties, which are included in interest income on loans, for 2019, 2018 and 2017, respectively.
Additional information about the net interest margin is contained in the “Overview” section of this report. Also, there can be no assurance that certain factors beyond its control, such as the prepayment of loans and changes in market interest rates, will continue to positively impact the net interest margin. Management believes that the current yield curve environment will continue to present challenges as deposit and borrowing costs may have the potential to increase at a faster rate than corresponding asset categories.
30
Table of Contents
Management’s Discussion and Analysis of Results of Operations and Financial Condition
The following table sets forth the distribution of the Company’s average assets, liabilities and stockholders’ equity, and average rates earned or paid on a fully taxable equivalent basis for each of the years indicated.
| Year Ended December 31, | 2019 | 2018 | 2017 | |||||||||||||||||||||||||||||||||
| Average Balance |
Interest Income/ Expense(1) |
Rate Earned/ Paid(1) |
Average Balance |
Interest Income/ Expense(1) |
Rate Earned/ Paid(1) |
Average Balance |
Interest Income/ Expense(2) |
Rate Earned/ Paid(2) |
||||||||||||||||||||||||||||
| (dollars in thousands) |
||||||||||||||||||||||||||||||||||||
| ASSETS |
||||||||||||||||||||||||||||||||||||
| Interest-earning assets: |
||||||||||||||||||||||||||||||||||||
| Loans(3) |
||||||||||||||||||||||||||||||||||||
| Taxable |
$ | 1,207,896 | $ | 54,720 | 4.53 | % | $ | 1,102,390 | $ | 46,615 | 4.23 | % | $ | 978,593 | $ | 39,103 | 4.00 | % | ||||||||||||||||||
| Tax-exempt |
1,133,294 | 41,998 | 3.71 | % | 1,120,556 | 40,439 | 3.61 | % | 1,081,204 | 40,420 | 3.74 | % | ||||||||||||||||||||||||
| Securities available-for-sale:(4) |
||||||||||||||||||||||||||||||||||||
| Taxable |
268,516 | 8,078 | 3.01 | % | 310,071 | 7,864 | 2.54 | % | 354,918 | 5,859 | 1.65 | % | ||||||||||||||||||||||||
| Tax-exempt |
45,088 | 1,324 | 2.94 | % | 90,027 | 1,938 | 2.15 | % | 106,717 | 1,588 | 1.49 | % | ||||||||||||||||||||||||
| Securities held-to-maturity: |
||||||||||||||||||||||||||||||||||||
| Taxable |
2,152,580 | 58,036 | 2.70 | % | 1,854,328 | 45,556 | 2.46 | % | 1,725,280 | 38,348 | 2.22 | % | ||||||||||||||||||||||||
| Interest-bearing deposits in other banks |
189,710 | 4,051 | 2.14 | % | 183,903 | 3,498 | 1.90 | % | 189,193 | 2,097 | 1.11 | % | ||||||||||||||||||||||||
|
|
|
|
|
|
|
|
|
|
|
|
|
|
|
|
|
|
|
|||||||||||||||||||
| Total interest-earning assets |
4,997,084 | 168,207 | 3.37 | % | 4,661,275 | 145,910 | 3.13 | % | 4,435,905 | 127,415 | 2.87 | % | ||||||||||||||||||||||||
| Noninterest-earning assets |
250,864 | 229,244 | 221,628 | |||||||||||||||||||||||||||||||||
| Allowance for loan losses |
(29,004 | ) | (27,531 | ) | (25,329 | ) | ||||||||||||||||||||||||||||||
|
|
|
|
|
|
|
|||||||||||||||||||||||||||||||
| Total assets |
$ | 5,218,944 | $ | 4,862,988 | $ | 4,632,204 | ||||||||||||||||||||||||||||||
|
|
|
|
|
|
|
|||||||||||||||||||||||||||||||
| LIABILITIES AND STOCKHOLDERS’ EQUITY |
||||||||||||||||||||||||||||||||||||
| Interest-bearing deposits: |
||||||||||||||||||||||||||||||||||||
| NOW accounts |
$ | 940,998 | $ | 9,357 | 0.99 | % | $ | 926,143 | $ | 6,579 | 0.71 | % | $ | 949,924 | $ | 3,669 | 0.39 | % | ||||||||||||||||||
| Savings accounts |
869,483 | 11,826 | 1.36 | % | 588,116 | 5,178 | 0.88 | % | 507,948 | 2,627 | 0.52 | % | ||||||||||||||||||||||||
| Money market accounts |
1,273,389 | 21,170 | 1.66 | % | 1,230,010 | 13,922 | 1.13 | % | 1,105,071 | 5,626 | 0.51 | % | ||||||||||||||||||||||||
| Time deposits |
519,761 | 11,804 | 2.27 | % | 577,975 | 10,208 | 1.77 | % | 566,941 | 7,919 | 1.40 | % | ||||||||||||||||||||||||
|
|
|
|
|
|
|
|
|
|
|
|
|
|
|
|
|
|
|
|||||||||||||||||||
| Total interest-bearing deposits |
3,603,631 | 54,157 | 1.50 | % | 3,322,244 | 35,887 | 1.08 | % | 3,129,884 | 19,841 | 0.63 | % | ||||||||||||||||||||||||
| Securities sold under agreements to repurchase |
224,361 | 2,347 | 1.05 | % | 147,944 | 976 | 0.66 | % | 189,684 | 496 | 0.26 | % | ||||||||||||||||||||||||
| Other borrowed funds and subordinated debentures |
231,926 | 6,846 | 2.95 | % | 291,674 | 7,617 | 2.61 | % | 309,102 | 7,483 | 2.42 | % | ||||||||||||||||||||||||
|
|
|
|
|
|
|
|
|
|
|
|
|
|
|
|
|
|
|
|||||||||||||||||||
| Total interest-bearing liabilities |
4,059,918 | 63,350 | 1.56 | % | 3,761,862 | 44,480 | 1.18 | % | 3,628,670 | 27,820 | 0.77 | % | ||||||||||||||||||||||||
| Noninterest-bearing liabilities |
||||||||||||||||||||||||||||||||||||
| Demand deposits |
760,420 | 753,604 | 687,853 | |||||||||||||||||||||||||||||||||
| Other liabilities |
79,437 | 70,020 | 60,925 | |||||||||||||||||||||||||||||||||
|
|
|
|
|
|
|
|||||||||||||||||||||||||||||||
| Total liabilities |
4,899,775 | 4,585,486 | 4,377,448 | |||||||||||||||||||||||||||||||||
|
|
|
|
|
|
|
|||||||||||||||||||||||||||||||
| Stockholders’ equity |
319,169 | 277,502 | 254,756 | |||||||||||||||||||||||||||||||||
| Total liabilities and stockholders’ equity |
$ | 5,218,944 | $ | 4,862,988 | $ | 4,632,204 | ||||||||||||||||||||||||||||||
|
|
|
|
|
|
|
|||||||||||||||||||||||||||||||
| Net interest income on a fully taxable equivalent basis |
$ | 104,857 | $ | 101,430 | $ | 99,595 | ||||||||||||||||||||||||||||||
|
|
|
|
|
|
|
|||||||||||||||||||||||||||||||
| Less taxable equivalent adjustment |
(9,068 | ) | (8,854 | ) | (13,979 | ) | ||||||||||||||||||||||||||||||
|
|
|
|
|
|
|
|||||||||||||||||||||||||||||||
| Net interest income |
$ | 95,789 | $ | 92,576 | $ | 85,616 | ||||||||||||||||||||||||||||||
|
|
|
|
|
|
|
|||||||||||||||||||||||||||||||
| Net interest spread |
1.81 | % | 1.95 | % | 2.10 | % | ||||||||||||||||||||||||||||||
|
|
|
|
|
|
|
|||||||||||||||||||||||||||||||
| Net interest margin |
2.10 | % | 2.18 | % | 2.25 | % | ||||||||||||||||||||||||||||||
|
|
|
|
|
|
|
|||||||||||||||||||||||||||||||
| (1) | On a fully taxable equivalent basis calculated using a federal tax rate of 21%. |
| (2) | On a fully taxable equivalent basis calculated using a federal tax rate of 34%. |
| (3) | Nonaccrual loans are included in average amounts outstanding. |
| (4) | At amortized cost. |
31
Table of Contents
Management’s Discussion and Analysis of Results of Operations and Financial Condition
The following table summarizes the year-to-year changes in the Company’s net interest income resulting from fluctuations in interest rates and volume changes in earning assets and interest-bearing liabilities. Changes due to rate are computed by multiplying the change in rate by the prior year’s volume. Changes due to volume are computed by multiplying the change in volume by the prior year’s rate. Changes in volume and rate that cannot be separately identified have been allocated in proportion to the relationship of the absolute dollar amounts of each change.
| Year Ended December 31, | 2019 Compared with 2018 Increase/(Decrease) Due to Change in |
2018 Compared with 2017 Increase/(Decrease) Due to Change in |
||||||||||||||||||||||
| Volume | Rate | Total | Volume | Rate | Total | |||||||||||||||||||
| (dollars in thousands) |
||||||||||||||||||||||||
| Interest income: |
||||||||||||||||||||||||
| Loans |
||||||||||||||||||||||||
| Taxable |
$ | 4,644 | $ | 3,461 | $ | 8,105 | $ | 5,144 | $ | 2,368 | $ | 7,512 | ||||||||||||
| Tax-exempt |
463 | 1,096 | 1,559 | 1,445 | (1,426 | ) | 19 | |||||||||||||||||
| Securities available-for-sale: |
||||||||||||||||||||||||
| Taxable |
(1,136 | ) | 1,350 | 214 | (816 | ) | 2,821 | 2,005 | ||||||||||||||||
| Tax-exempt |
(1,171 | ) | 557 | (614 | ) | (277 | ) | 627 | 350 | |||||||||||||||
| Securities held-to-maturity: |
||||||||||||||||||||||||
| Taxable |
7,772 | 4,708 | 12,480 | 2,994 | 4,214 | 7,208 | ||||||||||||||||||
| Interest-bearing deposits in other banks |
113 | 440 | 553 | (61 | ) | 1,462 | 1,401 | |||||||||||||||||
|
|
|
|
|
|
|
|
|
|
|
|
|
|||||||||||||
| Total interest income |
10,685 | 11,612 | 22,297 | 8,429 | 10,066 | 18,495 | ||||||||||||||||||
|
|
|
|
|
|
|
|
|
|
|
|
|
|||||||||||||
| Interest expense: |
||||||||||||||||||||||||
| Deposits: |
||||||||||||||||||||||||
| NOW accounts |
107 | 2,671 | 2,778 | (94 | ) | 3,004 | 2,910 | |||||||||||||||||
| Savings accounts |
3,108 | 3,540 | 6,648 | 468 | 2,083 | 2,551 | ||||||||||||||||||
| Money market accounts |
507 | 6,741 | 7,248 | 702 | 7,594 | 8,296 | ||||||||||||||||||
| Time deposits |
(1,105 | ) | 2,701 | 1,596 | 157 | 2,132 | 2,289 | |||||||||||||||||
|
|
|
|
|
|
|
|
|
|
|
|
|
|||||||||||||
| Total interest-bearing deposits |
2,617 | 15,653 | 18,270 | 1,233 | 14,813 | 16,046 | ||||||||||||||||||
| Securities sold under agreements to repurchase |
642 | 729 | 1,371 | (130 | ) | 610 | 480 | |||||||||||||||||
| Other borrowed funds and subordinated debentures |
(1,685 | ) | 914 | (771 | ) | (437 | ) | 571 | 134 | |||||||||||||||
|
|
|
|
|
|
|
|
|
|
|
|
|
|||||||||||||
| Total interest expense |
1,574 | 17,296 | 18,870 | 666 | 15,994 | 16,660 | ||||||||||||||||||
|
|
|
|
|
|
|
|
|
|
|
|
|
|||||||||||||
| Change in net interest income |
$ | 9,111 | $ | (5,684 | ) | $ | 3,427 | $ | 7,763 | $ | (5,928 | ) | $ | 1,835 | ||||||||||
|
|
|
|
|
|
|
|
|
|
|
|
|
|||||||||||||
Average earning assets were $4,997,084,000 in 2019, an increase of $335,809,000 or 7.2% from the average in 2018, which was 5.1% higher than the average in 2017. Total average securities, including securities available-for-sale and securities held-to-maturity, were $2,466,184,000, an increase of 9.4% from the average in 2018. The increase in securities volume was mainly attributable to an increase in taxable securities held-to-maturity. An increase in securities volume and rates resulted in higher securities income, which increased 21.8% to $67,438,000 on a fully taxable equivalent basis. Total average loans increased 5.3% to $2,341,190,000 after increasing $163,149,000 in 2018. The primary reason for the increase in loans was due in large part to an increase in taxable commercial real estate and residential mortgage lending. The increase in loan volume resulted in higher loan income. Loan income increased by 11.1% or $9,664,000 to $96,718,000 in 2019 compared to 2018. This was mainly the result of an increase in rates and average balances. Total loan income was $79,523,000 in 2017.
32
Table of Contents
Management’s Discussion and Analysis of Results of Operations and Financial Condition
The Company’s sources of funds include deposits and borrowed funds. On average, deposits increased 7.1%, or $288,203,000, in 2019 after increasing by 6.8%, or $258,111,000, in 2018. Deposits increased in 2019, primarily as a result of increases in savings, NOW, demand deposits, and money market accounts. This was offset, somewhat, by a decrease in time deposits. Deposits increased in 2018, primarily as a result of increases in time deposits, savings, demand deposits, and money market accounts. Borrowed funds and subordinated debentures decreased by 3.8% in 2019, following a decrease of 11.9% in 2018. The majority of the Company’s borrowed funds are borrowings from the FHLBB, and retail repurchase agreements. Average borrowings from the FHLBB decreased by approximately $59,748,000, and average retail repurchase agreements increased by $76,417,000 in 2019. Interest expense totaled $63,350,000 in 2019, an increase of $18,870,000, or 42.4%, from 2018 when interest expense increased 59.9% from 2017. The increase in interest expense, for 2019, is primarily due to increases in the rates on deposits and borrowed funds as well as an increase in average balances of deposits and repurchase agreements. The increase in interest expense, for 2018, is primarily due to increases in the rates on deposits as well as an increase in average balances of deposits.
Provision for Loan Losses
The provision for loan losses was $1,250,000 in 2019, compared with $1,350,000 in 2018 and $1,790,000 in 2017. These provisions are the result of management’s evaluation of the amounts and credit quality of the loan portfolio considering such factors as loan status, collateral values, financial condition of the borrower, the state of the economy and other relevant information. The provision for loan losses decreased during 2019, primarily as a result improvements in historical loss factors. The provision for loan losses decreased during 2018, primarily as a result of net recoveries of $938,000 offset by changes in qualitative factors.
Other Operating Income
During 2019, the Company continued to experience strong results in its fee-based services, including fees derived from traditional banking activities such as deposit-related services, its automated lockbox collection system and full-service securities brokerage supported by LPL Financial, a full-service securities brokerage business.
33
Table of Contents
Management’s Discussion and Analysis of Results of Operations and Financial Condition
34
Table of Contents
Management’s Discussion and Analysis of Results of Operations and Financial Condition
35
Table of Contents
Management’s Discussion and Analysis of Results of Operations and Financial Condition
Contractual Obligations, Commitments, and Contingencies
The Company has entered into contractual obligations and commitments. The following tables summarize the Company’s contractual cash obligations and other commitments at December 31, 2019.
| Contractual Obligations and Commitments by Maturity (dollars in thousands) |
Payments Due—By Period | |||||||||||||||||||
| CONTRACTUAL OBLIGATIONS |
Total | Less Than One Year |
One to Three Years |
Three to Five Years |
After Five Years |
|||||||||||||||
| FHLBB advances |
$ | 370,955 | $ | 218,000 | $ | 46,000 | $ | 70,000 | $ | 36,955 | ||||||||||
| Subordinated debentures |
36,083 | — | — | — | 36,083 | |||||||||||||||
| Retirement benefit obligations |
56,651 | 4,171 | 8,907 | 10,551 | 33,022 | |||||||||||||||
| Lease obligations |
8,446 | 2,300 | 3,421 | 2,144 | 581 | |||||||||||||||
| Customer repurchase agreements |
266,045 | 266,045 | — | — | — | |||||||||||||||
|
|
|
|
|
|
|
|
|
|
|
|||||||||||
| Total contractual cash obligations |
$ | 738,180 | $ | 490,516 | $ | 58,328 | $ | 82,695 | $ | 106,641 | ||||||||||
|
|
|
|
|
|
|
|
|
|
|
|||||||||||
| Amount of Commitment Expiring—By Period | ||||||||||||||||||||
| OTHER COMMITMENTS |
Total | Less Than One Year |
One to Three Years |
Three to Five Years |
After Five Years |
|||||||||||||||
| Lines of credit |
$ | 625,524 | $ | 71,336 | $ | 32,191 | $ | 80,346 | $ | 441,651 | ||||||||||
| Standby and commercial letters of credit |
5,779 | 4,547 | 371 | 768 | 93 | |||||||||||||||
| Other commitments |
40,669 | 18,277 | 2,521 | 5,804 | 14,067 | |||||||||||||||
|
|
|
|
|
|
|
|
|
|
|
|||||||||||
| Total commitments |
$ | 671,972 | $ | 94,160 | $ | 35,083 | $ | 86,918 | $ | 455,811 | ||||||||||
|
|
|
|
|
|
|
|
|
|
|
|||||||||||
36
Table of Contents
Management’s Discussion and Analysis of Results of Operations and Financial Condition
37
Table of Contents
Management’s Discussion and Analysis of Results of Operations and Financial Condition
38
Table of Contents
| December 31, |
2019 | 2018 | ||||||
| (dollars in thousands except share data) |
||||||||
| ASSETS |
||||||||
| Cash and due from banks (Note 2) |
$ | 44,420 | $ | 89,540 | ||||
| Federal funds sold and interest-bearing deposits in other banks |
214,273 | 252,963 | ||||||
|
|
|
|
|
|||||
| Total cash and cash equivalents |
258,693 | 342,503 | ||||||
| Securities available-for-sale, amortized cost $260,924 in 2019 and $336,751 in 2018 (Notes 3, 9 and 11) |
260,502 | 336,759 | ||||||
| Securities held-to-maturity, fair value $2,361,304 in 2019 and $1,991,421 in 2018 (Notes 4 and 11) |
2,351,120 | 2,046,647 | ||||||
| Federal Home Loan Bank of Boston, stock at cost |
19,471 | 17,974 | ||||||
| Equity securities, amortized cost $1,635 in 2019 and $1,635 in 2018, respectively |
1,688 | 1,596 | ||||||
| Loans, net (Note 5) |
2,426,119 | 2,285,578 | ||||||
| Less: allowance for loan losses (Note 6) |
29,585 | 28,543 | ||||||
|
|
|
|
|
|||||
| Net loans |
2,396,534 | 2,257,035 | ||||||
| Bank premises and equipment (Note 7) |
33,952 | 23,921 | ||||||
| Accrued interest receivable |
13,110 | 14,406 | ||||||
| Other assets (Notes 5, 6, 8, 16, 23) |
157,354 | 123,094 | ||||||
|
|
|
|
|
|||||
| Total assets |
$ | 5,492,424 | $ | 5,163,935 | ||||
|
|
|
|
|
|||||
| LIABILITIES AND STOCKHOLDERS’ EQUITY |
||||||||
| Demand deposits |
$ | 712,842 | $ | 813,478 | ||||
| Savings and NOW deposits |
1,678,250 | 1,707,019 | ||||||
| Money market accounts |
1,453,572 | 1,325,888 | ||||||
| Time deposits (Note 10) |
555,447 | 560,579 | ||||||
|
|
|
|
|
|||||
| Total deposits |
4,400,111 | 4,406,964 | ||||||
| Securities sold under agreements to repurchase (Note 11) |
266,045 | 154,240 | ||||||
| Other borrowed funds (Note 12) |
370,955 | 202,378 | ||||||
| Subordinated debentures (Note 12) |
36,083 | 36,083 | ||||||
| Other liabilities |
86,649 | 63,831 | ||||||
|
|
|
|
|
|||||
| Total liabilities |
5,159,843 | 4,863,496 | ||||||
| Commitments and contingencies (Notes 7, 18 and 19) |
||||||||
| Stockholders’ equity (Note 15): |
||||||||
| Preferred Stock—$1.00 par value; 100,000 shares authorized; no shares issued and outstanding |
— | — | ||||||
| Common stock, Class A, |
||||||||
| $1.00 par value per share; authorized 10,000,000 shares; issued 3,650,949 shares in 2019 and 3,608,329 shares in 2018 |
3,651 | 3,608 | ||||||
| Common stock, Class B, |
||||||||
| $1.00 par value per share; authorized 5,000,000 shares; issued 1,916,960 in 2019 and 1,959,580 shares in 2018 |
1,917 | 1,960 | ||||||
| Additional paid-in capital |
12,292 | 12,292 | ||||||
| Retained earnings |
338,980 | 301,488 | ||||||
|
|
|
|
|
|||||
| 356,840 | 319,348 | |||||||
| Unrealized (losses) gains on securities available-for-sale, net of taxes |
(308 | ) | 6 | |||||
| Unrealized losses on securities transferred to held-to maturity, net of taxes |
(1,812 | ) | (2,565 | ) | ||||
| Pension liability, net of taxes |
(22,139 | ) | (16,350 | ) | ||||
|
|
|
|
|
|||||
| Total accumulated other comprehensive loss, net of taxes (Notes 3 and 13) |
(24,259 | ) | (18,909 | ) | ||||
|
|
|
|
|
|||||
| Total stockholders’ equity |
332,581 | 300,439 | ||||||
|
|
|
|
|
|||||
| Total liabilities and stockholders’ equity |
$ | 5,492,424 | $ | 5,163,935 | ||||
|
|
|
|
|
|||||
See accompanying “Notes to Consolidated Financial Statements.”
39
Table of Contents
Consolidated Statements of Income
| Year Ended December 31, |
2019 | 2018 | 2017 | |||||||||
| (dollars in thousands except share data) |
||||||||||||
| INTEREST INCOME |
||||||||||||
| Loans, taxable |
$ | 54,720 | $ | 46,615 | $ | 39,103 | ||||||
| Loans, non-taxable |
33,167 | 31,936 | 26,910 | |||||||||
| Securities available-for-sale, taxable |
7,125 | 6,748 | 4,987 | |||||||||
| Securities available-for-sale, non-taxable |
1,087 | 1,587 | 1,119 | |||||||||
| Federal Home Loan Bank of Boston dividends |
953 | 1,116 | 872 | |||||||||
| Securities held-to-maturity |
58,036 | 45,556 | 38,348 | |||||||||
| Federal funds sold, interest-bearing deposits in other banks and short-term investments |
4,051 | 3,498 | 2,097 | |||||||||
|
|
|
|
|
|
|
|||||||
| Total interest income |
159,139 | 137,056 | 113,436 | |||||||||
| INTEREST EXPENSE |
||||||||||||
| Savings and NOW deposits |
21,183 | 11,757 | 6,296 | |||||||||
| Money market accounts |
21,170 | 13,922 | 5,626 | |||||||||
| Time deposits |
11,804 | 10,208 | 7,919 | |||||||||
| Securities sold under agreements to repurchase |
2,347 | 976 | 496 | |||||||||
| Other borrowed funds and subordinated debentures |
6,846 | 7,617 | 7,483 | |||||||||
|
|
|
|
|
|
|
|||||||
| Total interest expense |
63,350 | 44,480 | 27,820 | |||||||||
|
|
|
|
|
|
|
|||||||
| Net interest income |
95,789 | 92,576 | 85,616 | |||||||||
| Provision for loan losses (Note 6) |
1,250 | 1,350 | 1,790 | |||||||||
|
|
|
|
|
|
|
|||||||
| Net interest income after provision for loan losses |
94,539 | 91,226 | 83,826 | |||||||||
| OTHER OPERATING INCOME |
||||||||||||
| Service charges on deposit accounts |
9,220 | 8,560 | 8,586 | |||||||||
| Lockbox fees |
3,973 | 3,274 | 3,290 | |||||||||
| Brokerage commissions |
277 | 348 | 353 | |||||||||
| Net gains on sales of securities |
61 | 302 | 47 | |||||||||
| Gains on sales of mortgage loans |
412 | — | 370 | |||||||||
| Other income |
4,456 | 3,764 | 3,906 | |||||||||
|
|
|
|
|
|
|
|||||||
| Total other operating income |
18,399 | 16,248 | 16,552 | |||||||||
| OPERATING EXPENSES |
||||||||||||
| Salaries and employee benefits (Note 17) |
44,014 | 42,710 | 40,517 | |||||||||
| Occupancy |
6,246 | 6,092 | 6,140 | |||||||||
| Equipment |
3,238 | 3,132 | 2,892 | |||||||||
| FDIC assessments |
729 | 1,471 | 1,581 | |||||||||
| Other (Note 20) |
17,902 | 16,288 | 15,989 | |||||||||
|
|
|
|
|
|
|
|||||||
| Total operating expenses |
72,129 | 69,693 | 67,119 | |||||||||
|
|
|
|
|
|
|
|||||||
| Income before income taxes |
40,809 | 37,781 | 33,259 | |||||||||
| Provision for income taxes (Note 16) |
1,110 | 1,568 | 10,958 | |||||||||
|
|
|
|
|
|
|
|||||||
| Net income |
$ | 39,699 | $ | 36,213 | $ | 22,301 | ||||||
|
|
|
|
|
|
|
|||||||
| SHARE DATA (Note 14) |
||||||||||||
| Weighted average number of shares outstanding, basic |
||||||||||||
| Class A |
3,633,044 | 3,608,179 | 3,604,029 | |||||||||
| Class B |
1,934,865 | 1,959,730 | 1,963,880 | |||||||||
| Weighted average number of shares outstanding, diluted |
||||||||||||
| Class A |
5,567,909 | 5,567,909 | 5,567,909 | |||||||||
| Class B |
1,934,865 | 1,959,730 | 1,963,880 | |||||||||
| Basic earnings per share |
||||||||||||
| Class A |
$ | 8.63 | $ | 7.89 | $ | 4.86 | ||||||
| Class B |
$ | 4.31 | $ | 3.95 | $ | 2.43 | ||||||
| Diluted earnings per share |
||||||||||||
| Class A |
$ | 7.13 | $ | 6.50 | $ | 4.01 | ||||||
| Class B |
$ | 4.31 | $ | 3.95 | $ | 2.43 | ||||||
See accompanying “Notes to Consolidated Financial Statements.”
40
Table of Contents
Consolidated Statements of Comprehensive Income
| Year Ended December 31, |
2019 | 2018 | 2017 | |||||||||
| (dollars in thousands) |
||||||||||||
| NET INCOME |
$ | 39,699 | $ | 36,213 | $ | 22,301 | ||||||
| Other comprehensive (loss) income, net of tax: |
||||||||||||
| Unrealized (losses) gains on securities: |
||||||||||||
| Unrealized holding (losses) gains arising during period |
(270 | ) | 326 | 533 | ||||||||
| Less: reclassification adjustment for gains included in net income |
(44 | ) | (217 | ) | (28 | ) | ||||||
|
|
|
|
|
|
|
|||||||
| Total unrealized (losses) gains on securities |
(314 | ) | 109 | 505 | ||||||||
| Accretion of net unrealized losses transferred during period |
753 | 1,086 | 1,034 | |||||||||
| Defined benefit pension plans: |
||||||||||||
| Pension liability adjustment: |
||||||||||||
| Net (loss) gain |
(6,842 | ) | 3,770 | (2,315 | ) | |||||||
| Amortization of prior service cost and loss included in net periodic benefit cost |
1,053 | 1,167 | 931 | |||||||||
|
|
|
|
|
|
|
|||||||
| Total pension liability adjustment |
(5,789 | ) | 4,937 | (1,384 | ) | |||||||
| Other comprehensive (loss) income |
(5,350 | ) | 6,132 | 155 | ||||||||
|
|
|
|
|
|
|
|||||||
| Comprehensive income (loss) |
$ | 34,349 | $ | 42,345 | $ | 22,456 | ||||||
|
|
|
|
|
|
|
|||||||
See accompanying “Notes to Consolidated Financial Statements.”
41
Table of Contents
Consolidated Statements of Changes in Stockholders’ Equity
| Class A Common Stock |
Class B Common Stock |
Additional Paid-in Capital |
Retained Earnings |
Accumulated Other Comprehensive Loss |
Total Stockholders’ Equity |
|||||||||||||||||||
| (dollars in thousands except share data) | ||||||||||||||||||||||||
| BALANCE, DECEMBER 31, 2016 |
$ | 3,601 | $ | 1,967 | $ | 12,292 | $ | 243,565 | $ | (21,384 | ) | $ | 240,041 | |||||||||||
| Net income |
— | — | — | 22,301 | — | 22,301 | ||||||||||||||||||
| Other comprehensive income, net of tax: |
||||||||||||||||||||||||
| Unrealized holding gains arising during period, net of $331 in taxes and $47 in realized net gains |
— | — | — | — | 505 | 505 | ||||||||||||||||||
| Accretion of net unrealized losses transferred during the period, net of $1,258 in taxes |
— | — | — | — | 1,034 | 1,034 | ||||||||||||||||||
| Pension liability adjustment, net of $286 in taxes |
— | — | — | — | (1,384 | ) | (1,384 | ) | ||||||||||||||||
| Conversion of Class B Common Stock to Class A |
||||||||||||||||||||||||
| Common Stock, 5,100 shares |
5 | (5 | ) | — | — | — | — | |||||||||||||||||
| Cash dividends, Class A Common Stock, $0.48 per share |
— | — | — | (1,729 | ) | — | (1,729 | ) | ||||||||||||||||
| Cash dividends, Class B Common Stock, $0.24 per share |
— | — | — | (471 | ) | — | (471 | ) | ||||||||||||||||
|
|
|
|
|
|
|
|
|
|
|
|
|
|||||||||||||
| BALANCE, DECEMBER 31, 2017 |
$ | 3,606 | $ | 1,962 | $ | 12,292 | $ | 263,666 | $ | (21,229 | ) | $ | 260,297 | |||||||||||
| Net income |
— | — | — | 36,213 | — | 36,213 | ||||||||||||||||||
| Other comprehensive income, net of tax: |
||||||||||||||||||||||||
| Unrealized holding gains arising during period, net of $16 in taxes and $302 in realized net gains |
— | — | — | — | 109 | 109 | ||||||||||||||||||
| Accretion of net unrealized losses transferred during the period, net of $391 in taxes |
— | — | — | — | 1,086 | 1,086 | ||||||||||||||||||
| Pension liability adjustment, net of $1,930 in taxes |
— | — | — | — | 4,937 | 4,937 | ||||||||||||||||||
| Adoption of ASU 2018-2, Income Statement-Reporting Comprehensive Income (Topic 220)-Reclassification of Certain Tax Effects from AOCI |
— | — | — | 3,783 | (3,783 | ) | — | |||||||||||||||||
| Adoption of ASU 2016-1, Financial Instruments-Overall (Subtopic 825-10) Recognition and Measurement of Financial Assets and Financial Liabilities |
— | — | — | 29 | (29 | ) | — | |||||||||||||||||
| Conversion of Class B Common Stock to Class A Common Stock, 2,500 shares |
2 | (2 | ) | — | — | — | — | |||||||||||||||||
| Cash dividends, Class A Common Stock, $0.48 per share |
— | — | — | (1,732 | ) | — | (1,732 | ) | ||||||||||||||||
| Cash dividends, Class B Common Stock, $0.24 per share |
— | — | — | (471 | ) | — | (471 | ) | ||||||||||||||||
|
|
|
|
|
|
|
|
|
|
|
|
|
|||||||||||||
| BALANCE, DECEMBER 31, 2018 |
$ | 3,608 | $ | 1,960 | $ | 12,292 | $ | 301,488 | $ | (18,909 | ) | $ | 300,439 | |||||||||||
| Net income |
— | — | — | 39,699 | — | 39,699 | ||||||||||||||||||
| Other comprehensive income, net of tax: |
||||||||||||||||||||||||
| Unrealized holding gains arising during period, net of $116 in taxes and $61 in realized net gains |
— | — | — | — | (314 | ) | (314 | ) | ||||||||||||||||
| Accretion of net unrealized losses transferred during the period, net of $269 in taxes |
— | — | — | — | 753 | 753 | ||||||||||||||||||
| Pension liability adjustment, net of $2,263 in taxes |
— | — | — | — | (5,789 | ) | (5,789 | ) | ||||||||||||||||
| Conversion of Class B Common Stock to Class A |
||||||||||||||||||||||||
| Common Stock, 42,620 shares |
43 | (43 | ) | — | — | — | — | |||||||||||||||||
| Cash dividends, Class A Common Stock, $0.48 per share |
— | — | — | (1,742 | ) | — | (1,742 | ) | ||||||||||||||||
| Cash dividends, Class B Common Stock, $0.24 per share |
— | — | — | (465 | ) | — | (465 | ) | ||||||||||||||||
|
|
|
|
|
|
|
|
|
|
|
|
|
|||||||||||||
| BALANCE, DECEMBER 31, 2019 |
$ | 3,651 | $ | 1,917 | $ | 12,292 | $ | 338,980 | $ | (24,259 | ) | $ | 332,581 | |||||||||||
|
|
|
|
|
|
|
|
|
|
|
|
|
|||||||||||||
See accompanying “Notes to Consolidated Financial Statements.”
42
Table of Contents
Consolidated Statements of Cash Flows
| Year Ended December 31, |
2019 | 2018 | 2017 | |||||||||
| (dollars in thousands) | ||||||||||||
| CASH FLOWS FROM OPERATING ACTIVITIES: |
||||||||||||
| Net income |
$ | 39,699 | $ | 36,213 | $ | 22,301 | ||||||
| Adjustments to reconcile net income to net cash provided by operating activities: |
||||||||||||
| Gain on sales of portfolio loans |
(412 | ) | — | (370 | ) | |||||||
| Gain on sale of fixed assets |
— | — | (11 | ) | ||||||||
| Net loss on other real estate owned |
79 | — | — | |||||||||
| Net gains on sales of securities |
(61 | ) | (302 | ) | (47 | ) | ||||||
| Net (gain) loss on equity securities |
(92 | ) | 67 | — | ||||||||
| Provision for loan losses |
1,250 | 1,350 | 1,790 | |||||||||
| Deferred tax (expense) benefit |
(2,135 | ) | (1,766 | ) | 6,918 | |||||||
| Net depreciation and amortization |
(2,382 | ) | 885 | 3,047 | ||||||||
| Decrease (increase) in accrued interest receivable |
1,296 | (3,227 | ) | (1,534 | ) | |||||||
| (Increase) decrease in other assets |
8,532 | 2,326 | (16,310 | ) | ||||||||
| Increase in other liabilities |
2,075 | 5,242 | 5,802 | |||||||||
|
|
|
|
|
|
|
|||||||
| Net cash provided by operating activities |
47,849 | 40,788 | 21,586 | |||||||||
| CASH FLOWS FROM INVESTING ACTIVITIES: |
||||||||||||
| Proceeds from maturities of short-term investments |
— | — | 5,284 | |||||||||
| Purchase of short-term investments |
— | — | (2,101 | ) | ||||||||
| Proceeds from redemptions of Federal Home Loan Bank of Boston stock |
14,380 | 18,388 | 10,127 | |||||||||
| Purchase of Federal Home Loan Bank of Boston stock |
(15,877 | ) | (14,583 | ) | (10,864 | ) | ||||||
| Proceeds from calls/maturities of securities available-for-sale |
144,739 | 215,406 | 259,388 | |||||||||
| Proceeds from sales of securities available-for-sale |
16,285 | 27,517 | 18,180 | |||||||||
| Purchase of securities available-for-sale |
(85,123 | ) | (183,588 | ) | (175,147 | ) | ||||||
| Proceeds from calls/maturities of securities held-to-maturity |
458,915 | 234,741 | 293,221 | |||||||||
| Proceeds from sales of securities held-to-maturity |
1,193 | — | — | |||||||||
| Purchase of securities held-to-maturity |
(757,997 | ) | (576,140 | ) | (337,773 | ) | ||||||
| Proceeds from life insurance policies |
5,461 | 375 | 115 | |||||||||
| Proceeds from sales of portfolio loans |
22,120 | — | 26,701 | |||||||||
| Net increase in loans |
(162,415 | ) | (110,874 | ) | (278,242 | ) | ||||||
| Bank owned life insurance purchases |
(33,664 | ) | — | — | ||||||||
| Proceeds from sales of other real estate owned |
2,146 | — | — | |||||||||
| Proceeds from sales of fixed assets |
— | — | 11 | |||||||||
| Capital expenditures |
(13,144 | ) | (3,601 | ) | (3,244 | ) | ||||||
|
|
|
|
|
|
|
|||||||
| Net cash used in investing activities |
(402,981 | ) | (392,359 | ) | (194,344 | ) | ||||||
| CASH FLOWS FROM FINANCING ACTIVITIES: |
||||||||||||
| Net (decrease) increase in time deposit accounts |
(5,132 | ) | (64,782 | ) | 147,002 | |||||||
| Net (decrease) increase in demand, savings, money market and NOW deposits |
(1,721 | ) | 554,779 | 116,747 | ||||||||
| Cash dividends |
(2,207 | ) | (2,203 | ) | (2,200 | ) | ||||||
| Net increase (decrease) in securities sold under agreements to repurchase |
111,805 | (4,750 | ) | (23,290 | ) | |||||||
| Net increase (decrease) in other borrowed funds |
168,577 | (145,400 | ) | 54,778 | ||||||||
|
|
|
|
|
|
|
|||||||
| Net cash provided by financing activities |
271,322 | 337,644 | 293,037 | |||||||||
|
|
|
|
|
|
|
|||||||
| Net (decrease) increase in cash and cash equivalents |
(83,810 | ) | (13,927 | ) | 120,279 | |||||||
| Cash and cash equivalents at beginning of year |
342,503 | 356,430 | 236,151 | |||||||||
|
|
|
|
|
|
|
|||||||
| Cash and cash equivalents at end of year |
$ | 258,693 | $ | 342,503 | $ | 356,430 | ||||||
|
|
|
|
|
|
|
|||||||
| SUPPLEMENTAL DISCLOSURES OF CASH FLOW INFORMATION: |
||||||||||||
| Cash paid (received) during the year for: |
||||||||||||
| Interest |
$ | 63,345 | $ | 44,289 | $ | 27,731 | ||||||
| Income taxes |
$ | (6,504) | $ | 590 | $ | 5,330 | ||||||
| Change in unrealized losses on securities available-for-sale, net of taxes |
$ | (314) | $ | 109 | $ | 505 | ||||||
| Change in unrealized losses on securities transferred to held-to-maturity, net of taxes |
$ | 753 | $ | 1,086 | $ | 1,034 | ||||||
| Pension liability adjustment, net of taxes |
$ | (5,789) | $ | 4,937 | $ | (1,384) | ||||||
| Transfer of loans to other real estate owned |
$ | — | $ | 2,225 | $ | — | ||||||
See accompanying “Notes to Consolidated Financial Statements.”
43
Table of Contents
Table of Contents
Notes to Consolidated Financial Statements
45
Table of Contents
Notes to Consolidated Financial Statements
46
Table of Contents
Notes to Consolidated Financial Statements
47
Table of Contents
Notes to Consolidated Financial Statements
48
Table of Contents
Notes to Consolidated Financial Statements
49
Table of Contents
Notes to Consolidated Financial Statements
50
Table of Contents
Notes to Consolidated Financial Statements
51
Table of Contents
Notes to Consolidated Financial Statements
52
Table of Contents
Notes to Consolidated Financial Statements
| 3. | Securities Available-for-Sale |
| December 31, 2019 | December 31, 2018 | |||||||||||||||||||||||||||||||
| Amortized Cost |
Gross Unrealized Gains |
Gross Unrealized Losses |
Estimated Fair Value |
Amortized Cost |
Gross Unrealized Gains |
Gross Unrealized Losses |
Estimated Fair Value |
|||||||||||||||||||||||||
| (dollars in thousands) |
||||||||||||||||||||||||||||||||
| U.S. Treasury |
$ | — | $ | — | $ | — | $ | — | $ | 2,000 | $ | — | $ | 8 | $ | 1,992 | ||||||||||||||||
| U. S. Government Sponsored Enterprises |
— | — | — | — | 3,946 | — | 31 | 3,915 | ||||||||||||||||||||||||
| SBA Backed Securities |
54,331 | 23 | 143 | 54,211 | 70,477 | 1 | 284 | 70,194 | ||||||||||||||||||||||||
| U.S. Government Agency and Sponsored Enterprises Mortgage-Backed Securities |
184,580 | 139 | 532 | 184,187 | 162,604 | 536 | 250 | 162,890 | ||||||||||||||||||||||||
| Privately Issued Residential Mortgage-Backed Securities |
397 | 1 | 2 | 396 | 679 | 3 | 10 | 672 | ||||||||||||||||||||||||
| Obligations Issued by States and Political Subdivisions |
18,016 | 60 | — | 18,076 | 93,445 | 58 | — | 93,503 | ||||||||||||||||||||||||
| Other Debt Securities |
3,600 | 51 | 19 | 3,632 | 3,600 | 37 | 44 | 3,593 | ||||||||||||||||||||||||
|
|
|
|
|
|
|
|
|
|
|
|
|
|
|
|
|
|||||||||||||||||
| Total |
$ | 260,924 | $ | 274 | $ | 696 | $ | 260,502 | $ | 336,751 | $ | 635 | $ | 627 | $ | 336,759 | ||||||||||||||||
|
|
|
|
|
|
|
|
|
|
|
|
|
|
|
|
|
|||||||||||||||||
Included in SBA Backed Securities and U.S. Government Agency and Sponsored Enterprises Mortgage-Backed Securities are securities at fair value pledged to secure public deposits and repurchase agreements amounting to $186,245,000 and $197,304,000 at December 31, 2019 and 2018, respectively. Also included in securities available-for-sale at fair value are securities pledged for borrowing at the Federal Home Loan Bank amounting to $32,297,000 and $34,787,000 at December 31, 2019 and 2018, respectively. The Company realized gains on sales of securities of $13,000, $302,000 and $47,000 from the proceeds of sales of available-for-sale securities of $16,285,000, $27,517,000 and $18,180,000 for the years ended December 31, 2019, 2018, and 2017, respectively.
Debt securities of U.S. Government Agency and Sponsored Enterprises Mortgage-Backed Securities primarily refer to debt securities of Fannie Mae and Freddie Mac.
53
Table of Contents
Notes to Consolidated Financial Statements
The following table shows the estimated maturity distribution of the Company’s securities available-for-sale at December 31, 2019.
| Amortized Cost |
Fair Value |
|||||||
| (dollars in thousands) |
||||||||
| Within one year |
$ | 18,417 | $ | 18,476 | ||||
| After one but within five years |
113,192 | 112,935 | ||||||
| After five but within ten years |
124,489 | 124,274 | ||||||
| More than ten years |
4,826 | 4,817 | ||||||
|
|
|
|
|
|||||
| Total |
$ | 260,924 | $ | 260,502 | ||||
|
|
|
|
|
|||||
The weighted average remaining life of investment securities available-for-sale at December 31, 2019, was 5.4 years. The contractual maturities, which were used in the table above, of mortgage-backed securities, will differ from the actual maturities due to the ability of the issuers to prepay underlying obligations. Also, $244,688,000 of the securities are floating rate or adjustable rate and reprice prior to maturity.
As of December 31, 2019 and December 31, 2018, management concluded that the unrealized losses of its investment securities are temporary in nature since they are not related to the underlying credit quality of the issuers, and the Company does not intend to sell these debt securities and it is not more likely than not that it will be required to sell these debt securities before the anticipated recovery of its remaining amortized cost. In making its other-than-temporary impairment evaluation, the Company considered the fact that the principal and interest on these securities are from issuers that are investment grade. The change in the unrealized losses on the Obligations Issued by States and Political Subdivisions, Privately Issued Residential Mortgage-Backed Securities and Other Debt Securities was primarily caused by changes in credit spreads and liquidity issues in the marketplace.
The unrealized loss on SBA Backed Securities and U.S. Government Agency and Sponsored Enterprises Mortgage-Backed Securities related primarily to interest rates and not credit quality. The Company has the ability and intent to hold these investments until recovery of fair value, which may be maturity. The Company does not consider these investments to be other-than-temporarily impaired at December 31, 2019 and December 31, 2018.
In evaluating the underlying credit quality of a security, management considers several factors such as the credit rating of the obligor and the issuer, if applicable. Internal reviews of issuer financial statements are performed as deemed necessary. In the case of privately issued mortgage-backed securities, the performance of the underlying loans is analyzed as deemed necessary to determine the estimated future cash flows of the securities. Factors considered include the level of subordination, current and estimated future default rates, current and estimated prepayment rates, estimated loss severity rates, geographic concentrations and origination dates of underlying loans.
The following table shows the temporarily impaired securities of the Company’s available-for-sale portfolio at December 31, 2019. This table shows the unrealized market loss of securities that have been in a continuous unrealized loss position for 12 months or less and a continuous loss position for 12 months and longer. There are
54
Table of Contents
Notes to Consolidated Financial Statements
45 and 18 securities that are temporarily impaired for less than 12 months and for 12 months or longer, respectively, out of a total of 122 holdings at December 31, 2019.
| Temporarily Impaired Investments |
December 31, 2019 | |||||||||||||||||||||||
| Less Than 12 Months | 12 Months or Longer | Total | ||||||||||||||||||||||
| Fair Value | Unrealized Losses |
Fair Value | Unrealized Losses |
Fair Value | Unrealized Losses |
|||||||||||||||||||
| (dollars in thousands) | ||||||||||||||||||||||||
| U.S. Treasury |
$ | — | $ | — | $ | — | $ | — | $ | — | $ | — | ||||||||||||
| U.S. Government Sponsored Enterprises |
— | — | — | — | — | — | ||||||||||||||||||
| SBA Backed Securities |
14,560 | 30 | 22,092 | 113 | 36,652 | 143 | ||||||||||||||||||
| U.S. Government Agency and Sponsored Enterprise Mortgage-Backed Securities |
108,806 | 379 | 29,178 | 153 | 137,984 | 532 | ||||||||||||||||||
| Privately Issued Residential Mortgage-Backed Securities |
252 | 2 | — | — | 252 | 2 | ||||||||||||||||||
| Obligations Issued by States and Political Subdivisions |
— | — | — | — | — | — | ||||||||||||||||||
| Other Debt Securities |
800 | 1 | 481 | 18 | 1,281 | 19 | ||||||||||||||||||
|
|
|
|
|
|
|
|
|
|
|
|
|
|||||||||||||
| Total temporarily impaired securities |
$ | 124,418 | $ | 412 | $ | 51,751 | $ | 284 | $ | 176,169 | $ | 696 | ||||||||||||
|
|
|
|
|
|
|
|
|
|
|
|
|
|||||||||||||
The following table shows the temporarily impaired securities of the Company’s available-for-sale portfolio at December 31, 2018. This table shows the unrealized market loss of securities that have been in a continuous unrealized loss position for 12 months or less and a continuous loss position for 12 months and longer. There are 10 and 30 securities that are temporarily impaired for less than 12 months and for 12 months or longer, respectively, out of a total of 190 holdings at December 31, 2018.
| Temporarily Impaired Investments |
December 31, 2018 | |||||||||||||||||||||||
| Less Than 12 Months | 12 Months or Longer | Total |
||||||||||||||||||||||
| Fair Value |
Unrealized Losses |
Fair Value |
Unrealized Losses |
Fair Value | Unrealized Losses |
|||||||||||||||||||
| (dollars in thousands) | ||||||||||||||||||||||||
| U.S. Treasury |
$ | — | $ | — | $ | 1,992 | $ | 8 | $ | 1,992 | $ | 8 | ||||||||||||
| U.S. Government Sponsored Enterprises |
3,914 | 31 | — | — | 3,914 | 31 | ||||||||||||||||||
| SBA Backed Securities |
17,950 | 28 | 44,323 | 256 | 62,273 | 284 | ||||||||||||||||||
| U.S. Government Agency and Sponsored Enterprise Mortgage-Backed Securities |
19,244 | 21 | 45,782 | 229 | 65,026 | 250 | ||||||||||||||||||
| Privately Issued Residential Mortgage-Backed Securities |
— | — | 495 | 10 | 495 | 10 | ||||||||||||||||||
| Obligations Issued by States and Political Subdivisions |
— | — | — | — | — | — | ||||||||||||||||||
| Other Debt Securities |
— | — | 455 | 44 | 455 | 44 | ||||||||||||||||||
|
|
|
|
|
|
|
|
|
|
|
|
|
|||||||||||||
| Total temporarily impaired securities |
$ | 41,108 | $ | 80 | $ | 93,047 | $ | 547 | $ | 134,155 | $ | 627 | ||||||||||||
|
|
|
|
|
|
|
|
|
|
|
|
|
|||||||||||||
55
Table of Contents
Notes to Consolidated Financial Statements
| 4. | Investment Securities Held-to-Maturity |
| December 31, 2019 | December 31, 2018 | |||||||||||||||||||||||||||||||
| Amortized Cost |
Gross Unrealized Gains |
Gross Unrealized Losses |
Estimated Fair Value |
Amortized Cost |
Gross Unrealized Gains |
Gross Unrealized Losses |
Estimated Fair Value |
|||||||||||||||||||||||||
| (dollars in thousands) | ||||||||||||||||||||||||||||||||
| U.S. Treasury |
$ | — | $ | — | $ | — | $ | — | $ | 9,960 | $ | — | $ | 2 | $ | 9,958 | ||||||||||||||||
| U.S. Government Sponsored Enterprises |
98,867 | 527 | 96 | 99,298 | 234,228 | 336 | 803 | 233,761 | ||||||||||||||||||||||||
| SBA Backed Securities |
44,379 | 182 | 303 | 44,258 | 52,051 | — | 2,065 | 49,986 | ||||||||||||||||||||||||
| U.S. Government Sponsored Enterprises Mortgage-Backed Securities |
2,207,874 | 20,720 | 10,846 | 2,217,748 | 1,750,408 | 2,324 | 55,016 | 1,697,716 | ||||||||||||||||||||||||
|
|
|
|
|
|
|
|
|
|
|
|
|
|
|
|
|
|||||||||||||||||
| Total |
$ | 2,351,120 | $ | 21,429 | $ | 11,245 | $ | 2,361,304 | $ | 2,046,647 | $ | 2,660 | $ | 57,886 | $ | 1,991,421 | ||||||||||||||||
|
|
|
|
|
|
|
|
|
|
|
|
|
|
|
|
|
|||||||||||||||||
Included in U.S. Government Sponsored Enterprises and U.S. Government Sponsored Enterprise Mortgage-Backed Securities are securities pledged to secure public deposits and repurchase agreements at fair value amounting to $1,776,399,000 and $1,441,059,000 at December 31, 2019, and 2018, respectively. Also included are securities pledged for borrowing at the Federal Home Loan Bank at fair value amounting to $399,646,000 and $291,190,000 at December 31, 2019, and 2018, respectively. The Company realized gains on sales of securities of $48,000 from the proceeds of sales of held-to-maturity securities of $1,193,000. The sales from securities held-to-maturity relate to certain mortgage-backed securities for which the Company had previously collected a substantial portion of its principal investment. The Company did not realize any gains of sales of securities for the year ending December 31, 2018 and 2017.
At December 31, 2019 and 2018, all mortgage-backed securities are obligations of U.S. Government Sponsored Enterprises. Government Sponsored Enterprises primarily refer to debt securities of Fannie Mae and Freddie Mac.
The following table shows the maturity distribution of the Company’s securities held-to-maturity at December 31, 2019.
| Amortized Cost |
Fair Value |
|||||||
| (dollars in thousands) | ||||||||
| Within one year |
$ | 73,576 | $ | 73,841 | ||||
| After one but within five years |
1,891,043 | 1,900,050 | ||||||
| After five but within ten years |
374,071 | 374,688 | ||||||
| More than ten years |
12,430 | 12,725 | ||||||
|
|
|
|
|
|||||
| Total |
$ | 2,351,120 | $ | 2,361,304 | ||||
|
|
|
|
|
|||||
The weighted average remaining life of investment securities held-to-maturity at December 31, 2019, was 3.7 years. Included in the weighted average remaining life calculation at December 31, 2019, were $33,491,000 of U.S. Government Sponsored Enterprises obligations that are callable at the discretion of the issuer. The
56
Table of Contents
Notes to Consolidated Financial Statements
contractual maturities, which were used in the table above, of mortgage-backed securities, will differ from the actual maturities due to the ability of the issuers to prepay underlying obligations. Also, $107,000 of the securities are floating rate or adjustable rate and reprice prior to maturity.
As of December 31, 2019 and December 31, 2018, management concluded that the unrealized losses of its investment securities are temporary in nature since they are not related to the underlying credit quality of the issuers, and the Company does not intend to sell these debt securities and it is not more likely than not that it will be required to sell these debt securities before the anticipated recovery of their remaining amortized costs. In making its other-than-temporary impairment evaluation, the Company considered the fact that the principal and interest on these securities are from issuers that are investment grade.
The unrealized loss on U.S. Government Sponsored Enterprises, SBA Backed Securities and U.S. Government Sponsored Enterprises Mortgage-Backed Securities related primarily to interest rates and not credit quality, and because the Company does not intend to sell any of these securities and it is not more likely than not that it will be required to sell these securities before the anticipated recovery of the remaining amortized cost, the Company does not consider these investments to be other-than-temporarily impaired at December 31, 2019 and December 31, 2018.
In evaluating the underlying credit quality of a security, management considers several factors such as the credit rating of the obligor and the issuer, if applicable. Internal reviews of issuer financial statements are performed as deemed necessary.
The following table shows the temporarily impaired securities of the Company’s held-to-maturity portfolio at December 31, 2019. This table shows the unrealized market loss of securities that have been in a continuous unrealized loss position for 12 months or less and a continuous loss position for 12 months and longer. There are 114 and 103 securities that are temporarily impaired for less than 12 months and for 12 months or longer, respectively, out of a total of 531 holdings at December 31, 2019.
| Temporarily Impaired Investments |
December 31, 2019 | |||||||||||||||||||||||
| Less Than 12 Months | 12 Months or Longer | Total | ||||||||||||||||||||||
| Fair Value | Unrealized Losses |
Fair Value | Unrealized Losses |
Fair Value | Unrealized Losses |
|||||||||||||||||||
| (dollars in thousands) | ||||||||||||||||||||||||
| U.S. Treasury |
$ | — | $ | — | $ | — | $ | — | $ | — | $ | — | ||||||||||||
| U.S. Government Sponsored Enterprises |
24,420 | 72 | 9,976 | 24 | 34,396 | 96 | ||||||||||||||||||
| SBA Backed Securities |
25,251 | 303 | — | — | 25,251 | 303 | ||||||||||||||||||
| U.S. Government Agency and Sponsored Enterprise Mortgage-Backed Securities |
613,905 | 3,949 | 389,919 | 6,897 | 1,003,824 | 10,846 | ||||||||||||||||||
|
|
|
|
|
|
|
|
|
|
|
|
|
|||||||||||||
| Total temporarily impaired securities |
$ | 663,576 | $ | 4,324 | $ | 399,895 | $ | 6,921 | $ | 1,063,471 | $ | 11,245 | ||||||||||||
|
|
|
|
|
|
|
|
|
|
|
|
|
|||||||||||||
The following table shows the temporarily impaired securities of the Company’s held-to-maturity portfolio at December 31, 2018.This table shows the unrealized market loss of securities that have been in a continuous unrealized loss position for 12 months or less and a continuous loss position for 12 months and longer. There are
57
Table of Contents
Notes to Consolidated Financial Statements
56 and 315 securities that are temporarily impaired for less than 12 months and for 12 months or longer, respectively, out of a total of 475 holdings at December 31, 2018.
| Temporarily Impaired Investments |
December 31, 2018 | |||||||||||||||||||||||
| Less Than 12 Months | 12 Months or Longer | Total | ||||||||||||||||||||||
| Fair Value | Unrealized Losses |
Fair Value | Unrealized Losses |
Fair Value | Unrealized Losses |
|||||||||||||||||||
| (dollars in thousands) | ||||||||||||||||||||||||
| U.S. Treasury |
$ | 9,958 | $ | 2 | $ | — | $ | — | $ | 9,958 | $ | 2 | ||||||||||||
| U.S. Government Sponsored Enterprises |
9,849 | 42 | 69,499 | 761 | 79,348 | 803 | ||||||||||||||||||
| SBA Backed Securities |
— | — | 49,987 | 2,065 | 49,987 | 2,065 | ||||||||||||||||||
| U.S. Government Agency and Sponsored Enterprise Mortgage-Backed Securities |
188,125 | 2,032 | 1,249,689 | 52,984 | 1,437,814 | 55,016 | ||||||||||||||||||
|
|
|
|
|
|
|
|
|
|
|
|
|
|||||||||||||
| Total temporarily impaired securities |
$ | 207,932 | $ | 2,076 | $ | 1,369,175 | $ | 55,810 | $ | 1,577,107 | $ | 57,886 | ||||||||||||
|
|
|
|
|
|
|
|
|
|
|
|
|
|||||||||||||
| 5. | Loans |
The majority of the Bank’s lending activities are conducted in Massachusetts with other lending activity principally in New Hampshire, Rhode Island, Connecticut and New York. The Bank originates construction, commercial and residential real estate loans, commercial and industrial loans, municipal loans, consumer, home equity and other loans for its portfolio.
The following summary shows the composition of the loan portfolio at the dates indicated.
| December 31, |
2019 | 2018 | ||||||
| (dollars in thousands) | ||||||||
| Construction and land development |
$ | 8,992 | $ | 13,628 | ||||
| Commercial and industrial |
812,417 | 761,625 | ||||||
| Municipal |
120,455 | 97,290 | ||||||
| Commercial real estate |
786,102 | 750,362 | ||||||
| Residential real estate |
371,897 | 348,250 | ||||||
| Consumer |
21,071 | 21,359 | ||||||
| Home equity |
304,363 | 292,340 | ||||||
| Overdrafts |
822 | 724 | ||||||
|
|
|
|
|
|||||
| Total |
$ | 2,426,119 | $ | 2,285,578 | ||||
|
|
|
|
|
|||||
At December 31, 2019, and December 31, 2018, loans were carried net of (premiums) discounts of $(292,000) and $(364,000), respectively. Net deferred fees included in loans at December 31, 2019, and December 31, 2018, were $220,000 and $496,000, respectively.
The Company was servicing mortgage loans sold to others without recourse of approximately $204,690,000 and $209,160,000 at December 31, 2019, and December 31, 2018, respectively. The Company had no residential real estate loans held for sale at December 31, 2019 and December 31, 2018. The Company’s mortgage servicing rights totaled $1,202,000 and $1,226,000 at December 31, 2019 and December 31, 2018, respectively.
As of December 31, 2019, and 2018, the Company’s recorded investment in impaired loans was $3,252,000 and $3,051,000, respectively. If an impaired loan is placed on nonaccrual, the loan may be returned to an accrual status when principal and interest payments are not delinquent, and the risk characteristics have improved to the
58
Table of Contents
Notes to Consolidated Financial Statements
extent that there no longer exists a concern as to the collectibility of principal and interest. At December 31, 2019, there were $2,322,000 of impaired loans with specific reserves of $102,000. At December 31, 2018, there were $2,774,000 of impaired loans with specific reserves of $145,000.
Loans are designated as troubled debt restructures when a concession is made on a credit as a result of financial difficulties of the borrower. Typically, such concessions consist of a reduction in interest rate to a below-market rate, taking into account the credit quality of the note, or a deferment of payments, principal or interest, which materially alters the Bank’s position or significantly extends the note’s maturity date, such that the present value of cash flows to be received is materially less than those contractually established at the loan’s origination. Restructured loans are included in the impaired loan category.
The composition of nonaccrual loans and impaired loans is as follows:
| December 31, |
2019 | 2018 | 2017 | |||||||||
| (dollars in thousands) | ||||||||||||
| Loans on nonaccrual |
$ | 2,014 | $ | 1,313 | $ | 1,684 | ||||||
| Loans 90 days past due and still accruing |
— | — | — | |||||||||
| Impaired loans on nonaccrual included above |
— | 296 | 254 | |||||||||
| Total recorded investment in impaired loans |
3,252 | 3,051 | 7,114 | |||||||||
| Average recorded investment of impaired loans |
3,161 | 5,491 | 5,608 | |||||||||
| Accruing troubled debt restructures |
2,361 | 2,559 | 2,749 | |||||||||
| Interest income not recorded on nonaccrual loans according to their original terms |
67 | 64 | 51 | |||||||||
| Interest income on nonaccrual loans actually recorded |
— | — | — | |||||||||
| Interest income recognized on impaired loans |
103 | 196 | 182 | |||||||||
Directors and officers of the Company and their associates are customers of, and have other transactions with, the Company in the normal course of business. All loans and commitments included in such transactions were made on substantially the same terms, including interest rates and collateral, as those prevailing at the time for comparable transactions with other persons and do not involve more than normal risk of collection or present other unfavorable features.
The following table shows the aggregate amount of loans to directors and officers of the Company and their associates during 2019.
| Balance at December 31, 2018 |
Additions | Repayments and Deletions |
Balance at December 31, 2019 |
|||||||||
| (dollars in thousands) | ||||||||||||
| $ 12,547 |
$ | 706 | $ | 1,222 | $ | 12,031 | ||||||
| 6. | Allowance for Loan Losses |
The Company maintains an allowance for loan losses in an amount determined by management on the basis of the character of the loans, loan performance, financial condition of borrowers, the value of collateral securing loans and other relevant factors. The following table summarizes the changes in the Company’s allowance for loan losses for the years indicated.
59
Table of Contents
Notes to Consolidated Financial Statements
An analysis of the allowance for loan losses for each of the three years ending December 31, 2019, 2018 and 2017 is as follows:
| 2019 | 2018 | 2017 | ||||||||||
| (dollars in thousands) | ||||||||||||
| Allowance for loan losses, beginning of year |
$ | 28,543 | $ | 26,255 | $ | 24,406 | ||||||
| Loans charged-off |
(454 | ) | (833 | ) | (390 | ) | ||||||
| Recoveries on loans previously charged-off |
246 | 1,771 | 449 | |||||||||
|
|
|
|
|
|
|
|||||||
| Net recoveries (charge-offs ) |
(208 | ) | 938 | 59 | ||||||||
| Provision charged to expense |
1,250 | 1,350 | 1,790 | |||||||||
|
|
|
|
|
|
|
|||||||
| Allowance for loan losses, end of year |
$ | 29,585 | $ | 28,543 | $ | 26,255 | ||||||
|
|
|
|
|
|
|
|||||||
Further information pertaining to the allowance for loan losses at December 31, 2019 follows:
| Construction and Land Development |
Commercial and Industrial |
Municipal | Commercial Real Estate |
Residential Real Estate |
Consumer | Home Equity |
Unallocated | Total | ||||||||||||||||||||||||||||
| (dollars in thousands) | ||||||||||||||||||||||||||||||||||||
| Allowance for Loan Losses: |
||||||||||||||||||||||||||||||||||||
| Ending balance at December 31, 2018 |
$ | 1,092 | $ | 10,998 | $ | 1,838 | $ | 10,663 | $ | 2,190 | $ | 365 | $ | 1,111 | $ | 286 | $ | 28,543 | ||||||||||||||||||
| Charge-offs |
— | (137 | ) | — | — | — | (295 | ) | (22 | ) | — | (454 | ) | |||||||||||||||||||||||
| Recoveries |
— | 60 | — | — | — | 186 | — | — | 246 | |||||||||||||||||||||||||||
| Provision |
(761 | ) | 675 | 728 | 801 | 4 | 56 | (24 | ) | (229 | ) | 1,250 | ||||||||||||||||||||||||
|
|
|
|
|
|
|
|
|
|
|
|
|
|
|
|
|
|
|
|||||||||||||||||||
| Ending balance at December 31, 2019 |
$ | 331 | $ | 11,596 | $ | 2,566 | $ | 11,464 | $ | 2,194 | $ | 312 | $ | 1,065 | $ | 57 | $ | 29,585 | ||||||||||||||||||
|
|
|
|
|
|
|
|
|
|
|
|
|
|
|
|
|
|
|
|||||||||||||||||||
| Amount of allowance for loan losses for loans deemed to be impaired |
$ | — | $ | 15 | $ | — | $ | 87 | $ | — | $ | — | $ | — | $ | — | $ | 102 | ||||||||||||||||||
| Amount of allowance for loan losses for loans not deemed to be impaired |
$ | 331 | $ | 11,581 | $ | 2,566 | $ | 11,377 | $ | 2,194 | $ | 312 | $ | 1,065 | $ | 57 | $ | 29,483 | ||||||||||||||||||
| Loans: |
||||||||||||||||||||||||||||||||||||
| Ending balance |
$ | 8,992 | $ | 812,417 | $ | 120,455 | $ | 786,102 | $ | 371,897 | $ | 21,893 | $ | 304,363 | $ | — | $ | 2,426,119 | ||||||||||||||||||
| Loans deemed to be impaired |
$ | — | $ | 906 | $ | — | $ | 2,346 | $ | — | $ | — | $ | — | $ | — | $ | 3,252 | ||||||||||||||||||
| Loans not deemed to be impaired |
$ | 8,992 | $ | 811,511 | $ | 120,455 | $ | 783,756 | $ | 371,897 | $ | 21,893 | $ | 304,363 | $ | — | $ | 2,422,867 | ||||||||||||||||||
60
Table of Contents
Notes to Consolidated Financial Statements
Further information pertaining to the allowance for loan losses at December 31, 2018 follows:
| Construction and Land Development |
Commercial and Industrial |
Municipal | Commercial Real Estate |
Residential Real Estate |
Consumer | Home Equity |
Unallocated | Total | ||||||||||||||||||||||||||||
| (dollars in thousands) | ||||||||||||||||||||||||||||||||||||
| Allowance for Loan Losses: |
||||||||||||||||||||||||||||||||||||
| Balance at December 31, 2017 |
$ | 1,645 | $ | 9,651 | $ | 1,720 | $ | 9,728 | $ | 1,873 | $ | 373 | $ | 989 | $ | 276 | $ | 26,255 | ||||||||||||||||||
| Charge-offs |
— | (67 | ) | — | — | (450 | ) | (316 | ) | — | — | (833 | ) | |||||||||||||||||||||||
| Recoveries |
1,436 | 57 | — | — | 75 | 203 | — | — | 1,771 | |||||||||||||||||||||||||||
| Provision |
(1,989 | ) | 1,357 | 118 | 935 | 692 | 105 | 122 | 10 | 1,350 | ||||||||||||||||||||||||||
|
|
|
|
|
|
|
|
|
|
|
|
|
|
|
|
|
|
|
|||||||||||||||||||
| Ending balance at December 31, 2018 |
$ | 1,092 | $ | 10,998 | $ | 1,838 | $ | 10,663 | $ | 2,190 | $ | 365 | $ | 1,111 | $ | 286 | $ | 28,543 | ||||||||||||||||||
|
|
|
|
|
|
|
|
|
|
|
|
|
|
|
|
|
|
|
|||||||||||||||||||
| Amount of allowance for loan losses for loans deemed to be impaired |
$ | — | $ | 54 | $ | — | $ | 91 | $ | — | $ | — | $ | — | $ | — | $ | 145 | ||||||||||||||||||
| Amount of allowance for loan losses for loans not deemed to be impaired |
$ | 1,092 | $ | 10,944 | $ | 1,838 | $ | 10,572 | $ | 2,190 | $ | 365 | $ | 1,111 | $ | 286 | $ | 28,398 | ||||||||||||||||||
| Loans: |
||||||||||||||||||||||||||||||||||||
| Ending balance |
$ | 13,628 | $ | 761,625 | $ | 97,290 | $ | 750,362 | $ | 348,250 | $ | 22,083 | $ | 292,340 | $ | — | $ | 2,285,578 | ||||||||||||||||||
| Loans deemed to be impaired |
$ | — | $ | 401 | $ | — | $ | 2,650 | $ | — | $ | — | $ | — | $ | — | $ | 3,051 | ||||||||||||||||||
| Loans not deemed to be impaired |
$ | 13,628 | $ | 761,224 | $ | 97,290 | $ | 747,712 | $ | 348,250 | $ | 22,083 | $ | 292,340 | $ | — | $ | 2,282,527 | ||||||||||||||||||
CREDIT QUALITY INFORMATION
The Company utilizes a six-grade internal loan rating system for commercial real estate, construction and commercial loans as follows:
Loans rated 1-3 (Pass)—Loans in this category are considered “pass” rated loans with low to average risk.
Loans rated 4 (Monitor)—These loans represent classified loans that management is closely monitoring for credit quality. These loans have had or may have minor credit quality deterioration as of December 31, 2019.
Loans rated 5 (Substandard)—Substandard loans represent classified loans that management is closely monitoring for credit quality. These loans have had more significant credit quality deterioration as of December 31, 2019.
Loans rated 6 (Doubtful)—Doubtful loans represent classified loans that management is closely monitoring for credit quality. These loans had more significant credit quality deterioration as of December 31, 2019 and are doubtful for full collection.
Impaired—Impaired loans represent classified loans that management is closely monitoring for credit quality. A loan is classified as impaired when it is probable that the Company will be unable to collect all amounts due.
61
Table of Contents
Notes to Consolidated Financial Statements
The following table presents the Company’s loans by risk rating at December 31, 2019.
| Construction |
Commercial and Industrial |
Municipal | Commercial | |||||||||
| (dollars in thousands) | ||||||||||||
| Grade: |
||||||||||||
| 1-3 (Pass) |
$ 8,992 | $ | 807,486 | $ | 120,455 | $759,402 | ||||||
| 4 (Monitor) |
— | 4,025 | — | 24,354 | ||||||||
| 5 (Substandard) |
— | — | — | — | ||||||||
| 6 (Doubtful) |
— | — | — | — | ||||||||
| Impaired |
— | 906 | — | 2,346 | ||||||||
|
|
|
|
|
|
| |||||||
| Total |
$ 8,992 | $ | 812,417 | $ | 120,455 | $786,102 | ||||||
|
|
|
|
|
|
| |||||||
The Company has increased its exposure to larger loans to large institutions with publicly available credit ratings. These ratings are tracked as a credit quality indicator for these loans.
The following table presents the Company’s loans by credit rating at December 31, 2019.
| Commercial and Industrial |
Municipal | Commercial Real Estate |
Total | |||||||||||||
| (dollars in thousands) | ||||||||||||||||
| Credit Rating: |
||||||||||||||||
| Aaa-Aa3 |
$ | 523,644 | $ | 53,273 | $ | 40,437 | $ | 617,354 | ||||||||
| A1-A3 |
186,044 | 7,354 | 148,346 | 341,744 | ||||||||||||
| Baa1-Baa3 |
— | 51,133 | 144,711 | 195,844 | ||||||||||||
| Ba1 |
— | 5,895 | — | 5,895 | ||||||||||||
|
|
|
|
|
|
|
|
|
|||||||||
| Total |
$ | 709,688 | $ | 117,655 | $ | 333,494 | $ | 1,160,837 | ||||||||
|
|
|
|
|
|
|
|
|
|||||||||
The following table presents the Company’s loans by risk rating at December 31, 2018.
| Construction and Land Development |
Commercial and Industrial |
Municipal | Commercial Real Estate |
|||||||||||||
| (dollars in thousands) | ||||||||||||||||
| Grade: |
||||||||||||||||
| 1-3 (Pass) |
$ | 13,628 | $ | 757,089 | $ | 97,290 | $ | 723,170 | ||||||||
| 4 (Monitor) |
— | 4,135 | — | 24,542 | ||||||||||||
| 5 (Substandard) |
— | — | — | — | ||||||||||||
| 6 (Doubtful) |
— | — | — | — | ||||||||||||
| Impaired |
— | 401 | — | 2,650 | ||||||||||||
|
|
|
|
|
|
|
|
|
|||||||||
| Total |
$ | 13,628 | $ | 761,625 | $ | 97,290 | $ | 750,362 | ||||||||
|
|
|
|
|
|
|
|
|
|||||||||
62
Table of Contents
Notes to Consolidated Financial Statements
The following table presents the Company’s loans by credit rating at December 31, 2018.
| Commercial and Industrial |
Municipal | Commercial Real Estate |
Total | |||||||||||||
| (dollars in thousands) | ||||||||||||||||
| Credit Rating: |
||||||||||||||||
| Aaa-Aa3 |
$ | 491,247 | $ | 54,105 | $ | 42,790 | $ | 588,142 | ||||||||
| A1-A3 |
172,472 | 7,605 | 151,381 | 331,458 | ||||||||||||
| Baa1-Baa3 |
— | 26,970 | 118,197 | 145,167 | ||||||||||||
| Ba1 |
— | 6,810 | — | 6,810 | ||||||||||||
|
|
|
|
|
|
|
|
|
|||||||||
| Total |
$ | 663,719 | $ | 95,490 | $ | 312,368 | $ | 1,071,577 | ||||||||
|
|
|
|
|
|
|
|
|
|||||||||
The Company utilized payment performance as credit quality indicators for residential real estate, consumer and overdrafts, and the home equity portfolio. The indicators are depicted in the table “aging of past-due loans,” below.
AGING OF PAST-DUE LOANS
At December 31, 2019 the aging of past due loans are as follows:
| Accruing 30-89 Days Past Due |
Non Accrual |
Accruing Greater Than 90 Days |
Total Past Due |
Current Loans |
Total | |||||||||||||||||||
| (dollars in thousands) | ||||||||||||||||||||||||
| Construction and land development |
$ | — | $ | — | $ | — | $ | — | $ | 8,992 | $ | 8,992 | ||||||||||||
| Commercial and industrial |
227 | 400 | — | 627 | 811,790 | 812,417 | ||||||||||||||||||
| Municipal |
— | — | — | — | 120,455 | 120,455 | ||||||||||||||||||
| Commercial real estate |
840 | 492 | — | 1,332 | 784,770 | 786,102 | ||||||||||||||||||
| Residential real estate |
1,563 | 683 | — | 2,246 | 369,651 | 371,897 | ||||||||||||||||||
| Consumer and overdrafts |
18 | 4 | — | 22 | 21,871 | 21,893 | ||||||||||||||||||
| Home equity |
603 | 435 | — | 1,038 | 303,325 | 304,363 | ||||||||||||||||||
|
|
|
|
|
|
|
|
|
|
|
|
|
|||||||||||||
| Total |
$ | 3,251 | $ | 2,014 | $ | — | $ | 5,265 | $ | 2,420,854 | $ | 2,426,119 | ||||||||||||
|
|
|
|
|
|
|
|
|
|
|
|
|
|||||||||||||
At December 31, 2018 the aging of past due loans are as follows:
| Accruing 30-89 Days Past Due |
Non Accrual |
Accruing Greater Than 90 Days |
Total Past Due |
Current Loans |
Total | |||||||||||||||||||
| (dollars in thousands) | ||||||||||||||||||||||||
| Construction and land development |
$ | — | $ | — | $ | — | $ | — | $ | 13,628 | $ | 13,628 | ||||||||||||
| Commercial and industrial |
187 | 115 | — | 302 | 761,323 | 761,625 | ||||||||||||||||||
| Municipal |
— | — | — | — | 97,290 | 97,290 | ||||||||||||||||||
| Commercial real estate |
774 | 190 | — | 964 | 749,398 | 750,362 | ||||||||||||||||||
| Residential real estate |
2,554 | 569 | — | 3,123 | 345,127 | 348,250 | ||||||||||||||||||
| Consumer and overdrafts |
24 | 14 | — | 38 | 22,045 | 22,083 | ||||||||||||||||||
| Home equity |
1,108 | 425 | — | 1,533 | 290,807 | 292,340 | ||||||||||||||||||
|
|
|
|
|
|
|
|
|
|
|
|
|
|||||||||||||
| Total |
$ | 4,647 | $ | 1,313 | $ | — | $ | 5,960 | $ | 2,279,618 | $ | 2,285,578 | ||||||||||||
|
|
|
|
|
|
|
|
|
|
|
|
|
|||||||||||||
63
Table of Contents
Notes to Consolidated Financial Statements
IMPAIRED LOANS
A loan is impaired when, based on current information and events, it is probable that a creditor will be unable to collect all amounts due according to the contractual terms of the loan agreement. When a loan is impaired, the Company measures impairment based on the present value of expected future cash flows discounted at the loan’s effective interest rate, except that as a practical expedient, the Company measures impairment based on a loan’s observable market price or the fair value of the collateral if the loan is collateral dependent. Loans are charged-off when management believes that the collectibility of the loan’s principal is not probable. The specific factors that management considers in making the determination that the collectibility of the loan’s principal is not probable include; the delinquency status of the loan, the fair value of the collateral, if secured, and the financial strength of the borrower and/or guarantors. For collateral dependent loans, the amount of the recorded investment in a loan that exceeds the fair value of the collateral is charged-off against the allowance for loan losses in lieu of an allocation of a specific allowance amount when such an amount has been identified definitively as uncollectible. The Company’s policy for recognizing interest income on impaired loans is contained within Note 1 of the “Notes to Consolidated Financial Statements.”
The following is information pertaining to impaired loans at December 31, 2019:
| Carrying Value |
Unpaid Balance Principal |
Required Reserve |
Average Carrying Value Recognized |
Interest Income |
||||||||||||||||
| (dollars in thousands) | ||||||||||||||||||||
| With no required reserve recorded: |
||||||||||||||||||||
| Construction and land development |
$ | — | $ | — | $ | — | $ | — | $ | — | ||||||||||
| Commercial and industrial |
770 | 976 | — | 138 | 6 | |||||||||||||||
| Municipal |
— | — | — | — | — | |||||||||||||||
| Commercial real estate |
160 | 189 | — | 445 | — | |||||||||||||||
| Residential real estate |
— | — | — | — | — | |||||||||||||||
| Consumer |
— | — | — | — | — | |||||||||||||||
| Home equity |
— | — | — | — | — | |||||||||||||||
|
|
|
|
|
|
|
|
|
|
|
|||||||||||
| Total |
$ | 930 | $ | 1,165 | $ | — | $ | 583 | $ | 6 | ||||||||||
|
|
|
|
|
|
|
|
|
|
|
|||||||||||
| With required reserve recorded: |
||||||||||||||||||||
| Construction and land development |
$ | — | $ | — | $ | — | $ | — | $ | — | ||||||||||
| Commercial and industrial |
136 | 137 | 15 | 264 | 7 | |||||||||||||||
| Municipal |
— | — | — | — | — | |||||||||||||||
| Commercial real estate |
2,186 | 2,306 | 87 | 2,314 | 90 | |||||||||||||||
| Residential real estate |
— | — | — | — | — | |||||||||||||||
| Consumer |
— | — | — | — | — | |||||||||||||||
| Home equity |
— | — | — | — | — | |||||||||||||||
|
|
|
|
|
|
|
|
|
|
|
|||||||||||
| Total |
$ | 2,322 | $ | 2,443 | $ | 102 | $ | 2,578 | $ | 97 | ||||||||||
|
|
|
|
|
|
|
|
|
|
|
|||||||||||
| Total |
||||||||||||||||||||
| Construction and land development |
$ | — | $ | — | $ | — | $ | — | $ | — | ||||||||||
| Commercial and industrial |
906 | 1,113 | 15 | 402 | 13 | |||||||||||||||
| Municipal |
— | — | — | — | — | |||||||||||||||
| Commercial real estate |
2,346 | 2,495 | 87 | 2,759 | 90 | |||||||||||||||
| Residential real estate |
— | — | — | — | — | |||||||||||||||
| Consumer |
— | — | — | — | — | |||||||||||||||
| Home equity |
— | — | — | — | — | |||||||||||||||
|
|
|
|
|
|
|
|
|
|
|
|||||||||||
| Total |
$ | 3,252 | $ | 3,608 | $ | 102 | $ | 3,161 | $ | 103 | ||||||||||
|
|
|
|
|
|
|
|
|
|
|
|||||||||||
64
Table of Contents
Notes to Consolidated Financial Statements
The following is information pertaining to impaired loans at December 31, 2018:
| Carrying Value |
Unpaid Balance Principal |
Required Reserve |
Average Carrying Value Recognized |
Interest Income |
||||||||||||||||
| (dollars in thousands) | ||||||||||||||||||||
| With no required reserve recorded: |
||||||||||||||||||||
| Construction and land development |
$ | — | $ | — | $ | — | $ | — | $ | — | ||||||||||
| Commercial and industrial |
87 | 291 | — | 46 | 5 | |||||||||||||||
| Municipal |
— | — | — | — | — | |||||||||||||||
| Commercial real estate |
189 | 212 | — | 249 | — | |||||||||||||||
| Residential real estate |
— | — | — | — | — | |||||||||||||||
| Consumer |
— | — | — | — | — | |||||||||||||||
| Home equity |
— | — | — | — | — | |||||||||||||||
|
|
|
|
|
|
|
|
|
|
|
|||||||||||
| Total |
$ | 276 | $ | 503 | $ | — | $ | 295 | $ | 5 | ||||||||||
|
|
|
|
|
|
|
|
|
|
|
|||||||||||
| With required reserve recorded: |
||||||||||||||||||||
| Construction and land development |
$ | — | $ | — | $ | — | $ | — | $ | — | ||||||||||
| Commercial and industrial |
314 | 315 | 54 | 462 | 13 | |||||||||||||||
| Municipal |
— | — | — | — | — | |||||||||||||||
| Commercial real estate |
2,461 | 2,575 | 91 | 2,322 | 97 | |||||||||||||||
| Residential real estate |
— | — | — | 2,412 | 81 | |||||||||||||||
| Consumer |
— | — | — | — | — | |||||||||||||||
| Home equity |
— | — | — | — | — | |||||||||||||||
|
|
|
|
|
|
|
|
|
|
|
|||||||||||
| Total |
$ | 2,775 | $ | 2,890 | $ | 145 | $ | 5,196 | $ | 191 | ||||||||||
|
|
|
|
|
|
|
|
|
|
|
|||||||||||
| Total |
||||||||||||||||||||
| Construction and land development |
$ | — | $ | — | $ | — | $ | — | $ | — | ||||||||||
| Commercial and industrial |
401 | 606 | 54 | 508 | 18 | |||||||||||||||
| Municipal |
— | — | — | — | — | |||||||||||||||
| Commercial real estate |
2,650 | 2,787 | 91 | 2,571 | 97 | |||||||||||||||
| Residential real estate |
— | — | — | 2,412 | 81 | |||||||||||||||
| Consumer |
— | — | — | — | — | |||||||||||||||
| Home equity |
— | — | — | — | — | |||||||||||||||
|
|
|
|
|
|
|
|
|
|
|
|||||||||||
| Total |
$ | 3,051 | $ | 3,393 | $ | 145 | $ | 5,491 | $ | 196 | ||||||||||
|
|
|
|
|
|
|
|
|
|
|
|||||||||||
Troubled Debt Restructurings are identified as a modification in which a concession was granted to a customer who was having financial difficulties. This concession may be below market rate, longer amortization/term, or a lower payment amount. The present value calculation of the modification did not result in an increase in the allowance for these loans beyond any previously established allocations.
There was one commercial and industrial loan that was modified during the first quarter of 2019. The loan was modified by reducing the interest rates as well as extending the term on the loan. The pre-modification and post-modification outstanding recorded investment was $39,000. The financial impact for the modification was not material. This loan was subsequently charged off during the third quarter of 2019. Also, there were no commitments to lend additional funds to troubled debt restructuring borrowers.
There was one residential real estate loan and one consumer loan that were modified during the first quarter of 2018. The loans were modified by reducing the interest rates as well as extending the terms on both loans. The pre-modification and post-modification outstanding recorded investment was $2,675,000 for the residential real
65
Table of Contents
Notes to Consolidated Financial Statements
estate loan that was not accruing interest. The pre-modification and post-modification outstanding recorded investment was $17,000 for the consumer loan that was accruing interest. The financial impact for the modifications was not material. Both troubled debt restructurings subsequently defaulted during 2018. The residential real estate loan was partially charged off for $450,000 and was recorded as other real estate owned for $2,225,000 during the fourth quarter of 2018. This property was subsequently sold during the third quarter of 2019. Other real estate owned is included in other assets on the balance sheet. The consumer loan was fully charged off during the fourth quarter of 2018.
| 7. | Bank Premises and Equipment |
| December 31, |
2019 | 2018 | Estimated Useful Life | |||||||
| (dollars in thousands) | ||||||||||
| Land |
$ | 7,246 | $ | 3,850 | — | |||||
| Bank premises |
28,175 | 21,659 | 30-39 years | |||||||
| Furniture and equipment |
33,259 | 30,088 | 3-10 years | |||||||
| Leasehold improvements |
12,674 | 12,674 | 30-39 years or lease term | |||||||
|
|
|
|
|
|||||||
| 81,354 | 68,271 | |||||||||
| Accumulated depreciation and amortization |
(47,402 | ) | (44,350 | ) | ||||||
|
|
|
|
|
|||||||
| Total |
$ | 33,952 | $ | 23,921 | ||||||
|
|
|
|
|
|||||||
Depreciation and amortization amounted to $3,235,000, $3,206,000, and $3,135,000 at December 31, 2019, 2018 and 2017, respectively.
| 8. | Goodwill and Identifiable Intangible Assets |
At December 31, 2019 and 2018, the Company concluded that it is not more likely than not that fair value of the reporting unit is less than its carrying value, and goodwill is not considered to be impaired.
The changes in goodwill and identifiable intangible assets for the years ended December 31, 2019 and 2018 are shown in the table below.
| Carrying Amount of Goodwill and Intangibles |
Goodwill | Mortgage Servicing Rights |
Total | |||||||||
| (dollars in thousands) | ||||||||||||
| Balance at December 31, 2017 |
$ | 2,714 | $ | 1,525 | $ | 4,239 | ||||||
| Additions |
— | — | — | |||||||||
| Amortization Expense |
— | (299 | ) | (299 | ) | |||||||
|
|
|
|
|
|
|
|||||||
| Balance at December 31, 2018 |
$ | 2,714 | $ | 1,226 | $ | 3,940 | ||||||
| Additions |
— | 237 | 237 | |||||||||
| Amortization Expense |
— | (261 | ) | (261 | ) | |||||||
|
|
|
|
|
|
|
|||||||
| Balance at December 31, 2019 |
$ | 2,714 | $ | 1,202 | $ | 3,916 | ||||||
|
|
|
|
|
|
|
|||||||
| 9. | Fair Value Measurements |
The Company follows FASB ASC 820-10, Fair Value Measurements and Disclosures, which among other things, requires enhanced disclosures about assets and liabilities carried at fair value. ASC 820-10 establishes a hierarchal disclosure framework associated with the level of pricing observability utilized in measuring financial instruments at fair value. The three broad levels of the hierarchy are as follows:
66
Table of Contents
Notes to Consolidated Financial Statements
Level I—Quoted prices are available in active markets for identical assets or liabilities as of the reported date. The type of financial instruments included in Level I are highly liquid cash instruments with quoted prices such as G-7 government, agency securities, listed equities and money market securities, as well as listed
derivative instruments.
Level II—Pricing inputs are other than quoted prices in active markets, which are either directly or indirectly observable as of the reported date. The nature of these financial instruments include cash instruments for which quoted prices are available but traded less frequently, derivative instruments whose fair value have been derived using a model where inputs to the model are directly observable in the market, or can be derived principally from or corroborated by observable market data, and instruments that are fair valued using other financial instruments, the parameters of which can be directly observed. Instruments which are generally included in this category are corporate bonds and loans, mortgage whole loans, municipal bonds and OTC derivatives.
Level III—These instruments have little to no pricing observability as of the reported date. These financial instruments do not have two-way markets and are measured using management’s best estimate of fair value, where the inputs into the determination of fair value require significant management judgment or estimation. Instruments that are included in this category generally include certain commercial mortgage loans, certain private equity investments, distressed debt, non-investment grade residual interests in securitizations, as well as certain highly structured OTC derivative contracts.
The results of the fair value hierarchy as of December 31, 2019, are as follows:
| Fair Value Measurements Using | ||||||||||||||||
| Carrying Value |
Quoted Prices in Active Markets for Identical Assets (Level 1) |
Significant Observable Inputs (Level 2) |
Significant Other Unobservable Inputs (Level 3) |
|||||||||||||
| (dollars in thousands) | ||||||||||||||||
| Financial Instruments Measured at Fair Value on a Recurring Basis |
||||||||||||||||
| Securities AFS |
||||||||||||||||
| U.S. Treasury |
$ | — | $ | — | $ | — | $ | — | ||||||||
| U.S. Government Agency Sponsored Enterprises |
— | — | — | — | ||||||||||||
| SBA Backed Securities |
54,211 | — | 54,211 | — | ||||||||||||
| U.S. Government Agency and Sponsored Enterprises Mortgage-Backed Securities |
184,187 | — | 184,187 | — | ||||||||||||
| Privately Issued Residential Mortgage-Backed Securities |
396 | — | 396 | — | ||||||||||||
| Obligations Issued by States and Political Subdivisions |
18,076 | — | 4,775 | 13,301 | ||||||||||||
| Other Debt Securities |
3,632 | — | 3,632 | — | ||||||||||||
|
|
|
|
|
|
|
|
|
|||||||||
| Total |
$ | 260,502 | $ | — | $ | 247,201 | $ | 13,301 | ||||||||
|
|
|
|
|
|
|
|
|
|||||||||
| Equity Securities |
$ | 1,688 | $ | 343 | $ | 1,345 | $ | — | ||||||||
| Financial Instruments Measured at Fair Value on a Non-recurring Basis |
||||||||||||||||
| Impaired Loans |
$ | 877 | $ | — | $ | — | $ | 877 | ||||||||
67
Table of Contents
Notes to Consolidated Financial Statements
Impaired loan balances in the table above represent those collateral dependent loans where management has estimated the credit loss by comparing the loan’s carrying value against the expected realizable fair value of the collateral. Fair value is generally determined through a review process that includes independent appraisals, discounted cash flows, or other external assessments of the underlying collateral, which generally include various Level 3 inputs which are not identifiable. The Company discounts the fair values, as appropriate, based on management’s observations of the local real estate market for loans in this category. Appraisals, discounted cash flows and real estate tax assessments are reviewed quarterly. There is no specific policy regarding how frequently appraisals will be updated. Adjustments are made to appraisals and real estate tax assessments based on management’s estimate of changes in real estate values. Within the past twelve months there have been no updated appraisals, however, all impaired loans have been reviewed during the past quarter using either a discounted cash flow analysis or other type of real estate tax assessment. The types of adjustments that are made to specific provisions relate to impaired loans recognized for 2019 for the estimated credit loss amounted to $79,000.
There were no transfers between level 1, 2 and 3 for the year ended December 31, 2019. There were no liabilities measured at fair value on a recurring or nonrecurring basis during the year ended December 31, 2019.
The following table presents additional information about assets measured at fair value on a recurring and nonrecurring basis for which the Company has utilized Level 3 inputs to determine fair value (dollars in thousands) at December 31, 2019. Management continues to monitor the assumptions used to value the assets listed below.
| Asset |
Fair Value |
Valuation Technique |
Unobservable Input |
Unobservable Input | ||||
| Securities AFS(1) |
$ 13,301 | Discounted cash flow | Discount rate | 1.5%-3.2%(2) | ||||
| Impaired Loans |
877 | Appraisal of collateral(3) | Appraisal adjustments(4) | 0%-30% discount |
| (1) | Municipal securities generally have maturities of one year or less and, therefore, the amortized cost equates to the fair value. |
| (2) | Weighted averages. |
| (3) | Fair value is generally determined through independent appraisals of the underlying collateral, which generally include various Level 3 inputs which are not identifiable. |
| (4) | Appraisals may be adjusted by management for qualitative factors such as economic conditions and estimated expenses. |
The changes in Level 3 securities for the year ended December 31, 2019 are as shown in the table below:
| Auction Rate Securities |
Obligations Issued by States and Political Subdivisions |
Total | ||||||||||
| (dollars in thousands) | ||||||||||||
| Balance at December 31, 2018 |
$ | — | $ | 88,728 | $ | 88,728 | ||||||
| Purchases |
— | 21,408 | 21,408 | |||||||||
| Maturities/redemptions |
— | (96,812 | ) | (96,812 | ) | |||||||
| Transfer to Level 2 |
— | — | — | |||||||||
| Amortization |
— | (23 | ) | (23 | ) | |||||||
| Change in fair value |
— | — | — | |||||||||
|
|
|
|
|
|
|
|||||||
| Balance at December 31, 2019 |
$ | — | $ | 13,301 | $ | 13,301 | ||||||
|
|
|
|
|
|
|
|||||||
The amortized cost of Level 3 securities was $13,301,000 with an unrealized loss of $0 at December 31, 2019. The securities in this category are generally municipal securities with no readily determinable fair value or failed
68
Table of Contents
Notes to Consolidated Financial Statements
auction rate securities. Management evaluated the fair value of these securities based on an evaluation of the underlying issuer, prevailing rates and market liquidity.
The results of the fair value hierarchy as of December 31, 2018, are as follows:
| Fair Value Measurements Using | ||||||||||||||||
| Carrying Value |
Quoted Prices in Active Markets for Identical Assets (Level 1) |
Significant Observable Inputs (Level 2) |
Significant Other Unobservable Inputs (Level 3) |
|||||||||||||
| (dollars in thousands) | ||||||||||||||||
| Financial Instruments Measured at Fair Value on a Recurring Basis Securities AFS |
||||||||||||||||
| U.S. Treasury |
$ | 1,992 | $ | — | $ | 1,992 | $ | — | ||||||||
| U.S. Government Agency Sponsored Enterprises |
3,915 | — | 3,915 | — | ||||||||||||
| SBA Backed Securities |
70,194 | — | 70,194 | — | ||||||||||||
| U.S. Government Agency and Sponsored Enterprises Mortgage-Backed Securities |
162,890 | — | 162,890 | — | ||||||||||||
| Privately Issued Residential Mortgage-Backed Securities |
672 | — | 672 | — | ||||||||||||
| Obligations Issued by States and Political Subdivisions |
93,503 | — | 4,775 | 88,728 | ||||||||||||
| Other Debt Securities |
3,593 | — | 3,593 | — | ||||||||||||
|
|
|
|
|
|
|
|
|
|||||||||
| Total |
$ | 336,759 | $ | — | $ | 248,031 | $ | 88,728 | ||||||||
|
|
|
|
|
|
|
|
|
|||||||||
| Equity Securities |
$ | 1,596 | $ | 293 | $ | 1,303 | $ | — | ||||||||
| Financial Instruments Measured at Fair Value on a Non-recurring Basis |
||||||||||||||||
| Impaired Loans |
$ | 251 | $ | — | $ | — | $ | 251 | ||||||||
| Other Real Estate Owned |
$ | 2,225 | $ | — | $ | — | $ | 2,225 | ||||||||
Impaired loan balances in the table above represent those collateral dependent loans where management has estimated the credit loss by comparing the loan’s carrying value against the expected realizable fair value of the collateral. Fair value is generally determined through a review process that includes independent appraisals, discounted cash flows, or other external assessments of the underlying collateral, which generally include various Level 3 inputs which are not identifiable. The Company discounts the fair values, as appropriate, based on management’s observations of the local real estate market for loans in this category.
Appraisals, discounted cash flows and real estate tax assessments are reviewed quarterly. There is no specific policy regarding how frequently appraisals will be updated. Adjustments are made to appraisals and real estate tax assessments based on management’s estimate of changes in real estate values. Within the past twelve months there have been no updated appraisals, however, all impaired loans have been reviewed during the past quarter using either a discounted cash flow analysis or other type of real estate tax assessment. The types of adjustments that are made to specific provisions relate to impaired loans recognized for 2018 for the estimated credit loss amounted to $540,000.
There was a transfer of an auction rate security during 2018 from level 3 to level 2. Quoted prices on the auction rate security became available but traded infrequently. There were no other transfers between level 1, 2 and 3 for the year ended December 31, 2018. There were no liabilities measured at fair value on a recurring or nonrecurring basis during the year ended December 31, 2018.
69
Table of Contents
Notes to Consolidated Financial Statements
The following table presents additional information about assets measured at fair value on a recurring and nonrecurring basis for which the Company has utilized Level 3 inputs to determine fair value (dollars in thousands) at December 31, 2018. Management continues to monitor the assumptions used to value the assets listed below.
| Asset |
Fair Value | Valuation Technique |
Unobservable Input |
Unobservable Input | ||||||
| Securities AFS(1) |
$ | 88,728 | Discounted cash flow | Discount rate | 2.1%-4.1%(2) | |||||
| Other Real Estate Owned |
2,225 | Appraisal of collateral(3) | Appraisal adjustments (4) | 30% discount | ||||||
| Impaired Loans |
251 | Appraisal of collateral(3) | Appraisal adjustments (4) | 0%-30% discount | ||||||
| (1) | Municipal securities generally have maturities of one year or less and, therefore, the amortized cost equates to the fair value. |
| (2) | Weighted averages. |
| (3) | Fair value is generally determined through independent appraisals of the underlying collateral, which generally include various Level 3 inputs which are not identifiable. |
| (4) | Appraisals may be adjusted by management for qualitative factors such as economic conditions and estimated expenses. |
The changes in Level 3 securities for the year ended December 31, 2018 are as shown in the table below:
| Auction Rate Securities |
Obligations Issued by States and Political Subdivisions |
Total | ||||||||||
| (dollars in thousands) | ||||||||||||
| Balance at December 31, 2017 |
$ | 4,459 | $ | 78,141 | $ | 82,600 | ||||||
| Purchases |
— | 132,470 | 132,470 | |||||||||
| Maturities/redemptions |
— | (121,753 | ) | (121,753 | ) | |||||||
| Transfer to Level 2 |
(4,459 | ) | — | (4,459 | ) | |||||||
| Amortization |
— | (130 | ) | (130 | ) | |||||||
| Change in fair value |
— | — | — | |||||||||
|
|
|
|
|
|
|
|||||||
| Balance at December 31, 2018 |
$ | — | $ | 88,728 | $ | 88,728 | ||||||
|
|
|
|
|
|
|
|||||||
The amortized cost of Level 3 securities was $88,728,000 with an unrealized loss of $0 at December 31, 2018. The securities in this category are generally municipal securities with no readily determinable fair value or failed auction rate securities. Management evaluated the fair value of these securities based on an evaluation of the underlying issuer, prevailing rates and market liquidity.
| 10. | Deposits |
The following is a summary of remaining maturities or re-pricing of time deposits as of December 31,
| 2019 | Percent | 2018 | Percent | |||||||||||||
| (dollars in thousands) | ||||||||||||||||
| Within one year |
$ | 383,497 | 69 | % | $ | 413,297 | 74 | % | ||||||||
| Over one year to two years |
123,016 | 22 | % | 88,815 | 16 | % | ||||||||||
| Over two years to three years |
27,223 | 5 | % | 39,924 | 7 | % | ||||||||||
| Over three years to five years |
21,711 | 4 | % | 18,543 | 3 | % | ||||||||||
|
|
|
|
|
|
|
|
|
|||||||||
| Total |
$ | 555,447 | 100 | % | $ | 560,579 | 100 | % | ||||||||
|
|
|
|
|
|
|
|
|
|||||||||
Time deposits of more than $250,000 totaled $342,809,000 and $293,046,000 in 2019 and 2018, respectively.
70
Table of Contents
Notes to Consolidated Financial Statements
Deposits totaling $34,964,000 and $36,794,000 were attributable to related parties at December 31, 2019 and December 31, 2018, respectively.
| 11. | Securities Sold Under Agreements to Repurchase |
The following is a summary of securities sold under agreements to repurchase as of December 31,
| 2019 | 2018 | 2017 | ||||||||||
| (dollars in thousands) | ||||||||||||
| Amount outstanding at December 31 |
$ | 266,045 | $ | 154,240 | $ | 158,990 | ||||||
| Weighted average rate at December 31 |
0.96 | % | 0.82 | % | 0.32 | % | ||||||
| Maximum amount outstanding at any month end |
$ | 307,235 | $ | 174,150 | $ | 228,848 | ||||||
| Daily average balance outstanding during the year |
$ | 224,361 | $ | 147,944 | $ | 189,684 | ||||||
| Weighted average rate during the year |
1.05 | % | 0.66 | % | 0.26 | % | ||||||
Amounts outstanding at December 31, 2019, 2018 and 2017 carried maturity dates of the next business day. U.S. Government Sponsored Enterprise securities with a total amortized cost of $264,737,000, $160,576,000, and $162,927,000 were pledged as collateral and held by custodians to secure the agreements at December 31, 2019, 2018 and 2017, respectively. The approximate fair value of the collateral at those dates was $265,687,000, $156,369,000, and $159,051,000, respectively.
| 12. | Other Borrowed Funds and Subordinated Debentures |
The following is a summary of other borrowed funds and subordinated debentures as of December 31,
| 2019 | 2018 | 2017 | ||||||||||
| (dollars in thousands) | ||||||||||||
| Amount outstanding at December 31 |
$ | 407,038 | $ | 238,461 | $ | 383,861 | ||||||
| Weighted average rate at December 31 |
2.37 | % | 2.76 | % | 2.26 | % | ||||||
| Maximum amount outstanding at any month end |
$ | 487,502 | $ | 542,913 | $ | 491,583 | ||||||
| Daily average balance outstanding during the year |
$ | 231,926 | $ | 291,674 | $ | 309,102 | ||||||
| Weighted average rate during the year |
2.95 | % | 2.61 | % | 2.42 | % | ||||||
FEDERAL HOME LOAN BANK BORROWINGS
Federal Home Loan Bank of Boston (“FHLBB”) borrowings are collateralized by a blanket pledge agreement on the Bank’s FHLBB stock, certain qualified investment securities, deposits at the FHLBB and residential mortgages held in the Bank’s portfolios. The Bank’s remaining term borrowing capacity at the FHLBB at December 31, 2019, was approximately $245,138,000. In addition, the Bank has a $14,500,000 line of credit with the FHLBB. A schedule of the maturity distribution of FHLBB advances with the weighted average interest rates is as follows:
| December 31, | 2019 | 2018 | 2017 | |||||||||||||||||||||
| Amount | Weighted Average Rate |
Amount | Weighted Average Rate |
Amount | Weighted Average Rate |
|||||||||||||||||||
| (dollars in thousands) | ||||||||||||||||||||||||
| Within one year |
$ | 218,000 | 1.86 | % | $ | 63,000 | 2.17 | % | $ | 164,500 | 1.82 | % | ||||||||||||
| Over one year to two years |
$ | 42,500 | 2.58 | % | $ | 28,000 | 2.29 | % | $ | 63,000 | 2.17 | % | ||||||||||||
| Over two years to three years |
$ | 3,500 | 2.15 | % | $ | 25,000 | 3.34 | % | $ | 28,000 | 2.29 | % | ||||||||||||
| Over three years to five years |
$ | 70,000 | 2.85 | % | $ | 33,500 | 2.23 | % | $ | 28,500 | 3.19 | % | ||||||||||||
| Over five years |
$ | 36,955 | 2.88 | % | $ | 52,878 | 2.47 | % | $ | 63,778 | 2.38 | % | ||||||||||||
|
|
|
|
|
|
|
|
|
|
|
|
|
|||||||||||||
| Total |
$ | 370,955 | 2.23 | % | $ | 202,378 | 2.42 | % | $ | 347,778 | 2.13 | % | ||||||||||||
|
|
|
|
|
|
|
|
|
|
|
|
|
|||||||||||||
71
Table of Contents
Notes to Consolidated Financial Statements
Included in the table above are $40,000,000, $40,000,000, and $20,000,000, respectively, of FHLBB advances at December 31, 2019, 2018 and 2017, that are puttable at the discretion of FHLBB. These put dates were not utilized in the table above.
During 2019, the Company restructured $15,000,000 of FHLBB advances. Prior to the restructure, the weighted average rate on these advances was 3.33% and the weighted average maturity was 14 months. Subsequent to the restructure, the weighted average rate was 2.37% and the weighted average maturity was 60 months.
SUBORDINATED DEBENTURES
Subordinated debentures totaled $36,083,000 at December 31, 2019 and 2018.
In December 2004, the Company consummated the sale of a trust preferred securities offering, in which it issued $36,083,000 of subordinated debt securities due 2034 to its newly formed unconsolidated subsidiary Century Bancorp Capital Trust II.
Century Bancorp Capital Trust II then issued 35,000 shares of Cumulative Trust Preferred Securities with a liquidation value of $1,000 per share. These securities paid dividends at an annualized rate of 6.65% for the first ten years and then converted to the three-month LIBOR rate plus 1.87% for the remaining 20 years. The coupon rate on these securities was 3.76% at December 31, 2019 and 4.66% at December 31, 2018.
OTHER BORROWED FUNDS
There were no overnight federal funds purchased at December 31, 2019 and 2018.
| 13. | Reclassifications Out of Accumulated Other Comprehensive Income(a) |
| Amount Reclassified from Accumulated Other Comprehensive Income |
||||||||||
| Details About Accumulated Other |
Year Ended December 31, 2019(a) |
Year Ended December 31, 2018(a) |
Affected Line Item in the Statement | |||||||
| Unrealized gains and losses on available-for-sale securities |
$ | 61 | $ | 302 | Net gains on sales of investments | |||||
| (17 | ) | (85 | ) | Provision for income taxes | ||||||
|
|
|
|
|
|||||||
| $ | 44 | $ | 217 | Net income | ||||||
|
|
|
|
|
|||||||
| Accretion of unrealized losses transferred |
$ | (1,022 | ) | $ | (1,477 | ) | Securities held-to-maturity | |||
| 269 | 391 | Provision for income taxes | ||||||||
|
|
|
|
|
|||||||
| $ | (753 | ) | $ | (1,086 | ) | Net income | ||||
|
|
|
|
|
|||||||
| Amortization of defined benefit pension items |
||||||||||
| Prior-service costs |
$ | (114 | ) | $ | (14 | ) | Salaries and employee benefits(b) | |||
| Actuarial gains (losses) |
(1,351 | ) | (1,610 | ) | Salaries and employee benefits(b) | |||||
|
|
|
|
|
|||||||
| Total before tax |
(1,465 | ) | (1,624 | ) | Income before taxes | |||||
| Tax (expense) or benefit |
412 | 457 | Provision for income taxes | |||||||
|
|
|
|
|
|||||||
| Net of tax |
$ | (1,053 | ) | $ | (1,167 | ) | Net income | |||
|
|
|
|
|
|||||||
| (a) | Amounts in parentheses indicate decreases to profit/loss. |
| (b) | These accumulated other comprehensive income components are included in the computation of net periodic pension cost (see employee benefits footnote (Note 17) for additional details). |
72
Table of Contents
Notes to Consolidated Financial Statements
| 14. | Earnings Per Share (“EPS”) |
Class A and Class B shares participate equally in undistributed earnings. Under the Company’s Articles of Organization, the holders of Class A Common Stock are entitled to receive dividends per share equal to at least 200% of dividends paid, if any, from time to time, on each share of Class B Common Stock.
Diluted EPS includes the dilutive effect of common stock equivalents; basic EPS excludes all common stock equivalents. There were no common stock equivalents for 2019, 2018 and 2017, respectively.
The following table is a reconciliation of basic EPS and diluted EPS:
| Year Ended December 31, |
2019 | 2018 | 2017 | |||||||||
| (in thousands except share and per share data) | ||||||||||||
| BASIC EPS COMPUTATION |
||||||||||||
| Numerator: |
||||||||||||
| Net income, Class A |
$ | 31,351 | $ | 28,479 | $ | 17,526 | ||||||
| Net income, Class B |
8,348 | 7,734 | 4,775 | |||||||||
| Denominator: |
||||||||||||
| Weighted average shares outstanding, Class A |
3,633,044 | 3,608,179 | 3,604,029 | |||||||||
| Weighted average shares outstanding, Class B |
1,934,865 | 1,959,730 | 1,963,880 | |||||||||
| Basic EPS, Class A |
$ | 8.63 | $ | 7.89 | $ | 4.86 | ||||||
| Basic EPS, Class B |
$ | 4.31 | $ | 3.95 | $ | 2.43 | ||||||
|
|
|
|
|
|
|
|||||||
| DILUTED EPS COMPUTATION |
||||||||||||
| Numerator: |
||||||||||||
| Net income, Class A |
$ | 31,351 | $ | 28,479 | $ | 17,526 | ||||||
| Net income, Class B |
8,348 | 7,734 | 4,775 | |||||||||
|
|
|
|
|
|
|
|||||||
| Total net income, for diluted EPS, Class A computation |
39,699 | 36,213 | 22,301 | |||||||||
| Denominator: |
||||||||||||
| Weighted average shares outstanding, basic, Class A |
3,633,044 | 3,608,179 | 3,604,029 | |||||||||
| Weighted average shares outstanding, Class B |
1,934,865 | 1,959,730 | 1,963,880 | |||||||||
|
|
|
|
|
|
|
|||||||
| Weighted average shares outstanding diluted, Class A |
5,567,909 | 5,567,909 | 5,567,909 | |||||||||
| Weighted average shares outstanding, Class B |
1,934,865 | 1,959,730 | 1,963,880 | |||||||||
| Diluted EPS, Class A |
$ | 7.13 | $ | 6.50 | $ | 4.01 | ||||||
| Diluted EPS, Class B |
$ | 4.31 | $ | 3.95 | $ | 2.43 | ||||||
|
|
|
|
|
|
|
|||||||
| 15. | Stockholders’ Equity |
DIVIDENDS
Holders of the Class A common stock may not vote in the election of directors but may vote as a class to approve certain extraordinary corporate transactions. Holders of Class B common stock may vote in the election of directors. Class A common stockholders are entitled to receive dividends per share equal to at least 200% per share of that paid, if any, on each share of Class B common stock. Class A common stock is publicly traded.
73
Table of Contents
Notes to Consolidated Financial Statements
Class B common stock is not publicly traded; however, it can be converted on a per share basis to Class A common stock at any time at the option of the holder. Dividend payments by the Company are dependent in part on the dividends it receives from the Bank, which are subject to certain regulatory restrictions.
STOCK OPTION PLAN
During 2000 and 2004, common stockholders of the Company approved stock option plans (the “Option Plans”) that provide for granting of options for not more than 150,000 shares of Class A common stock per plan. Under the Option Plans, all officers and key employees of the Company are eligible to receive nonqualified and incentive stock options to purchase shares of Class A common stock. The Option Plans are administered by the Compensation Committee of the Board of Directors, whose members are ineligible to participate in the Option Plans. Based on management’s recommendations, the Committee submits its recommendations to the Board of Directors as to persons to whom options are to be granted, the number of shares granted to each, the option price (which may not be less than 85% of the fair market value for nonqualified stock options, or the fair market value for incentive stock options, of the shares on the date of grant) and the time period over which the options are exercisable (not more than ten years from the date of grant). There were no options outstanding at December 31, 2019 and December 31, 2018.
CAPITAL RATIOS
The Bank and the Company are subject to various regulatory requirements administered by federal banking agencies. Failure to meet minimum capital requirements can initiate certain mandatory and possibly additional discretionary actions by regulators that, if undertaken, could have a direct material effect on the Bank and Company’s financial statements. Under capital adequacy guidelines and regulatory framework for prompt corrective action, the Bank and Company must meet specific capital guidelines that involve quantitative measures of the Bank and Company’s assets and liabilities, and certain off-balance-sheet items as calculated under regulatory accounting practices. The Bank and Company’s capital amounts and classification are also subject to qualitative judgments by the regulators about components, risk weightings and other factors.
Quantitative measures established by regulation to ensure capital adequacy require the Bank and the Company to maintain minimum amounts and ratios (set forth in the table below) of total and Tier 1 capital (as defined in the regulation) to risk-weighted assets (as defined) and Tier 1 capital (as defined) to average assets (as defined). Management believes, as of December 31, 2019, that the Bank and the Company meet all capital adequacy requirements to which they are subject.
The Basel Committee has issued capital standards entitled “Basel III: A global framework for more resilient banks and banking systems” (Basel III). The Federal Reserve has finalized its rule implementing the Basel III regulatory capital framework. The rule was effective in January 2015 and sets the Basel III minimum Regulatory capital requirements. To be categorized as well capitalized, the Bank must maintain minimum total risk-based, Common Equity tier 1, tier 1 risk-based, and Tier 1 leverage ratios as set forth in the table. There are no conditions or events since that notification that management believes would cause a change in the Bank’s categorization.
74
Table of Contents
Notes to Consolidated Financial Statements
The Bank’s actual capital amounts and ratios are presented in the following table:
| Actual | For Capital Adequacy Purposes |
To Be Well Capitalized Under Prompt Corrective Action Provisions |
||||||||||||||||||||||
| Amount | Ratio | Amount | Ratio | Amount | Ratio | |||||||||||||||||||
| As of December 31, 2019 (Basel III) |
||||||||||||||||||||||||
| Total Capital (to Risk-Weighted Assets) |
$ | 401,850 | 13.57 | % | $ | 236,830 | 8.00 | % | $ | 296,037 | 10.00 | % | ||||||||||||
| Tier 1 Capital (to Risk-Weighted Assets) |
372,265 | 12.57 | % | 177,622 | 6.00 | % | 236,830 | 8.00 | % | |||||||||||||||
| Common Equity Tier 1 Capital (to Risk-Weighted Assets) |
372,265 | 12.57 | % | 133,217 | 4.50 | % | 192,424 | 6.50 | % | |||||||||||||||
| Tier 1 Capital (to 4th Qtr. Average Assets) |
372,265 | 7.01 | % | 212,549 | 4.00 | % | 265,686 | 5.00 | % | |||||||||||||||
| As of December 31, 2018 (Basel III) |
||||||||||||||||||||||||
| Total Capital (to Risk-Weighted Assets) |
$ | 364,744 | 13.24 | % | $ | 220,335 | 8.00 | % | $ | 275,419 | 10.00 | % | ||||||||||||
| Tier 1 Capital (to Risk-Weighted Assets) |
336,201 | 12.21 | % | 165,251 | 6.00 | % | 220,335 | 8.00 | % | |||||||||||||||
| Common Equity Tier 1 Capital (to Risk-Weighted Assets) |
336,201 | 12.21 | % | 123,938 | 4.50 | % | 179,022 | 6.50 | % | |||||||||||||||
| Tier 1 Capital (to 4th Qtr. Average Assets) |
336,201 | 6.68 | % | 201,228 | 4.00 | % | 251,535 | 5.00 | % | |||||||||||||||
The Company’s actual capital amounts and ratios are presented in the following table:
| Actual | For Capital Adequacy Purposes |
To Be Well Capitalized Under Prompt Corrective Action Provisions |
||||||||||||||||||||||
| Amount | Ratio | Amount | Ratio | Amount | Ratio | |||||||||||||||||||
| As of December 31, 2019 (Basel III) |
||||||||||||||||||||||||
| Total Capital (to Risk-Weighted Assets) |
$ | 415,863 | 13.97 | % | $ | 238,132 | 8.00 | % | $ | 297,665 | 10.00 | % | ||||||||||||
| Tier 1 Capital (to Risk-Weighted Assets) |
386,308 | 12.98 | % | 178,599 | 6.00 | % | 238,132 | 8.00 | % | |||||||||||||||
| Common Equity Tier 1 Capital (to Risk-Weighted Assets) |
351,308 | 11.80 | % | 133,949 | 4.50 | % | 193,482 | 6.50 | % | |||||||||||||||
| Tier 1 Capital (to 4th Qtr. Average Assets) |
386,308 | 7.25 | % | 213,222 | 4.00 | % | 266,528 | 5.00 | % | |||||||||||||||
| As of December 31, 2018 (Basel III) |
||||||||||||||||||||||||
| Total Capital (to Risk-Weighted Assets) |
$ | 377,359 | 13.62 | % | $ | 221,690 | 8.00 | % | $ | 277,113 | 10.00 | % | ||||||||||||
| Tier 1 Capital (to Risk-Weighted Assets) |
348,816 | 12.59 | % | 166,268 | 6.00 | % | 221,690 | 8.00 | % | |||||||||||||||
| Common Equity Tier 1 Capital (to Risk-Weighted Assets) |
313,816 | 11.32 | % | 124,701 | 4.50 | % | 180,123 | 6.50 | % | |||||||||||||||
| Tier 1 Capital (to 4th Qtr. Average Assets) |
348,816 | 6.91 | % | 201,913 | 4.00 | % | 252,391 | 5.00 | % | |||||||||||||||
75
Table of Contents
Notes to Consolidated Financial Statements
| 16. | Income Taxes |
The current and deferred components of income tax expense (benefit) for the years ended December 31, are as follows:
| 2019 | 2018 | 2017 | ||||||||||
| (dollars in thousands) | ||||||||||||
| Current expense: |
||||||||||||
| Federal |
$ | 2,548 | $ | 2,637 | $ | 3,628 | ||||||
| State |
697 | 697 | 412 | |||||||||
|
|
|
|
|
|
|
|||||||
| Total current expense |
3,245 | 3,334 | 4,040 | |||||||||
|
|
|
|
|
|
|
|||||||
| Deferred (benefit) expense: |
||||||||||||
| Federal |
(1,660 | ) | (1,238 | ) | 6,496 | |||||||
| State |
(367 | ) | (528 | ) | 422 | |||||||
| Valuation allowance reversal |
(108 | ) | — | — | ||||||||
|
|
|
|
|
|
|
|||||||
| Total deferred (benefit) expense |
(2,135 | ) | (1,766 | ) | 6,918 | |||||||
|
|
|
|
|
|
|
|||||||
| Provision for income taxes |
$ | 1,110 | $ | 1,568 | $ | 10,958 | ||||||
|
|
|
|
|
|
|
|||||||
Income tax accounts included in other assets at December 31, are as follows:
| 2019 | 2018 | |||||||
| (dollars in thousands) | ||||||||
| Current receivable |
$ | 3,446 | $ | 13,194 | ||||
| Deferred income tax asset, net |
24,566 | 20,321 | ||||||
|
|
|
|
|
|||||
| Total |
$ | 28,012 | $ | 33,515 | ||||
|
|
|
|
|
|||||
Differences between income tax expense (benefit) at the statutory federal income tax rate and total income tax expense are summarized as follows:
| 2019 | 2018 | 2017 | ||||||||||
| (dollars in thousands) | ||||||||||||
| Federal income tax expense at statutory rates |
$ | 8,570 | $ | 7,934 | $ | 11,308 | ||||||
| State income tax, net of federal income tax benefit |
261 | 134 | 550 | |||||||||
| Insurance income |
(265 | ) | (176 | ) | (371 | ) | ||||||
| Effect of tax-exempt interest |
(6,737 | ) | (6,510 | ) | (8,683 | ) | ||||||
| Net tax credit |
(292 | ) | (349 | ) | (341 | ) | ||||||
| Valuation allowance reversal |
(108 | ) | — | — | ||||||||
| Sequestration (reversal) accrual |
(438 | ) | 438 | — | ||||||||
| Deferred tax remeasurement |
— | — | 8,448 | |||||||||
| Other |
119 | 97 | 47 | |||||||||
|
|
|
|
|
|
|
|||||||
| Total |
$ | 1,110 | $ | 1,568 | $ | 10,958 | ||||||
|
|
|
|
|
|
|
|||||||
| Effective tax rate |
2.72 | % | 4.15 | % | 32.95 | % | ||||||
76
Table of Contents
Notes to Consolidated Financial Statements
The following table sets forth the Company’s gross deferred income tax assets and gross deferred income tax liabilities at December 31:
| 2019 | 2018 | |||||||
| (dollars in thousands) | ||||||||
| Deferred income tax assets: |
||||||||
| Allowance for loan losses |
$ | 8,354 | $ | 8,058 | ||||
| Deferred compensation |
8,910 | 8,184 | ||||||
| Pension and SERP liability |
8,770 | 6,506 | ||||||
| Operating lease liabilities |
3,567 | — | ||||||
| Unrealized losses on securities transferred to held-to-maturity |
643 | 912 | ||||||
| Depreciation |
1,060 | 908 | ||||||
| QZAB credit |
812 | — | ||||||
| Accrued bonus |
708 | 717 | ||||||
| Charitable contributions carryforward |
276 | 389 | ||||||
| Nonaccrual interest |
115 | 109 | ||||||
| Unrealized (gains) losses on securities available-for-sale |
114 | (2 | ) | |||||
| Other |
206 | 181 | ||||||
|
|
|
|
|
|||||
| Gross deferred income tax asset |
33,535 | 25,962 | ||||||
|
|
|
|
|
|||||
| Valuation allowance |
— | (108 | ) | |||||
|
|
|
|
|
|||||
| Gross deferred income tax asset, net of valuation allowance |
33,535 | 25,854 | ||||||
| Deferred income tax liabilities: |
||||||||
| Pension liability |
(4,258 | ) | (4,436 | ) | ||||
| Operating lease right-of-use assets |
(3,520 | ) | — | |||||
| Deferred origination costs |
(516 | ) | (524 | ) | ||||
| Prepaid expenses |
(337 | ) | (228 | ) | ||||
| Mortgage servicing rights |
(338 | ) | (345 | ) | ||||
|
|
|
|
|
|||||
| Gross deferred income tax liability |
(8,969 | ) | (5,533 | ) | ||||
|
|
|
|
|
|||||
| Deferred income tax asset net |
$ | 24,566 | $ | 20,321 | ||||
|
|
|
|
|
|||||
Based on the Company’s historical and current pre-tax earnings, management believes it is more likely than not that the Company will realize the deferred income tax asset existing at December 31, 2019. During 2019, the valuation allowance on a charitable contribution carryforward was reversed. Management believes that existing net deductible temporary differences which give rise to the deferred tax asset will reverse during periods in which the Company generates net taxable income. In addition, gross deductible temporary differences are expected to reverse in periods during which offsetting gross taxable temporary differences are expected to reverse. Factors beyond management’s control, such as the general state of the economy and real estate values, can affect future levels of taxable income, and no assurance can be given that sufficient taxable income will be generated to fully absorb gross deductible temporary differences.
On December 22, 2017, the Tax Cuts and Jobs Act (the “Tax Act”) was enacted. The majority of the provisions of the Tax Act took effect on January 1, 2018. The Tax Act lowers the Company’s federal tax rate from 34% to 21%. The Company remeasured its deferred taxes at 21% as of the enactment date and recorded additional tax expense of $8,448,000. Also, for tax years beginning after December 31, 2018, the corporate Alternative Minimum Tax (“AMT”) has been repealed. For 2017 through 2021, the AMT credit carryforward can offset
77
Table of Contents
Notes to Consolidated Financial Statements
regular tax liability and is refundable in an amount equal to 50% (100% for 2021) of the excess of the minimum tax credit for the tax year over the amount of the credit allowable for the year against regular tax liability. Accordingly, the full amount of the alternative minimum tax credit carryforward will be recovered in tax years beginning before 2022. The Tax Act also contains other provisions that may affect the Company currently or in future years. Among these are changes to the deductibility of meals and entertainment, the deductibility of executive compensation, the dividend received deduction and net operating loss carryforwards.
The Company is in an Alternative Minimum Tax (“AMT”) credit position. As the AMT has been repealed and the existing credit is refundable, the AMT credit, totaling $5,664,000, has been reclassified to currently receivable. Of this amount, the Company expects to recover $4,069,000 with the filing of its 2019 federal tax return. The Company and its subsidiaries file a consolidated federal tax return. The Company is subject to federal and state examinations for tax years after December 31, 2015.
| 17. | Employee Benefits |
The Company has a Qualified Defined Benefit Pension Plan (the “Plan”), which had been offered to all employees reaching minimum age and service requirements. In 2006, the Bank became a member of the Savings Bank Employees Retirement Association (“SBERA”) within which it then began maintaining the Qualified Defined Benefit Pension Plan. SBERA offers a common and collective trust as the underlying investment structure for its retirement plans. The target allocation mix for the common and collective trust portfolio calls for an equity-based investment deployment range of 43% to 57% of total portfolio assets. The remainder of the portfolio is allocated to fixed income securities with target range of 15% to 25% and other investments including global asset allocation and hedge funds from 15% to 31%.
The Trustees of SBERA, through its Investment Committee, select investment managers for the common and collective trust portfolio. A professional investment advisory firm is retained by the Investment Committee to provide allocation analysis, performance measurement and to assist with manager searches. The overall investment objective is to diversify investments across a spectrum of investment types to limit risks from large market swings. The Company closed the plan to employees hired after March 31, 2006.
The measurement date for the Plan is December 31 for each year. The benefits expected to be paid in each year from 2020 to 2024 are $1,798,000, $2,023,000, $2,157,000, $2,270,000, and $2,451,000, respectively. The aggregate benefits expected to be paid in the five years from 2025 to 2029 are $15,005,000.
The framework for measuring fair value provides a fair value hierarchy that prioritizes the inputs to valuation techniques used to measure fair value. The hierarchy gives the highest priority to unadjusted quoted prices in active markets for identical assets or liabilities (level 1) and the lowest priority to unobservable inputs (level 3). Valuation techniques maximize the use of relevant observable inputs and minimize the use of unobservable inputs. The three levels of the fair value hierarchy under Topic 820 are described as follows:
LEVEL 1
Inputs to the valuation methodology are quoted market prices (unadjusted) for identical assets or liabilities in active markets that the Company has the ability to access at the measurement date.
LEVEL 2
Inputs other than quoted prices included within level 1 that are observable for the asset or liability, either directly or indirectly, such as: quoted prices for similar assets or liabilities in active markets; quoted prices for identical or similar assets or liabilities in inactive markets; inputs other that quoted prices that are observable for the asset or liability; or inputs that are derived principally from or corroborated by observable market data by correlation or
78
Table of Contents
Notes to Consolidated Financial Statements
other means. If the asset or liability has specified (contractual) term, the level 2 input must be observable for substantially the full term of the asset or liability.
LEVEL 3
Inputs that are unobservable inputs for the asset or liability.
Below is a description of the valuation methodologies used for assets measured at fair value.
Collective Funds
Valued at either the closing price reported on the active market on which the individual securities are traded or valued at the net asset value (NAV) of units of a collective trust. The NAV, as provided by the trustee, is used as a practical expedient to estimate fair value. The NAV is based on the fair value of the underlying investments held by the fund less its liabilities. This practical expedient is not used when it is determined to be probable that the fund will sell the investment for an amount different than the reported NAV. Participant transactions (purchases and sales) may occur daily. Were SBERA to initiate a full redemption of the collective trust, the investment advisor reserves the right to temporarily delay withdrawal from the trust in order to ensure that securities liquidations will be carried out in an orderly business manner.
Equity Securities
Valued at the closing price reported on the active market on which the individual securities are traded.
Mutual Funds
Valued at the daily closing price as reported by the fund. Mutual funds held open-end mutual funds that are registered with the U.S. Securities and Exchange Commission. The funds are required to publish their daily NAV and to transact at that price.
The mutual funds held are deemed to be actively traded.
Limited Partnerships and Hedge Funds
The funds are valued at NAV, without further adjustment, as calculated by the fund’s manager based upon the terms and conditions of the organization documents of the underlying investments, with further consideration to portfolio risks.
The following table sets forth by level, within the fair value hierarchy, the plan’s assets at fair value. Classification within the fair value hierarchy table is based upon the lowest level of any input that is significant to the fair value measurement:
The fair value of plan assets and major categories as of December 31, 2019, is as follows:
| Description |
Percent | NAV | Level 1 | Level 2 | Level 3 | Total | ||||||||||||||||||
| (dollars in thousands) | ||||||||||||||||||||||||
| Collective Funds |
8.3 | % | $ | — | $ | 4,289 | $ | — | $ | — | $ | 4,289 | ||||||||||||
| Equity Securities |
9.7 | % | — | 5,016 | — | — | 5,016 | |||||||||||||||||
| Diversified Mutual Funds |
31.1 | % | — | 16,081 | — | — | 16,081 | |||||||||||||||||
|
|
|
|
|
|
|
|
|
|
|
|
|
|||||||||||||
| Total investments measured in the fair value hierarchy |
49.1 | % | — | 25,386 | — | — | 25,386 | |||||||||||||||||
| Investments measured at net asset value(1) |
50.9 | % | 26,274 | — | — | — | 26,274 | |||||||||||||||||
|
|
|
|
|
|
|
|
|
|
|
|
|
|||||||||||||
| 100.0% | $26,274 | $25,386 | $— | $— | $51,660 | |||||||||||||||||||
|
|
|
|
|
|
|
|
|
|
|
|
|
|||||||||||||
| (1) | In accordance with Subtopic 820-10, certain investments that were measured at net asset value per share (or its equivalent) have not been classified in the fair value hierarchy. |
79
Table of Contents
Notes to Consolidated Financial Statements
The fair value of plan assets and major categories as of December 31, 2018, is as follows:
| Description |
Percent | NAV | Level 1 | Level 2 | Level 3 | Total | ||||||||||||||||||
| (dollars in thousands) | ||||||||||||||||||||||||
| Collective Funds |
5.6 | % | $ | — | $ | 2,504 | $ | — | $ | — | $ | 2,504 | ||||||||||||
| Equity Securities |
10.9 | % | — | 4,863 | — | — | 4,863 | |||||||||||||||||
| Diversified Mutual Funds |
30.7 | % | — | 13,612 | — | — | 13,612 | |||||||||||||||||
| Short-term investments |
0.1 | % | — | 60 | — | — | 60 | |||||||||||||||||
|
|
|
|
|
|
|
|
|
|
|
|
|
|||||||||||||
| Total investments measured in the fair value hierarchy |
47.3 | % | — | 21,039 | — | — | 21,039 | |||||||||||||||||
| Investments measured at net asset value(1) |
52.7 | % | 23,398 | — | — | — | 23,398 | |||||||||||||||||
|
|
|
|
|
|
|
|
|
|
|
|
|
|||||||||||||
| 100.0 | % | $ | 23,398 | $ | 21,039 | $ | — | $ | — | $ | 44,437 | |||||||||||||
|
|
|
|
|
|
|
|
|
|
|
|
|
|||||||||||||
| (1) | In accordance with Subtopic 820-10, certain investments that were measured at net asset value per share (or its equivalent) have not been classified in the fair value hierarchy. |
INVESTMENTS MEASURED USING THE NET ASSET VALUE PER SHARE PRACTICAL EXPEDIENT
The following table summarizes investments for which fair value is measured using the net asset value per share practical expedient. There are no participant redemption restrictions for these investments.
The investments measured using the net asset value per share practical expedient as of December 31, 2019, is as follows:
| Percent | Fair Value | |||||||
| (dollars in thousands) | ||||||||
| Collective Funds by Category: |
||||||||
| Equity |
19.3 | % | $ | 9,932 | ||||
| US debt securities |
15.2 | % | 7,874 | |||||
| International equities |
10.1 | % | 5,208 | |||||
| Limited Partnerships by Category: |
||||||||
| Emerging markets |
3.2 | % | 1,635 | |||||
| Multi-strategy |
1.2 | % | 644 | |||||
| Hedge Funds by Category: |
||||||||
| Global opportunities(2) |
0.5 | % | 259 | |||||
| Private investment entities and/or separately managed accounts(3) |
1.4 | % | 722 | |||||
|
|
|
|
|
|||||
| 50.9 | % | $ | 26,274 | |||||
|
|
|
|
|
|||||
80
Table of Contents
Notes to Consolidated Financial Statements
The investments measured using the net asset value per share practical expedient as of December 31, 2018, is as follows:
| Percent | Fair Value | |||||||
| (dollars in thousands) | ||||||||
| Collective Funds by Category: |
||||||||
| Equity |
20.8 | % | $ | 9,204 | ||||
| Diversified |
0.0 | % | — | |||||
| US debt securities |
12.1 | % | 5,386 | |||||
| International equities |
9.7 | % | 4,311 | |||||
| Limited Partnerships by Category: |
||||||||
| Emerging markets |
2.9 | % | 1,289 | |||||
| Multi-strategy |
1.9 | % | 826 | |||||
| Hedge Funds by Category: |
||||||||
| Multi-strategy(1) |
3.6 | % | 1,593 | |||||
| Global opportunities(2) |
0.3 | % | 150 | |||||
| Private investment entities and/or separately managed accounts(3) |
1.4 | % | 639 | |||||
|
|
|
|
|
|||||
| 52.7 | % | $ | 23,398 | |||||
|
|
|
|
|
|||||
| (1) | This category includes investments in hedge funds that pursue multiple strategies to diversify risks and reduce volatility. Fund objectives are to seek above-average rates of return and long-term capital growth through in-vestments, which are fund of funds with a diversified portfolio of private investment entities and/or separately managed accounts managed by investment managers or achieve superior risk-adjusted capital appreciation over the long-term, generally through an investment, which invests in private investment funds and discretional managed accounts, structured notes, swaps or other similar products. The fair values of the investments in this category have been determined using the net asset value per share of the fund(s). |
| (2) | This category has an investment strategy to pursue a hybrid absolute return via portfolio managers, secondaries, and co-investments with a flexible and opportunistic mandate tactically allocating capital to look to capitalize on market dislocations and inefficiencies. The opportunities are expected to fall within the following strategies: Niche Alternatives and Private Credit and Hedge Fund secondaries. The fair value of the investments in this category have been determined using the last sales price, for listed securities, and in accordance with the agreement terms for portfolio-managed investments, notes, swaps, and other similar products. |
| (3) | The Fund’s investment objective is to invest in highly attractive, select investment opportunities by maintaining investments through private investment entities and/or separately managed accounts (each, an Investment or a Portfolio and collectively, the Investments or the Portfolios) with investment management professionals (each a Manager and collectively, the Managers) specializing in various alternative investment strategies. The Managers have broad investment experience and the ability to leverage their existing relationships with corporate management teams, investment banks and other institutions to gain access to certain investment opportunities. As such, the Manager is presented with “best idea” investment opportunities, typically in asset classes where market dislocations or other events have created attractive investment opportunities. The Managers are not restricted in the investment strategies that they may employ across different asset classes and regions. The Manager anticipates that any number of strategies will be eligible for consideration for investment by the Fund and the Fund reserves the right to invest in any particular strategy or asset class it deems appropriate. |
The Company has a Supplemental Executive Insurance/Retirement Plan (the Supplemental Plan), which is limited to certain officers and employees of the Company. The Supplemental Plan is voluntary. Under the
81
Table of Contents
Notes to Consolidated Financial Statements
Supplemental Plan, each participant will receive a retirement benefit based on compensation and length of service. Life insurance policies, which are owned by the Company, are purchased covering the lives of each participant.
The benefits expected to be paid in each year from 2020 to 2024 are $2,373,000, $2,318,000, $2,409,000, $2,692,000 and $3,138,000, respectively. The aggregate benefits expected to be paid in the five years from 2025 to 2029 are $18,017,000.
| Defined Benefit Pension Plan | Supplemental Insurance/ Retirement Plan |
|||||||||||||||
| 2019 | 2018 | 2019 | 2018 | |||||||||||||
| (dollars in thousands) | ||||||||||||||||
| Change projected in benefit obligation |
||||||||||||||||
| Benefit obligation at beginning of year |
$ | 40,509 | $ | 47,065 | $ | 40,405 | $ | 42,579 | ||||||||
| Service cost |
1,103 | 1,411 | 1,024 | 1,107 | ||||||||||||
| Interest cost |
1,892 | 1,481 | 1,926 | 1,386 | ||||||||||||
| Actuarial (gain)/loss |
7,099 | (8,263 | ) | 7,537 | (3,591 | ) | ||||||||||
| Benefits paid |
(1,169 | ) | (1,185 | ) | (916 | ) | (1,076 | ) | ||||||||
|
|
|
|
|
|
|
|
|
|||||||||
| Projected benefit obligation at end of year |
$ | 49,434 | $ | 40,509 | $ | 49,976 | $ | 40,405 | ||||||||
|
|
|
|
|
|
|
|
|
|||||||||
| Change in plan assets |
||||||||||||||||
| Fair value of plan assets at beginning of year |
$ | 44,437 | $ | 48,422 | ||||||||||||
| Actual return (loss) on plan assets |
8,392 | (2,800 | ) | |||||||||||||
| Employer contributions |
— | — | ||||||||||||||
| Benefits paid |
(1,169 | ) | (1,185 | ) | ||||||||||||
|
|
|
|
|
|||||||||||||
| Fair value of plan assets at end of year |
$ | 51,660 | $ | 44,437 | ||||||||||||
|
|
|
|
|
|||||||||||||
| (Unfunded) Funded status |
$ | 2,226 | $ | 3,928 | $ | (49,976 | ) | $ | (40,405 | ) | ||||||
|
|
|
|
|
|
|
|
|
|||||||||
| Accumulated benefit obligation |
$ | 49,434 | $ | 40,509 | $ | 45,238 | $ | 36,984 | ||||||||
|
|
|
|
|
|
|
|
|
|||||||||
| Weighted-average assumptions as of December 31 |
||||||||||||||||
| Discount rate—Liability |
3.71 | % | 4.76 | % | 3.71 | % | 4.79 | % | ||||||||
| Discount rate—Expense |
4.76 | % | 3.49 | % | 4.79 | % | 3.42 | % | ||||||||
| Expected return on plan assets |
7.50 | % | 8.00 | % | NA | NA | ||||||||||
| Rate of compensation increase |
4.00 | % | 4.00 | % | 4.00 | % | 4.00 | % | ||||||||
| Components of net periodic benefit cost |
||||||||||||||||
| Service cost |
$ | 1,103 | $ | 1,411 | $ | 1,024 | $ | 1,107 | ||||||||
| Interest cost |
1,892 | 1,481 | 1,926 | 1,386 | ||||||||||||
| Expected return on plan assets |
(3,275 | ) | (3,813 | ) | — | — | ||||||||||
| Recognized prior service cost |
— | (100 | ) | 114 | 114 | |||||||||||
| Recognized net losses |
916 | 904 | 435 | 706 | ||||||||||||
|
|
|
|
|
|
|
|
|
|||||||||
| Net periodic cost (benefit) |
$ | 636 | $ | (117 | ) | $ | 3,499 | $ | 3,313 | |||||||
|
|
|
|
|
|
|
|
|
|||||||||
| Other changes in plan assets and benefit obligations recognized in other comprehensive income |
||||||||||||||||
| Amortization of prior service cost |
$ | — | $ | 100 | $ | (114 | ) | $ | (114 | ) | ||||||
| Net (gain) loss |
1,066 | (2,554 | ) | 7,101 | (4,298 | ) | ||||||||||
|
|
|
|
|
|
|
|
|
|||||||||
| Total recognized in other comprehensive income |
1,066 | (2,454 | ) | 6,987 | (4,412 | ) | ||||||||||
|
|
|
|
|
|
|
|
|
|||||||||
| Total recognized in net periodic benefit cost and other comprehensive income |
$ | 1,702 | $ | (2,571 | ) | $ | 10,486 | $ | (1,099 | ) | ||||||
|
|
|
|
|
|
|
|
|
|||||||||
82
Table of Contents
Notes to Consolidated Financial Statements
| Plan | December 31, 2019 Supplemental Plan |
Total | Plan | December 31, 2018 Supplemental Plan |
Total | |||||||||||||||||||
| (dollars in thousands) |
||||||||||||||||||||||||
| Prior service cost |
$ | — | $ | (307 | ) | $ | (307 | ) | $ | — | $ | (421 | ) | $ | (421 | ) | ||||||||
| Net actuarial loss |
(12,920 | ) | (17,971 | ) | (30,891 | ) | (11,854 | ) | (10,870 | ) | (22,724 | ) | ||||||||||||
|
|
|
|
|
|
|
|
|
|
|
|
|
|||||||||||||
| Total |
$ | (12,920 | ) | $ | (18,278 | ) | $ | (31,198 | ) | $ | (11,854 | ) | $ | (11,291 | ) | $ | (23,145 | ) | ||||||
|
|
|
|
|
|
|
|
|
|
|
|
|
|||||||||||||
83
Table of Contents
Notes to Consolidated Financial Statements
84
Table of Contents
Notes to Consolidated Financial Statements
85
Table of Contents
Notes to Consolidated Financial Statements
| Fair Value Measurements | ||||||||||||||||||||
| Carrying Amount |
Estimated Fair Value |
Level 1 Inputs |
Level 2 Inputs |
Level 3 Inputs |
||||||||||||||||
| (dollars in thousands) |
||||||||||||||||||||
| December 31, 2019 |
||||||||||||||||||||
| Financial assets: |
||||||||||||||||||||
| Securities held-to-maturity |
$ | 2,351,120 | $ | 2,361,304 | $ | — | $ | 2,361,304 | $ | — | ||||||||||
| Loans(1) |
2,396,534 | 2,424,770 | — | — | 2,424,770 | |||||||||||||||
| Financial liabilities: |
||||||||||||||||||||
| Time deposits |
555,447 | 560,746 | — | 560,746 | — | |||||||||||||||
| Other borrowed funds |
370,955 | 374,531 | — | 374,531 | — | |||||||||||||||
| Subordinated debentures |
36,083 | 36,083 | — | 36,083 | — | |||||||||||||||
| December 31, 2018 |
||||||||||||||||||||
| Financial assets: |
||||||||||||||||||||
| Securities held-to-maturity |
$ | 2,046,647 | $ | 1,991,421 | $ | — | $ | 1,991,421 | $ | — | ||||||||||
| Loans(1) |
2,257,035 | 2,279,712 | — | — | 2,279,712 | |||||||||||||||
| Financial liabilities: |
||||||||||||||||||||
| Time deposits |
560,579 | 559,988 | — | 559,988 | — | |||||||||||||||
| Other borrowed funds |
202,378 | 203,122 | — | 203,122 | — | |||||||||||||||
| Subordinated debentures |
36,083 | 36,083 | — | 36,083 | — | |||||||||||||||
| (1) | Comprised of loans (including collateral dependent impaired loans), net of deferred loan costs and the allowance for loan losses. |
86
Table of Contents
Notes to Consolidated Financial Statements
87
Table of Contents
Notes to Consolidated Financial Statements
| Year ended December 31, 2019 |
Revenue from Contracts in Scope of Topic 606 |
Year ended December 31, 2018 |
Revenue from Contracts in Scope of Topic 606 |
Year ended December 31, 2017 |
Revenue from Contracts in Scope of Topic 606 |
|||||||||||||||||||
| (dollars in thousands) |
||||||||||||||||||||||||
| Total net interest income |
$ | 95,789 | $ | — | $ | 92,576 | $ | — | $ | 85,616 | $ | — | ||||||||||||
| Noninterest income: |
||||||||||||||||||||||||
| Service charges on deposit accounts |
9,220 | 9,220 | 8,560 | 8,560 | 8,586 | 8,586 | ||||||||||||||||||
| Lockbox fees |
3,973 | 3,973 | 3,274 | 3,274 | 3,290 | 3,290 | ||||||||||||||||||
| Brokerage commissions |
277 | — | 348 | — | 353 | — | ||||||||||||||||||
| Net gains on sales of securities |
61 | — | 302 | — | 47 | — | ||||||||||||||||||
| Gains on sales of mortgage loans |
412 | — | — | — | 370 | — | ||||||||||||||||||
| Other income |
4,456 | 2,799 | 3,764 | 2,536 | 3,906 | 2,429 | ||||||||||||||||||
|
|
|
|
|
|
|
|
|
|
|
|
|
|||||||||||||
| Total noninterest income |
18,399 | 15,992 | 16,248 | 14,370 | 16,552 | 14,305 | ||||||||||||||||||
|
|
|
|
|
|
|
|
|
|
|
|
|
|||||||||||||
| Total revenues |
$ | 114,188 | $ | 15,992 | $ | 108,824 | $ | 14,370 | $ | 102,168 | $ | 14,305 | ||||||||||||
|
|
|
|
|
|
|
|
|
|
|
|
|
|||||||||||||
The following table provides information about receivables with customers.
| December 31, |
2019 | 2018 | 2017 | |||||||||
| (dollars in thousands) |
||||||||||||
| Receivables, which are included in “Other assets” |
$ | 1,200 | $ | 1,205 | $ | 1,009 | ||||||
88
Table of Contents
Notes to Consolidated Financial Statements
89
Table of Contents
Notes to Consolidated Financial Statements
| 24. | Quarterly Results of Operations (unaudited) |
| 2019 Quarters |
Fourth | Third | Second | First | ||||||||||||
| (in thousands, except share data) | ||||||||||||||||
| Interest income |
$ | 40,518 | $ | 39,852 | $ | 39,692 | $ | 39,077 | ||||||||
| Interest expense |
15,187 | 16,082 | 16,442 | 15,639 | ||||||||||||
|
|
|
|
|
|
|
|
|
|||||||||
| Net interest income |
25,331 | 23,770 | 23,250 | 23,438 | ||||||||||||
| Provision for loan losses |
550 | 75 | 250 | 375 | ||||||||||||
|
|
|
|
|
|
|
|
|
|||||||||
| Net interest income after provision for loan losses |
24,781 | 23,695 | 23,000 | 23,063 | ||||||||||||
| Other operating income |
4,689 | 4,286 | 4,997 | 4,427 | ||||||||||||
| Operating expenses |
18,212 | 17,462 | 18,264 | 18,190 | ||||||||||||
|
|
|
|
|
|
|
|
|
|||||||||
| Income before income taxes |
11,258 | 10,519 | 9,733 | 9,300 | ||||||||||||
| Provision for income taxes |
526 | 435 | 267 | (118 | ) | |||||||||||
|
|
|
|
|
|
|
|
|
|||||||||
| Net income |
$ | 10,732 | $ | 10,084 | $ | 9,466 | $ | 9,418 | ||||||||
|
|
|
|
|
|
|
|
|
|||||||||
| Share data: |
||||||||||||||||
| Average shares outstanding, basic |
||||||||||||||||
| Class A |
3,650,949 | 3,650,449 | 3,620,449 | 3,610,329 | ||||||||||||
| Class B |
1,916,960 | 1,917,460 | 1,947,460 | 1,957,580 | ||||||||||||
| Average shares outstanding, diluted |
||||||||||||||||
| Class A |
5,567,909 | 5,567,909 | 5,567,909 | 5,567,909 | ||||||||||||
| Class B |
1,916,960 | 1,917,460 | 1,947,460 | 1,957,580 | ||||||||||||
| Earnings per share, basic |
||||||||||||||||
| Class A |
$ | 2.33 | $ | 2.19 | $ | 2.06 | $ | 2.05 | ||||||||
| Class B |
$ | 1.16 | $ | 1.09 | $ | 1.03 | $ | 1.03 | ||||||||
| Earnings per share, diluted |
||||||||||||||||
| Class A |
$ | 1.93 | $ | 1.81 | $ | 1.70 | $ | 1.69 | ||||||||
| Class B |
$ | 1.16 | $ | 1.09 | $ | 1.03 | $ | 1.03 | ||||||||
90
Table of Contents
Notes to Consolidated Financial Statements
| 2018 Quarters |
Fourth | Third | Second | First | ||||||||||||
| (in thousands, except share data) | ||||||||||||||||
| Interest income |
$ | 37,453 | $ | 34,765 | $ | 33,408 | $ | 31,430 | ||||||||
| Interest expense |
13,748 | 11,561 | 10,209 | 8,962 | ||||||||||||
|
|
|
|
|
|
|
|
|
|||||||||
| Net interest income |
23,705 | 23,204 | 23,199 | 22,468 | ||||||||||||
| Provision for loan losses |
450 | — | 450 | 450 | ||||||||||||
|
|
|
|
|
|
|
|
|
|||||||||
| Net interest income after provision for loan losses |
23,255 | 23,204 | 22,749 | 22,018 | ||||||||||||
| Other operating income |
4,164 | 4,169 | 3,722 | 4,193 | ||||||||||||
| Operating expenses |
17,185 | 17,348 | 17,159 | 18,001 | ||||||||||||
|
|
|
|
|
|
|
|
|
|||||||||
| Income before income taxes |
10,234 | 10,025 | 9,312 | 8,210 | ||||||||||||
| Provision for income taxes |
309 | 444 | 314 | 501 | ||||||||||||
|
|
|
|
|
|
|
|
|
|||||||||
| Net income |
$ | 9,925 | $ | 9,581 | $ | 8,998 | $ | 7,709 | ||||||||
|
|
|
|
|
|
|
|
|
|||||||||
| Share data: |
||||||||||||||||
| Average shares outstanding, basic |
||||||||||||||||
| Class A |
3,608,329 | 3,608,329 | 3,608,029 | 3,608,029 | ||||||||||||
| Class B |
1,959,580 | 1,959,580 | 1,959,880 | 1,959,880 | ||||||||||||
| Average shares outstanding, diluted |
||||||||||||||||
| Class A |
5,567,909 | 5,567,909 | 5,567,909 | 5,567,909 | ||||||||||||
| Class B |
1,959,580 | 1,959,580 | 1,959,880 | 1,959,880 | ||||||||||||
| Earnings per share, basic |
||||||||||||||||
| Class A |
$ | 2.16 | $ | 2.09 | $ | 1.96 | $ | 1.68 | ||||||||
| Class B |
$ | 1.08 | $ | 1.04 | $ | 0.98 | $ | 0.84 | ||||||||
| Earnings per share, diluted |
||||||||||||||||
| Class A |
$ | 1.78 | $ | 1.72 | $ | 1.62 | $ | 1.38 | ||||||||
| Class B |
$ | 1.08 | $ | 1.04 | $ | 0.98 | $ | 0.84 | ||||||||
| 25. | Parent Company Financial Statements |
The balance sheets of Century Bancorp, Inc. (“Parent Company”) as of December 31, 2019 and 2018 and the statements of income and cash flows for each of the years in the three-year period ended December 31, 2019, are presented below. The statements of changes in stockholders’ equity are identical to the consolidated statements of changes in stockholders’ equity and are therefore not presented here.
BALANCE SHEETS
| December 31, |
2019 | 2018 | ||||||
| (dollars in thousands) | ||||||||
| ASSETS: |
||||||||
| Cash |
$ | 3,177 | $ | 1,263 | ||||
| Investment in subsidiary, at equity |
353,489 | 322,775 | ||||||
| Other assets |
16,325 | 16,991 | ||||||
|
|
|
|
|
|||||
| Total assets |
$ | 372,991 | $ | 341,029 | ||||
|
|
|
|
|
|||||
| LIABILITIES AND STOCKHOLDERS’ EQUITY: |
||||||||
| Liabilities |
$ | 4,327 | $ | 4,507 | ||||
| Subordinated debentures |
36,083 | 36,083 | ||||||
| Stockholders’ equity |
332,581 | 300,439 | ||||||
|
|
|
|
|
|||||
| Total liabilities and stockholders’ equity |
$ | 372,991 | $ | 341,029 | ||||
|
|
|
|
|
|||||
91
Table of Contents
Notes to Consolidated Financial Statements
STATEMENTS OF INCOME
| Year Ended December 31, |
2019 | 2018 | 2017 | |||||||||
| (dollars in thousands) | ||||||||||||
| Income: |
||||||||||||
| Dividends from subsidiary |
$ | 5,000 | $ | 4,750 | $ | 2,500 | ||||||
| Interest income from deposits in bank |
— | — | 1 | |||||||||
| Other income |
65 | 53 | 34 | |||||||||
|
|
|
|
|
|
|
|||||||
| Total income |
5,065 | 4,803 | 2,535 | |||||||||
| Interest expense |
1,577 | 1,474 | 1,121 | |||||||||
| Operating expenses |
215 | 225 | 209 | |||||||||
|
|
|
|
|
|
|
|||||||
| Income before income taxes and equity in undistributed income of subsidiary |
3,273 | 3,104 | 1,205 | |||||||||
| Benefit from income taxes |
(363 | ) | (347 | ) | (440 | ) | ||||||
|
|
|
|
|
|
|
|||||||
| Income before equity in undistributed income of subsidiary |
3,636 | 3,451 | 1,645 | |||||||||
| Equity in undistributed income of subsidiary |
36,063 | 32,762 | 20,656 | |||||||||
|
|
|
|
|
|
|
|||||||
| Net income |
$ | 39,699 | $ | 36,213 | $ | 22,301 | ||||||
|
|
|
|
|
|
|
|||||||
STATEMENTS OF CASH FLOWS
| December 31, |
2019 | 2018 | 2017 | |||||||||
| (dollars in thousands) | ||||||||||||
| CASH FLOWS FROM OPERATING ACTIVITIES: |
||||||||||||
| Net income |
$ | 39,699 | $ | 36,213 | $ | 22,301 | ||||||
| Adjustments to reconcile net income to net cash provided by operating activities |
||||||||||||
| Undistributed income of subsidiary |
(36,063 | ) | (32,762 | ) | (20,656 | ) | ||||||
| Decrease (increase) in other assets |
665 | (158 | ) | (6,498 | ) | |||||||
| (Decrease) increase in liabilities |
(180 | ) | (1,808 | ) | 6,266 | |||||||
|
|
|
|
|
|
|
|||||||
| Net cash provided by (used in) operating activities |
4,121 | 1,485 | 1,413 | |||||||||
|
|
|
|
|
|
|
|||||||
| CASH FLOWS FROM FINANCING ACTIVITIES: |
||||||||||||
| Cash dividends paid |
(2,207 | ) | (2,203 | ) | (2,200 | ) | ||||||
|
|
|
|
|
|
|
|||||||
| Net cash used in financing activities |
(2,207 | ) | (2,203 | ) | (2,200 | ) | ||||||
|
|
|
|
|
|
|
|||||||
| Net increase (decrease) in cash |
1,914 | (718 | ) | (787 | ) | |||||||
|
|
|
|
|
|
|
|||||||
| Cash at beginning of year |
1,263 | 1,981 | 2,768 | |||||||||
|
|
|
|
|
|
|
|||||||
| Cash at end of year |
$ | 3,177 | $ | 1,263 | $ | 1,981 | ||||||
|
|
|
|
|
|
|
|||||||
92
Table of Contents
Report of Independent Registered Public Accounting Firm
The Board of Directors and Stockholders
Century Bancorp, Inc.:
Opinion on the Consolidated Financial Statements
We have audited the accompanying consolidated balance sheets of Century Bancorp, Inc. and its subsidiary (the Company) as of December 31, 2019 and 2018, the related consolidated statements of income, comprehensive income, changes in stockholders’ equity, and cash flows for each of the years in the three-year period ended December 31, 2019, and the related notes, collectively, the consolidated financial statements. In our opinion, the consolidated financial statements present fairly, in all material respects, the financial position of the Company as of December 31, 2019 and 2018, and the results of its operations and its cash flows for each of the years in the three-year period ended December 31, 2019, in conformity with U.S. generally accepted accounting principles.
We also have audited, in accordance with the standards of the Public Company Accounting Oversight Board (United States) (PCAOB), the Company’s internal control over financial reporting as of December 31, 2019, based on criteria established in Internal Control—Integrated Framework (2013) issued by the Committee of Sponsoring Organizations of the Treadway Commission, and our report dated March 13, 2020 expressed an unqualified opinion on the effectiveness of the Company’s internal control over financial reporting.
Basis for Opinion
These consolidated financial statements are the responsibility of the Company’s management. Our responsibility is to express an opinion on these consolidated financial statements based on our audits. We are a public accounting firm registered with the PCAOB and are required to be independent with respect to the Company in accordance with the U.S. federal securities laws and the applicable rules and regulations of the Securities and Exchange Commission and the PCAOB.
We conducted our audits in accordance with the standards of the PCAOB. Those standards require that we plan and perform the audit to obtain reasonable assurance about whether the consolidated financial statements are free of material misstatement, whether due to error or fraud. Our audits included performing procedures to assess the risks of material misstatement of the consolidated financial statements, whether due to error or fraud, and performing procedures that respond to those risks. Such procedures included examining, on a test basis, evidence regarding the amounts and disclosures in the consolidated financial statements. Our audits also included evaluating the accounting principles used and significant estimates made by management, as well as evaluating the overall presentation of the consolidated financial statements. We believe that our audits provide a reasonable basis for our opinion.
/s/ KPMG LLP
We have served as the Company’s auditor since 1982.
Boston, Massachusetts
March 13, 2020
93
Table of Contents
Report of Independent Registered Public Accounting Firm
The Board of Directors and Stockholders
Century Bancorp, Inc.:
Opinion on Internal Control Over Financial Reporting
We have audited Century Bancorp, Inc. and its subsidiary’s (the Company) internal control over financial reporting as of December 31, 2019, based on criteria established in Internal Control—Integrated Framework (2013) issued by the Committee of Sponsoring Organizations of the Treadway Commission. In our opinion, the Company maintained, in all material respects, effective internal control over financial reporting as of December 31, 2019, based on criteria established in Internal Control—Integrated Framework (2013) issued by the Committee of Sponsoring Organizations of the Treadway Commission.
We also have audited, in accordance with the standards of the Public Company Accounting Oversight Board (United States) (PCAOB), the consolidated balance sheets of the Company as of December 31, 2019 and 2018, the related consolidated statements of income, comprehensive income, changes in stockholders’ equity, and cash flows for each of the years in the three-year period ended December 31, 2019, and the related notes, collectively, the consolidated financial statements, and our report dated March 13, 2020 expressed an unqualified opinion on those consolidated financial statements.
Basis for Opinion
The Company’s management is responsible for maintaining effective internal control over financial reporting and for its assessment of the effectiveness of internal control over financial reporting, included in the accompanying Management’s Report on Internal Control Over Financial Reporting. Our responsibility is to express an opinion on the Company’s internal control over financial reporting based on our audit. We are a public accounting firm registered with the PCAOB and are required to be independent with respect to the Company in accordance with the U.S. federal securities laws and the applicable rules and regulations of the Securities and Exchange Commission and the PCAOB.
We conducted our audit in accordance with the standards of the PCAOB. Those standards require that we plan and perform the audit to obtain reasonable assurance about whether effective internal control over financial reporting was maintained in all material respects. Our audit of internal control over financial reporting included obtaining an understanding of internal control over financial reporting, assessing the risk that a material weakness exists, and testing and evaluating the design and operating effectiveness of internal control based on the assessed risk. Our audit also included performing such other procedures as we considered necessary in the circumstances. We believe that our audit provides a reasonable basis for our opinion.
Definition and Limitations of Internal Control Over Financial Reporting
A company’s internal control over financial reporting is a process designed to provide reasonable assurance regarding the reliability of financial reporting and the preparation of financial statements for external purposes in accordance with generally accepted accounting principles. A company’s internal control over financial reporting includes those policies and procedures that (1) pertain to the maintenance of records that, in reasonable detail, accurately and fairly reflect the transactions and dispositions of the assets of the company; (2) provide reasonable assurance that transactions are recorded as necessary to permit preparation of financial statements in accordance with generally accepted accounting principles, and that receipts and expenditures of the company are being made only in accordance with authorizations of management and directors of the company; and (3) provide reasonable assurance regarding prevention or timely detection of unauthorized acquisition, use, or disposition of the company’s assets that could have a material effect on the financial statements.
94
Table of Contents
Report of Independent Registered Public Accounting Firm
Because of its inherent limitations, internal control over financial reporting may not prevent or detect misstatements. Also, projections of any evaluation of effectiveness to future periods are subject to the risk that controls may become inadequate because of changes in conditions, or that the degree of compliance with the policies or procedures may deteriorate.
/s/ KPMG LLP
Boston, Massachusetts
March 13, 2020
95
Table of Contents
Management’s Report on Internal Control Over Financial Reporting
CENTURY BANCORP, INC.
400 Mystic Avenue
Medford, Massachusetts 02155
We, together with the other members of executive management of Century Bancorp, Inc. and our subsidiary (the “Company”), are responsible for establishing and maintaining adequate internal control over financial reporting. The Company’s internal control system was designed to provide reasonable assurance to the Company’s management and board of directors regarding the preparation and fair presentation of published financial statements.
All internal control systems, no matter how well designed, have inherent limitations. Therefore, even those systems determined to be effective can provide only reasonable assurance with respect to financial statement preparation and presentation.
The Company’s management assessed the effectiveness of the Company’s internal control over financial reporting as of December 31, 2019. In making this assessment, it used the criteria set forth by the Committee of Sponsoring Organizations of the Treadway Commission (“COSO”) in Internal Control—Integrated Framework (2013). Based on our assessment, we believe that, as of December 31, 2019, the Company’s internal control over financial reporting is effective based on those criteria.
The Company’s independent registered public accounting firm has issued an audit report on the effectiveness of the Company’s internal control over financial reporting. Their report appears on page 94.

|
|
|||
| Barry R. Sloane | William P. Hornby, CPA | |||
| Chairman, President & CEO | Chief Financial Officer & Treasurer |

March 13, 2020
96
Table of Contents
PART III
| ITEM 10. | DIRECTORS, EXECUTIVE OFFICERS AND CORPORATE GOVERNANCE |
The directors of the Company and their ages are as follows:
| Name |
Age | Position | ||
| George R. Baldwin | 76 | Director, Century Bancorp, Inc., and Century Bank and Trust Company | ||
| Stephen R. Delinsky | 75 | Director, Century Bancorp, Inc., and Century Bank and Trust Company | ||
| Louis J. Grossman | 70 | Director, Century Bancorp, Inc., and Century Bank and Trust Company | ||
| Russell B. Higley, Esquire | 80 | Director, Century Bancorp, Inc., and Century Bank and Trust Company | ||
| Jackie Jenkins-Scott | 70 | Director, Century Bancorp, Inc., and Century Bank and Trust Company | ||
| Linda Sloane Kay | 58 | Vice Chair of the Board, Century Bancorp, Inc., and Century Bank and Trust Company | ||
| Fraser Lemley | 79 | Director, Century Bancorp, Inc., and Century Bank and Trust Company | ||
| Joseph P. Mercurio | 71 | Director, Century Bancorp, Inc., and Century Bank and Trust Company | ||
| Joseph J. Senna, Esquire | 80 | Director, Century Bancorp, Inc., and Century Bank and Trust Company | ||
| Jo Ann Simons | 66 | Director, Century Bancorp, Inc., and Century Bank and Trust Company | ||
| Barry R. Sloane | 64 | Chairman of the Board, President and Chief Executive Officer, Century Bancorp, Inc. and Century Bank and Trust Company | ||
| Marshall M. Sloane (Deceased 2019) | — | Chairman of the Board, Century Bancorp, Inc. and Century Bank and Trust Company | ||
| George F. Swansburg | 77 | Director, Century Bancorp, Inc., and Century Bank and Trust Company | ||
| Jon Westling (Retired 2019) | 77 | Director, Century Bancorp, Inc., and Century Bank and Trust Company | ||
97
Table of Contents
Mr. Baldwin became a director of the Company in 1996. He has been a director of Century Bank and Trust Company since 1995. Mr. Baldwin is President and CEO of G. Baldwin & Co., a financial service firm. He was formerly CEO, Owner and Director of Kaler Carney Liffler, a multi-state regional insurance agency; and subsequently he became Chairman of the New England area of Arthur J. Gallagher & Co., America’s third largest insurance broker. Mr. Baldwin’s extensive three-decade background in banking and insurance is relevant to Century’s insurance and financial customers and qualifies him to continue to serve as a director of the Company.
Mr. Delinsky became a director of the Company and of Century Bank in 2013. He was an attorney with the law firm of Clark, Hunt, Ahearn & Embry until the end of June 2019. Prior to that, Mr. Delinsky was an attorney at the law firm of Eckert Seamans Cherin & Mellott, LLC. Currently, he’s an attorney in private practice. Mr. Delinsky’s experience as an attorney, and expertise in civil and criminal trial experience in state and federal courts, has qualified him to serve as director of the Company.
Mr. Grossman became a director of the Company and of Century Bank and Trust Company in January 2016. Mr. Grossman has been President and Treasurer of The Grossman Companies, Inc. since 1980, when he and his father, Morton, purchased the family real estate business. In January 2015 he became Chairman. Mr. Grossman’s experience and expertise in real estate, which is relevant to customer relationships of the Company, qualifies him to serve as director of the Company.
Mr. Higley became a director of the Company in 1996. He has been a director of Century Bank and Trust Company since 1986. Mr. Higley is an attorney in private practice. Mr. Higley’s experience as an attorney and expertise in the real estate industry, which is relevant to real estate customers of the Company, has qualified him to serve as director of the Company. Also, his tenure and experience as a director of the Company has qualified him to continue to serve.
Ms. Jenkins-Scott became a director of the Company and of Century Bank and Trust Company in 2006. Ms. Jenkins-Scott is past President of Boston’s Wheelock College. Ms. Jenkins-Scott’s experience as President of a college and expertise in the educational field as well as President and CEO of a non-profit entity, which is relevant to certain customer relationships of the Company, has qualified her to serve as director of the Company. Also, her tenure and experience as a director of the Company has qualified her to continue to serve.
Ms. Sloane Kay became a director of the Company in 2005. Ms. Kay joined Century Bank and Trust Company in 1983 as Assistant Vice President and currently serves as Vice Chair of the Board. Ms. Kay’s experience in business development, customer relationships and tenure at Century Bank and Trust Company has qualified her to serve as Vice Chair of the Board of the Company.
Mr. Lemley became a director of the Company in 1996. He has been a director of Century Bank and Trust Company since 1988. Mr. Lemley is Chairman of the Board and CEO of Sentry Auto Group. Mr. Lemley’s experience as CEO of a company and expertise in the automotive industry, which is relevant to certain other customers in the automotive industry of the Company, has qualified him to serve as director of the Company. Also, his tenure and experience as a director of the Company has qualified him to continue to serve.
Mr. Mercurio became a director of the Company in 1990 and a director of Century Bank and Trust Company in 1995 and voluntarily resigned in 2004. He was then re-elected in 2010. In December 2010, Mr. Mercurio retired as Executive Vice President of Boston University having completed 38 years of service. He subsequently served as Senior Vice President for Administration and Finance and Senior Advisor to the President at Quincy College; and now serves as an independent consultant in the field of higher administration and education. Mr. Mercurio’s experience in the educational field, which is relevant to certain customer relationships of the Company, has qualified him to serve as director of the Company. Also, his tenure and experience as a director of the Company has qualified him to continue to serve.
Mr. Senna became a director of the Company in 1986. He has been a director of Century Bank and Trust Company since 1979. Mr. Senna is an attorney and managing partner of C&S Capital Properties, LLC, a real
98
Table of Contents
estate management and development firm. Mr. Senna’s experience as an attorney and expertise in the real estate industry, which is relevant to real estate related customers in addition to his years of service as Chairman of the Audit Committee, has qualified him to serve as director of the Company. Also, his tenure and experience as a director of the Company has qualified him to continue to serve.
Ms. Simons became a director of the Company and a director of Century Bank and Trust Company in January 2016. Ms. Simons is CEO of Northeast Arc and was President and CEO of Cardinal Cushing Centers, Inc. from 2008 through January 2016. These nonprofit organizations specialize in the support of individuals with disabilities. Ms. Simons’ experience and expertise with nonprofit organizations, which is relevant to customer relationships of the Company, qualifies her to serve as director of the Company.
Mr. Barry R. Sloane has been a director of the Company and Century Bank and Trust Company since 1997. Mr. Sloane is Chairman, President and CEO of Century Bancorp and Chairman, President and CEO of Century Bank and Trust Company. Mr. Sloane is also Treasurer and a trustee of the Savings Bank Employee Retirement System (SBERA). Mr. Sloane’s experience at the Company as well as his experience at other financial services companies and expertise in the financial services industry has qualified him to serve as Chairman of the Board.
Mr. Marshall M. Sloane was the founder of the Company. He founded Century Bank and Trust Company in 1969 and was the Chairman of the Board. Mr. Sloane passed away in April of 2019.
Mr. Swansburg became a director of the Company in 1986. He has been a director of Century Bank and Trust Company since 1992. From 1992 to 1998 he was President and Chief Operating Officer of Century Bank and Trust Company. He is now retired from Century Bank and Trust Company. Mr. Swansburg’s experience as President and Chief Operating Officer of Century Bank and Trust Company and expertise in the banking industry has qualified him to serve as a director of the Company. Also, his tenure and experience as a director of the Company has qualified him to continue to serve.
Mr. Westling became a director of the Company in 1996. He has been a director of Century Bank and Trust Company since 1995. Mr. Westling is President Emeritus and Professor of History and Humanities at Boston University. Mr. Westling’s experience as president of a University and expertise in the educational field, which is relevant to certain customer relationships of the Company, has qualified him to serve as director of the Company. Also, his tenure and experience as a director of the Company qualified him to serve. Mr. Westling retired as director in May of 2019.
All of the Company’s directors are elected annually and hold office until their successors are duly elected and qualified. A majority of the members of the Company’s Board of Directors have been determined by the Company’s Board of Directors to be independent within the meaning of current NASDAQ listing standards. There are no family relationships between any of the directors or executive officers, except that Barry R. Sloane is the son of the late Marshall M. Sloane and Linda Sloane Kay is the daughter of the late Marshall M. Sloane.
Executive officers are elected annually by the Board prior to the Annual Meeting of Shareholders to serve for a one year term and until their successors are elected and qualified. The following table sets forth the name and age of each executive officer of the Company and the principal positions and offices he/she holds with the Company.
| Barry R. Sloane |
Chairman, President and CEO; Chairman, President and CEO, Century Bank and Trust Company. Mr. Sloane is 64 years old. | |
| Linda Sloane Kay |
Vice Chair, Century Bank and Trust Company. Ms. Sloane Kay is 58 years old. She joined the Company in 1983. | |
| William P. Hornby |
Chief Financial Officer and Treasurer; Chief Financial Officer and Treasurer, Century Bank and Trust Company. Mr. Hornby is 53 years old. He joined the Company in 2007. | |
99
Table of Contents
| Paul A. Evangelista |
Executive Vice President, Century Bank and Trust Company with responsibility for retail, operations and marketing. Mr. Evangelista is 56 years old. He joined the Company in 1999. | |
| Brian J. Feeney |
Executive Vice President, Century Bank and Trust Company, Head of Institutional Services Group. Mr. Feeney is 59 years old. He joined the Company in 1989. | |
| David B. Woonton |
Executive Vice President, Century Bank and Trust Company with responsibility for lending. Mr. Woonton is 64 years old. He joined the Company in 1999. | |
The Audit Committee
The Audit Committee meets with KPMG LLP, the Company’s independent registered public accounting firm, in connection with the annual audit and quarterly reviews of the Company’s financial statements. The Audit Committee was composed of four directors during 2019, Joseph J. Senna, Chair, Stephen R. Delinsky, Jo Ann Simons, and Joseph P. Mercurio, each of whom the Board of Directors has determined is independent under current NASDAQ listing standards. The Board of Directors has determined that Mr. Senna and Ms. Jo Ann Simons qualify as “audit committee financial experts”, as that term is defined in Item 407(d)(5) of Regulation S-K promulgated by the SEC. The Audit Committee reviews the findings and recommendations of the FRB, FDIC, and the Massachusetts Division of Banks in connection with their examinations and the internal audit reports and procedures for the Company and its subsidiaries. The Audit Committee met five times during 2019.
Audit Committee Report
The Audit Committee of the Company’s Board of Directors is responsible for providing independent, objective oversight of the Company’s accounting functions and internal controls. The Audit Committee reviews: the financial information provided to shareholders and others; the systems of internal controls regarding finance, accounting, legal/regulatory compliance, and ethics; and the audit and financial reporting processes. The Audit Committee operates under a written charter first adopted and approved by the Board of Directors in 2000. The Audit Committee has reviewed and reassessed its Charter. A copy of the Audit Committee Charter was last published in the Form 10-K for the period ending December 31, 2018.
Management is responsible for the Company’s internal controls and financial reporting process. The independent registered public accounting firm is responsible for performing an independent audit of the Company’s consolidated financial statements in accordance with the standards of the Public Company Accounting Oversight Board (United States) and to issue their reports thereon. The Audit Committee’s responsibility is to monitor and oversee these processes.
The Audit Committee has reviewed and discussed the audited financial statements with management and the independent registered public accounting firm. The Audit Committee has also discussed with KPMG LLP, the independent registered public accounting firm for the Company, the matters required to be discussed by the applicable requirements of the Public Company Accounting Oversight Board (PCAOB) and the SEC.
The Audit Committee has also received the written disclosures and the letter from KPMG LLP as required by the PCAOB. The Audit Committee has discussed with KPMG LLP the firm’s independence, including a review of audit and non-audit fees and services, and concluded that KPMG LLP is independent.
Based on the review and discussions referred to in the paragraph above, the Audit Committee recommended to the Board of Directors that the audited consolidated financial statements be included in the Company’s Annual Report on Form 10-K for the last fiscal year for filing with the Securities and Exchange Commission.
100
Table of Contents
/s/ Joseph J. Senna, Chair
/s/ Stephen R. Delinsky
/s/ Jo Ann Simons
/s/ Joseph P. Mercurio
Nominating Committee
The Company’s Nominating Committee has three director members, Stephen R. Delinsky, Fraser Lemley and Louis J. Grossman, each of whom the Board of Directors has determined to be independent under the NASDAQ current listing standards. The Nominating Committee operates pursuant to a written policy. The nominating committee implements the process by identifying a potential candidate and evaluating whether the candidate is eligible and qualified for service. The Committee has developed criteria for the selection of new directors to the Board, including but not limited to, diversity, age, skills, experience, time availability (including the number of other boards a director candidate sits on), NASDAQ listing standards, applicable federal and state laws and regulations, Board and Company needs and such other criteria as the Committee shall determine to be relevant. The committee’s effectiveness is assessed by reviewing existing Board of Directors attendance and performance; experience, skills and contributions that the existing Director brings to the Board; and independence, prior to nominating an existing director for reelection.
Board Leadership Structure
Marshall M. Sloane was Chairman of the Board before his passing in April of 2019. Barry R. Sloane is the Chairman of the Board, President and CEO. Linda Sloane Kay is Vice Chair of the Board.
Oversight of Risk
The Board oversees risk through various Board Committees which report directly to the Board. Also, various committees comprised of Company management report to the Board.
The principal Board Committees responsible for overseeing the various elements of risk are the Audit Committee, the Asset Liability Committee and the Executive Committee. The Audit Committee is responsible for monitoring all elements of risk, primarily through its oversight of the internal audit program. The Asset Liability Committee monitors interest rate risk principally through management’s models and simulations. The Executive Committee monitors credit risk through its review of large originators, classified assets, and the calculation of the allowance for loan losses and concentrations of credits.
The principal committees comprised of management are Management Committee, Corporate Risk Management Committee, Loan Approval Committee and Asset Liability Pricing Committee. Management Committee is comprised of senior management and is responsible for overseeing all elements of risk. The Corporate Risk Management Committee meets quarterly to address specific elements of risk. Loan Approval Committee is responsible for overseeing credit risk. The Asset Liability Committee oversees interest rate risk. The committees comprised of management report to the Board of Directors, as needed, through senior management’s attendance and reporting at Board of Directors meetings.
Code of Ethics
The Company has adopted a Code of Ethics that applies to its principal executive officer, principal financial officer, principal accounting officer or persons performing similar functions. A copy of the Company’s Code of Ethics may be obtained upon written request to Investor Relations, Century Bancorp, Inc., 400 Mystic Avenue, Medford, Massachusetts 02155.
Delinquent Section 16(a) Reports
Based solely on a review of the copies of Forms 3, 4 and 5 and amendments thereto, if any, filed with the SEC during the fiscal year ended December 31, 2019 and any written representations furnished to the Company,
101
Table of Contents
the Company believes that Barry R. Sloane filed 2 (two) late reports covering 4 (four) transactions that were not reported on a timely basis and Linda Sloane Kay filed 2 (two) late reports covering 3 (three) transactions that were not reported on a timely basis. These transactions relate to the appointment of Barry R. Sloane and Linda Sloane Kay, respectively, as trustees of various trusts in connection with the death of Marshall Sloane.
Based solely on a review of Forms 4 filed with the SEC during the fiscal year ended December 31, 2019, the Company believes a beneficial owner of more than 10% of the Company’s Class A Common Stock, James J. Filler filed 31 (thirty-one) late reports covering 85 (eighty-five) transactions that were not reported on a timely basis. Based solely on a review of Forms 5 filed with the SEC during such fiscal year, Mr. Filler did not file a Form 5 in such fiscal year.
| ITEM 11. | EXECUTIVE COMPENSATION |
The following is a discussion and analysis of our executive compensation policies and practices with respect to compensation reported for fiscal year 2019.
Introduction
The following discussion and analysis includes separate sections on:
| • | The Composition and Responsibilities of the Compensation Committee |
| • | The Company’s Executive Compensation Conclusion |
| • | Compensation Discussion and Analysis (CD&A) |
| • | Philosophy and Objectives of the Company |
| • | Compensation Process |
| • | Compensation Consultant |
| • | Compensation Components |
| • | Post-Employment Compensation |
| • | Chief Executive Officer Compensation |
| • | Executive Officer Compensation |
| • | Consulting Services Agreements |
| • | Employment Agreements |
| • | Report of the Compensation Committee |
Composition and Responsibilities of the Compensation Committee
The Compensation Committee is a committee of the Board of Directors composed of Fraser Lemley as Chairman, Joseph Mercurio and Jo Ann Simons, each of whom the Board has determined is independent as defined by the FINRA current listing standards.
The Compensation Committee oversees compensation programs applicable to employees at all levels of the Company and makes decisions regarding executive compensation that is intended to align total compensation with business objectives and enable the Company to attract, retain and reward individuals who are contributing to the Company’s success.
The Compensation Committee reviews the Company’s cash incentive, stock incentive, retirement, and benefit plans and makes its recommendations to the Board with respect to these areas.
All decisions with respect to executive and director compensation are approved by the Compensation Committee and recommended to the full Board for ratification.
102
Table of Contents
The Company’s Executive Compensation Conclusion
Based upon review, the Compensation Committee and the Board of Directors found the Company’s Chief Executive Officer’s, the Chief Financial Officer’s and the other Named Executive Officers’ total compensation to be reasonable. In addition to the other factors noted, the Committee and the Board considered that the Company maintains only one change of control provision and did not award stock incentive awards for fiscal year 2019. It should be noted that when the Committee and the Board considers any component of executive compensation, the mix and aggregate amounts of all components are taken into consideration.
Compensation Discussion and Analysis (CD&A)
Philosophy and Objectives of Company
The Company’s executive compensation philosophy is based on the following principles:
| • | Compensation programs should be designed to attract and retain executives, to motivate them to achieve and to reward them appropriately for their performance. |
| • | Compensation should be competitive and equitable in light of the executive’s responsibilities, experience, and performance. |
| • | Provide annual compensation that takes into account the Company’s performance with respect to its financial and strategic objectives, the performance of functions and business areas under the executive’s management and the results of established goals; |
| • | Align the financial interests of the executive with those of shareholders by providing both short-term and long-term incentives; |
| • | Offer a total compensation program for each executive based on (i) the level of responsibility of the executive’s position, (ii) the experience and skills necessary relative to the other senior management positions, (iii) comparison of compensation to similarly positioned executives of peer financial institutions; and |
| • | Evaluate the overall compensation of our executives in light of general economic and specific company, industry and competitive considerations. |
Compensation Process
The Company maintains governance practices to ensure that it can reach its compensation-related decisions in an informed and appropriate manner.
Base salaries, which are the Company’s major element of compensation, are reviewed for executive officers and employees at the regularly scheduled fall meeting of the Compensation Committee. At this meeting the Committee also reviews and adopts, as appropriate, proposals for the discretionary officer cash incentive plan for the new fiscal year, stock option grants, additions, amendments, modifications or terminations of retirement and benefit programs.
The Compensation Committee’s process incorporates the following:
| • | The Committee operates under a written charter which is periodically reviewed. The Committee amended its charter in 2014 to conform to NASDAQ compensation committee rule amendments. |
| • | The Committee meets with representatives of management to review and discuss prepared materials and issues. |
| • | The Committee considers recommendations from the Chief Executive Officer with respect to the compensation of the Company’s Named Executive Officers. |
| • | Our independent compensation consultant attends Committee meetings as requested. |
103
Table of Contents
| • | The Committee meets and deliberates privately without management present. Our consultant participates in these sessions as requested. |
| • | The Committee may consult with the non-management and independent directors regarding decisions affecting Executive compensation. |
| • | The Committee reports the Committee’s major actions to the entire Board at the Board of Director’s meeting in December or the following January. |
| • | The Committee recommends for approval to the Board of Directors the fees for our Board and Board Committees. |
| • | The Board of Directors then considers the report of the Compensation Committee and accepts or amends and approves or ratifies all matters presented for consideration. |
To the extent permitted by applicable law, the Committee or the Board may delegate to management certain of its duties and responsibilities, including with respect to the adoption, amendment, modification or termination of benefit plans and with respect to the awards of stock options under certain stock plans.
Compensation Consultant
When making determinations regarding the compensation paid to our executives the Compensation Committee and the Board of Directors rely, in part, on the expertise of our independent compensation consultant, Thomas Warren & Associates, to conduct an assessment of our executive compensation. In addition to conferring with certain executives, the consultant works with internal company support staff to obtain compensation and market data. Thomas Warren & Associates identifies a group of peer companies in consideration of such factors as asset size, geography, type of financial services offered and the complexity and scope of operations and makes use of executive compensation comparisons, published surveys and peer analyses.
The Compensation Committee and the Board of Directors took Thomas Warren & Associates’ recommendations into consideration when setting base salaries for fiscal 2019.
Compensation Components
With respect to Executive compensation, the Company reviews the mix of base salary, cash and stock based incentive plans and benefits for our individual executives, however, there is no specific formula for allocating between cash and non-cash compensation. The competitiveness of total compensation potential for our executives is reviewed against industry practices and the Company’s peers as identified by our independent compensation consultant. The major elements of the Company’s executive compensation package (i.e., base salary, cash and stock based incentive plans) are similar to those found in many companies.
Base Salary Compensation:
When evaluating executive base salary compensation, the Company takes into consideration such factors as:
| • | The attainment of business and strategic goals and the financial performance of the Company; |
| • | The importance, complexity, and level of responsibility of the executive’s position within the organizational structure; |
| • | The performance of the executive’s business area’s goals and the accomplishment of objectives for the previous year; |
| • | The difficulty of achieving desired results; |
| • | The value of the executive’s unique skills, abilities and general management capabilities to support the long-term performance of the Company; |
| • | The executive’s contribution as a member of the Executive Management Team. |
104
Table of Contents
While the Company reviews numerous quantitative and qualitative factors noted above when determining executive base salary compensation, the performance of the Company’s stock is not generally considered a factor in this determination as the price of the Company’s common stock is subject to various factors beyond the Company’s control. The Company believes that the price of the stock in the long-term will reflect the Company’s operating performance and how well our executives manage the Company.
Ultimately, the Compensation Committee and the Board of Directors have the authority to use discretion when making executive compensation determinations after review of all the information that they deem relevant.
Cash Incentive Plan:
The Company has a discretionary cash incentive plan that is designed to reward our executives and officers for the achievement of annual financial performance goals of the Company as well as business line, department and individual performance. The plan supports the philosophy that management be measured for their performance as a team in the attainment of these goals.
Awards are based upon the attainment of established objectives including profitability, expense control, sales volumes and overall job performance. Awards are generally not granted unless the Company achieves certain financial targets.
Upon recommendation of the Compensation Committee, the Board of Directors determines the aggregate amount, if any, to be awarded. In recognition of the Company’s solid performance, discretionary awards were granted for fiscal 2019. Awards for the Chief Executive Officer and the other Named Executive Officers were reviewed and approved by the Board of Directors and are noted on the Summary Compensation Table.
Stock Option Plans:
During 2000 and 2004, common stockholders of the Company approved stock option plans (the “Option Plans”) to encourage ownership of Class A common stock of the Company by directors, officers and employees of the Company and its Affiliates and to provide additional incentives for them to promote the success of the Company’s business through awards of or relating to shares of the Company’s Class A common stock. Under the Option Plans, all officers and key employees of the Company are eligible to receive non-qualified and incentive stock options to purchase shares of Class A common stock. The Option Plans are administered by the Compensation Committee of the Board of Directors, whose members are ineligible to participate in the Option Plans. Based on management’s recommendations, the Committee submits its recommendations to the Board of Directors as to persons to whom options are to be granted, the number of shares granted to each, the option price (which may not be less than 85% of the stocks trading value for non-qualified stock options, or the fair market value for incentive stock options, of the shares on the date of grant) and the time period over which the options are exercisable (not more than ten years from the date of the grant).
The Compensation Committee has complete discretion to make or select the manner of making all necessary determinations with respect to each option to be granted by the committee under the Option Plans including the director, employee, or officer to receive an Option. However, in determining the long-term incentive component (stock incentive plan) of executive compensation, the Committee does consider the Company’s performance and relative shareholder return, the value of similar incentives awards at peer companies and the awards given in past years. The Committee may take into account the nature of the services provided by the respective officers, employees, and directors, their present and potential contributions to the success of the Company, and any other factors that the Compensation Committee, in its discretion, determines are relevant.
Option grants were not awarded in 2019.
Post-Employment Compensation
Defined Benefit Pension Plan:
The Company had a qualified Defined Benefit Pension Plan which had been offered to all employees reaching a minimum age and service requirement. In 2006 the Bank became a member of the Savings Bank
105
Table of Contents
Employee Retirement Association (“SBERA”) within which it maintains the qualified Defined Benefit Pension Plan. SBERA offers a common and collective trust as the underlying investment structure for pension plans participating in SBERA. The Trustee of SBERA, through SBERA’s Investment Committee, selects investment managers for the common and collective trust portfolio. A professional advisory firm is retained by the Investment Committee to provide allocation analysis, performance measurement and to assist with manager searches. The overall investment objective is to diversify equity investments across a spectrum of investment types. (e.g. small cap, large cap, international, etc.) and styles (e.g. growth, value, etc.). The Company has closed the plan to employees hired after March 31, 2006.
Benefits under the plan are based upon an employee’s years of service and career average compensation. The 2019 increase in the actuarial present value of each Named Executive Officer’s accumulated benefit under the plan is set forth in the Summary Compensation Table which appears on page 109 and the actuarial present value of each Named Executive Officer is set forth in the Pension Benefits Table which appears on page 110.
401(k) Plan:
Our executives are eligible to participate in the Company’s 401(k) contributory defined contribution plan. The Company contributes a matching contribution equal to 33.33% on the first 6% of the participant’s compensation that has been contributed to the plan. The Chief Executive Officer and five of the Named Executive Officers participated in the 401(k) plan during fiscal 2019 and received matching contributions up to a maximum of $5,600. The plan is currently administered by SBERA and BPAS.
Supplemental Executive Insurance/Retirement Income Plan:
The Company has a Supplemental Executive Insurance/Retirement Plan (the Supplemental Plan) which is limited to select officers and employees of the Company.
Executive officers of the Company or its subsidiaries who have at least one year of service may participate in the Supplemental Plan. The Supplemental Plan is voluntary, and participants are required to contribute to its cost. Under the Supplemental Plan, each participant will receive a retirement benefit based on compensation and length of service. Individual life insurance policies, which are owned by the Company, are purchased covering the lives of each participant.
Benefits under the Supplemental Plan are based upon an employee’s years of service and average compensation over the highest thirty-six (36) consecutive months. The 2019 increase in the actuarial present value of each Named Executive Officer’s accumulated benefit under the Supplemental Plan is set forth in the Summary Compensation Table which appears below and the actuarial present value of each Named Executive Officer is set forth in the Supplemental Executive Insurance/Retirement Benefits Table which appears on page 111.
Previously, the Company has entered into an agreement with Mr. Marshall Sloane to freeze his Supplemental Executive/Insurance Retirement Income Plan benefit. In consideration of this frozen benefit, the Company has acquired life insurance policies providing a death benefit of $25,000,000 upon the death of the survivor of Mr. Sloane or Mrs. Sloane. Mr. Sloane elected 50% joint and survivor annuity. Under this plan he and his spouse received $327,274 in 2019.
Chief Executive Officer Compensation
The Company granted Chief Executive Officer, Barry R. Sloane, a 5% salary increase in 2019. In recognition of the Company’s solid financial performance in 2019, the Company also granted a $303,264 cash bonus payable to Mr. Barry R. Sloane.
The 2019 total compensation for the Chief Executive Officer was $2,718,816, as shown in the Summary Compensation Table. The 2019 estimated median compensation for the Company was $52,025. The CEO total
106
Table of Contents
compensation was approximately 52 times the total compensation of the median employee calculated in the same manner. In determining the median employee, a listing was prepared of all employees as of December 31, 2019. Compensation was annualized for those employees that were not employed for the full year of 2019.
Executive Officer Compensation
Consistent with the decisions regarding CEO base compensation, the Company determined that the base salary compensation for each of the following Named Executive Officers, Linda Sloane Kay, Paul Evangelista, David Woonton, William Hornby and Brian Feeney increased 5% in 2019. In light of the Company’s financial performance in 2019, cash bonuses were awarded to all of the above Named Executive Officers as noted in the Summary Compensation Table.
The Company based its determinations on its subjective analysis of each individual’s performance and contribution to the corporation’s goals and objectives and considered the quantitative and qualitative factors referenced above.
Executive Benefits
We limit additional executive benefits that we make available to our executive officers. Where such benefits are provided, they are intended to support other business purposes including facilitating business development efforts.
Consulting Services Agreement
The Company renewed its consulting agreement with Marshall M. Sloane to provide the Company advice on strategic planning and operational management, assist with business development efforts and clients, participate in public relations and community outreach efforts and provides other services as may be requested by the Board of Directors. The Company agreed to pay Mr. Sloane an annual contract fee of $446,955 per year during 2019 with provisions to reimburse Mr. Sloane for all related business expenses and the expense of obtaining health insurance comparable to that which the Company provided while he was Chief Executive Officer. The actual amount paid to Mr. Sloane and his estate was $394,188; this amount included a termination payment as a result of his death in April of 2019.
Employment Agreement
The Company has an employment agreement with Mr. David Woonton. The agreement grants two years of service payable upon a change of control of the Company.
Compensation Committee Report
The Compensation Committee has reviewed and discussed the foregoing Report of the Compensation Committee, including the CD&A, with management. In reliance on the reviews and discussions referred to above, the Compensation Committee recommended to the Board, and the Board has approved, that the CD&A be included in the Company’s Annual Report on Form 10-K for the year ended December 31, 2019 for filing with the SEC.
/s/ Fraser Lemley, Chairman
/s/ Joseph Mercurio
/s/ Jo Ann Simons
Compensation Paid to Executive Officers
The following table sets forth information for the three year period ended December 31, 2019 concerning the compensation for services in all capacities to Century Bancorp, Inc. and its subsidiaries of our principal executive
107
Table of Contents
officers and our principal financial officer as well as our other four most highly compensated executive officers (or executive officers of our subsidiaries). We refer to these individuals throughout this 10-K statement as the “Named Executive Officers”.
108
Table of Contents
Summary Compensation Table
| Name and Principal Position |
Year | Salary ($) |
Bonus ($) |
Stock Awards ($) |
Option Awards ($) |
Change in Pension Value and Nonqualified Deferred Compensation Earnings- December 31, ($) |
All Other Compensation ($) (1) |
Total ($) |
||||||||||||||||||||||||
| Marshall M. Sloane (Deceased 2019) (2) |
2019 | — | — | — | — | — | 161,691 | 161,691 | ||||||||||||||||||||||||
| Chairman of the Board, |
2018 | — | — | — | — | — | 1,500,739 | 1,500,739 | ||||||||||||||||||||||||
| Century Bancorp, Inc. and Century |
2017 | — | — | — | — | — | 1,280,741 | 1,280,741 | ||||||||||||||||||||||||
| Barry R. Sloane |
2019 | 719,086 | 303,264 | — | — | 1,646,224 | 50,242 | 2,718,816 | ||||||||||||||||||||||||
| Chairman, President and CEO, |
2018 | 684,844 | 280,800 | — | — | 21,774 | 44,605 | 1,032,023 | ||||||||||||||||||||||||
| Century Bancorp, Inc. and Century |
2017 | 652,232 | 240,000 | — | — | 1,103,884 | 59,042 | 2,055,158 | ||||||||||||||||||||||||
| Linda Sloane Kay |
2019 | 426,512 | 128,887 | — | — | 1,252,213 | 10,709 | 1,818,321 | ||||||||||||||||||||||||
| Vice Chair, Century Bancorp, Inc. |
2018 | 406,202 | 119,340 | — | — | 105,491 | 28,961 | 659,994 | ||||||||||||||||||||||||
| and Century Bank and Trust Company |
2017 | 386,859 | 102,000 | — | — | 661,850 | 22,835 | 1,173,544 | ||||||||||||||||||||||||
| David B. Woonton |
2019 | 426,512 | 128,887 | — | — | 853,041 | 15,215 | 1,423,655 | ||||||||||||||||||||||||
| Executive Vice President, |
2018 | 406,202 | 119,340 | — | — | 35,136 | 8,429 | 569,107 | ||||||||||||||||||||||||
| Century Bank and Trust Company |
2017 | 386,859 | 79,936 | — | — | 137,891 | 7,541 | 612,227 | ||||||||||||||||||||||||
| Paul A. Evangelista |
2019 | 426,512 | 128,887 | — | — | 1,338,790 | 17,397 | 1,911,586 | ||||||||||||||||||||||||
| Executive Vice President, |
2018 | 406,202 | 119,340 | — | — | 3,581 | 12,317 | 541,440 | ||||||||||||||||||||||||
| Century Bank and Trust Company |
2017 | 386,859 | 79,936 | — | — | 488,865 | 8,814 | 964,474 | ||||||||||||||||||||||||
| Brian J. Feeney |
2019 | 387,819 | 108,000 | — | — | 1,156,834 | 22,229 | 1,674,882 | ||||||||||||||||||||||||
| Executive Vice President, |
2018 | 369,351 | 100,000 | — | — | 55,544 | 22,959 | 547,854 | ||||||||||||||||||||||||
| Century Bank and Trust Company |
2017 | 351,763 | 77,986 | — | — | 552,360 | 17,555 | 999,664 | ||||||||||||||||||||||||
| William P. Hornby |
2019 | 387,804 | 108,000 | — | — | 965,412 | 20,500 | 1,481,716 | ||||||||||||||||||||||||
| Chief Financial Officer and |
2018 | 369,338 | 100,000 | — | — | — | 20,583 | 489,921 | ||||||||||||||||||||||||
| Treasurer, Century Bancorp, Inc. and Century Bank and Trust Company |
2017 | 351,750 | 78,000 | — | — | 439,310 | 14,914 | 883,974 | ||||||||||||||||||||||||
| (1) | The amount listed in all other compensation includes amounts attributable to term insurance premiums paid for the Supplemental Executive Insurance/Retirement Plan, matching contribution for the 401(k) plan, excess group life insurance premiums and long-term disability premiums and, as applicable, country club membership dues and taxable expense reimbursements. |
| (2) | The amount, for 2019 includes payments made to Marshall M. Sloane prior to his death. This includes $119,188 for consulting services, $14,200 for Director fees, and $28,303 for health insurance premiums and Medicare reimbursements. |
109
Table of Contents
Pension Benefits
The following table sets forth information concerning plans that provide for payments or other benefits at, following, or in connection with, retirement for each Named Executive Officer.
PENSION BENEFITS TABLE
| Name |
Plan Name | Number of Years Credited Service (#) |
Present Value of Accumulated Benefit 12/31/2019 ($)(1) |
Payments During Last Fiscal Year 12/31/2019 ($) |
||||||||||
| Marshall M. Sloane (Deceased 2019) |
Defined Benefit | 33 | — | 23,565 | ||||||||||
| Chairman of the Board |
Pension Plan | |||||||||||||
| Barry R. Sloane |
Defined Benefit | 16 | 449,790 | — | ||||||||||
| Chairman, President and CEO |
Pension Plan | |||||||||||||
| Linda Sloane Kay |
Defined Benefit | 19 | 604,103 | — | ||||||||||
| Vice Chair |
Pension Plan | |||||||||||||
| David B. Woonton |
Defined Benefit | 20 | 1,091,315 | — | ||||||||||
| Executive Vice President, |
Pension Plan | |||||||||||||
| Paul A. Evangelista |
Defined Benefit | 20 | 862,566 | — | ||||||||||
| Executive Vice President, |
Pension Plan | |||||||||||||
| Brian J. Feeney |
Defined Benefit | 30 | 931,599 | — | ||||||||||
| Executive Vice President, |
Pension Plan | |||||||||||||
| William P. Hornby(2) |
Defined Benefit | — | — | — | ||||||||||
| Chief Financial Officer and Treasurer |
Pension Plan | |||||||||||||
| (1) | The present value of accumulated benefits was calculated with the assumption that retirement occurs at age 65. The benefit is calculated using an interest rate of 2.99% and was based on Amount-Weighted Pri-2012 Mortality Tables with Scale MP-2019. |
| (2) | Not a member of the Defined Benefit Pension Plan. |
110
Table of Contents
SUPPLEMENTAL EXECUTIVE INSURANCE/RETIREMENT BENEFITS
| Name |
Plan Name | Number of Years Credited Service (#) |
Present Value of Accumulated Benefit- 12/31/2019 ($)(1) |
Payments During Last Fiscal Year- 12/31/2019 ($) |
||||||||||
| Marshall M. Sloane |
Supplemental Executive | 33 | — | 130,910 | ||||||||||
| Chairman of the Board |
Insurance/Retirement Plan | |||||||||||||
| Barry R. Sloane(2) |
Supplemental Executive | 18 | 9,488,578 | — | ||||||||||
| Chairman, President and CEO |
Insurance/Retirement Plan | |||||||||||||
| Linda Sloane Kay(2) |
Supplemental Executive | 11 | 3,224,477 | — | ||||||||||
| Vice Chair |
Insurance/Retirement Plan | |||||||||||||
| David B. Woonton(2) |
Supplemental Executive | 20 | 3,960,374 | — | ||||||||||
| Executive Vice President, Century Bank and Trust Company |
Insurance/Retirement Plan | |||||||||||||
| Paul A. Evangelista(2) |
Supplemental Executive | 20 | 3,820,406 | — | ||||||||||
| Executive Vice President, |
Insurance/Retirement Plan | |||||||||||||
| Brian J. Feeney(2) |
Supplemental Executive | 12 | 2,866,747 | — | ||||||||||
| Executive Vice President, |
Insurance/Retirement Plan | |||||||||||||
| William P. Hornby(2) |
Supplemental Executive | 11 | 2,461,742 | — | ||||||||||
| Chief Financial Officer and |
Insurance/Retirement Plan | |||||||||||||
| (1) | The present value of accumulated benefits was calculated with the assumption that retirement occurs at age 65. The benefit is calculated using an interest rate of 3.71% and the mortality table was revised from the MP-2018 White Collar Mortality Table to the Amount-Weighted Pri-2012 White Collar Mortality Table, adjusted for mortality improvements with the Scale MP-2019 mortality improvements scale on a generational basis. |
| (2) | As of January 1, 2018, Messrs. Marshall M. Sloane, Barry R. Sloane, Paul A. Evangelista, David B. Woonton, Brian J. Feeney, Linda Sloane Kay and William P. Hornby were 100%, 100%, 100%, 100%, 77.5%, 70.0% and 70.0% vested, respectively, under the Supplemental Executive Insurance/Retirement Plan. |
111
Table of Contents
Director Compensation
Directors not employed by the Company receive a $19,600 retainer per year, $350 per Company Board meeting attended, $900 per Bank Board meeting attended and $750 per committee meeting attended. Joseph Senna receives $2,400 per Audit Committee meeting as Chairman of the Audit Committee.
DIRECTOR COMPENSATION TABLE 2019
| Name |
Fees Earned or Paid in Cash ($) |
All Other Compensation ($) |
Total ($) | |||||||||
| George R. Baldwin |
43,800 | — | 43,800 | |||||||||
| Stephen R. Delinsky |
39,300 | — | 39,300 | |||||||||
| Louis Grossman |
43,800 | — | 43,800 | |||||||||
| Russell B. Higley |
38,550 | — | 38,550 | |||||||||
| Jackie Jenkins-Scott |
42,150 | — | 42,150 | |||||||||
| Linda Sloane Kay |
— | — | — | |||||||||
| Fraser Lemley |
43,650 | — | 43,650 | |||||||||
| Joseph P. Mercurio |
36,750 | — | 36,750 | |||||||||
| Joseph J. Senna |
50,400 | — | 50,400 | |||||||||
| Jo Ann Simons |
43,800 | — | 43,800 | |||||||||
| Barry R. Sloane |
— | — | — | |||||||||
| Marshall M. Sloane (Deceased 2019) (1) |
— | — | — | |||||||||
| George F. Swansburg (2) |
47,550 | 14,500 | 62,050 | |||||||||
| Jon Westling (Retired 2019) |
9,800 | — | 9,800 | |||||||||
| (1) | Amounts paid are listed in the Summary Compensation Table. |
| (2) | The amount listed in all other compensation is for serving as Administrator of Century Bancorp Capital Trust II. |
| ITEM 12. | SECURITY OWNERSHIP OF CERTAIN BENEFICIAL OWNERS AND MANAGEMENT AND RELATED STOCKHOLDER MATTERS |
The following table sets forth certain information as to the number and percentage of shares of Class A and Class B Common Stock beneficially owned as of December 31, 2019, (i) by each person known by the Company to own beneficially more than 5% of the Company’s outstanding shares of Class A or Class B Common Stock, (ii) by each of the Company’s directors and executive officers; and (iii) by all directors and executive officers as a group. As of December 31, 2019, there were 3,650,949 shares of Class A Common Stock and 1,916,960 shares of Class B Common Stock outstanding.
112
Table of Contents
| Name and Address of Beneficial Owner |
Class A Owned |
% A Owned |
Class B Owned |
% B Owned |
||||||||||||||||
| James J. Filler |
735,332 | (4 | ) | 20.14 | % | |||||||||||||||
| 2964 Shook Hill Parkway, Birmingham, AL 35223 |
||||||||||||||||||||
| BlackRock, Inc. |
210,916 | (5 | ) | 5.78 | % | |||||||||||||||
| 55 East 52nd Street, New York, NY 10055 |
||||||||||||||||||||
| Sloane Family Enterprises, Limited Partnership |
8,146 | 0.22 | % | 1,721,841 | 89.82 | % | ||||||||||||||
| 400 Mystic Avenue, Medford, MA 02155 |
||||||||||||||||||||
| George R. Baldwin(a) |
5,819 | 0.16 | % | |||||||||||||||||
| Stephen R. Delinsky(a) |
3,003 | (3 | ) | 0.08 | % | |||||||||||||||
| Paul A. Evangelista(b) |
8,002 | 0.22 | % | |||||||||||||||||
| Brian J. Feeney(b) |
1,979 | 0.05 | % | |||||||||||||||||
| Louis Grossman(a) |
100 | 0.00 | % | |||||||||||||||||
| Russell B. Higley, Esquire(a) |
4,602 | 0.13 | % | |||||||||||||||||
| William P. Hornby(b) |
500 | 0.01 | % | |||||||||||||||||
| Jackie Jenkins-Scott(a) |
40 | 0.00 | % | |||||||||||||||||
| Linda Sloane Kay(a)(b) |
25,159 | (1 | ) | 0.69 | % | 60,000 | 3.13 | % | ||||||||||||
| Fraser Lemley(a) |
23,764 | 0.65 | % | |||||||||||||||||
| Joseph P. Mercurio(a) |
100 | 0.00 | % | |||||||||||||||||
| Joseph J. Senna(a) |
25,001 | 0.68 | % | |||||||||||||||||
| Jo Ann Simons |
300 | 0.01 | % | |||||||||||||||||
| Barry R. Sloane(a)(b) |
8,856 | (2 | ) | 0.24 | % | |||||||||||||||
| George F. Swansburg(a) |
32,251 | 0.88 | % | |||||||||||||||||
| David B. Woonton(b) |
800 | 0.02 | % | |||||||||||||||||
| All directors and officers as a group (17 in number) |
148,422 | 4.07 | % | 1,781,841 | 92.95 | % | ||||||||||||||
| (a) | Denotes director of the Company. |
| (b) | Denotes officer of the Company or one of its subsidiaries. |
| (1) | Includes 10,254 shares owned by Ms. Kay’s spouse, 10,927 shares held in trust for Ms. Kay’s children and 3,105 shares owned by the Marshall M. and Barbara J. Sloane Private Foundation. |
| (2) | Includes 918 shares held in trust for Mr. Barry Sloane’s children and 72 shares owned by Mr. Barry Sloane’s spouse. Includes 3,111 shares pledged and 3,105 shares owned by the Marshall M. and Barbara J. Sloane Private Foundation. |
| (3) | Includes 261 shares owned by Mr. Delinsky’s children. |
| (4) | The Company has relied upon the information set forth in the Form 4 filed with the SEC by James J. Filler on January 6, 2020. |
| (5) | The Company has relied upon the information set forth in the Schedule 13G filed with the SEC by BlackRock, Inc. on February 7, 2020. |
| ITEM 13. | CERTAIN RELATIONSHIPS AND RELATED TRANSACTIONS, AND DIRECTOR INDEPENDENCE |
Certain Directors and Officers of the Company and Bank and members of their immediate family are at present, as in the past, customers of the Bank and have transactions with the Bank in the ordinary course of business. In addition, certain of the Directors are at present, as in the past, also Directors, Officers or Stockholders of corporations or members of partnerships that are customers of the Bank and have transactions with the Bank in the ordinary course of business. Such transactions with Directors and Officers of the Company and the Bank and their families and with such corporations and partnerships were made in the ordinary course of business, were made on substantially the same terms, including interest rates and collateral on loans, as those prevailing at the time for comparable transactions with other persons, and did not involve more than the normal risk of collectibility or present other features unfavorable to the Bank. The Directors annually approve amounts to be paid to related parties for services rendered. The Company reviews related party transactions monthly.
113
Table of Contents
NASDAQ Stock Market (“NASDAQ”) rules, and our governance principles, require that at least a majority of our Board be composed of “independent” directors. All of our directors other than Barry R. Sloane, Linda Sloane Kay, and George F. Swansburg are “independent” within the meaning of both the NASDAQ rules and our own corporate governance principles. Nine of our fourteen directors, therefore, are currently “independent” directors.
| ITEM 14. | PRINCIPAL ACCOUNTING FEES AND SERVICES |
The Audit Committee separately pre-approves each of the following services, in compliance with the requirements of the Sarbanes-Oxley Act and SEC regulations, before they are rendered by the auditor: financial statement audit, attestation, preparation of tax returns and audit of 401(k) and pension plans. The Audit Committee’s pre-approval procedures, in compliance with the requirements of the Sarbanes-Oxley Act and SEC regulations, allow the Company’s auditors to perform certain services without specific permission from the Audit Committee, as long as these services comply with the following requirements: (a) the services consist of special projects relating to strategic tax savings initiatives, corporate tax structure engagements or merger and acquisition consulting; (b) aggregate special project services cannot exceed $50,000 during the calendar year; and (c) the Audit Committee must be informed about each service at its next scheduled meeting. All other services provided by the Company’s auditor must be separately pre-approved before they are rendered.
| Description of Fees |
Fiscal 2019 Amount |
Fiscal 2018 Amount |
||||||
| Audit fees(1) |
$ | 610,000 | $ | 500,000 | ||||
| Audit-related fees |
— | — | ||||||
| Tax fees(2) |
53,000 | 51,500 | ||||||
| Other fees |
— | — | ||||||
|
|
|
|
|
|||||
| $ | 663,000 | $ | 551,500 | |||||
|
|
|
|
|
|||||
| (1) | includes fees for annual audit, review of quarterly financial statements, and internal control attestations. |
| (2) | includes fees for tax compliance and tax consulting. |
114
Table of Contents
PART IV
| ITEM 15. | EXHIBITS AND FINANCIAL STATEMENT SCHEDULES |
(a)(1) Financial Statements.
The following financial statements of the company and its subsidiaries are presented in Item 8:
Report of Independent Registered Public Accounting Firm
Consolidated Balance Sheets — December 31, 2019 and 2018
Consolidated Statements of Income — Years Ended December 31, 2019, 2018 and 2017
Consolidated Statements of Changes in Stockholders’ Equity-Years ended December 31, 2019, 2018 and 2017
Consolidated Statements of Cash Flows-Years Ended December 31, 2019, 2018, and 2017
Notes to Consolidated Financial Statements
(2) Financial Statement Schedules
All schedules are omitted because either the required information is shown in the financial statements or notes incorporated by reference, or they are not applicable, or the data is not significant.
115
Table of Contents
(3) Exhibits
116
Table of Contents
| + | This exhibit shall not be deemed “filed” for purposes of Section 18 of the Securities Exchange Act of 1934, or otherwise subject to the liability of that section, and shall not be deemed to be incorporated by reference into any filing under the Securities Act of 1933 or the Securities Exchange Act of 1934. |
| * | As provided in Rule 406T of Regulation S-T, this information is filed for purposes of Sections 11 and 12 of the Securities Act of 1933 and Section 18 of the Securities Exchange Act of 1934. |
(b) Exhibits required by Item 601 of Regulation S-K.
See (a)(3) above for exhibits filed herewith.
(c) Financial Statement required by Regulation S-X.
Schedules to Consolidated Financial Statements required by Regulation S-X are not required under the related instructions or are inapplicable, and therefore have been omitted.
| ITEM 16. | FORM 10-K SUMMARY |
Not applicable.
117
Table of Contents
Pursuant to the requirements of Section 13 or 15 (d) of the Securities Exchange Act of 1934, the registrant has duly caused this report to be signed on its behalf by the undersigned, thereunto duly authorized, on this 13th day of March, 2020.
| Century Bancorp, Inc. | ||
| By: | /s/ Barry R. Sloane | |
| Barry R. Sloane, Chairman, President and Chief Executive Officer | ||
Pursuant to the requirements of the Securities Exchange Act of 1934, this report has been signed below by the following persons on behalf of the registrant and in the capacities indicated and on the date indicated.
| /s/ George R. Baldwin | /s/ Joseph Senna | |||
| George R. Baldwin, Director |
Joseph Senna, Director | |||
| /s/ Stephen R. Delinsky | /s/ Jo Ann Simons | |||
| Stephen R. Delinsky, Director |
Jo Ann Simons, Director | |||
| /s/ Louis J. Grossman | /s/ Barry R. Sloane | |||
| Louis J. Grossman, Director |
Barry R. Sloane, Director, Chairman, President and Chief Executive Officer | |||
| /s/ Russell B. Higley | /s/ George F. Swansburg | |||
| Russell B. Higley, Esquire, Director |
George F. Swansburg, Director | |||
| /s/ Jackie Jenkins-Scott | /s/ William P. Hornby | |||
| Jackie Jenkins-Scott, Director |
William P. Hornby, CPA, Chief Financial Officer and Treasurer | |||
| /s/ Linda Sloane Kay | /s/ Anthony C. LaRosa | |||
| Linda Sloane Kay, Director, Vice Chair |
Anthony C. LaRosa, CPA, Senior Vice President, Century Bank and Trust Company, Principal Accounting Officer | |||
| /s/ Fraser Lemley |
| |||
| Fraser Lemley, Director |
||||
| /s/ Joseph P. Mercurio |
| |||
| Joseph P. Mercurio, Director |
||||
118