Attached files
| file | filename |
|---|---|
| EX-32.2 - EX-32.2 - Ultra Clean Holdings, Inc. | uctt-ex322_6.htm |
| EX-32.1 - EX-32.1 - Ultra Clean Holdings, Inc. | uctt-ex321_11.htm |
| EX-31.2 - EX-31.2 - Ultra Clean Holdings, Inc. | uctt-ex312_8.htm |
| EX-31.1 - EX-31.1 - Ultra Clean Holdings, Inc. | uctt-ex311_12.htm |
| EX-23.1 - EX-23.1 - Ultra Clean Holdings, Inc. | uctt-ex231_7.htm |
| EX-21.1 - EX-21.1 - Ultra Clean Holdings, Inc. | uctt-ex211_10.htm |
| EX-4.2 - EX-4.2 - Ultra Clean Holdings, Inc. | uctt-ex42_370.htm |
C
UNITED STATES
SECURITIES AND EXCHANGE COMMISSION
Washington, D.C. 20549
FORM 10-K
(Mark One)
|
☒ |
ANNUAL REPORT PURSUANT TO SECTION 13 OR 15(d) OF THE SECURITIES EXCHANGE ACT OF 1934 |
For the fiscal year ended December 27, 2019
or
|
☐ |
TRANSITION REPORT PURSUANT TO SECTION 13 OR 15(d) OF THE SECURITIES EXCHANGE ACT OF 1934 |
For the transition period from to
Commission file number 000-50646
Ultra Clean Holdings, Inc.
(Exact name of Registrant as specified in its charter)
|
Delaware |
|
61-1430858 |
|
(State or other jurisdiction of incorporation or organization) |
|
(IRS Employer Identification No.) |
|
|
|
|
|
26462 Corporate Avenue Hayward, California |
|
94545 |
|
(Address of principal executive offices) |
|
(Zip Code) |
Registrant’s telephone number, including area code:
(510) 576-4400
Securities registered pursuant to Section 12(b) of the Act:
|
Title of Each Class |
|
Name of Each Exchange on Which Registered |
|
Common Stock, $0.001 par value |
|
The NASDAQ Global Market LLC |
Securities registered pursuant to Section 12(g) of the Act:
None
Indicate by check mark if the registrant is a well-known seasoned issuer, as defined in Rule 405 of the Securities Act. Yes ☒ No ☐
Indicate by check mark if the registrant is not required to file reports pursuant to Section 13 or Section 15(d) of the Act. Yes ☐ No ☒
Indicate by check mark whether the registrant (1) has filed all reports required to be filed by Section 13 or 15(d) of the Securities Exchange Act of 1934 during the preceding 12 months (or for such shorter period that the registrant was required to file such reports), and (2) has been subject to such filing requirements for the past 90 days. Yes ☒ No ☐
Indicate by check mark whether the registrant has submitted electronically every Interactive Data File required to be submitted pursuant to Rule 405 of Regulation S-T (§ 232.405 of this chapter) during the preceding 12 months (or for such shorter period that the registrant was required to submit such files). Yes ☒ No ☐
Indicate by check mark whether the registrant is a large accelerated filer, an accelerated filer, a non-accelerated filer, a smaller reporting company, or an emerging growth company. See the definitions of “large accelerated filer,” “accelerated filer,” “smaller reporting company,” and “emerging growth company” in Rule 12b-2 of the Exchange Act.:
|
Large accelerated filer |
|
☐ |
|
Accelerated filer |
|
☒ |
|
|
|
|
|
|||
|
Non-accelerated filer |
|
☐ |
|
Smaller reporting company |
|
☐ |
|
|
|
|
|
Emerging growth company |
|
☐ |
If an emerging growth company, indicate by check mark if the registrant has elected not to use the extended transition period for complying with any new or revised financial accounting standards provided pursuant to Section 13(a) of the Exchange Act. ☐
Indicate by check mark whether the registrant is a shell company (as defined by Rule 12b-2 of the Act). Yes ☐ No ☒
The aggregate market value of the voting and non-voting stock held by non-affiliates of the Registrant, based on the closing sale price of the Registrant’s common stock on June 28, 2019 as reported on the NASDAQ Global Market, was approximately $539.6 million. Shares of common stock held by each executive officer and director have been excluded from this computation. The determination of affiliate status for this purpose is not necessarily a conclusive determination for other purposes.
Number of shares of the registrant’s common stock outstanding as of February 21, 2020: 39,888,762
DOCUMENTS INCORPORATED BY REFERENCE
Portions of the registrant’s definitive proxy statement to be delivered to stockholders in connection with the 2018 annual meeting of stockholders are incorporated by reference in Part III of this Form 10-K where indicated. Such proxy statement will be filed with the Securities and Exchange Commission within 120 days of the registrant’s fiscal year ended December 27, 2019.
|
|
|
|
Page |
|
|
|
PART I |
|
|
Item 1 |
|
3 |
|
|
Item 1A |
|
11 |
|
|
Item 1B |
|
30 |
|
|
Item 2 |
|
30 |
|
|
Item 3 |
|
31 |
|
|
Item 4 |
|
31 |
|
|
|
|
||
|
|
|
PART II |
|
|
Item 5 |
|
32 |
|
|
Item 6 |
|
34 |
|
|
Item 7 |
|
Management’s Discussion and Analysis of Financial Condition and Results of Operations |
35 |
|
Item 7A |
|
45 |
|
|
Item 8 |
|
47 |
|
|
Item 9 |
|
Changes in and Disagreements With Accountants on Accounting and Financial Disclosure |
81 |
|
Item 9A |
|
81 |
|
|
Item 9B |
|
82 |
|
|
|
|
||
|
|
|
PART III |
|
|
Item 10 |
|
83 |
|
|
Item 11 |
|
83 |
|
|
Item 12 |
|
Security Ownership of Certain Beneficial Owners and Management and Related Stockholder Matters |
83 |
|
Item 13 |
|
Certain Relationships and Related Transactions and Director Independence |
84 |
|
Item 14 |
|
84 |
|
|
|
|
||
|
|
|
PART IV |
|
|
Item 15 |
|
85 |
|
|
Item 16 |
|
87 |
|
2
This Annual Report on Form 10-K contains forward-looking statements within the meaning of the Private Securities Litigation Reform Act of 1995. Words such as “expects,” “anticipates,” “targets,” “goals,” “projects,” “intends,” “plans,” “believes,” “seeks,” “estimates,” “continues,” “may,” “will be,” “will continue,” “will likely results,” variations of such words, and similar expressions are intended to identify such forward-looking statements, but the absence of these words does not necessarily mean that a statement is not forward-looking. These forward-looking statements include, but are not limited to, statements concerning the following: projections of our financial performance, our anticipated growth and trends in our business, levels of capital expenditures, the adequacy of our capital resources to fund operations and growth, our ability to compete effectively with our competitors, our strategies and ability to protect our intellectual property, future acquisitions, customer demand, our manufacturing and procurement process, employee matters, supplier relations, foreign operations (including our operations in China and Singapore), the legal and regulatory backdrop (including environmental regulation), our exposure to market risks and other characterizations of future events or circumstances described in this Annual Report. Readers are cautioned that these forward-looking statements are only predictions and are subject to risks, uncertainties, and assumptions that are difficult to predict, including those identified below, under “Risk Factors,” and elsewhere herein. Therefore, actual results may differ materially and adversely from those expressed in any forward-looking statements. We undertake no obligation to revise or update any forward-looking statements for any reason, except as required by law.
Overview
Ultra Clean Holdings, Inc., (“UCT”, the “Company” or “We”) a Delaware corporation, was founded in November 2002 and became a publicly traded company on the NASDAQ Global Market in March 2004. We are a global leader in the design, engineering and manufacture of production tools, modules and subsystems for the semiconductor and display capital equipment markets. Our products include chemical delivery modules, frame assemblies, gas delivery systems, fluid delivery systems, precision robotics, process modules as well as other high level assemblies. Our services provide part cleaning, surface encapsulation, and high sensitivity micro contamination analysis primarily for the semiconductor device makers and wafer fabrication (WFE) equipment markets.
On April 15, 2019, we acquired substantially all of the assets of Dynamic Manufacturing Solutions, LLC ("DMS"), a semiconductor weldment and solutions provider. Under the terms of the Asset Purchase Agreement, we paid $29.9 million in cash for DMS, subject to certain post-closing adjustments as provided in the Acquisition Agreement. We may pay up to $12.5 million in additional cash earn-out payments to the former owners of DMS if, post-acquisition, the combined weldment business achieves certain gross profit and gross margin targets for the twelve months ending June 26, 2020.
With our acquisition of Quantum Global Technologies, LLC (“QGT”), on August 27, 2018, a leader in parts cleaning, coating and foundry related analytical services, we expanded our capabilities to provide ultra-high purity parts cleaning, process tool part recoating, surface treatment, and analytical services to the semiconductor and related industries.
We ship a majority of our products and provide most of our services to U.S. registered customers with locations both in and outside the U.S. In addition to U.S. manufacturing and service operations, we manufacture products and provide parts cleaning and other related services in our Asian and European facilities to support local and U.S. based customers. We conduct our operating activities primarily through our subsidiaries, Ultra Clean Technology Systems and Service, Inc., American Integration Technologies, LLC, Ultra Clean Micro-Electronics Equipment (Shanghai) Co., Ltd., Ultra Clean Asia Pacific, Pte, Ltd., UCT Thermal Solutions, Inc., UCT Fluid Delivery Solutions s.r.o. (FDS), QGT and DMS.
Over the long-term, we believe the semiconductor market we serve will continue to grow based on demand from a broad range of drivers, including applications such as autonomous vehicles, the Internet of Things, high performance computing, artificial intelligence, and technology to support the data sharing economy. We also believe that semiconductor equipment OEMs are increasingly relying on partners like UCT to fulfill their expanding capacity requirements.
3
Historically, we have operated under one operating segment. However, as a result of the acquisition of QGT, we created an additional segment in the first quarter of 2019. We reorganized our organizational and reporting structure to capture efficiencies and operating leverage from our recent acquisition and now operate and report results for two operating segments: Semiconductor Products and Solutions (“SPS”) and Semiconductor Services Business (“SSB”).
Our international revenues represented 52.1%, 56.7% and 53.6% of total revenues for fiscal years ended 2019, 2018 and 2017, respectively. See Note 12 to the Notes to Consolidated Financial Statements for further information about our geographic areas.
Our Suite of Offerings
We are a leading developer and supplier of critical subsystems, ultra-high purity cleaning and analytical services primarily for the semiconductor industry. We offer our customers an integrated outsourced solution for major subassemblies, improved design-to-delivery cycle times, design for manufacturability, prototyping and component manufacturing, and tool chamber parts cleaning and coating, as well as micro contamination analytical services. We offer our customers:
|
• |
A vertically integrated solution for complex and highly configurable systems. We provide our original equipment manufacturing (OEM) customers a broad outsourced solution for the development, design, component sourcing and cleaning, prototyping, engineering, manufacturing and testing of advanced systems. We utilize our weldment and frame fabrication capabilities with highly specialized engineering, global supply chain management, and assembly capabilities to produce high performance products that are customized to meet the needs of our customers and their end users. We enable our customers to minimize their overall number of suppliers, simplify their supply chain and reduce their inventories. |
|
• |
Subsystem manufacturing. Our experience with the demanding requirements in semiconductor equipment manufacturing has enabled us to grow from primarily supplying gas delivery modules to being a leading developer and supplier of other critical modules and subsystems. These assemblies include chemical and fluid delivery modules, wafer transport, and process modules. |
|
• |
Improved design-to-delivery cycle times. Our strong customer relationships and familiarity with their product requirements and the ever-changing needs of their customer base help us reduce their design-to-delivery cycle times. We seek to optimize our supply chain management, design and manufacturing coordination and controls to respond rapidly to order requests, enabling us to decrease product design and customization cycle times for our customers. Because our engineers work closely with our customers’ engineers and understand the fabrication, assembly and testing of their products, we often can improve their design for manufacturability, thereby improving their cost, quality and consistency. |
|
• |
Component neutral design and manufacturing. We do not manufacture components such as mass flow controllers and valves which are selected based on manufacturer published specifications. Our component neutral position enables us to recommend components on the basis of technology, performance and cost and to optimize our customers’ overall designs based on these criteria while allowing us to maintain close relationships with a wide range of component suppliers. |
|
• |
Component testing capabilities. We utilize our technical expertise to test and characterize key components and subsystems. We have made significant investments in advanced analytical and automated test equipment, enabling us to test and qualify key components. We can perform diagnostic tests, design verifications and failure analyses for our customers and suppliers. |
|
• |
Increased integration with OEMs through local presence. Our local presence in close proximity to the facilities of most of our OEM customers enables us to remain closely integrated with their design, development and implementation teams. This level of integration enables us to respond quickly and efficiently to customer changes and requests. |
|
• |
Precision fabrication. We design and manufacture weldments and frames with exacting standards to meet or exceed our customers’ needs. We utilize over 25 years of experience in the fabrication of complex components to provide a cost competitive edge in our vertical integration model. Many of our customers require frames that are powder coated and we added this capability in 2016. In 2019, we expanded our weldment capabilities via the acquisition of DMS. |
4
|
• |
Custom thermal control. We design and manufacture heaters, sensors, and controllers for precise temperature control. These products are complementary to our gas delivery systems products. |
|
• |
Parts cleaning and coating and analytical verification: Our acquisition of QGT and the subsequent creation of our SSB Business Unit has enabled us to extend our offerings to our OEM customers and added integrated device manufacturers (IDM) to our customer base. Through our Services business unit, we now offer customers validated, ultra-high purity outsourced process tool chamber parts cleaning and coating services. Included in these services are tool part process optimization solutions that could lower the total cost of ownership for our customers. Through ChemTrace®, we also now provide analytical verification of process tool chamber part cleaning effectiveness. In addition, ChemTrace® offers micro contamination analysis of tool parts, wafers and depositions, chemicals, cleanroom materials, deionized water and airborne molecular contamination. |
Our Strategy
Our objective is to grow our position as a leading solutions and service provider in the semiconductor markets we serve, while supporting other technologically similar markets in the display, consumer, medical, energy, industrial and research industries. Our strategy is comprised of the following key elements:
|
• |
Expand our solutions and service market share with semiconductor OEMs and IDMs. We believe that equipment outsourcing among OEMs creates a significant market opportunity for us to grow our business with existing and new customers. We believe our customers will continue to outsource critical subsystems and that we are well positioned to capture a significant portion of these outsourcing opportunities. We believe that our continued focus on efficient manufacturing, reduced design-to-delivery cycle times, and high quality and reliability will also allow us to gain market share. Similarly, we believe there is room to gain market share with our SSB business offerings, both with IDMs and OEMs, as customers typically outsource these solutions. By providing customers process improvement through consistently cleaner parts and analytical verification of process tool chamber part cleaning effectiveness, we have expanded our total available market significantly. |
|
• |
Develop or acquire solutions that allow our customers to succeed at the leading edge of the semiconductor processing nodes. We continue to expand the number and type of subsystems and services that we offer in this rapidly advancing semiconductor market. |
|
• |
Leverage our geographic presence in lower cost manufacturing regions. Our manufacturing facilities in Shanghai, China allow us to produce in a low-cost region. These facilities house subsystem assembly, weldment and thermal control heater operations and put us in close proximity to the manufacturing facilities of existing and potential customers and their end users. In Singapore, we have a procurement office and substantial manufacturing capabilities. Our manufacturing facilities all use similar processes and procedures, enabling us to respond rapidly to demand changes from our customer. Several QGT cleaning and analytic facilities are also in low cost regions, strategically close to our customers, adding to our competitive advantage. |
|
• |
Drive profitable growth with our flexible cost structure. We implement cost containment and capacity enhancement initiatives throughout the semiconductor demand cycle and benefit from the global presence and efficiencies of our supply chain. In addition, we believe our overseas facilities position us to respond effectively to future business demands. We employ a core engineering strategy with flexible partnering to augment our staff during the steep rise and fall often associated with cycles in the semiconductor industry. |
|
• |
Continue to selectively pursue strategic acquisitions. We will continue to consider strategic acquisitions that will enable us to improve our financial model, expand our geographic presence, secure new customers and diversify into complementary products and services markets as well as broaden our technological and cleaning and analytical capabilities in the markets we serve. |
|
• |
Strengthen vertical integration. We continue to invest in our operations to meet customer quality and delivery targets. We have expanded welding operations at several of our manufacturing sites, developed/built in-house powder coating capability, and purchased new machining tools. In addition to organic growth, we continue to manage/foster key strategic partnerships to efficiently meet production needs. |
In late 2019, UCT executed on a series of cost improvement initiatives aimed at improving the flexibility of its operating and financial model over time. These initiatives include the closure or combination of some facilities to maximize operations, the postponement of selective capital expenditures, and a reduction in workforce, without constraining our capacity or ability to grow when the semiconductor industry recovers. The final initiatives are expected to be completed in the first quarter of 2020 and will provide benefit to our ongoing operational performance.
5
We design, develop, prototype, manufacture and test subsystems, primarily for the semiconductor equipment market. Our products include precision robotic solutions, gas delivery systems, a variety of industrial and automation production equipment products, and subsystems that include wafer cleaning modules, chemical delivery modules, top-plate assemblies, frame assemblies, and process modules.
|
• |
Chemical delivery modules: Chemical delivery modules deliver gases and reactive chemicals in a liquid or gaseous form from a centralized subsystem to the reaction chamber. The module may be a gas delivery system in combination with liquid and vapor precursor delivery systems or may be a liquid delivery system in combination with a liquid storage system. |
|
• |
Frame assemblies: Frame assemblies are support structures fabricated from steel tubing or folded sheet metal and form the backbone to which all other assemblies are attached. The complex manufacturing of the frames includes powder coating, pneumatic harnesses and cables integration that connect critical subsystems together. |
|
• |
Gas delivery systems: A typical OEM gas delivery system consists of one or more gas lines, comprised of weldments, filters, mass flow controllers, regulators, pressure transducers and valves, component heaters, and an integrated electronic and/or pneumatic control system. These systems are typically pallet mounted and are enclosed in a sheet metal encasing. Our gas delivery system designs are developed in collaboration with our customers and are customized to meet the needs of specific processing requirements for OEMs. While several customers specify the full system bill of materials, many leverage our design expertise to help them select the appropriate components for their particular system. |
|
• |
Fluid delivery system: A typical OEM liquid delivery system consists of one or more chemical delivery units, comprised of small diameter high purity PFA tubing, filters, flow controllers, regulators, component heaters, and an integrated electronic and/or pneumatic control system. These units are typically contained in a plastic enclosure and further integrated into a frame. Our liquid delivery system designs are developed in collaboration with our customers and are customized to meet the needs of specific processing requirements for OEMs. Although several customers specify the full system bill of materials, many rely on our design expertise and component characterization capabilities to help them select the appropriate components for their particular system. |
|
• |
Precision robotics: Precision robotic systems are used when accurate controlled motion is required. Some of the systems that employ robotic systems are: semiconductor wafer and chip handling, wire bonding and industrial equipment. |
|
• |
Process modules: Process modules refer to the larger subsystems of semiconductor manufacturing tools that process integrated circuits onto wafers. Process modules include several smaller subsystems such as the frame assembly, top-plate assembly and gas and chemical delivery modules, as well as the chamber and electronic, pneumatic and mechanical subsystems. |
|
• |
Other high level assemblies: Other high level assemblies refer to large subsystems used in semiconductor manufacturing, display, medical, energy, industrial and research industries. |
Services
Our services business includes ultra-high purity outsourced process tool chamber parts cleaning and coating services, tool part life extension and process tool part optimization solutions, and micro-contamination analytical testing, primarily for the semiconductor device manufacturers and wafer fabrication equipment markets.
|
• |
Parts cleaning and coating: Through our QuantumClean® sites we offer customers validated, ultra-high purity outsourced process tool chamber parts cleaning and coating services. Included in these services are tool part process optimization solutions that could lower the total cost of ownership for our customers. |
|
• |
Micro-contamination analysis: Through our ChemTrace® locations we offer micro-contamination analysis of tool parts, wafers and depositions, chemicals, cleanroom materials, deionized water and airborne molecular contamination. We also provide analytical verification of process tool chamber part cleaning effectiveness. |
6
We sell our products and services primarily to customers in the semiconductor capital equipment and semiconductor integrated device manufacturing industries, and we also sell to the display, consumer, medical, energy, industrial, and research equipment industries.
The majority of our total revenues comes from the semiconductor capital equipment industry (OEM’s), which is highly concentrated, so we are therefore highly dependent upon a small number of customers. Our two largest revenue customers in fiscal year 2019, 2018 and 2017 were Applied Materials, Inc. and Lam Research Corporation, each of which accounted for more than 10.0% of our total revenues in fiscal years 2019, 2018 and 2017. As a group, our respective year’s top two customers accounted for 66.9%, 76.6% and 84.4% of the Company’s revenues for fiscal years 2019, 2018 and 2017, respectively.
Approximately 94.3% of our total revenues came from the semiconductor integrated device manufacturing industry, which include IDM, Foundry, OEM, sub-tier suppliers.
We have successfully qualified as a supplier of equipment, cleaning, coating and analytical services with each of our customers who require it. This lengthy qualification process involves the inspection and audit of our facilities and evaluation by our customers of our engineering, documentation, manufacturing and quality control processes and procedures. Our customers generally place orders with suppliers who have met and continue to meet their qualification criteria.
Customer Business Management
We sell and support our products and services through our Customer Business Management organization. Our customer relationship directors are responsible for establishing sales strategy and setting the objectives for specific customer accounts. Each customer relationship manager is dedicated to a specific customer account and is responsible for maintaining strong working relationships with that customer, in many cases provide on-site support. OEM Customer relationship managers often attend customers’ internal meetings related to production and engineering design and quality to ensure that customer expectations are interpreted and communicated properly to our operations group. Customer relationship managers also work with our customers to identify and meet their cost and design-to-delivery cycle time objectives. Our IDM Customer relationship managers work with process tool owners and Fab maintenance managers relating to the development and validation of cleaning recipes, addressing new tools cleaning and analytical requirements, and optimizing cleaning processes and analytical testing requirements to support node transitions.
We have dedicated new business development managers for both our product and service businesses. Our new business development managers initiate and develop long-term, multilevel customer relationships and work closely with them on new business opportunities. Our customer relationship organization includes technical sales support for order placement, spare parts quotes, production status updates as well as service and maintenance contracts and analysis business. We have a technical relationship representative located at most of our facilities.
We integrate new business wins into our facilities via a rigorous product transition process, working in concert with our customers to ensure all production, cleaning and/or test requirements are identified, documented, and validated. We employ the same process at all our sites, enabling products and service offerings to smoothly transition into and between our sites as needed to support customer demand.
In addition, we have developed an overall service and support infrastructure to provide our customers with service and support 24 hours a day, seven days a week. Our dedicated global field service engineers provide customer support through the performance of on-site installation, servicing and repair.
Technology Development
We engage in ongoing technology development efforts to remain a leader for gas delivery systems and to further develop our expertise in other critical subsystems. We work closely with our customers to identify and anticipate changes and trends in next-generation equipment. We participate in customer technology partnership programs that focus on process application requirements for gas and liquid delivery systems and other critical subsystems. These development efforts are designed to meet specific customer requirements in the areas of subsystem design, materials, component selection and functionality. Our technology development group also works directly with our suppliers to help them identify new component technologies and make necessary changes in, and enhancements to, the components that we integrate into our products. Our analytical and testing capabilities enable us to evaluate multiple supplier component technologies and provide our customers with a wide range of appropriate component and design choices for their gas delivery systems and other critical subsystems.
7
Our analytical and testing capabilities also help us anticipate technological changes and requirements in component features for our core UCT next-generation gas delivery systems and other critical subsystems. We are developing additional features to improve the performance and functionality of our gas delivery systems and other critical subsystems. Our technology development activities for next-gen gas delivery and other critical subsystems are performed principally in Hayward, California.
We also engage in ongoing technology development to maintain technological leadership in the cleaning, coating and analytical markets. Our Services business works closely with customers to identify and anticipate changes that will be required in next-generation equipment. SSB’s technical capability is becoming extremely critical and differentiated to ensure high wafer yields and throughput as geometries shrink and density increases. SSB’s development activities are performed primarily in Phoenix, AZ.
Intellectual Property
Our success depends in part on our ability to maintain and protect our proprietary technology and to conduct our business without infringing the proprietary rights of others. Both our products and services businesses largely depend upon our design, engineering, manufacturing, testing, cleaning, coating and analytical know-how. We also rely on a combination of trade secrets and confidentiality provisions, and to a much lesser extent, patents, copyrights and trademarks, to protect our proprietary rights. We have 128 patents with various expiration dates, mostly through QGT and its subsidiaries. We have no pending U.S. patents. Intellectual property that we develop on behalf of our customers is generally owned exclusively by those customers.
We require our employees, suppliers and potential business partners to enter into confidentiality and non-disclosure agreements before we disclose to them any sensitive or proprietary information regarding our products, technology or business plans. We require employees to assign to us proprietary information, inventions and other intellectual property they create, modify or improve.
Competition
Our industry is highly fragmented. When we compete for new business, we face competition from other suppliers of gas delivery systems, critical subsystems, cleaning and analytical services, as well as the internal manufacturing and services groups of our customers. Customers that have elected to outsource their gas delivery systems and other critical subsystems including cleaning and analytics, could elect in the future to develop and manufacture these subsystems internally, leading to further competition.
Our principal competitor for gas delivery systems is Ichor Systems, Inc., and our principal competitors for other critical subsystems are Flex Ltd., Foxsemicon Integrated Technology Inc. and Celestica Inc. Some of these competitors have substantially greater financial, technical, manufacturing and marketing resources than we do. We expect our competitors to continue to improve the performance of their current products and to introduce new products or new technologies that could adversely affect sales of our current and future products. For our services, cleaning and coating offerings, our main competitors in the US are Pentagon Technologies and Cleanpart, and in Korea, KoMiCo. For analytical services our primary competitors are Balazs (an Air Liquide company) and Cerium Labs.
The limited number of potential customers in our industry further intensifies competition. The primary competitive factors in our industry are quality, meeting customer timeline demands, price, technology, design-to-delivery cycle time, customer qualification approvals, the development of product recipes for cleaning and analytics and historical customer relationships. We anticipate that increased competitive pressures will cause intensified price-based competition and we may have to reduce the prices of our products. In addition, we expect to face new competitors as we enter new markets.
Governmental Regulation and Environmental Matters
Our operations are subject to federal, state and local regulatory requirements and foreign laws relating to environmental, waste management and health and safety matters, including measures relating to the release, use, storage, treatment, transportation, discharge, disposal and remediation of contaminants, hazardous substances and waste, as well as practices and procedures applicable to the construction and operation of our UCT facilities.
UCT’s QuantumClean® business participates in the Responsible Business Alliance’s Responsible Minerals Assurance Process for Tantalum. Our cleaning processes for tantalum-deposited parts recovers the tantalum, enabling it to re-enter the commodity market and reduce the demand for mined material, the majority of which originates from the Conflict Region in Africa.
8
Although cleaning is a chemical-intensive business, UCT’s QuantumClean® group, where possible, utilizes chemical-free processing to remove significant volumes of deposited material. Reduction in the volume of film being chemically removed reduces the amount of chemicals used to meet the target cleanliness specifications.
The semiconductor industry has stringent packaging requirements and include the need to maintain the cleanliness of part/system and provide structural support of heavy modules. These requirements may necessitate product-specific crates be designed and fabricated or plastic cleanroom boxes be used. To minimize packaging waste UCT has implemented re-use programs for these type of materials with our customer and suppliers.
Our past or future operations may result in injury or claims of injury by employees or the public which may result in material costs and liabilities to us. Although some risk of costs and liabilities related to these matters is inherent in our business, we believe that our business is in compliance with applicable regulations. However, new, modified or more stringent requirements or enforcement policies could be adopted, which could adversely affect us.
Employees
As of December 27, 2019, we had 4,400 employees, of which 460 were temporary. Of our total employees, there were 88 in engineering, 16 in technology development, 264 in sales and support, 2,882 in direct manufacturing, 779 in indirect manufacturing and 371 in executive and administrative functions. These figures include 1,884 employees in Asia and 583 employees in Europe. None of our employees are represented by a labor union and we have not experienced any work stoppages.
Available Information
We file with the Securities and Exchange Commission (“SEC”) annual reports on Form 10-K, quarterly reports on Form 10-Q and current reports on Form 8-K pursuant to Section 13(a) or 15(d) of the Securities Exchange Act of 1934, as amended, or the Exchange Act. You may read and copy any materials we file with the SEC at the Public Reference Room maintained by the SEC at 100 F Street, N.E., Washington, D.C. 20549. You may also request copies of all or any portion of such material from the SEC at prescribed rates. Please call the SEC at 1-800-SEC-0330 for further information on the operation of the public reference room. In addition, materials filed electronically with the SEC are available at the SEC’s website at http://www.sec.gov.
In addition, we make available free of charge, on or through our website at http://www.uct.com, our annual, quarterly and current reports and any amendments to those reports, as soon as reasonably practicable after electronically filing such reports with, or furnishing them to, the SEC. This website address is intended to be an inactive textual reference only; none of the information contained on our website is part of this report or is incorporated by reference herein.
Executive Officers
Set forth below is information concerning our executive officers as of February 21, 2020.
|
Name |
|
Age |
|
Position |
|
James P. Scholhamer |
|
53 |
|
Chief Executive Officer & Director |
|
Sheri Savage |
|
49 |
|
Chief Financial Officer |
|
Vijay S. Chinnasami |
|
54 |
|
Chief Operating Officer |
|
W. Joseph Williams |
|
47 |
|
President, Semiconductor Products & Solutions Business |
|
William C. Bentinck |
|
58 |
|
President, Semiconductor Services Business |
|
Chris P. Siu |
|
49 |
|
Senior Vice President, Chief Accounting Officer |
|
Joan Sterling |
|
62 |
|
Senior Vice President, Human Resources |
|
Paul Y. Cho |
|
42 |
|
General Counsel, Corporate Secretary |
9
James P. Scholhamer joined the Company as Chief Executive Officer and a member of our Board of Directors in January 2015. Prior to joining Ultra Clean, Mr. Scholhamer served as Corporate Vice President and General Manager of Applied Materials, Inc., leading the Equipment Products Group and Display Services Group of its Global Service Division from February 2011 to January 2015. Mr. Scholhamer joined Applied Materials, Inc. in 2006, where, prior to his most recent position, he served as Vice President of Operations-Energy, for the Environmental and Display Products Division from July 2006 to December 2008 and Corporate Vice President and General Manager of the Display Business Group from December 2008 to February 2011. Prior to that, Mr. Scholhamer worked for Applied Films Corporation as Vice President of Operations, Engineering and Research Development in the company’s German office from September 2002 to July 2006 and as Vice President of Thin Film Coating Division and Thin Film Equipment Division in the company’s Colorado office from July 2000 to September 2002. Mr. Scholhamer holds a Bachelor of Science degree in Materials and Metallurgical Engineering from the University of Michigan.
Sheri Savage has served as our Chief Financial Officer since July 2016. Ms. Savage joined the Company as the Senior Director of Finance in April 2009. She was Senior Vice President of Finance and Chief Accounting Officer from February 2016 to July 2016. Prior to joining the Company, Ms. Savage served at Credence Systems Corporation, a manufacturer of test equipment for the global semiconductor industry, as its Corporate Controller and Vice President of Finance from February 2008 to February 2009 and as Director of Internal Audit from May 2006 to February 2008. Prior to Credence Systems, Ms. Savage served in various accounting and finance roles at Protiviti, a global business consulting and internal audit firm, and KLA-Tencor Corporation, a supplier of process control and yield management solutions for the semiconductor and related nanoelectronics industries. Ms. Savage also served as Manager, Business Process Risk Accounting, at Arthur Anderson LLP, the former accounting firm, from May 1996 to October 1999. Ms. Savage holds a Bachelor of Science degree in Managerial Economics from the University of California, Davis.
Vijayan S. Chinnasami has served as our Chief Operating Officer since April 2019. Prior to joining the Company, Mr. Chinnasami served as the Senior Vice President of EMS Operations at Jabil Inc. from March 2017 to March 2019, as Chief Executive Officer of CaliBurger (Malaysia) from January 2015 to January 2017 and as Chief Executive Officer of Advanced Optronic Devices (Malaysia) from January 2014 to January 2017. Prior to that, Mr. Chinnasami served in various capacities with SunEdison International, Inc. (formerly MEMC Electronic Materials, Inc.), including most recently as Senior Vice President, Solar Materials, from May 2010 to August 2014, where his responsibilities included the executive management of the polysilicon, wafer, cell and module businesses. Mr. Chinnasami’s previous roles have also included Senior Vice President, Industrial Business Unit at Johnson Electric Health Hong Kong and Vice President and General Manager, Consumer Segment of Flextronics International, Ltd. Mr. Chinnasami holds a Bachelor’s degree in Production Engineering from Swinburne University of Technology.
W. Joseph Williams joined the Company in February 2015 with the acquisition of UCT Thermal Solutions, Inc. (“Thermal”) as president of Thermal, and has continued to manage Thermal since that time. Mr. Williams has served as our Executive Vice President and President, Semiconductor Products & Solutions since October 2018 and as our Senior Vice President of Customer Business Management from October 2016 to October 2018. Prior to joining the Company in 2015, Mr. Williams was President of Thermal from April 2013 to 2015. He worked previously at the Company as Vice President of New Business Development. Mr. Williams was Senior Vice President of Business Development & Engineering at AIT from 2007 to 2013. Prior to that, Mr. Williams co-founded Integrated Flow Systems and served as Vice President of Engineering and Operations and Director of Engineering and Operations from 1997 to 2004. He worked at Watkins-Johnson Company as a mechanical design engineer from 1994 to 1997. Mr. Williams holds a Bachelor of Science degree in Mechanical Engineering from North Carolina State University.
William C. Bentinck has served as our President, Semiconductor Services Business since May 2019. Mr. Bentinck joined the Company as Senior Vice President, Semiconductor Services Business, in March 2019. Mr. Bentinck previously served as Executive Vice President and General Manager of Eugenus, Inc., a semiconductor equipment manufacturing company, from November 2017 to June 2018. Prior to that, Mr. Bentinck served as Vice President and General Manager of the Logic & Memories Technology Group for AIXTRON Inc., a manufacturer of systems and equipment to the semiconductor industry, from April 2014 to November 2017. From August 2006 to March 2014, Mr. Bentinck served as General Manager, Customer Support Business Group (Spares & Services) for Lam Research Corporation, a global supplier of wafer fabrication equipment and services to the semiconductor industry. Prior to Lam Research Corporation, Mr. Bentinck served in various roles of increasing responsibility at Novellus Systems, Inc., a provider of advanced process equipment for the global semiconductor industry, from 1991 through August 2006. Mr. Bentinck holds a Bachelor of Science degree in Chemical Engineering, and a Master of Science degree in Engineering – Material Science, from California State Polytechnic University, Pomona.
10
Chris P. Siu has served as our Senior Vice President, Chief Accounting Officer since May 2019. Prior to joining the Company, Mr. Siu served as Vice President of Finance at PDF Solutions, Inc., a leading provider of differentiated data and analytics solutions to the semiconductor and electronics industries, since October 2018. Prior to PDF Solutions, Mr. Siu served at GLOBALFOUNDRIES, Inc., a global pure-play foundry for the semiconductor industry, as its Corporate Controller from June 2014 to October 2018, as Senior Director, Finance and Operations Controller from December 2013 to June 2014 and as Assistant Corporate Controller from November 2010 to December 2013. Prior to that, Mr. Siu served at Trident Microsystems, Inc. a provider of high-performance multimedia semiconductor solutions, as its Chief Accounting Officer and Director of Finance from February 2007 to November 2010. Prior to Trident Microsystems, Mr. Siu served at Varian Medial Systems, Inc., a market-leading manufacturer of medical devices for the treatment of cancer, in different finance management roles from June 2004 to February 2007. Prior to that, he worked for Deloitte & Touche from August 2001 to June 2004 and was previously with Ernst & Young from January 1996 to June 2001. Mr. Siu holds a Bachelor of Science degree in Accounting from Brigham Young University in Hawaii and a Master of Business Administration degree from the University of California at Berkeley. Mr. Siu is a Certified Public Accountant (inactive) in California.
Joan Sterling has served as our Senior Vice President of Global Human Resources since 2016. Ms. Sterling joined the Company in March 2013 as Director of Global Human Resources. Prior to joining the Company, Ms. Sterling was the Human Resources Director for Engineering and Broadcast Operations at SiriusXM Satellite Radio from 2009 to 2013. She worked at Hitachi Data Systems from 2007 to 2009 as an executive change management consultant for a global IT redesign. Ms. Sterling served as Human Resource Senior Vice President for the consumer credit group at Wells Fargo from 2005 to 2007. From 2000 to 2005, Ms. Sterling served in several senior director roles at Hewlett Packard managing human resources sites and functions of staffing, compensation, benefits, training and development. She was the Corporate Director of Human Resource Strategic Planning for First Energy Corporation from 1999 to 2000. She worked at Hewlett Packard Enterprise from 1994 to 1999 as the Midwest Region Headquarters Human Resource Manager. Ms. Sterling holds a Bachelor of Science degree in Business from DePaul University and a Master of Arts degree in Organizational Development from Loyola University.
Paul Y. Cho has served as our General Counsel and Corporate Secretary since October 2019. Mr. Cho brings over a decade of experience in various legal disciplines, including IP and commercial litigations, joint venture projects, and commercial transaction work. Most recently, from April 2016 to October 2019, Mr. Cho held the position of General Counsel and Corporate Secretary for the North American operations of the world’s second largest memory chip supplier, SK Hynix, Inc., and held the position of Senior Counsel at its corporate headquarters from September 2014 to March 2016. Prior to SK Hynix Inc., Mr. Cho served as Senior Legal Counsel for Samsung SDI, a storage battery manufacturing company, from June 2013 to September 2014 and as Legal Counsel for LG Electronics, an electronics company, from April 2012 to May 2013. Mr. Cho holds a Bachelor of Arts in English from the University of Michigan and a Juris Doctor Degree from the University of Minnesota Law School.
The following risk factors could materially and adversely affect the Company’s business, financial condition or results of operations and cause reputational harm, and should be carefully considered in evaluating the Company and its business, in addition to other information presented elsewhere in this report.
COVID-19 outbreak
The novel coronavirus COVID-19 is impacting all levels of the semiconductor industry and supply chain. For example:
|
• |
A decrease in the production (and consumption) of electronics, such as smart phones, computers, servers and televisions, much of which is concentrated in Asia (specifically China), may result in lower chip demand. |
|
• |
A reduced output from the semiconductor fabrication plants located in China and South Korea (and other regions experiencing a significant level of COVID-19 infections) may delay additional equipment move-in’s and supporting new orders at those fabrication plants. |
|
• |
Our operations, as well as the operations of our OEM customers, at the equipment manufacturing sites located in these regions may be reduced or shut down. |
11
|
• |
A decrease in the rate of parts cleaning cycles at the fabrication facilities located in these regions may reduce our SSB services in those regions. |
We are attempting to lessen the impact of COVID-19 to UCT equipment production by leveraging our extensive global supply chain and diversified factory footprint and, therefore, minimize the potential disruption to our customers. Our business continuity plan team has taken every precaution to protect our employees and factories with a wide array of preventive measures, including, among others, making protective gears and temperature sensing equipment available, implementing travel restriction and work from home policies, an increase in hygienic and janitorial services, and enforcing preventative quarantines.
The cyclical and highly volatile nature of the industries we serve could harm our operating results.
Our business and operating results depend in significant part upon capital expenditures by manufacturers in the semiconductor and display industries, which in turn depend upon the current and anticipated market demand for such products. Historically, the industries we serve (in particular the semiconductor industry) have been highly cyclical, with recurring periods of over-supply of products that have had a severe negative effect on the demand for capital equipment and related services involved in manufacturing such products. We have experienced and anticipate that we will continue to experience significant fluctuations in customer orders for our products through such cycles. Although certain aspects of our business, including the cleaning, coating and analytical services delivered by QGT which also supports the semiconductor chip market are less susceptible to variations in capital expenditures by manufacturers than other aspects of our business, slowdowns in the industries we serve have had, and future slowdowns may also have, a material adverse effect on our operating results. Demand shifts in the industries we serve are rapid and difficult to predict, and we may not be able to anticipate or respond quickly enough to changes in demand. Our ability to increase revenues of our products and services in periods of increasing demand depends, in part, upon our ability to:
|
• |
mobilize our supply chain in order to maintain component and raw material supply; |
|
• |
optimize the use of our design, engineering and manufacturing capacity in a timely manner; |
|
• |
deliver our products and services to our customers in a timely fashion; |
|
• |
expand, if necessary, our manufacturing, cleaning, coating and analytical services capacity; and |
|
• |
maintain our product and service quality as we increase production. |
If we are unable to respond to rapid increases in demand for our products and services on a timely basis, or to manage any corresponding expansion of our manufacturing and service capacity effectively, our customers could divert their purchases of products and services from us to our competitors, which would adversely affect our business.
Our ability to remain profitable and mitigate the impact on our business in periods of decreasing demand depends, in part, upon our ability to:
|
• |
optimize our inventory levels and reduce or cancel orders from our suppliers without compromising our relationships with such suppliers; |
|
• |
reduce our fixed and variable costs through a number of initiatives, which may include reducing our manufacturing workforce; |
|
• |
continue to motivate our employees; and |
|
• |
maintain the prices, quality and delivery cycles of our products and services in order to retain our customers’ business. |
The limited visibility we have from the majority of our customers of their future orders, combined with the cyclical and volatile nature of the industries we serve, make future revenues, results of operations and net cash flows difficult to estimate.
12
We rely on a small number of original equipment manufacturing (“OEM”) and integrated device manufacturing (“IDM”) customers for a significant portion of our revenues, and any adverse change in our relationships with these customers, including a decision by such customers not to continue to outsource critical subsystems or part cleaning, coating or analytical services to us or to give market share to one of our competitors, would adversely affect our business, results of operations and financial condition. Our customers also exert a significant amount of negotiating leverage over us, which may require us to accept lower operating margins, increased liability risks or changes in our operations in order to retain or expand our market share with them.
A relatively small number of OEM customers have historically accounted for a significant portion of our revenues, and we expect this trend to continue. Our top two customers accounted for 66.9%, 76.6% and 84.4% of our revenues for fiscal years 2019, 2018 and 2017, respectively, and we expect that our revenues will continue to be concentrated among a small number of customers. In addition, our customer contracts generally do not require customers to place any orders. Accordingly, the success of our products business depends on OEMs continuing to outsource the manufacturing of critical subsystems to us. Because of the small number of OEMs in the markets we serve, most of which are already our customers, it would be difficult to replace lost revenue resulting from the loss of, or the reduction, cancellation or delay in purchase orders by, any one of these customers, whether due to such customer’s decision to not continue to outsource all or a portion of its critical subsystems for its capital equipment to us, such customer giving market share to our competitors or for other reasons, such as a customer’s bankruptcy or insolvency or decreased demand for such customer’s products. We have in the past lost business from customers who have taken the manufacturing of our products in-house, given market share to our competitors or declared bankruptcy. Further, since our customers generally own the designs and other intellectual property to the products we manufacture, we cannot prevent them from licensing such designs and other intellectual property to our competitors for the manufacturing of such products. If we are unable to replace revenue from customers who determine to take subsystem assembly in-house, give market share to our competitors or from whom we otherwise lose business, such events could have a material adverse impact on our financial position and results of operations.
Our Semiconductor Services Business provides part cleaning, coating and analytical expertise, to IDM and OEM customers. Our IDM business is concentrated in a relatively small number of customers, and we compete with in-house capabilities, OEM’s who perform cleaning as part of service contracts, and businesses that provide cleaning, coating and analytical services. The OEM customer profile of our SSB segment has significant overlap with our products business and is subject to risks of market share loss to cleaning, coating and analytical services competitors. The cleaning and analytical process are proprietary to QuantumClean® and ChemTrace®, respectively, and transition to new suppliers may require requalification on the part of the customer.
Consolidation among our customers, or a decision by any one or more of our customers to outsource all or most manufacturing, assembly, cleaning, coating and analytical services work to a single equipment manufacturer, may further concentrate our business in a limited number of customers and expose us to increased risks relating to dependence on an even smaller number of customers.
In addition, due to the size and revenue contribution levels from our largest customers, they are able to exert significant pricing pressure in the negotiation of our commercial agreements and individual purchase orders. Our customers often require reduced prices or other quality, manufacturing or delivery commitments as a condition to their awarding the placement of orders with us in any given period. This may, among other things, result in reduced operating margins or require capital or other expenditures in order to maintain or expand our market share. Our customers’ negotiating leverage also can result in terms and conditions that may contain significant liability risk to us. For example, our customers generally require that we provide them indemnification against certain liabilities, which may include claims of losses by their own customers resulting out of property damages, bodily injuries or deaths, or infringement of intellectual property rights by our products. Our potential liability arising out of intellectual property infringement claims by any third party is generally uncapped. In some cases, we have self-insured against liability risk meaning that we may be directly responsible for a high magnitude of liability claims by our customers without recourse to insurance proceeds from third-party insurers. Our customers may also pressure us to make other concessions in order to preserve or expand our market share with them. Those concessions may harm our business. For example, customers may require us to move the manufacturing of our products from lower-cost geographies such as China to higher-cost geographies such as Singapore. Such transfer of manufacturing could result in reduced margins and a sub-optimal cost structure. Similarly, customers may prevent us from moving our manufacturing from higher-cost regions to lower-cost regions, while requiring us to reduce our prices. If we are unable to retain and expand our business with our customers on favorable terms, our business and operating results will be adversely affected and we may be susceptible to increased liability risk. This additional liability risk could have a material adverse effect on our business, cash flows, results of operations and financial condition.
13
Our dependence on our suppliers may prevent us from delivering an acceptable product on a timely basis.
We rely on both single-source and sole-source suppliers, some of whom are relatively small, for many of the components we use in our products and services. In addition, our customers often specify components or raw materials of particular suppliers that we must incorporate into our products. Our suppliers may be under no long-term obligation to provide us with components or raw materials. As a result, the loss of or failure to perform by any of these suppliers could adversely affect our business and operating results. In addition, the manufacturing of certain components and subsystems and the cleaning, coating and analysis of tool parts are complex processes. Therefore, if a supplier were unable to provide the volume of supplies, components or raw materials we require on a timely basis and at acceptable prices and quality, we would have to identify and qualify replacements from alternative sources. However, the process of qualifying new suppliers for complex components and raw materials is lengthy and could delay our production or delivery of services, which would adversely affect our business, operating results and financial condition.
We may also experience difficulty in obtaining sufficient supplies of components and raw materials in times of growth in our business. For example, we have in the past experienced shortages in supplies of various components, such as mass flow controllers, valves and regulators, and certain prefabricated parts, such as sheet metal enclosures, used in the manufacture of our products. In addition, one of our competitors manufactures mass flow controllers that may be specified by one or more of our customers. If we are unable to obtain these particular mass flow controllers from our competitor or convince a customer to select alternative mass flow controllers, we may be unable to meet that customer’s requirements, which could result in a loss of market share.
If we, or our suppliers, are unable to procure sufficient quantities of supplies, components or raw materials from suppliers, it could influence decisions by our customers to delay or cancel orders or service contracts and decisions by our vendors to fulfill our purchase orders and, consequently, have a material adverse effect on our results of operations.
Our inability to successfully manage the implementation of a company-wide enterprise resource planning (“ERP”) system could adversely affect our operating results.
We are in the process of implementing a new company-wide ERP system. This process has been and continues to be complex and time-consuming and we expect to incur additional capital outlays and expenses. This ERP system will replace many of our existing operating and financial systems, which is a major undertaking from a financial management and personnel perspective. Should the new ERP system not be implemented successfully throughout all our business units on time and within budget, or if the system does not perform in a satisfactory manner, it could be disruptive and adversely affect our operations, including our potential ability to report accurate, timely and consistent financial results; our ability to purchase supplies, components and raw materials from and pay our suppliers; and our ability to deliver products and services to customers on a timely basis and to collect our receivables from them.
In addition, we have teams leading the implementation of the ERP system at most of our locations. To the extent that these teams or key individuals are not retained through the implementation period, the success of our implementation could be compromised and the expected benefits of the ERP system may not be realized. If the new ERP system is not successfully and fully implemented, it could negatively affect our financial reporting, inventory management and our future sales, profitability and financial condition.
14
We are subject to order and shipment uncertainties and any significant reductions, cancellations or delays in customer orders could cause our revenue to decline and our operating results to suffer.
Our revenue is difficult to forecast because we generally do not have a material backlog of unfilled orders and because of the short time frame within which we are often required to design, produce or deliver products to our customers. Most of our revenue in any quarter depends on customer orders for our products that we receive and fulfill in the same quarter. We generally do not have long-term purchase orders or contracts that contain minimum purchase commitments from our customers. Instead, we receive non-binding forecasts of the future volume of orders from our customers. Occasionally, we order and build component inventory in advance of the receipt of actual customer orders. Customers may cancel order forecasts, change production quantities from forecasted volumes or delay production for reasons beyond our control. Furthermore, reductions, cancellations or delays in customer order forecasts, which may occur for various reasons, including reduced demand for our customer’s products, customer bankruptcies or customer insolvency, usually occur without penalty to, or compensation from, the customer. Reductions, cancellations or delays in forecasted orders could cause us to hold inventory longer than anticipated, which could reduce our gross profit, restrict our ability to fund our operations and cause us to incur unanticipated reductions or delays in revenue. Moreover, many of the products we manufacture are custom built for our customers and are therefore not fungible with products we sell to other customers. If we do not obtain orders as we anticipate, we could have excess component inventory for a specific product that we would not be able to sell to another customer, likely resulting in inventory write-offs, which could have a material adverse effect on our business, financial condition and operating results. In addition, because many of our costs are fixed in the short term, we could experience deterioration in our gross profit and operating margins when our sales volumes decline.
The manufacturing of our products and the services we provide are highly complex, and if we are not able to manage our manufacturing and procurement process effectively, our business and operating results will suffer.
The manufacturing of our products is a highly complex process. The services we provide are also highly complex, and dependent upon procuring specialty materials necessary to correctly perform the complex/precise services. Both the manufacturing of our products and the services we provide involve the integration of multiple components and require effective management of our supply chain while meeting our customers’ design-to-delivery cycle time requirements. Through the course of the manufacturing process, our customers may modify design and system configurations in response to changes in their own customers’ requirements. In order to rapidly respond to these modifications and deliver our products to our customers in a timely manner, we must effectively manage our manufacturing and procurement process. If we fail to manage this process effectively, we risk losing customers and damaging our reputation. We may also be subject to liability under our agreements with our customers if we or our suppliers fail to effectively or timely re-configure manufacturing processes or components in response to these modifications or if shipments of our products are delayed, which may lead to product defect or other claims by our customers or cancelled orders. In addition, if we acquire inventory in excess of demand or that does not meet customer specifications, we could incur excess or obsolete inventory charges. These risks are even greater during periods of macroeconomic uncertainty or down cycles in our industry, and as we continue to expand our business beyond gas delivery systems into new subsystems or services with which we have less experience. During periods of economic uncertainty or down cycles in our industry, certain of our suppliers may be forced to reduce or go out of business, which could require us to either procure products from higher-cost suppliers or, if no additional suppliers exist, reconfigure the design and manufacture of our products. This could limit our growth and have a material adverse effect on our business, financial condition and operating results.
We held our customers’ inventories on our premises and any significant damage or loss to these inventories could cause our operating results to suffer.
In connection with our cleaning business, we face a number of risks associated with customer inventory being held on our property, including the risk of loss or mishandling of, or other damage to, customer inventory, any of which could harm our reputation, adversely affect our business, and otherwise expose us to increased liabilities or losses.
Our results of operations, financial position and cash flows may suffer if we do not effectively manage our inventory.
Inventory is one of the largest assets on our balance sheet, representing 16.9% of our total assets as of December 27, 2019. We must manage our inventory of raw materials, work-in-process and finished goods effectively to meet changing customer requirements, while keeping inventory costs down and maintaining or improving gross margins.
15
Historically, the industries we serve (in particular the semiconductor capital equipment industry) have been highly cyclical, which makes accurately forecasting customers’ product needs difficult. Although we seek to maintain sufficient inventory levels of materials to guard against interruptions in supply and to meet our customers’ needs, we may experience shortages of certain key materials, particularly in times of high industry demand. We also face long lead times from our suppliers, which may be longer than the lead times provided to us by our customers. If we underestimate customer demand or if insufficient manufacturing capacity or raw materials are available, we may have to forego sales opportunities, lose market share and damage our customer relationships.
In the event we overestimate customer demand, we may allocate resources to manufacturing products that we may not be able to sell. As a result, we could hold excess or obsolete inventory, which would reduce our profit margins and adversely affect our financial results. Some of our products have in the past and may in the future become obsolete while in inventory due to changing customer specifications, or become excess inventory due to decreased demand for our products and an inability to sell the inventory within a foreseeable period. Furthermore, our customers may be able to cancel orders on short notice. This could result in charges that reduce our gross profit and gross margin. Furthermore, if market prices drop below the prices at which we value inventory, we would need to take a charge for a reduction in inventory values in accordance with the applicable accounting rules. Any future unexpected changes in demand or increases in costs of production that cause us to take additional charges for un-saleable, obsolete or excess inventory, or to reduce inventory values, would adversely affect our results of operations.
We hold inventory at our various manufacturing sites globally and many of these sites have more than one inventory warehouse. Successfully managing our inventory is dependent upon our information technology systems and internal controls. We rely upon such information technology systems and internal controls to accurately and timely manage, store and replenish inventory, complete and track customer orders, coordinate sales activities across all of our products and maintain and report vital data and information. A disruption in our information technology systems or a failure of our internal controls could result in delays or disruptions in receiving inventory and supplies or filling customer orders, incorrect inventory counts, over or under stocking or loss of inventory and adversely affect our business, customer relationships and results of operations. In particular, our largest customer requires that certain of our products are manufactured and shipped out of our Singapore facility. High levels of customer demand at such facility in fiscal year 2017 created substantial strain on our processes, internal controls and information technology systems. There can be no assurance that such delays, failures or disruptions will not have a material adverse effect on our cash flows, results of operations and financial condition.
Our customers require our products to undergo a lengthy and expensive qualification process. If we are unsuccessful or delayed in qualifying any of our products with a customer, our results of operations and financial condition could suffer.
We have had to qualify, and are required to maintain our status, as a supplier for each of our customers. This is often a lengthy process that involves the inspection and approval by a customer of our engineering, documentation, manufacturing and quality control procedures before that customer will place volume orders. Our ability to lessen the adverse effect of any loss of, or reduction in sales to, an existing customer through the rapid addition of one or more new customers is limited because of these qualification requirements. Consequently, the risk that our business, operating results and financial condition would be adversely affected by the loss of, or any reduction in orders by, any of our significant customers is increased. Moreover, if we lose our existing status as a qualified supplier to any of our customers, such customer could cancel its orders from us or otherwise terminate its relationship with us, which could have a material adverse effect on our results of operations and financial condition.
Acquisitions could result in operating and integration difficulties, dilution, margin deterioration, diversion of management’s attention, and other consequences that may adversely impact our business and results of operations.
We have made, and may in the future make, acquisitions of, or significant investments in, businesses that offer complementary products, services, technologies or market access. We expect that management will evaluate potential strategic transactions regularly with its advisors and our board of directors in the ordinary course of business. We may not be successful in negotiating the terms of potential acquisitions or financing potential acquisitions, and our due diligence may fail to identify all of the problems, liabilities or other challenges associated with an acquired business, product or technology, including issues related to intellectual property, product quality or product architecture, regulatory compliance practices, revenue recognition or other accounting practices or employee or customer retention issues. In addition, we may not be successful in effectively integrating the acquired business, product or technology into our existing business and operations. The areas where we face risks include:
|
• |
management of a larger, more complex and capital intensive, combined business, including integrating supply and distribution channels, computer and accounting systems, and other aspects of operations; |
16
|
• |
inability to complete proposed transactions due to the failure to obtain regulatory or other approvals, litigation or other disputes, and any ensuing obligation to pay a termination fee; |
|
• |
deterioration of gross margins due to the acquired company having the same customer base as us, resulting in reduced pricing leverage; |
|
• |
the failure to realize expected returns from acquired businesses; |
|
• |
reductions in cash balances or increases in debt obligations to finance the acquisition, which reduce the availability of cash flow for general corporate or other purposes; |
|
• |
integration of the capabilities of the acquired businesses while maintaining focus on providing consistently high quality products; |
|
• |
incorporation of different financial and reporting controls, processes, systems and technologies into our existing business environment; |
|
|
o |
Based on our evaluation under the COSO framework as further described under “Item 9A – Controls and Procedures,” our management concluded that we did not maintain effective internal control over financial reporting as of December 27, 2019 due to material weaknesses attributable to deficiencies in the design and implementation of business process controls and information technology general controls relating to all relevant accounts and cycles within our Semiconductor Services Business (SSB) segment. |
|
• |
unforeseen liabilities, expenses, or other losses associated with the acquisitions for which we do not have recourse under their respective agreements; |
|
• |
the risk of litigation or claims associated with a proposed or completed transaction; |
|
• |
inadequacy or ineffectiveness of an acquired company’s internal financial controls, disclosure controls and procedures, or environmental, health and safety, anti-corruption, human resource or other policies or practices; |
|
• |
performance shortfalls as a result of the diversion of management’s attention from the Company’s operations; |
|
• |
cultural challenges associated with integrating employees from the acquired business into our organization, and incentivization and retention of employees from the businesses we acquire; and |
|
• |
difficulties associated with the retention and transition of new customers and partners into our existing business. |
Our failure to address these risks or other problems encountered in connection with our past or future acquisitions and investments could cause us to fail to realize the anticipated benefits of such acquisitions or investments, incur unanticipated liabilities and substantial costs, and materially harm our business generally.
Our acquisitions could also result in dilutive issuances of our equity securities, the incurrence of debt, contingent liabilities, or amortization expenses, impairment charges and restructuring charges, any of which could harm our financial condition. Also, the anticipated benefits or value of our acquisitions or investments may not materialize. Even if an acquisition or other investment is not completed, we may divert significant management time and effort and incur significant financial cost in evaluating such acquisition or investment, which could have an adverse effect on our results of operations. Furthermore, due to prevailing conditions in the credit market and our existing leverage, the financing of any such acquisition may be difficult to obtain if at all, and the terms of any such financing may not be favorable.
Failure to realize the benefits expected from the QGT and DMS acquisitions could adversely affect the value of our common stock.
Although we expect significant benefits to result from the QGT and DMS acquisitions, there can be no assurance that we will actually realize them. Achieving these benefits will depend, in part, on our ability to integrate QGT's and DMS’ businesses successfully and efficiently. The challenges involved in these integrations, which will be complex and time consuming, include the following: preserving customer and other important relationships of QGT and DMS; managing effectively a new business and competing in a new industry for QGT; consolidating and integrating information technology, finance, general and administrative infrastructures; coordinating sales and marketing efforts to effectively position our capabilities; coordinating and integrating operations in countries in which we have not previously operated; and integrating employees and related HR systems and benefits, maintaining employee morale and retaining key employees. The successful integration of the QGT and DMS businesses will require significant management attention, and may divert the attention of management from our business and operational issues.
17
Based on our evaluation under the COSO framework as further described under “Item 9A – Controls and Procedures,” our management concluded that we did not maintain effective internal control over financial reporting as of December 27, 2019 due to material weaknesses attributable to deficiencies in the design and implementation of business process controls and information technology general controls relating to all relevant accounts and cycles within our Semiconductor Services Business (SSB) segment.
If we do not successfully manage these issues and the other challenges inherent in integrating an acquired business, we may not achieve the anticipated benefits of the QGT and DMS acquisitions and our revenue, expenses, operating results, financial condition and stock price could be materially adversely affected.
We are exposed to risks associated with volatility in the global economy.
We rely to a significant extent on OEM customers, whose business, in turn, depends largely on consumer spending and capital expenditures by businesses. Uncertainty regarding the global economy may pose challenges to our business. Economic uncertainty may exacerbate negative trends in business and consumer spending and may cause certain of our customers to push out, cancel, or refrain from placing orders for products or services, which may reduce sales and materially affect our results of operations and financial condition. Inflationary trends could also have an impact on labor costs and component costs, reducing our margins. Difficulties in obtaining capital, uncertain market conditions, or reduced profitability may also cause some customers to scale back operations, exit businesses, merge with other manufacturers, or file for bankruptcy protection and potentially cease operations, leading to customers’ reduced research and development funding and/or capital expenditures and, in turn, lower orders from our customers and/or additional slow moving or obsolete inventory or bad debt expense for us. These conditions may also similarly affect key suppliers, which could impair their ability to deliver supplies, components or raw materials and result in delays for our products or services or require us to either procure supplies, components or raw materials from higher-cost suppliers, or if no additional suppliers exist, to reconfigure the design and manufacture of our products or services, and we may be unable to fulfill customer orders.
Escalating trade tensions and the adoption or expansion of tariffs and trade restrictions could negatively impact us.
International trade tensions or trade wars, as well as other changes in social, political, regulatory and economic conditions or laws and policies, could have a material adverse effect on our business, financial condition and operating results. The U.S. Government has recently announced tariffs on steel and aluminum products and materials imported into the United States. The U.S. Government has also implemented or announced plans to impose tariffs on a wide-range of goods imported from China, where we and our customers have significant operations. Additionally, various countries and economic regions have announced plans or intentions to impose retaliatory tariffs on a wide-range of products they import from the U.S., and there is a risk that a broader trade conflict could ensue. These newly imposed or threatened U.S. tariffs and retaliatory tariffs could have the negative effect of increasing the cost of materials for our products, which could result in our products becoming less competitive or generating lower margins. This has the potential to impact global trade and economic conditions in many of the regions where we do business.
The United Kingdom’s (UK) pending withdrawal from the European Union (EU), commonly referred to as “Brexit,” has created significant uncertainty concerning the future relationship between the UK and the EU and the impact on global markets. It is unclear what financial, trade, regulatory and legal implications the withdrawal of the UK from the EU will have and how such withdrawal will affect us. Furthermore, the announcement of Brexit caused significant volatility in global stock markets and foreign currency exchange rate fluctuations, and the pending withdrawal of the UK from the EU may also adversely affect European and global economic and market conditions, which may cause our customers to closely monitor their costs and reduce their spending budgets. Any of these effects of Brexit, among others, could have a material adverse impact on our business, financial condition and results of operations.
Other changes in U.S. or international social, political, regulatory and economic conditions or laws and policies governing tax laws, foreign trade, manufacturing, and development and investment in the countries where we or our customers operate could also adversely affect our operating results and our business.
18
We have significant existing indebtedness; the restrictive covenants under our credit agreement or other limitations on financing may limit our ability to expand or pursue our business strategy or make capital expenditures; if we are forced to pay some or all of our indebtedness prior to its maturity, our financial position could be severely and adversely affected.
We have total debt as of December 27, 2019 of 292.2 million. Such debt is composed of a $300.0 million term loan outstanding under our Credit Agreement with Barclays Bank less debt costs of $9.7 million and $1.9 million under FDS’s revolving credit facility in the Czech Republic.
Our indebtedness could have adverse consequences including:
|
• |
risk associated with any inability to satisfy debt obligations; |
|
• |
the portion of our cash flows that must be dedicated to interest and principal payments and will not be available for operations, working capital, capital expenditures, expansion, acquisitions or general corporate or other purposes; and |
|
• |
impairing our ability to obtain additional financing in the future, if needed. |
If we are unable to meet our debt obligations as they come due, we could be forced to restructure or refinance such obligations, seek additional equity financing or sell assets, which we may not be able to do on satisfactory terms, or at all. If we determine it is necessary to seek additional funding for any reason, we may not be able to obtain such funding or, if funding is available, may not be able to obtain it on acceptable terms.
Our Credit Agreement contains certain covenants that restrict our ability to take certain actions, including our ability to incur additional debt, including guarantees, create liens, make certain investments, engage in transactions with affiliates and engage in certain mergers and acquisitions.
Our Credit Agreement requires us to maintain certain financial covenants, including compliance with a maximum consolidated total gross leverage ratio and a minimum fixed charge coverage ratio. Our failure to comply with these covenants could result in an event of default which, if not cured or waived, could result in the acceleration of all of our indebtedness, which would materially adversely affect our financial health if we are unable to access sufficient funds to repay all of the outstanding amounts.
As long as our indebtedness remains outstanding, the restrictive covenants and mandatory prepayment provisions could impair our ability to expand or pursue our business strategies or obtain additional funding.
We may not be able to fund our future capital requirements or strategic acquisitions from our operations, and financing from other sources may not be available on favorable terms or at all.
We made capital expenditures of approximately $25.7 million and $29.2 million for fiscal years 2019 and 2018, respectively, which primarily related to our ERP system implementation and to investment in our manufacturing facilities in the United States, China, Singapore and South Korea. The amount of our future capital requirements will depend on many factors, including:
|
• |
the cost required to ensure appropriate IT systems; |
|
• |
the cost required to ensure access to adequate manufacturing capacity; |
|
• |
the timing and extent of spending to support product development efforts; |
|
• |
the timing of introductions of new products and enhancements to existing products; |
|
• |
the timing, size and availability of strategic transactions we may enter into; |
|
• |
the cost required to integrate our acquisitions into our business, including into our ERP system; |
|
• |
changing manufacturing capabilities to meet new or increased customer requirements; |
|
• |
market acceptance of our products; and |
|
• |
an ability to generate sufficient cash flow from our operating activities. |
19
We regularly consider opportunities for strategic acquisitions. On April 15, 2019, we acquired substantially all of the assets of DMS for approximately $29.9 million in cash, subject to certain post-closing adjustments, and we may pay up to $12.5 million in additional cash earn-out if the combined weldment business after the acquisition achieves certain gross profit and gross margin targets for the twelve months ending June 26, 2020. We drew $15.0 million from our available Revolving Credit Facility to finance this acquisition.
In order to finance our capital expenditures or any future strategic acquisitions, we may need to raise additional funds through public or private equity or debt financing, but such financing may not be available on terms satisfactory to us, or at all. Access to capital markets has, in the past, been unavailable to companies such as ours. In addition, equity financings could be dilutive to holders of our common stock, and debt financings would likely involve additional covenants that restrict our business operations. Any potential strategic acquisition or significant capital expenditure may also require the consent of our existing lenders. If we cannot raise funds on acceptable terms if and when needed, we may not be able to develop or enhance our products, take advantage of future opportunities, including potential acquisitions, grow our business or respond to competitive pressures or unanticipated requirements, any of which could adversely affect our business, operating results and financial condition.
Our quarterly revenue and operating results could fluctuate significantly from period to period, and this may cause volatility in our common stock price.
Our quarterly revenue and operating results, including our gross margin, have fluctuated significantly in the past, and we expect them to continue to fluctuate in the future for a variety of reasons which may include:
|
• |
demand for and market acceptance of our products and services as a result of the cyclical nature of the industries we serve or otherwise, often resulting in reduced sales during industry downturns and increased sales during periods of industry recovery or growth; |
|
• |
overall economic conditions; |
|
• |
changes in the timing and size of orders by our customers; |
|
• |
loss of business from one or more significant customers due to strategic decisions by our customers to terminate their outsourcing relationship with us or give market share to our competitors, or due to decreased demand for our customers’ products by end customers; |
|
• |
strategic consolidation by our customers; |
|
• |
cancellations and postponements of previously placed orders; |
|
• |
pricing pressure from either our competitors or our customers, resulting in the reduction of our product or service prices, margins or loss of market share; |
|
• |
disruptions or delays in the manufacturing of our products or in the supply of components or raw materials that are incorporated into or used to manufacture our products or provide our services, thereby causing us to delay the shipment of products; |
|
• |
decreased margins for several or more quarters following the introduction of new products or services, especially as we introduce new subsystems; |
|
• |
delays in ramp-up in production, low yields or other problems experienced at our manufacturing facilities in China or Singapore; |
|
• |
changes in design-to-delivery cycle times; |
|
• |
inability to reduce our costs quickly in step with reductions in our prices or in response to decreased demand for our products; |
|
• |
changes in our mix of products sold or services; |
|
• |
write-offs of excess or obsolete inventory due to a customer’s bankruptcy or insolvency; |
|
• |
one-time expenses or charges associated with failed acquisition negotiations or completed acquisitions; |
|
• |
inability to control our operating costs consistent with target levels; |
20
|
• |
announcements by our competitors of new products, services or technological innovations, which may, among other things, render our products less competitive; and |
|
• |
geographic mix of customer orders or worldwide earnings. |
As a result of the foregoing, we believe that quarter-to-quarter comparisons of our revenue and operating results may not be meaningful and that these comparisons may not be an accurate indicator of our future performance. Changes in the timing or terms of a small number of transactions could disproportionately affect our operating results in any particular quarter. Moreover, our operating results in one or more future quarters may fail to meet our guidance or the expectations of securities analysts or investors. If this occurs, we would expect to experience an immediate and significant decline in the trading price of our common stock.
We have established and, as circumstances may require, intend to expand our operations globally, which exposes us to risks associated with operating in foreign countries.
We generated approximately 52.1% and 56.7% of our revenues in international markets for fiscal years 2019 and 2018, respectively. Depending on market conditions, we intend to further expand our operations in Asia and Europe. Through our acquisition of QGT, we expanded our operations to several regions outside of the United States, including in South Korea, Taiwan, Ireland, Scotland and Israel, and increased our operations in China and Singapore. The carrying amount of our fixed assets in Asia and Europe were $81.4 million and $7.5 million, respectively as of December 27, 2019.
We are exposed to political, economic, legal and other risks associated with operating in Asia and Europe, including:
|
• |
foreign currency exchange fluctuations; |
|
• |
political, civil and economic instability; |
|
• |
restrictive governmental actions, such as restrictions on the transfer or repatriation of funds and foreign investments and trade protection measures, including increasing protectionism, import/export restrictions, import/export duties and quotas, trade sanctions and customs duties and tariffs, all of which could increase under the current or future U.S. administration; |
|
• |
uncertainty regarding social, political and trade policies in the United States and abroad; |
|
• |
timing and availability of export licenses; |
|
• |
disruptions to our and our customers’ operations due to increased risk of outbreak of diseases; |
|
• |
disruptions in operations due to China’s developing domestic infrastructure, including transportation and energy; |
|
• |
difficulties in developing relationships with local suppliers; |
|
• |
difficulties in attracting new international customers; |
|
• |
difficulties in conducting due diligence with respect to business partners in certain international markets; |
|
• |
difficulties in accounts receivable collections; |
|
• |
difficulties in staffing and managing distant international subsidiaries and branch operations; |
|
• |
the burden of complying with foreign and international laws and treaties; |
|
• |
legal systems potentially subject to undue influence or corruption; and |
|
• |
potentially adverse tax consequences, including restrictions on the repatriation of earnings to the United States. |
21
Negative or uncertain global conditions could prevent us from accurately forecasting demand for our products and services which could adversely affect our results of operations. In addition, due to generally lower labor and materials costs in the Asian markets in which we currently operate, a shift in the mix of orders from our customers away from such Asian markets or from low cost Asian markets, such as China, to higher cost Asian markets, such as Singapore, could adversely affect our operating margins.
Our operations in Asia and Europe are also subject to U.S. laws governing the export of equipment. These laws are complex and require us to obtain clearances for the export to Asia and Europe of certain equipment. We may fail to comply with these laws and regulations, which could require us to cease the export of certain equipment and expose us to fines or penalties.
Over the past several years, the Chinese government has pursued economic reform policies, including the encouragement of private economic activity. The Chinese government may not continue these policies or may significantly alter them to our detriment from time to time without notice. Changes in laws and regulations or their interpretation, the imposition of confiscatory taxation policies, new restrictions on currency conversion or limitations on sources of supply could materially and adversely affect our Chinese operations, which could result in the partial or total loss of our investment in that country and materially and adversely affect our future operating results.
A significant legal risk associated with conducting business internationally is compliance with the various and differing laws and regulations, including anti-corruption and anti-bribery laws and regulations, of the countries in which we do business, antitrust and competition laws, data privacy laws and export regulations. In addition, the laws in various countries are constantly evolving and may, in some cases, conflict with each other. Although our Code of Business Conduct and Ethics and other policies prohibit us, our employees and our agents from engaging in unethical business practices, there can be no assurance that all of our employees or agents will refrain from acting in violation of our related anti-corruption policies and procedures. Any such violation could have a material adverse effect on our business.
Business practices in Asia may entail greater risk and dependence upon the personal relationships of senior management than is common in North America, and therefore some of our agreements with other parties in South Korea and China could be difficult or impossible to enforce.
Through our acquisition of QGT, we have expanded our business activities in Asia. The business culture in parts of Asia is, in some respects, different from the business cultures in Western countries. Personal relationships among business principals of companies and business entities in Asia are very significant in their business cultures. In some cases, because so much reliance is based upon personal relationships, written contracts among businesses in Asia may be less detailed and specific than is commonly accepted for similar written agreements in Western countries. In some cases, material terms of an understanding are not contained in the written agreement but exist only as oral agreements. In addition, in contrast to the Western business environment where a written agreement specifically defines the terms, rights and obligations of the parties in a legally-binding and enforceable manner, the parties to a written agreement in Asia may view that agreement more as a starting point for an ongoing business relationship which will evolve and undergo ongoing modification over time. As a result, any contractual arrangements we enter into with a counterparty in Asia may be more difficult to enforce.
We could be adversely affected by risks associated with joint ventures, including those in the Asian markets.
From time to time, we may seek to expand our business through investments in joint ventures with complementary businesses, technologies, services or products, subject to our business plans and management’s ability to identify, acquire and develop suitable investments or acquisition targets in both new and existing market categories and geographic markets. Our investments in joint ventures are subject to a number of risks, including many of those described for acquisitions above under Risk Factors—“Acquisitions could result in operating and integration difficulties, dilution, margin deterioration, diversion of management’s attention, and other consequences that may adversely impact our business and results of operations.”. In particular, at the closing of the QGT acquisition, we indirectly became a party to QGT’s joint venture with Cinos Co., Ltd. (“Cinos Korea”) in South Korea and Cinos Xi’an in China, which is our first experience with a joint venture. There can be no assurances that the joint ventures will be successful. The success of the joint ventures will require significant management and capital resources and there can be no assurances that such resources will be available. Operations at the joint ventures could expose us to
22
increased risks inherent in such activities, such as protection of our intellectual property, economic and political stability, labor matters, language and cultural differences; contractual enforcement issues; and the need to manage product development, operations and sales activities that are located a long distance from our headquarters and have historically been centralized with local management. In addition, from time to time in the future, our joint venture partners may have economic or business interests or goals that are different from ours. Furthermore, our joint venture with Cinos Korea will require us to make purchases of equity from time to time up to specified amounts. If each joint venture business does not progress according to our plans and anticipated timing, our investment in the joint ventures may not be successful.
The industries in which we participate are highly competitive and rapidly evolving, and if we are unable to compete effectively, our operating results will be harmed.
We face intense competition from subsystem and component manufacturers in the industries we serve. Increased competition has in the past resulted, and could in the future result, in price reductions, reduced gross margins or loss of market share, any of which would harm our operating results. We are subject to significant pricing pressure as we attempt to maintain and increase market share with our existing customers. Competitors may offer reduced prices or introduce new products for the markets currently served by our products. These products may have better performance, lower prices and achieve broader market acceptance than our products. Further, OEMs typically own the design rights to their products and may provide these designs to other subsystem manufacturers. If our competitors obtain proprietary rights to these designs such that we are unable to obtain the designs necessary to manufacture products for our OEM customers, our business, financial condition and operating results could be adversely affected. The cleaning and analytical process are proprietary to QuantumClean® and ChemTrace®, respectively, and are subject to less risk from cleaning, coating and analytics competitors. OEMs are looking to increase their maintenance services and could create proprietary cleaning processes with competitors, limiting our ability to compete for future business.
Our competitors may have greater financial, technical, manufacturing and marketing resources than we do. As a result, they may be able to respond more quickly to new or emerging technologies and changes in customer requirements, devote greater resources to the development, promotion, sale and support of their products and services, and reduce prices to increase market share. Moreover, there may be merger and acquisition activities among our competitors and potential competitors that may provide our competitors and potential competitors an advantage over us by enabling them to expand their product offerings and service capabilities to meet a broader range of customer needs. Further, if one of our customers develops or acquires the internal capability to develop and produce critical subsystems that we produce, or cleaning, coating and analytical services we provide, the loss of that customer could have a material adverse effect on our business, financial condition and operating results. The introduction of new technologies and new market entrants may also increase competitive pressures.
If our new products are not accepted by OEMs or other customers or if we are unable to obtain historical margins on our new products, our operating results would be adversely impacted.
We design, develop and market critical subsystems and proprietary cleaning, coating and analytical services to OEMs, IDMs and other customers. The introduction of new products and processes is inherently risky because it is difficult to foresee the adoption of new standards, coordinate our technical personnel and strategic relationships and win acceptance of new products by OEMs, IDMs and other customers. We may not be able to recoup design and development expenditures if our new products are not accepted by OEMs, IDMs or other customers. Newly introduced products typically carry lower gross margins than existing products for several or more quarters following their introduction. If any of our new systems or subsystems are not successful in the market, or if we are unable to obtain gross margins on new products that are similar to the gross margins we have historically achieved, our business, operating results and financial condition could be adversely affected.
23
Our business may be adversely affected by information technology, disruptions, including by impairing our ability to effectively deliver our products or services, which could cause us to lose customers and harm our results of operations.
The manufacture and delivery of our products, the provision of our services and our financial reporting depends on the continuing operation of our technology infrastructure and systems, particularly our data center located in California. Any damage to or failure of our systems could result in interruptions in our ability to manufacture or deliver products or services on agreed upon lead times, or at all, on a local or worldwide basis, or adversely affect our impact to accurately and timely report our financial results. Interruptions could reduce our sales and profits, and our reputation could be damaged if people believe our systems are unreliable. Our systems and operations are vulnerable to damage or interruption from earthquakes, terrorist attacks, floods, fires, power loss, hardware or software failures, telecommunications failures, cybersecurity attacks, and similar events. Some of the critical components of our system are not redundant and we currently do not have a backup data center. Accordingly, the risk associated with such events beyond our control is heightened.
Cybersecurity attacks, in particular, are evolving and include, but are not limited to, malicious software, attempts to gain unauthorized access to data, and other electronic security breaches that could lead to disruptions in systems, unauthorized release of confidential or otherwise protected information and corruption of data (our own or that of third parties). Although we have adopted certain measures to mitigate potential risks to our systems from information technology-related disruptions, given the unpredictability of the timing, nature and scope of such disruptions, we could potentially be subject to production downtimes, operational delays, other detrimental impacts on our operations or ability to provide products and services to our customers, the compromising of confidential or otherwise protected information, misappropriation, destruction or corruption of data, security breaches, other manipulation or improper use of our systems or networks, financial losses from remedial actions, loss of business or potential liability, and/or damage to our reputation, any of which could have a material adverse effect on our business, financial condition, results of operations and cash flows.
If we experience frequent or persistent system failures, the attractiveness of our products or services to customers could be permanently harmed. Any steps we take to increase the reliability and redundancy of our systems may be expensive, reduce our operating margin and may not be successful in reducing the frequency or duration of unscheduled interruptions.
If we were required to impair all or part of our goodwill and/or our acquired intangible assets, our net income and net worth could be materially adversely affected.
We had $171.1 million of goodwill recorded on our Consolidated Balance Sheet as of December 27, 2019. Goodwill represents the excess of cost over the fair market value of net tangible and finite lived, identifiable intangible assets acquired in business combinations. If our market capitalization drops significantly below the amount of net equity recorded on our balance sheet, it could indicate a decline in our value and would require us to further evaluate whether our goodwill has been impaired. During the fourth quarter of each year, we perform an annual review of our goodwill and acquired intangible assets to determine if they have become impaired, however, we also evaluate goodwill and acquired intangible assets for impairment whenever events or changes in circumstances indicate that the carrying amount may not be recoverable. If we were required to impair all or a significant part of our goodwill and/or our acquired intangible assets, our financial results and net worth could be materially adversely affected.
Our business is largely dependent on the know-how of our employees, and we generally do not have an intellectual property position that is protected by patents.
Our business is largely dependent upon our design, engineering, manufacturing, chemical processing, analytical and testing know-how. We rely on a combination of trade secrets and contractual confidentiality provisions and, to a much lesser extent, patents, copyrights and trademarks to protect our proprietary rights. Confidentiality agreements with our employees and others may not adequately prevent disclosure of trade secrets and other proprietary information. Accordingly, our intellectual property position is more vulnerable than it would be if it were protected primarily by patents. If we fail to protect our proprietary rights successfully, our competitive position could suffer, which could harm our operating results. We may be required to spend significant resources to monitor and protect our proprietary rights, and, in the event infringement or breach of our proprietary rights occurs, our competitive position in the market may be harmed. In addition, competitors may design around our technology or develop competing technologies and know-how. Further, since our customers generally own the designs and other intellectual property to the products we manufacture, we cannot prevent them from licensing such designs and other intellectual property to our competitors for the manufacture of such products.
24
Third parties have claimed and may in the future claim we are infringing their intellectual property, which could subject us to litigation or licensing expenses, and we may be prevented from selling our products if any such claims prove successful.
We have in the past and may in the future receive claims that our products, processes or technologies infringe the patents or other proprietary rights of third parties. In addition, we may be unaware of intellectual property rights of others that may be applicable to our products. Any litigation regarding our patents or other intellectual property could be costly and time-consuming and divert the attention of our management and key personnel from our business operations, any of which could have a material adverse effect on our business and results of operations. The complexity of the technology involved in our products and the uncertainty of intellectual property litigation increase these risks. Claims of intellectual property infringement may also require us to enter into costly license agreements. However, we may not be able to obtain licenses on terms acceptable to us, or at all. We also may be subject to significant damages or injunctions against the development, manufacture and sale of certain of our products if any such claims prove successful. We also rely on design specifications and other intellectual property of our customers in the manufacture of products for such customers. While our customer agreements generally provide for indemnification of us by our customers if we are subjected to litigation for third-party claims of infringement of such intellectual property, such indemnification provisions may not be sufficient to fully protect us from such claims, or our customers may breach such indemnification obligations to us, which could result in costly litigation to defend against such claims or enforce our contractual rights to such indemnification.
If we do not keep pace with developments in the industries we serve and with technological innovation generally, our products may not be competitive.
Rapid technological innovation in the markets we serve requires us to anticipate and respond quickly to evolving customer requirements and could render our current product or service offerings and technology obsolete. Technological innovations are inherently complex. We must devote resources to technology development in order to keep pace with such rapidly evolving technologies. We believe that our future success will depend upon our ability to design, engineer and manufacture products and services that meet the changing needs of our customers. This requires that we successfully anticipate and respond to technological changes in design, engineering and manufacturing processes, as well as cleaning and analytical processes, in a cost-effective and timely manner. If we are unable to integrate new technical specifications into competitive product and service designs, develop the technical capabilities necessary to manufacture new products or provide new services or make necessary modifications or enhancements to existing products or services, our business prospects could be harmed.
The timely development of new or enhanced products and services is a complex and uncertain process which requires that we:
|
• |
design innovative and performance-enhancing features that differentiate our products and services from those of our competitors; |
|
• |
identify emerging technological trends in the industries we serve, including new standards for our products and services; |
|
• |
accurately identify and design new products and services to meet market needs; |
|
• |
collaborate with OEMs to design and develop products and IDMs to design and develop services on a timely and cost-effective basis; |
|
• |
ramp-up production of new products, especially new subsystems, in a timely manner and with acceptable yields at acceptable costs; |
|
• |
successfully manage development production cycles; and |
|
• |
respond effectively to technological changes or product or service announcements by others. |
If we are unsuccessful in keeping pace with technological developments for the reasons above or other reasons, our business prospects, results of operations and financial condition could be materially and adversely affected.
25
We must achieve design wins to retain our existing customers and to obtain new customers.
New capital equipment typically has a lifespan of several years, and OEMs frequently specify which systems, subsystems, components and instruments are to be used in their equipment. Once a specific system, subsystem, component or instrument is incorporated into a piece of capital equipment, it will likely continue to be incorporated into that piece of equipment for at least several months before the OEM would be in a position to switch to the product of another supplier. IDMs typically establish cleaning, coating, and analytical services as they develop and qualify new chip designs for production. Once a cleaned or coated part has been qualified, the associated refurbishment processes are likely to continue to be used. Accordingly, it is important that our products are designed into the new capital equipment of OEMs and new chip designs, which we refer to as a design win, in order to retain our competitive position with existing customers and to obtain new customers.
We incur technology development and sales expenses with no assurance that our products will ultimately be designed into an OEM’s capital equipment. Further, developing new customer relationships, as well as maintaining and increasing our market share with existing customers, requires a substantial investment of our sales, engineering and management resources without any assurance from prospective customers that they will place significant orders. We believe that OEMs and IDMs often consider long-term relationships in selecting and placing orders with suppliers. Accordingly, we may have difficulty achieving design wins from OEMs and IDMs that are not currently our customers. Our operating results and potential growth could be adversely affected if we fail to achieve design wins with leading OEMs and IDMs.
Defects in our products could damage our reputation, decrease market acceptance of our products, cause the unintended release of hazardous materials, and result in potentially costly litigation, indemnification liability or unexpected warranty claims.
A number of factors, including design flaws, material and component failures, workmanship issues, contamination in the manufacturing, cleaning, coating or analytical environment, impurities in the materials or chemicals used and unknown sensitivities to process conditions, such as temperature and humidity, as well as equipment failures, may cause our products to contain undetected errors or defects. Problems with our products may:
|
• |
cause delays in product introductions and shipments for us or our customers; |
|
• |
result in increased costs and diversion of development resources; |
|
• |
cause us to incur increased charges due to unusable inventory; |
|
• |
require design modifications; |
|
• |
result in liability for the unintended release of hazardous materials or other damages to our or our customers’ property; |
|
• |
create claims for rework, replacement and/or damages under our contracts with customers, as well as indemnification claims from customers; |
|
• |
decrease market acceptance of, or customer satisfaction with, our products, which could result in decreased sales and product returns; or |
|
• |
result in lower yields for semiconductor manufacturers. |
If any of our products contain defects or have reliability, quality or compatibility problems, our reputation might be damaged and customers might be reluctant to buy our products or services. We may also face a higher rate of product defects as we increase our production levels. Product defects could result in warranty and indemnification liability, the loss of existing customers or impair our ability to attract new customers. In addition, we may not find defects or failures in our products until after they are installed in a manufacturer’s fabrication facility. We may have to invest significant capital and other resources to correct these problems. Our current or potential customers also might seek to recover from us any losses resulting from defects or failures in our products. Hazardous materials flow through and are controlled by our products and an unintended release of these materials could result in serious injury or death. Liability claims could require us to spend significant time and money in litigation or pay significant damages or indemnification claims.
26
Fluctuations in foreign currency exchange rates may adversely affect our financial condition and results of operations.
The majority of our international revenues are denominated in U.S. dollars. Many of the costs and expenses associated with our international operations are paid in foreign currencies, including Chinese Renminbi, Singapore dollars, Japanese Yen, South Korean Won and Euro and we expect our exposure to these foreign currencies to increase as we increase production in those facilities. Changes in exchange rates among foreign currencies in which our revenue or costs are denominated and the U.S. dollar may affect our revenue, cost of revenues, operating margins and tax.
The Company uses derivative instruments, such as foreign currency forward contracts, to hedge certain exposures to fluctuations in foreign currency exchange rates. The use of such hedging activities may not offset any, or more than a portion, of the adverse financial effects of unfavorable movements in foreign currency exchange rates over the limited time the hedges are in place.
The market for our stock is subject to significant fluctuation.
The size of our public market capitalization is relatively small, and the average volume of our shares that are traded is relatively low. The market price of our common stock could be subject to significant fluctuations. Among the factors that could affect our stock price are:
|
• |
quarterly variations in our operating results; |
|
• |
our ability to successfully introduce new products and services and manage new product transitions; |
|
• |
changes in revenue or earnings estimates or publication of research reports by analysts; |
|
• |
speculation in the press or investment community; |
|
• |
strategic actions by us, our customers or our competitors, such as acquisitions or restructurings; |
|
• |
announcements relating to any of our key customers, significant suppliers or the semiconductor manufacturing and capital equipment industry generally; |
|
• |
general market conditions; |
|
• |
the effects of war and terrorist attacks; and |
|
• |
domestic and international economic or political factors unrelated to our performance. |
The stock markets in general, and the markets for technology stocks in particular, have experienced extreme volatility that has often been unrelated to the operating performance of particular companies. These broad market fluctuations may adversely affect the trading price of our common stock.
The technology labor market is very competitive, and our business will suffer if we are unable to effectively hire, promote and retain key personnel.
Our future success depends in part on the continued service of our key executive officers, as well as our research, engineering, sales, manufacturing and administrative personnel, most of whom are not subject to employment or non-competition agreements. In addition, competition for qualified personnel in the technology industry is intense, and we operate in geographic locations in which labor markets are particularly competitive.
Our business is particularly dependent on expertise which only a limited number of engineers possess. The loss of any of our key employees and officers, including our Chief Executive Officer, our Chief Financial Officer, any of our Executive or Senior Vice Presidents or any of our other senior managers, or the failure to attract, promote and retain qualified employees, could adversely affect our business, operating results and financial condition.
Management transition also creates uncertainties and could harm our business. Disruption to our organization as a result of executive management transition could divert the executive management’s attention away from certain key areas of our business and have a material adverse effect on our business, financial condition and results of operations.
27
The challenges of employee retention has also increased during the integration process with the companies we have acquired because of the necessity of combining personnel with varied business backgrounds and combining different corporate cultures and objectives, and several acquired employees, including members of the acquired companies’ senior management, have left our company. The process of integrating operations and making such adjustments could cause an interruption of, or loss of momentum in, the activities of one or more of our businesses and the loss of key personnel. Employee uncertainty, lack of focus or turnover during the integration process may also disrupt our businesses.
We have identified material weaknesses in our internal control over financial reporting which, if not remediated, could adversely affect our reputation, business or stock price.
Based on our evaluation under the COSO framework as further described under “Item 9A – Controls and Procedures,” our management concluded that we did not maintain effective internal control over financial reporting as of December 27, 2019 due to material weaknesses attributable to deficiencies in the design and implementation of business process controls and information technology general controls relating to all relevant accounts and cycles within our Semiconductor Services Business (SSB) segment.
A material weakness is a deficiency, or a combination of deficiencies, in internal control over financial reporting, such that there is a reasonable possibility that a material misstatement of our annual or interim financial statements will not be prevented or detected on a timely basis.
Effective internal controls are necessary for us to provide reliable financial reports and prevent fraud. In addition, Section 404 of the Sarbanes-Oxley Act of 2002 requires us and our independent registered public accounting firm to evaluate and report on our internal control over financial reporting. The process of designing, implementing, maintaining and updating our internal controls and complying with Section 404 is expensive and time consuming, and requires significant attention from management and company resources. In addition, following the expiration of applicable grace periods, we are required to evaluate and report on the internal controls of the companies we acquire, and the attestation report we are required to obtain from our independent registered public accounting firm must include the internal control over financial reporting of the companies we acquire. Integrating acquired companies’ internal control frameworks into the Company and upgrading acquired companies’ controls to comply with the Sarbanes-Oxley Act has required and will require substantial resources, and we cannot assure you that we will be able to successfully or effectively maintain adequate controls over our financial processes at our acquired companies, or for our consolidated business. Failure to maintain existing or implement new or improved controls, or difficulties encountered in their implementation, could harm our results of operations or cause us to fail to meet our reporting obligations.
Although the Company has begun the process of executing remediation plans that address the material weaknesses in our internal control over financial reporting as described above, we cannot assure you that this will occur within the contemplated timeframe. Moreover, we cannot assure you that we will not identify additional material weaknesses in our internal control over financial reporting in the future. If we are unable to remediate the material weaknesses, our ability to record, process and report financial information accurately, and to prepare financial statements within the time periods specified by the rules and forms of the Securities and Exchange Commission, could be adversely affected and could reduce the market’s confidence in our financial statements and harm our stock price.
If environmental contamination were to occur in one of our production facilities, we could be subject to substantial liabilities.
We use substances regulated under various foreign, domestic, federal, state and local environmental laws and regulations in our facilities. In addition, we may not be aware of or in compliance with all environmental laws or regulations that could subject us to liability in the U.S. or internationally. Our failure or inability to comply with existing or future environmental requirements could result in significant remediation and other liabilities, the imposition of fines or the suspension or termination of the production of our services or products, and thus a material adverse impact on our business.
28
Our business is subject to the risks of earthquakes, fire, power outages, floods, and other catastrophic events, and to interruption by man-made disruptions, such as terrorism.
Our facilities could be subject to a catastrophic loss caused by natural disasters, including fires and earthquakes. We have facilities in areas with above average seismic activity, such as our facilities in South San Francisco, California, Hayward, California and our Taiwan facilities in Hsinchu and Tainan. If any of our facilities were to experience a catastrophic loss, it could disrupt our operations, delay production and shipments, reduce revenue and result in large expenses to repair or replace the facility. In addition, we have in the past experienced, and may in the future experience, fires and extended power outages at our facilities, such as the fire that occurred at a plant operated by our joint venture, Cinos Korea, in Balan, Republic of Korea, which we announced on September 19, 2018. We do not carry insurance policies that cover potential losses caused by earthquakes or other natural disasters or power loss.
In addition, disruption in supply resulting from natural disasters or other causalities or catastrophic events, such as earthquakes, severe weather such as storms or floods, fires, public health epidemic, labor disruptions, power outages, terrorist attacks or political unrest, may result in certain of our suppliers being unable to deliver sufficient quantities of components or raw materials at all or in a timely manner, disruptions in our operations or disruptions in our customers’ operations. For example, in 2011, the northern region of Japan experienced a severe earthquake followed by a tsunami. These geological events caused significant damage in that region and adversely affected Japan’s infrastructure and economy. Some of our suppliers are located in Japan and they experienced, and may experience in the future, shutdowns or disruptions as a result of these types of events, and their operations may be negatively impacted by these events. Many of our customers and suppliers are also located in California, and may be subject to the same risk of seismic activity as described for us above. Similarly, the novel coronavirus (now called “COVID-19”) outbreak in Wuhan, China in December 2019 forced the Chinese government to extend the Lunar New Year holidays in certain cities and provinces in China, and forced many others to put travel restrictions to and out of China. Such public health epidemic may adversely affect some of our operations in China, disrupting our manufacturing capacity out of the affected regions.
To the extent that natural disasters or other calamities or causalities should result in delays or cancellations of customer orders, or the delay in the manufacture or shipment of our products or services, our business, financial condition and operating results would be adversely affected.
Changes in tax rates or tax assets and liabilities could affect results of operations.
As a global company, we are subject to taxation in the United States and various other countries. Significant judgment is required to determine and estimate worldwide tax liabilities. Our future annual and quarterly tax rates could be affected by numerous factors, including changes in the: (1) applicable tax laws; (2) amount and composition of pre-tax income in countries with differing tax rates; or (3) valuation of our deferred tax assets and liabilities.
In addition, we are subject to regular examination by the Internal Revenue Service and other tax authorities, and from time to time we initiate amendments to previously filed tax returns. We regularly assess the likelihood of favorable or unfavorable outcomes resulting from these examinations and amendments to determine the adequacy of our provision for income taxes, which requires estimates and judgments. Although we believe our tax estimates are reasonable, there can be no assurance that the tax authorities will agree with such estimates. We may have to engage in litigation to achieve the results reflected in the estimates, which may be time-consuming and expensive. There can be no assurance that we will be successful or that any final determination will not be materially different from the treatment reflected in our historical income tax provisions and accruals, which could materially and adversely affect our financial condition and results of operations.
Certain regulations related to conflict minerals could adversely impact our business.
The Dodd-Frank Wall Street Reform and Consumer Protection Act contains provisions to improve transparency and accountability concerning the supply of certain minerals, known as conflict minerals, originating from the Democratic Republic of Congo (DRC) and adjoining countries. As a result, in August 2012 the SEC adopted annual disclosure and reporting requirements for those companies who use conflict minerals mined from the DRC and adjoining countries in their products. These requirements require us to perform ongoing due diligence efforts on our supply chain and require public disclosure of the nature and results of these efforts. We filed our most recent conflict minerals report on Form SD on May 30, 2019 reporting that we could not yet determine whether the conflict minerals we source were, directly or indirectly, used to finance or benefit armed groups in the Covered Countries.
29
There have been and there will be costs associated with complying with these disclosure requirements to determine the sources of conflict minerals used in our products and other potential changes to products, processes or sources of supply as a consequence of such verification activities. Complying with these rules could adversely affect the sourcing, supply and pricing of materials used in our products and result in substantial additional costs. As there may be only a limited number of suppliers offering “conflict free” conflict minerals, we cannot be sure that we will be able to obtain necessary conflict minerals from such suppliers in sufficient quantities or at competitive prices. Also, we may face reputational challenges if we determine that certain of our products contain minerals not determined to be conflict free or if we are unable to sufficiently verify the origins for all conflict minerals used in our products through the procedures we may implement. In addition, there is uncertainty about the future of the regulations related to conflict minerals as a result of legal challenges and statements by the SEC. If we are unable to comply with these rules, we could be subject to enforcement actions by the SEC and liability under the Securities Exchange Act of 1934, as amended, which could result in material adverse consequences to our business, as well as significant fines and penalties.
If securities or industry analysts do not publish research or reports about our business, or if they issue an adverse opinion regarding our stock, our stock price and trading volume could decline.
The trading market for our common stock is influenced by the research and reports that industry or securities analysts publish about us or our business. If any of the analysts who cover us issue an adverse opinion regarding our stock, our stock price would likely decline. If one or more of these analysts ceases coverage of our company or fails to publish reports on us regularly, we could lose visibility in the financial markets, which in turn could cause our stock price or trading volume to decline.
We do not currently intend to pay dividends on our common stock and, consequently, your ability to achieve a return on your investment will depend on appreciation in the price of our common stock.
We do not intend to declare and pay dividends on UCT’s common stock for the foreseeable future. We currently intend to invest our future earnings, if any, to fund our growth. Additionally, the terms of our credit agreement also restrict our ability to pay dividends. Therefore, you are not likely to receive any dividends on your common stock for the foreseeable future.
From time to time, we may become involved in other litigation and regulatory proceedings, which could require significant attention from our management and result in significant expense to us and disruptions to our business.
In addition to any litigation related to our intellectual property rights, we may in the future be named as a defendant from time to time in other lawsuits and regulatory actions relating to our business, such as commercial contract claims, environmental compliance claims, employment claims and tax examinations, some of which may claim significant damages or cause us reputational harm. Due to the inherent uncertainties of litigation and regulatory proceedings, we cannot predict the ultimate outcome of any such proceeding. An unfavorable outcome could have a material adverse effect on our business, financial condition and results of operations or limit our ability to engage in certain of our business activities. In addition, regardless of the outcome of any litigation or regulatory proceeding, such proceedings are often expensive, time-consuming and disruptive to normal business operations and require significant attention from our management. As a result, any such lawsuits or proceedings could materially and adversely affect our business, financial condition and results of operations.
None.
UCT’s headquarters is located in Hayward, California and its QGT subsidiary’s headquarters is located in Quakertown, Pennsylvania. These facilities provide administrative, sales and support, engineering and technology development and manufacturing operations. The leases for these facilities expire in 2021 and 2022, respectively.
30
The Company has manufacturing and engineering facilities in Hayward, South San Francisco and Fremont, California, Austin, Texas, Chandler, Arizona; Shanghai, China; Singapore; Cebu, Philippines and Liberec, Czech Republic. The Company has parts cleaning, analytics and engineering facilities in Colorado Springs, Colorado; Phoenix, Arizona; San Jose, California; Fremont, California; Hillsboro, Oregon; Portland, Oregon; Scarborough, Maine; Carrollton, Texas; Israel, Taiwan, South Korea, Singapore and Xi’an, China. These facilities have leases that expire on various dates through 2031 and are subject to periodic changes.
We also own buildings and land that are located in South Korea, China and the United Kingdom.
We believe that our existing facilities are well-maintained and in good operating condition.
The table below lists our properties as of March 11, 2020:
|
Location |
|
Principal Use |
|
Square Footage |
|
|
Ownership |
|
|
|
Hayward, California |
|
Headquarters, manufacturing, sales, engineering, technology development |
|
|
148,855 |
|
|
Leased |
|
|
South San Francisco, California |
|
Manufacturing, engineering |
|
|
123,847 |
|
|
Leased |
(1) |
|
Fremont, California |
|
Manufacturing, engineering |
|
|
9,000 |
|
|
Leased |
|
|
Austin, Texas |
|
Manufacturing, engineering |
|
|
56,400 |
|
|
Leased |
|
|
Chandler, Arizona |
|
Manufacturing |
|
|
127,301 |
|
|
Leased |
|
|
Cebu, Philippines |
|
Manufacturing |
|
|
15,726 |
|
|
Leased |
|
|
Singapore |
|
Manufacturing, customer support |
|
|
161,814 |
|
|
Leased |
|
|
Shanghai, China |
|
Manufacturing |
|
|
154,068 |
|
|
Leased |
|
|
Liberec, Czech Republic |
|
Manufacturing, customer support |
|
|
97,171 |
|
|
Leased |
|
|
Quakertown, Pennsylvania |
|
Headquarters |
|
|
8,077 |
|
|
Leased |
|
|
Colorado Springs, Colorado |
|
Parts Cleaning |
|
|
14,000 |
|
|
Leased |
|
|
Scarborough, Maine |
|
Parts Cleaning |
|
|
20,000 |
|
|
Leased |
|
|
San Jose, California |
|
Parts Cleaning |
|
|
20,130 |
|
|
Leased |
|
|
Fremont, California |
|
Parts Cleaning, R&D, Laboratory & Recycling |
|
|
59,161 |
|
|
Leased |
|
|
Hillsboro, Oregon |
|
Parts Cleaning |
|
|
61,334 |
|
|
Leased |
|
|
Portland, Oregon |
|
Testing & Parts Cleaning |
|
|
5,156 |
|
|
Leased |
|
|
Phoenix, Arizona |
|
Parts Cleaning |
|
|
72,884 |
|
|
Leased |
|
|
Carrollton, Texas |
|
Parts Cleaning |
|
|
121,968 |
|
|
Leased |
|
|
Quiryat Gat, Israel |
|
Parts Cleaning |
|
|
56,758 |
|
|
Leased |
|
|
Fife, Scotland, United Kingdom |
|
Parts Cleaning |
|
|
26,658 |
|
|
Own |
|
|
Singapore |
|
Parts Cleaning |
|
|
55,122 |
|
|
Leased |
|
|
Hukou Township, Taiwan |
|
Parts Cleaning |
|
|
30,354 |
|
|
Leased |
|
|
Tainan, Taiwan |
|
Parts Cleaning |
|
|
90,000 |
|
|
Leased |
|
|
Gyeonggi-do, South Korea |
|
Parts Cleaning |
|
|
40,000 |
|
|
Own |
|
|
Gyeonggi-do, South Korea |
|
Parts Cleaning |
|
|
157,453 |
|
|
Own |
|
|
Hwaseong-si, South Korea |
|
Parts Cleaning |
|
|
95,814 |
|
|
Own |
|
|
Xi'an, China |
|
Parts Cleaning |
|
|
66,185 |
|
|
Own |
|
|
(1) |
We lease this facility from one of our directors. We incurred rent expense resulting from the lease of this facility of $0.4 million and $0.3 million for each of fiscal years 2019 and 2018, respectively. |
From time to time, we are subject to various legal proceedings and claims, either asserted or unasserted, that arise in the ordinary course of business. Although the outcome of the various legal proceedings and claims cannot be predicted with certainty, we have not had a history of outcomes to date that have been material to our statement of operations and do not believe that any of these proceedings or other claims will have a material adverse effect on our consolidated financial condition or results of operations.
Not applicable.
31
|
Item 5. |
Market for Registrant’s Common Equity, Related Stockholder Matters, and Issuer Purchases of Equity Securities |
Stock Exchange Listing
Our common stock has been traded on the NASDAQ Global Market under the symbol “UCTT” since March 25, 2004. As of February 21, 2020, there were three holders of record of UCTT common stock.
Dividends on Common Stock
To date, we have not declared or paid cash dividends to our UCT stockholders and we do not intend to do so for the foreseeable future in order to retain earnings for use in our business. Our credit facility also limits our ability to pay dividends.
Stock Performance Graph
The following stock performance graph and related information shall not be deemed “soliciting material” or “filed” with the Securities and Exchange Commission, nor shall such information be incorporated by reference into any future filings under the Securities Act of 1933 or the Exchange Act, each as amended, except to the extent that we specifically incorporate it by reference into such filing.
The following stock performance graph compares the cumulative total stockholder returns during the period from December 26, 2014 to December 27, 2019 of our common stock to the NASDAQ Composite Index and the RDG Semiconductor Composite Index. The comparison assumes $100 was invested on December 26, 2014 in our common stock and in each of the foregoing indices. The stock performance shown on the following graph represents historical stock performance and is not necessarily indicative of future stock price performance.
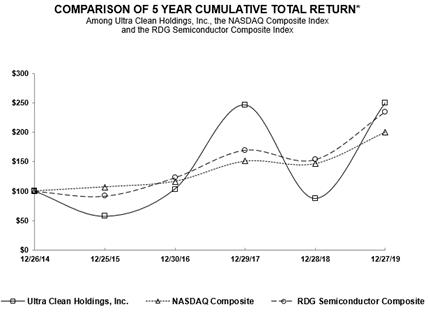
32
The following table sets forth for the periods indicated the high and low sales prices per share of our common stock as reported by the NASDAQ Global Market:
|
|
|
High |
|
|
Low |
|
||
|
Fiscal year 2018 |
|
|
|
|
|
|
|
|
|
First quarter |
|
$ |
27.20 |
|
|
$ |
16.29 |
|
|
Second quarter |
|
$ |
19.59 |
|
|
$ |
15.36 |
|
|
Third quarter |
|
$ |
17.35 |
|
|
$ |
12.28 |
|
|
Fourth quarter |
|
$ |
13.00 |
|
|
$ |
6.94 |
|
|
Fiscal year 2019 |
|
|
|
|
|
|
|
|
|
First quarter |
|
$ |
13.12 |
|
|
$ |
7.93 |
|
|
Second quarter |
|
$ |
14.82 |
|
|
$ |
10.50 |
|
|
Third quarter |
|
$ |
16.67 |
|
|
$ |
11.20 |
|
|
Fourth quarter |
|
$ |
24.24 |
|
|
$ |
13.94 |
|
Recent Sales of Unregistered Sales of Equity Securities
None.
Purchase of Equity Securities by the Issuer and Affiliated Purchasers
None.
33
You should read the following tables in conjunction with other information contained under “Management’s Discussion and Analysis of Financial Condition and Results of Operations,” our consolidated financial statements and related notes and other financial information contained elsewhere in this Annual Report on Form 10-K.
Statements of Operations Data:
|
|
Year ended |
|
||||||||||||||||||||||
|
(In millions, except per share amounts) |
12/28/2019 (1) |
|
|
12/28/2018 (2) |
|
|
12/29/2017 |
|
|
12/30/2016 |
|
|
12/25/2015 (3) |
|
||||||||||
|
Consolidated Statements of Operations Data: |
|
|||||||||||||||||||||||
|
Revenues |
$ |
|
1,066.2 |
|
|
$ |
|
1,096.5 |
|
|
$ |
|
924.4 |
|
|
$ |
|
562.8 |
|
|
$ |
|
469.1 |
|
|
Cost of revenues |
|
|
869.4 |
|
|
|
|
920.7 |
|
|
|
|
756.7 |
|
|
|
|
476.0 |
|
|
|
|
398.1 |
|
|
Gross margin |
|
|
196.8 |
|
|
|
|
175.8 |
|
|
|
|
167.7 |
|
|
|
|
86.8 |
|
|
|
|
71.0 |
|
|
Operating expenses |
|
|
166.9 |
|
|
|
|
115.1 |
|
|
|
|
78.2 |
|
|
|
|
64.4 |
|
|
|
|
65.2 |
|
|
Income from operations |
|
|
29.9 |
|
|
|
|
60.7 |
|
|
|
|
89.5 |
|
|
|
|
22.4 |
|
|
|
|
5.8 |
|
|
Interest and other income (expense), net |
|
|
(27.6 |
) |
|
|
|
(8.4 |
) |
|
|
|
(2.5 |
) |
|
|
|
(3.4 |
) |
|
|
|
(2.2 |
) |
|
Income before provision for income taxes |
|
|
2.3 |
|
|
|
|
52.3 |
|
|
|
|
87.0 |
|
|
|
|
19.0 |
|
|
|
|
3.6 |
|
|
Provision for income taxes |
|
|
10.0 |
|
|
|
|
15.3 |
|
|
|
|
11.9 |
|
|
|
|
8.9 |
|
|
|
|
14.3 |
|
|
Net income (loss) |
|
|
(7.7 |
) |
|
|
|
37.0 |
|
|
|
|
75.1 |
|
|
|
|
10.1 |
|
|
|
|
(10.7 |
) |
|
Less: Net income attributable to noncontrolling interests |
|
|
1.7 |
|
|
|
|
0.4 |
|
|
|
— |
|
|
|
— |
|
|
|
— |
|
|||
|
Net income (loss) attributable to UCT |
$ |
|
(9.4 |
) |
|
$ |
|
36.6 |
|
|
$ |
|
75.1 |
|
|
$ |
|
10.1 |
|
|
$ |
|
(10.7 |
) |
|
|
|
|
|
|
|
|
|
|
|
|
|
|
|
|
|
|
|
|
|
|
|
|
|
|
|
Net income (loss) per share attributable to UCT common stockholders: |
|
|
|
|
|
|
|
|
|
|
|
|
|
|
|
|
|
|
|
|
|
|
|
|
|
Basic |
$ |
|
(0.24 |
) |
|
$ |
|
0.95 |
|
|
$ |
|
2.25 |
|
|
$ |
|
0.31 |
|
|
$ |
|
(0.34 |
) |
|
Diluted |
$ |
|
(0.24 |
) |
|
$ |
|
0.94 |
|
|
$ |
|
2.19 |
|
|
$ |
|
0.30 |
|
|
$ |
|
(0.34 |
) |
|
Shares used in computing net income (loss) per share: |
|
|||||||||||||||||||||||
|
Basic |
|
|
39.5 |
|
|
|
|
38.4 |
|
|
|
|
33.4 |
|
|
|
|
32.6 |
|
|
|
|
31.6 |
|
|
Diluted |
|
|
39.5 |
|
|
|
|
38.9 |
|
|
|
|
34.3 |
|
|
|
|
33.2 |
|
|
|
|
31.6 |
|
Consolidated Balance Sheet Data:
|
(In millions) |
|
12/28/2019 (1) |
|
|
12/28/2018 (2) |
|
|
12/29/2017 |
|
|
12/30/2016 |
|
|
12/25/2015 (3) |
|
||||||||||
|
Cash & cash equivalents |
|
$ |
|
162.5 |
|
|
$ |
|
144.1 |
|
|
$ |
|
68.3 |
|
|
$ |
|
52.5 |
|
|
$ |
|
50.1 |
|
|
Working capital |
|
$ |
|
256.4 |
|
|
$ |
|
323.6 |
|
|
$ |
|
200.1 |
|
|
$ |
|
136.4 |
|
|
$ |
|
125.4 |
|
|
Total assets |
|
$ |
|
1,019.3 |
|
|
$ |
|
965.5 |
|
|
$ |
|
563.4 |
|
|
$ |
|
380.7 |
|
|
$ |
|
336.2 |
|
|
Bank borrowings and long-term debt |
|
$ |
|
292.2 |
|
|
$ |
|
341.2 |
|
|
$ |
|
52.3 |
|
|
$ |
|
67.8 |
|
|
$ |
|
75.5 |
|
|
Other long term liabilities |
|
$ |
|
44.0 |
|
|
$ |
|
43.6 |
|
|
$ |
|
6.6 |
|
|
$ |
|
3.3 |
|
|
$ |
|
3.8 |
|
|
Total stockholders’ equity |
|
$ |
|
452.5 |
|
|
$ |
|
451.0 |
|
|
$ |
|
300.3 |
|
|
$ |
|
216.1 |
|
|
$ |
|
200.9 |
|
|
(1) |
Includes the results of operations of DMS for the period from April 15, 2019 to December 27, 2019. |
|
(2) |
Includes the results of operations of QGT for the period from August 27, 2018 to December 28, 2018. |
|
(3) |
Includes the results of operations of Thermal and FDS for the period February 5, 2015 through December 25, 2015 and for the period from July 31, 2015 to December 25, 2015, respectively. |
See Note 2 to the Notes to Consolidated Financial Statements for further information.
34
This section and other parts of this Annual Report on Form 10-K contain forward-looking statements within the meaning of the Private Securities Litigation Reform Act of 1995. These statements involve risks and uncertainties. Forward-looking statements can also be identified by words such as “expects,” “anticipates,” “targets,” “goals,” “projects,” “intends,” “plans,” “believes,” “seeks,” “estimates,” “continues,” “may,” “will be,” “will continue,” “will likely results, and similar terms. Forward-looking statements are not guarantees of future performance and our actual results may differ significantly from the results discussed in the forward-looking statements. Factors that might cause such differences include, but are not limited to, those discussed in “Item 1A — Risk Factors” above. The following discussion should be read in conjunction with the consolidated financial statement and notes thereto included in Item 8 of this report. We assume no obligation to revise or update any forward-looking statements for any reason, except as required by law.
Overview
We are a global leader in the design, engineering and manufacture of production tools, modules and subsystems for the semiconductor and display capital equipment markets. Our products include chemical delivery modules, frame assemblies, gas delivery systems, fluid delivery systems, precision robotics, process modules as well as other high level assemblies. Our services provide part cleaning, surface encapsulation, and high sensitivity micro contamination analysis primarily for the semiconductor device makers and wafer fabrication (WFE) equipment markets.
With our acquisition of Quantum Global Technologies, LLC (“QGT”), on August 27, 2018, a leader in parts cleaning, coating and foundry related analytical services, we expanded our capabilities to provide ultra-high purity parts cleaning, process tool part recoating, surface treatment, and analytical services to the semiconductor and related industries.
Historically, the Company has operated under one operating segment. However, as a result of the acquisition of QGT, the Company created an additional segment in the first quarter of 2019. We elected to reorganize our organizational and reporting structure to capture efficiencies and operating leverage from our recent acquisition of QGT. We now report results for two segments: Semiconductor Products and Solutions (“Products” or “SPS”) and Semiconductor Services Business (“Services” or “SSB”).
On April 15, 2019, we acquired substantially all of the assets of Dynamic Manufacturing Solutions, LLC ("DMS"), a semiconductor weldment and solutions provider. Under the terms of the Asset Purchase Agreement, we paid $29.9 million in cash for DMS, subject to certain post-closing adjustments as provided in the Acquisition Agreement. We may pay up to $12.5 million in additional cash earn-out payments to the former owners of DMS if, post-acquisition, the combined weldment business achieves certain gross profit and gross margin targets for the twelve months ending June 26, 2020. DMS reports into the SPS segment.
We ship a majority of our products and provide most of our services to U.S. registered customers with locations both in and outside the U.S. In addition to U.S. manufacturing and service operations, we manufacture products and provide parts cleaning and other related services in our Asian and European facilities to support local and U.S. based customers. We conduct our operating activities primarily through our subsidiaries, Ultra Clean Technology Systems and Service, Inc., American Integration Technologies, LL, Ultra Clean Micro-Electronics Equipment (Shanghai) Co., Ltd., Ultra Clean Asia Pacific, Pte, Ltd., UCT Thermal Solutions, Inc., UCT Fluid Delivery Solutions s.r.o.(“FDS”), QGT and DMS.
Over the long-term, we believe the semiconductor market we serve will continue to grow based on demand from a broad range of drivers, including applications such as autonomous vehicles, the Internet of Things, high performance computing, artificial intelligence, and technology to support the data sharing economy. We also believe that semiconductor equipment OEMs are increasingly relying on partners like UCT to fulfill their expanding capacity requirements.
35
Our Consolidated Financial Statements have been prepared in accordance with accounting principles generally accepted in the United States, which require us to make estimates and judgments that affect the reported amounts of assets, liabilities, revenue and expenses and related disclosure at the date of our consolidated financial statements. On an on-going basis, we evaluate our estimates and judgments, including those related to revenues, inventories, goodwill, intangible assets and long-lived assets and income taxes. We base our estimates and judgments on historical experience and on various other factors that we believe to be reasonable under the circumstances, the results of which form the basis of our judgments about the carrying values of assets and liabilities that are not readily apparent from other sources. Actual results may differ from these estimates. We consider certain accounting policies related to revenue recognition, inventory valuation, accounting for income taxes, business combinations, valuation of goodwill, intangible assets and long-lived assets to be critical policies due to the estimates and judgments involved in each.
Revenue Recognition
Our revenues for fiscal years 2019, 2018 and 2017 were highly concentrated in a small number of OEM customers in the semiconductor capital equipment industry. Our standard arrangement for our customers includes a signed purchase order or contract, no right of return of delivered products and no customer acceptance provisions. We perform the following five steps to determine when to recognize revenue:
|
• |
identification of the contract(s) with customers; |
|
• |
identification of the performance obligations in the contract; |
|
• |
determination of the transaction price; |
|
• |
allocation of the transaction price to the performance obligations in the contract; and |
|
• |
recognition of revenue when, or as, a performance obligation is satisfied. |
Revenue is recognized when promised goods or services (performance obligations) are transferred to a customer in an amount that reflects the consideration to which we expect to be entitled in exchange for those goods or services.
We assess collectability based on the creditworthiness of the customer and past transaction history. We perform on-going credit evaluations of, and do not require collateral from, our customers. A significant change in the liquidity or financial position of any one customer could make it more difficult for us to assess collectability.
Inventory Valuation
We write down the carrying value of our inventory to net realizable value for estimated obsolescence or unmarketable inventory in an amount equal to the difference between the cost of inventory and its estimated realizable value based upon inventory age and assumptions about future demand and market conditions. We assess the valuation of all inventories, including raw materials, work-in-process, finished goods and spare parts on a periodic basis.
Obsolete inventory or inventory in excess of our estimated usage is written down to its estimated market value less costs to sell, if less than its cost. The inventory write-downs are recorded as an inventory valuation allowance established on the basis of obsolete inventory or specifically identified inventory in excess of established usage. Inherent in our estimates of demand and market value in determining inventory valuation are estimates related to economic trends, future demand for our products and technological obsolescence of our products. If actual demand and market conditions are less favorable than our projections, additional inventory write-downs may be required. If the inventory value is written down to its net realizable value, and subsequently there is an increased demand for the inventory at a higher value, the increased value of the inventory is not realized until the inventory is sold either as a component of a subsystem or as separate inventory. For fiscal years 2019, 2018 and 2017, we wrote down inventory of $2.6 million, $3.3 million, and $2.4 million, respectively.
36
The determination of our tax provision is highly dependent upon the geographic composition of worldwide earnings and tax regulations governing each region and is subject to judgments and estimates. Management carefully monitors the changes in many factors and adjusts the effective tax rate as required. The carrying value of our net deferred tax assets, which consist primarily of future tax deductions, assumes we will be able to generate sufficient future income to fully realize these deductions. In determining whether the realization of these deferred tax assets may be impaired, we make judgments with respect to whether we are likely to generate sufficient future taxable income to realize these assets. In order to reverse a valuation allowance, accounting principles generally accepted in the United States of America suggest that we review our recent cumulative income/loss as well as determine our ability to generate sufficient future taxable income to realize our net deferred tax assets. As of December 27, 2019, we maintained full valuation allowances on our U.S. federal and state deferred tax assets in the amount of $23.1 million as we believe it is more likely than not that these deferred tax assets will not be realized.
In addition, the calculation of tax liabilities involves significant judgment in estimating the impact of uncertainties in the application of complex tax laws. Resolution of these uncertainties in a manner inconsistent with our expectations could have a material impact on the results of our operations and financial position. We believe we have adequately reserved for our uncertain tax position, however, no assurance can be given that the final tax outcome of these matters will not be different than what we expect. We adjust these reserves in light of changing facts and circumstances, such as the closing of a tax audit or the refinement of an estimate. To the extent that the final tax outcome of these matters is different than the amounts recorded, such differences will impact the provision for income taxes in the period in which such determination is made. The provision for income taxes includes the impact of reserve provisions and changes to reserves that are considered appropriate, as well as the related net interest.
We file income tax returns in the U.S. federal jurisdiction, various states and foreign jurisdictions. Our 2016 through 2018 federal income tax returns are open to audit through the statute of limitations by the Internal Revenue Service. The Company’s 2015 through 2018 state income tax returns are open to audit by the California Franchise Tax Board. The Company is also subject to examination in various other jurisdictions for various periods.
Business Combinations
In accordance with accounting for business combinations, we allocate the purchase price of acquired companies to the tangible and intangible assets acquired and liabilities assumed based on their estimated fair values. We may engage third-party valuation firms to assist management in reviewing management’s determination of the fair values of acquired intangible assets such as customer relationships and tradenames. Such valuations require management to make significant estimates and assumptions. Management makes estimates of fair value based upon assumptions believed to be reasonable. These estimates are based on historical experience and information obtained from the management of the acquired companies and are inherently uncertain.
Goodwill, Intangibles Assets, and Long-lived Assets
Goodwill is measured as the excess of the cost of an acquisition over the sum of the amounts assigned to identifiable assets acquired less liabilities assumed.
We evaluate our goodwill and indefinite life tradename for impairment on an annual basis, and whenever events or changes in circumstances indicate that the carrying value may not be fully recoverable. In addition, we evaluate our identifiable intangible assets and other long-lived assets for impairment whenever events or changes in circumstances indicate that the carrying amount of an asset may not be recoverable. Factors we consider important which could trigger an impairment review include the following:
|
• |
Significant changes in the manner of our use of the acquired assets or the strategy of our overall business; |
|
• |
Significant negative changes in revenue of specific products or services; |
|
• |
Significant negative industry or economic trends; and |
|
• |
Significant decline in our stock price for a sustained period. |
37
We continually apply judgment when performing these evaluations and continuously monitor for events and circumstances that could negatively impact the key assumptions in determining fair value, including long-term revenue growth projections, undiscounted cash flows, discount rates, recent market valuations from transactions by comparable companies, volatility in our market capitalization and general industry, market and macroeconomic conditions. It is possible that changes in such circumstances, or in the variables associated with the judgments, assumptions and estimates used in assessing fair value, would require us to record a non-cash impairment charge.
Results of Operations
Fiscal Year
Our fiscal year is the 52- or 53-week period ending on the Friday nearest December 31. Fiscal 2019, 2018 and 2017 each contained 52 weeks.
A discussion regarding our financial condition and results of operations for fiscal 2019 compared to fiscal 2018 is presented below. A discussion regarding our financial condition and results of operations for fiscal 2018 compared to fiscal 2017 can be found under Item 7 in our Annual Report on Form 10-K for the fiscal year ended December 28, 2018, filed with the SEC on March 22, 2019, which is available on the SEC’s website at www.sec.gov and our Investor Relations website at ww.uct.com/investors.
Discussion of Results of Operations
The financial information for SSB represents a full twelve months of QGT activity in 2019 compared to four months of activity in 2018 as QGT was acquired on August 27, 2018.
The financial information for SPS represents eight months of activity in 2019 for DMS as DMS was acquired on April 15, 2019.
Revenues
|
|
|
Years Ended |
|
|||||||||||||||||||
|
Revenues by Segment |
|
December 27, |
|
|
Percent |
|
December 28, |
|
|
Percent |
|
December 29, |
|
|||||||||
|
(Dollars in millions) |
|
2019 |
|
|
Change |
|
2018 |
|
|
Change |
|
2017 |
|
|||||||||
|
SPS |
|
$ |
840.8 |
|
|
|
(17.2 |
) |
% |
|
$ |
1,015.5 |
|
|
|
9.9 |
|
% |
|
$ |
924.4 |
|
|
SSB |
|
|
225.4 |
|
|
|
178.3 |
|
% |
|
|
81.0 |
|
|
n/m |
|
|
|
|
- |
|
|
|
Total Revenues |
|
$ |
1,066.2 |
|
|
|
|
|
|
|
$ |
1,096.5 |
|
|
|
|
|
|
|
$ |
924.4 |
|
|
SPS as a percentage of total revenues |
|
|
78.9 |
% |
|
|
|
|
|
|
|
92.6 |
% |
|
|
|
|
|
|
|
100.0 |
% |
|
SSB as a percentage of total revenues |
|
|
21.1 |
% |
|
|
|
|
|
|
|
7.4 |
% |
|
|
|
|
|
|
|
0.0 |
% |
n/m = not meaningful
Total SPS revenues decreased in fiscal year 2019 over fiscal year 2018, primarily due to a slowdown in the semiconductor industry, in particular, the wafer fabrication equipment industry, partially offset by the acquisition of DMS which contributed $35.2 million of revenues in fiscal year 2019.
38
Total SSB revenues increased in fiscal year 2019 over fiscal year 2018, primarily due to the acquisition of QGT which contributed a full year of financial results in 2019 compared to four months of financial results in 2018.
|
|
|
Years Ended |
|
|||||||||||||||||||
|
Revenues by Geography |
|
December 27, |
|
|
Percent |
|
December 28, |
|
|
Percent |
|
December 29, |
|
|||||||||
|
(Dollars in millions) |
|
2019 |
|
|
Change |
|
2018 |
|
|
Change |
|
2017 |
|
|||||||||
|
United States |
|
$ |
510.9 |
|
|
|
7.5 |
|
% |
|
$ |
475.3 |
|
|
|
10.9 |
|
% |
|
$ |
428.6 |
|
|
International |
|
555.3 |
|
|
|
(10.6 |
) |
% |
|
621.2 |
|
|
|
25.3 |
|
% |
|
495.8 |
|
|||
|
Total Revenues |
|
$ |
1,066.2 |
|
|
|
|
|
|
|
$ |
1,096.5 |
|
|
|
|
|
|
|
$ |
924.4 |
|
|
Unites States as a percentage of total revenues |
|
|
47.9 |
% |
|
|
|
|
|
|
|
43.3 |
% |
|
|
|
|
|
|
|
46.4 |
% |
|
International as a percentage of total revenues |
|
|
52.1 |
% |
|
|
|
|
|
|
|
56.7 |
% |
|
|
|
|
|
|
|
53.6 |
% |
On a geographic basis, revenues represent products shipped from or services performed in our U.S. and international locations.
United States revenue increased in absolute terms and as a percentage of total revenue due, in part, to our acquisition of DMS, whose customers are primarily based in the United States.
The decrease in foreign revenues in absolute terms and as a percentage of total revenue is due primarily to lower semiconductor demands.
Gross Margin
|
|
|
Years Ended |
|
|||||||||||||||||||
|
(Dollars in millions) |
|
December 27, |
|
|
Percent |
|
December 28, |
|
|
Percent |
|
December 29, |
|
|||||||||
|
Dollar by Segment |
|
2019 |
|
|
Change |
|
2018 |
|
|
Change |
|
2017 |
|
|||||||||
|
SPS |
|
$ |
121.8 |
|
|
|
(19.0 |
) |
% |
|
$ |
150.3 |
|
|
|
(10.4 |
) |
% |
|
$ |
167.7 |
|
|
SSB |
|
|
75.0 |
|
|
|
194.1 |
|
% |
|
25.5 |
|
|
n/m |
|
|
|
|
- |
|
||
|
Gross profit |
|
$ |
196.8 |
|
|
|
|
|
|
|
$ |
175.8 |
|
|
|
|
|
|
|
$ |
167.7 |
|
|
Gross Margin Percentage by Segment |
|
|
|
|
|
|
|
|
|
|
|
|
|
|
|
|
|
|
|
|
|
|
|
SPS |
|
|
14.5 |
% |
|
|
|
|
|
|
|
14.8 |
% |
|
|
|
|
|
|
|
18.1 |
% |
|
SSB |
|
|
33.3 |
% |
|
|
|
|
|
|
|
31.5 |
% |
|
|
|
|
|
|
n/m |
|
|
|
Total Company |
|
|
18.5 |
% |
|
|
|
|
|
|
|
16.0 |
% |
|
|
|
|
|
|
|
18.1 |
% |
Cost of revenues consists primarily of purchased materials, labor and overhead, including depreciation related to certain capital assets associated with the design and manufacture of products sold. SPS gross profit decreased in fiscal year 2019 compared to fiscal year 2018 due primarily to lower revenues. SPS gross margin decreased in fiscal year 2019 compared to fiscal year 2018, due primarily to a change in product mix with lower product margins. SSB gross profit increased in fiscal year 2019 compared to fiscal year 2018 due primarily to the acquisition of QGT which contributed a full year of financial results in 2019 compared to four months of financial results in 2018. SSB gross margin increased in fiscal year 2019 compared to fiscal year 2018 due primarily to a change in product mix as well as an improvement in labor efficiencies.
Research and Development
|
|
|
Years Ended |
|
|||||||||||||||||||
|
|
|
December 27, |
|
|
Percent |
|
December 28, |
|
|
Percent |
|
December 29, |
|
|||||||||
|
(Dollars in millions) |
|
2019 |
|
|
Change |
|
2018 |
|
|
Change |
|
2017 |
|
|||||||||
|
Research and development |
|
$ |
14.6 |
|
|
|
9.8 |
|
% |
|
$ |
13.3 |
|
|
|
13.7 |
|
% |
|
$ |
11.7 |
|
|
Research and development as a percentage of total revenues |
|
|
1.4 |
% |
|
|
|
|
|
|
|
1.2 |
% |
|
|
|
|
|
|
|
1.3 |
% |
39
Research and development expenses consist primarily of activities related to new component testing and evaluation, test equipment and fixture development, product design, the advancement of cleaning and coating and analytical processes, and other product-development activities. Research and development expenses increased $1.3 million in fiscal year 2019 over fiscal year 2018, due primarily to the acquisition of QGT which contributed a full year of financial results in 2019 compared to four months of financial results in 2018.
Sales and Marketing
|
|
|
Years Ended |
|
|||||||||||||||||||
|
|
|
December 27, |
|
|
Percent |
|
December 28, |
|
|
Percent |
|
December 29, |
|
|||||||||
|
(Dollars in millions) |
|
2019 |
|
|
Change |
|
2018 |
|
|
Change |
|
2017 |
|
|||||||||
|
Sales and marketing |
|
$ |
22.4 |
|
|
|
37.4 |
|
% |
|
$ |
16.3 |
|
|
|
19.0 |
|
% |
|
$ |
13.7 |
|
|
Sales and marketing as a percentage of total revenues |
|
|
2.1 |
% |
|
|
|
|
|
|
|
1.5 |
% |
|
|
|
|
|
|
|
1.5 |
% |
Sales and marketing expenses consist primarily of salaries and commissions paid to our sales employees, salaries paid to our engineers who work with sales and service employees to help determine the components and configuration requirements for new products and other costs related to the sales of our products. Sales and marketing expenses increased $6.1 million in fiscal year 2019 over fiscal year 2018, due primarily to the acquisition of QGT which contributed a full year of financial results in 2019 compared to four months of financial results in 2018 and the inclusion of DMS’s partial year financial results of $0.8 million in fiscal year 2019.
General and Administrative
|
|
|
Years Ended |
|
|||||||||||||||||||
|
|
|
December 27, |
|
|
Percent |
|
December 28, |
|
|
Percent |
|
December 29, |
|
|||||||||
|
(Dollars in millions) |
|
2019 |
|
|
Change |
|
2018 |
|
|
Change |
|
2017 |
|
|||||||||
|
General and administrative |
|
$ |
129.9 |
|
|
|
51.9 |
|
% |
|
$ |
85.5 |
|
|
|
61.9 |
|
% |
|
$ |
52.8 |
|
|
General and administrative as a percentage of total revenues |
|
|
12.2 |
% |
|
|
|
|
|
|
|
7.8 |
% |
|
|
|
|
|
|
|
5.7 |
% |
General and administrative expenses increased $44.4 million in fiscal year 2019 over fiscal year 2018, due to the acquisition of QGT which added $25.7 million of general and administrative expense during a full year of financial results in 2019 compared to four months of financial results in 2018, $14.8 million of restructuring expenses charged to operations in fiscal year 2019, and $10.5 million higher amortization of intangibles assets related to the acquisitions of QGT and DMS.
Interest and Other Income (Expense), net
|
|
|
Years Ended |
|
|||||||||||||||||||
|
|
|
December 27, |
|
|
Percent |
|
December 28, |
|
|
Percent |
|
December 29, |
|
|||||||||
|
(Dollars in millions) |
|
2019 |
|
|
Change |
|
2018 |
|
|
Change |
|
2017 |
|
|||||||||
|
Interest income |
|
$ |
0.4 |
|
|
|
33.3 |
|
% |
|
$ |
0.3 |
|
|
|
200.0 |
|
% |
|
$ |
0.1 |
|
|
Interest expense |
|
$ |
(25.5 |
) |
|
|
155.0 |
|
% |
|
$ |
(10.0 |
) |
|
|
354.5 |
|
% |
|
$ |
(2.2 |
) |
|
Other income (expense), net |
|
$ |
(2.4 |
) |
|
|
84.6 |
|
% |
|
$ |
(1.3 |
) |
|
|
(425.0 |
) |
% |
|
$ |
0.4 |
|
Interest expense increased in fiscal year 2019 over fiscal year 2018, due to a higher average debt balance and average interest rate on our new debt related to our acquisition of QGT.
Other income (expense), net increased in fiscal year 2019 over fiscal year 2018, primarily due to a $4.1 million net increase in fair value of the contingent earn-out liabilities recorded in conjunction with the acquisitions of DMS and QGT. The $4.1 million net increase is composed of the increase in DMS’s earn-out liability of $8.0 million since its acquisition date, offset by a $3.9 million reduction of the QGT earn-out liability. This net increase was offset by a $1.5 million decrease in fair value of our liability related to our obligation to purchase the common stock owned by one of the Cinos Korea shareholders.
40
|
|
|
Years Ended |
|
|||||||||||||||||||
|
|
|
December 27, |
|
|
Percent |
|
December 28, |
|
|
Percent |
|
December 29, |
|
|||||||||
|
(Dollars in millions) |
|
2019 |
|
|
Change |
|
2018 |
|
|
Change |
|
2017 |
|
|||||||||
|
Provision for income taxes |
|
$ |
10.0 |
|
|
|
(34.6 |
) |
% |
|
$ |
15.3 |
|
|
|
28.6 |
|
% |
|
$ |
11.9 |
|
|
Effective tax rate |
|
|
415.9 |
% |
|
|
|
|
|
|
|
29.3 |
% |
|
|
|
|
|
|
|
13.6 |
% |
For fiscal year 2019, income tax expense was $10.0 million compared to $15.3 million for fiscal year 2018. For fiscal year 2019, our effective tax rate was 415.9% compared to 29.3% for fiscal year 2018. The change in respective tax rates reflects, primarily, changes in the geographic distribution of our worldwide earnings. For fiscal year 2019, our effective tax rate was higher than the statutory rates primarily due to the effects of the geographic distribution of our worldwide earnings in foreign jurisdictions with different tax rates, unfavorable book to tax differences related to U.S. tax reform, primarily income in foreign jurisdictions which cannot be offset against losses in the U.S., which is in full valuation allowance.
For the year ended December 27, 2019, the Company concluded that a full valuation allowance against its U.S. federal and state deferred tax assets continues to be necessary. The Company also concluded that some of its foreign deferred tax assets acquired as part of the QGT acquisition required a valuation allowance. As of December 27, 2019, the total U.S. and foreign valuation allowances for deferred tax assets was $23.1 million and $2.7 million, respectively.
Our ability to realize deferred tax assets depends on our ability to generate sufficient future taxable income. In assessing our future taxable income, we have considered all sources of future taxable income available to realize our deferred tax assets, including the taxable income from future reversal of existing temporary differences, carry forwards, and tax-planning strategies. If changes occur in the assumptions underlying our tax planning strategies or in the scheduling of the reversal of our deferred tax liabilities, the valuation allowance may need to be adjusted in the future.
The Company remitted earnings from its subsidiaries in Singapore and China in 2019 and the Company has no future plans to remit earnings other than possibly remitting earnings out of its Singapore entity. We may change our intent to reinvest our undistributed foreign earnings indefinitely, which could require us to accrue or pay taxes on some or all of these undistributed earnings.
Liquidity and Capital Resources
Cash and cash Equivalents
The following table summarizes our cash and cash equivalents:
|
|
|
Years Ended |
|
|||||||||
|
|
|
December 27, |
|
|
December 28, |
|
|
|
|
|
||
|
(In millions) |
|
2019 |
|
|
2018 |
|
|
Increase |
|
|||
|
Total cash and cash equivalents |
|
$ |
162.5 |
|
|
$ |
144.1 |
|
|
$ |
18.4 |
|
The increase in cash and cash equivalents in fiscal year 2019 compared to fiscal year 2018 was primarily due to the cash provided by operating activities of $121.0 million, partially offset by the $29.9 million acquisition of DMS, $26.3 million used for purchases of property, plant and equipment and net debt payments of $50.7 million.
41
|
|
|
Years Ended |
|
|||||||||
|
|
|
December 27, |
|
|
December 28, |
|
|
December 29, |
|
|||
|
(In millions) |
|
2019 |
|
|
2018 |
|
|
2017 |
|
|||
|
Operating activities |
|
$ |
121.0 |
|
|
$ |
41.7 |
|
|
$ |
48.9 |
|
|
Investing activities |
|
|
(49.2 |
) |
|
|
(345.9 |
) |
|
|
(16.1 |
) |
|
Financing activities |
|
|
(53.4 |
) |
|
|
380.1 |
|
|
|
(17.1 |
) |
|
Effects of exchange rate changes on cash and cash equivalents |
|
|
- |
|
|
|
(0.1 |
) |
|
|
0.1 |
|
|
Net increase in cash and cash equivalents |
|
$ |
18.4 |
|
|
$ |
75.8 |
|
|
$ |
15.8 |
|
Our primary cash inflows and outflows were as follows:
|
• |
We generated net cash from operating activities of $121.0 million in fiscal year 2019, compared to $41.7 million in fiscal year 2018. The $79.3 million increase was driven by an increase of $100.1 million in the net change from operating assets and liabilities and an increase of $23.9 million in non-cash items offset by a decrease of $44.7 million in net income. |
|
• |
The major contributors to the net change in operating assets and liabilities, net of effects of acquisition, in fiscal year 2019 were as follows: |
|
|
o |
Accounts receivable increased $4.5 million primarily due to timing of collections. |
|
|
o |
Inventories decreased $22.3 million due primarily to lower SPS revenues together with better management of supply chain and inventories on hand. |
|
|
o |
Prepaid expenses and other current assets decreased $3.7 million due primarily to amortization of prepaid expenses. |
|
|
o |
Accounts payable increased $31.0 million, accrued compensation and related benefits increased $9.0 million, and other liabilities increased $6.3 million, primarily due to the timing of payments. |
|
• |
Cash used in investing activities was $49.2 million in fiscal year 2019 compared to $345.9 million in fiscal year 2018. During fiscal year 2019, net cash used for investing activities primarily consisted of $29.9 million for the DMS acquisition and $26.3 million for purchases of property, plant and equipment, offset by $7.0 million in proceeds from insurance and sale of property, plant and equipment. During fiscal year 2018, net cash used for investing activities primarily consisted of $319.8 million, net of cash acquired, for the QGT acquisition and $26.1 million for purchases of property, plant and equipment. |
|
• |
Cash used in financing activities was $53.4 million in fiscal year 2019 compared to cash provided by financing activities of $380.1 million in fiscal year 2018. During fiscal year 2019, net cash used in financing activities primarily consisted of $50.7 million net of debt repayments, $0.5 million finance leases payments, $0.6 million dividends payments made to a joint venture shareholder and $1.9 million of taxes paid upon the vesting of restricted stock units. During fiscal year 2018, the cash provided by financing activities primarily included net bank borrowings of $300.7 million and $94.3 million net cash proceeds from the public offering of our common stock in February of 2018, offset by $12.1 million payment of debt issuance costs and $3.1 million of taxes paid upon vesting of restricted stock units. |
We believe we have sufficient capital to fund our working capital needs, satisfy our debt obligations, maintain our existing capital equipment, purchase new capital equipment and make strategic acquisitions from time to time. As of December 27, 2019, we had cash of $162.5 million compared to $144.1 million as of December 28, 2018. Our cash and cash equivalents, cash generated from operations and amounts available under our revolving line of credit described below were our principal sources of liquidity as of December 27, 2019.
In February of 2018, we completed an underwritten public offering of 4,761,905 shares of our common stock, in which we received net proceeds of approximately $94.3 million, after deducting the underwriting discounts and offering expenses payable by us.
42
In August 2018, in conjunction with the acquisition of QGT, we entered into a credit agreement with Barclays Bank that provided a Term Loan, a Revolving Credit Facility, and a Letter of Credit Facility (the “Credit Facilities”). See further discussion under Borrowing Arrangements below.
We anticipate that our existing cash and cash equivalents balance and operating cash flow will be sufficient to service our indebtedness and meet our working capital requirements and technology development projects for at least the next twelve months. The adequacy of these resources to meet our liquidity needs beyond that period will depend on our growth, the size and number of any acquisitions, the state of the worldwide economy, our ability to meet our financial covenants with our credit facility, the cyclical expansion or contraction of the semiconductor capital equipment industry and the other industries we serve and capital expenditures required to meet possible increased demand for our products.
In order to expand our business or acquire additional complementary businesses or technologies, we may need to raise additional funds through equity or debt financings. If required, additional financing may not be available on terms that are favorable to us, if at all. If we raise additional funds through the issuance of equity or convertible debt securities, our stockholders’ equity interest will be diluted and these securities might have rights, preferences and privileges senior to those of our current stockholders. We may also require the consent of our new lenders to raise additional funds through equity or debt financings. No assurance can be given that additional financing will be available or that, if available, such financing can be obtained on terms favorable to our stockholders and us.
In 2017, we determined that a portion of the current year and future year earnings of one of our China subsidiaries may be remitted in the future to one of our foreign subsidiaries outside of mainland China and, accordingly, we provided for the related withholding taxes in our consolidated financial statements. As of December 27, 2019, we had undistributed earnings of approximately $217.0 million from our foreign subsidiaries that are indefinitely invested outside of the U.S. As of December 27, 2019, we have cash of approximately $126.7 million in our foreign subsidiaries.
Borrowing Arrangements
|
|
|
December 27, |
|
|||||
|
|
|
2019 |
|
|||||
|
(Dollars in millions) |
|
Amount |
|
|
Weighted- Average Interest Rate |
|
||
|
U.S. Term Loan |
|
$ |
300.0 |
|
|
6.9% |
|
|
|
U.S. Revolving Credit Facility |
|
|
- |
|
|
4.7% |
|
|
|
FDS Revolving Credit Facility |
|
|
1.9 |
|
|
1.0% |
|
|
|
|
|
$ |
301.9 |
|
|
|
|
|
In August 2018, we entered into a credit agreement with Barclays Bank that provided a Term Loan, a Revolving Credit Facility and a Letter of Credit Facility (the “Credit Facility”). We and some of our subsidiaries have agreed to secure all of our obligations under the Credit Facility by granting a first priority lien in substantially all of our respective personal property assets (subject to certain exceptions and limitations). In connection with this Credit Facility, we borrowed $350.0 million under the Term Loan and used the proceeds, together with cash on hand, to finance the acquisition of QGT (see Note 2) and to refinance our previous credit facilities.
In August 2018, we paid $41.6 million of principal, accrued interest, and fees in settlement of the then-outstanding term loan, revolving credit facility, interest rate swap under the Credit Agreement, and recognized $0.1 million in expense upon extinguishment of debt as Interest and other income (expense), net.
The Term Loan has a maturity date of August 27, 2025, with monthly interest payments in arrears, quarterly principal payments of 0.625% of the original outstanding principal balance payable beginning in January 2019, with the remaining principal paid upon maturity. The Term Loan accrues interest daily at a rate equal to a base LIBOR rate determined by reference to the London interbank offered rate for dollars, plus 4.5% (subject to certain adjustments quarterly based upon the Company’s consolidated leverage ratio). At December 27, 2019, we had an outstanding amount under the Term Loan of $300.0 million, gross of unamortized debt issuance costs of $9.7 million. As of December 27, 2019, the interest rate on the outstanding Term Loan was 6.2%. On December 31, 2021, LIBOR will officially be phased out. The Company will work with its bank to determine alternative risk-free rates.
43
The Revolving Credit Facility has an initial available commitment of $65.0 million and a maturity date of August 27, 2023. We pay a quarterly commitment fee in arrears equal to 0.25% of the average daily available commitment outstanding. During the second quarter of 2019, we borrowed $15.0 million under the Revolving Credit Facility to fund the acquisition of DMS, and as of December 27, 2019, we had no amount outstanding under the Revolving Credit Facility.
The New Credit Agreement requires that we maintain certain financial covenants including a consolidated fixed charge coverage ratio (as defined in the New Credit Agreement) as of the last day of any fiscal quarter of at least 1.25 to 1.00, and a consolidated leverage ratio (as defined in the New Credit Agreement) as of the last day of any fiscal quarter of no greater than 3.75 to 1.00. We were in compliance with all covenants for the quarter ended December 27, 2019.
The Letter of Credit Facility has an initial available commitment of $50.0 million and a maturity date of August 27, 2023. We pay quarterly in arrears a fee equal to 2.5% (subject to certain adjustments as per the Term Loans) of the dollar equivalent of all outstanding letters of credit, and a fronting fee equal to 0.125% of the undrawn and unexpired amount of each letter of credit. As of December 27, 2019, we have no outstanding letters of credit and the remaining available commitments was $65.0 million.
As of December 27, 2019, FDS had an outstanding amount under its revolving credit facility of 1.7 million euros (approximately $1.9 million) with an interest rate of 0.9%.
We have partial ownership in a South Korean company, Cinos Korea, Ltd (“Cinos”), which Cinos has Credit Agreements with various banks that provide Revolving Credit Facilities for a total available commitment of 1.9 billion Korean Won (approximately $1.7 million) with annual renewals beginning in April 2020 through October 2020 and interest rates ranging from 1.4% - 5.4%. During the fiscal year ended December 27, 2019, borrowings under these Revolving Facilities were insignificant and no amounts were outstanding as of December 27, 2019.
As of December 27, 2019, our total bank debt was $292.2 million, net of unamortized debt issuance costs of $9.7 million. As of December 27, 2019, we had $65.0 million and 6.5 million euros (approximately $7.3 million) available to draw from our revolving credit facilities in the U.S. and Czech Republic, respectively.
The fair value of our long term debt was based on Level 2 inputs, and fair value was determined using quoted prices for similar liabilities in inactive markets. The carrying value of our long term debt approximates fair value.
Capital Expenditures
Capital expenditures were $25.7 million for the year ended December 27, 2019, primarily attributable to the expansion of our South Korea, Singapore, Czech Republic and certain U.S. facilities.
Off-Balance Sheet Arrangements
During the periods presented, we do not have unconsolidated entities or financial partnerships, such as entities often referred to as structured finance or special purpose entities, which would have been established for the purpose of facilitating off-balance sheet arrangements or other contractually narrow or limited purposes.
In conjunction with the sale of our products in the ordinary course of business, we provide standard indemnification against certain liabilities, which may include claims of losses by their own customers resulting out of property damages, bodily injuries or deaths, or infringement of intellectual property rights by our products. Our potential liability arising out of intellectual property infringement claims by any third party is generally uncapped. As of December 27, 2019, we have not incurred any significant costs to defend lawsuits or settle claims related to these indemnification arrangements. As a result, we believe the estimated fair value of these arrangements is minimal.
44
Other than operating leases for certain equipment and real estate and purchase order commitments primarily for inventory, we have no off-balance sheet transactions or similar instruments and, other than the arrangements described under “Borrowing Arrangements” above and our stock purchase obligation resulted from the acquisition of QGT, are not a guarantor of any other entities’ debt or other financial obligations. The following table summarizes our future minimum lease payments, principal payments under debt obligations and our purchase obligations for the purchase of inventory as of December 27, 2019:
|
(In millions) |
|
Total |
|
|
Fiscal Year 2020 |
|
|
Fiscal Years 2021 - 2022 |
|
|
Fiscal Years 2023 - 2024 |
|
|
Beyond |
|
||||||||||
|
Operating leases(1) |
|
$ |
|
49.2 |
|
|
$ |
|
15.1 |
|
|
$ |
|
20.7 |
|
|
$ |
|
7.1 |
|
|
$ |
|
6.3 |
|
|
Borrowing Arrangement(2) |
|
|
|
301.9 |
|
|
|
|
10.7 |
|
|
|
|
17.5 |
|
|
|
|
17.5 |
|
|
|
|
256.2 |
|
|
Stock purchase obligation(3) |
|
|
|
6.8 |
|
|
|
— |
|
|
|
|
6.8 |
|
|
|
— |
|
|
|
— |
|
|||
|
Purchase order commitments(4) |
|
|
|
139.9 |
|
|
|
|
139.9 |
|
|
|
— |
|
|
|
— |
|
|
|
— |
|
|||
|
Total |
|
$ |
|
497.8 |
|
|
$ |
|
165.7 |
|
|
$ |
|
45.0 |
|
|
$ |
|
24.6 |
|
|
$ |
|
262.5 |
|
|
(1) |
The Company leases facilities in the U.S.A. as well as internationally under non-cancellable leases that expire on various date through 2031. |
|
(2) |
Amounts reflect obligations under our Term loan amounting to $300.0 gross of $9.7 million of unamortized debt issuance costs and $1.9 million held by FDS, in the Czech Republic. |
|
(3) |
The Company is obligated to purchase the common stock owned by one of Cinos’ shareholders. See Note 10 of Notes to the Consolidated Financial Statements. |
|
(4) |
Represents our outstanding purchase orders primarily for inventory. |
Recently Issued and Adopted Accounting Pronouncement
For a description of recent accounting pronouncements, including the expected dates of adoption and estimated effects, if any, on UCT’s consolidated financial statements, see Note 1, “Organization and Significant Accounting Policies,” of the Notes to Consolidated Financial Statements.
We are exposed to financial market risks, including credit risk, foreign currency exchange rate risk and interest rate risk.
Credit Risk
A substantial majority of our trade receivables are derived from sales to OEMs. We believe the net accounts receivable balances from our three largest customers (66.7% as of December 27, 2019) do not represent a significant credit risk, based on cash flow forecasts, balance sheet analysis, and past collection experience. For more information about the customers that represent our accounts receivable balance, see Note 1, Organization and Significant Accounting Policies.
We have adopted credit policies and standards intended to accommodate industry growth and inherent risk. We believe credit risks are moderated by the financial stability of our major customers. We assess credit risk through quantitative and qualitative analysis. From these analysis, we establish shipping and credit limits and determine whether we will seek to use one or more credit support protection devices, such as obtaining a parent guarantee, prepayment or standby letter of credit.
45
Foreign Currency Exchange Rate Risk
We operate in international markets, which expose us to market risk associated with foreign currency exchange rate fluctuations between the U.S. Dollar and various foreign currencies. Historically, the majority of our revenue contracts and arrangements with third party suppliers are denominated in U.S. Dollars. Additionally, a portion of our expenses, primarily the cost to manufacture, cost of personnel to deliver technical support on our products and professional services, sales and sales support and research and development, are denominated in foreign currencies. Revenue resulting from selling in currencies and costs incurred in local currencies are exposed to foreign currency exchange rate fluctuations which can affect our operating income. As foreign currency exchange rates vary, operating income may differ from expectations. Increases in the value of the U.S. dollar relative to other currencies would make our products more expensive relative to competing products priced in such other currencies, which could negatively impact our ability to compete. Conversely, decreases in the value of the U.S. dollar relative to other currencies could result in our foreign suppliers raising their prices in order to continue doing business with us. However, we do not expect foreign currency exchange rate fluctuations to have a material effect on our results of operations.
FDS uses derivative instruments, such as foreign currency exchange contracts, to hedge certain exposures to fluctuations in foreign currency exchange rates. These contracts reduce, but do not entirely eliminate the impact of currency exchange rates movement on FDS’ assets and liabilities.
Interest Rate Risk
We are exposed to market risk due to the possibility of changing interest rates under our credit facilities. Our Credit Facility is comprised of a Term B loan and a revolving credit agreement with interest rates as described under Note 8 of Notes to the Consolidated Financial Statements.
At the end of fiscal 2019, we had outstanding the Term B loan of $300.0 million. A hypothetical 10% increase in our borrowing rates at the end of fiscal 2019 could result in approximately $1.9 million annual increase in interest expense on these existing principal balances.
46
INDEX TO CONSOLIDATED FINANCIAL STATEMENTS
|
48 |
|
|
Consolidated Balance Sheets as of December 27, 2019 and December 28, 2018 |
50 |
|
51 |
|
|
52 |
|
|
53 |
|
|
54 |
|
|
55 |
47
REPORT OF INDEPENDENT REGISTERED PUBLIC ACCOUNTING FIRM
To the Stockholders and the Board of Directors of
Ultra Clean Holdings, Inc.
Opinions on the Financial Statements and Internal Control over Financial Reporting
We have audited the accompanying consolidated balance sheets of Ultra Clean Holdings, Inc. (the “Company”) as of December 27, 2019 and December 28, 2018, the related consolidated statements of operations, comprehensive income (loss), stockholders’ equity and cash flows for each of the years ended December 27, 2019, December 28, 2018 and December 29, 2017, and the related notes (collectively referred to as the “consolidated financial statements”). We also have audited the Company’s internal control over financial reporting as of December 27, 2019, based on criteria established in Internal Control - Integrated Framework (2013) issued by the Committee of Sponsoring Organizations of the Treadway Commission (COSO).
In our opinion, the consolidated financial statements referred to above present fairly, in all material respects, the consolidated financial position of the Company as of December 27, 2019 and December 28, 2018, and the consolidated results of its operations and its cash flows for each of the years ended December 27, 2019, December 28, 2018 and December 29, 2017, in conformity with accounting principles generally accepted in the United States of America. Also in our opinion, because of the effect of the material weaknesses identified below on the achievement of the objectives of the control criteria, the Company has not maintained effective internal control over financial reporting as of December 27, 2019, based on criteria established in Internal Control - Integrated Framework (2013) issued by COSO.
Change in Accounting Principle
As discussed in Note 1 to the consolidated financial statements, the Company changed the manner in which it accounts for leases in 2019.
Basis for Opinions
The Company’s management is responsible for these consolidated financial statements, for maintaining effective internal control over financial reporting, and for its assessment of the effectiveness of internal control over financial reporting, included in the accompanying Management’s Report on Internal Control over Financial Reporting appearing under Item 9A. Our responsibility is to express an opinion on the Company’s consolidated financial statements and an opinion on the Company’s internal control over financial reporting based on our audits. We are a public accounting firm registered with the Public Company Accounting Oversight Board (United States) (“PCAOB”) and are required to be independent with respect to the Company in accordance with the U.S. federal securities laws and the applicable rules and regulations of the Securities and Exchange Commission and the PCAOB.
We conducted our audits in accordance with the standards of the PCAOB. Those standards require that we plan and perform the audits to obtain reasonable assurance about whether the consolidated financial statements are free of material misstatement, whether due to error or fraud, and whether effective internal control over financial reporting was maintained in all material respects.
Our audits of the consolidated financial statements included performing procedures to assess the risks of material misstatement of the consolidated financial statements, whether due to error or fraud, and performing procedures to respond to those risks. Such procedures included examining, on a test basis, evidence regarding the amounts and disclosures in the consolidated financial statements. Our audits also included evaluating the accounting principles used and significant estimates made by management, as well as evaluating the overall presentation of the consolidated financial statements. Our audit of internal control over financial reporting included obtaining an understanding of internal control over financial reporting, assessing the risk that a material weakness exists, and testing and evaluating the design and operating effectiveness of internal control based on the assessed risk. Our audits also included performing such other procedures as we considered necessary in the circumstances. We believe that our audits provide a reasonable basis for our opinions.
48
As discussed in Management’s Report on Internal Control over Financial Reporting, on April 15, 2019, the Company acquired Dynamic Manufacturing Solutions, LLC (DMS). For the purposes of assessing internal control over financial reporting, management excluded DMS, whose financial statements constitute 3.0% of the Company’s consolidated total assets (excluding $18.5 million of goodwill and intangible assets, which were integrated into the Company’s control environment), and 3.3% of consolidated revenues as of and for the year ended December 27, 2019. Accordingly, our audit did not include the internal control over financial reporting of DMS.
A material weakness is a deficiency, or a combination of deficiencies, in internal control over financial reporting, such that there is a reasonable possibility that a material misstatement of the Company’s annual or interim financial statements will not be prevented or detected on a timely basis. The following material weaknesses have been identified and included in management’s assessment in Item 9A:
The Company did not design and maintain effective controls within its Semiconductor Services Business segment due to deficiencies in the design and implementation of business process controls and information technology general controls relating to all relevant accounts and cycles of this segment as of December 27, 2019.
We considered the material weaknesses in determining the nature, timing, and extent of audit tests applied in our audit of the Company’s consolidated financial statements as of and for the year ended December 27, 2019, and our opinion on such consolidated financial statements was not affected.
Definition and Limitations of Internal Control Over Financial Reporting
A company’s internal control over financial reporting is a process designed to provide reasonable assurance regarding the reliability of financial reporting and the preparation of financial statements for external purposes in accordance with generally accepted accounting principles. A company’s internal control over financial reporting includes those policies and procedures that (1) pertain to the maintenance of records that, in reasonable detail, accurately and fairly reflect the transactions and dispositions of the assets of the company; (2) provide reasonable assurance that transactions are recorded as necessary to permit preparation of financial statements in accordance with generally accepted accounting principles, and that receipts and expenditures of the company are being made only in accordance with authorizations of management and directors of the company; and (3) provide reasonable assurance regarding prevention or timely detection of unauthorized acquisition, use, or disposition of the company’s assets that could have a material effect on the consolidated financial statements.
Because of its inherent limitations, internal control over financial reporting may not prevent or detect misstatements. Also, projections of any evaluation of effectiveness to future periods are subject to the risk that controls may become inadequate because of changes in conditions, or that the degree of compliance with the policies or procedures may deteriorate.
/s/ Moss Adams LLP
San Francisco, California
March 11, 2020
We have served as the Company’s auditor since 2015.
49
|
|
|
December 27, |
|
|
December 28, |
|
||
|
|
|
2019 |
|
|
2018 |
|
||
|
(In millions, except par value) |
|
|||||||
|
ASSETS |
|
|
|
|
|
|
|
|
|
Current assets: |
|
|
|
|
|
|
|
|
|
Cash and cash equivalents |
|
$ |
162.5 |
|
|
$ |
144.1 |
|
|
Accounts receivable, net of allowance for doubtful accounts of $0.3 at December 27, 2019 and $0.1 at December 28, 2018 |
|
|
112.7 |
|
|
|
107.0 |
|
|
Inventories |
|
|
172.4 |
|
|
|
186.1 |
|
|
Prepaid expenses and other current assets |
|
|
19.4 |
|
|
|
25.7 |
|
|
Total current assets |
|
|
467.0 |
|
|
|
462.9 |
|
|
Property, plant and equipment, net |
|
|
145.3 |
|
|
|
143.5 |
|
|
Goodwill |
|
|
171.1 |
|
|
|
150.2 |
|
|
Intangibles assets, net |
|
|
180.3 |
|
|
|
193.5 |
|
|
Deferred tax assets, net |
|
|
15.5 |
|
|
|
10.2 |
|
|
Operating lease right-of-use assets |
|
|
34.9 |
|
|
— |
|
|
|
Other non-current assets |
|
|
5.2 |
|
|
|
5.2 |
|
|
Total assets |
|
$ |
1,019.3 |
|
|
$ |
965.5 |
|
|
LIABILITIES AND STOCKHOLDERS’ EQUITY |
|
|
|
|
|
|
|
|
|
Current liabilities: |
|
|
|
|
|
|
|
|
|
Bank borrowings |
|
$ |
8.8 |
|
|
$ |
9.7 |
|
|
Accounts payable |
|
|
133.1 |
|
|
|
99.0 |
|
|
Accrued compensation and related benefits |
|
|
24.8 |
|
|
|
15.8 |
|
|
Operating lease liabilities |
|
|
13.2 |
|
|
— |
|
|
|
Other current liabilities |
|
|
30.7 |
|
|
|
14.8 |
|
|
Total current liabilities |
|
|
210.6 |
|
|
|
139.3 |
|
|
Bank borrowings, net of current portion |
|
|
283.4 |
|
|
|
331.6 |
|
|
Deferred tax liabilities |
|
|
25.2 |
|
|
|
15.8 |
|
|
Operating lease liabilities |
|
|
28.8 |
|
|
— |
|
|
|
Other liabilities |
|
|
18.8 |
|
|
|
27.8 |
|
|
Total liabilities |
|
|
566.8 |
|
|
|
514.5 |
|
|
Commitments and contingencies (See Note 9) |
|
|
|
|
|
|
|
|
|
Equity: |
|
|
|
|
|
|
|
|
|
UCT stockholders’ equity: |
|
|
|
|
|
|
|
|
|
Preferred stock — $0.001 par value, 10.0 authorized; none outstanding |
|
— |
|
|
— |
|
||
|
Common stock — $0.001 par value, 90.0 authorized; 39.9 and 39.1 shares issued and outstanding at December 27, 2019 and December 28, 2018, respectively |
|
|
0.1 |
|
|
|
0.1 |
|
|
Additional paid-in capital |
|
|
300.9 |
|
|
|
290.4 |
|
|
Common shares held in treasury, at cost, 0.6 shares at December 27, 2019 and December 28, 2018 |
|
|
(3.3 |
) |
|
|
(3.3 |
) |
|
Retained earnings |
|
|
140.3 |
|
|
|
149.7 |
|
|
Accumulated other comprehensive loss |
|
|
(1.3 |
) |
|
|
(0.6 |
) |
|
Total UCT stockholders' equity |
|
|
436.7 |
|
|
|
436.3 |
|
|
Noncontrolling interests |
|
|
15.8 |
|
|
|
14.7 |
|
|
Total equity |
|
|
452.5 |
|
|
|
451.0 |
|
|
Total liabilities and equity |
|
$ |
1,019.3 |
|
|
$ |
965.5 |
|
(See accompanying notes to consolidated financial statements)
50
Consolidated Statements of Operations
|
|
|
Fiscal Year Ended |
|
|||||||||
|
|
|
December 27, |
|
|
December 28, |
|
|
December 29, |
|
|||
|
|
|
2019 |
|
|
2018 |
|
|
2017 |
|
|||
|
(In millions, except per share amounts) |
|
|||||||||||
|
Revenues: |
|
|
|
|
|
|
|
|
|
|
|
|
|
Product |
|
$ |
840.8 |
|
|
$ |
1,015.5 |
|
|
$ |
924.4 |
|
|
Services |
|
|
225.4 |
|
|
|
81.0 |
|
|
|
- |
|
|
Total revenues |
|
|
1,066.2 |
|
|
|
1,096.5 |
|
|
|
924.4 |
|
|
Cost of revenues: |
|
|
|
|
|
|
|
|
|
|
|
|
|
Product |
|
|
719.0 |
|
|
865.2 |
|
|
756.7 |
|
||
|
Services |
|
150.4 |
|
|
55.5 |
|
|
|
- |
|
||
|
Total cost revenues |
|
869.4 |
|
|
920.7 |
|
|
756.7 |
|
|||
|
Gross margin |
|
|
196.8 |
|
|
|
175.8 |
|
|
|
167.7 |
|
|
Operating expenses: |
|
|
|
|
|
|
|
|
|
|
|
|
|
Research and development |
|
14.6 |
|
|
13.3 |
|
|
11.7 |
|
|||
|
Sales and marketing |
|
22.4 |
|
|
16.3 |
|
|
13.7 |
|
|||
|
General and administrative |
|
|
129.9 |
|
|
85.5 |
|
|
52.8 |
|
||
|
Total operating expenses |
|
|
166.9 |
|
|
115.1 |
|
|
78.2 |
|
||
|
Income from operations |
|
|
29.9 |
|
|
60.7 |
|
|
89.5 |
|
||
|
Interest income |
|
|
0.4 |
|
|
|
0.3 |
|
|
|
0.1 |
|
|
Interest expense |
|
|
(25.6 |
) |
|
|
(10.0 |
) |
|
|
(2.2 |
) |
|
Other income (expense), net |
|
|
(2.4 |
) |
|
|
1.3 |
|
|
|
(0.4 |
) |
|
Income before provision for income taxes |
|
|
2.3 |
|
|
|
52.3 |
|
|
|
87.0 |
|
|
Provision for income taxes |
|
|
10.0 |
|
|
15.3 |
|
|
11.9 |
|
||
|
Net income (loss) |
|
|
(7.7 |
) |
|
|
37.0 |
|
|
75.1 |
|
|
|
Less: Net income attributable to noncontrolling interests |
|
|
1.7 |
|
|
|
0.4 |
|
|
|
- |
|
|
Net income (loss) attributable to UCT |
|
$ |
(9.4 |
) |
|
$ |
36.6 |
|
|
$ |
75.1 |
|
|
|
|
|
|
|
|
|
|
|
|
|
|
|
|
Net income (loss) per share attributable to UCT common stockholders: |
|
|||||||||||
|
Basic |
|
$ |
(0.24 |
) |
|
$ |
0.95 |
|
|
$ |
2.25 |
|
|
Diluted |
|
$ |
(0.24 |
) |
|
$ |
0.94 |
|
|
$ |
2.19 |
|
|
Shares used in computing net income (loss) per share: |
|
|
|
|
|
|
|
|
|
|
|
|
|
Basic |
|
|
39.5 |
|
|
|
38.4 |
|
|
|
33.4 |
|
|
Diluted |
|
|
39.5 |
|
|
|
38.9 |
|
|
|
34.3 |
|
(See accompanying notes to consolidated financial statements)
51
Consolidated Statements of Comprehensive Income (Loss)
|
|
|
Fiscal Year Ended |
|
|||||||||
|
|
|
December 27, |
|
|
December 28, |
|
|
December 29, |
|
|||
|
|
|
2019 |
|
|
2018 |
|
|
2017 |
|
|||
|
(In millions) |
|
|||||||||||
|
Net income (loss) |
|
$ |
(7.7 |
) |
|
$ |
37.0 |
|
|
$ |
75.1 |
|
|
Other comprehensive income (loss): |
|
|
|
|
|
|
|
|
|
|
|
|
|
Change in cumulative translation adjustment |
|
|
(0.4 |
) |
|
|
(1.3 |
) |
|
|
1.2 |
|
|
Change in pension net actuarial loss |
|
|
(0.3 |
) |
|
— |
|
|
— |
|
||
|
Cash flow hedges: |
|
|
|
|
|
|
|
|
|
|
|
|
|
Change in fair value of derivatives |
|
|
- |
|
|
|
(0.1 |
) |
|
|
1.2 |
|
|
Adjustment for net loss realized and included in net income |
|
|
- |
|
|
|
(1.0 |
) |
|
|
(0.2 |
) |
|
Total change in unrealized gain (loss) on derivative instruments |
|
|
- |
|
|
|
(1.1 |
) |
|
|
1.0 |
|
|
Total other comprehensive income (loss), net of tax |
|
|
(0.7 |
) |
|
|
(2.4 |
) |
|
|
2.2 |
|
|
Other comprehensive income (loss), net of tax, attributable to noncontrolling interests |
|
|
1.7 |
|
|
|
0.4 |
|
|
|
- |
|
|
Comprehensive income (loss) attributable to UCT |
|
$ |
(10.1 |
) |
|
|
34.2 |
|
|
|
77.3 |
|
(See accompanying notes to consolidated financial statements)
52
Consolidated Statements of Cash Flows
|
|
|
Fiscal Year Ended |
|
|||||||||
|
|
|
December 27, |
|
|
December 28, |
|
|
December 29, |
|
|||
|
|
|
2019 |
|
|
2018 |
|
|
2017 |
|
|||
|
(In millions) |
|
|||||||||||
|
Cash flows from operating activities: |
|
|
|
|
|
|
|
|
|
|
|
|
|
Net income (loss) |
|
$ |
(7.7 |
) |
|
$ |
37.0 |
|
|
$ |
75.1 |
|
|
Adjustments to reconcile net income (loss) to net cash provided by operating activities (excluding assets acquired, liabilities assumed and noncontrolling interests at acquisition): |
|
|
|
|
|
|
|
|
|
|
|
|
|
Depreciation and amortization |
|
|
21.5 |
|
|
|
11.5 |
|
|
|
5.3 |
|
|
Amortization of intangible assets |
|
|
20.1 |
|
|
|
9.6 |
|
|
|
5.4 |
|
|
Stock-based compensation |
|
|
12.1 |
|
|
|
10.3 |
|
|
|
7.8 |
|
|
Amortization of debt issuance costs |
|
|
1.8 |
|
|
|
0.8 |
|
|
|
0.2 |
|
|
Loss on the disposal of assets and business |
|
|
2.0 |
|
|
|
1.0 |
|
|
|
- |
|
|
Deferred income taxes |
|
|
(3.6 |
) |
|
|
(0.1 |
) |
|
|
(3.8 |
) |
|
Change in the fair value of financial instruments |
|
|
2.8 |
|
|
|
(0.3 |
) |
|
|
(0.3 |
) |
|
Changes in assets and liabilities, net of effects of acquisitions: |
|
|
|
|
|
|
|
|
|
|
|
|
|
Accounts receivable |
|
|
(4.5 |
) |
|
|
7.2 |
|
|
|
(14.9 |
) |
|
Inventories |
|
|
22.3 |
|
|
|
50.2 |
|
|
|
(131.9 |
) |
|
Prepaid expenses and other current assets |
|
|
3.7 |
|
|
|
2.6 |
|
|
|
(4.9 |
) |
|
Other non-current assets |
|
|
- |
|
|
|
(0.4 |
) |
|
|
(0.6 |
) |
|
Accounts payable |
|
|
31.0 |
|
|
|
(83.2 |
) |
|
|
99.6 |
|
|
Accrued compensation and related benefits |
|
|
9.0 |
|
|
|
(2.8 |
) |
|
|
2.8 |
|
|
Income taxes payable |
|
|
(2.9 |
) |
|
|
0.8 |
|
|
|
8.2 |
|
|
Operating lease assets and liabilities |
|
|
7.1 |
|
|
|
— |
|
|
|
— |
|
|
Other liabilities |
|
|
6.3 |
|
|
|
(2.5 |
) |
|
|
0.9 |
|
|
Net cash provided by operating activities |
|
|
121.0 |
|
|
|
41.7 |
|
|
|
48.9 |
|
|
Cash flows from investing activities: |
|
|
|
|
|
|
|
|
|
|
|
|
|
Purchases of property, plant and equipment |
|
|
(26.3 |
) |
|
|
(26.1 |
) |
|
|
(16.1 |
) |
|
Proceeds from sale of equipment, including insurance proceeds |
|
|
7.0 |
|
|
|
— |
|
|
|
— |
|
|
Acquisition of businesses, net of cash acquired |
|
|
(29.9 |
) |
|
|
(319.8 |
) |
|
|
— |
|
|
Net cash used in investing activities |
|
|
(49.2 |
) |
|
|
(345.9 |
) |
|
|
(16.1 |
) |
|
Cash flows from financing activities: |
|
|
|
|
|
|
|
|
|
|
|
|
|
Proceeds from bank borrowings |
|
|
41.8 |
|
|
|
387.1 |
|
|
|
15.0 |
|
|
Proceeds from issuance of common stock |
|
|
0.3 |
|
|
|
94.6 |
|
|
|
1.8 |
|
|
Principal payments on bank borrowings and finance leases |
|
|
(93.0 |
) |
|
|
(86.4 |
) |
|
|
(31.2 |
) |
|
Payments of debt issuance costs |
|
|
— |
|
|
|
(12.1 |
) |
|
|
— |
|
|
Payments of dividends to a joint venture shareholder |
|
|
(0.6 |
) |
|
|
— |
|
|
|
— |
|
|
Employees’ taxes paid upon vesting of restricted stock units |
|
|
(1.9 |
) |
|
|
(3.1 |
) |
|
|
(2.7 |
) |
|
Net cash provided by (used in) financing activities |
|
|
(53.4 |
) |
|
|
380.1 |
|
|
|
(17.1 |
) |
|
Effect of exchange rate changes on cash and cash equivalents |
|
|
- |
|
|
|
(0.1 |
) |
|
|
0.1 |
|
|
Net increase in cash and cash equivalents |
|
|
18.4 |
|
|
|
75.8 |
|
|
|
15.8 |
|
|
Cash and cash equivalents at beginning of period |
|
|
144.1 |
|
|
|
68.3 |
|
|
|
52.5 |
|
|
Cash and cash equivalents at end of period |
|
|
162.5 |
|
|
$ |
144.1 |
|
|
$ |
68.3 |
|
|
Supplemental cash flow information: |
|
|
|
|
|
|
|
|
|
|
|
|
|
Income taxes paid, net of income tax refunds |
|
$ |
14.5 |
|
|
$ |
14.5 |
|
|
$ |
7.5 |
|
|
Interest paid |
|
$ |
23.6 |
|
|
$ |
7.1 |
|
|
$ |
2.2 |
|
|
Non-cash investing and financing activities: |
|
|
|
|
|
|
|
|
|
|
|
|
|
Property, plant and equipment purchased included in accounts payable and other liabilities |
|
$ |
5.0 |
|
|
$ |
5.6 |
|
|
$ |
2.6 |
|
|
Impairment loss due to a facility fire covered by insurance |
|
$ |
— |
|
|
$ |
6.0 |
|
|
$ |
— |
|
|
Note receivable received in exchange for sale of UAMC |
|
$ |
— |
|
|
$ |
0.3 |
|
|
$ |
— |
|
|
Fair value of earn-out payment related to business acquisitions |
|
$ |
1.4 |
|
|
$ |
4.2 |
|
|
$ |
— |
|
(See accompanying notes to consolidated financial statements)
53
Consolidated Statements of Stockholders’ Equity
|
|
|
Common Stock |
|
|
|
|
|
|
Treasury shares |
|
|
|
|
|
|
|
|
|
|
|
|
|
|
|
|
|
|
|
|
|
||||||||||
|
|
|
Shares |
|
|
Amount |
|
|
Additional Paid-in Capital |
|
|
Shares |
|
|
Amount |
|
|
Retained Earnings |
|
|
Accumulated Other Comprehensive Income (Loss) |
|
|
Total Stockholders’ Equity of UCT |
|
|
Noncontrolling Interests |
|
|
Total Equity |
|
||||||||||
|
(In millions) |
|
|
|
|
|
|
|
|
|
|
|
|
|
|
|
|
|
|
|
|
|
|
|
|
|
|
|
|
|
|
|
|
|
|
|
|
|
|
|
|
|
Balance December 30, 2016 |
|
|
33.0 |
|
|
$ |
0.1 |
|
|
$ |
181.7 |
|
|
|
0.6 |
|
|
$ |
(3.3 |
) |
|
$ |
38.0 |
|
|
$ |
(0.4 |
) |
|
$ |
216.1 |
|
|
$ |
— |
|
|
$ |
216.1 |
|
|
Issuance of restricted common stock |
|
0.1 |
|
|
— |
|
|
— |
|
|
— |
|
|
— |
|
|
— |
|
|
— |
|
|
— |
|
|
— |
|
|
— |
|
||||||||||
|
Issuance under employee stock plans |
|
|
0.8 |
|
|
— |
|
|
|
1.8 |
|
|
— |
|
|
— |
|
|
— |
|
|
— |
|
|
|
1.8 |
|
|
— |
|
|
|
1.8 |
|
||||||
|
Stock-based compensation expense |
|
— |
|
|
— |
|
|
|
7.8 |
|
|
— |
|
|
— |
|
|
— |
|
|
— |
|
|
|
7.8 |
|
|
— |
|
|
|
7.8 |
|
|||||||
|
Employees’ taxes paid upon vesting of restricted stock units |
|
|
(0.2 |
) |
|
— |
|
|
|
(2.7 |
) |
|
— |
|
|
— |
|
|
— |
|
|
— |
|
|
|
(2.7 |
) |
|
— |
|
|
|
(2.7 |
) |
||||||
|
Net income |
|
— |
|
|
— |
|
|
— |
|
|
— |
|
|
— |
|
|
|
75.1 |
|
|
— |
|
|
|
75.1 |
|
|
— |
|
|
|
75.1 |
|
|||||||
|
Other comprehensive income |
|
— |
|
|
— |
|
|
— |
|
|
— |
|
|
— |
|
|
— |
|
|
|
2.2 |
|
|
|
2.2 |
|
|
— |
|
|
|
2.2 |
|
|||||||
|
Balance December 29, 2017 |
|
|
33.7 |
|
|
$ |
0.1 |
|
|
$ |
188.6 |
|
|
|
0.6 |
|
|
$ |
(3.3 |
) |
|
$ |
113.1 |
|
|
$ |
1.8 |
|
|
$ |
300.3 |
|
|
$ |
— |
|
|
$ |
300.3 |
|
|
Issuance under employee stock plans |
|
|
0.8 |
|
|
— |
|
|
|
0.3 |
|
|
— |
|
|
— |
|
|
— |
|
|
— |
|
|
|
0.3 |
|
|
— |
|
|
|
0.3 |
|
||||||
|
Stock-based compensation expense |
|
— |
|
|
— |
|
|
|
10.3 |
|
|
— |
|
|
— |
|
|
— |
|
|
— |
|
|
|
10.3 |
|
|
— |
|
|
|
10.3 |
|
|||||||
|
Employees’ taxes paid upon vesting of restricted stock units |
|
|
(0.2 |
) |
|
— |
|
|
|
(3.1 |
) |
|
— |
|
|
— |
|
|
— |
|
|
— |
|
|
|
(3.1 |
) |
|
— |
|
|
|
(3.1 |
) |
||||||
|
Issuance of common stock in public offering |
|
|
4.8 |
|
|
— |
|
|
|
94.3 |
|
|
— |
|
|
— |
|
|
— |
|
|
— |
|
|
|
94.3 |
|
|
— |
|
|
|
94.3 |
|
||||||
|
Noncontrolling interests from acquisition of QGT |
|
— |
|
|
— |
|
|
— |
|
|
— |
|
|
— |
|
|
— |
|
|
— |
|
|
— |
|
|
|
14.3 |
|
|
|
14.3 |
|
||||||||
|
Net income |
|
— |
|
|
— |
|
|
— |
|
|
— |
|
|
— |
|
|
|
36.6 |
|
|
— |
|
|
|
36.6 |
|
|
|
0.4 |
|
|
|
37.0 |
|
||||||
|
Other comprehensive loss |
|
— |
|
|
— |
|
|
— |
|
|
— |
|
|
— |
|
|
— |
|
|
|
(2.4 |
) |
|
|
(2.4 |
) |
|
— |
|
|
|
(2.4 |
) |
|||||||
|
Balance December 28, 2018 |
|
|
39.1 |
|
|
$ |
0.1 |
|
|
$ |
290.4 |
|
|
|
0.6 |
|
|
$ |
(3.3 |
) |
|
$ |
149.7 |
|
|
$ |
(0.6 |
) |
|
$ |
436.3 |
|
|
$ |
14.7 |
|
|
$ |
451.0 |
|
|
Issuance under employee stock plans |
|
|
0.9 |
|
|
— |
|
|
|
0.3 |
|
|
— |
|
|
— |
|
|
— |
|
|
— |
|
|
|
0.3 |
|
|
— |
|
|
|
0.3 |
|
||||||
|
Stock-based compensation expense |
|
— |
|
|
— |
|
|
|
12.1 |
|
|
— |
|
|
— |
|
|
— |
|
|
— |
|
|
|
12.1 |
|
|
— |
|
|
|
12.1 |
|
|||||||
|
Employees’ taxes paid upon vesting of restricted stock units |
|
|
(0.1 |
) |
|
— |
|
|
|
(1.9 |
) |
|
— |
|
|
— |
|
|
— |
|
|
— |
|
|
|
(1.9 |
) |
|
— |
|
|
|
(1.9 |
) |
||||||
|
Net income (loss) |
|
— |
|
|
— |
|
|
— |
|
|
— |
|
|
— |
|
|
|
(9.4 |
) |
|
— |
|
|
|
(9.4 |
) |
|
|
1.7 |
|
|
|
(7.7 |
) |
||||||
|
Dividend payments to a joint venture shareholder |
|
— |
|
|
— |
|
|
— |
|
|
— |
|
|
— |
|
|
— |
|
|
— |
|
|
— |
|
|
|
(0.6 |
) |
|
|
(0.6 |
) |
||||||||
|
Other comprehensive loss |
|
— |
|
|
— |
|
|
— |
|
|
— |
|
|
— |
|
|
— |
|
|
|
(0.7 |
) |
|
|
(0.7 |
) |
|
— |
|
|
|
(0.7 |
) |
|||||||
|
Balance December 27, 2019 |
|
|
39.9 |
|
|
$ |
0.1 |
|
|
$ |
300.9 |
|
|
|
0.6 |
|
|
$ |
(3.3 |
) |
|
$ |
140.3 |
|
|
$ |
(1.3 |
) |
|
$ |
436.7 |
|
|
$ |
15.8 |
|
|
$ |
452.5 |
|
(See accompanying notes to consolidated financial statements)
54
Notes to Consolidated Financial Statements
1. ORGANIZATION AND SIGNIFICANT ACCOUNTING POLICIES
Organization
Ultra Clean Holdings, Inc., (the “Company” or “UCT”) a Delaware corporation, was founded in November 2002 and became a publicly traded company on the NASDAQ Global Market in March 2004. The Company is a global leader in the design, engineering, and manufacture of production tools, modules and subsystems for the semiconductor capital equipment industry and industry segments with similar requirements including display, consumer and medical. The Company focuses on providing specialized engineering and manufacturing solutions for these applications.
Historically, the Company has operated under one operating segment. However, as a result of the acquisition of QGT, the Company created an additional segment in the first quarter of 2019. The Company elected to reorganize its organizational and reporting structure to capture efficiencies and operating leverage from its recent acquisition of QGT. The Company now reports results for two segments: Semiconductor Products and Solutions (“Products” or “SPS”) and Semiconductor Services Business (“Services” or “SSB”).
Through the Company’s acquisition of Quantum Global Technologies, LLC (“QGT”) in August 2018, the Company is also a provider of ultra-high purity outsourced parts cleaning, process tool part recoating, surface treatment and analytical services to the semiconductor and related industries.
On April 15, 2019, the Company purchased substantially all of the assets of Dynamic Manufacturing Solutions, LLC ("DMS"), a semiconductor weldment and solutions provider. DMS reports into the SPS segment. See Note 2 to the Company’s Consolidated Financial Statements for further information about the acquisitions of QGT and DMS.
Fiscal Year
The Company uses a 52-53 week fiscal year ending on the Friday nearest December 31. All references to quarters refer to fiscal quarters and all references to years refer to fiscal years.
Principles of Consolidation
The Company’s consolidated financial statements include the accounts of the Company and its wholly-owned subsidiaries and all intercompany accounts and transactions have been eliminated in consolidation.
Noncontrolling interests
Noncontrolling interests are recognized to reflect the portion of the equity of the majority-owned subsidiaries which is not attributable, directly or indirectly, to the controlling stockholder. Through the acquisition of QGT in August 2018, the Company’s consolidated entities include partially-owned entities. These partially-owned entities are (1) Cinos Co., Ltd (“Cinos Korea”), a South Korean company that provides outsourced cleaning and recycling of precision parts for the semiconductor industry through its operating facilities in South Korea, 86.0% of whose equity interests the Company is obligated to purchase and whose results the Company consolidates and (2) Cinos Xian Clean Technology, Ltd. (“Cinos China”), a Chinese entity that is 60.0% owned by Cinos. The interest held by others in Cinos Korea and in Cinos China are presented as noncontrolling interests in the accompanying Consolidated Financial Statements. The noncontrolling interests will continue to be attributed its share of gains and losses even if that attribution results in a deficit noncontrolling interests balance.
55
The Financial Accounting Standards Board’s (FASB) guidance regarding disclosure about segments in an enterprise and related information establishes standards for the reporting by public business enterprises of information about reportable segments, products and services, geographic areas, and major customers. The method for determining what information to report is based on the manner in which management organizes the reportable segments within the Company for making operational decisions and assessments of financial performance. The Company’s chief operating decision-maker is the Chief Executive Officer. In March 2019, the Company effected a change in the reporting of its segment financial results to better reflect the reorganization within the Company due to the acquisition of QGT. The Company now operates and reports two segments. See Note 15 to the Company’s Consolidated Financial Statements.
Foreign Currency Translation and Remeasurement
The functional currency of UCT Fluid Delivery Solutions s.r.o. (“FDS") is the Euro. The Company remeasures the monetary assets and liabilities of FDS from its local currency to its functional currency. Gains and losses from these remeasurements are recorded in other income (expense), net. The Company then translates the assets and liabilities of FDS into the U.S. dollar. Gains and losses from these translations are recognized in foreign currency translation included in accumulated other comprehensive income (AOCI) within UCT stockholders’ equity.
The functional currency of the Company’s other international subsidiaries are either the U.S. dollar or their local currency. For the Company’s foreign subsidiaries where the local currency is the functional currency, the Company translates the financial statements of these subsidiaries to U.S. dollars using month-end exchange rates for assets and liabilities, and average rates of exchange for revenue, costs and expenses. Translation gains and losses are recorded in AOCI as a component of stockholders' equity. For the Company’s foreign subsidiaries where the U.S. dollar is the functional currency, any gains and losses resulting from the translation of the assets and liabilities of these subsidiaries are recorded in other income (expense), net.
Use of Estimates
The presentation of financial statements in conformity with U.S. generally accepted accounting principles (“GAAP”) requires management to make estimates and assumptions that affect the reported amounts of assets and liabilities, and disclosures of contingent liabilities at the date of the financial statements and the reported amounts of revenues and expenses during the reporting period. Such estimates and assumptions include revenue recognition, inventory valuation, accounting for income taxes, business combinations, valuation of goodwill, intangible assets and long-lived assets. The Company bases its estimates and judgments on historical experience and on various other assumptions that it believes are reasonable under the circumstances. However, future events are subject to change and the best estimates and judgments routinely require adjustments. Actual amounts may differ from those estimates.
Cash and Cash Equivalents
The Company considers currency on hand, demand deposits, time deposits, and all highly liquid investments with an original maturity of three months or less at the date of purchase to be cash and cash equivalents. Cash and cash equivalents are held in various financial institutions in the United States and internationally.
Concentration of Credit Risk
Financial instruments which subject the Company to concentrations of credit risk consist principally of cash and cash equivalents and accounts receivable. The Company sells its products and provides services primarily to semiconductor capital equipment manufacturers in the United States. The Company performs credit evaluations of its customers’ financial condition and generally requires no collateral.
56
The Company’s most significant customers (having accounted for 10% or more of related) and their related revenues as a percentage of total revenues were as follows:
|
|
|
Fiscal Year Ended |
|
|
|||||||||||
|
|
|
2019 |
|
|
|
2018 |
|
|
|
2017 |
|
|
|||
|
Lam Research Corporation |
|
|
41.7 |
|
% |
|
|
55.1 |
|
% |
|
59.8 |
|
% |
|
|
Applied Materials, Inc. |
|
25.2 |
|
|
|
21.5 |
|
|
|
24.6 |
|
|
|||
|
Total |
|
|
66.9 |
|
% |
|
|
76.6 |
|
% |
|
|
84.4 |
|
% |
Three customers’ accounts receivable balances, Lam Research Corporation, Applied Materials, Inc. and ASM International, Inc., were individually greater than 10.0% of accounts receivable as of December 27, 2019 and December 28, 2018, in the aggregate approximately 66.7% and 62.9% of accounts receivable, respectively.
Fair Value of Measurements
The Company measures its cash equivalents and contingent earn-out liabilities at fair value on a recurring basis. In August 2018, the Company extinguished its debt with East West Bank, and as a result, the interest rate swap contract was consequently cancelled. Fair value is an exit price, representing the amount that would be received to sell an asset or paid to transfer a liability in an orderly transaction between market participants. As such, fair value is a market-based measurement that is determined based on assumptions that market participants would use in pricing an asset or a liability. Assets and liabilities recorded at fair value are measured and classified in accordance with a three-tier fair value hierarchy based on the observability of the inputs available in the market used to measure fair value:
Level 1 — Observable inputs that reflect quoted prices (unadjusted) for identical assets or liabilities in active markets.
Level 2 — Inputs that are based upon quoted prices for similar instruments in active markets, quoted prices for identical or similar instruments in markets that are not active, and model-based valuation techniques for which all significant inputs are observable in the market or can be derived from observable market data. Where applicable, these models project future cash flows and discount the future amounts to a present value using market-based observable inputs including interest rate curves, foreign exchange rates, and credit ratings.
Level 3 — Unobservable inputs that are supported by little or no market activities.
Derivative Financial Instruments
The Company recognizes derivative instruments as either assets or liabilities in the accompanying Consolidated Balance Sheets at fair value. The Company records changes in the fair value of the derivatives in the accompanying Consolidated Statements of Operations as other income (expense), net, or as a component of AOCI in the accompanying Consolidated Balance Sheets.
Inventories
Inventories are stated at the lower of standard cost (which approximates actual cost on a first-in, first-out basis) or net realizable value. The Company evaluates the valuation of all inventories, including raw materials, work-in-process, finished goods and spare parts on a periodic basis. Obsolete inventory or inventory in excess of management’s estimated usage is written-down to its estimated market value less costs to sell, if less than its cost. Inherent in the estimates of market value are management’s estimates related to economic trends, future demand for products, and technological obsolescence of the Company’s products.
Inventory write downs inherently involve judgments as to assumptions about expected future demand and the impact of market conditions on those assumptions. Although the Company believes that the assumptions it used in estimating inventory write downs are reasonable, significant changes in any one of the assumptions in the future could produce a significantly different result. There can be no assurances that future events and changing market conditions will not result in significant increases in inventory write downs.
57
Property, plant and equipment are stated at cost, or, in the case of equipment under finance leases, the present value of future minimum lease payments at inception of the related lease. Depreciation and amortization are computed using the straight-line method and declining balance methods over the lesser of the estimated useful lives of the assets or the terms of the leases. Useful lives range from three to fifty years. Direct costs incurred to develop software for internal use are capitalized and amortized over an estimated useful life of three or ten years. Costs related to the design or maintenance of internal use software are expensed as incurred. Capitalized internal use software is included in computer equipment and software.
Long-lived Assets
The Company evaluates long-lived assets for impairment whenever events or changes in circumstances indicate the carrying value of an asset group may not be recoverable. The Company assesses the fair value of the assets based on the amount of the undiscounted future cash flows that the assets are expected to generate and recognizes an impairment loss when estimated undiscounted future cash flows expected to result from the use of the asset are less than the carrying value of the asset. If the Company identifies an impairment, the Company reduces the carrying value of the group of assets to comparable market values, when available and appropriate, or to its estimated fair value based on a discounted cash flow approach.
At the end of fiscal years 2019, 2018 and 2017, the Company assessed the useful lives of its long-lived assets, including property, plant and equipment as well as its intangible assets and concluded that no impairment was required.
Leases
The Company determines if an arrangement is a lease, or contains a lease, at the inception of the arrangement. When the Company determines the arrangement is a lease, or contains a lease, at lease inception, it then determines whether the lease is an operating lease or a finance lease. Operating and finance leases with lease terms of one year or greater result in the Company recording a right-of-use (ROU) asset and lease liability on its balance sheet. ROU assets represent the Company’s right to use an underlying asset for the lease term and lease liabilities represent its obligation to make lease payments arising from the lease. Operating and finance lease ROU assets and liabilities are initially recognized based on the present value of lease payments over the lease term. In determining the present value of lease payments, the Company uses the implicit interest rate if readily determinable or when the implicit interest rate is not readily determinable, the Company uses its incremental borrowing rate. The incremental borrowing rate is not a commonly quoted rate and is derived through a combination of inputs including the Company’s credit rating and the impact of full collateralization. The incremental borrowing rate is based on the Company’s collateralized borrowing capabilities over a similar term of the lease payments. The Company utilizes the consolidated group incremental borrowing rate for all leases. The operating lease ROU asset also includes any lease payments made and excludes any lease incentives. Specific lease terms used in computing the ROU assets and lease liabilities may include options to extend or terminate the lease when the Company believes it is reasonably certain that it will exercise that option. Lease expense for operating lease payments is recognized on a straight-line basis over the lease term. As allowed by the guidance, the Company has elected not to recognize ROU assets and lease liabilities that arise from short-term (12 months or less) leases for any class of underlying asset. Operating leases are included in operating lease ROU assets, other current liabilities, and long-term operating lease liabilities on the Company’s consolidated balance sheet. The Company’s finance leases at December 27, 2019 are immaterial.
Goodwill and Indefinite Lived Intangible Assets
Goodwill and indefinite-lived intangible assets are not amortized, but are reviewed for impairment annually. Intangible assets are presented at cost, net of accumulated amortization, and are amortized on either a straight-line method or on an accelerated method over their estimated future discounted cash flows. The Company reviews goodwill and purchased intangible assets with indefinite lives for impairment annually and whenever events or changes in circumstances indicate the carrying value of an asset may not be recoverable, such as when reductions in demand or significant economic slowdowns in the semiconductor industry are present. There were no impairments of the Company’s goodwill and purchased intangible assets in fiscal year 2019.
58
Debt issuance costs incurred in connection with obtaining debt financing are deferred and presented as a direct deduction from Bank Borrowings in the accompanying Consolidated Balance Sheets. Costs incurred in connection with revolving credit facilities and letter of credit facilities are deferred and presented as an offset to bank borrowings in the accompanying Consolidated Balance Sheets. Deferred costs are amortized on an effective interest method basis over the contractual term.
Defined Benefit Plan
Through the acquisition of QGT, the Company has a noncontributory defined benefit plan covering substantially all of the employees of one of its foreign entities upon termination of their employee services. For further discussion of the Company’s defined benefit plan see Note 8 of Notes to the Consolidated Financial Statements.
Revenue Recognition
On December 30, 2017, the Company adopted Topic 606 using the modified retrospective method to value those contracts which were not completed as of December 30, 2017. The adoption of Topic 606 did not have a material effect on the Company’s financial position or results of operations.
Revenue is recognized when control of the promised goods or services is transferred to the Company’s customers, in an amount that reflects the consideration the Company expects to be entitled to in exchange for those goods or services. The Company assesses collectability based on the credit worthiness of the customer and past transaction history. The Company performs on-going credit evaluations of customers and generally does not require collateral from customers.
Shipping and Handling Costs
Shipping and handling costs are included as a component of cost of revenues.
Research and Development Costs
Research and development costs are expensed as incurred.
Stock-Based Compensation Expense
The Company maintains stock-based compensation plans which allow for the issuance of equity-based awards to executives and certain employees. These equity-based awards include stock options, restricted stock awards and restricted stock units. The Company also maintains an employee stock purchase plan (“ESPP”) that provides for the issuance of shares to all eligible employees of the Company at a discounted price.
Income Taxes
The Company utilizes the asset and liability method of accounting for income taxes, under which deferred taxes are determined based on the temporary differences between the financial statement and tax basis of assets and liabilities using tax rates expected to be in effect during the years in which the basis differences reverse. Deferred income taxes arise from temporary differences between the tax basis of assets and liabilities and their reported amounts in the financial statements, which will result in taxable or deductible amounts in the future. In evaluating our ability to realize our deferred tax assets within the jurisdiction from which they arise, we consider all available positive and negative evidence, including scheduled reversals of deferred tax liabilities, projected future taxable income, tax-planning strategies, and results of recent operations. In projecting future taxable income, we begin with historical results and incorporate assumptions about the amount of future state, federal, and foreign pretax operating income adjusted for items that do not have tax consequences. The assumptions about future taxable income require significant judgment and are consistent with the plans and estimates we are using to manage the underlying businesses. In evaluating the objective evidence that historical results provide, we consider recent cumulative income (loss). A valuation allowance is recorded when it is more likely than not that some of the deferred tax assets will not be realized.
59
During the quarter ended December 27, 2019 the Company performed a twelve quarter analysis of its U.S. cumulative pretax profit position as of December 27, 2019 and, weighing both positive and negative evidence, determined that it is more likely than not that the Company will not have the ability to generate sufficient taxable income over the foreseeable future to realize its U.S. federal and state deferred tax assets. Therefore, during the quarter ended December 27, 2019, the Company continues to believe that a valuation allowance is required on its U.S. federal and state net deferred tax assets. The total U.S. federal and state valuation allowance as of December 27, 2019 was $23.1 million.
The Company’s ability to realize deferred tax assets depends on its ability to generate sufficient future taxable income. In assessing the Company’s future taxable income, the Company considered all sources of future taxable income available to realize its deferred tax assets, including the taxable income from future reversal of existing temporary differences, carry forwards and tax-planning strategies. If changes occur in the assumptions underlying the Company’s tax planning strategies or in the scheduling of the reversal of its deferred tax liabilities, the valuation allowance may need to be adjusted in the future.
The Company had a total valuation allowance on its net deferred tax assets in the amount of $25.8 million and $7.7 million as of December 27, 2019 and December 28, 2018, respectively.
Income tax positions must meet a more likely than not recognition threshold to be recognized. Income tax positions that previously failed to meet the more likely than not threshold are recognized in the first subsequent financial reporting period in which that threshold is met. Previously recognized tax positions that no longer meet the more likely than not threshold are derecognized in the first subsequent financial reporting period in which that threshold is no longer met. The Company recognizes potential accrued interest and penalties related to unrecognized tax benefits within the consolidated statements of income as income tax expense. The calculation of tax liabilities involves significant judgment in estimating the impact of uncertainties in the application of complex tax laws. Resolution of these uncertainties in a manner inconsistent with the Company’s expectations could have a material impact on its results of operations and financial position. Management believes that it has adequately provided for any adjustments that may result from these examinations; however, the outcome of tax audits cannot be predicted with certainty.
Net Income per Share
Basic net income per share is computed by dividing net income by the weighted average number of shares outstanding for the period. Diluted net income per share is calculated by dividing net income by the weighted average number of common shares outstanding and common equivalent shares from dilutive stock options and restricted stock using the treasury stock method, except when such shares are anti-dilutive (see Note 14 to the Notes to Consolidated Financial Statements).
Business Combinations
The Company recognizes assets acquired (including goodwill and identifiable intangible assets), liabilities assumed and noncontrolling interest at fair value on the acquisition date. Subsequent changes to the fair value of such assets acquired and liabilities assumed are recognized in earnings, after the expiration of the measurement period, a period not to exceed 12 months from the acquisition date. Acquisition-related expenses and acquisition-related restructuring costs are recognized in earnings in the period in which they are incurred.
Recently Adopted Accounting Pronouncements
Beginning in fiscal 2019, the Company adopted Accounting Standards Update (“ASU”) No. 2016-02, "Leases (Topic 842)" and as part of that process the Company made the following elections:
|
|
• |
The Company did not elect to use hindsight for transition when considering judgments and estimates such as assessments of lessee options to extend or terminate a lease or purchase the underlying asset. |
|
|
• |
For all asset classes, the Company elected to not recognize a right-of-use asset and lease liability for leases with a term of 12 months or less. |
60
|
|
• |
In March 2018, the FASB approved an optional transition method that allows companies to use the effective date as the date of initial application on transition. The Company elected this transition method, and as a result, will not adjust its comparative period financial information or make the newly required lease disclosures for periods before the effective date. |
The Company determines if an arrangement is a lease at inception. Operating leases are included in the Consolidated Balance Sheet as right-of-use assets from operating leases, current operating lease liabilities and long-term operating lease liabilities. Finance leases, which are not material, are included in property, plant and equipment, other current liabilities and other non-current liabilities in the Consolidated Balance Sheet. Most of the Company’s lease agreements contain renewal options; however, the Company did not recognize right-of-use assets or lease liabilities for renewal periods unless it is determined that we are reasonably certain of renewing the lease at inception or when a triggering event occurs. Some of the Company’s lease agreements contain rent escalation clauses, rent holidays, capital improvement funding or other lease concessions. The Company recognizes minimum rental expense on a straight-line basis based on the fixed components of a lease arrangement. The Company amortizes this expense over the term of the lease beginning with the date of initial possession, which is the date the Company enters the leased space and begins to make improvements in preparation for its intended use. Variable lease components represent amounts that are not fixed in nature and are not tied to an index or rate, and are recognized as incurred.
In determining right-of-use assets and lease liabilities, the Company applied a discount rate to the minimum lease payments within each lease agreement. Accounting Standards Codification (“ASC”) 842 requires companies to use the rate of interest that a lessee would have to pay to borrow on a collateralized basis over a similar term, an amount equal to the lease payments in a similar economic environment. When the Company cannot readily determine the discount rate implicit in the lease agreement, the Company utilizes its incremental borrowing rate. For additional information on the required disclosures related to the impact of adopting this standard, see Note 13 to the Consolidated Financial Statements.
Adoption of the new standard resulted in the recording of operating lease right-of-use assets and lease liabilities at the beginning of 2019 of $35.6 million and $38.5 million, respectively, with the difference due to deferred rent that was reclassified to the right of use asset value.
All other newly issued and effective accounting standards during 2019 were not relevant or significant to the Company.
Recent Accounting Pronouncements Not Yet Adopted
In December 2019, the FASB issued ASU 2019-12, Income Taxes (Topic 740): Simplifying the Accounting for Income Taxes. This standard simplifies the accounting for income taxes by eliminating certain exceptions to the guidance in Topic 740 related to the approach for intraperiod tax allocation, the methodology for calculating income taxes in an interim period and the recognition of deferred tax liabilities for outside basis differences. The new guidance also simplifies aspects of the accounting for franchise taxes and enacted changes in tax laws or rates and clarifies the accounting for transactions that result in a step-up in the tax basis of goodwill and allocating consolidated income taxes to separate financial statements of entities not subject to income tax. ASU 2019-12 is effective for fiscal years beginning after December 15, 2020, with early adoption permitted. Upon adoption, the Company must apply certain aspects of this standard retrospectively for all periods presented while other aspects are applied on a modified retrospective basis through a cumulative-effect adjustment to retained earnings as of the beginning of the fiscal year of adoption. The Company is currently evaluating the impact of this new standard on its consolidated financial statements.
Although there are several other new accounting pronouncements issued by the FASB, the Company does not believe any of these accounting pronouncements had or will have a material impact on its consolidated financial statements.
61
Quantum Global Technologies, LLC
On August 27, 2018, the Company acquired all of the outstanding preferred and common units of QGT, a provider of ultra-high purity parts cleaning, process tool part recoating, surface treatment and analytical services to the semiconductor and related industries, for total purchase consideration of $340.8 million, including an estimated $4.2 million in contingent consideration related to $15.0 million of potential cash earn-out payments if the Company achieves certain specified revenue levels through December 27, 2019. For the twelve months ended December 27, 2019, the Company incurred approximately $2.6 million of costs related to the acquisition, which were expensed as incurred and recorded as general and administrative operating expense. The Company completed this acquisition primarily in order to diversify the Company’s customer base, to create a wafer-starts-based recurring revenue stream, and to expand the Company’s addressable market. The Company borrowed $350.0 million to finance the acquisition and to refinance its existing indebtedness. See further discussion of the new borrowing arrangements in Note 6 to the Notes to Consolidated Financial Statements.
The fair value of the earn-out at the acquisition date was determined using the Monte Carlo Simulation model, which incorporated risk adjusted revenue projections. These inputs are not observable in the market and thus represent a Level 3 measurement as discussed in Note 4 to the Notes to Consolidated Financial Statements. During the fiscal year 2019, the Company reassessed the fair value of the earn-out payments. The fair value decreased from $3.9 million as of December 28, 2018 to nil as of December 27, 2019 as QGT did not achieve the specified performance target. The decrease in the recorded liability of $3.9 million was recorded as other income in the Consolidated Statements of Operations.
In 2019, the Company completed its analysis of the fair value of the property, plant and equipment acquired and the impact on depreciation expense from the acquisition date through the end of the third quarter of 2019 and, as a result, the Company recorded a reduction in the fair value of fixed assets of approximately $0.9 million and a reduction in previously recorded depreciation expense of approximately $0.2 million. In addition, the Company completed its analysis of the impact of the intangible assets acquired on its worldwide tax position and recorded deferred tax liabilities that resulted in an increase to goodwill of approximately $7.6 million. During the quarter ended September 27, 2019, the Company completed the purchase price allocation for the QGT acquisition. The following table summarizes the fair values of assets acquired and liabilities assumed at the date of acquisition:
|
Fair Market Values (In millions) |
|
|
|
|
|
Cash and cash equivalents |
|
$ |
19.0 |
|
|
Accounts receivable |
|
|
24.2 |
|
|
Inventories |
|
|
0.5 |
|
|
Prepaid expenses and other |
|
|
12.3 |
|
|
Property, plant and equipment |
|
|
100.1 |
|
|
Goodwill |
|
|
73.5 |
|
|
Intangible assets |
|
|
171.5 |
|
|
Total assets acquired |
|
|
401.1 |
|
|
Accounts payable |
|
|
(9.0 |
) |
|
Accrued compensation and related benefits |
|
|
(7.9 |
) |
|
Other current liabilities |
|
|
(7.4 |
) |
|
Deferred tax liability |
|
|
(8.5 |
) |
|
Other liabilities |
|
|
(13.2 |
) |
|
Total liabilities assumed |
|
|
(46.0 |
) |
|
Noncontrolling interests |
|
|
(14.3 |
) |
|
Fair value of net assets acquired |
|
$ |
340.8 |
|
62
|
|
|
|
|
|
|
Purchased |
|
|
|
|
|
Useful Life |
|
|
Intangible Assets |
|
||
|
|
|
(In years) |
|
|
(In millions) |
|
||
|
Customer relationships |
|
|
10 |
|
|
$ |
74.8 |
|
|
Trade name |
|
|
4 |
|
|
|
14.9 |
|
|
Recipes |
|
|
20 |
|
|
|
73.2 |
|
|
Standard operating procedures |
|
|
20 |
|
|
|
8.6 |
|
|
Total purchased intangible assets |
|
|
|
|
|
$ |
171.5 |
|
The results of operations for the Company for the year ended December 28, 2018 included revenues of approximately $81.0 million attributable to QGT’s operating activities since its acquisition date on August 27, 2018.
For the year ended December 27, 2019 and December 28, 2018, results of operations included charges of $15.3 million and $5.2 million, respectively, attributable to amortization of intangible assets and $2.6 million and $10.0 million, respectively, of costs associated with the acquisition, which were expensed as incurred and recorded as general and administrative operating expense.
Quantum Facility Fire
In September 2018, a fire in a facility owned by a South Korean subsidiary of QGT destroyed certain assets, including the building, acquired in the QGT acquisition. The fire damage was estimated to be $5.9 million. The building and related assets were fully insured, resulting in no net loss from the fire damage. The fire also destroyed inventory owned by one of its customers. The cost of this inventory was assessed at approximately $6 million and is fully insured. The Company was able to minimize the impact on the Company’s revenue stream by utilizing its other local facilities and moving its labor force in quick order. The Company had a $2.0 million business interruption insurance policy at the time of the fire, which the Company collected in 2019 and recorded in other income (expense), net.
Dynamic Manufacturing Solutions, LLC
On April 15, 2019, the Company purchased substantially all of the assets of DMS, a semiconductor weldment and solutions provider based in Austin, Texas. Pursuant to the purchase agreement, the former owners of DMS are entitled up to $12.5 million of potential cash earn-out if the combined weldment business, after the acquisition, achieves certain gross profit and gross margin targets for the twelve months ending June 26, 2020. The fair value of the earn-out at the acquisition date was $1.5 million and was determined using a risk adjusted earnings projection utilizing the Monte Carlo Simulation model. These inputs are not observable in the market and thus represent a Level 3 measurement as discussed in Note 1 of the Company’s Consolidated Financial Statements. The total purchase consideration of DMS for purposes of the Company’s purchase price allocation was determined to be $31.4 million, which includes the cash payment of $29.9 million and the fair value of the potential earn-out payments of approximately $1.5 million.
63
The allocation of the purchase price is preliminary pending the completion of various analyses and the finalization of estimates primarily related to taxes, inventory and residual goodwill. During the measurement period, which can be no more than one year from the date of acquisition, we expect to continue to obtain information to assist us in determining the final fair value of the net assets acquired at the acquisition date during the measurement period. Assets acquired and liabilities assumed are recorded based on valuations derived from estimated fair value assessments and assumptions used by the Company. Thus, the provisional measurements of fair value discussed above are subject to change. The Company expects to finalize the valuation as soon as practicable, but not later than one year from the acquisition date. While the Company believes that its estimates and assumptions underlying the valuations are reasonable, different estimates and assumptions could result in different valuations assigned to the individual assets acquired and liabilities assumed, and the resulting amount of goodwill. The following table summarizes the preliminary fair values of assets acquired and liabilities assumed at the date of acquisition:
|
Fair Market Values (In millions) |
|
|
|
|
|
Accounts receivable |
|
$ |
1.5 |
|
|
Inventories |
|
|
8.9 |
|
|
Property, plant and equipment |
|
|
5.4 |
|
|
Goodwill |
|
|
12.3 |
|
|
Intangible assets |
|
|
6.9 |
|
|
Other assets |
|
|
0.3 |
|
|
Total assets acquired |
|
|
35.3 |
|
|
Accounts payable |
|
|
(3.8 |
) |
|
Other liabilities |
|
|
(0.1 |
) |
|
Total liabilities assumed |
|
|
(3.9 |
) |
|
Purchase price allocated |
|
$ |
31.4 |
|
The customer relationships intangible assets acquired from the acquisition of DMS has an estimated useful life of six years.
The results of operations for the Company for fiscal year ended December 27, 2019 included eight months of operating activities for DMS. Net sales of approximately $35.2 million and operating income of approximately $4.9 million attributable to DMS were included in the consolidated results of operations. For the fiscal year ended December 27, 2019, results of operations included charges of $8.0 million of contingent earn-out expense recorded in other income (expense), net, $0.8 million attributable to amortization of intangible assets and $1.2 million of deal costs associated with the acquisition.
Pro Forma Consolidated Results
The following unaudited pro forma consolidated results of operations assume the QGT and DMS acquisitions were completed as of the beginning of the year of the reporting periods presented.
|
|
|
Unaudited Pro Forma Information |
|
|||||
|
|
|
Year Ended |
|
|||||
|
|
|
December 27, |
|
|
December 28, |
|
||
|
|
|
2019 |
|
|
2018 |
|
||
|
(In millions, except per share amounts) |
|
|
|
|||||
|
Revenues |
|
$ |
1,075.4 |
|
|
$ |
1,305.5 |
|
|
Net income (loss) |
|
$ |
(8.0 |
) |
|
$ |
47.5 |
|
|
Basic income (loss) per share |
|
$ |
(0.20 |
) |
|
$ |
1.24 |
|
|
Diluted income (loss) per share |
|
$ |
(0.20 |
) |
|
$ |
1.22 |
|
64
The unaudited pro forma results above include adjustments related to the purchase price allocation and financing of the acquisition, primarily to increase amortization for the identifiable intangible assets, to increase interest expense for the additional debt incurred to complete the acquisition and to reflect the related income tax effect. The unaudited pro forma condensed combined financial information has been prepared by management for illustrative purposes only and are not necessarily indicative of the consolidated financial position or results of operations in future periods or the results that would have been realized had UCT, DMS and QGT been a combined company during the specified periods. The unaudited pro forma condensed combined financial information does not reflect any operating efficiencies and/or cost savings that the Company may achieve with respect to the combined companies, or any liabilities that may result from integration activities.
3. BALANCE SHEET INFORMATION
Inventories consisted of the following:
|
|
|
December 27, |
|
|
December 28, |
|
||||
|
(In millions) |
|
2019 |
|
|
2018 |
|
||||
|
Raw materials |
|
$ |
|
99.9 |
|
|
$ |
|
121.3 |
|
|
Work in process |
|
|
|
57.6 |
|
|
|
|
51.0 |
|
|
Finished goods |
|
|
|
14.9 |
|
|
|
|
13.8 |
|
|
Total |
|
$ |
|
172.4 |
|
|
$ |
|
186.1 |
|
At December 27, 2019 and December 28, 2018, inventory balances were $172.4 million and $186.1 million, respectively, net of reserves of $12.0 million and $8.9 million, respectively. The inventory write-downs are recorded as an inventory valuation allowance established on the basis of obsolete inventory or specific identified inventory in excess of estimated usage. For fiscal years 2019, 2018 and 2017, inventory write-downs were $2.5 million, $3.3 million and $2.6 million, respectively.
Property, plant and equipment, net, consisted of the following:
|
|
|
December 27, |
|
|
December 28, |
|
||||
|
(In millions) |
|
2019 |
|
|
2018 |
|
||||
|
Land |
|
$ |
|
4.8 |
|
|
$ |
|
4.8 |
|
|
Buildings |
|
|
|
36.9 |
|
|
|
|
32.2 |
|
|
Leasehold improvements |
|
|
|
41.8 |
|
|
|
|
38.6 |
|
|
Machinery and equipment |
|
|
|
58.1 |
|
|
|
|
58.3 |
|
|
Computer equipment and software |
|
|
|
32.1 |
|
|
|
|
31.3 |
|
|
Furniture and fixtures |
|
|
|
4.4 |
|
|
|
|
5.8 |
|
|
|
|
|
|
178.1 |
|
|
|
|
171.0 |
|
|
Accumulated depreciation |
|
|
|
(56.7 |
) |
|
|
|
(42.5 |
) |
|
Construction in progress |
|
|
|
23.9 |
|
|
|
|
15.0 |
|
|
Total |
|
$ |
|
145.3 |
|
|
$ |
|
143.5 |
|
Restructuring
During the fourth quarter of fiscal year 2019, the Company made a strategic decision to close its machining operations in South San Francisco, CA. As a result, the Company recorded a restructuring charge of $12.6 million related to the sale of equipment, facility leases, severance and write down of inventory.
65
The fair value hierarchy requires an entity to maximize the use of observable inputs and minimize the use of unobservable inputs when measuring fair value. The following table summarizes, for assets or liabilities measured at fair value, the respective fair value and the classification by level of input within the fair value hierarchy:
|
|
|
|
|
|
Fair Value Measurement at |
|
||||||||||
|
|
|
|
|
|
Reporting Date Using |
|
||||||||||
|
Description |
|
December 27, 2019 |
|
|
Quoted Prices in Active Markets for Identical Assets (Level 1) |
|
|
Significant Other Observable Inputs (Level 2) |
|
|
Significant Unobservable Inputs (Level 3) |
|
||||
|
(In millions) |
|
|
|
|
|
|
|
|
|
|
|
|
|
|
|
|
|
Other liabilities: |
|
|
|
|
|
|
|
|
|
|
|
|
|
|
|
|
|
Contingent earn-out liability |
|
$ |
9.5 |
|
|
$ |
— |
|
|
$ |
— |
|
|
$ |
9.5 |
|
|
Common stock purchase obligation |
|
$ |
6.8 |
|
|
$ |
— |
|
|
$ |
— |
|
|
$ |
6.8 |
|
|
Pension obligation |
|
$ |
4.4 |
|
|
$ |
— |
|
|
$ |
— |
|
|
$ |
4.4 |
|
|
|
|
|
|
|
Fair Value Measurement at |
|
||||||||||
|
|
|
|
|
|
Reporting Date Using |
|
||||||||||
|
Description |
|
December 28, 2018 |
|
|
Quoted Prices in Active Markets for Identical Assets (Level 1) |
|
|
Significant Other Observable Inputs (Level 2) |
|
|
Significant Unobservable Inputs (Level 3) |
|
||||
|
(In millions) |
|
|
|
|
|
|
|
|
|
|
|
|
|
|
|
|
|
Other assets: |
|
|
|
|
|
|
|
|
|
|
|
|
|
|
|
|
|
Forward contracts |
|
$ |
0.2 |
|
|
$ |
— |
|
|
$ |
0.2 |
|
|
$ |
— |
|
|
Other liabilities: |
|
|
|
|
|
|
|
|
|
|
|
|
|
|
|
|
|
Contingent earn-out liability |
|
$ |
3.9 |
|
|
$ |
— |
|
|
$ |
— |
|
|
$ |
3.9 |
|
|
Common stock purchase obligation |
|
$ |
8.5 |
|
|
$ |
— |
|
|
$ |
— |
|
|
$ |
8.5 |
|
|
Pension obligation |
|
$ |
3.5 |
|
|
$ |
— |
|
|
$ |
— |
|
|
$ |
3.5 |
|
There were no transfers from Level 1 or Level 2. Fair value adjustments were noncash, and therefore did not impact the Company’s liquidity or capital resources. Qualitative information about Level 3 fair value measurements are as follow:
|
(Dollars in millions, except rate/multiple) |
|
December 27, 2019 |
|
|
Valuation Techniques |
|
Unobservable Input |
|
Rate/Multiple |
|
|||
|
Contingent earn-out liability |
|
$ |
|
9.5 |
|
|
Monte carlo simulation |
|
Revenue discount rate |
|
|
9.0 |
% |
|
|
|
|
|
|
|
|
|
|
Revenue volatility rate |
|
|
28.0 |
% |
|
|
|
|
|
|
|
|
|
|
|
|
|
|
|
|
Common stock purchase obligation |
|
$ |
|
6.8 |
|
|
Discounted cash flow |
|
Revenue Multiple |
|
1.3 |
|
|
|
|
|
|
|
|
|
|
|
|
EBITDA Multiple |
|
|
8.0 |
|
|
|
|
|
|
|
|
|
|
|
|
|
|
|
|
|
Pension obligation |
|
$ |
|
4.4 |
|
|
Projected unit credit method |
|
Discount rate |
|
|
2.43 |
% |
|
|
|
|
|
|
|
|
|
|
Rate on return |
|
|
1.37 |
% |
|
|
|
|
|
|
|
|
|
|
Salary increase rate |
|
|
4.42 |
% |
Following is a summary of the Level 3 activity:
|
(In millions) |
|
Contingent earn-out liability |
|
|
Common stock purchase obligation |
|
|
Pension obligation |
|
|||
|
As of December 28, 2018 |
|
$ |
3.9 |
|
|
$ |
8.5 |
|
|
$ |
3.5 |
|
|
Fair value adjustments (DMS) |
|
|
9.5 |
|
|
|
- |
|
|
|
- |
|
|
Fair value adjustments (QGT) |
|
|
(3.9 |
) |
|
|
(1.7 |
) |
|
|
- |
|
|
Benefits and other adjustments (SSB) |
|
|
- |
|
|
|
- |
|
|
|
0.9 |
|
|
As of December 27, 2019 |
|
$ |
9.5 |
|
|
$ |
6.8 |
|
|
$ |
4.4 |
|
66
5. GOODWILL AND INTANGIBLE ASSETS
The Company’s methodology for allocating the purchase price relating to an acquisition is determined through established and generally accepted valuation techniques. Goodwill is measured as the excess of the cost of the acquisition over the sum of the amounts assigned to tangible and identifiable intangible assets acquired less liabilities assumed.
Goodwill and purchased intangible assets with indefinite useful lives are not amortized, but are reviewed for impairment at least annually and whenever events or changes in circumstances indicate that the carrying value of an asset may not be recoverable. To test goodwill for impairment, the Company first performs a qualitative assessment to determine whether it is more likely than not that the fair value of a reporting unit is less than its carrying value. If the Company concludes it is more likely than not that the fair value of a reporting unit exceeds its carrying amount, the Company does not proceed to perform a quantitative impairment test. If the Company concludes it is more likely than not that the fair value of the reporting unit is less than its carrying value, a quantitative goodwill impairment test will be performed by comparing the fair value of each reporting unit to its carrying value. A quantitative impairment analysis, if necessary, considers the income approach, which requires estimates of the present value of expected future cash flows to determine a reporting unit’s fair value. Significant estimates include revenue growth rates and operating margins used to calculate projected future cash flows, discount rates, and future economic and market conditions. A goodwill impairment charge is recognized for the amount by which the reporting unit’s fair value is less than its carrying value. Any loss recognized should not exceed the total amount of goodwill allocated to that reporting unit. The process of evaluating the potential impairment of goodwill and intangible assets requires significant judgment. The Company regularly monitors current business conditions and other factors including, but not limited to, adverse industry or economic trends and lower projections of profitability that may impact future operating results.
In the fourth quarters of 2019 and 2018, the Company conducted its annual impairment tests of goodwill and concluded that there was no goodwill impairment with respect to its reporting units.
Details of aggregate goodwill of the Company are as follows:
|
|
|
|
|
|
|
|
|
|
|
|||
|
(In millions) |
|
SPS |
|
|
SSB |
|
|
Total |
|
|||
|
Balance at December 29, 2017 |
|
$ |
85.2 |
|
|
$ |
— |
|
|
$ |
85.2 |
|
|
Business combination |
|
|
— |
|
|
|
65.0 |
|
|
|
65.0 |
|
|
Balance at December 28, 2018 |
|
|
85.2 |
|
|
|
65.0 |
|
|
|
150.2 |
|
|
Business combination |
|
|
12.4 |
|
|
|
8.5 |
|
|
|
20.9 |
|
|
Balance at December 27, 2019 |
|
$ |
97.6 |
|
|
$ |
73.5 |
|
|
$ |
171.1 |
|
Intangible Assets
Intangible assets are generally recorded in connection with a business acquisition. The Company evaluates the useful lives of its intangible assets each reporting period to determine whether events and circumstances require revising the remaining period of amortization. In addition, the Company reviews indefinite lived intangible assets for impairment when events or changes in circumstances indicate their carrying value may not be recoverable and tests definite lives intangible assets at least annually for impairment. Management considers such indicators as significant differences in product demand from the estimates, changes in the competitive and economic environment, technological advances, and changes in cost structure.
67
Details of intangible assets were as follows:
|
|
|
|
As of December 27, 2019 |
|
|
As of December 28, 2018 |
|
|
||||||||||||||||||
|
|
|
|
Gross |
|
|
|
|
|
|
Gross |
|
|
|
|
|
|
|
|
||||||||
|
|
Useful Life |
|
Carrying |
Accumulated |
|
|
Carrying |
|
|
Carrying |
|
|
Accumulated |
|
|
Carrying |
|
|
||||||||
|
(Dollars in millions) |
(in years) |
|
Amount |
Amortization |
|
|
Value |
|
|
Amount |
|
|
Amortization |
|
|
Value |
|
|
||||||||
|
Customer relationships |
6 - 10 |
|
$ |
119.4 |
|
|
$ |
(39.8 |
) |
|
$ |
79.6 |
|
|
$ |
112.5 |
|
|
$ |
(29.0 |
) |
|
$ |
83.5 |
|
|
|
Tradename |
4 - 6* |
|
|
27.0 |
|
|
|
(8.1 |
) |
|
|
18.9 |
|
|
|
27.0 |
|
|
|
(4.4 |
) |
|
$ |
22.6 |
|
|
|
Intellectual property/know-how |
7 - 12 |
|
|
13.9 |
|
|
|
(8.4 |
) |
|
|
5.5 |
|
|
|
13.9 |
|
|
|
(6.9 |
) |
|
$ |
7.0 |
|
|
|
Recipes |
20 |
|
|
73.2 |
|
|
|
(4.9 |
) |
|
|
68.3 |
|
|
|
73.2 |
|
|
|
(1.2 |
) |
|
$ |
72.0 |
|
|
|
Standard operating procedures |
20 |
|
|
8.6 |
|
|
|
(0.6 |
) |
|
|
8.0 |
|
|
|
8.6 |
|
|
|
(0.2 |
) |
|
$ |
8.4 |
|
|
|
Total |
|
|
$ |
242.1 |
|
|
$ |
(61.8 |
) |
|
$ |
180.3 |
|
|
$ |
235.2 |
|
|
$ |
(41.7 |
) |
|
$ |
193.5 |
|
|
|
* |
The Company concluded that the asset life of UCT tradename of $9.0 million is indefinite and is therefore not amortized but is reviewed for impairment at least annually and whenever events or changes in circumstances indicate that the carrying value of an asset may not be recoverable. |
Amortization expense was approximately $20.1 million for the year ended December 27, 2019, $9.6 million for the year ended December 28, 2018, and $5.4 million for the year ended December 29, 2017.
|
|
|
Amortization |
|
|
|
(In millions) |
|
Expense |
|
|
|
2020 |
|
$ |
19.8 |
|
|
2021 |
|
|
19.6 |
|
|
2022 |
|
|
19.3 |
|
|
2023 |
|
|
14.2 |
|
|
2024 |
|
|
14.0 |
|
|
Thereafter |
|
|
84.4 |
|
|
Total |
|
$ |
171.3 |
|
6. BORROWING ARRANGEMENTS
In August 2018, the Company entered into a credit agreement with Barclays Bank that provided a Term Loan, a Revolving Credit Facility, and a Letter of Credit Facility (the “Credit Facility”). UCT and certain of its subsidiaries have agreed to secure all of their obligations under the Credit Facility by granting a first priority lien in substantially all of their respective personal property assets (subject to certain exceptions and limitations). In connection with this credit agreement, the Company borrowed $350.0 million under the Term Loan and used the proceeds, together with cash on hand, to finance the acquisition of QGT (see Note 2) and to refinance its previous credit facilities.
In August 2018, the Company paid $41.6 million of principal, accrued interest, and fees in settlement of the then-outstanding term loan, revolving credit facility, interest rate swap under the Credit Agreement, and recognized $0.1 million in expense upon extinguishment of debt as Interest and other income (expense), net.
The Term Loan has a maturity date of August 27, 2025, with monthly interest payments in arrears, quarterly principal payments of 0.625% of the original outstanding principal balance payable beginning in January 2019, with the remaining principal paid upon maturity. The Term Loan accrues interest at a rate equal to a base LIBOR rate determined by reference to the London interbank offered rate for dollars, plus 4.5% (subject to certain adjustments quarterly based upon the Company’s consolidated leverage ratio). At December 27, 2019, the Company had an outstanding amount under the Term Loan of $300.0 million, gross of unamortized debt issuance costs of $9.7 million. As of December 27, 2019, interest rate on the outstanding Term Loan was 6.2%. After December 31, 2021, LIBOR will officially be phased out. The Company will work with its bank to determine alternative risk-free rates.
The Revolving Credit Facility has an initial available commitment of $65.0 million and a maturity date of August 27, 2023. The Company pays a quarterly commitment fee in arrears equal to 0.25% of the average daily available commitment outstanding. During the second quarter of 2019, the Company borrowed $15.0 million under the
68
Revolving Credit Facility to fund the acquisition of DMS, and as of December 27, 2019, the Company had no amount outstanding under the Revolving Credit Facility.
The New Credit Agreement requires the Company to maintain certain financial covenants including a consolidated fixed charge coverage ratio (as defined in the New Credit Agreement) as of the last day of any fiscal quarter of at least 1.25 to 1.00, and a consolidated leverage ratio (as defined in the New Credit Agreement) as of the last day of any fiscal quarter of no greater than 3.75 to 1.00. The Company was in compliance with all financial covenants during the year ended December 27, 2019.
The Letter of Credit Facility has an initial available commitment of $50.0 million and a maturity date of August 27, 2023. The Company pays quarterly in arrears a fee equal to 2.5% (subject to certain adjustments as per the Term Loans) of the dollar equivalent of all outstanding letters of credit, and a fronting fee equal to 0.125% of the undrawn and unexpired amount of each letter of credit. As of December 27, 2019, the Company had $1.5 million of outstanding letters of credit and a remaining available commitments of $48.5 million on the Letter of Credit Facility and $65.0 million on the Revolving Credit Facility.
As of December 27, 2019, FDS had an outstanding amount under a revolving credit facility of 1.7 million euros (approximately $1.9 million) with an interest rate of 0.9%.
Cinos Korea has Credit Agreements with various banks that provide Revolving Credit Facilities for a total available commitment of 1.9 billion Korean Won (approximately $1.7 million) with annual renewals beginning in April 2020 through October 2020 and interest rates ranging from 1.4% - 5.4%. During fiscal year ended December 27, 2019, borrowings under these Revolving Facilities were insignificant and no amounts were outstanding as of December 27, 2019.
As of December 27, 2019, the Company’s total bank debt was $292.2 million, net of unamortized debt issuance costs of $9.7 million. As of December 27, 2019, the Company had $65.0 million and 6.5 million euros (approximately $7.3 million) available to draw from its revolving credit facilities in the U.S. and Czech Republic, respectively.
The fair value of the Company’s long term debt was based on Level 2 inputs, and fair value was determined using quoted prices for similar liabilities in inactive markets. The Company’s carrying value approximates fair value for the Company’s long term debt.
As of December 27, 2019, the Company’s future debt principal payment obligations for the respective fiscal years were as follows:
|
|
|
Debt |
|
|
|
(In millions) |
|
(Principal only) |
|
|
|
2020 |
|
$ |
10.7 |
|
|
2021 |
|
|
8.7 |
|
|
2022 |
|
|
8.8 |
|
|
2023 |
|
|
8.7 |
|
|
2024 |
|
|
8.8 |
|
|
Thereafter |
|
|
256.2 |
|
|
Total |
|
$ |
301.9 |
|
69
The provision for income taxes consisted of the following:
|
|
Year Ended |
|
||||||||||||
|
|
December 27, |
|
|
December 28, |
|
|
December 29, |
|
||||||
|
(In millions) |
2019 |
|
|
2018 |
|
|
2017 |
|
||||||
|
Current: |
|
|
|
|
|
|
|
|
|
|
|
|
|
|
|
Federal |
$ |
|
0.1 |
|
|
$ |
|
2.3 |
|
|
$ |
|
3.7 |
|
|
State |
|
|
0.1 |
|
|
|
|
0.7 |
|
|
|
|
0.2 |
|
|
Foreign |
|
|
12.3 |
|
|
|
|
12.2 |
|
|
|
|
11.7 |
|
|
Total current |
|
|
12.5 |
|
|
|
|
15.2 |
|
|
|
|
15.6 |
|
|
Deferred: |
|
|
|
|
|
|
|
|
|
|
|
|
|
|
|
Federal |
|
|
(0.1 |
) |
|
|
|
0.2 |
|
|
|
|
(5.5 |
) |
|
State |
|
|
0.7 |
|
|
|
|
0.1 |
|
|
|
|
0.2 |
|
|
Foreign |
|
|
(3.1 |
) |
|
|
|
(0.2 |
) |
|
|
|
1.6 |
|
|
Total deferred |
|
|
(2.5 |
) |
|
|
|
0.1 |
|
|
|
|
(3.7 |
) |
|
Total provision |
$ |
|
10.0 |
|
|
$ |
|
15.3 |
|
|
$ |
|
11.9 |
|
Income before provision for income taxes was generated from the following geographic areas:
|
|
Year Ended |
|
||||||||||||
|
|
December 27, |
|
|
December 28, |
|
|
December 29, |
|
||||||
|
(In millions) |
2019 |
|
|
2018 |
|
|
2017 |
|
||||||
|
United States |
$ |
|
(49.7 |
) |
|
$ |
|
(5.0 |
) |
|
$ |
|
8.9 |
|
|
Foreign |
|
|
52.0 |
|
|
|
|
57.3 |
|
|
|
|
78.1 |
|
|
Total pretax income |
$ |
|
2.3 |
|
|
$ |
|
52.3 |
|
|
$ |
|
87.0 |
|
The effective tax rate differs from the U.S. federal statutory tax rate as follows:
|
|
|
Year Ended |
|
|
|||||||||||
|
|
|
December 27, |
|
|
|
December 28, |
|
|
|
December 29, |
|
|
|||
|
|
|
2019 |
|
|
|
2018 |
|
|
|
2017 |
|
|
|||
|
Federal income tax provision at statutory rate |
|
|
21.0 |
|
% |
|
|
21.0 |
|
% |
|
|
35.0 |
|
% |
|
State income taxes, net of federal benefit |
|
|
(99.5 |
) |
% |
|
|
2.0 |
|
% |
|
|
0.3 |
|
% |
|
Effect of foreign operations |
|
|
(85.3 |
) |
% |
|
— |
|
% |
|
|
(18.7 |
) |
% |
|
|
Change in valuation allowance |
|
|
552.7 |
|
% |
|
|
(0.1 |
) |
% |
|
|
(19.8 |
) |
% |
|
Foreign income inclusions |
|
|
34.5 |
|
% |
|
|
2.1 |
|
% |
|
— |
|
% |
|
|
Adjustment for changes in tax law |
|
— |
|
% |
|
|
3.6 |
|
% |
|
|
15.8 |
|
% |
|
|
Other |
|
|
(7.5 |
) |
% |
|
|
0.7 |
|
% |
|
|
1.0 |
|
% |
|
Effective Tax Rate |
|
|
415.9 |
|
% |
|
|
29.3 |
|
% |
|
|
13.6 |
|
% |
70
Significant components of deferred tax assets and liabilities are as follows:
|
|
|
Year Ended |
|
|||||||
|
|
|
December 27, |
|
|
December 28, |
|
||||
|
(In millions) |
|
2019 |
|
|
2018 |
|
||||
|
Deferred tax assets: |
|
|
|
|
|
|
|
|
|
|
|
Inventory valuation and basis difference |
|
$ |
|
3.4 |
|
|
$ |
|
3.3 |
|
|
State taxes |
|
|
|
0.5 |
|
|
|
|
0.4 |
|
|
Stock compensation |
|
|
|
1.7 |
|
|
|
|
1.7 |
|
|
Operating lease liabilities |
|
|
|
9.0 |
|
|
|
— |
|
|
|
Interest expense limitation |
|
|
|
5.8 |
|
|
|
|
0.1 |
|
|
Intangibles |
|
|
|
7.8 |
|
|
|
|
6.3 |
|
|
Net operating losses |
|
|
|
6.4 |
|
|
|
|
2.2 |
|
|
Tax credits |
|
|
|
2.2 |
|
|
|
|
0.6 |
|
|
Other timing differences |
|
|
|
4.5 |
|
|
|
|
3.3 |
|
|
|
|
|
|
41.3 |
|
|
|
|
17.9 |
|
|
Valuation allowance |
|
|
|
(25.8 |
) |
|
|
|
(7.7 |
) |
|
Total deferred tax assets |
|
|
|
15.5 |
|
|
|
|
10.2 |
|
|
Deferred tax liabilities: |
|
|
|
|
|
|
|
|
|
|
|
Undistributed earnings |
|
|
|
(0.5 |
) |
|
|
|
(2.5 |
) |
|
Operating lease right-of-use assets |
|
|
|
(7.2 |
) |
|
|
— |
|
|
|
Depreciation |
|
|
|
(3.3 |
) |
|
|
|
(6.4 |
) |
|
Intangibles |
|
|
|
(5.8 |
) |
|
|
— |
|
|
|
Goodwill |
|
|
|
(8.4 |
) |
|
|
|
(6.9 |
) |
|
Total deferred tax liabilities |
|
|
|
(25.2 |
) |
|
|
|
(15.8 |
) |
|
Net deferred tax liabilities |
|
$ |
|
(9.7 |
) |
|
$ |
|
(5.6 |
) |
The Company earns a significant amount of its operating income outside the United States, which is deemed to be indefinitely reinvested in foreign jurisdictions, except as disclosed below. As a result, most of the Company’s cash and cash equivalents are held by foreign subsidiaries. During 2019, the Company remitted earnings from its Singapore and Chinese subsidiaries. The Company currently does not intend nor foresee a need to repatriate any other funds to the U.S. other than possibly from its Singapore subsidiary. The Company expects domestic cash and cash flows from operations to continue to be sufficient to fund its domestic operating activities and cash commitments for investing and financing activities, such as debt repayment and capital expenditures, for the foreseeable future. If the Company should require more capital in the U.S. than is generated by its domestic operations, for example to fund significant discretionary activities such as business acquisitions, the Company could raise capital in the United States through debt or equity issuances. These alternatives could result in higher effective tax rates, increased interest expense, or dilution of our earnings. The Company has borrowed funds domestically and continues to believe it has the ability to do so at reasonable interest rates. The Company does not provide for U.S. taxes on its undistributed earnings of foreign subsidiaries that it intends to invest indefinitely outside the U.S., unless such taxes are otherwise required under U.S. tax law. In 2017, the Company determined that a portion of the current year earnings of one of its China subsidiaries may be remitted in the future to one of its foreign subsidiaries outside of mainland China and, accordingly, the Company provided for the related withholding taxes in its consolidated financial statements. A portion of those earnings from China were remitted to the U.S. in 2019. As of December 27, 2019, the Company had undistributed earnings of foreign subsidiaries that are indefinitely invested outside of the U.S. of approximately $217.0 million. If the Company were to distribute these earnings to the United States, these earnings could be subject to withholding taxes in the countries where the cash was earned.
The Company’s gross liability for unrecognized tax benefits as of December 27, 2019 and December 28, 2018 was $1.0 million and $1.0 million, respectively. Increases or decreases to interest and penalties on uncertain tax positions are included in the income tax provision in the Consolidated Statements of Operations. Interest related to uncertain tax positions for the periods ended December 27, 2019, December 28, 2018 and December 29, 2017 were $0.3 million, $0.1 million, and $0.0 million, respectively. Although it is possible some of the unrecognized tax benefits could be settled within the next twelve months, the Company cannot reasonably estimate the outcome at this time.
71
As of December 28, 2019, the Company had California net operating loss carryforwards (“NOLs”) of approximately $32.9 million. The California NOLs begin expiring after 2031.
The Company files income tax returns in the U.S. federal jurisdiction, various states and foreign jurisdictions. The Company’s 2016 through 2018 federal income tax returns are open to audit through the statute of limitations by the Internal Revenue Service. The Company’s 2015 through 2018 state income tax returns are open to audit by the California Franchise Tax Board. The Company is also subject to examination in various other jurisdictions for various periods.
Effective January 1, 2018, the Tax Act Cuts and Jobs created a new requirement to include in U.S. income global intangible low-taxed income (GILTI) earned by controlled foreign corporations (“CFC”). The effect of GILTI, and the associated foreign tax credit, is to effectively create a minimum floor of taxation on CFC profits that must be included currently in the gross income of the CFCs’ U.S. shareholder. Under GAAP, we are allowed to make an accounting policy choice of either (1) treating taxes due on future U.S. inclusions related to GILTI as a current-period expense when incurred (the “period cost method”) or (2) factoring such amounts into a company’s measurement of its deferred taxes (the “deferred method”). The Company uses the period cost method in recording the tax effects of GILTI in its financial statements.
8. RETIREMENT PLANS
Defined Benefit Plan
Cinos Korea has a noncontributory defined benefit pension plan covering substantially all of its employees upon their retirement. The benefits are based on expected years of service and average compensation. The net period costs are recognized as employees render the services necessary to earn the postretirement benefits. The Company records annual amounts relating to the pension plan based on calculations that incorporate various actuarial and other assumptions, including discount rates, mortality, assumed rates of return, compensation increases and turnover rates. The Company reviews its assumptions on an annual basis and makes modifications to the assumptions based on current and expected rates return and trends when it is appropriate to do so. The effect of modifications to those assumptions is recorded in accumulated other comprehensive income and amortized to net periodic cost over future periods using the corridor method. The Company believes that the assumptions utilized in recording its obligations under the plan are reasonable based on its experience and market conditions.
As of December 27, 2019, the benefit obligation of the plan is $7.8 million and the fair value of the benefit plan assets, which are invested in several fixed deposit accounts with a bank is $3.9 million. As of December 27, 2019, the unfunded balance of the plan of $4.4 million has been accrued for by the Company and is included in other long-term liabilities. Amounts recognized in accumulated other comprehensive income as of December 27, 2019 is $1.7 million. The contributions to the plan by the Company and its subsidiaries during the year ended December 27, 2019 was $0.6 million. The benefits expected to be paid from the pension plan in each year from 2020-2024 are $1.1 million, $1.1 million, $2.3 million, $0.9 million and $1.0 million, respectively. The aggregate benefits expected to be paid in the five years from 2025-2029 are $4.7 million.
72
Employee Savings and Retirement Plan
The Company sponsors a 401(k) savings and retirement plan (the “401(k) Plan”) for all US employees who meet certain eligibility requirements. Participants could elect to contribute to the 401(k) Plan, on a pre-tax basis, up to 25.0% of their salary to a maximum of IRS limit. The Company may make matching contributions of up to 3.0% of employee contributions based upon eligibility. The Company made discretionary employer contributions of approximately $2.3 million, $1.2 million and $1.2 million to the 401(k) Plan in 2019, 2018 and 2017, respectively.
9. COMMITMENTS AND CONTINGENCIES
Commitment
The Company had commitments to purchase inventory totaling approximately $139.9 million at December 27, 2019.
Contingency
From time to time, the Company is subject to various legal proceedings and claims, either asserted or unasserted, that arise in the ordinary course of business. Although the outcome of the various legal proceedings and claims individually or in the aggregate cannot be predicted with certainty, the Company has not had a history of outcomes to date that have been material to the statement of operations and does not believe that any of these proceedings or other claims will have a material adverse effect on its consolidated financial condition, results of operations or cash flows.
10. STOCKHOLDERS’ EQUITY AND NONCONTROLLING INTERESTS
Common Stock Offering
In February 2018, the Company completed an underwritten public offering of 4,761,905 shares of its common stock with net proceeds of approximately $94.3 million, after deducting the underwriting discounts and offering expenses of $0.7 million.
Noncontrolling Interests
QGT owns 51.0% of the outstanding shares of Cinos Korea that provides outsourced cleaning and recycling of precision parts for the semiconductor industry through its operating facilities in South Korea and, through a 60.0% interest in a joint venture with Cinos China. QGT is obligated to purchase shares held by two other shareholders of Cinos Korea representing a combined 35.0% interest. QGT accounted for this unconditional obligation as an assumed liability and derecognized any noncontrolling interest related to the 35%, which brings its controlling interest up to 86%.
The carrying value of the remaining 14.0% interest held by others in Cinos Korea and the 40.0% interest in the China joint venture are presented as noncontrolling interests in the accompanying consolidated financial statements. The fair values of the noncontrolling interests were estimated based on the values of Cinos Korea and Cinos China on a 100.0% basis. The values were calculated based on the pro-rata portion of total 2019 QGT earnings before interest expense, taxes, depreciation and amortization ("EBITDA") contributed by each entity. Management indicated that each entity's pro-rata portion of EBITDA was reasonably reflective of each entity's invested capital value at the acquisition date.
The Company is obligated to purchase shares owned by a Cinos Korea shareholder at a fixed price per share, while the purchase price per share for the other shareholder is the greater of the then fair value of the stock and the fixed price per share (floor). The Company has a firm obligation to purchase the shares and a call option, while the two shareholders have a put option. Accordingly, the fair value of the obligation of $6.8 million has been recorded as a non-current liability in the accompanying consolidated balance sheets and represents a Level 3 measurement as discussed in Note 1 of the Company’s Consolidated Financial Statements. The agreement with Cinos Korea allows for the purchase obligation to become due in December 2022, and once completed, the Company will own 86% of Cinos Korea.
73
Employee Stock Plans
The Company maintains plans which allow for the issuance of equity-based awards to executives and certain employees. These equity-based awards include stock options, restricted stock awards and restricted stock units. The Company also maintains an employee stock purchase plan (“ESPP”) that provides for the issuance of shares to all eligible employees of the Company at a discounted price.
The estimated fair value of the Company’s equity-based awards, net of expected forfeitures, is amortized over the awards’ vesting period on a straight-line basis over a weighted average period of four years for stock options, three years for restricted stock units and one year for restricted stock awards and will be adjusted for subsequent changes in estimated forfeitures and future option grants.
The Company uses historical data to estimate pre-existing forfeitures, and records stock-based compensation for those awards that are expected to vest at the time of grant and revises those estimates in subsequent periods if actual forfeitures differ from those estimates.
On February 20, 2003, the Company adopted the 2003 Stock Incentive Plan (the “2003 Incentive Plan”) which was subsequently amended and restated. The Company has reserved 4,515,239 shares of its common stock for issuance under the 2003 Incentive Plan. The stockholders of the Company approved an increase in the number of shares available for issuance under our amended and restated stock incentive plan by 2.3 million and 2.7 million in 2019 and 2017, respectively. At December 27, 2019, 1,299,197 shares were available for future grants under the 2003 Incentive Plan.
There were no employee stock option grants by the Company for years 2019, 2018 and 2017. During fiscal years 2019, 2018 and 2017, the Company recorded $12.1 million, $10.3 million and $7.8 million, respectively, of stock-based compensation expense, associated with the 2003 Incentive Plan. As of December 27, 2019, there was $15.5 million, net of forfeitures of $2.4 million, of unrecognized compensation cost related to employee and director stock which is expected to be recognized on a straight-line basis over a weighted average period of approximately 1.8 years, and will be adjusted for subsequent changes in estimated forfeitures and future grants.
Total stock-based compensation during the fiscal years 2019, 2018 and 2017, respectively, in various expense categories was as follows:
|
|
Year Ended |
|
|||||||||
|
|
December 27, |
|
|
December 28, |
|
|
December 29, |
|
|||
|
(In millions) |
2019 |
|
|
2018 |
|
|
2017 |
|
|||
|
Cost of revenues (1) |
$ |
2.4 |
|
|
$ |
2.1 |
|
|
$ |
1.5 |
|
|
Research and development |
|
0.3 |
|
|
|
0.1 |
|
|
|
0.2 |
|
|
Sales and marketing |
|
1.3 |
|
|
|
1.0 |
|
|
|
0.6 |
|
|
General and administrative |
|
8.1 |
|
|
|
7.1 |
|
|
|
5.5 |
|
|
|
|
12.1 |
|
|
|
10.3 |
|
|
|
7.8 |
|
|
Income tax benefit |
— |
|
|
|
(3.0 |
) |
|
|
(0.9 |
) |
|
|
Net stock-based compensation expense |
$ |
12.1 |
|
|
$ |
7.3 |
|
|
$ |
6.9 |
|
|
(1) |
Stock-based compensation expenses capitalized in inventory for fiscal years 2019, 2018 and 2017 were considered immaterial. |
2003 Amended and Restated Stock Incentive Plan
Options
The 2003 Incentive Plan provides for the issuance of options and other stock-based awards. Options are generally granted at fair value at the date of grant as determined by the Board of Directors and have terms up to ten years and generally vest over four years.
74
Option activity under the 2003 Incentive Plan is as follows:
|
|
|
|
|
|
|
|
|
|
|
Weighted |
|
|
|
|
|
|
|
|
|
|
|
|
|
Weighted |
|
|
Average |
|
|
Aggregate |
|
|||
|
|
|
|
|
|
|
Average |
|
|
Remaining |
|
|
Intrinsic |
|
|||
|
|
|
Shares |
|
|
Exercise |
|
|
Contractual |
|
|
Value |
|
||||
|
|
|
(in thousands) |
|
|
Price |
|
|
Life |
|
|
(in thousands) |
|
||||
|
Outstanding, December 30, 2016 |
|
|
136.4 |
|
|
$ |
13.15 |
|
|
0.57 |
|
|
$ |
135.0 |
|
|
|
Exercised |
|
|
(113.4 |
) |
|
13.96 |
|
|
|
|
|
|
|
|
|
|
|
Cancelled |
|
|
(13.8 |
) |
|
|
14.56 |
|
|
|
|
|
|
|
|
|
|
Outstanding, December 29, 2017 |
|
|
9.2 |
|
|
$ |
1.17 |
|
|
1.24 |
|
|
$ |
203.0 |
|
|
|
Exercised |
|
|
(5.0 |
) |
|
1.17 |
|
|
|
|
|
|
|
|
|
|
|
Outstanding, December 28, 2018 |
|
|
4.2 |
|
|
$ |
1.17 |
|
|
0.24 |
|
|
$ |
30.0 |
|
|
|
Exercised |
|
|
(4.2 |
) |
|
$ |
1.17 |
|
|
|
|
|
|
|
|
|
|
Outstanding, December 27, 2019 |
|
|
- |
|
|
$ |
— |
|
|
|
- |
|
|
$ |
— |
|
|
Options exercisable and expected to vest, December 27, 2019 |
|
|
- |
|
|
$ |
— |
|
|
|
- |
|
|
$ |
— |
|
There was no stock-based compensation expense for fiscal year 2019, 2018 and 2017 attributable to stock options as all outstanding options were fully vested at the beginning of the 2014 fiscal year.
Restricted Stock Units and Restricted Stock Awards
In fiscal years 2019, 2018 and 2017, the Company granted 69,783, 38,010 and 45,000 shares, respectively, of common stock to its board members under the 2003 Incentive Plan. These Restricted Share Awards (RSAs) vest on the earlier of 1) the next Annual Shareholder Meeting, or 2) 365 days from date of grant. The total unamortized expense of the Company’s unvested RSAs as of December 27, 2019, is approximately $0.4 million. During the first quarter of fiscal year 2008, the Company began granting stock awards in the forms of Restricted Stock Units (RSUs) and Performance Stock Units (PSUs) to its employees as part of the Company’s long term equity compensation plan. These stock awards are granted to employees with a unit purchase price of zero dollars and typically vest over three years, subject to the employee’s continued service with the Company and, in the case of PSUs, subject to achieving certain performance goals. The expected cost of the grant is recognized over the service period, and is reduced for estimated forfeitures and, in the case of PSUs, is reduced based on estimated achievement of performance goals. During the year ended December 27, 2019, the Company approved and granted 883,837 RSU’s to employees with a weighted average grant date fair value of $12.58 per share and 144,183 PSUs with a weighted average grant date fair value of $12.03 per share. As of December 27, 2019, $15.1 million of unrecognized stock-based compensation cost, net of estimated forfeitures, related to RSUs remains to be amortized and is expected to be recognized over an estimated period of 1.8 years. The unvested amount is subject to forfeiture, until fully vested. At December 27, 2019, 1,790,786 shares were subject to forfeiture.
75
The following table summarizes the Company’s restricted stock unit and restricted stock award activity through the year ended December 27, 2019:
|
|
|
|
|
|
|
Aggregate |
|
|
|
|
|
|
|
|
|
Intrinsic |
|
|
|
|
|
Number of |
|
|
Value |
|
||
|
|
|
Shares |
|
|
(in millions) |
|
||
|
Unvested restricted stock units and restricted stock awards at December 29, 2017 |
|
|
1.7 |
|
|
$ |
38.7 |
|
|
Granted |
|
|
1.1 |
|
|
|
|
|
|
Vested |
|
|
(0.8 |
) |
|
|
|
|
|
Forfeited |
|
|
(0.2 |
) |
|
|
|
|
|
Unvested restricted stock units and restricted stock awards at December 28, 2018 |
|
|
1.8 |
|
|
$ |
14.6 |
|
|
Granted |
|
|
1.1 |
|
|
|
|
|
|
Vested |
|
|
(0.9 |
) |
|
|
|
|
|
Forfeited |
|
|
(0.2 |
) |
|
|
|
|
|
Unvested restricted stock units and restricted stock awards at December 27, 2019 |
|
|
1.8 |
|
|
$ |
41.9 |
|
|
Vested and expected to vest restricted stock units and restricted stock awards |
|
|
1.6 |
|
|
$ |
37.3 |
|
Employee Stock Purchase Plan
In 2004 the Company adopted an Employee Stock Purchase Plan (“ESPP”) and is authorized to issue 555,343 shares of common stock under the ESPP. The ESPP permits employees to purchase common stock at a discount through payroll withholdings at certain specified dates (purchase period) within a defined offering period. The purchase price is 95% of the fair market value of the common stock at the end of the purchase period and is intended to qualify as an “employee stock purchase plan” under Section 423 of the Internal Revenue Code. There were 21,161 shares issued under the ESPP during the year ended December 27, 2019.
12. REVENUE RECOGNITION
Revenue is recognized when control of the promised goods or services is transferred to the Company’s customers, in an amount that reflects the consideration the Company expects to be entitled to in exchange for those goods or services. The Company assesses collectability based on the credit worthiness of the customer and past transaction history. The Company performs on-going credit evaluations of customers and generally does not require collateral from customers.
The Company sells its products and services primarily to customers in the semiconductor capital equipment industry. The Company’s revenues are highly concentrated, and we are therefore highly dependent upon a small number of customers. Typical payment terms with our customers range from thirty to sixty days.
The Company’s SPS segment provides warranty on its products for a period of up to two years and provides for warranty costs at the time of sale based on historical activity. Determination of the warranty reserve requires the Company to make estimates of product return rates and expected costs to repair or replace the products under warranty. If actual return rates and/or repair and replacement costs differ significantly from these estimates, adjustments to recognize additional cost of goods sold may be required in future periods. The warranty reserve is included in other current liabilities on the Condensed Consolidated Balance Sheets and are not considered significant.
76
The Company’s products are manufactured at our facilities in the U.S.A., China, Singapore and the Czech Republic. The Company provides services from operations in the U.S.A., Singapore, United Kingdom, Israel, Taiwan, South Korea, and China. Sales to customers are initiated through a purchase order and are governed by our standard terms and conditions, written agreements, or both. Revenue is recognized when performance obligations under the terms of an agreement with a customer are satisfied; generally, this occurs with the transfer of control of the products or when the Company provides the services. Transfer of control occurs at a specific point-in-time. Based on the enforceable rights included in our agreements or prevailing terms and conditions, products produced by the Company without an alternative use are not protected by an enforceable right of payment that includes a reasonable profit throughout the duration of the agreement. Consignment sales are recognized in revenue at the earlier of the period that the goods are consumed or after a period of time subsequent to receipt by the customer as specified by terms of the agreement, provided control of the promised goods or services has transferred.
Revenue is measured as the amount of consideration we expect to receive in exchange for transferring goods or providing services. Sales, value-add, and other taxes we collect concurrent with revenue-producing activities are excluded from revenue. Certain of our customers may receive cash-based incentives, such as rebates or credits, which are accounted for as variable consideration. We estimate these amounts based on the expected amount to be provided to customers and reduce revenues recognized. As of December 27, 2019, an accrual for unpaid customer rebates of $1.7 million is included in accrued expenses on the Company’s Consolidated Balance Sheet. The Company's disaggregated revenues are by segments.
The Company’s principal markets include America, Asia and Europe. The Company’s foreign operations are conducted primarily through its subsidiaries in China, Singapore, Israel, Taiwan, South Korea, United Kingdom and the Czech Republic. Below sales by geographic area represent sales to unaffiliated customers and are based upon the location to which the products were shipped or services performed. The following table sets forth revenue by geographic area (in millions):
|
|
|
Year Ended |
|
|||||||||
|
|
|
December 27, |
|
|
December 28, |
|
|
December 29, |
|
|||
|
|
|
2019 |
|
|
2018 |
|
|
2017 |
|
|||
|
United States |
|
$ |
546.2 |
|
|
$ |
602.2 |
|
|
$ |
512.2 |
|
|
Singapore |
|
|
302.1 |
|
|
|
315.3 |
|
|
|
287.9 |
|
|
Korea |
|
|
68.2 |
|
|
|
45.6 |
|
|
|
30.1 |
|
|
Austria |
|
|
47.7 |
|
|
|
58.1 |
|
|
|
34.5 |
|
|
Taiwan |
|
|
44.4 |
|
|
|
22.6 |
|
|
|
17.8 |
|
|
China |
|
|
35.3 |
|
|
|
42.1 |
|
|
|
36.9 |
|
|
Others |
|
|
22.3 |
|
|
|
10.6 |
|
|
|
5.0 |
|
|
Total |
|
$ |
1,066.2 |
|
|
$ |
1,096.5 |
|
|
$ |
924.4 |
|
13. LEASES
The Company leases offices, facilities and equipment in locations throughout the United States, Asia and Europe. Leases with an initial term of 12 months or less are not recorded on the balance sheet.
Right-of-use assets represent right to use an underlying asset for the lease term and lease liabilities represent obligation to make lease payments arising from the lease. ROU assets and liabilities are based on the estimated present value of lease payments over the lease term and are recognized at the lease commencement date.
77
The Company’s leases do not provide an implicit rate, thus the Company uses an estimated incremental borrowing rate in determining the present value of lease payments. The Company used an estimated incremental borrowing rate of 7.0%, which is derived from information available at the lease commencement date.
|
(Dollars in millions) |
|
Twelve months ended December 27, 2019 |
|
|
|
Operating lease cost |
|
$ |
13.8 |
|
|
Short-term lease cost |
|
|
1.1 |
|
|
Sublease income |
|
|
(0.2 |
) |
|
Total lease cost |
|
$ |
14.7 |
|
|
|
|
|
|
|
|
Operating cash flows from operating leases |
|
$ |
17.3 |
|
|
Weighted-average remaining lease term – operating leases |
|
|
2.4 |
|
|
Weighted-average discount rate – operating leases |
|
|
7.0 |
% |
|
(In millions) |
|
Operating Leases |
|
|
|
2020 |
|
$ |
15.1 |
|
|
2021 |
|
|
11.4 |
|
|
2022 |
|
|
9.3 |
|
|
2023 |
|
|
4.4 |
|
|
2024 |
|
|
2.7 |
|
|
Thereafter |
|
|
6.3 |
|
|
Total minimum lease payments |
|
|
49.2 |
|
|
Less: imputed interest |
|
|
7.2 |
|
|
Lease liability |
|
$ |
42.0 |
|
14. NET INCOME PER SHARE
The following is a reconciliation of the numerators and denominators used in computing basic and diluted net income per share:
|
|
|
Year Ended |
|
|||||||||
|
|
|
December 27, |
|
|
December 28, |
|
|
December 29, |
|
|||
|
(In millions, except share amounts) |
|
2019 |
|
|
2018 |
|
|
2017 |
|
|||
|
Numerator: |
|
|
|
|
|
|
|
|
|
|
|
|
|
Net income (loss) attributable to UCT |
|
$ |
(9.4 |
) |
|
$ |
36.6 |
|
|
$ |
75.1 |
|
|
Denominator: |
|
|
|
|
|
|
|
|
|
|
|
|
|
Shares used in computation — basic: |
|
|
|
|
|
|
|
|
|
|
|
|
|
Weighted average common shares outstanding |
|
|
39.5 |
|
|
|
38.4 |
|
|
|
33.4 |
|
|
Shares used in computation — diluted: |
|
|
|
|
|
|
|
|
|
|
|
|
|
Weighted average common shares outstanding |
|
|
39.5 |
|
|
|
38.4 |
|
|
|
33.4 |
|
|
Dilutive effect of common shares outstanding subject to repurchase |
|
|
0.0 |
|
|
|
0.5 |
|
|
|
0.9 |
|
|
Dilutive effect of options outstanding |
|
|
0.0 |
|
|
|
0.0 |
|
|
|
0.0 |
|
|
Shares used in computing diluted net income (loss) per share |
|
|
39.5 |
|
|
|
38.9 |
|
|
|
34.3 |
|
|
Net income (loss) per share attributable to UCT — basic |
|
$ |
(0.24 |
) |
|
$ |
0.95 |
|
|
$ |
2.25 |
|
|
Net income (loss) per share attributable to UCT — diluted |
|
$ |
(0.24 |
) |
|
$ |
0.94 |
|
|
$ |
2.19 |
|
78
Historically, the Company has operated under one operating segment. However, as a result of the acquisition of QGT, the Company created an additional segment in the first quarter of 2019. The Company reorganized its organizational and reporting structure to capture efficiencies and operating leverage from the Company’s recent acquisition and now operates and reports results for two operating segments: Semiconductor Products and Solutions (“SPS”) and Semiconductor Services Business (“SSB”). These segments are organized primarily by the nature of the products and service they provide. The Company’s Chief Executive Officer (chief operating decision maker) views and evaluates operations based on the results of each of the reportable segments. The following table describes each segment:
|
Segment |
|
Product or Services |
|
Markets Served |
|
Geographic Areas |
|
SPS |
|
Assembly Weldments Machining Fabrication |
|
Semiconductor |
|
United States Asia Europe |
|
SSB |
|
Cleaning Analytics |
|
Semiconductor |
|
United States Asia Europe |
The Company uses segment profit or loss as the primary measure of profitability to evaluate operating performance and to allocate capital resources. Segment profit or loss is defined as a segment’s income or loss from continuing operations before other income and income taxes included in the accompanying condensed consolidated statements of operations.
Any intercompany sales and associated profit (and any other intercompany items) are eliminated from segment results. There were no significant intercompany eliminations for the periods presented.
|
|
|
Fiscal Year End |
|
|||||||||
|
|
|
December 27, |
|
|
December 28, |
|
|
December 29, |
|
|||
|
(In millions) |
|
2019 |
|
|
2018 |
|
|
2017 |
|
|||
|
Revenues: |
|
|
|
|
|
|
|
|
|
|
|
|
|
SPS |
|
$ |
840.8 |
|
|
$ |
1,015.5 |
|
|
$ |
924.4 |
|
|
SSB |
|
|
225.4 |
|
|
|
81.0 |
|
|
|
— |
|
|
Total segment revenues |
|
$ |
1,066.2 |
|
|
$ |
1,096.5 |
|
|
$ |
924.4 |
|
|
|
|
|
|
|
|
|
|
|
|
|
|
|
|
Gross profit: |
|
|
|
|
|
|
|
|
|
|
|
|
|
SPS |
|
$ |
121.8 |
|
|
$ |
150.3 |
|
|
$ |
167.7 |
|
|
SSB |
|
$ |
75.0 |
|
|
$ |
25.5 |
|
|
$ |
— |
|
|
Total segment gross profit |
|
$ |
196.8 |
|
|
$ |
175.8 |
|
|
$ |
167.7 |
|
|
|
|
|
|
|
|
|
|
|
|
|
|
|
|
Operating profit: |
|
|
|
|
|
|
|
|
|
|
|
|
|
SPS |
|
$ |
18.3 |
|
|
$ |
52.3 |
|
|
$ |
89.5 |
|
|
SSB |
|
|
11.6 |
|
|
|
8.4 |
|
|
|
— |
|
|
Total segment operating profit |
|
$ |
29.9 |
|
|
$ |
60.7 |
|
|
$ |
89.5 |
|
|
|
|
|
|
|
|
|
|
|
|
|
|
|
|
|
|
|
|
|
|
December 27, |
|
|
December 28, |
|
||
|
(In millions) |
|
|
|
|
|
2019 |
|
|
2018 |
|
||
|
Assets |
|
|
|
|
|
|
|
|
|
|
|
|
|
SPS |
|
|
|
|
|
$ |
828.0 |
|
|
$ |
803.7 |
|
|
SSB |
|
|
|
|
|
|
191.3 |
|
|
|
161.8 |
|
|
Total segment assets |
|
|
|
|
|
$ |
1,019.3 |
|
|
$ |
965.5 |
|
79
16. UNAUDITED QUARTERLY FINANCIAL RESULTS
The following table sets forth statement of operations data for the periods indicated. The information for each of these periods is unaudited and has been prepared on the same basis as our audited consolidated financial statements included herein and includes all adjustments, consisting only of normal recurring adjustments that we consider necessary for a fair presentation of our unaudited operations data for the periods presented. Historical results are not necessarily indicative of the results to be expected in the future:
|
|
|
First |
|
|
Second |
|
|
Third |
|
|
Fourth |
|
|
Fiscal |
|
||||||||||
|
(In million, except per share data) |
|
Quarter |
|
|
Quarter |
|
|
Quarter |
|
|
Quarter |
|
|
Year (1) |
|
||||||||||
|
2019 |
|
|
|
|
|
|
|
|
|
|
|
|
|
|
|
|
|
|
|
|
|
|
|
|
|
|
Revenues |
|
$ |
|
260.1 |
|
|
$ |
|
265.4 |
|
|
$ |
|
254.3 |
|
|
$ |
|
286.4 |
|
|
$ |
|
1,066.2 |
|
|
Gross profit |
|
$ |
|
44.8 |
|
|
$ |
|
48.2 |
|
|
$ |
|
47.5 |
|
|
$ |
|
56.3 |
|
|
$ |
|
196.8 |
|
|
Net income (loss) |
|
$ |
|
0.6 |
|
|
$ |
|
(0.2 |
) |
|
$ |
|
0.5 |
|
|
$ |
|
(10.3 |
) |
|
$ |
|
(9.4 |
) |
|
Earnings (loss) per share — basic |
|
$ |
|
0.02 |
|
|
$ |
|
(0.01 |
) |
|
$ |
|
0.01 |
|
|
$ |
|
(0.17 |
) |
|
$ |
|
(0.24 |
) |
|
Earnings (loss) per share — diluted |
|
$ |
|
0.02 |
|
|
$ |
|
(0.01 |
) |
|
$ |
|
0.01 |
|
|
$ |
|
(0.17 |
) |
|
$ |
|
(0.24 |
) |
|
2018 |
|
|
|
|
|
|
|
|
|
|
|
|
|
|
|
|
|
|
|
|
|
|
|
|
|
|
Revenues |
|
$ |
|
314.8 |
|
|
$ |
|
290.2 |
|
|
$ |
|
234.1 |
|
|
$ |
|
257.4 |
|
|
$ |
|
1,096.5 |
|
|
Gross profit |
|
$ |
|
48.8 |
|
|
$ |
|
46.1 |
|
|
$ |
|
35.0 |
|
|
$ |
|
45.9 |
|
|
$ |
|
175.8 |
|
|
Net income (loss) |
|
$ |
|
24.7 |
|
|
$ |
|
19.0 |
|
|
$ |
|
(6.00 |
) |
|
$ |
|
(1.10 |
) |
|
$ |
|
36.6 |
|
|
Earnings (loss) per share — basic |
|
$ |
|
0.67 |
|
|
$ |
|
0.49 |
|
|
$ |
|
(0.15 |
) |
|
$ |
|
(0.03 |
) |
|
$ |
|
0.95 |
|
|
Earnings (loss) per share — diluted |
|
$ |
|
0.66 |
|
|
$ |
|
0.48 |
|
|
$ |
|
(0.15 |
) |
|
$ |
|
(0.03 |
) |
|
$ |
|
0.94 |
|
|
(1) |
Earnings per share is calculated independently each quarter and for the full year based upon their respective weighted average shares outstanding. Therefore, the sum of the quarterly earnings per share may not equal the annual earnings per share reported. |
17. SUBSEQUENT EVENTS
Subsequent to December 27, 2019, the World Health Organization declared the novel coronavirus outbreak a public health emergency. The outbreak caused the Chinese government to place restrictions on travel and other activities throughout the country. The Company operates facilities in China. In cooperation with the government authorities, the Company’s operations in China extended their Chinese New Year holiday shut down for several weeks. While operations have resumed, the Company may operate at below normal levels due to the continued restrictions on travel in China and labor shortages. Although the Company does not expect the impact on its operations and financial results to be significant in the first quarter of fiscal year 2020, the duration and intensity of the impact of the coronavirus and resulting disruption to the Company’s operations is uncertain. The Company, therefore, cannot reasonably estimate the impact to its financial statements beyond the first quarter of fiscal 2020. The Company will continue to monitor the situation closely and assess the impact on its operations and financial results for the remainder of the year.
80
Not Applicable
Management’s Report on Internal Control Over Financial Reporting
Our management is responsible for establishing and maintaining adequate internal control over financial reporting, as such term is defined in Securities Exchange Act Rules 13a-15(f), including maintenance of (i) records that in reasonable detail accurately and fairly reflect the transactions and dispositions of our assets, and (ii) policies and procedures that provide reasonable assurance that (a) transactions are recorded as necessary to permit preparation of financial statements in accordance with accounting principles generally accepted in the United States of America, (b) our receipts and expenditures are being made only in accordance with authorizations of management and our board of directors and (c) we will prevent or timely detect unauthorized acquisition, use, or disposition of our assets that could have a material effect on the financial statements.
Internal control over financial reporting cannot provide absolute assurance of achieving financial reporting objectives because of the inherent limitations of any system of internal control. Internal control over financial reporting is a process that involves human diligence and compliance and is subject to lapses of judgment and breakdowns resulting from human failures. Internal control over financial reporting also can be circumvented by collusion or improper overriding of controls. As a result of such limitations, there is risk that material misstatements may not be prevented or detected on a timely basis by internal control over financial reporting. However, these inherent limitations are known features of the financial reporting process. Therefore, it is possible to design into the process safeguards to reduce, though not eliminate, this risk.
Under the supervision and with the participation of our management, including our Chief Executive Officer and Chief Financial Officer, we conducted an evaluation of the effectiveness of our internal control over financial reporting based on the criteria established in Internal Control-Integrated Framework (2013) issued by the Committee of Sponsoring Organizations (COSO) of the Treadway Commission.
Our assessment excludes Internal Control over Financial Reporting at Dynamic Manufacturing Solutions, LLC (DMS), which was acquired on April 15, 2019 and whose financial statements constitute 3.0% and 3.3% of the Company’s consolidated total assets (excluding $18.5 million of goodwill and intangible assets, net, which were integrated into the Company’s control environment), and revenues, respectively. We will include this acquired entity in our assessment of the effectiveness of internal controls over financial reporting in fiscal year 2020 annual management report, the annual management report following the first anniversary of the acquisition.
Based on our evaluation under the COSO framework, our management concluded that we did not maintain effective internal control over financial reporting as of December 27, 2019, due to the fact that material weaknesses related to the Semiconductor Services Business (SSB) segment existed in the Company’s internal control over financial reporting as further described below. A material weakness is a deficiency, or a combination of deficiencies, in internal control over financial reporting, such that there is a reasonable possibility that a material misstatement of our annual or interim financial statements will not be prevented or detected on a timely basis.
Our independent registered public accounting firm, Moss Adams LLP, who audited the consolidated financial statements included in this Annual Report on Form 10-K, has expressed an adverse opinion on the operating effectiveness of the Company’s internal control over financial reporting as of December 27, 2019, as stated in their report which appears in this Form 10-K.
Material Weaknesses Identified Relating to Semiconductor Services Business (SSB) Segment
Based on our evaluation under the COSO framework, our management concluded that we did not maintain effective internal control over financial reporting as of December 27, 2019, due to the fact that material weaknesses exist in SSB.
81
In August 2018, we acquired Quantum Global Technologies, LLC, a privately held company (now SSB). During fiscal year 2019, management proceeded to implement control processes and procedures to integrate the acquired business into the overall Company. During fiscal 2019, process improvements were made; however, we have determined that the control environment of SSB lacks the maturity and design effectiveness necessary to comply with the requirements of Sarbanes-Oxley Act of 2002. As of December 27, 2019, management has concluded that due to deficiencies in the design and implementation of business process controls and information technology general controls relating to all relevant accounts and cycles within SSB, material weaknesses exist.
The Company’s Plan to Remediate the Material Weaknesses
The Company, with the oversight from the Audit Committee of the Board of Directors, is committed to remediating the SSB material weaknesses in a timely manner. We have begun the process of executing remediation plans that address the material weaknesses in our internal control over financial reporting. We are engaged in various stages of remedial actions to address the material weaknesses described above. We are using both internal and external resources to assist in the following actions:
|
• |
Assess key business cycles at material SSB locations to ensure that the processes, procedures and controls are adequately designed, clearly documented, standardized, appropriately communicated and executed timely to enhance control ownership throughout SSB. |
|
• |
Strengthen the information technology general controls that support SSB’s critical process areas. |
|
• |
Enhance SSB’s monitoring procedures by implementing new training activities and hiring additional qualified personnel. |
|
• |
Ensure appropriate resources and controls are fully incorporated into the corporate oversight function. |
Disclosure Controls and Procedures
Rule 13a-15 of the Securities and Exchange Act of 1934, as amended, requires that we conduct an evaluation of the effectiveness of our disclosure controls and procedures as of the end of the period covered by this Annual Report, and we have a disclosure policy in furtherance of the same. This evaluation is designed to ensure that all corporate disclosure is complete and accurate in all material respects. The evaluation is further designed to ensure that all information required to be disclosed in our SEC reports is accumulated and communicated to management to allow timely decisions regarding required disclosures and recorded, processed, summarized and reported within the time periods and in the manner specified in the SEC’s rules and forms. Any controls and procedures, no matter how well designed and operated, can provide only reasonable assurance of achieving the desired control objectives. Our Chief Executive Officer and Chief Financial Officer supervise and participate in this evaluation, and they are assisted by our Chief Accounting Officer and other members of our Disclosure Committee.
We conducted the required evaluation, and our Chief Executive Officer and Chief Financial Officer have concluded that our disclosure controls and procedures (as defined by Securities Exchange Act Rule 13a-15(e)) were not effective as of December 27, 2019 to accomplish their objectives at the reasonable assurance level because of the material weaknesses described above.
Notwithstanding such material weaknesses in internal control over financial reporting, our management concluded that our consolidated financial statements in this Annual Report on Form 10-K present fairly, in all material respects, the company’s financial position, results of operations and cash flows as of the dates, and for the periods presented, in conformity with U.S. GAAP.
Changes in Internal Control Over Financial Reporting
Other than the material weaknesses described above, there have been no changes in our internal control over financial reporting during the fiscal quarter ended December 27, 2019 that have materially affected, or are reasonably likely to materially affect, our internal control over financial reporting. Our remediation efforts related to the material weaknesses are ongoing.
None.
82
Pursuant to Paragraph G(3) of the General Instructions to Form 10-K, portions of the information required by Part III of Form 10-K are incorporated by reference from our definitive Proxy Statement to be filed with the SEC in connection with our 2019 Annual Meeting of Stockholders.
The information required by this item concerning directors is incorporated by reference to the section entitled, “Election of Directors” in our Proxy Statement for the 2019 Annual Meeting of Stockholders.
For information with respect to Executive Officers, see Part I, Item 1 of this Annual Report on Form 10-K, under “Executive Officers.”
The information required by this item with respect to Section 16(a) beneficial reporting compliance is incorporated by reference to the section entitled, “Section 16(a) Beneficial Ownership Reporting Compliance” in our Proxy Statement for the 2019 Annual Meeting of Stockholders.
We have adopted a code of ethics that is designed to qualify as a “code of ethics” within the meaning of Section 406 of the Sarbanes-Oxley Act of 2002 and the rules promulgated thereunder. This code of ethics is available on our website at www.uct.com. To the extent required by law, any amendments to, or waivers from, any provision of the code of ethics will be promptly disclosed to the public. To the extent permitted by such legal requirements, we intend to make such public disclosure by posting the relative material on our website in accordance with SEC rules.
The information required by this item regarding the security ownership of certain beneficial owners is incorporated by reference to the sections entitled “Executive Officer Compensation” and “Election of Directors” in our Proxy Statement for the 2019 Annual Meeting of Stockholders.
|
Item 12. |
Security Ownership of Certain Beneficial Owners and Management and Related Stockholder Matters |
The information required by this item is incorporated by reference to the sections entitled “Security Ownership of Certain Beneficial Owners and Management” in our Proxy Statement for the 2019 Annual Meeting of Stockholders.
The table below summarizes our equity plan information as of December 27, 2019:
|
|
|
|
|
|
|
|
(c) (1) |
|
|||||
|
|
|
|
|
|
|
|
Number of Securities |
|
|||||
|
|
|
(a) |
|
|
|
|
Remaining Available |
|
|||||
|
|
|
Number of Securities |
|
|
(b) |
|
for Future Issuance |
|
|||||
|
|
|
to be Issued Upon |
|
|
Weighted-Average |
|
Under Equity |
|
|||||
|
|
|
Exercise/Vest of |
|
|
Exercise Price of |
|
Compensation Plans |
|
|||||
|
|
|
Outstanding Options, |
|
|
Outstanding |
|
(Excluding |
|
|||||
|
(Shares in millions) |
|
Awards |
|
|
Options, Warrants |
|
Securities Reflected |
|
|||||
|
Plan Category |
|
Warrants and Rights |
|
|
and Rights |
|
in Column (a) |
|
|||||
|
Equity compensation plans approved by security holders: |
|
|
|
1.6 |
|
|
$ |
— |
|
|
|
2.2 |
|
|
Equity compensation plans not approved by security holders |
|
|
— |
|
|
|
— |
|
|
— |
|
||
|
Total |
|
|
|
1.6 |
|
|
$ |
— |
|
|
|
2.2 |
|
|
(1) |
Consists of the 2003 Stock Incentive Plan, as amended, and, for purposes of column (c), the Employee Stock Purchase Plan. Since restricted stock units do not have an exercise price, they are excluded from the calculations in column (b) of the table above. |
83
The information required by this item is incorporated by reference to the section entitled “Certain Relationships and Related Party Transactions” in our Proxy Statement for the 2019 Annual Meeting of Stockholders.
The information required by this item is incorporated by reference to the section entitled “Ratification of the Appointment of Our Independent Registered Public Accounting Firm” in our Proxy Statement for the 2019 Annual Meeting of Stockholders.
84
(a) The following documents are filed as part of this Form 10-K:
1. Financial Statements:
|
|
|
Form 10-K Page No. |
|
|
48 |
|
|
|
50 |
|
|
|
51 |
|
|
|
52 |
|
|
|
53 |
|
|
|
54 |
|
|
|
55 |
2. Financial statement schedules not listed have been omitted because they are not applicable or required, or the information required to be set forth therein is included in the Consolidated Financial Statements or Notes thereto.
3. Exhibits
85
|
Exhibit Number |
|
Description |
|
Form |
|
File No. |
|
Filing Date |
|
Exhibit |
|
Filed Herewith |
|
|
|
|
|
|
|
|
|
|
|
|
|
|
|
2.1 |
|
|
8-K |
|
000-50646 |
|
July 25, 2018 |
|
2.1 |
|
|
|
|
|
|
|
|
|
|
|
|
|
|
|
|
|
|
3.1 |
|
Amended and Restated Certificate of Incorporation of Ultra Clean Holdings, Inc. |
|
S-1/A |
|
333-11904 |
|
March 2, 2004 |
|
3.1 |
|
|
|
|
|
|
|
|
|
|
|
|
|
|
|
|
|
3.2 |
|
|
10-Q |
|
000-50646 |
|
May 2, 2016 |
|
3.1 |
|
|
|
|
|
|
|
|
|
|
|
|
|
|
|
|
|
|
4.1 |
|
|
S-1/A |
|
333-11904 |
|
March 8, 2004 |
|
4.1 |
|
|
|
|
|
|
|
|
|
|
|
|
|
|
|
|
|
|
4.2 |
|
Description of Securities Registered Under Section 12 of the Exchange Act |
|
|
|
|
|
|
|
|
|
X |
|
|
|
|
|
|
|
|
|
|
|
|
|
|
|
10.1† |
|
Ultra Clean Holdings, Inc. Amended and Restated Stock Incentive Plan (as amended) |
|
8-K |
|
000-50646 |
|
May 24, 2019 |
|
10.1 |
|
|
|
|
|
|
|
|
|
|
|
|
|
|
|
|
|
10.2† |
|
|
S-1/A |
|
333-11904 |
|
March 8, 2004 |
|
10.6 |
|
|
|
|
|
|
|
|
|
|
|
|
|
|
|
|
|
|
10.3† |
|
|
S-1/A |
|
333-11904 |
|
March 8, 2004 |
|
10.13 |
|
|
|
|
|
|
|
|
|
|
|
|
|
|
|
|
|
|
10.4† |
|
|
10-K |
|
000-50646 |
|
March 12, 2008 |
|
10.18 |
|
|
|
|
|
|
|
|
|
|
|
|
|
|
|
|
|
|
10.5† |
|
Employee Stock Purchase Plan (restated as of October 21, 2004) |
|
10-Q |
|
000-50646 |
|
November 8, 2004 |
|
10.9.1 |
|
|
|
|
|
|
|
|
|
|
|
|
|
|
|
|
|
10.6† |
|
|
S-1/A |
|
333-11904 |
|
March 2, 2004 |
|
10.10 |
|
|
|
|
|
|
|
|
|
|
|
|
|
|
|
|
|
|
10.7† |
|
Severance Policy for Executive Officers (amended as of October 26, 2018) |
|
8-K |
|
000-50646 |
|
November 1, 2018 |
|
10.1 |
|
|
|
|
|
|
|
|
|
|
|
|
|
|
|
|
|
10.8† |
|
Offer Letter between Ultra Clean Holdings, Inc. and James P. Scholhamer dated January 3, 2015 |
|
8-K |
|
000-50646 |
|
January 5, 2015 |
|
99.1 |
|
|
|
|
|
|
|
|
|
|
|
|
|
|
|
|
|
10.9† |
|
|
10-K |
|
000-50646 |
|
March 11, 2015 |
|
10.18 |
|
|
|
|
|
|
|
|
|
|
|
|
|
|
|
|
|
|
10.10† |
|
|
10-K |
|
000-50646 |
|
March 9, 2016 |
|
10.18 |
|
|
|
|
|
|
|
|
|
|
|
|
|
|
|
|
|
|
10.11† |
|
|
8-K |
|
000-50646 |
|
July 12, 2016 |
|
99.1 |
|
|
|
|
|
|
|
|
|
|
|
|
|
|
|
|
|
|
10.12† |
|
|
8-K |
|
000-50646 |
|
July 12, 2016 |
|
99.2 |
|
|
|
|
|
|
|
|
|
|
|
|
|
|
|
|
|
|
10.13† |
|
|
10-Q |
|
000-50646 |
|
August 9, 2017 |
|
10.2 |
|
|
86
|
Exhibit Number |
|
Description |
|
Form |
|
File No. |
|
Filing Date |
|
Exhibit |
|
Filed Herewith |
|
|
|
|
|
|
|
|
|
|
|
|
|
|
|
10.14† |
|
|
10-Q |
|
000-50646 |
|
August 8, 2018 |
|
10.1 |
|
|
|
|
|
|
|
|
|
|
|
|
|
|
|
|
|
|
10.15 |
|
|
8-K |
|
000-50646 |
|
August 31, 2018 |
|
10.1 |
|
|
|
|
|
|
|
|
|
|
|
|
|
|
|
|
|
|
10.16 |
|
|
8-K |
|
000-50646 |
|
August 31, 2018 |
|
10.2 |
|
|
|
|
|
|
|
|
|
|
|
|
|
|
|
|
|
|
10.17 |
|
|
8-K |
|
000-50646 |
|
October 4, 2018 |
|
10.1 |
|
|
|
|
|
|
|
|
|
|
|
|
|
|
|
|
|
|
10.18† |
|
Form of Change in Control Severance Agreement for Executive Officers |
|
8-K |
|
000-50646 |
|
November 1, 2018 |
|
10.2 |
|
|
|
|
|
|
|
|
|
|
|
|
|
|
|
|
|
21.1 |
|
|
|
|
|
|
|
|
|
|
X |
|
|
|
|
|
|
|
|
|
|
|
|
|
|
|
|
23.1 |
|
Consent of Moss Adams LLP, Independent Registered Public Accounting Firm |
|
|
|
|
|
|
|
|
|
X |
|
|
|
|
|
|
|
|
|
|
|
|
|
|
|
24.1 |
|
|
|
|
|
|
|
|
|
|
X |
|
|
|
|
|
|
|
|
|
|
|
|
|
|
|
|
31.1 |
|
Certification of Chief Executive Officer pursuant to Section 302 of the Sarbanes-Oxley Act of 2002 |
|
|
|
|
|
|
|
|
|
X |
|
|
|
|
|
|
|
|
|
|
|
|
|
|
|
31.2 |
|
Certification of Chief Financial Officer pursuant to Section 302 of the Sarbanes-Oxley Act of 2002 |
|
|
|
|
|
|
|
|
|
X |
|
|
|
|
|
|
|
|
|
|
|
|
|
|
|
32.1 |
|
|
|
|
|
|
|
|
|
|
X |
|
|
|
|
|
|
|
|
|
|
|
|
|
|
|
|
32.2 |
|
|
|
|
|
|
|
|
|
|
X |
|
|
|
|
|
|
|
|
|
|
|
|
|
|
|
|
101.INS |
|
XBRL Instance Document |
|
|
|
|
|
|
|
|
|
X |
|
|
|
|
|
|
|
|
|
|
|
|
|
|
|
101.SCH |
|
XBRL Taxonomy Extension Schema Document |
|
|
|
|
|
|
|
|
|
X |
|
|
|
|
|
|
|
|
|
|
|
|
|
|
|
101.CAL |
|
XBRL Taxonomy Calculation Linkbase Document |
|
|
|
|
|
|
|
|
|
X |
|
|
|
|
|
|
|
|
|
|
|
|
|
|
|
101.DEF |
|
XBRL Taxonomy Definition Linkbase Document |
|
|
|
|
|
|
|
|
|
X |
|
|
|
|
|
|
|
|
|
|
|
|
|
|
|
101.LAB |
|
XBRL Taxonomy Label Linkbase Document |
|
|
|
|
|
|
|
|
|
X |
|
|
|
|
|
|
|
|
|
|
|
|
|
|
|
101.PRE |
|
XBRL Taxonomy Extension Presentation Linkbase Document |
|
|
|
|
|
|
|
|
|
X |
|
† |
Denotes management contract or compensatory plan. |
None
87
Pursuant to the requirements of Section 13 or 15(d) of the Securities Exchange Act of 1934, the Registrant has duly caused this Report to be signed on its behalf by the undersigned, thereunto duly authorized.
|
Ultra Clean Holdings, Inc. |
||
|
|
|
|
|
By: |
|
/S/ JAMES P. SCHOLHAMER |
|
|
|
James P. Scholhamer |
|
|
|
Chief Executive Officer |
Date: March 11, 2020
KNOW ALL PERSONS BY THESE PRESENTS , that each person whose signature appears below constitutes and appoints James P. Scholhamer and Sheri Savage, and each of them, as his or her true and lawful attorneys-in-fact and agents, with full power of substitution and re-substitution, for him or her in any and all capacities, to sign any and all amendments to this Annual Report on Form 10-K and to file the same, with all exhibits thereto, and other documents in connection therewith, with the Securities and Exchange Commission hereby ratifying and confirming that each of said attorneys-in-fact and agents, or his substitute or substitutes, may lawfully do or cause to be done by virtue hereof.
Pursuant to the requirements of the Securities Exchange Act of 1934, this Report has been signed below by the following persons on behalf of the Registrant and in the capacities and on the dates indicated.
|
Signature |
|
Title |
|
Date |
|
|
|
|
|
|
|
/S/ CLARENCE L. GRANGER Clarence L. Granger |
|
Chairman |
|
March 11, 2020 |
|
|
|
|
||
|
/S/ JAMES P. SCHOLHAMER James P. Scholhamer |
|
Chief Executive Officer and Director (Principal Executive Officer) |
|
March 11, 2020 |
|
|
|
|
||
|
/S/ SHERI SAVAGE Sheri Savage |
|
Chief Financial Officer (Principal Financial Officer)
|
|
March 11, 2020 |
|
/S/ CHRIS P. SIU Chris P. Siu |
|
Chief Accounting Officer (Principal Accounting Officer ) |
|
March 11, 2020 |
|
|
|
|
||
|
/S/ LEONID MEZHVINSKY Leonid Mezhvinsky |
|
Director |
|
March 11, 2020 |
|
|
|
|
||
|
/S/ EMILY M. LIGGETT Emily M. Liggett |
|
Director |
|
March 11, 2020 |
|
|
|
|
||
|
/S/ THOMAS T. EDMAN Thomas T. Edman |
|
Director |
|
March 11, 2020 |
|
|
|
|
||
|
/S/ BARBARA V. SCHERER Barbara V. Scherer |
|
Director |
|
March 11, 2020 |
|
|
|
|
||
|
/S/ DAVID T. IBNALE David T. IbnAle |
|
Director |
|
March 11, 2020 |
|
|
|
|
|
|
|
/S/ ERNEST E. MADDOCK Ernest E. Maddock |
|
Director |
|
March 11, 2020 |
|
|
|
|
|
|
|
/S/ JACQUELINE A. SETO |
|
Director |
|
March 11, 2020 |
|
Jacqueline A. Seto |
|
|
|
|
88