Attached files
| file | filename |
|---|---|
| 8-K - FORM 8-K - KBS Real Estate Investment Trust III, Inc. | kbsriii8k-webinarmar20.htm |

Exhibit 99.1 Portfolio & Strategic Plan Update March 11, 2020
The information contained herein should be read in conjunction with, and is qualified by, the information in KBS Real Estate Investment Trust III’s (the “Company” or “KBS REIT III”) Annual Report on Form 10-K for the year ended December 31, 2019 (the “Annual Report”), including the “Risk Factors” contained therein. For a full description of the limitations, methodologies and assumptions used to value the Company’s assets Important and liabilities in connection with the calculation of the Company’s estimated value per share, see the Company’s Current Report on Form 8-K, filed with the SEC on December 12, 2019. Forward-Looking Statements Certain statements contained herein may be deemed to be forward-looking statements within the meaning of the Federal Private Securities Litigation Reform Act of 1995. The Company intends that such forward- Disclosures looking statements be subject to the safe harbors created by Section 27A of the Securities Act of 1933, as amended, and Section 21E of the Securities Exchange Act of 1934, as amended. These statements include statements regarding the intent, belief or current expectations of the Company and members of its management team, as well as the assumptions on which such statements are based, and generally are identified by the use of words such as “may,” “will,” “seeks,” “anticipates,” “believes,” “estimates,” “expects,” “plans,” “intends,” “should” or similar expressions. Readers are cautioned not to place undue reliance on these forward-looking statements, which speak only as of the date they are made. The Company undertakes no obligation to update or revise forward-looking statements to reflect changed assumptions, the occurrence of unanticipated events or changes to future operating results over time, unless required by law. Such statements are subject to known and unknown risks and uncertainties which could cause actual results to differ materially from those contemplated by such forward-looking statements. The Company makes no representation or warranty (express or implied) about the accuracy of any such forward-looking statements. These statements are based on a number of assumptions involving the judgment of management. The Company may fund distributions from any source including, without limitation, from offering proceeds or borrowings. Distributions paid through December 31, 2019 have been funded with cash flow from operating activities, debt financing and proceeds from asset sales. There are no guarantees that the Company will continue to pay distributions or that distributions at the current rate are sustainable. No assurances can be given with respect to distributions. Actual events may cause the value and returns on the Company’s investments to be less than that used for purposes of the Company’s estimated NAV per share. With respect to the estimated NAV per share, the appraisal methodology used for the appraised properties assumes the properties realize the projected net operating income and expected exit cap rates and that investors would be willing to invest in such properties at yields equal to the expected discount rates. The valuation for the Company’s investment in units of Prime US REIT assumes a discount for the holding period risk attributable to transfer restrictions and blockage due to the quantity of units held by the Company and such discount is driven by trading volume in Prime US REIT’s units in the public market and expected future volatility. Though the appraisals of the appraised properties and the valuation of the Company’s investment in units of Prime US REIT, with respect to Duff & Phelps, and the valuation estimates used in calculating the estimated value per share, with respect to Duff & Phelps, the Company’s advisor and the Company, are the respective party’s best estimates as of September 30, 2019, December 3, 2019 or December 4, 2019, as applicable, the Company can give no assurance in this regard. Even small changes to these assumptions could result in significant differences in the appraised values of the appraised properties, the valuation of the Company’s investment in units of Prime US REIT and the estimated value per share. Further, the Company can make no assurances with respect to the future value appreciation of its properties and ultimate returns to investors. Stockholders may have to hold their shares for an indefinite period of time. The Company can give no assurance that it will be able to provide additional liquidity to stockholders. The Company’s conflicts committee, which is composed of all of its independent directors, has approved the pursuit of the Company’s conversion to a perpetual-life NAV REIT. However, the Company’s conversion to an NAV REIT remain subject to further approval of the conflicts committee and board of directors, and regulatory, market or business considerations may influence the Company to delay the implementation of the NAV REIT conversion or abandon the Company’s conversion to an NAV REIT. Even if the Company converts to an NAV REIT, there is no assurance that the Company will successfully implement its strategy. The statements herein also depend on factors such as: future economic, competitive and market conditions; the Company’s ability to maintain and/or improve occupancy levels and rental rates at its real estate properties; and other risks identified in Part I, Item IA of the Company’s Annual Report. WWW. KBS.COM 2
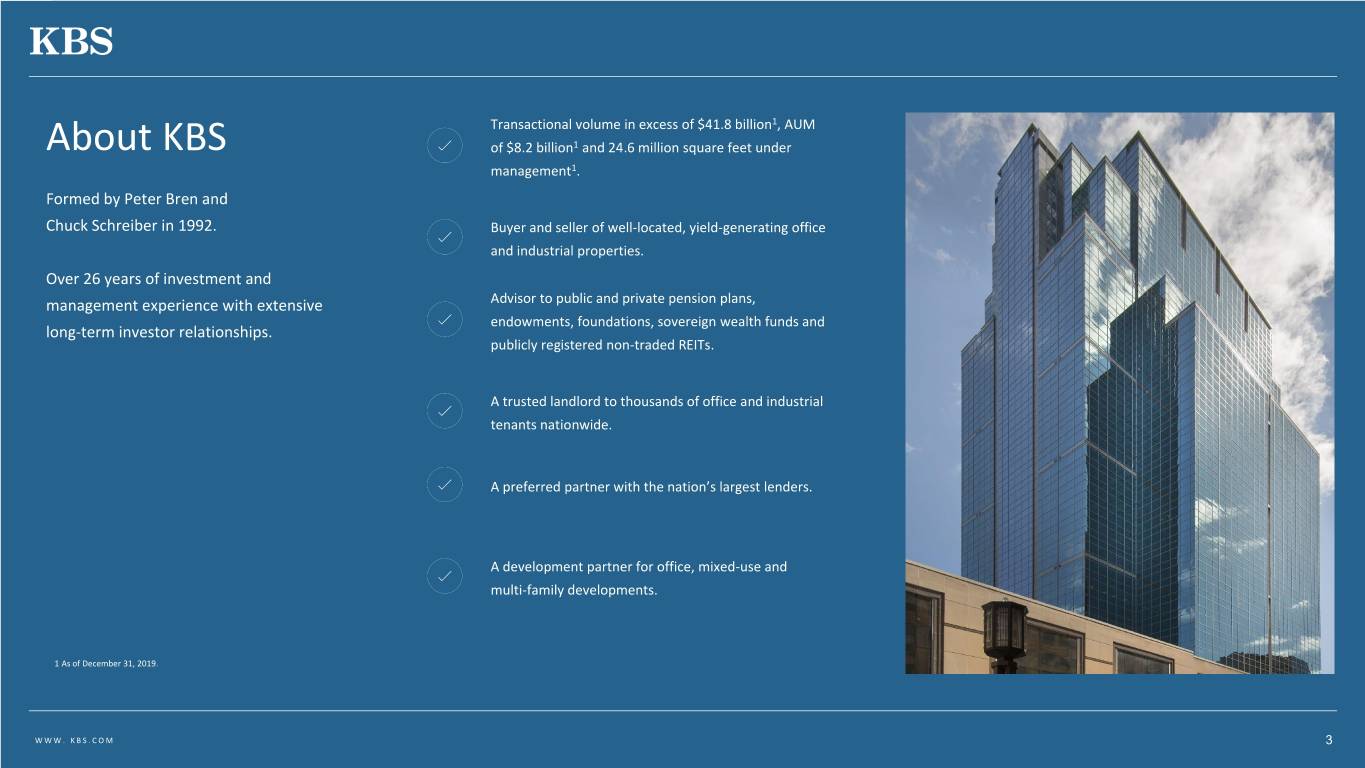
Transactional volume in excess of $41.8 billion1, AUM About KBS of $8.2 billion1 and 24.6 million square feet under management1. Formed by Peter Bren and Chuck Schreiber in 1992. Buyer and seller of well-located, yield-generating office and industrial properties. Over 26 years of investment and management experience with extensive Advisor to public and private pension plans, endowments, foundations, sovereign wealth funds and long-term investor relationships. publicly registered non-traded REITs. A trusted landlord to thousands of office and industrial tenants nationwide. A preferred partner with the nation’s largest lenders. A development partner for office, mixed-use and multi-family developments. 1 As of December 31, 2019. WWW. KBS.COM 3
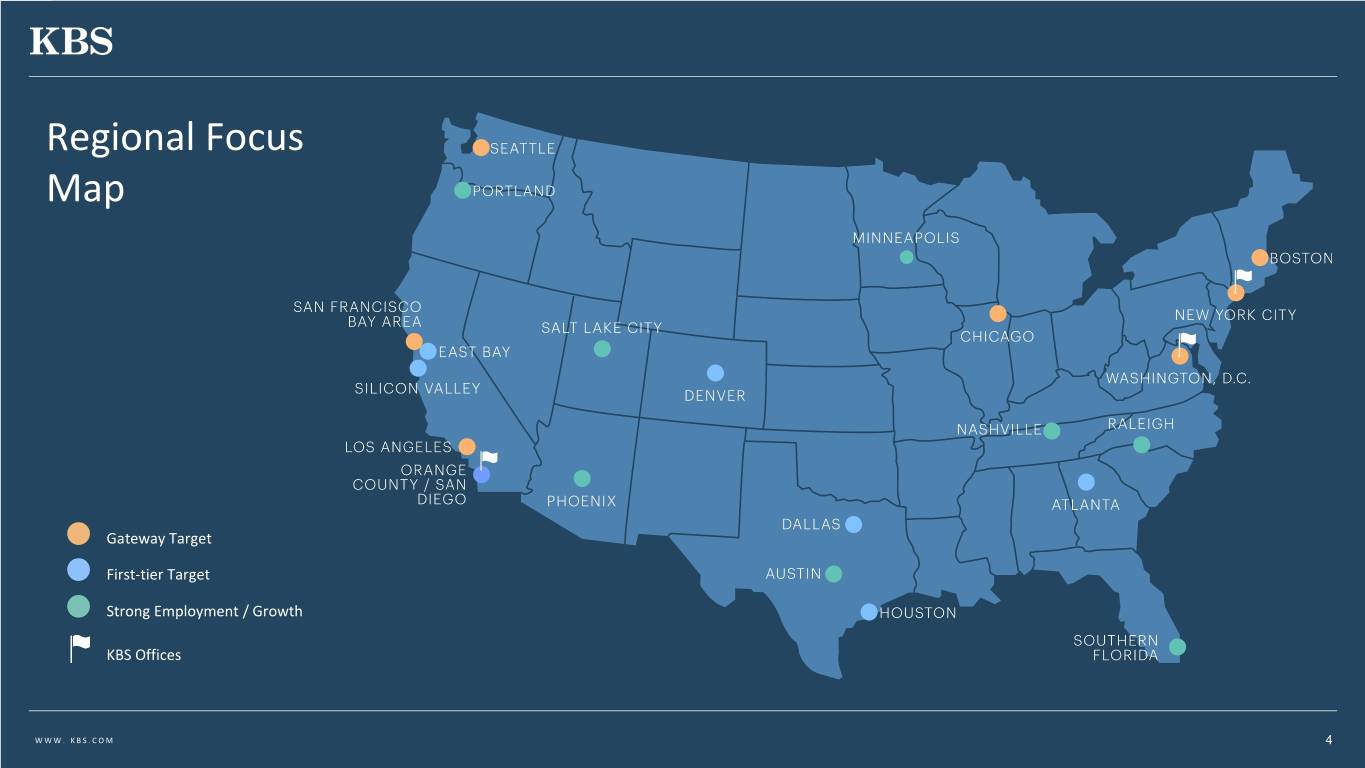
Regional Focus Map Gateway Target First-tier Target Strong Employment / Growth KBS Offices WWW. KBS.COM 4
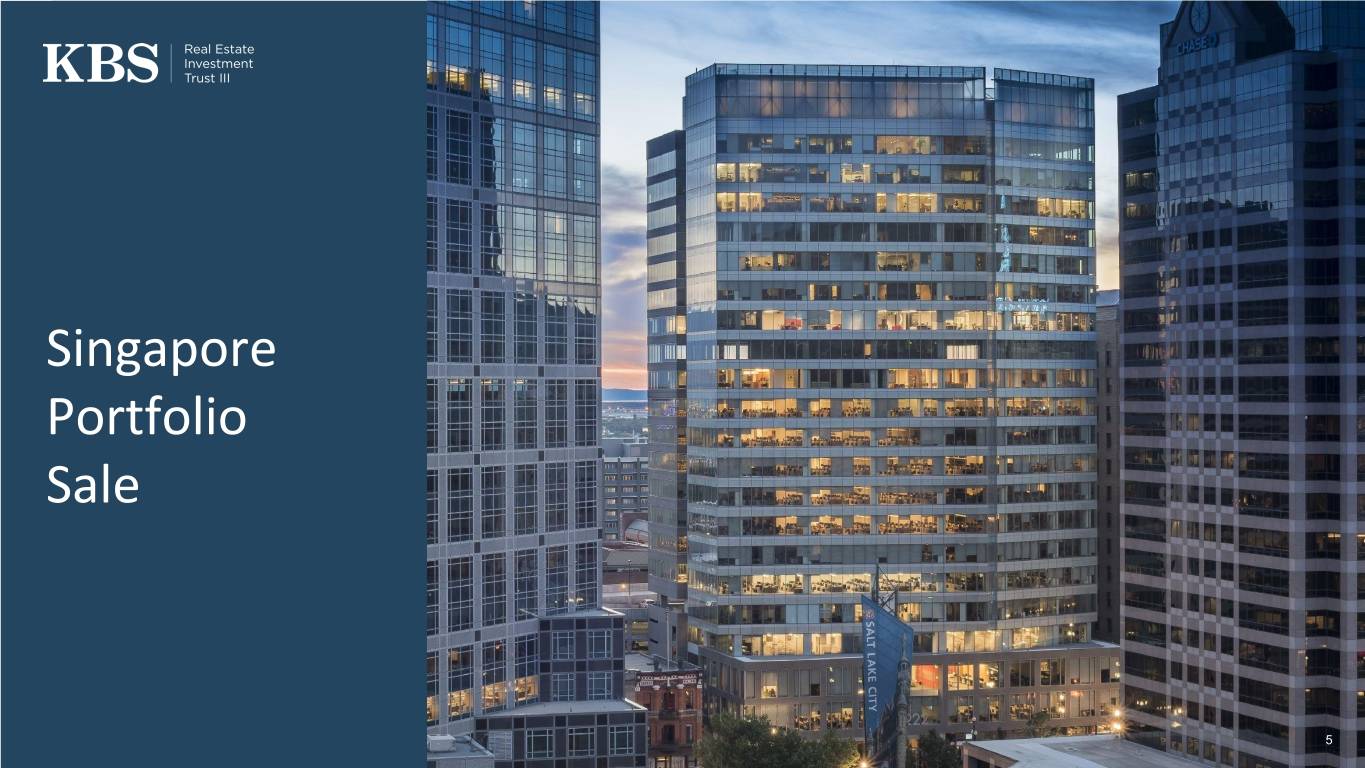
Singapore Portfolio Sale 5
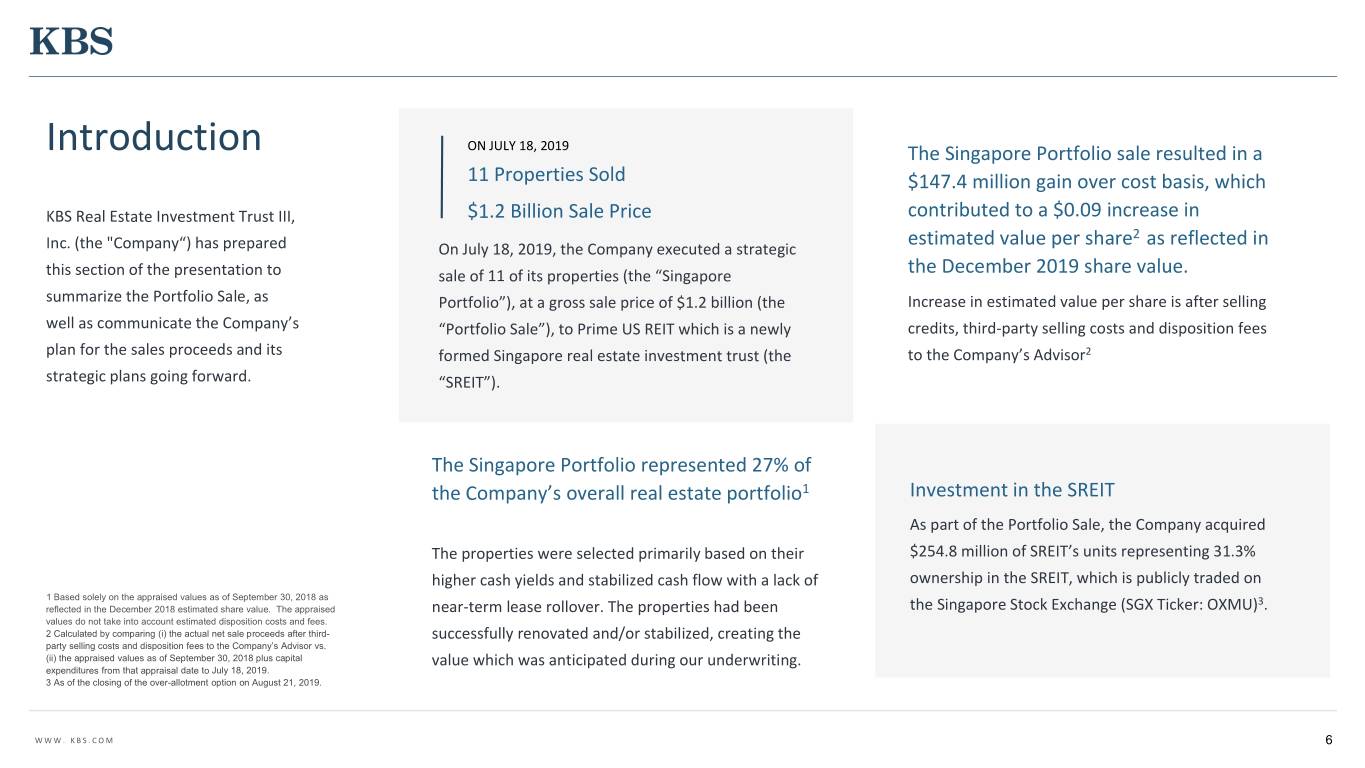
Introduction ON JULY 18, 2019 The Singapore Portfolio sale resulted in a 11 Properties Sold $147.4 million gain over cost basis, which KBS Real Estate Investment Trust III, $1.2 Billion Sale Price contributed to a $0.09 increase in estimated value per share2 as reflected in Inc. (the "Company“) has prepared On July 18, 2019, the Company executed a strategic this section of the presentation to sale of 11 of its properties (the “Singapore the December 2019 share value. summarize the Portfolio Sale, as Portfolio”), at a gross sale price of $1.2 billion (the Increase in estimated value per share is after selling well as communicate the Company’s “Portfolio Sale”), to Prime US REIT which is a newly credits, third-party selling costs and disposition fees plan for the sales proceeds and its formed Singapore real estate investment trust (the to the Company’s Advisor2 strategic plans going forward. “SREIT”). The Singapore Portfolio represented 27% of the Company’s overall real estate portfolio1 Investment in the SREIT As part of the Portfolio Sale, the Company acquired The properties were selected primarily based on their $254.8 million of SREIT’s units representing 31.3% higher cash yields and stabilized cash flow with a lack of ownership in the SREIT, which is publicly traded on 1 Based solely on the appraised values as of September 30, 2018 as 3 reflected in the December 2018 estimated share value. The appraised near-term lease rollover. The properties had been the Singapore Stock Exchange (SGX Ticker: OXMU) . values do not take into account estimated disposition costs and fees. 2 Calculated by comparing (i) the actual net sale proceeds after third- successfully renovated and/or stabilized, creating the party selling costs and disposition fees to the Company’s Advisor vs. (ii) the appraised values as of September 30, 2018 plus capital value which was anticipated during our underwriting. expenditures from that appraisal date to July 18, 2019. 3 As of the closing of the over-allotment option on August 21, 2019. WWW. KBS.COM 6
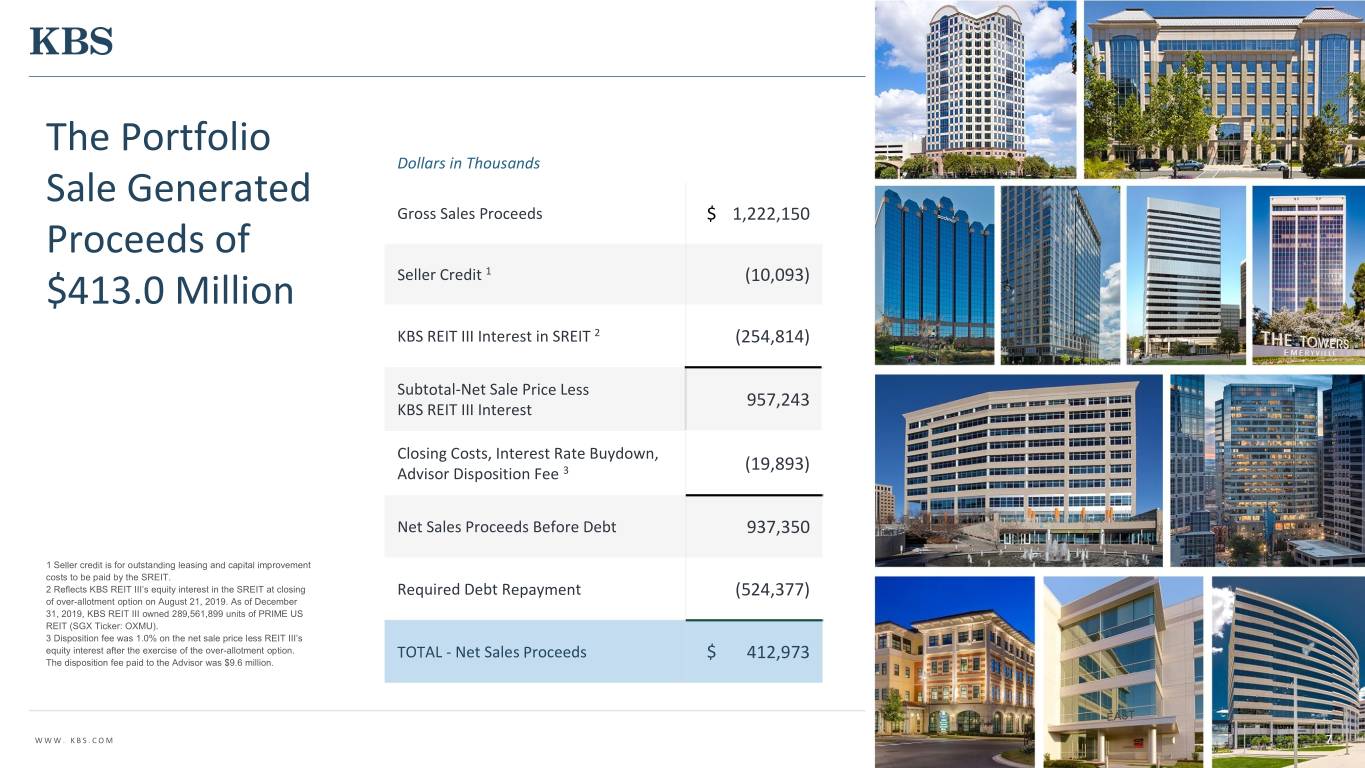
The Portfolio Dollars in Thousands Sale Generated Gross Sales Proceeds $ 1,222,150 Proceeds of $413.0 Million Seller Credit 1 (10,093) KBS REIT III Interest in SREIT 2 (254,814) Subtotal-Net Sale Price Less 957,243 KBS REIT III Interest Closing Costs, Interest Rate Buydown, (19,893) Advisor Disposition Fee 3 Net Sales Proceeds Before Debt 937,350 1 Seller credit is for outstanding leasing and capital improvement costs to be paid by the SREIT. 2 Reflects KBS REIT III’s equity interest in the SREIT at closing Required Debt Repayment (524,377) of over-allotment option on August 21, 2019. As of December 31, 2019, KBS REIT III owned 289,561,899 units of PRIME US REIT (SGX Ticker: OXMU). 3 Disposition fee was 1.0% on the net sale price less REIT III’s equity interest after the exercise of the over-allotment option. TOTAL - Net Sales Proceeds $ 412,973 The disposition fee paid to the Advisor was $9.6 million. WWW. KBS.COM 77
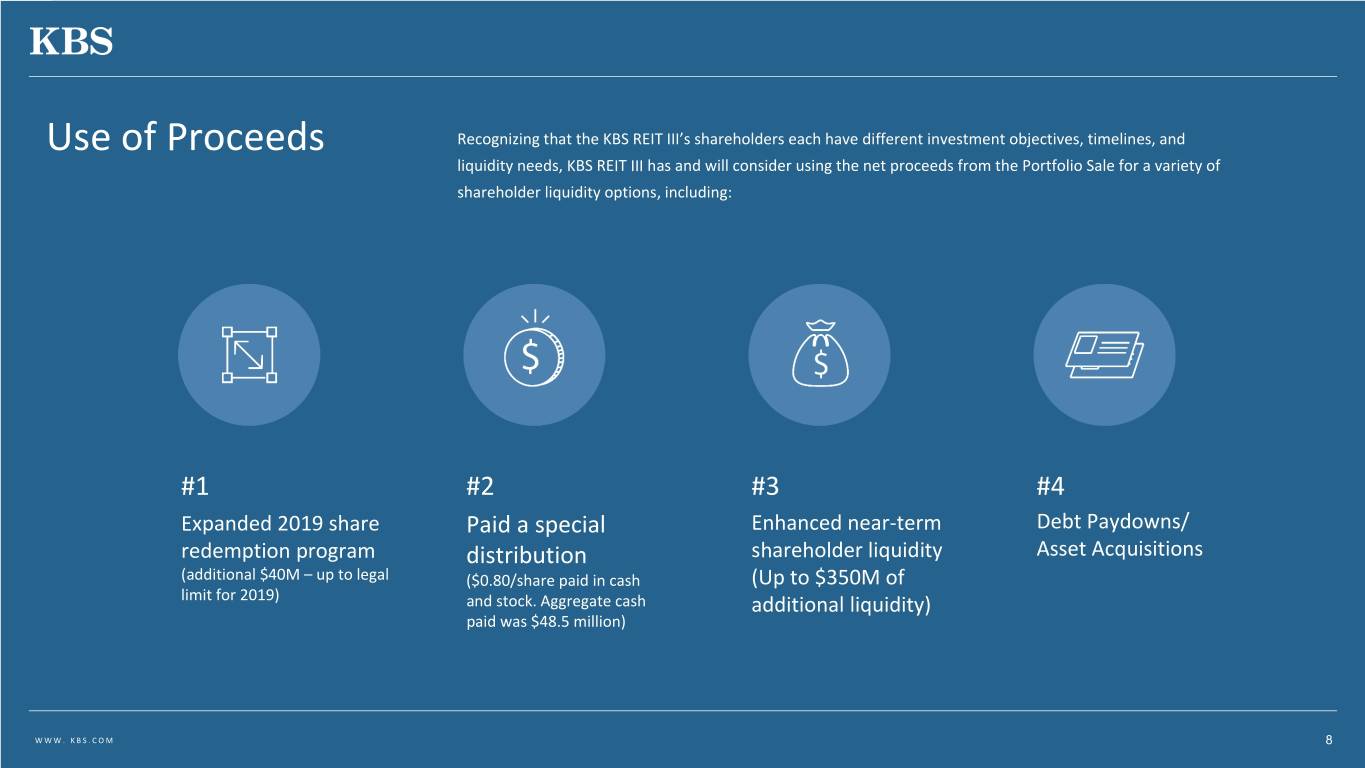
Use of Proceeds Recognizing that the KBS REIT III’s shareholders each have different investment objectives, timelines, and liquidity needs, KBS REIT III has and will consider using the net proceeds from the Portfolio Sale for a variety of shareholder liquidity options, including: #1 #2 #3 #4 Expanded 2019 share Paid a special Enhanced near-term Debt Paydowns/ redemption program distribution shareholder liquidity Asset Acquisitions (additional $40M – up to legal ($0.80/share paid in cash (Up to $350M of limit for 2019) and stock. Aggregate cash additional liquidity) paid was $48.5 million) WWW. KBS.COM 8
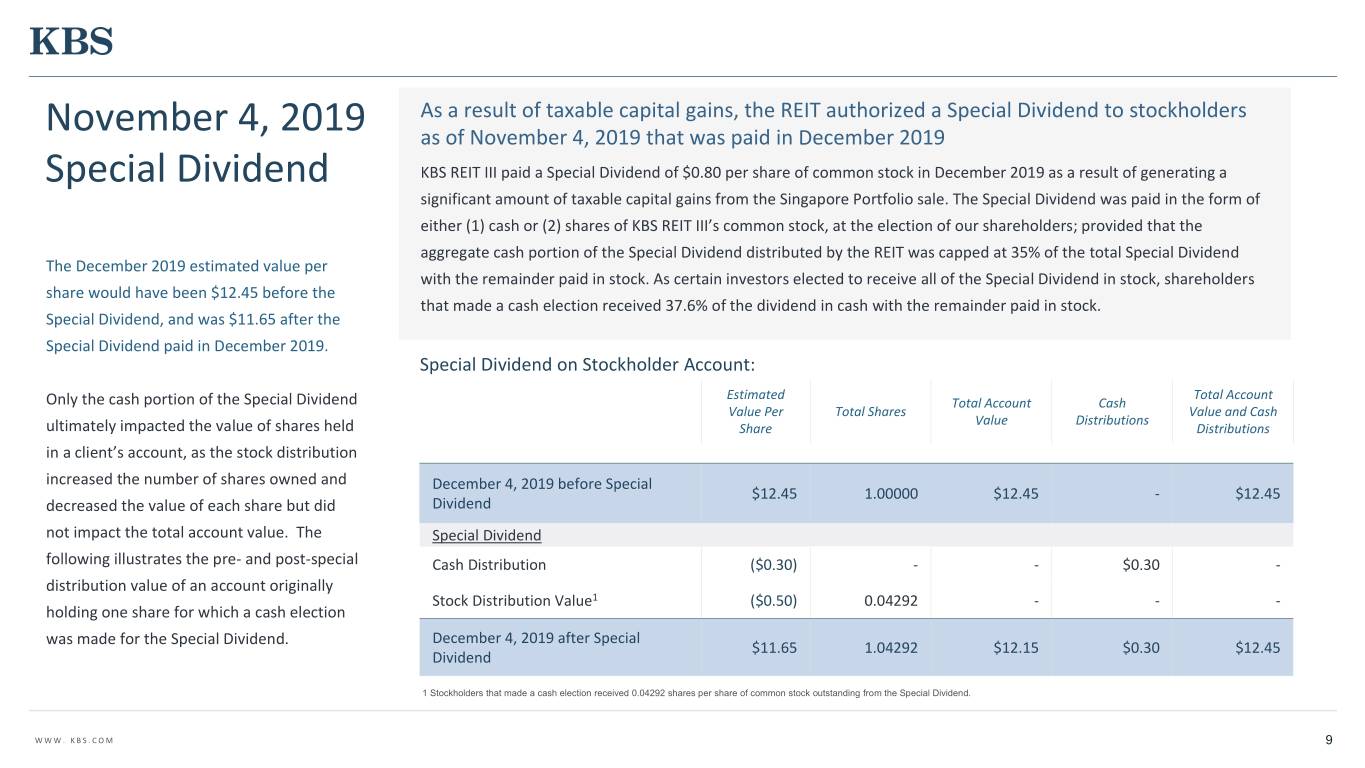
As a result of taxable capital gains, the REIT authorized a Special Dividend to stockholders November 4, 2019 as of November 4, 2019 that was paid in December 2019 Special Dividend KBS REIT III paid a Special Dividend of $0.80 per share of common stock in December 2019 as a result of generating a significant amount of taxable capital gains from the Singapore Portfolio sale. The Special Dividend was paid in the form of either (1) cash or (2) shares of KBS REIT III’s common stock, at the election of our shareholders; provided that the aggregate cash portion of the Special Dividend distributed by the REIT was capped at 35% of the total Special Dividend The December 2019 estimated value per with the remainder paid in stock. As certain investors elected to receive all of the Special Dividend in stock, shareholders share would have been $12.45 before the that made a cash election received 37.6% of the dividend in cash with the remainder paid in stock. Special Dividend, and was $11.65 after the Special Dividend paid in December 2019. Special Dividend on Stockholder Account: Estimated Total Account Only the cash portion of the Special Dividend Total Account Cash Value Per Total Shares Value and Cash Value Distributions ultimately impacted the value of shares held Share Distributions in a client’s account, as the stock distribution increased the number of shares owned and December 4, 2019 before Special $12.45 1.00000 $12.45 - $12.45 decreased the value of each share but did Dividend not impact the total account value. The Special Dividend following illustrates the pre- and post-special Cash Distribution ($0.30) - - $0.30 - distribution value of an account originally Stock Distribution Value1 ($0.50) 0.04292 - - - holding one share for which a cash election was made for the Special Dividend. December 4, 2019 after Special $11.65 1.04292 $12.15 $0.30 $12.45 Dividend 1 Stockholders that made a cash election received 0.04292 shares per share of common stock outstanding from the Special Dividend. WWW. KBS.COM 9
Fund and Portfolio Overview 10
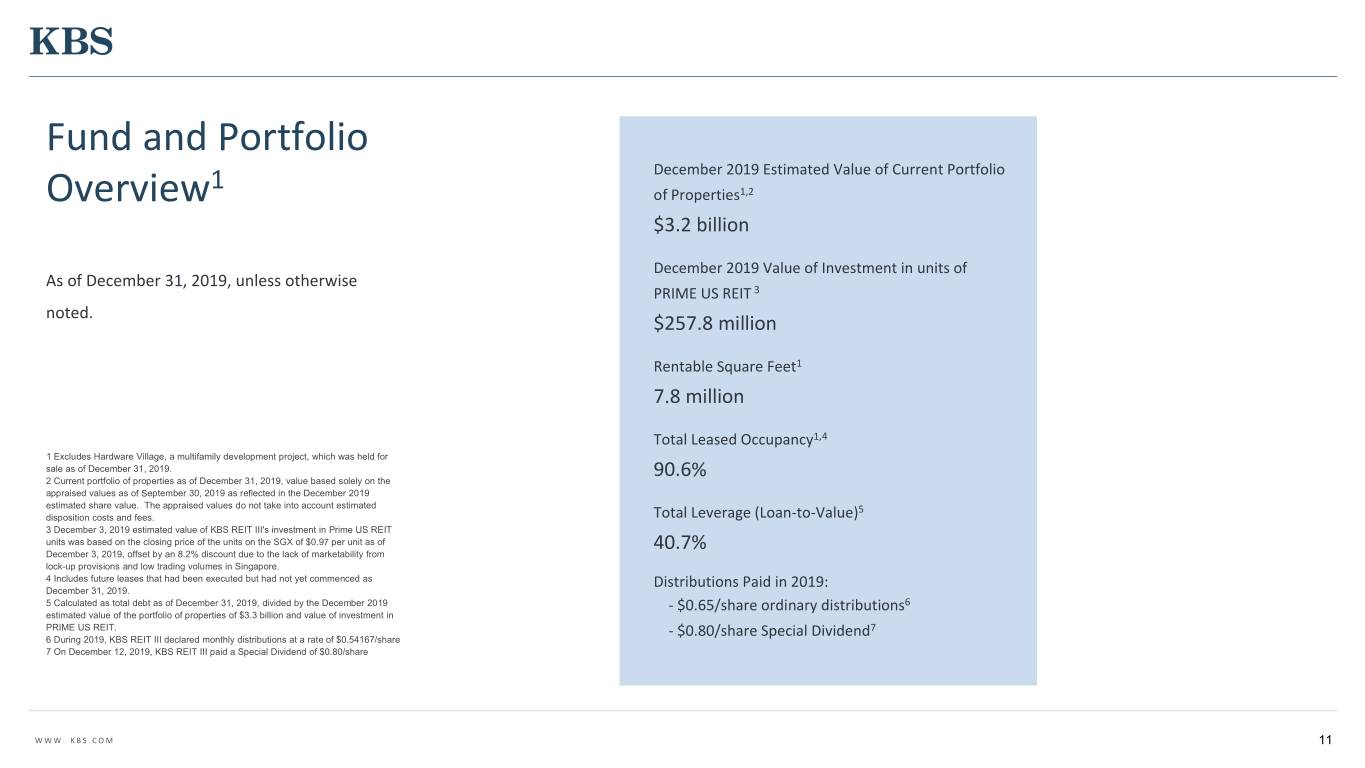
Fund and Portfolio 1 December 2019 Estimated Value of Current Portfolio Overview of Properties1,2 $3.2 billion December 2019 Value of Investment in units of As of December 31, 2019, unless otherwise PRIME US REIT 3 noted. $257.8 million Rentable Square Feet1 7.8 million Total Leased Occupancy1,4 1 Excludes Hardware Village, a multifamily development project, which was held for sale as of December 31, 2019. 90.6% 2 Current portfolio of properties as of December 31, 2019, value based solely on the appraised values as of September 30, 2019 as reflected in the December 2019 estimated share value. The appraised values do not take into account estimated 5 disposition costs and fees. Total Leverage (Loan-to-Value) 3 December 3, 2019 estimated value of KBS REIT III's investment in Prime US REIT units was based on the closing price of the units on the SGX of $0.97 per unit as of 40.7% December 3, 2019, offset by an 8.2% discount due to the lack of marketability from lock-up provisions and low trading volumes in Singapore. 4 Includes future leases that had been executed but had not yet commenced as Distributions Paid in 2019: December 31, 2019. 5 Calculated as total debt as of December 31, 2019, divided by the December 2019 - $0.65/share ordinary distributions6 estimated value of the portfolio of properties of $3.3 billion and value of investment in PRIME US REIT. - $0.80/share Special Dividend7 6 During 2019, KBS REIT III declared monthly distributions at a rate of $0.54167/share 7 On December 12, 2019, KBS REIT III paid a Special Dividend of $0.80/share WWW. KBS.COM 11
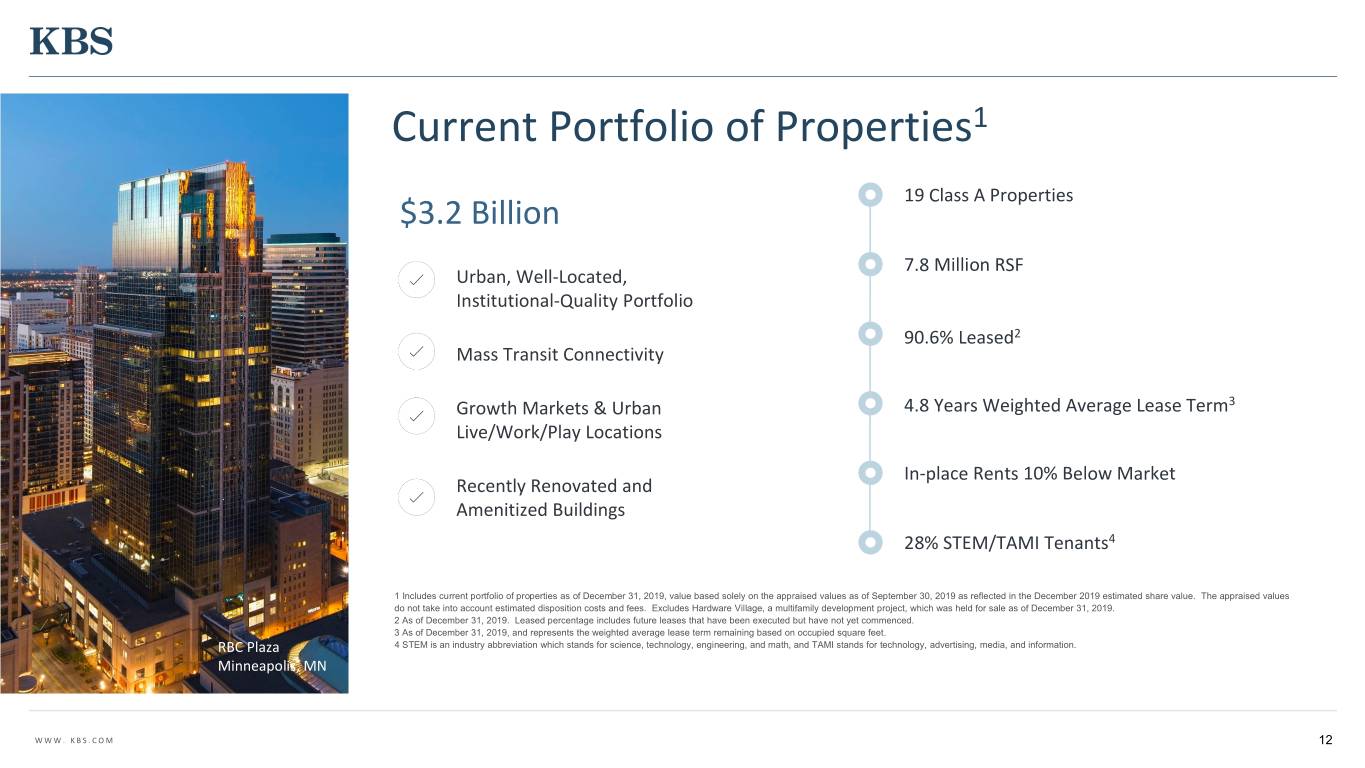
Current Portfolio of Properties1 19 Class A Properties $3.2 Billion 7.8 Million RSF Urban, Well-Located, Institutional-Quality Portfolio 90.6% Leased2 Mass Transit Connectivity Growth Markets & Urban 4.8 Years Weighted Average Lease Term3 Live/Work/Play Locations In-place Rents 10% Below Market Recently Renovated and Amenitized Buildings 28% STEM/TAMI Tenants4 1 Includes current portfolio of properties as of December 31, 2019, value based solely on the appraised values as of September 30, 2019 as reflected in the December 2019 estimated share value. The appraised values do not take into account estimated disposition costs and fees. Excludes Hardware Village, a multifamily development project, which was held for sale as of December 31, 2019. 2 As of December 31, 2019. Leased percentage includes future leases that have been executed but have not yet commenced. 3 As of December 31, 2019, and represents the weighted average lease term remaining based on occupied square feet. RBC Plaza 4 STEM is an industry abbreviation which stands for science, technology, engineering, and math, and TAMI stands for technology, advertising, media, and information. Minneapolis, MN WWW. KBS.COM 12
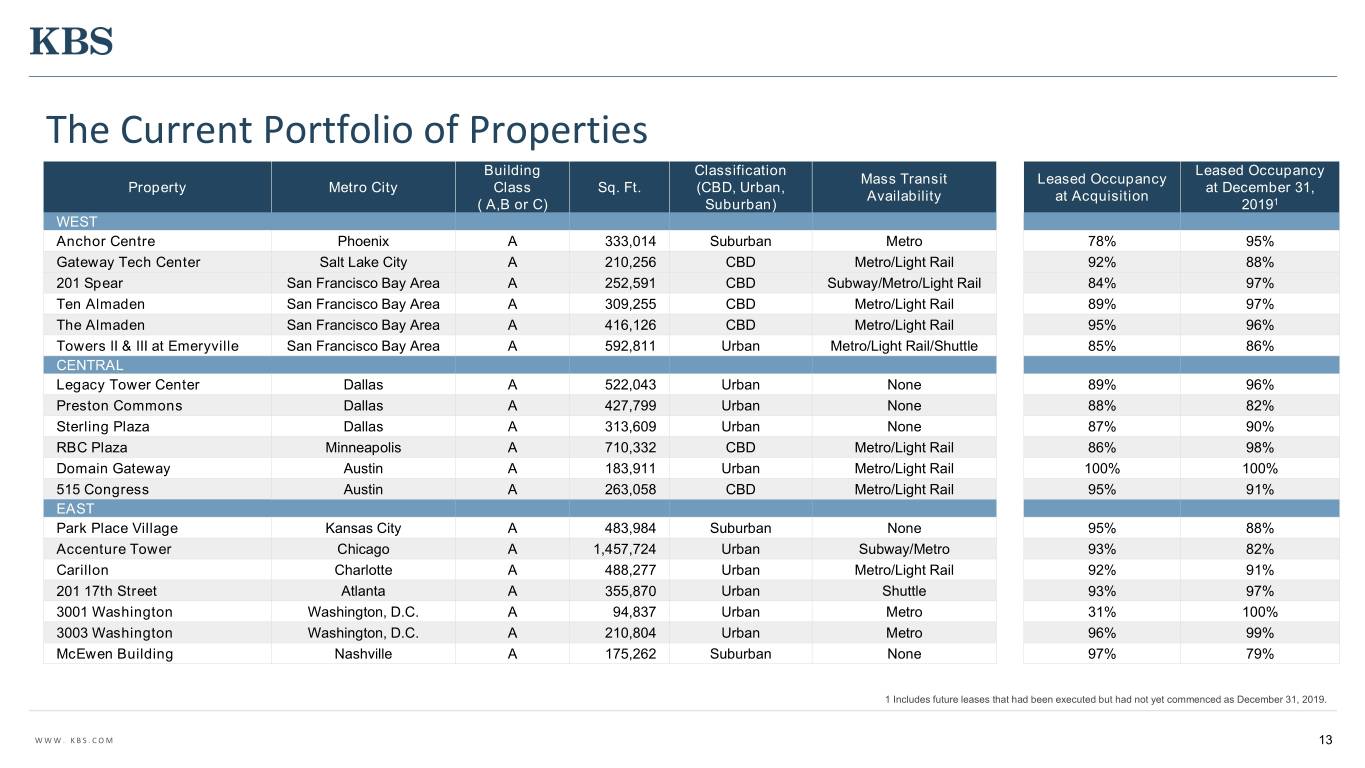
The Current Portfolio of Properties Building Classification Leased Occupancy Mass Transit Leased Occupancy Property Metro City Class Sq. Ft. (CBD, Urban, at December 31, Availability at Acquisition ( A,B or C) Suburban) 20191 WEST Anchor Centre Phoenix A 333,014 Suburban Metro 78% 95% Gateway Tech Center Salt Lake City A 210,256 CBD Metro/Light Rail 92% 88% 201 Spear San Francisco Bay Area A 252,591 CBD Subway/Metro/Light Rail 84% 97% Ten Almaden San Francisco Bay Area A 309,255 CBD Metro/Light Rail 89% 97% The Almaden San Francisco Bay Area A 416,126 CBD Metro/Light Rail 95% 96% Towers II & III at Emeryville San Francisco Bay Area A 592,811 Urban Metro/Light Rail/Shuttle 85% 86% CENTRAL Legacy Tower Center Dallas A 522,043 Urban None 89% 96% Preston Commons Dallas A 427,799 Urban None 88% 82% Sterling Plaza Dallas A 313,609 Urban None 87% 90% RBC Plaza Minneapolis A 710,332 CBD Metro/Light Rail 86% 98% Domain Gateway Austin A 183,911 Urban Metro/Light Rail 100% 100% 515 Congress Austin A 263,058 CBD Metro/Light Rail 95% 91% EAST Park Place Village Kansas City A 483,984 Suburban None 95% 88% Accenture Tower Chicago A 1,457,724 Urban Subway/Metro 93% 82% Carillon Charlotte A 488,277 Urban Metro/Light Rail 92% 91% 201 17th Street Atlanta A 355,870 Urban Shuttle 93% 97% 3001 Washington Washington, D.C. A 94,837 Urban Metro 31% 100% 3003 Washington Washington, D.C. A 210,804 Urban Metro 96% 99% McEwen Building Nashville A 175,262 Suburban None 97% 79% 1 Includes future leases that had been executed but had not yet commenced as December 31, 2019. WWW. KBS.COM 13
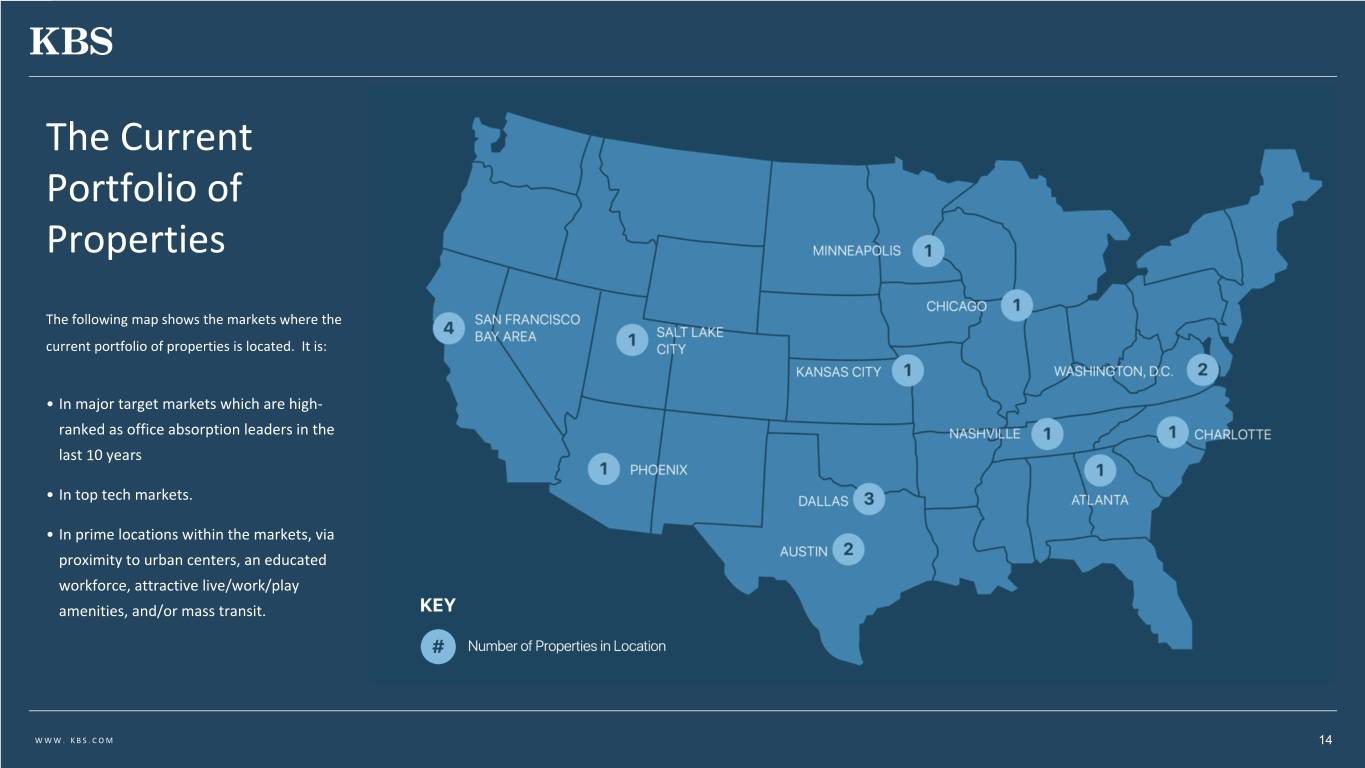
The Current Portfolio of Properties The following map shows the markets where the current portfolio of properties is located. It is: • In major target markets which are high- ranked as office absorption leaders in the last 10 years • In top tech markets. • In prime locations within the markets, via proximity to urban centers, an educated workforce, attractive live/work/play amenities, and/or mass transit. WWW. KBS.COM 14

Statistics for the Current Portfolio Market Diversification 1 Asset Diversification 1 Invested in Target Markets: Asset Diversification: 50% of value2 in CBRE’s Top 10 Tech Markets Largest asset accounts for just 16% 90% of value2 in CBRE’s Top 25 Tech Markets 1 Based solely on the appraised values as of September 30, 2019 as reflected in the December 2019 estimated share value for the current portfolio of properties. The appraised values do not take into account estimated disposition costs and fees. 3 “Other” is comprised of various properties that individually represent less than 3% or less of total value. 2 Per CBRE’s 2019 Tech Talent Report WWW. KBS.COM 15
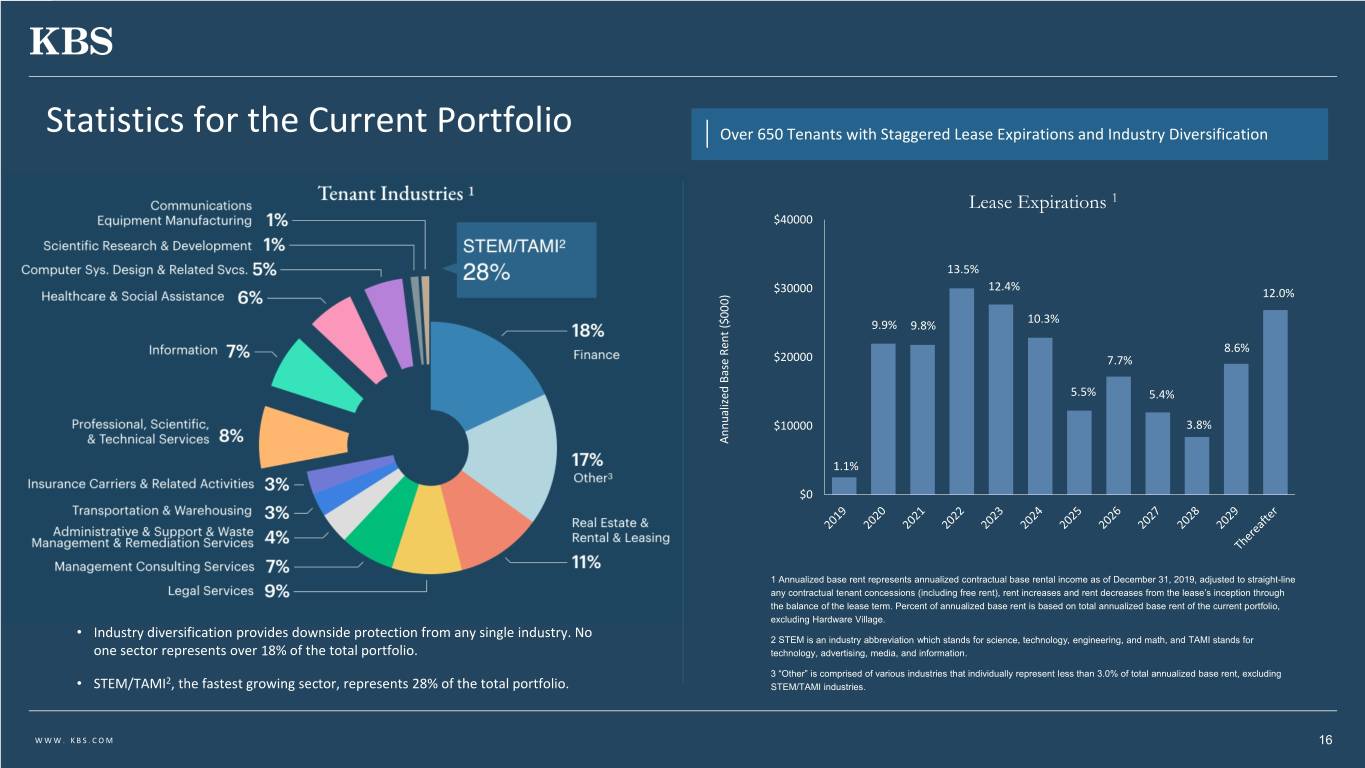
Statistics for the Current Portfolio Over 650 Tenants with Staggered Lease Expirations and Industry Diversification Lease Expirations 1 $40000 13.5% 12.4% $30000 12.0% 10.3% 9.9% 9.8% 8.6% $20000 7.7% 5.5% 5.4% $10000 3.8% Annualized Annualized Rent Base($000) 1.1% $0 1 Annualized base rent represents annualized contractual base rental income as of December 31, 2019, adjusted to straight-line any contractual tenant concessions (including free rent), rent increases and rent decreases from the lease’s inception through the balance of the lease term. Percent of annualized base rent is based on total annualized base rent of the current portfolio, excluding Hardware Village. • Industry diversification provides downside protection from any single industry. No 2 STEM is an industry abbreviation which stands for science, technology, engineering, and math, and TAMI stands for one sector represents over 18% of the total portfolio. technology, advertising, media, and information. 3 “Other” is comprised of various industries that individually represent less than 3.0% of total annualized base rent, excluding 2 • STEM/TAMI , the fastest growing sector, represents 28% of the total portfolio. STEM/TAMI industries. WWW. KBS.COM 16
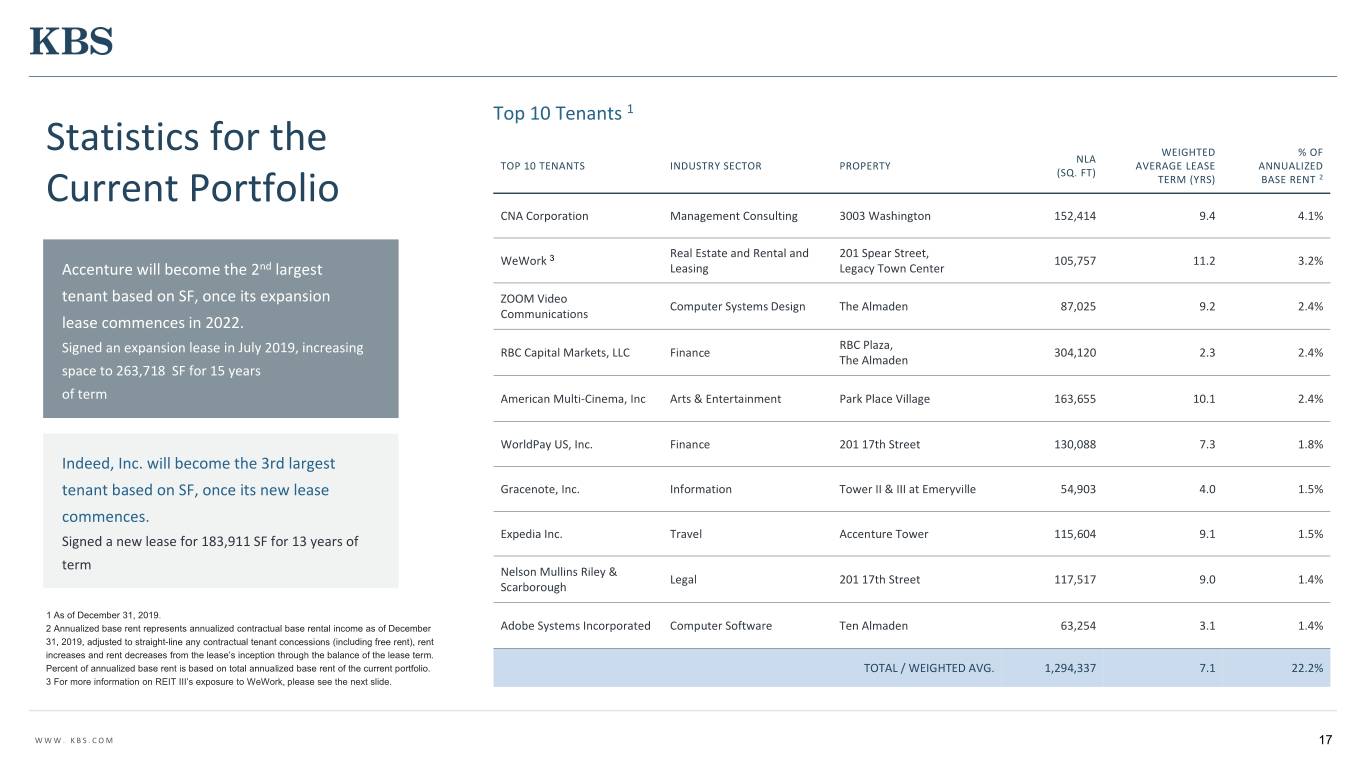
Top 10 Tenants 1 Statistics for the WEIGHTED % OF NLA TOP 10 TENANTS INDUSTRY SECTOR PROPERTY AVERAGE LEASE ANNUALIZED (SQ. FT) Current Portfolio TERM (YRS) BASE RENT 2 CNA Corporation Management Consulting 3003 Washington 152,414 9.4 4.1% Real Estate and Rental and 201 Spear Street, WeWork 3 105,757 11.2 3.2% Accenture will become the 2nd largest Leasing Legacy Town Center tenant based on SF, once its expansion ZOOM Video Computer Systems Design The Almaden 87,025 9.2 2.4% Communications lease commences in 2022. RBC Plaza, Signed an expansion lease in July 2019, increasing RBC Capital Markets, LLC Finance 304,120 2.3 2.4% The Almaden space to 263,718 SF for 15 years of term American Multi-Cinema, Inc Arts & Entertainment Park Place Village 163,655 10.1 2.4% WorldPay US, Inc. Finance 201 17th Street 130,088 7.3 1.8% Indeed, Inc. will become the 3rd largest tenant based on SF, once its new lease Gracenote, Inc. Information Tower II & III at Emeryville 54,903 4.0 1.5% commences. Expedia Inc. Travel Accenture Tower 115,604 9.1 1.5% Signed a new lease for 183,911 SF for 13 years of term Nelson Mullins Riley & Legal 201 17th Street 117,517 9.0 1.4% Scarborough 1 As of December 31, 2019. 2 Annualized base rent represents annualized contractual base rental income as of December Adobe Systems Incorporated Computer Software Ten Almaden 63,254 3.1 1.4% 31, 2019, adjusted to straight-line any contractual tenant concessions (including free rent), rent increases and rent decreases from the lease’s inception through the balance of the lease term. Percent of annualized base rent is based on total annualized base rent of the current portfolio. TOTAL / WEIGHTED AVG. 1,294,337 7.1 22.2% 3 For more information on REIT III’s exposure to WeWork, please see the next slide. WWW. KBS.COM 17
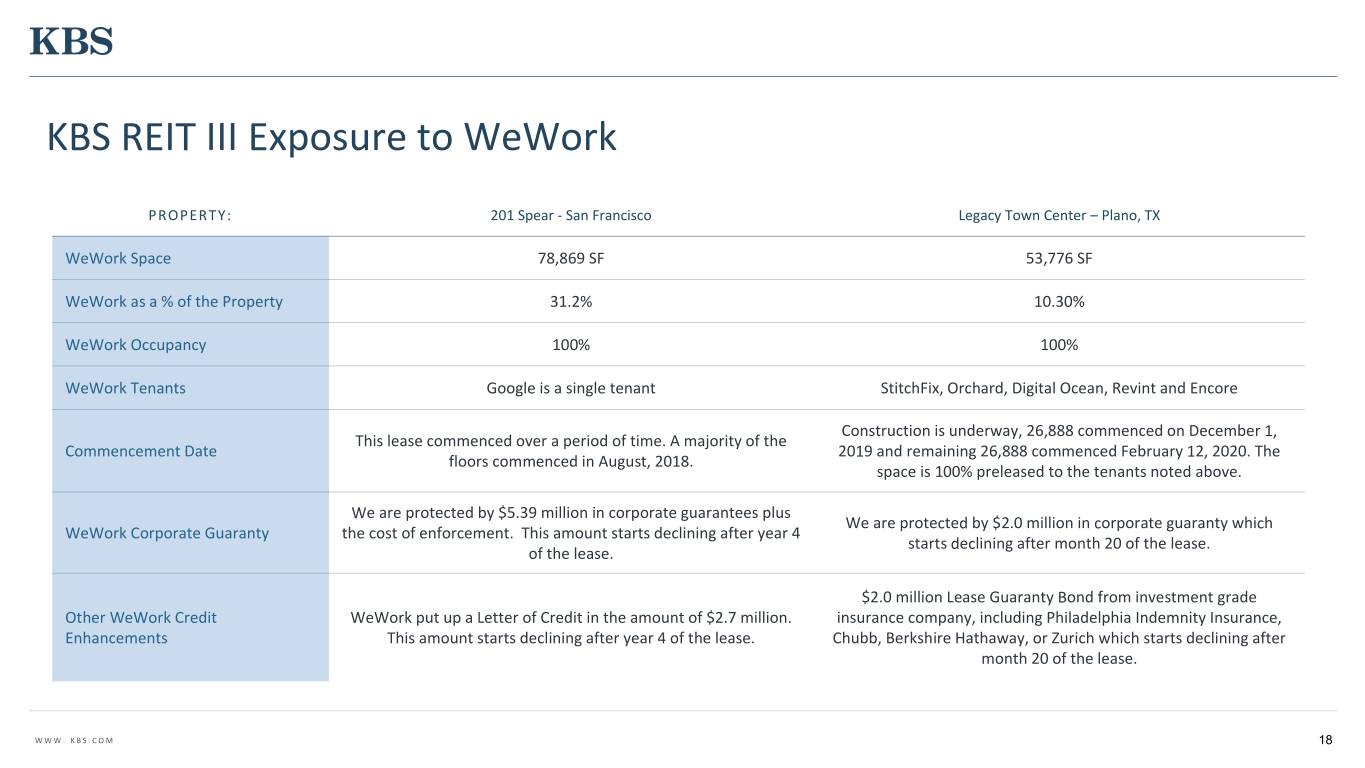
KBS REIT III Exposure to WeWork PROPERTY: 201 Spear - San Francisco Legacy Town Center – Plano, TX WeWork Space 78,869 SF 53,776 SF WeWork as a % of the Property 31.2% 10.30% WeWork Occupancy 100% 100% WeWork Tenants Google is a single tenant StitchFix, Orchard, Digital Ocean, Revint and Encore Construction is underway, 26,888 commenced on December 1, This lease commenced over a period of time. A majority of the Commencement Date 2019 and remaining 26,888 commenced February 12, 2020. The floors commenced in August, 2018. space is 100% preleased to the tenants noted above. We are protected by $5.39 million in corporate guarantees plus We are protected by $2.0 million in corporate guaranty which WeWork Corporate Guaranty the cost of enforcement. This amount starts declining after year 4 starts declining after month 20 of the lease. of the lease. $2.0 million Lease Guaranty Bond from investment grade Other WeWork Credit WeWork put up a Letter of Credit in the amount of $2.7 million. insurance company, including Philadelphia Indemnity Insurance, Enhancements This amount starts declining after year 4 of the lease. Chubb, Berkshire Hathaway, or Zurich which starts declining after month 20 of the lease. WWW. KBS.COM 18
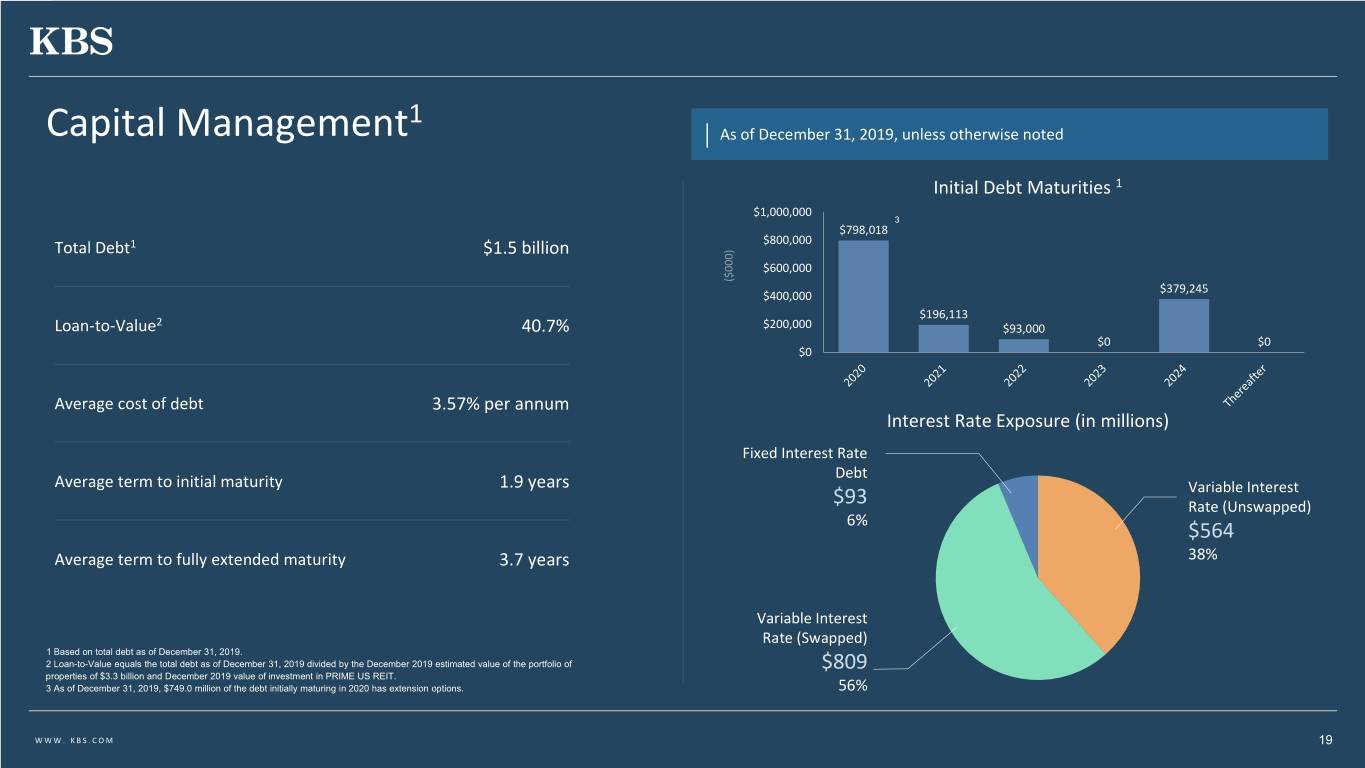
1 Capital Management As of December 31, 2019, unless otherwise noted Initial Debt Maturities 1 $1,000,000 3 $798,018 Total Debt1 $1.5 billion $800,000 $600,000 $379,245 $400,000 $196,113 2 Loan-to-Value 40.7% $200,000 $93,000 $0 $0 $0 Average cost of debt 3.57% per annum Interest Rate Exposure (in millions) Fixed Interest Rate Debt Average term to initial maturity 1.9 years Variable Interest $93 Rate (Unswapped) 6% $564 Average term to fully extended maturity 3.7 years 38% Variable Interest Rate (Swapped) 1 Based on total debt as of December 31, 2019. 2 Loan-to-Value equals the total debt as of December 31, 2019 divided by the December 2019 estimated value of the portfolio of $809 properties of $3.3 billion and December 2019 value of investment in PRIME US REIT. 3 As of December 31, 2019, $749.0 million of the debt initially maturing in 2020 has extension options. 56% WWW. KBS.COM 19

Property Updates 20
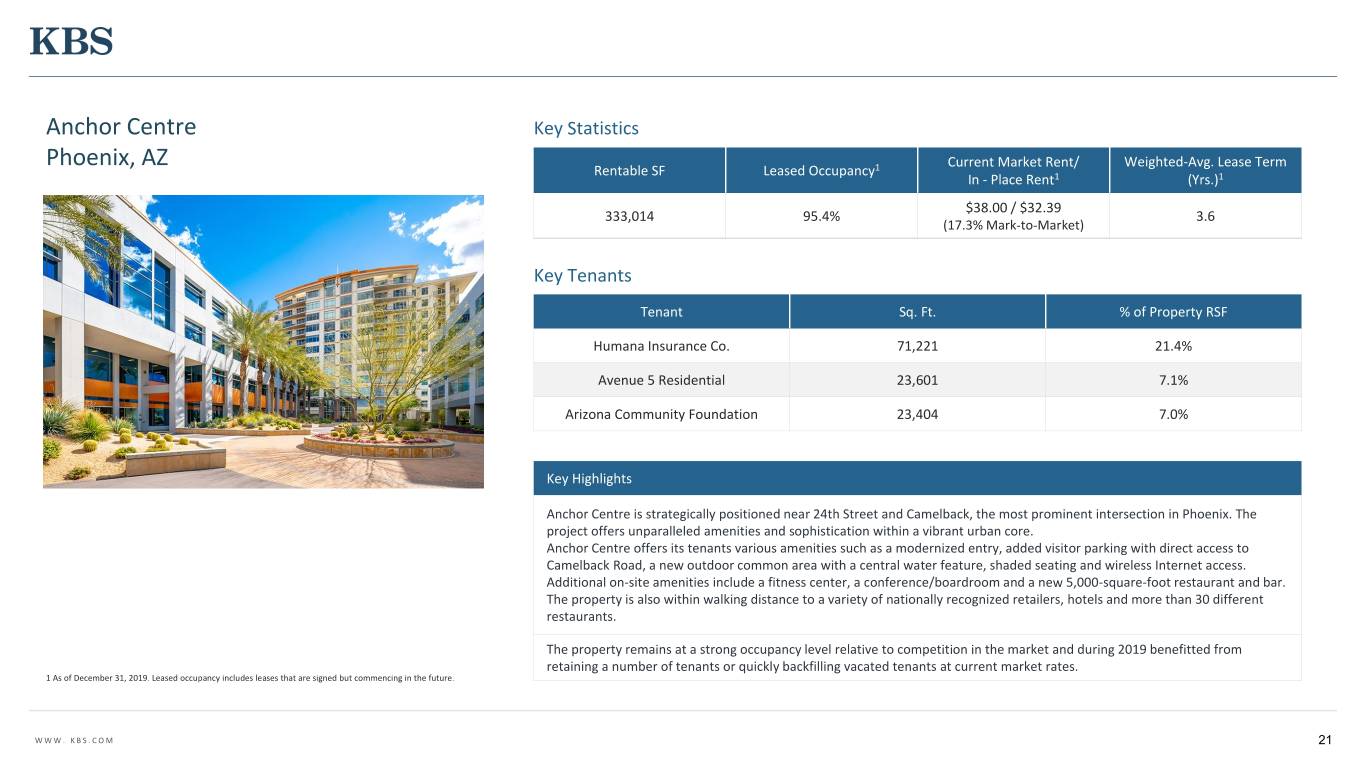
Anchor Centre Key Statistics Phoenix, AZ Current Market Rent/ Weighted-Avg. Lease Term Rentable SF Leased Occupancy1 In - Place Rent1 (Yrs.)1 $38.00 / $32.39 333,014 95.4% 3.6 (17.3% Mark-to-Market) Key Tenants Tenant Sq. Ft. % of Property RSF Humana Insurance Co. 71,221 21.4% Avenue 5 Residential 23,601 7.1% Arizona Community Foundation 23,404 7.0% Key Highlights Anchor Centre is strategically positioned near 24th Street and Camelback, the most prominent intersection in Phoenix. The project offers unparalleled amenities and sophistication within a vibrant urban core. Anchor Centre offers its tenants various amenities such as a modernized entry, added visitor parking with direct access to Camelback Road, a new outdoor common area with a central water feature, shaded seating and wireless Internet access. Additional on-site amenities include a fitness center, a conference/boardroom and a new 5,000-square-foot restaurant and bar. The property is also within walking distance to a variety of nationally recognized retailers, hotels and more than 30 different restaurants. The property remains at a strong occupancy level relative to competition in the market and during 2019 benefitted from retaining a number of tenants or quickly backfilling vacated tenants at current market rates. 1 As of December 31, 2019. Leased occupancy includes leases that are signed but commencing in the future. WWW. KBS.COM 21

201 Spear Street Key Statistics San Francisco, CA Current Market Rent/ Weighted-Avg. Lease Term Rentable SF Leased Occupancy1 In - Place Rent (Yrs.)2 $90.00 / $71.70 252,591 96.5% 5.7 (25.52% Mark-to-Market) Key Tenants Tenant Sq. Ft. % of Property RSF We Work 78,869 31.0% Verizon 42,033 16.6% Circle Internet 21,761 8.6% Key Highlights 201 Spear Street features water and Bay Bridge views from majority of the floors, and two outdoor decks. The property has a desirable South of Market Street location in the CBD and is two blocks from the BART, Transbay Terminal and the iconic Ferry Building. KBS recently repositioned the property by remodeling elevator lobbies, corridors, and restrooms, as well as remodeling the lobby and adding a private tenant lounge, and conference facilities. 70% of the tenant improvement are new, modern, creative tech space. Bridge Bank signed a renewal/expansion lease for 14,012 SF, 7 years of term, and $78.0 starting rent PSF. The South of Market Street location in the CBD has high barriers to entry and Measure M will severely limit future development. Presently there are no new spec office buildings delivering until 2022. Technology companies continue to 1 As of December 31, 2019. Leased occupancy includes leases that are signed but commencing in expand, and the young educated workforce wants to work in San Francisco. Asking rents in the market have reached new the future. highs. WWW. KBS.COM 22
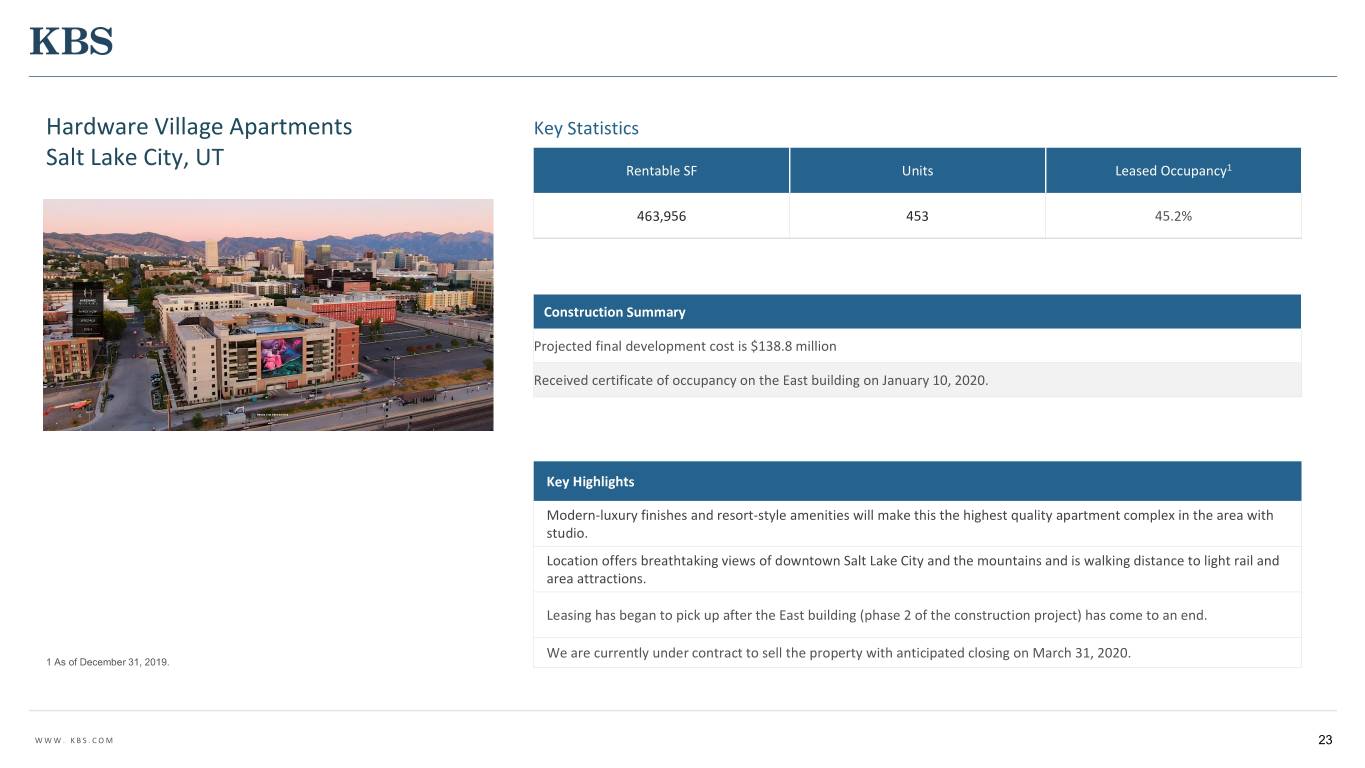
Hardware Village Apartments Key Statistics Salt Lake City, UT Rentable SF Units Leased Occupancy1 463,956 453 45.2% Construction Summary Projected final development cost is $138.8 million Received certificate of occupancy on the East building on January 10, 2020. Key Highlights Modern-luxury finishes and resort-style amenities will make this the highest quality apartment complex in the area with studio. Location offers breathtaking views of downtown Salt Lake City and the mountains and is walking distance to light rail and area attractions. Leasing has began to pick up after the East building (phase 2 of the construction project) has come to an end. We are currently under contract to sell the property with anticipated closing on March 31, 2020. 1 As of December 31, 2019. WWW. KBS.COM 23
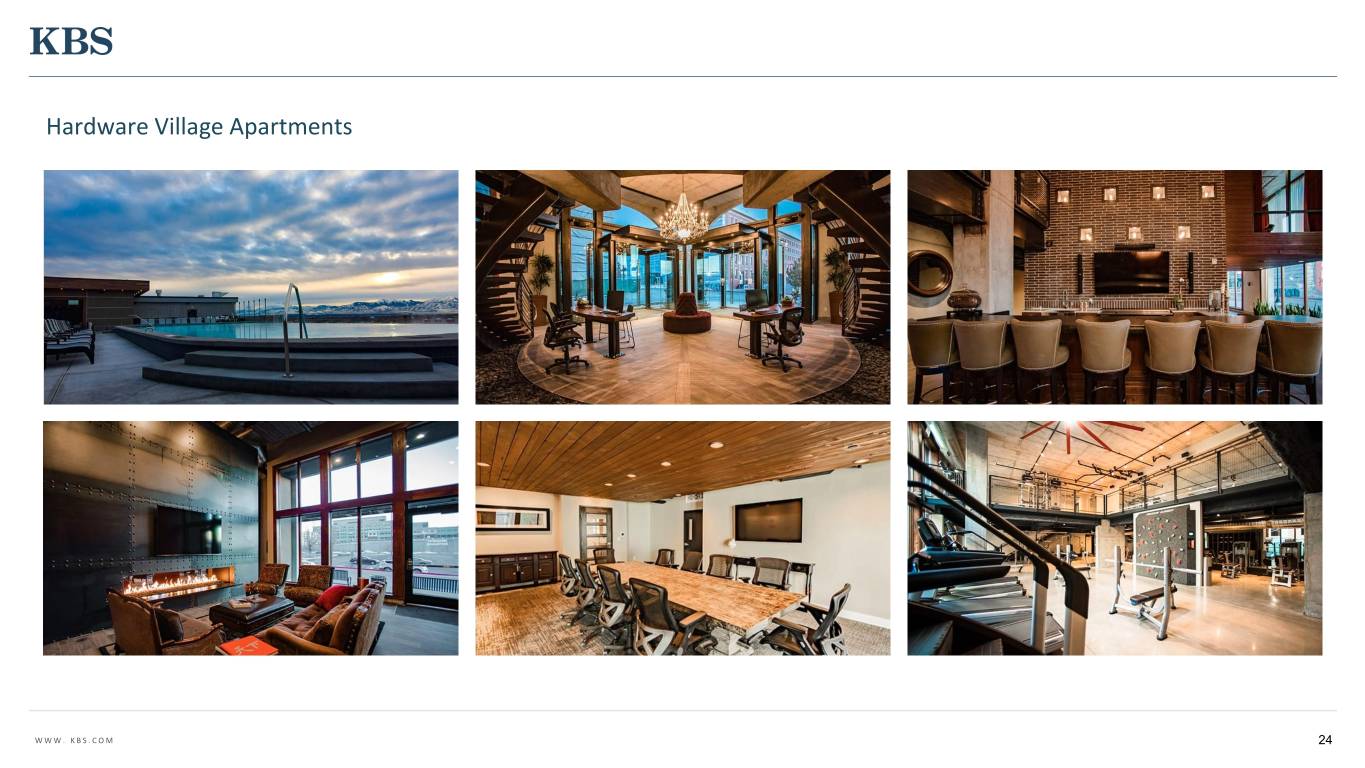
Hardware Village Apartments WWW. KBS.COM 24

Park Place Village Key Statistics Leawood, KS Current Market Rent/ Weighted-Avg. Lease Term Rentable SF Leased Occupancy1 In - Place Rent1 (Yrs.)1 90.7% Office $29.00 / $29.29 483,984 6.4 79.2% Retail (-0.1% Mark-to-Market) Key Tenants Tenant Sq. Ft. % of Property RSF AMC 163,655 33.8% SCOR Global 40,286 8.3% RPS Financial 32,523 6.7% Key Highlights Park Place Village is a multi-tenant mixed-use office and retail property located in Kansas City’s South Johnson County submarket. Anchored by the headquarters of American Multi-Cinema (AMC), the property includes 10 buildings that were developed in phases starting in 2007. Park Place includes a dynamic mix of tenants and offers many amenities including boutique shops, upscale restaurants and cafes. In 2019, KBS generated 211,214 square feet of new, renewal and expansion leasing. This was highlighted by the 150k SF renewal of AMC’s world headquarters. While KBS had success in leasing, the Property did see more than 62k SF of tenants vacate throughout 2019. Park Place Village was marketed for sale in September 2019 by Cushman & Wakefield and CBRE. KBS has elected to temporarily remove the property from the market to lease up the remaining vacancy. 1 As of December 31, 2019. Leased occupancy includes leases that are signed but commencing in the future. WWW. KBS.COM 25

201 17th Street Key Statistics Atlanta, GA Current Market Rent/ Weighted-Avg. Lease Term Rentable SF Leased Occupancy1 In - Place Rent2 (Yrs.)2 $37.50 / $31.05 355,870 96.9% 7.1 (20.8% Mark-to-Market) Key Tenants Tenant Sq. Ft. % of Property RSF WorldPay US Inc. 130,088 36.5% Nelson Mullins 117,517 33.0% EMA Management Services 9,122 2.6% Key Highlights Office-using employment continues a steady rise in metro Atlanta with an urbanization trend from suburbs to urban core. Nelson Mullins (117,517 SF, exp 12/31/28) signed an expansion for 5,145 SF starting 4/1/20, $41.10/SF, $20.00 TI. WorldPay (130,088 SF, exp 3/31/27) acquired by FIS in July 2019 are consolidating Atlanta operations to 6-floors at 201 17th Street and are engaged on a possible expansion of another full floor. The property features a state-of-the-art conference center with seven collaborative meeting spaces that accommodate groups of 7-75. 201 17th Street has excellent access with 10 means of ingress and 8 means of egress and exposure off I- 1 As of December 31, 2019. Leased occupancy includes leases that are signed but commencing in the future. 85 and I-75. The property is part of Atlantic Station, one of the Southeast’s premier mixed-use communities. 2 Full Service Gross Rents WWW. KBS.COM 26

Strategic Plan Update - NAV Conversion 27
NAV Conversion Conversion to an NAV REIT fulfills certain key Following the Portfolio Sale, the objectives of the Company including the current Company’s Board of Directors finalized portfolio size and performance, shareholder desire for a review of strategic alternatives in an liquidity as well as their desire to stay invested and effort to further enhance shareholder current market environments. liquidity and maximize shareholder value. The board has determined to pursue conversion into an NAV REIT. NAV REITs at a Glance Perpetual Life Investment Vehicle Potential enhanced liquidity, up to 20% of equity per year Frequent valuations Lower up-front fees WWW. KBS.COM 28
NAV Conversion NAV Conversion Process and Timeline The NAV conversion process requires us to proxy the shareholders of KBS REIT III with respect to two proposals related to KBS REIT III’s conversion to an NAV REIT. The anticipated timeline is as follows: Finalize Proxy with the SEC and send out proxy statement for shareholder vote January 2020 Hold shareholder meeting and announce voting results Spring 2020 Provide enhanced shareholder liquidity Q2 - Q3 2020 Potential Conversion to an NAV REIT Q3 - Q4 2020 WWW. KBS.COM 29
REIT III Goals & Objectives Provide enhanced shareholder liquidity Pursue NAV REIT Conversion Complete major capital projects, such as renovations or amenity enhancements, with the goal of attracting quality tenants Complete disposition of Hardware Village property Lease-up and stabilize all properties in the portfolio with an emphasis in capital investments leading to stabilized occupancy at increased market rental rates Distribute operating cash flows to stockholders Continue to monitor the properties in the portfolio for beneficial sale opportunities in order to maximize value WWW. KBS.COM 30
Q&A For additional questions, contact KBS Capital Markets Group Investor Relations (866) 527-4264 31
