Attached files
| file | filename |
|---|---|
| 8-K - 8-K - HUNTINGTON BANCSHARES INC /MD/ | hban-2020x03x11x8k.htm |
RBC Capital Markets Financial Institutions Conference March 11, 2020 The Huntington National Bank is Member FDIC. ®, Huntington® and Huntington. Welcome.® are federally registered service marks of Huntington Bancshares Incorporated. ©2020 Huntington Bancshares Incorporated.
Disclaimer CAUTION REGARDING FORWARD-LOOKING STATEMENTS This communication contains certain forward-looking statements, including, but not limited to, certain plans, expectations, goals, projections, and statements, which are not historical facts and are subject to numerous assumptions, risks, and uncertainties. Statements that do not describe historical or current facts, including statements about beliefs and expectations, are forward-looking statements. Forward-looking statements may be identified by words such as expect, anticipate, believe, intend, estimate, plan, target, goal, or similar expressions, or future or conditional verbs such as will, may, might, should, would, could, or similar variations. The forward-looking statements are intended to be subject to the safe harbor provided by Section 27A of the Securities Act of 1933, Section 21E of the Securities Exchange Act of 1934, and the Private Securities Litigation Reform Act of 1995. While there is no assurance that any list of risks and uncertainties or risk factors is complete, below are certain factors which could cause actual results to differ materially from those contained or implied in the forward-looking statements: changes in general economic, political, or industry conditions; uncertainty in U.S. fiscal and monetary policy, including the interest rate policies of the Federal Reserve Board; volatility and disruptions in global capital and credit markets; movements in interest rates; reform of LIBOR; competitive pressures on product pricing and services; success, impact, and timing of our business strategies, including market acceptance of any new products or services implementing our “Fair Play” banking philosophy; the nature, extent, timing, and results of governmental actions, examinations, reviews, reforms, regulations, and interpretations, including those related to the Dodd-Frank Wall Street Reform and Consumer Protection Act and the Basel III regulatory capital reforms, as well as those involving the OCC, Federal Reserve, FDIC, and CFPB; and other factors that may affect our future results. Additional factors that could cause results to differ materially from those described above can be found in our 2019 Annual Report on Form 10-K, as well as our subsequent Securities and Exchange Commission (“SEC”) filings, which are on file with the SEC and available in the “Investor Relations” section of our website, http://www.huntington.com, under the heading “Publications and Filings.” All forward-looking statements speak only as of the date they are made and are based on information available at that time. We do not assume any obligation to update forward-looking statements to reflect circumstances or events that occur after the date the forward-looking statements were made or to reflect the occurrence of unanticipated events except as required by federal securities laws. As forward-looking statements involve significant risks and uncertainties, caution should be exercised against placing undue reliance on such statements. 2020 RBC Capital Markets Financial Institutions Conference 2
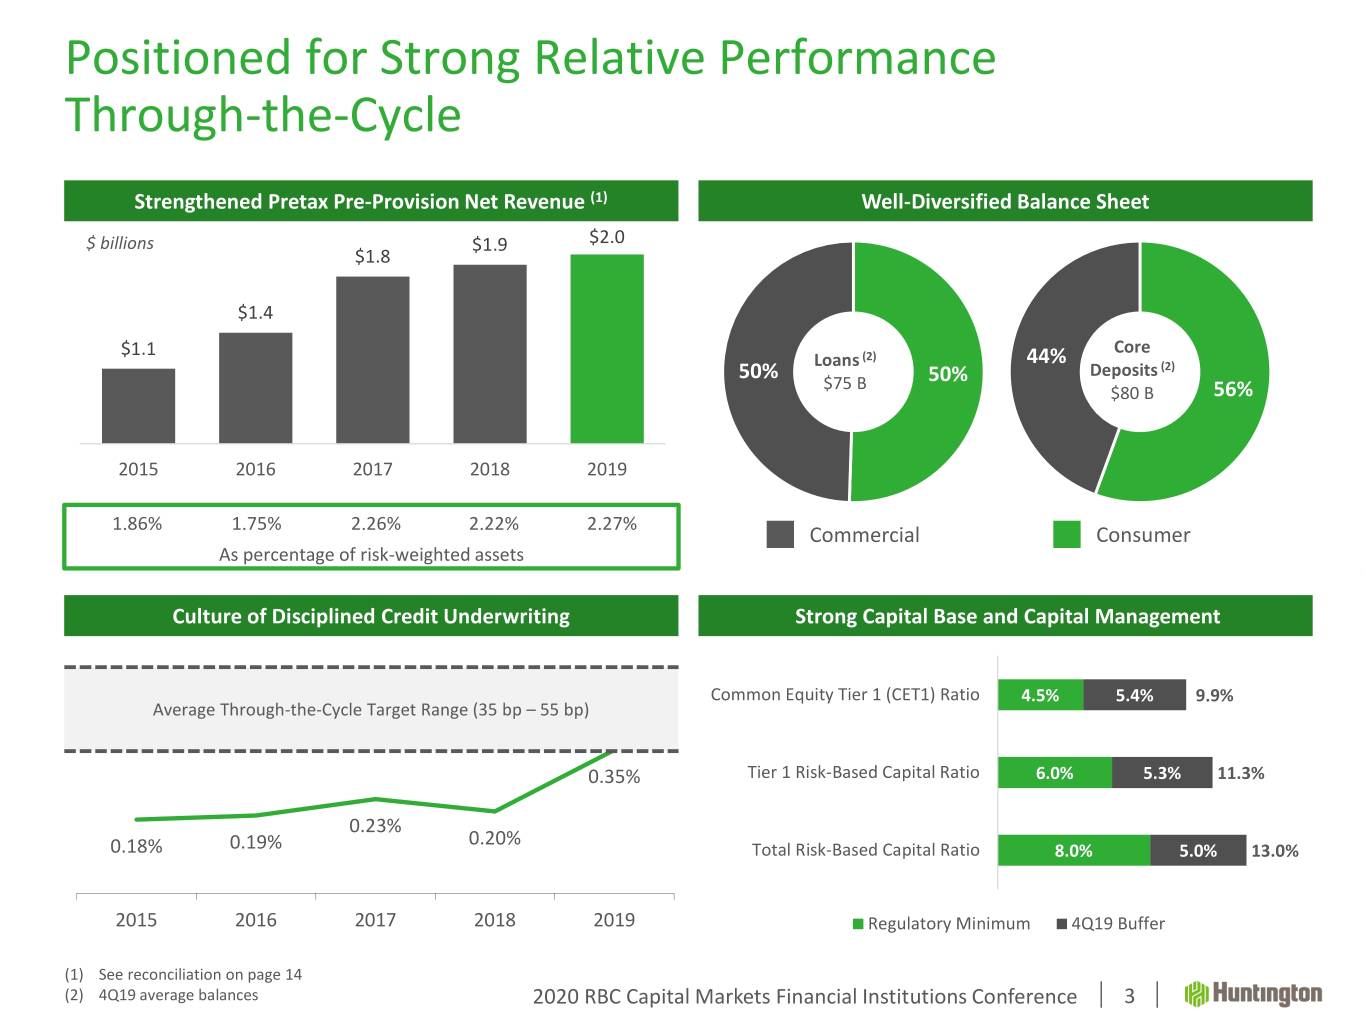
Positioned for Strong Relative Performance Through-the-Cycle Strengthened Pretax Pre-Provision Net Revenue (1) Well-Diversified Balance Sheet $ billions $1.9 $2.0 $1.8 $1.4 $1.1 Core Loans (2) 44% Deposits (2) 50% $75 B 50% $80 B 56% 2015 2016 2017 2018 2019 1.86% 1.75% 2.26% 2.22% 2.27% Commercial Consumer As percentage of risk-weighted assets Culture of Disciplined Credit Underwriting Strong Capital Base and Capital Management Common Equity Tier 1 (CET1) Ratio 4.5% 5.4% 9.9% Average Through-the-Cycle Target Range (35 bp – 55 bp) 0.35% Tier 1 Risk-Based Capital Ratio 6.0% 5.3% 11.3% 0.23% 0.20% 0.18% 0.19% Total Risk-Based Capital Ratio 8.0% 5.0% 13.0% 2015 2016 2017 2018 2019 Regulatory Minimum 4Q19 Buffer (1) See reconciliation on page 14 (2) 4Q19 average balances 2020 RBC Capital Markets Financial Institutions Conference 3
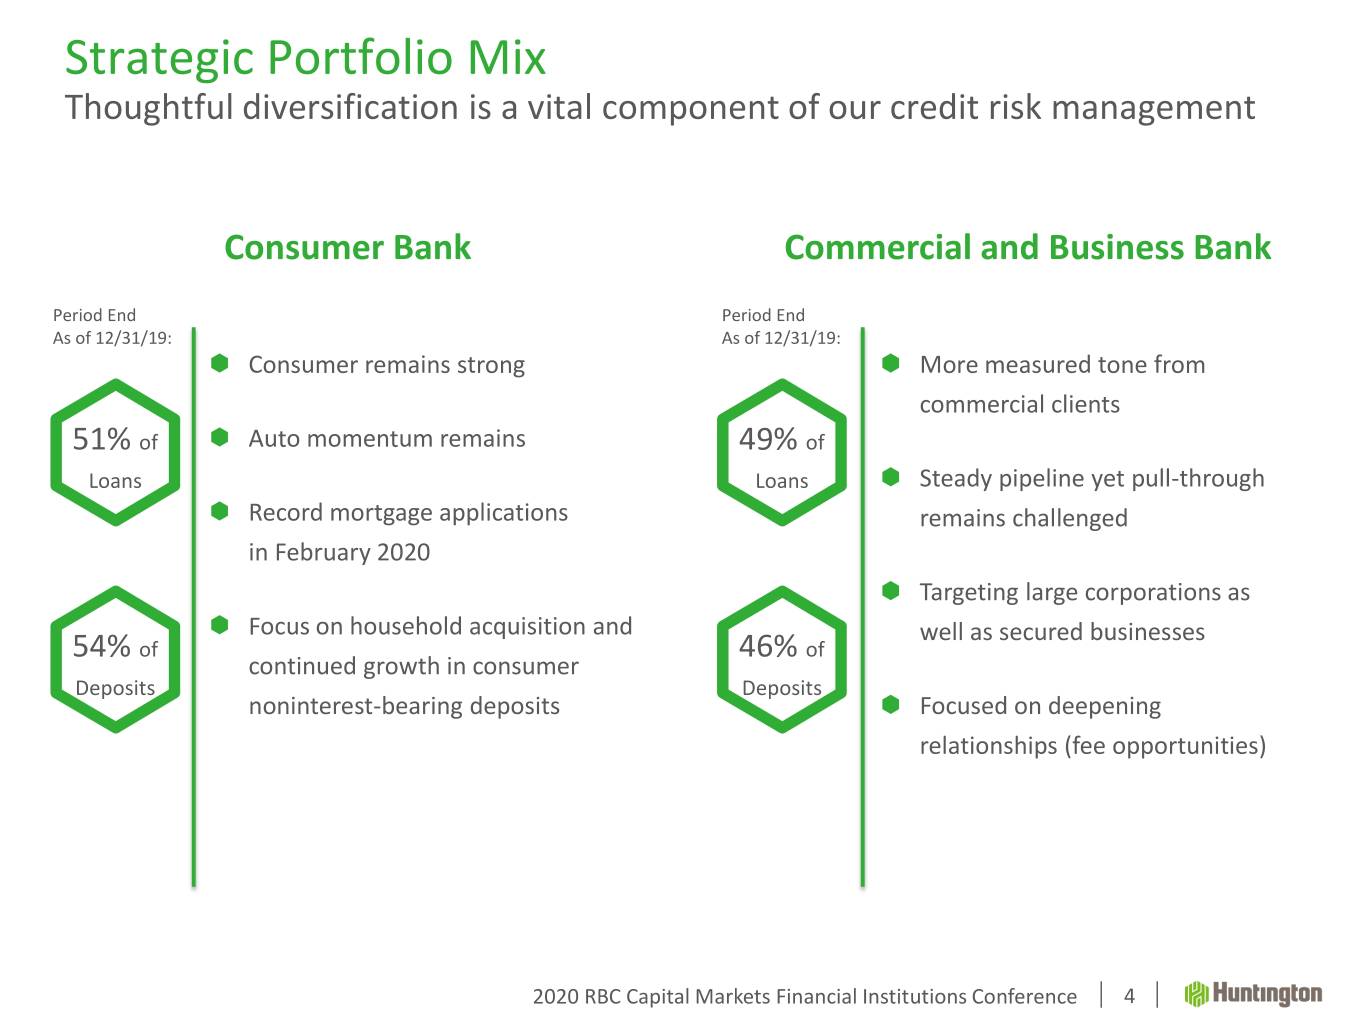
Strategic Portfolio Mix Thoughtful diversification is a vital component of our credit risk management Consumer Bank Commercial and Business Bank Period End Period End As of 12/31/19: As of 12/31/19: Consumer remains strong More measured tone from commercial clients 51% of Auto momentum remains 49% of Loans Loans Steady pipeline yet pull-through Record mortgage applications remains challenged in February 2020 Targeting large corporations as Focus on household acquisition and well as secured businesses 54% of 46% of continued growth in consumer Deposits Deposits noninterest-bearing deposits Focused on deepening relationships (fee opportunities) 2020 RBC Capital Markets Financial Institutions Conference 4
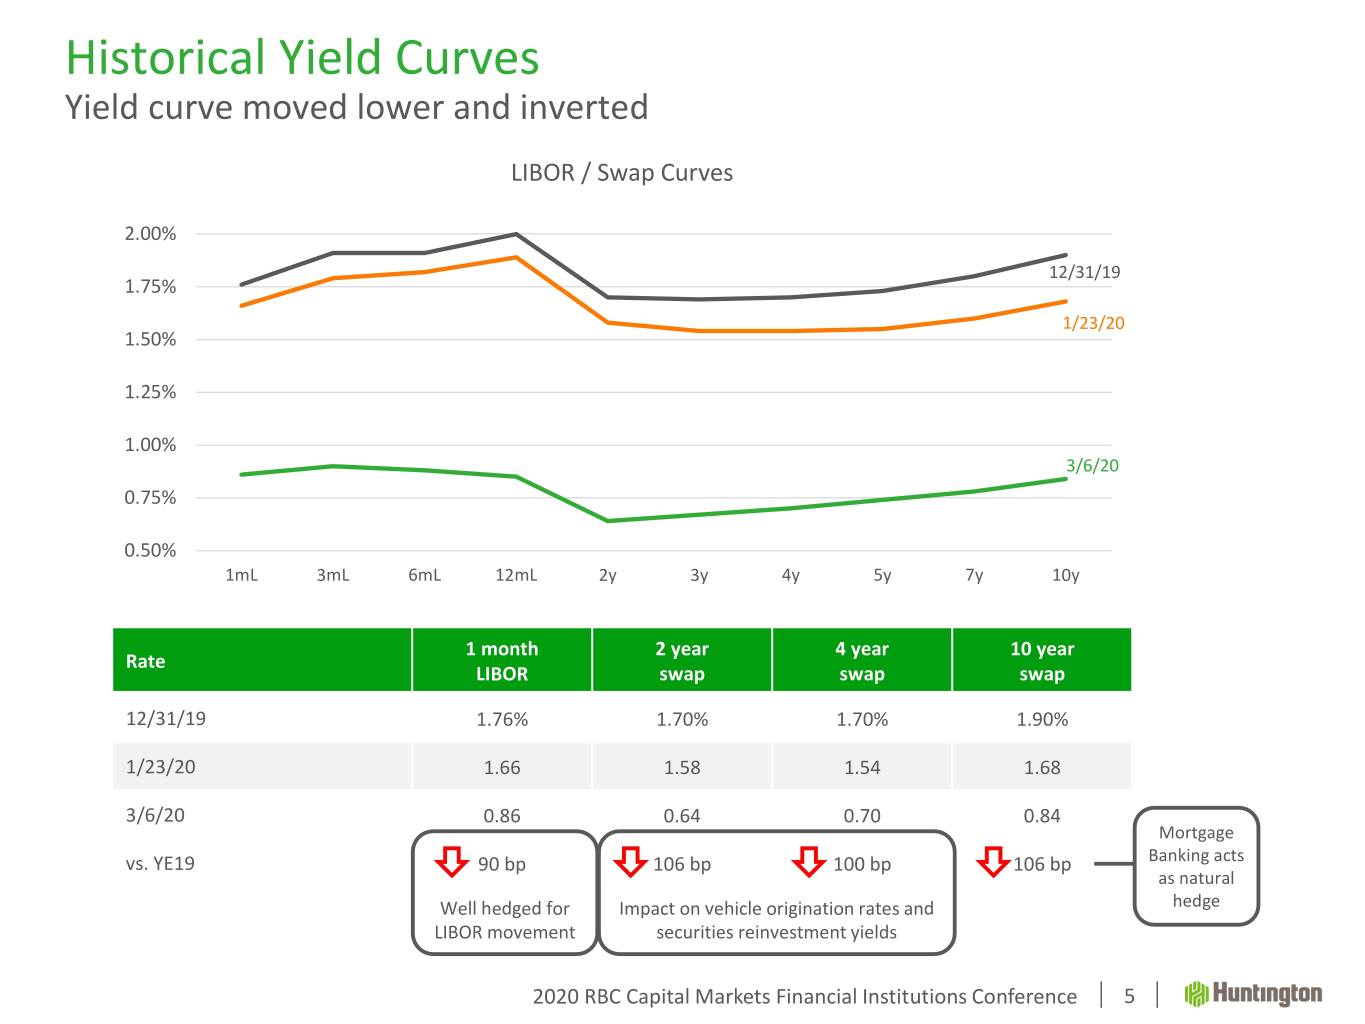
Historical Yield Curves Yield curve moved lower and inverted LIBOR / Swap Curves 2.00% 12/31/19 1.75% 1/23/20 1.50% 1.25% 1.00% 3/6/20 0.75% 0.50% 1mL 3mL 6mL 12mL 2y 3y 4y 5y 7y 10y 1 month 2 year 4 year 10 year Rate LIBOR swap swap swap 12/31/19 1.76% 1.70% 1.70% 1.90% 1/23/20 1.66 1.58 1.54 1.68 3/6/20 0.86 0.64 0.70 0.84 Mortgage vs. YE19 90 bp 106 bp 100 bp 106 bp Banking acts as natural Well hedged for Impact on vehicle origination rates and hedge LIBOR movement securities reinvestment yields 2020 RBC Capital Markets Financial Institutions Conference 5
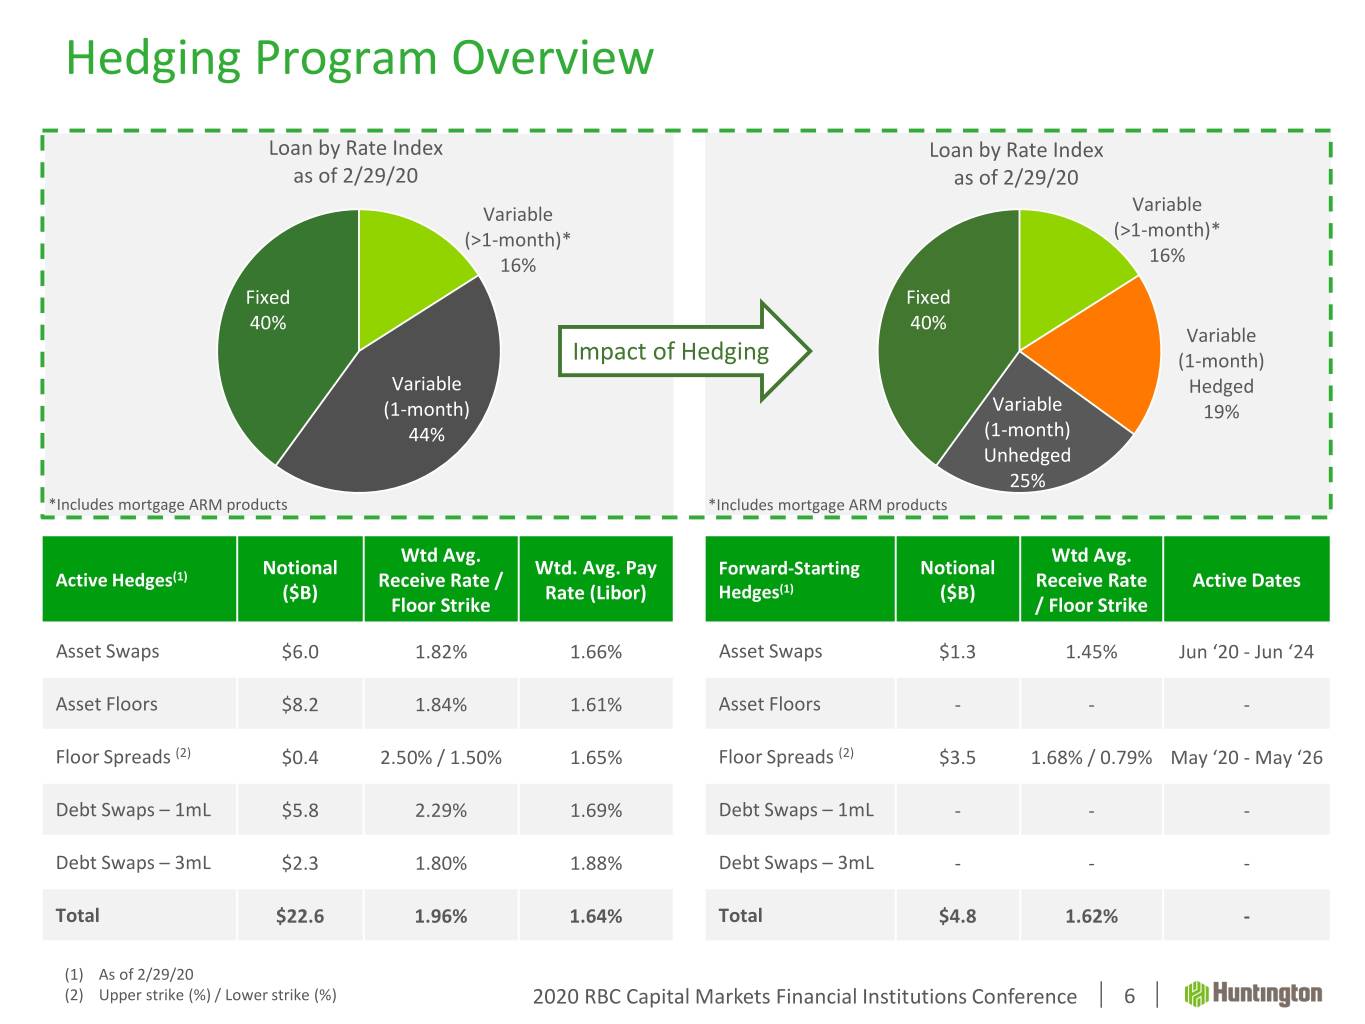
Hedging Program Overview Loan by Rate Index Loan by Rate Index as of 2/29/20 as of 2/29/20 Variable Variable (>1-month)* (>1-month)* 16% 16% Fixed Fixed 40% 40% Variable Impact of Hedging (1-month) Variable Hedged (1-month) Variable 19% 44% (1-month) Unhedged 25% *Includes mortgage ARM products *Includes mortgage ARM products Wtd Avg. Wtd Avg. Notional Wtd. Avg. Pay Forward-Starting Notional Active Hedges(1) Receive Rate / Receive Rate Active Dates ($B) Rate (Libor) Hedges(1) ($B) Floor Strike / Floor Strike Asset Swaps $6.0 1.82% 1.66% Asset Swaps $1.3 1.45% Jun ‘20 - Jun ‘24 Asset Floors $8.2 1.84% 1.61% Asset Floors - - - Floor Spreads (2) $0.4 2.50% / 1.50% 1.65% Floor Spreads (2) $3.5 1.68% / 0.79% May ‘20 - May ‘26 Debt Swaps – 1mL $5.8 2.29% 1.69% Debt Swaps – 1mL - - - Debt Swaps – 3mL $2.3 1.80% 1.88% Debt Swaps – 3mL - - - Total $22.6 1.96% 1.64% Total $4.8 1.62% - (1) As of 2/29/20 (2) Upper strike (%) / Lower strike (%) 2020 RBC Capital Markets Financial Institutions Conference 6
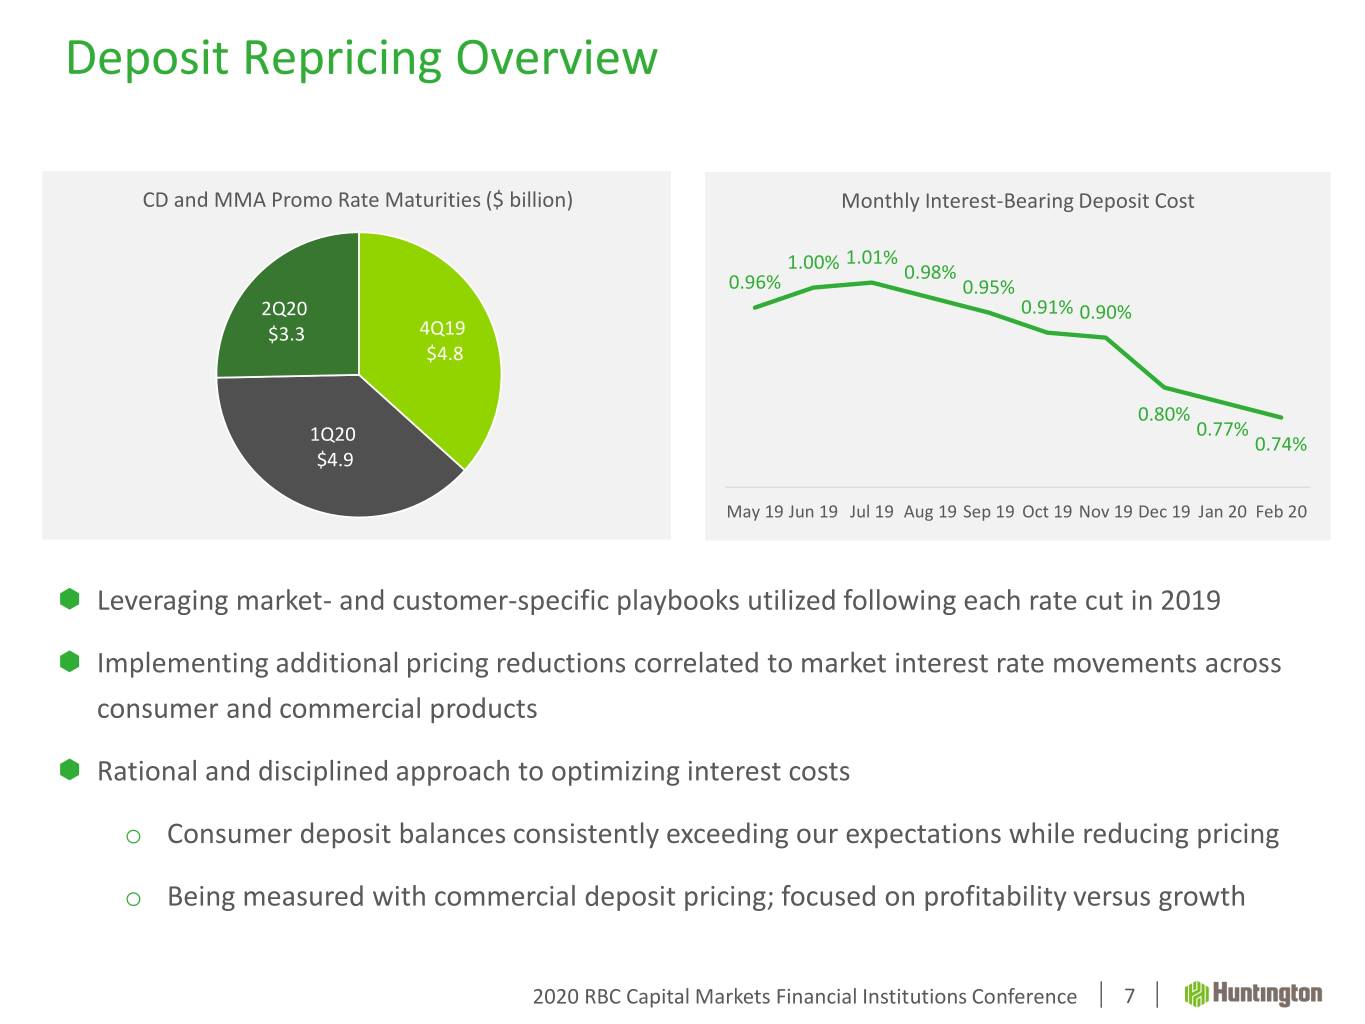
Deposit Repricing Overview CD and MMA Promo Rate Maturities ($ billion) Monthly Interest-Bearing Deposit Cost 1.01% 1.00% 0.98% 0.96% 0.95% 2Q20 0.91% 0.90% $3.3 4Q19 $4.8 0.80% 0.77% 1Q20 0.74% $4.9 May 19 Jun 19 Jul 19 Aug 19 Sep 19 Oct 19 Nov 19 Dec 19 Jan 20 Feb 20 Leveraging market- and customer-specific playbooks utilized following each rate cut in 2019 Implementing additional pricing reductions correlated to market interest rate movements across consumer and commercial products Rational and disciplined approach to optimizing interest costs o Consumer deposit balances consistently exceeding our expectations while reducing pricing o Being measured with commercial deposit pricing; focused on profitability versus growth 2020 RBC Capital Markets Financial Institutions Conference 7
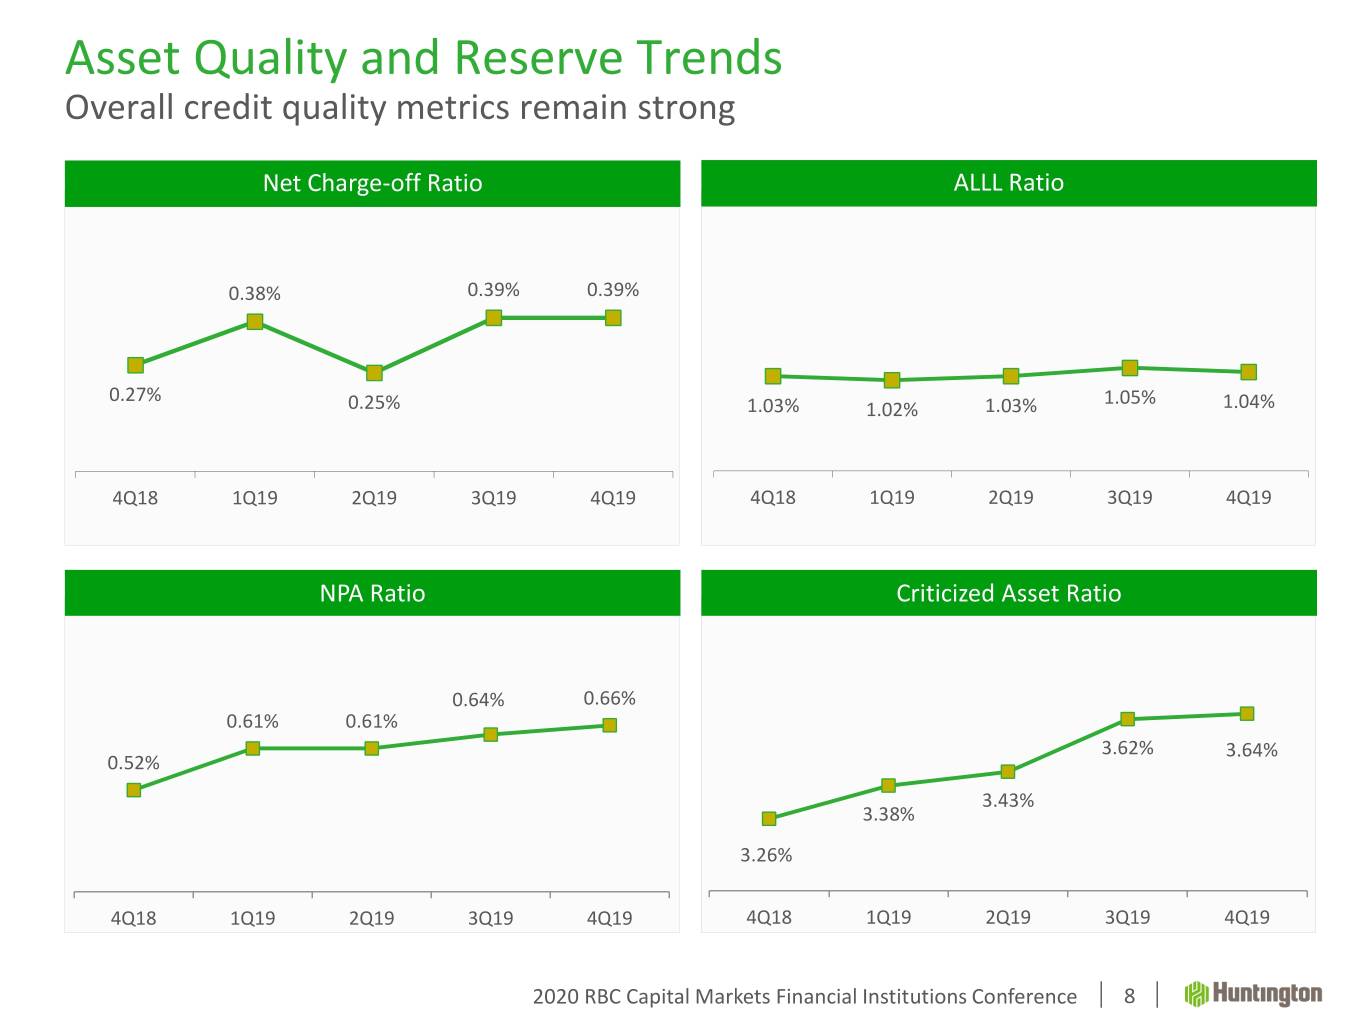
Asset Quality and Reserve Trends Overall credit quality metrics remain strong Net Charge-off Ratio ALLL Ratio 0.38% 0.39% 0.39% 0.27% 1.05% 0.25% 1.03% 1.02% 1.03% 1.04% 4Q18 1Q19 2Q19 3Q19 4Q19 4Q18 1Q19 2Q19 3Q19 4Q19 NPA Ratio Criticized Asset Ratio 0.64% 0.66% 0.61% 0.61% 3.62% 3.64% 0.52% 3.43% 3.38% 3.26% 4Q18 1Q19 2Q19 3Q19 4Q19 4Q18 1Q19 2Q19 3Q19 4Q19 2020 RBC Capital Markets Financial Institutions Conference 8
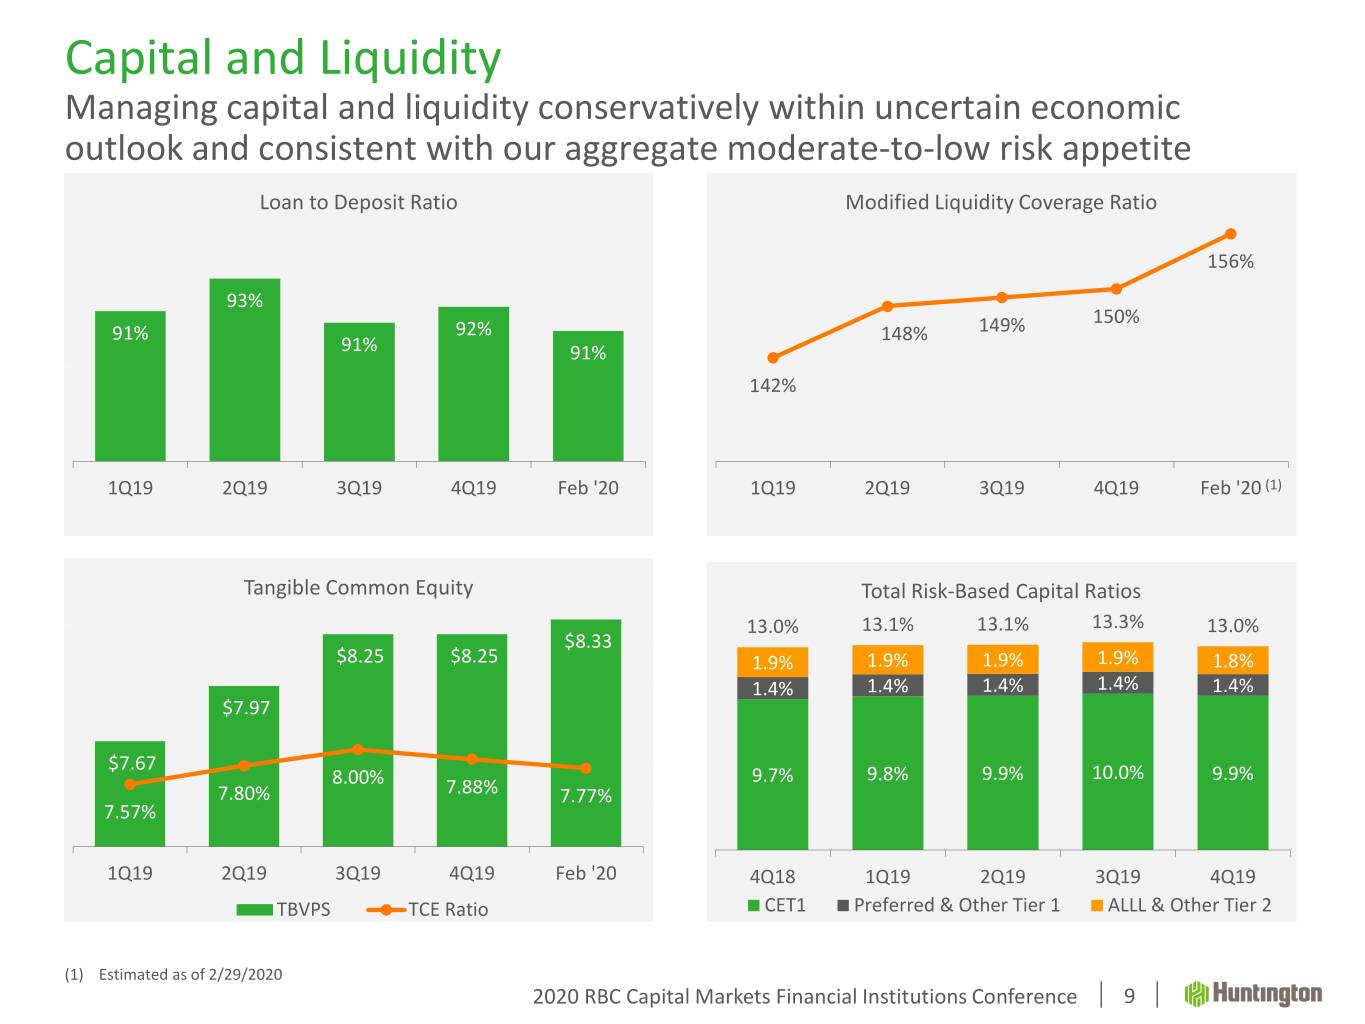
Capital and Liquidity Managing capital and liquidity conservatively within uncertain economic outlook and consistent with our aggregate moderate-to-low risk appetite Loan to Deposit Ratio $1.60 Modified Liquidity Coverage Ratio $0.95 $1.55 156% $0.93 $1.50 93% $0.91 150% 91% 92% $1.45 148% 149% 91% 91% $0.89 $1.40 142% $0.87 $1.35 $0.85 $1.30 1Q19 2Q19 3Q19 4Q19 Feb '20 1Q19 2Q19 3Q19 4Q19 Feb '20 (1) $8.50 Tangible Common Equity Total Risk-Based Capital Ratios 9.80% $8.30 13.0% 13.1% 13.1% 13.3% 13.0% $8.33 9.30% $8.10 $8.25 $8.25 1.9% 1.9% 1.9% 1.9% 1.8% 8.80% 1.4% 1.4% 1.4% 1.4% $7.90 1.4% $7.97 8.30% $7.70 7.80% $7.50 $7.67 8.00% 9.7% 9.8% 9.9% 10.0% 9.9% 7.80% 7.88% 7.77% 7.30% $7.30 7.57% $7.10 6.80% 1Q19 2Q19 3Q19 4Q19 Feb '20 4Q18 1Q19 2Q19 3Q19 4Q19 TBVPS TCE Ratio CET1 Preferred & Other Tier 1 ALLL & Other Tier 2 (1) Estimated as of 2/29/2020 2020 RBC Capital Markets Financial Institutions Conference 9
Important Messages Building long-term shareholder value Consistent organic growth Maintain aggregate moderate-to-low risk appetite Minimize earnings volatility through the cycle Disciplined capital allocation Focus on top quartile financial performance relative to peers Strategic focus on Customer Experience High level of colleague and shareholder alignment Board, management, and colleague ownership collectively represent top 10 shareholder 2020 RBC Capital Markets Financial Institutions Conference 10

Appendix
Basis of Presentation Use of Non-GAAP Financial Measures This document contains GAAP financial measures and non-GAAP financial measures where management believes it to be helpful in understanding Huntington’s results of operations or financial position. Where non-GAAP financial measures are used, the comparable GAAP financial measure, as well as the reconciliation to the comparable GAAP financial measure, can be found in this document, conference call slides, or the Form 8-K related to this document, all of which can be found in the Investor Relations section of Huntington’s website, http://www.huntington.com. Annualized Data Certain returns, yields, performance ratios, or quarterly growth rates are presented on an “annualized” basis. This is done for analytical and decision-making purposes to better discern underlying performance trends when compared to full-year or year-over- year amounts. For example, loan and deposit growth rates, as well as net charge-off percentages, are most often expressed in terms of an annual rate like 8%. As such, a 2% growth rate for a quarter would represent an annualized 8% growth rate. Fully-Taxable Equivalent Interest Income and Net Interest Margin Income from tax-exempt earning assets is increased by an amount equivalent to the taxes that would have been paid if this income had been taxable at statutory rates. This adjustment puts all earning assets, most notably tax-exempt municipal securities and certain lease assets, on a common basis that facilitates comparison of results to results of competitors. Earnings per Share Equivalent Data Significant income or expense items may be expressed on a per common share basis. This is done for analytical and decision- making purposes to better discern underlying trends in total corporate earnings per share performance excluding the impact of such items. Investors may also find this information helpful in their evaluation of our financial performance against published earnings per share mean estimate amounts, which typically exclude the impact of Significant Items. Earnings per share equivalents are usually calculated by applying an effective tax rate to a pre-tax amount to derive an after-tax amount, which is divided by the average shares outstanding during the respective reporting period. Occasionally, when the item involves special tax treatment, the after-tax amount is disclosed separately, with this then being the amount used to calculate the earnings per share equivalent. 2020 RBC Capital Markets Financial Institutions Conference 12
Basis of Presentation Rounding Please note that columns of data in this document may not add due to rounding. Significant Items From time to time, revenue, expenses, or taxes are impacted by items judged by management to be outside of ordinary banking activities and/or by items that, while they may be associated with ordinary banking activities, are so unusually large that their outsized impact is believed by management at that time to be infrequent or short term in nature. We refer to such items as “Significant Items”. Most often, these Significant Items result from factors originating outside the company – e.g., regulatory actions/assessments, windfall gains, changes in accounting principles, one-time tax assessments/refunds, and litigation actions. In other cases they may result from management decisions associated with significant corporate actions out of the ordinary course of business – e.g., merger/restructuring charges, recapitalization actions, and goodwill impairment. Even though certain revenue and expense items are naturally subject to more volatility than others due to changes in market and economic environment conditions, as a general rule volatility alone does not define a Significant Item. For example, changes in the provision for credit losses, gains/losses from investment activities, and asset valuation write-downs reflect ordinary banking activities and are, therefore, typically excluded from consideration as a Significant Item. Management believes the disclosure of “Significant Items”, when appropriate, aids analysts/investors in better understanding corporate performance and trends so that they can ascertain which of such items, if any, they may wish to include/exclude from their analysis of the company’s performance - i.e., within the context of determining how that performance differed from their expectations, as well as how, if at all, to adjust their estimates of future performance accordingly. To this end, management has adopted a practice of listing “Significant Items” in our external disclosure documents (e.g., earnings press releases, quarterly performance discussions, investor presentations, Forms 10-Q and 10-K). “Significant Items” for any particular period are not intended to be a complete list of items that may materially impact current or future period performance. A number of items could materially impact these periods, including those which may be described from time to time in Huntington’s filings with the Securities and Exchange Commission. 2020 RBC Capital Markets Financial Institutions Conference 13
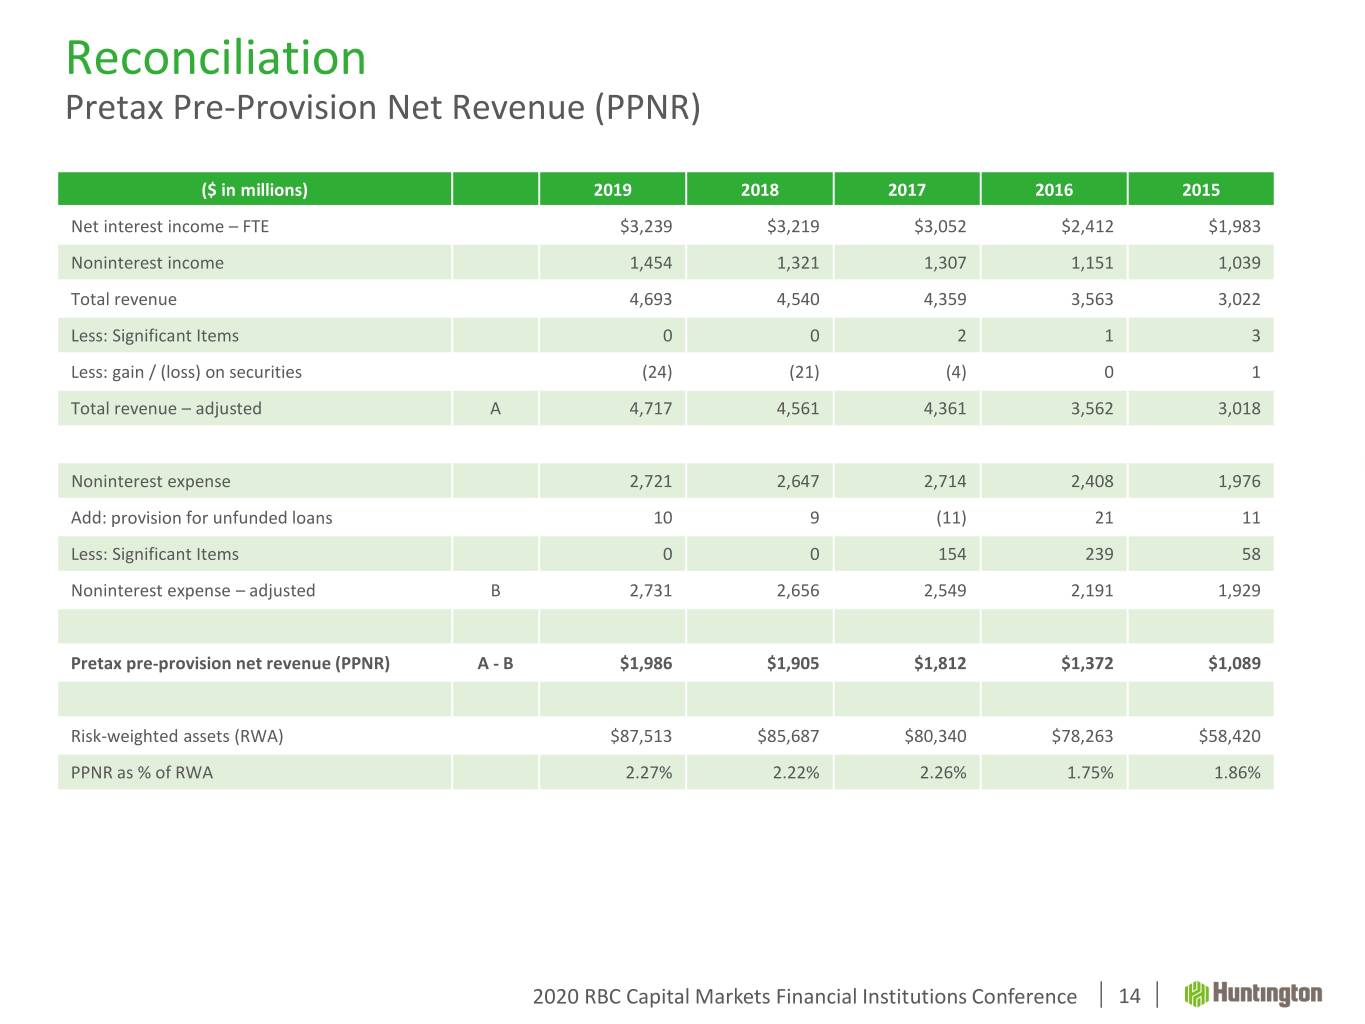
Reconciliation Pretax Pre-Provision Net Revenue (PPNR) ($ in millions) 2019 2018 2017 2016 2015 Net interest income – FTE $3,239 $3,219 $3,052 $2,412 $1,983 Noninterest income 1,454 1,321 1,307 1,151 1,039 Total revenue 4,693 4,540 4,359 3,563 3,022 Less: Significant Items 0 0 2 1 3 Less: gain / (loss) on securities (24) (21) (4) 0 1 Total revenue – adjusted A 4,717 4,561 4,361 3,562 3,018 Noninterest expense 2,721 2,647 2,714 2,408 1,976 Add: provision for unfunded loans 10 9 (11) 21 11 Less: Significant Items 0 0 154 239 58 Noninterest expense – adjusted B 2,731 2,656 2,549 2,191 1,929 Pretax pre-provision net revenue (PPNR) A - B $1,986 $1,905 $1,812 $1,372 $1,089 Risk-weighted assets (RWA) $87,513 $85,687 $80,340 $78,263 $58,420 PPNR as % of RWA 2.27% 2.22% 2.26% 1.75% 1.86% 2020 RBC Capital Markets Financial Institutions Conference 14
