Attached files
| file | filename |
|---|---|
| 8-K/A - AMENDMENT NO. 2 - Foresight Energy LP | eh2000465_8ka2.htm |
EXHIBIT 99.1

Settlement Communication Subject to FRE 408 Foresight Energy Cleansing Materials March 2020 FORESIGHT ENERGY Settlement Communication Subject to FRE 408
Settlement Communication Subject to FRE 408 Settlement Communication Subject to FRE 408 This presentation contains certain forward - looking statements as defined under the federal securities laws . These forward - looking statements may be identified by a reference to a future period or by the use of forward - looking terminology, and include pro forma financial information presented solely for illustrative purposes . Forward - looking statements by their nature address matters that are, to different degrees, uncertain . Forward - looking statements involve a number of assumptions, risks and uncertainties that could cause actual results to differ materially . Disclaimer 2
Settlement Communication Subject to FRE 408 I. DIP Sizing and Liquidity
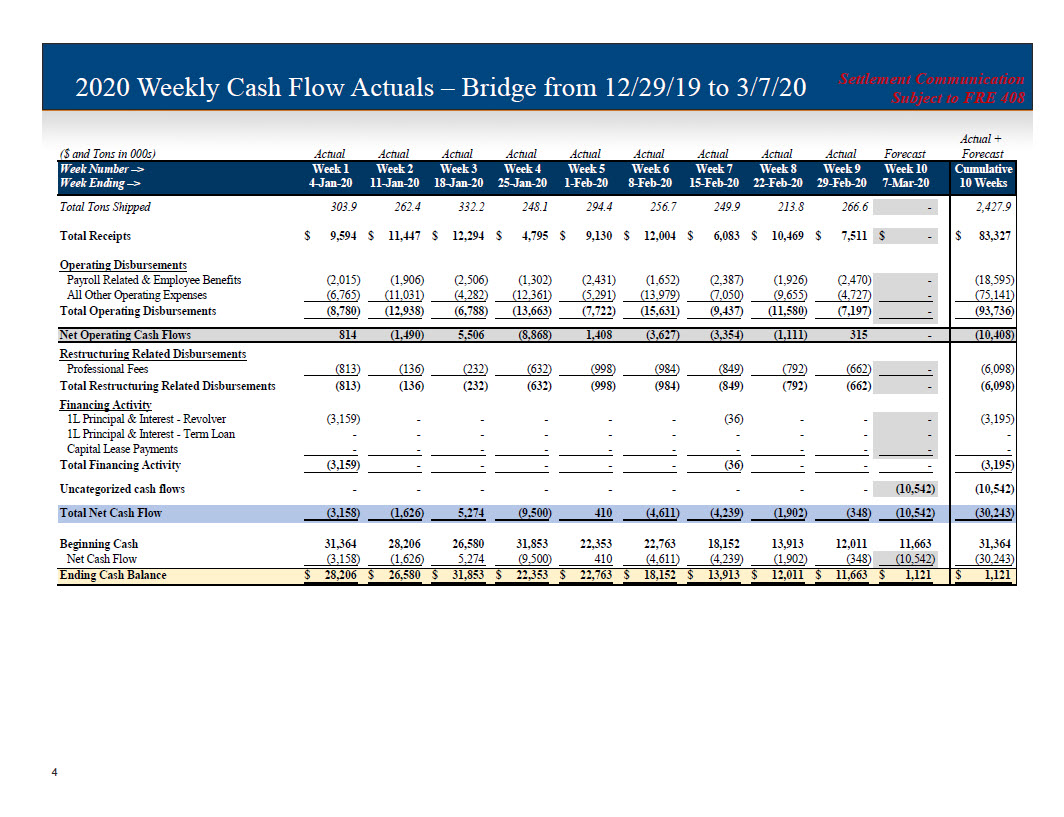
Settlement Communication Subject to FRE 408 Settlement Communication Subject to FRE 408 2020 Weekly Cash Flow Actuals – Bridge from 12/29/19 to 3/7/20 4 Actual + ($ and Tons in 000s) Actual Actual Actual Actual Actual Actual Actual Actual Actual Forecast Forecast Week Number –> Week 1 Week 2 Week 3 Week 4 Week 5 Week 6 Week 7 Week 8 Week 9 Week 10 Cumulative Week Ending –> 4-Jan-20 11-Jan-20 18-Jan-20 25-Jan-20 1-Feb-20 8-Feb-20 15-Feb-20 22-Feb-20 29-Feb-20 7-Mar-20 10 Weeks Total Tons Shipped 303.9 262.4 332.2 248.1 294.4 256.7 249.9 213.8 266.6 - 2,427.9 Total Receipts 9,594$ 11,447$ 12,294$ 4,795$ 9,130$ 12,004$ 6,083$ 10,469$ 7,511$ -$ 83,327$ Operating Disbursements Payroll Related & Employee Benefits (2,015) (1,906) (2,506) (1,302) (2,431) (1,652) (2,387) (1,926) (2,470) - (18,595) All Other Operating Expenses (6,765) (11,031) (4,282) (12,361) (5,291) (13,979) (7,050) (9,655) (4,727) - (75,141) Total Operating Disbursements (8,780) (12,938) (6,788) (13,663) (7,722) (15,631) (9,437) (11,580) (7,197) - (93,736) Net Operating Cash Flows 814 (1,490) 5,506 (8,868) 1,408 (3,627) (3,354) (1,111) 315 - (10,408) Restructuring Related Disbursements Professional Fees (813) (136) (232) (632) (998) (984) (849) (792) (662) - (6,098) Total Restructuring Related Disbursements (813) (136) (232) (632) (998) (984) (849) (792) (662) - (6,098) Financing Activity 1L Principal & Interest - Revolver (3,159) - - - - - (36) - - - (3,195) 1L Principal & Interest - Term Loan - - - - - - - - - - - Capital Lease Payments - - - - - - - - - - - Total Financing Activity (3,159) - - - - - (36) - - - (3,195) Uncategorized cash flows - - - - - - - - - (10,542) (10,542) Total Net Cash Flow (3,158) (1,626) 5,274 (9,500) 410 (4,611) (4,239) (1,902) (348) (10,542) (30,243) Beginning Cash 31,364 28,206 26,580 31,853 22,353 22,763 18,152 13,913 12,011 11,663 31,364 Net Cash Flow (3,158) (1,626) 5,274 (9,500) 410 (4,611) (4,239) (1,902) (348) (10,542) (30,243) Ending Cash Balance 28,206$ 26,580$ 31,853$ 22,353$ 22,763$ 18,152$ 13,913$ 12,011$ 11,663$ 1,121$ 1,121$
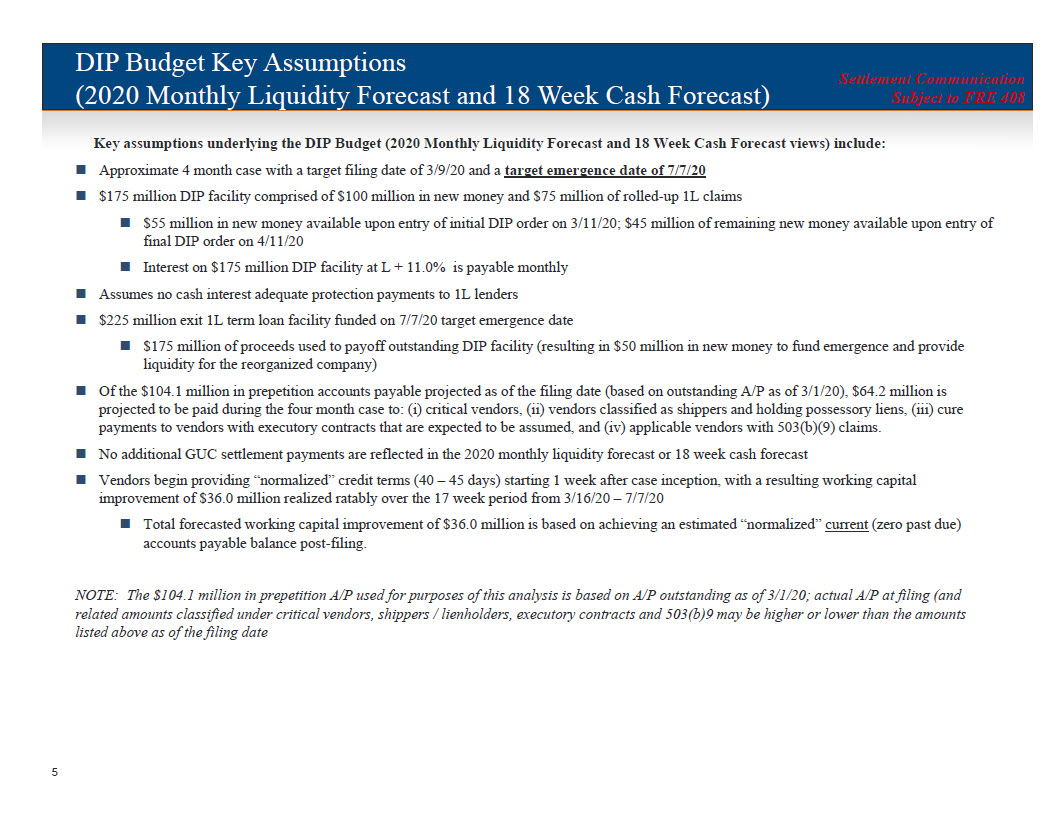
Settlement Communication Subject to FRE 408 Settlement Communication Subject to FRE 408 DIP Budget Key Assumptions (2020 Monthly Liquidity Forecast and 18 Week Cash Forecast) 5 Key assumptions underlying the DIP Budget (2020 Monthly Liquidity Forecast and 18 Week Cash Forecast views) include: Approximate 4 month case with a target filing date of 3/9/20 and a target emergence date of 7/7/20 $175 million DIP facility comprised of $100 million in new money and $75 million of rolled - up 1L claims $55 million in new money available upon entry of initial DIP order on 3/11/20; $45 million of remaining new money available u pon entry of final DIP order on 4/11/20 Interest on $175 million DIP facility at L + 11.0% is payable monthly Assumes no cash interest adequate protection payments to 1L lenders $225 million exit 1L term loan facility funded on 7/7/20 target emergence date $175 million of proceeds used to payoff outstanding DIP facility (resulting in $50 million in new money to fund emergence and pr ovide liquidity for the reorganized company) Of the $104.1 million in prepetition accounts payable projected as of the filing date (based on outstanding A/P as of 3/1/20) , $ 64.2 million is projected to be paid during the four month case to: (i) critical vendors, (ii) vendors classified as shippers and holding pos ses sory liens, (iii) cure payments to vendors with executory contracts that are expected to be assumed, and (iv) applicable vendors with 503(b)(9) clai ms. No additional GUC settlement payments are reflected in the 2020 monthly liquidity forecast or 18 week cash forecast Vendors begin providing “normalized” credit terms (40 – 45 days) starting 1 week after case inception, with a resulting working capital improvement of $36.0 million realized ratably over the 17 week period from 3/16/20 – 7/7/20 Total forecasted working capital improvement of $36.0 million is based on achieving an estimated “normalized” current (zero past due) accounts payable balance post - filing. NOTE: The $104.1 million in prepetition A/P used for purposes of this analysis is based on A/P outstanding as of 3/1/20; act ual A/P at filing (and related amounts classified under critical vendors, shippers / lienholders, executory contracts and 503(b)9 may be higher or l owe r than the amounts listed above as of the filing date
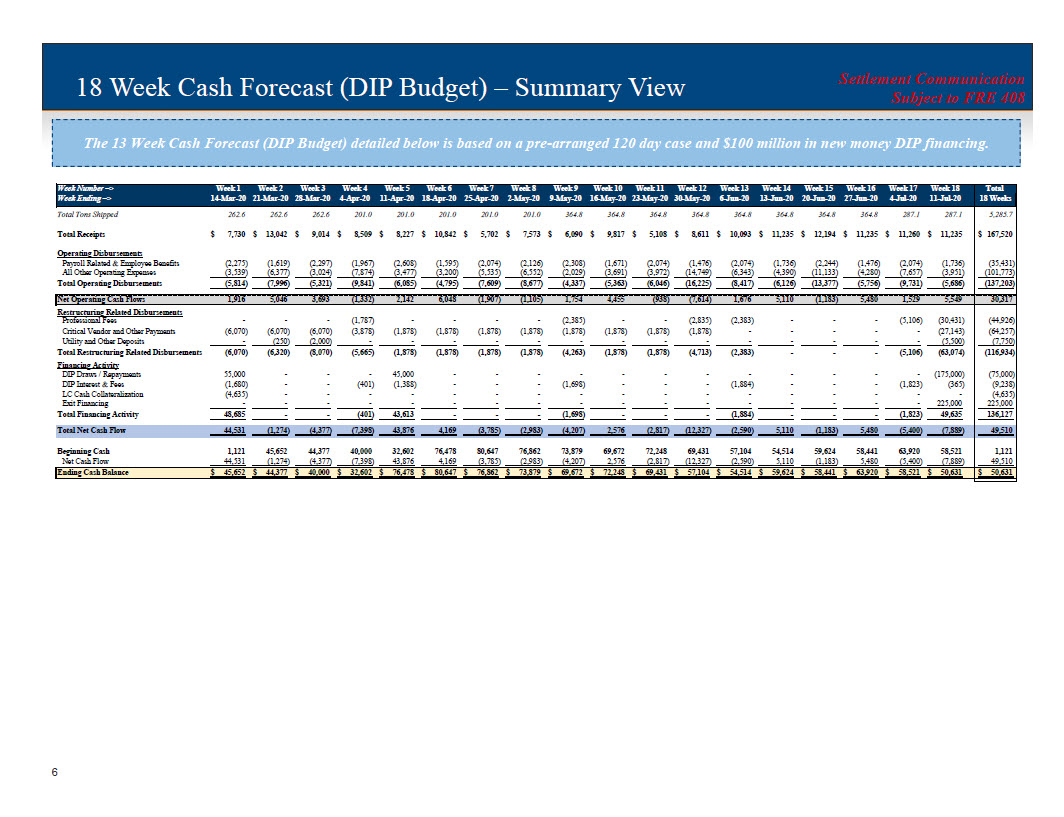
Settlement Communication Subject to FRE 408 Settlement Communication Subject to FRE 408 The 13 Week Cash Forecast (DIP Budget) detailed below is based on a pre - arranged 120 day case and $100 million in new money DIP financing. 18 Week Cash Forecast (DIP Budget) – Summary View 6 Week Number –> Week 1 Week 2 Week 3 Week 4 Week 5 Week 6 Week 7 Week 8 Week 9 Week 10 Week 11 Week 12 Week 13 Week 14 Week 15 Week 16 Week 17 Week 18 Total Week Ending –> 14-Mar-20 21-Mar-20 28-Mar-20 4-Apr-20 11-Apr-20 18-Apr-20 25-Apr-20 2-May-20 9-May-20 16-May-20 23-May-20 30-May-20 6-Jun-20 13-Jun-20 20-Jun-20 27-Jun-20 4-Jul-20 11-Jul-20 18 Weeks Total Tons Shipped 262.6 262.6 262.6 201.0 201.0 201.0 201.0 201.0 364.8 364.8 364.8 364.8 364.8 364.8 364.8 364.8 287.1 287.1 5,285.7 Total Receipts 7,730$ 13,042$ 9,014$ 8,509$ 8,227$ 10,842$ 5,702$ 7,573$ 6,090$ 9,817$ 5,108$ 8,611$ 10,093$ 11,235$ 12,194$ 11,235$ 11,260$ 11,235$ 167,520$ Operating Disbursements Payroll Related & Employee Benefits (2,275) (1,619) (2,297) (1,967) (2,608) (1,595) (2,074) (2,126) (2,308) (1,671) (2,074) (1,476) (2,074) (1,736) (2,244) (1,476) (2,074) (1,736) (35,431) All Other Operating Expenses (3,539) (6,377) (3,024) (7,874) (3,477) (3,200) (5,535) (6,552) (2,029) (3,691) (3,972) (14,749) (6,343) (4,390) (11,133) (4,280) (7,657) (3,951) (101,773) Total Operating Disbursements (5,814) (7,996) (5,321) (9,841) (6,085) (4,795) (7,609) (8,677) (4,337) (5,363) (6,046) (16,225) (8,417) (6,126) (13,377) (5,756) (9,731) (5,686) (137,203) Net Operating Cash Flows 1,916 5,046 3,693 (1,332) 2,142 6,048 (1,907) (1,105) 1,754 4,455 (938) (7,614) 1,676 5,110 (1,183) 5,480 1,529 5,549 30,317 Restructuring Related Disbursements Professional Fees - - - (1,787) - - - - (2,385) - - (2,835) (2,383) - - - (5,106) (30,431) (44,926) Critical Vendor and Other Payments (6,070) (6,070) (6,070) (3,878) (1,878) (1,878) (1,878) (1,878) (1,878) (1,878) (1,878) (1,878) - - - - - (27,143) (64,257) Utility and Other Deposits - (250) (2,000) - - - - - - - - - - - - - - (5,500) (7,750) Total Restructuring Related Disbursements (6,070) (6,320) (8,070) (5,665) (1,878) (1,878) (1,878) (1,878) (4,263) (1,878) (1,878) (4,713) (2,383) - - - (5,106) (63,074) (116,934) Financing Activity DIP Draws / Repayments 55,000 - - - 45,000 - - - - - - - - - - - - (175,000) (75,000) DIP Interest & Fees (1,680) - - (401) (1,388) - - - (1,698) - - - (1,884) - - - (1,823) (365) (9,238) LC Cash Collateralization (4,635) - - - - - - - - - - - - - - - - - (4,635) Exit Financing - - - - - - - - - - - - - - - - - 225,000 225,000 Total Financing Activity 48,685 - - (401) 43,613 - - - (1,698) - - - (1,884) - - - (1,823) 49,635 136,127 Total Net Cash Flow 44,531 (1,274) (4,377) (7,398) 43,876 4,169 (3,785) (2,983) (4,207) 2,576 (2,817) (12,327) (2,590) 5,110 (1,183) 5,480 (5,400) (7,889) 49,510 Beginning Cash 1,121 45,652 44,377 40,000 32,602 76,478 80,647 76,862 73,879 69,672 72,248 69,431 57,104 54,514 59,624 58,441 63,920 58,521 1,121 Net Cash Flow 44,531 (1,274) (4,377) (7,398) 43,876 4,169 (3,785) (2,983) (4,207) 2,576 (2,817) (12,327) (2,590) 5,110 (1,183) 5,480 (5,400) (7,889) 49,510 Ending Cash Balance 45,652$ 44,377$ 40,000$ 32,602$ 76,478$ 80,647$ 76,862$ 73,879$ 69,672$ 72,248$ 69,431$ 57,104$ 54,514$ 59,624$ 58,441$ 63,920$ 58,521$ 50,631$ 50,631$
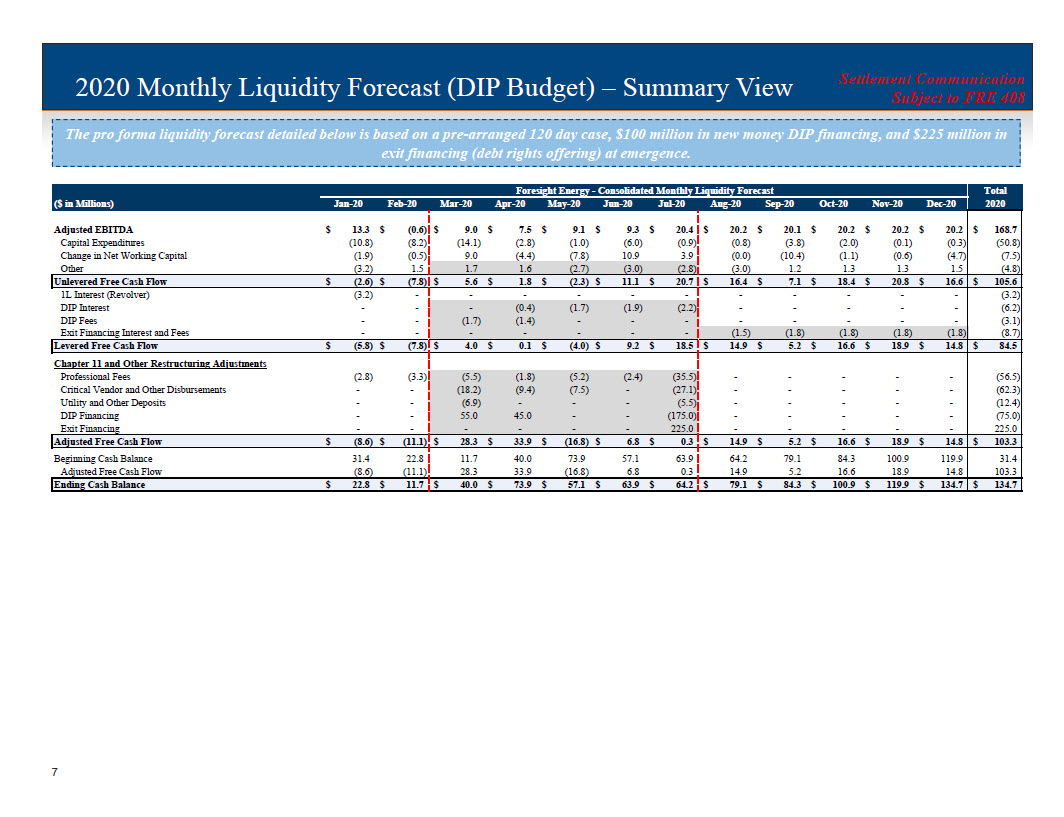
Settlement Communication Subject to FRE 408 Settlement Communication Subject to FRE 408 2020 Monthly Liquidity Forecast (DIP Budget) – Summary View 7 The pro forma liquidity forecast detailed below is based on a pre - arranged 120 day case, $100 million in new money DIP financing , and $225 million in exit financing (debt rights offering) at emergence. Foresight Energy - Consolidated Monthly Liquidity Forecast Total ($ in Millions) Jan-20 Feb-20 Mar-20 Apr-20 May-20 Jun-20 Jul-20 Aug-20 Sep-20 Oct-20 Nov-20 Dec-20 2020 Adjusted EBITDA 13.3$ (0.6)$ 9.0$ 7.5$ 9.1$ 9.3$ 20.4$ 20.2$ 20.1$ 20.2$ 20.2$ 20.2$ 168.7$ Capital Expenditures (10.8) (8.2) (14.1) (2.8) (1.0) (6.0) (0.9) (0.8) (3.8) (2.0) (0.1) (0.3) (50.8) Change in Net Working Capital (1.9) (0.5) 9.0 (4.4) (7.8) 10.9 3.9 (0.0) (10.4) (1.1) (0.6) (4.7) (7.5) Other (3.2) 1.5 1.7 1.6 (2.7) (3.0) (2.8) (3.0) 1.2 1.3 1.3 1.5 (4.8) Unlevered Free Cash Flow (2.6)$ (7.8)$ 5.6$ 1.8$ (2.3)$ 11.1$ 20.7$ 16.4$ 7.1$ 18.4$ 20.8$ 16.6$ 105.6$ 1L Interest (Revolver) (3.2) - - - - - - - - - - - (3.2) DIP Interest - - - (0.4) (1.7) (1.9) (2.2) - - - - - (6.2) DIP Fees - - (1.7) (1.4) - - - - - - - - (3.1) Exit Financing Interest and Fees - - - - - - - (1.5) (1.8) (1.8) (1.8) (1.8) (8.7) Levered Free Cash Flow (5.8)$ (7.8)$ 4.0$ 0.1$ (4.0)$ 9.2$ 18.5$ 14.9$ 5.2$ 16.6$ 18.9$ 14.8$ 84.5$ Chapter 11 and Other Restructuring Adjustments Professional Fees (2.8) (3.3) (5.5) (1.8) (5.2) (2.4) (35.5) - - - - - (56.5) Critical Vendor and Other Disbursements - - (18.2) (9.4) (7.5) - (27.1) - - - - - (62.3) Utility and Other Deposits - - (6.9) - - - (5.5) - - - - - (12.4) DIP Financing - - 55.0 45.0 - - (175.0) - - - - - (75.0) Exit Financing - - - - - - 225.0 - - - - - 225.0 Adjusted Free Cash Flow (8.6)$ (11.1)$ 28.3$ 33.9$ (16.8)$ 6.8$ 0.3$ 14.9$ 5.2$ 16.6$ 18.9$ 14.8$ 103.3$ Beginning Cash Balance 31.4 22.8 11.7 40.0 73.9 57.1 63.9 64.2 79.1 84.3 100.9 119.9 31.4 Adjusted Free Cash Flow (8.6) (11.1) 28.3 33.9 (16.8) 6.8 0.3 14.9 5.2 16.6 18.9 14.8 103.3 Ending Cash Balance 22.8$ 11.7$ 40.0$ 73.9$ 57.1$ 63.9$ 64.2$ 79.1$ 84.3$ 100.9$ 119.9$ 134.7$ 134.7$
Settlement Communication Subject to FRE 408 II. Preliminary 4Q19 Results and 5 - Year Projection Model as of February 27, 2020
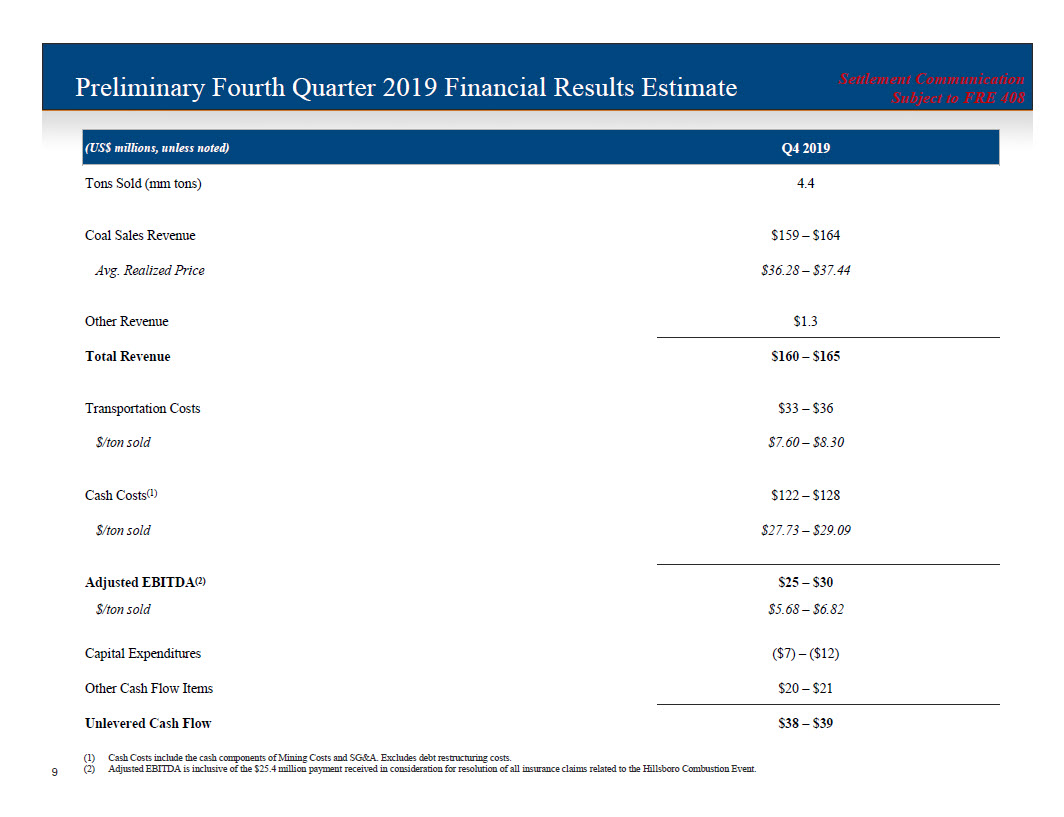
Settlement Communication Subject to FRE 408 Settlement Communication Subject to FRE 408 Preliminary Fourth Quarter 2019 Financial Results Estimate (US$ millions, unless noted) Q4 2019 Tons Sold (mm tons) 4.4 Coal Sales Revenue $159 – $164 Avg. Realized Price $36.28 – $37.44 Other Revenue $1.3 Total Revenue $160 – $165 Transportation Costs $33 – $36 $/ton sold $7.60 – $8.30 Cash Costs (1) $122 – $128 $/ton sold $27.73 – $29.09 Adjusted EBITDA (2) $25 – $30 $/ton sold $5.68 – $6.82 Capital Expenditures ($7) – ($12) Other Cash Flow Items $20 – $21 Unlevered Cash Flow $38 – $39 (1) Cash Costs include the cash components of Mining Costs and SG&A. Excludes debt restructuring costs. (2) Adjusted EBITDA is inclusive of the $25.4 million payment received in consideration for resolution of all insurance claims re lat ed to the Hillsboro Combustion Event. 9
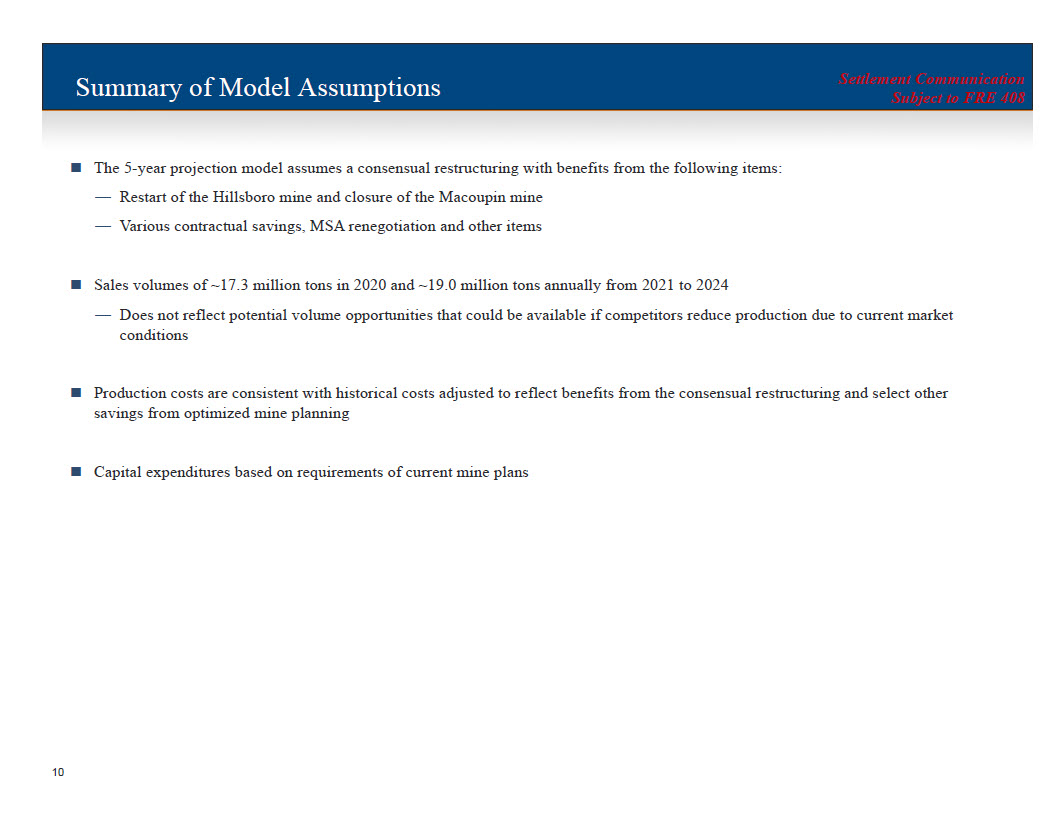
Settlement Communication Subject to FRE 408 Settlement Communication Subject to FRE 408 Summary of Model Assumptions The 5 - year projection model assumes a consensual restructuring with benefits from the following items: — Restart of the Hillsboro mine and closure of the Macoupin mine — Various contractual savings, MSA renegotiation and other items Sales volumes of ~17.3 million tons in 2020 and ~19.0 million tons annually from 2021 to 2024 — Does not reflect potential volume opportunities that could be available if competitors reduce production due to current marke t conditions Production costs are consistent with historical costs adjusted to reflect benefits from the consensual restructuring and sele ct other savings from optimized mine planning Capital expenditures based on requirements of current mine plans 10
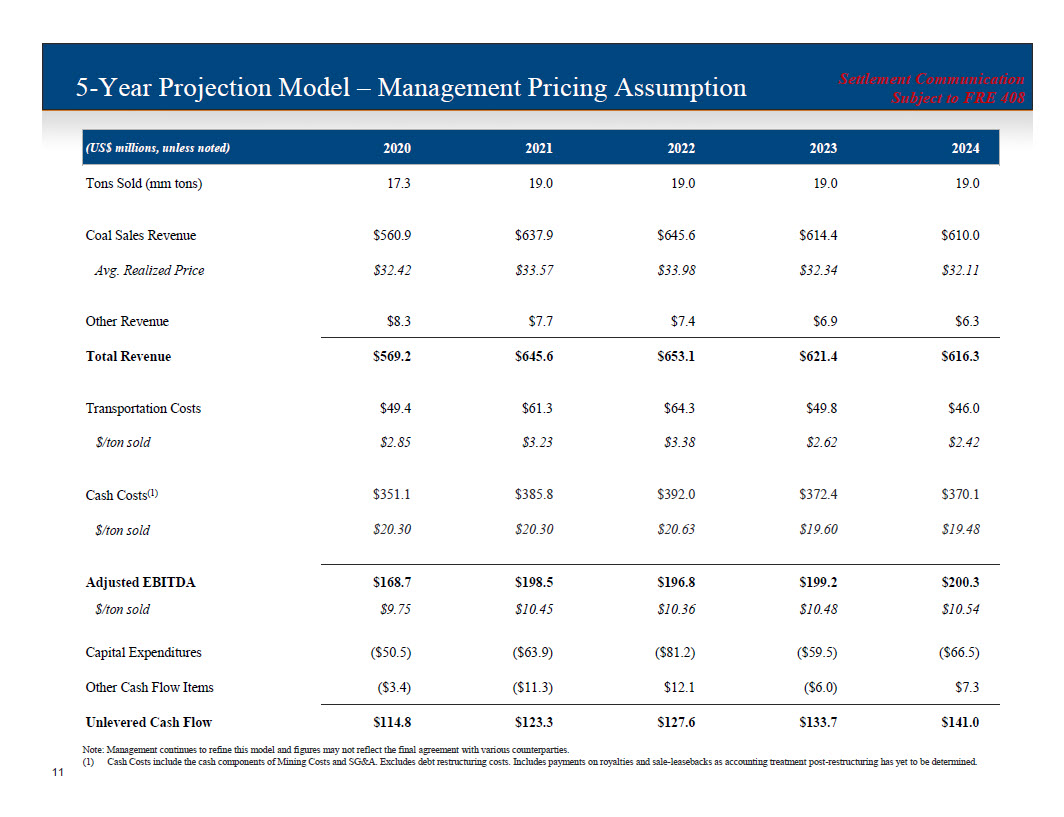
Settlement Communication Subject to FRE 408 Settlement Communication Subject to FRE 408 5 - Year Projection Model – Management Pricing Assumption (US$ millions, unless noted) 2020 2021 2022 2023 2024 Tons Sold (mm tons) 17.3 19.0 19.0 19.0 19.0 Coal Sales Revenue $560.9 $637.9 $645.6 $614.4 $610.0 Avg. Realized Price $32.42 $33.57 $33.98 $32.34 $32.11 Other Revenue $8.3 $7.7 $7.4 $6.9 $6.3 Total Revenue $569.2 $645.6 $653.1 $621.4 $616.3 Transportation Costs $49.4 $61.3 $64.3 $49.8 $46.0 $/ton sold $2.85 $3.23 $3.38 $2.62 $2.42 Cash Costs (1) $351.1 $385.8 $392.0 $372.4 $370.1 $/ton sold $20.30 $20.30 $20.63 $19.60 $19.48 Adjusted EBITDA $168.7 $198.5 $196.8 $199.2 $200.3 $/ton sold $9.75 $10.45 $10.36 $10.48 $10.54 Capital Expenditures ($50.5) ($63.9) ($81.2) ($59.5) ($66.5) Other Cash Flow Items ($3.4) ($11.3) $12.1 ($6.0) $7.3 Unlevered Cash Flow $114.8 $123.3 $127.6 $133.7 $141.0 Note: Management continues to refine this model and figures may not reflect the final agreement with various counterparties. (1) Cash Costs include the cash components of Mining Costs and SG&A. Excludes debt restructuring costs. Includes payments on roya lti es and sale - leasebacks as accounting treatment post - restructuring has yet to be determined. 11
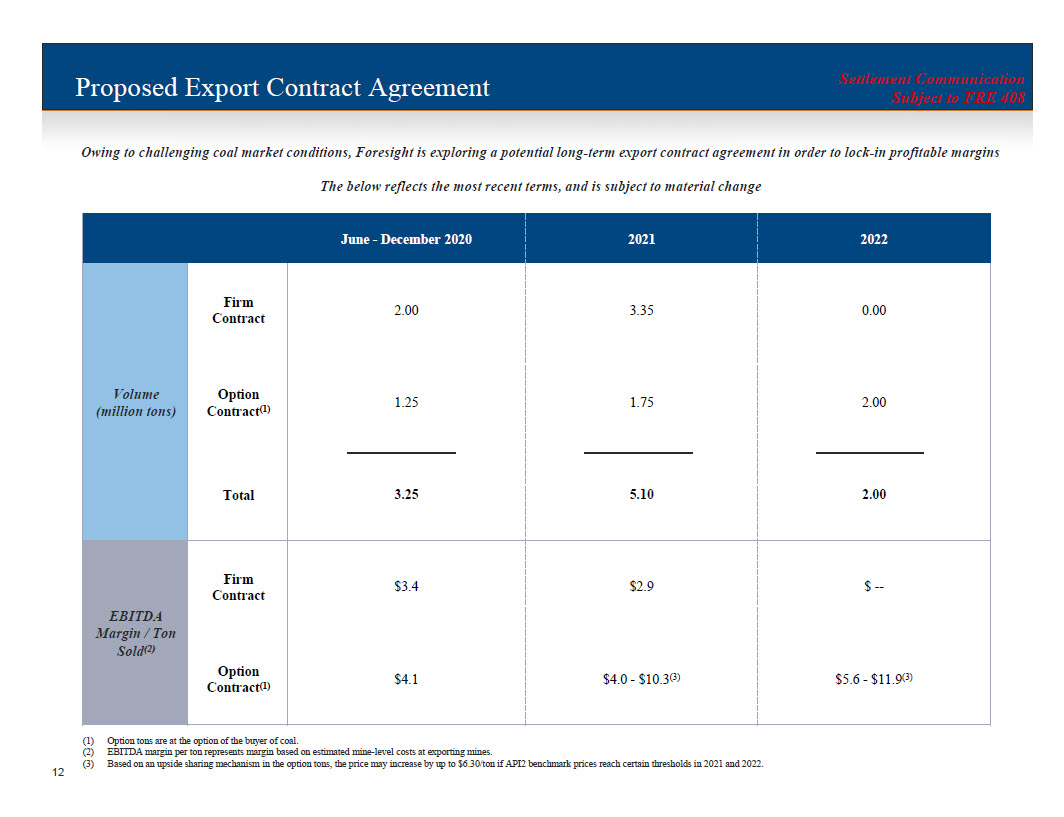
Settlement Communication Subject to FRE 408 Settlement Communication Subject to FRE 408 12 Proposed Export Contract Agreement Owing to challenging coal market conditions, Foresight is exploring a potential long - term export contract agreement in order to lock - in profitable margins The below reflects the most recent terms, and is subject to material change June - December 2020 2021 2022 Volume (million tons) Firm Contract 2.00 3.35 0.00 Option Contract (1) 1.25 1.75 2.00 Total 3.25 5.10 2.00 EBITDA Margin / Ton Sold (2) Firm Contract $3.4 $2.9 $ -- Option Contract (1) $4.1 $4.0 - $10.3 (3) $5.6 - $11.9 (3) (1) Option tons are at the option of the buyer of coal. (2) EBITDA margin per ton represents margin based on estimated mine - level costs at exporting mines. (3) Based on an upside sharing mechanism in the option tons, the price may increase by up to $6.30/ton if API2 benchmark prices r eac h certain thresholds in 2021 and 2022.
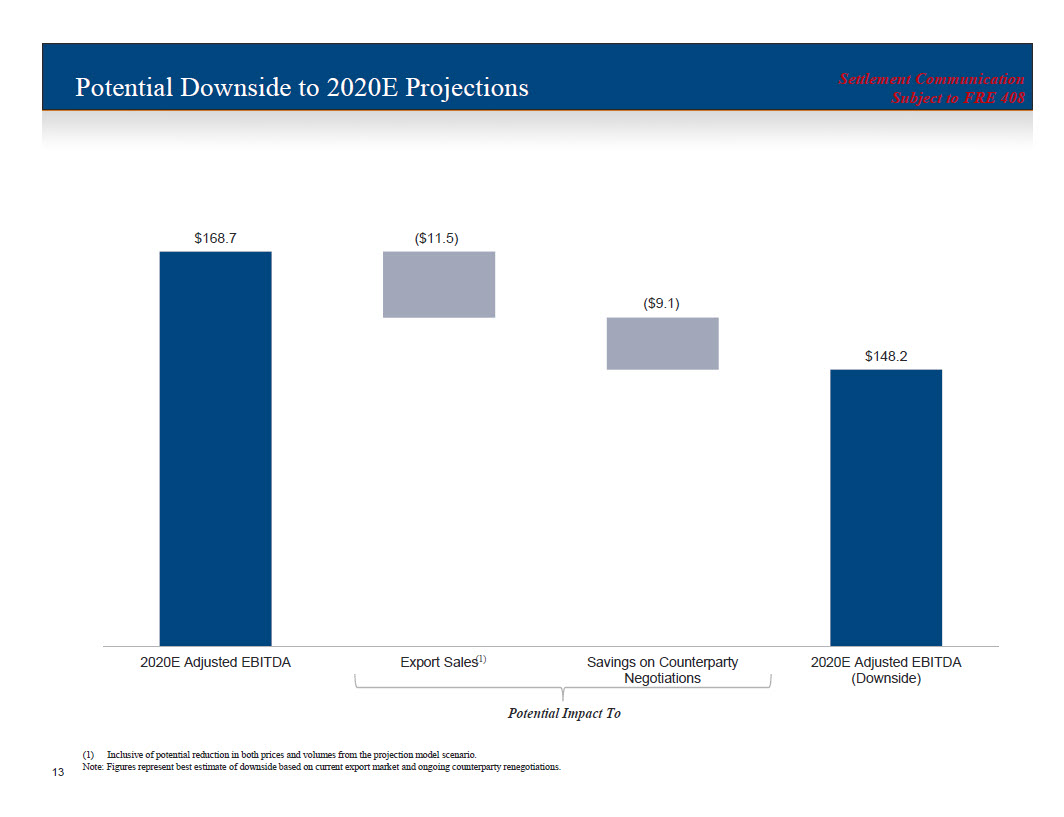
Settlement Communication Subject to FRE 408 Settlement Communication Subject to FRE 408 13 Potential Downside to 2020E Projections Potential Impact To (1) $168.7 ($11.5) ($9.1) $148.2 2020E Adjusted EBITDA Export Sales Savings on Counterparty Negotiations 2020E Adjusted EBITDA (Downside) (1) Inclusive of potential reduction in both prices and volumes from the projection model scenario. Note: Figures represent best estimate of downside based on current export market and ongoing counterparty renegotiations.
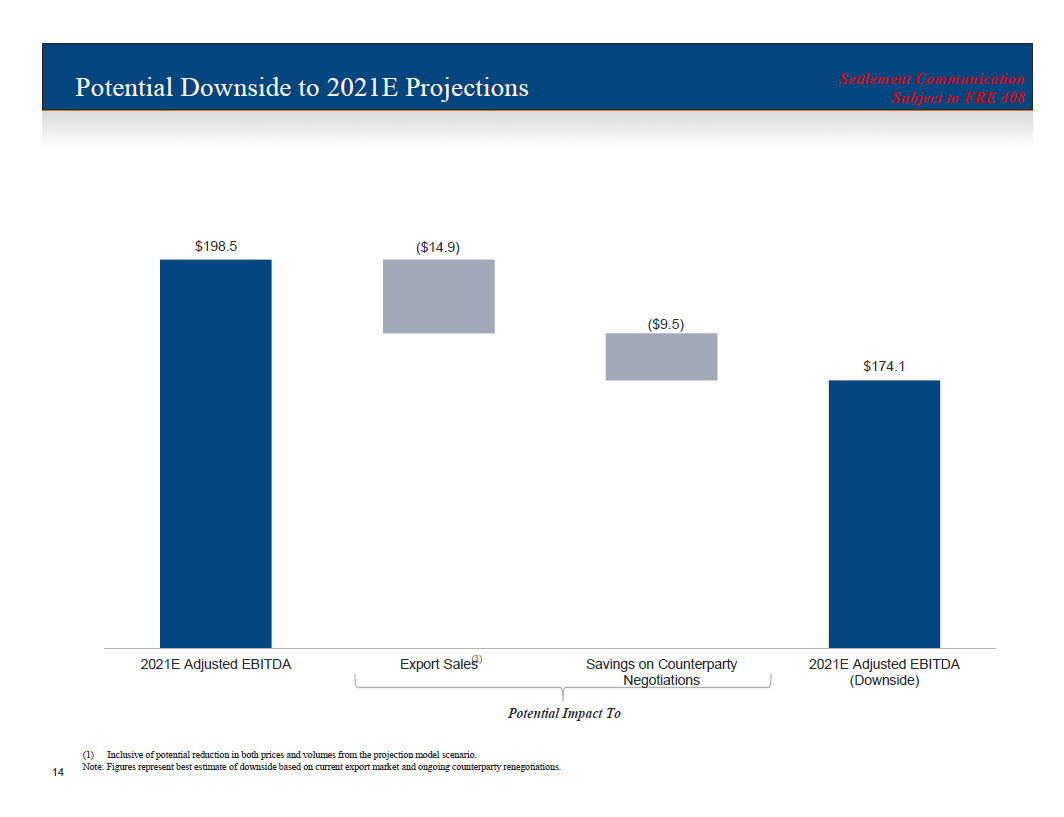
Settlement Communication Subject to FRE 408 Settlement Communication Subject to FRE 408 14 Potential Downside to 2021E Projections Potential Impact To (1) $198.5 ($14.9) ($9.5) $174.1 2021E Adjusted EBITDA Export Sales Savings on Counterparty Negotiations 2021E Adjusted EBITDA (Downside) (1) Inclusive of potential reduction in both prices and volumes from the projection model scenario. Note: Figures represent best estimate of downside based on current export market and ongoing counterparty renegotiations.