Attached files
| file | filename |
|---|---|
| EX-32.2 - EXHIBIT 32.2 - COHU INC | ex_174763.htm |
| EX-32.1 - EXHIBIT 32.1 - COHU INC | ex_174762.htm |
| EX-31.2 - EXHIBIT 31.2 - COHU INC | ex_174761.htm |
| EX-31.1 - EXHIBIT 31.1 - COHU INC | ex_174760.htm |
| EX-23 - EXHIBIT 23 - COHU INC | ex_174759.htm |
| EX-21 - EXHIBIT 21 - COHU INC | ex_174758.htm |
| EX-4.1 - EXHIBIT 4.1 - COHU INC | ex_175328.htm |
UNITED STATES
SECURITIES AND EXCHANGE COMMISSION
Washington, D. C. 20549
FORM 10-K
(Mark One)
|
☑ |
ANNUAL REPORT PURSUANT TO SECTION 13 OR 15(d) OF THE SECURITIES EXCHANGE ACT OF 1934 |
For the fiscal year ended December 28, 2019
OR
|
☐ |
TRANSITION REPORT PURSUANT TO SECTION 13 OR 15(d) OF THE SECURITIES EXCHANGE ACT OF 1934 |
For the transition period from to
Commission file number 1-4298
COHU, INC.
(Exact name of registrant as specified in its charter)
|
Delaware |
95-1934119 |
|
(State or other jurisdiction of |
(I.R.S. Employer Identification No.) |
|
Incorporation or Organization) |
|
|
12367 Crosthwaite Circle, Poway, California |
92064-6817 |
|
(Address of principal executive offices) |
(Zip Code) |
Registrant’s telephone number, including area code: (858) 848-8100
Securities registered pursuant to Section 12(b) of the Act:
|
Title of Each Class |
Trading Symbol(s) |
Name of Exchange on Which Registered |
|
Common Stock, $1.00 par value |
COHU |
The Nasdaq Stock Market LLC |
Securities registered pursuant to Section 12(g) of the Act:
None
Indicate by check mark if the registrant is a well-known seasoned issuer, as defined in Rule 405 of the Securities Act. Yes ☐ No ☑
Indicate by check mark if the registrant is not required to file reports pursuant to Section 13 or Section 15(d) of the Act. Yes ☐ No ☑
Indicate by check mark whether the registrant (1) has filed all reports required to be filed by Section 13 or 15(d) of the Securities Exchange Act of 1934 during the preceding 12 months (or for such shorter period that the registrant was required to file such reports), and (2) has been subject to such filing requirements for the past 90 days. Yes ☑ No ☐
Indicate by check mark whether the registrant has submitted electronically every Interactive Data File required to be submitted pursuant to Rule 405 of Regulation S-T (§232.405 of this chapter) during the preceding 12 months (or for such shorter period that the registrant was required to submit such files). Yes ☑ No ☐
Indicate by check mark whether the registrant is a large accelerated filer, an accelerated filer, a non-accelerated filer, a smaller reporting company or an emerging growth company. See definitions of “large accelerated filer,” “accelerated filer”, “smaller reporting company” and “emerging growth company” in Rule 12b-2 of the Exchange Act:
| Large accelerated filer | ☐ | Accelerated filer | ☑ | Non-accelerated filer | ☐ | Smaller reporting company | ☐ | Emerging growth company | ☐ |
If an emerging growth company, indicate by check mark if the registrant has elected not to use the extended transition period for complying with any new or revised financial accounting standards provided pursuant to Section 13(a) of the Exchange Act. ☐
Indicate by check mark whether the registrant is a shell company (as defined in Rule 12b-2 of the Act). Yes ☐ No ☑
The aggregate market value of voting stock held by non-affiliates of the registrant was approximately $624,000,000 based on the closing stock price as reported by the Nasdaq Stock Market LLC as of June 28, 2019. Shares of common stock held by each officer and director and by each person or group who owns 5% or more of the outstanding common stock have been excluded in that such persons or groups may be deemed to be affiliates. This determination of affiliate status is not necessarily a conclusive determination for other purposes.
As of February 27, 2020, the Registrant had 41,452,753 shares of its $1.00 par value common stock outstanding.
DOCUMENTS INCORPORATED BY REFERENCE
Portions of the Proxy Statement for Cohu, Inc.’s 2020 Annual Meeting of Stockholders to be held on May 6, 2020, and to be filed pursuant to Regulation 14A within 120 days after registrant’s fiscal year ended December 28, 2019, are incorporated by reference into Part III of this Report.
COHU, INC.
FORM 10-K FOR THE FISCAL YEAR ENDED DECEMBER 28, 2019
TABLE OF CONTENTS
| Page | ||
| PART I | ||
|
Item 1. |
1 |
|
|
Item 1A. |
7 |
|
|
Item 1B. |
21 |
|
|
Item 2. |
22 |
|
|
Item 3. |
22 |
|
|
Item 4. |
22 |
|
|
Item 5. |
23 | |
|
Item 6. |
25 |
|
|
Item 7. |
Management’s Discussion and Analysis of Financial Condition and Results of Operations |
26 |
|
Item 7A. |
35 |
|
|
Item 8. |
37 |
|
|
Item 9. |
Changes in and Disagreements with Accountants on Accounting and Financial Disclosure |
37 |
|
Item 9A. |
37 |
|
|
Item 9B. |
39 |
|
|
Item 10. |
39 |
|
|
Item 11. |
39 |
|
|
Item 12. |
Security Ownership of Certain Beneficial Owners and Management and Related Stockholder Matters |
39 |
|
Item 13. |
Certain Relationships and Related Transactions, and Director Independence |
39 |
|
Item 14. |
39 |
|
|
Item 15. |
40 |
|
|
Item 16. |
81 |
|
|
|
82 |
The following discussion should be read in conjunction with the Consolidated Financial Statements and notes thereto included elsewhere in this Annual Report on Form 10-K. This Annual Report on Form 10-K contains certain forward-looking statements including expectations of market conditions, challenges and plans, within the meaning of Section 21E of the Securities Exchange Act of 1934, as amended (the “Exchange Act”), and is subject to the Safe Harbor provisions created by that statute. These forward-looking statements are based on management’s current expectations and beliefs, including estimates and projections about our business. Statements concerning financial position, business strategy, and plans or objectives for future operations are forward-looking statements. These statements are not guarantees of future performance and are subject to certain risks, uncertainties, and assumptions that are difficult to predict and may cause actual results to differ materially from management’s current expectations. Such risks and uncertainties include those set forth in this Annual Report on Form 10-K under the heading “Item 1A. Risk Factors”. The forward-looking statements in this report speak only as of the time they are made and do not necessarily reflect management’s outlook at any other point in time. We undertake no obligation to update publicly any forward-looking statements, whether as a result of new information, future events, or for any other reason. However, readers should carefully review the risk factors set forth in other reports or documents we file from time-to-time with the Securities and Exchange Commission (“SEC”) after the date of this Annual Report.
PART I
Item 1. Business.
Cohu, Inc. (“Cohu”, “we”, “our”, “us” and the “Company”) was incorporated under the laws of California in 1947, as Kalbfell Lab, Inc. and commenced active operations in the same year. Our name was changed to Kay Lab in 1954. In 1957, Cohu was reincorporated under the laws of the State of Delaware as Cohu Electronics, Inc. and in 1972 our name was changed to Cohu, Inc.
On October 1, 2018, we acquired Xcerra Corporation (“Xcerra”), a Massachusetts-based company. Xcerra, formerly known as LTX-Credence Corporation, is a global provider of test and handling capital equipment, interface products and related services to the semiconductor and electronics manufacturing industries. Xcerra operated in the semiconductor and electronics manufacturing test markets through its atg-Luther & Maelzer, Everett Charles Technologies (ECT), LTX-Credence and Multitest businesses. The acquisition of Xcerra extended Cohu’s market position in the test handler and test contactor markets and expanded Cohu’s addressable market with our entry into semiconductor automated test equipment (ATE) and bare board printed circuit board (PCB) test. The results of Xcerra’s operations have been included in our consolidated results since October 1, 2018. As a result of the timing of the acquisition our 2019 results include Xcerra for the entire year whereas all 2018 amounts only include Xcerra for the three months ended December 29, 2018.
Management determined that Xcerra’s fixtures services business did not align with Cohu’s long-term strategic plan and has engaged in a process to divest this portion of the business. As a result, as of December 28, 2019 and December 29, 2018, the assets of our fixtures business are considered “held for sale” and the operations of our fixtures business have been presented as “discontinued operations”. This business was sold in February 2020. Unless otherwise noted, all amounts presented are from continuing operations.
After the acquisition of Xcerra, we determined that we have two reportable segments, Semiconductor Test and Inspection Equipment (“Semiconductor Test & Inspection”) and PCB Test Equipment (“PCB Test”). Financial information on our reportable segments for each of the last three years is included in Note 9, “Segment and Geographic Information” in Part IV, Item 15(a) of this Form 10-K.
Sales by reportable segment, expressed as a percentage of total consolidated net sales, for the last three years were as follows:
|
2019 |
2018 |
2017 (1) |
|||||||||||
|
Semiconductor Test & Inspection |
93 | % | 98 | % | 100 | % | |||||||
|
PCB Test |
7 | % | 2 | % | N/A | ||||||||
| 100 | % | 100 | % | 100 | % | ||||||||
|
(1) |
After the acquisition of Xcerra on October 1, 2018 we report in two segments, Semiconductor Test & Inspection and PCB Test. Cohu’s historical reported net sales would have been reported in our Semiconductor Test & Inspection segment and have been presented accordingly. |
Our Products
Cohu is a leading supplier of semiconductor test and inspection handlers, micro-electro mechanical system (MEMS) test modules, test contactors, thermal sub-systems, semiconductor automated test equipment and bare board PCB test systems used by global semiconductor and electronics manufacturers and semiconductor test subcontractors. We offer a wide range of products and services, and revenue from our capital equipment products is driven by the capital expenditure budgets and spending patterns of our customers, who often delay or accelerate purchases in reaction to variations in their business. The level of capital expenditures by these companies depends on the current and anticipated market demand for semiconductor devices and PCBs and the products that incorporate them. Our recurring revenues are driven by an increase in the number of semiconductor devices and PCBs that are tested and by the continuous introduction of new products and technologies by our customers.
We currently sell the following products:
Semiconductor Test. Semiconductor ATE is used both for wafer level and device package testing. Our semiconductor ATE solutions consist primarily of two platforms focused on the system on a chip (SoC) device market. The Diamond series platform, which includes the flagship Diamondx test system, offers high-density instrumentation for low-cost testing of microcontrollers and cost sensitive consumer and digital-based application specific standard products (ASSP) such as Power Management and application specific integrated circuit (ASIC) devices including flat panel display drivers. The PAx series of testers is focused primarily on the RF Front End IC and Module market.
Semiconductor Handlers. Semiconductor test and inspection handlers are used in conjunction with automated test equipment and are used to automate the testing and inspection of packaged semiconductor devices. Our handlers support a variety of package sizes and device types, including those used in automotive, mobile, industrial, computing applications, among others. We offer a broad range of test handlers, including pick-and-place, turret, gravity, strip, microelectronic systems (MEMS) and thermal sub-systems.
Bare Board PCB Test Systems. Bare board PCB test systems are used to test pre-assembly printed circuit boards. Our PCB test systems include flying probe testers, which are used to test low-volume, highly complex circuit boards and do not require the use of a separate test fixture, as well as universal grid testers, which require the use of a separate test fixture and are well-suited for circuit boards in high volume manufacturing.
Interface Products. Our interface products are comprised of test contactors and probe pins. Test contactors serve as the interface between the test handler and the semiconductor device under test such as digital semiconductor devices utilizing spring probe technology, power management and LED semiconductor devices utilizing cantilever technology, and RF semiconductor devices based on contacts designed to operate at high frequencies. Test contactors are specific to individual semiconductor device designs, need to be replaced frequently and increase in size with the number of devices tested in parallel. Interface Products are included in our recurring revenues.
Spares and Kits. We provide consumable, non-consumable and spare items that are used to maintain, sustain or otherwise enable customers’ equipment to meet its performance, availability and production requirements. We also design and manufacture a wide range of device dedication kits that enable handlers to process different semiconductor packages. Spares and Kits are included in our recurring revenues.
Services. Our worldwide service organization is capable of performing installations and necessary maintenance of systems sold. We provide various parts and labor warranties on test and handling systems and instruments designed and manufactured by us and warranties on certain components that have been purchased from other manufacturers and incorporated into our test and handling systems. We also provide training on the maintenance and operation of our systems as well as application, data management software and consulting services on our products. Our InSight test cell enterprise software platform provides our customers with a centralized data management system to monitor equipment performance. Services are included in our recurring revenues.
Sales by Product Line
During the last three years, our consolidated net sales were distributed as follows:
|
2019 |
2018 |
2017 |
||||||||||
|
Semiconductor test & inspection systems (including kits) |
48 | % | 54 | % | 56 | % | ||||||
|
Interface products, spares, kits (not as part of systems sales) and service |
47 | % | 44 | % | 44 | % | ||||||
|
PCB test systems (1) |
5 | % | 2 | % | - | % | ||||||
|
(1) |
Cohu had no PCB test systems sales prior to the acquisition of Xcerra on October 1, 2018. |
Customers
Our customers include semiconductor integrated device manufacturers, fabless design houses, PCB manufacturers, and test subcontractors throughout the world. Repeat sales to existing customers represent a significant portion of our sales. During the last three years, customers of our Semiconductor Test & Inspection segment that comprised 10% or greater of our consolidated net sales were as follows:
|
2019 |
2018 |
2017 |
||||||||||
|
Intel |
11.1 | % | ** | 11.2 | % | |||||||
|
NXP Semiconductors N.V. |
* | ** | 15.9 | % | ||||||||
|
* Less than 10% of consolidated net sales. |
||||||
|
**No single customer exceeded 10% of consolidated net sales for the year ended December 29, 2018. |
No customer of our PCB Test segment exceeded 10% of consolidated net sales for the years ended December 28, 2019 and December 29, 2018.
The loss of, or a significant reduction in, orders by these or other significant customers, including reductions due to market, economic or competitive conditions or the outsourcing of final integrated circuit test to subcontractors that are not our customers would adversely affect our financial condition and results of operations and as a result, we believe that our customer concentration is a significant business risk.
Additional financial information on revenues from external customers by geographic area for each of the last three years is included in Note 9, “Segment and Geographic Information” in Part IV, Item 15(a) of this Form 10-K.
Sales and Marketing
We market our products worldwide through a combination of a direct sales force and independent sales representatives. In geographic areas where we believe there is sufficient sales potential, we generally employ our own personnel. Our U.S. sales offices are located in Poway, Milpitas (California), Richardson (Texas) and Norwood (Massachusetts). Our European sales offices are located in Munich, Wertheim and Kolbermoor (Germany), Grenoble (France), Agrate (Italy) and La Chaux-de-Fonds (Switzerland). We operate in Asia with offices in Singapore, Malaysia, Thailand, Philippines, Taiwan, China, Korea, and Japan. After acquiring Xcerra, we announced that we would terminate Xcerra’s distribution arrangements in China and Taiwan and sell and service Xcerra products direct to customers. As a result, in 2019, we made significant investments in sales and service resources located in China and Taiwan and we now sell and service the entire portfolio of Cohu products direct to customers in this geography.
Competition
The semiconductor equipment industry is intensely competitive and is characterized by rapid technological change and demanding worldwide service requirements. Significant competitive factors include product performance, price, reliability, lead-time, customer support and installed base of products. While we believe that we are the leading worldwide supplier of semiconductor test handling equipment, we face substantial competition in the Japanese and Korean markets which represent a significant percentage of the worldwide market. During each of the last three years our sales to Japanese and Korean customers, who have historically purchased test handling equipment from Asian suppliers, have represented less than 10% of our total sales. Test subcontractors in Asia also purchase mostly from local Asian competitors. Some of our current and potential competitors are part of larger corporations that have substantially greater financial, engineering, manufacturing and customer support capabilities and offer more extensive product offerings than Cohu. In the semiconductor test market, we face competition from two dominant suppliers headquartered in the U.S. and Japan, both of which are substantially larger than Cohu’s test business. While we are among the leading worldwide suppliers of test contactors, this market is very fragmented with a large number of global and local competitors. To remain competitive, we believe we will require significant financial resources to offer a broad range of products, maintain customer support and service centers worldwide and to invest in research and development of new products. Failure to introduce new products in a timely manner or the introduction by competitors of products with actual or perceived advantages could result in a loss of competitive position and reduced sales of existing products. No assurance can be given that we will continue to compete successfully throughout the world.
Backlog
Our backlog of unfilled orders for products, by segment at December 28, 2019 and December 29, 2018 was as follows:
|
(in millions) |
2019 |
2018 |
|||||||
|
Semiconductor Test & Inspection |
$ | 149.9 | $ | 139.8 | |||||
|
PCB Test |
10.5 | 10.6 | |||||||
|
Total consolidated backlog |
$ | 160.4 | $ | 150.4 | |||||
Backlog is generally expected to be shipped within the next twelve months. Our backlog at any point in time may not be representative of actual sales in any future period due to the possibility of customer changes in delivery schedules, cancellation of orders, potential delays in product shipments, and difficulties in obtaining parts from suppliers or failure to satisfy customer acceptance requirements resulting in the inability to recognize revenue under accounting requirements. Furthermore, many orders are subject to cancellation or rescheduling by the customer with limited or no penalty. A reduction in backlog during any period could have a material adverse effect on our business, financial condition and results of operations.
Manufacturing and Raw Materials
Our principal manufacturing operations are currently located in Malacca, Malaysia (handler operations and kits); Laguna, Philippines (kits and test contactors); Lincoln, Rhode Island (connectors); Osaka, Japan (probe pins); and Wertheim, Germany (bare board PCB test systems).
We outsource the manufacturing of many of our semiconductor automated test equipment products to Jabil Circuit, Inc. Our contract manufacturing partner is responsible for significant material procurement, assembly, and testing. We continue to manage product design through pilot production for the subcontracted products, and we are directly involved in qualifying suppliers and key components used in all our products. Our contract manufacturer is responsible for funding the capital expenses incurred in connection with the manufacture of our products, except with regard to end-of-line testing equipment and other specific manufacturing equipment utilized in assembling our products or sub-components which are financed and owned by Cohu. Contracting with a global provider such as Jabil, gives us added flexibility to manufacture certain products closer to target markets in Asia, potentially increasing responsiveness to customers while reducing costs and delivery times.
Many of the components and subassemblies we utilize are standard products, although some items are made to our specifications. Certain components are obtained or are available from a limited number of suppliers. We seek to reduce our dependence on sole and limited source suppliers, however in some cases the complete or partial loss of certain of these sources could have a material adverse effect on our operations while we attempt to locate and qualify replacement suppliers.
Patents and Trademarks
Our technology is protected by various intellectual property laws including patent, license, trademark, copyright and trade secret laws. In addition, we believe that, due to the rapid pace of technological change in the semiconductor and electronic equipment industries, the successful manufacture and sale of our products also depends upon our experience, technological know-how, manufacturing and marketing skills and speed of response to sales opportunities. In the absence of patent protection, we would be vulnerable to competitors who attempt to copy or imitate our products or processes. We believe our intellectual property has value and we have in the past and will in the future take actions we deem appropriate to protect such property from misappropriation. However, there can be no assurance such actions will provide meaningful protection from competition. Protecting our intellectual property rights or defending against claims brought by other holders of such rights, either directly against us or against customers we have agreed to indemnify, would likely be expensive and time consuming and could have a material adverse effect on our operations.
Research and Development
Research and development activities are carried on in our various subsidiaries and are directed toward development of new products and equipment, as well as enhancements to existing products and equipment. Our total research and development expense was $86.1 million in 2019, $56.4 million in 2018 and $40.7 million in 2017. The increase in research and development expense in 2019 and 2018 was primarily associated with the acquisition of Xcerra on October 1, 2018. Incremental research and development expense directly attributed to Xcerra in 2019 and 2018 was $45.4 million and $11.6 million, respectively.
We work closely with our customers to make improvements to our existing products and in the development of new products. We expect to continue to invest heavily in research and development and must manage product transitions successfully as introductions of new products could adversely impact sales.
Environmental Laws
Our business is subject to numerous federal, state, local and international environmental laws. We believe we are in compliance with applicable federal, state, local and international regulations. Compliance with federal, state, local and international laws that have been enacted or adopted regulating the discharge of materials into the environment or otherwise relating to the protection of the environment and the prevention of climate change have not had a material effect and are not expected to have a material effect upon our capital expenditures, results of operations or our competitive position. However, future changes in regulations may require expenditures that could adversely impact earnings in future years.
Seasonality
Historically, the semiconductor industry has been seasonal with recurring periods of oversupply and excess capacity, which often have had a significant effect on the semiconductor industry’s demand for capital equipment, including equipment of the type we manufacture and market. We anticipate that the markets for newer generations of semiconductors and semiconductor equipment will also be subject to similar cycles and severe downturns. Any significant reductions in capital equipment investment by semiconductor integrated device manufacturers and test subcontractors will materially and adversely affect our business, financial position and results of operations. See the risk factor entitled “The semiconductor industry we serve is seasonal, volatile and unpredictable.”
Executive Officers of the Registrant
The following sets forth the names, ages, positions and offices held by all executive officers of Cohu as of February 27, 2020. Executive Officers serve at the discretion of the Board of Directors, until their successors are appointed.
|
Name |
Age |
Position |
|||
|
Luis A. Müller |
50 |
President and Chief Executive Officer |
|||
|
Jeffrey D. Jones |
58 |
Vice President, Finance and Chief Financial Officer |
|||
|
Christopher G. Bohrson |
60 |
Senior Vice President and General Manager, Test Handler Group |
|||
|
Thomas D. Kampfer |
56 |
Vice President, Corporate Development, General Counsel and Secretary |
|||
|
Ian P. Lawee |
53 |
Vice President and General Manager, Semiconductor Test Group |
|||
|
Pascal Rondé |
57 |
Senior Vice President, Global Customer Group |
|||
Dr. Müller has been the President and Chief Executive Officer of Cohu since December 28, 2014. His previous roles at Cohu include serving as President of Cohu’s Semiconductor Equipment Group (“SEG”) from 2011 to 2014; Managing Director of Rasco GmbH (“Rasco”) from 2009 to 2011; Vice President of Delta Design’s High Speed Handling Group from 2008 to 2011; and Director of Engineering at Delta Design from 2005 to 2008. Prior to joining Cohu, Dr. Müller spent nine years at Teradyne Inc., where he held management positions in engineering and business development.
Mr. Jones joined Cohu’s Delta Design subsidiary in July 2005 as Vice President Finance and Controller. In November 2007, Mr. Jones was named Vice President, Finance and Chief Financial Officer of Cohu. Prior to joining Delta Design, Mr. Jones, was Vice President and General Manager of the Systems Group at SBS Technologies, Inc., a designer and manufacturer of embedded computer products. Prior to SBS Technologies, Mr. Jones was an Audit Manager for Coopers & Lybrand (now PricewaterhouseCoopers).
Mr. Bohrson was appointed Sr. Vice President and General Manager, Test Handler Group in October 2018. Mr. Bohrson was Vice President and General Manager for Digital Test Handlers from January 2017 until his promotion, and served as Vice President Sales and Service, Americas from May 2016 to January 2017. Prior to joining Cohu, from 2007 through 2016, Mr. Bohrson held several executive positions at Bosch Automotive Service Solutions/SPX lastly as Vice President and General Manager of the OEM Diagnostics and Information Solutions group. Prior to that, Mr. Bohrson spent twenty years working in a variety of management and technical roles at Teradyne, Inc.’s semiconductor and broadband test division in the U.S. and Asia.
Mr. Kampfer joined Cohu in May 2017 as Vice President Corporate Development, General Counsel and Secretary. Mr. Kampfer most recently served from June 2015 to May 2017 as Executive Vice President and Chief Financial Officer of Multi-Fineline Electronix, Inc. Prior to that, Mr. Kampfer served from 2012 to 2015 as President of CohuHD, formerly a division of Cohu, which was divested in 2014. Previously, Mr. Kampfer spent eight years with Iomega Corporation, holding several executive positions, including President and Chief Operating Officer and Vice President, General Counsel and Secretary. Earlier, Mr. Kampfer served in various legal and business development executive roles with Proxima Corporation, and also held various positions in manufacturing engineering and legal at IBM.
Mr. Lawee joined Cohu in May 2019 as Vice President and General Manager of Cohu’s Semiconductor Test Group. Mr. Lawee has more than 25 years of experience in multiple management positions at both semiconductor and test instrumentation companies. Between 2009 and 2019, he served in multiple General Manager and Senior Director roles at Analog Devices, with responsibilities spanning Interface, Isolation and Precision Converter semiconductor franchises, as well as Business Unit responsibility for semiconductors sold into the Energy market. Prior to this, Mr. Lawee spent 15 years working in a variety of product, marketing and engineering management roles at Teradyne’s semiconductor test division.
Mr. Rondé joined Cohu in October 2018 with the acquisition of Xcerra, and was appointed Sr. Vice President, Global Customer Group at that time. Mr. Rondé was Sr. Vice President Global Customer Team at Xcerra, a position he held since joining the company’s original LTX-Credence group in January 2012. Prior to that, Mr. Rondé was Vice President Global Sales, Service, Support and Business Development for Verigy, Inc. from 2006 to 2011. From 2000 to 2006, he was the Vice President of Global Sales, Service and Support for Agilent Technologies and later Verigy. Mr. Rondé spent the early part of his career in sales and management roles in France at HP, ATE Europe and Saintel.
Employees
At December 28, 2019, we had approximately 3,200 employees. Our employee headcount has fluctuated in the last five years primarily due to the volatile and unpredictable business conditions in the semiconductor equipment industry. Over the last several years, our headcount has also been impacted by acquisitions and divestitures. Our employees in the United States and most locations in Asia are not covered by collective bargaining agreements. However, certain employees at our operations in Germany are represented by works councils and employees in La Chaux-de-Fonds, Switzerland are members of the micro-technology and Swiss watch trade union. The Collective Bargaining Agreement of “Metallurgie (ingenieurs et cadres)” is applicable to all employees of our French subsidiary and certain employees in our China operation belong to local trade unions. We have not experienced any work stoppages and consider relations with our employees to be good. We believe that a great part of our future success will depend on our continued ability to attract and retain qualified employees. Competition for the services of certain personnel, particularly those with technical skills, is intense. There can be no assurance that we will be able to attract, hire, assimilate and retain a sufficient number of qualified employees.
Available Information
Our web site address is www.cohu.com. We make available free of charge, on or through our web site, our annual report on Form 10-K, quarterly reports on Form 10-Q, current reports on Form 8-K, and all amendments to those reports, as soon as reasonably practicable after such material is electronically filed with the Securities and Exchange Commission. Our Code of Business Conduct and Ethics and other documents related to our corporate governance are also posted on our web site at www.cohu.com/investors/corporategovernance. When required by the rules of the Nasdaq Stock Market, LLC, or Nasdaq, or the Securities and Exchange Commission, or SEC, we will disclose any future amendment to, or waiver of, any provision of the code of conduct for our chief executive officer and principal financial officer or any member or members of our board of directors on our website within four business days following the date of such amendment or waiver. Information contained on our web site is not deemed part of this report.
Item 1A. Risk Factors.
Set forth below and elsewhere in this report on Form 10-K and in other documents we file with the SEC, are risks and uncertainties that could cause actual results to differ materially from the results expressed or implied by the forward-looking statements contained in this Annual Report. Before deciding to purchase, hold or sell our common stock, you should carefully consider the risks described below in addition to the other cautionary statements and risks described elsewhere, and the other information contained, in this Annual Report on Form 10-K. The risks and uncertainties described below are not the only ones we face. Additional risks and uncertainties not presently known to us or that we currently deem immaterial may also affect our business. If any of these known or unknown risks or uncertainties actually occurs with material adverse effects on Cohu, our business, financial condition and results of operations could be seriously harmed. The trading price of our common stock could decline due to any of these risks, and you may lose all or part of your investment.
We may fail to realize all of the anticipated benefits of the Xcerra acquisition or those benefits may take longer to realize than expected.
Cohu acquired Xcerra on October 1, 2018, at which time Xcerra became a wholly owned subsidiary of Cohu (the “Merger”). Our ability to realize the anticipated benefits and synergies of the Merger depends, to a large extent, on our ability to successfully integrate Xcerra, which has been and continues to be a complex, costly and time-consuming process. The integration process may disrupt our business and, if implemented ineffectively or delayed, could restrict the realization of the full expected benefits, and could ultimately be unsuccessful. The failure to meet the challenges involved in the integration process and to realize the anticipated benefits of the Merger in the time frame we initially anticipated could cause an interruption of, or a loss of momentum in, our operations and could adversely affect our business, financial condition and results of operations.
In addition, the integration of Xcerra may result in material unanticipated problems, expenses, liabilities, competitive responses, and loss of employees, customers, suppliers and other business relationships. Additional integration challenges and risks include:
|
● |
difficulties entering new markets or manufacturing in new geographies where Cohu has no or limited direct prior experience; |
|
● |
such a new market for Cohu, the automated test equipment market, is intensely competitive with entrenched large competitors who are much larger than Cohu; |
|
● |
successfully managing relationships with Cohu and Xcerra’s combined supplier and customer base; |
|
● |
coordinating and integrating independent research and development and engineering teams across technologies and product platforms to enhance product development while reducing costs; |
|
● |
coordinating sales and marketing efforts to effectively position the combined company’s capabilities and the direction of product development; |
|
● |
difficulties and significant costs in integrating the systems and processes of two companies with complex operations including multiple manufacturing sites; |
|
● |
difficulties and potential loss of sales in transitioning customers from certain Xcerra products that are being discontinued and to Cohu products; |
|
● |
product manufacturing disruptions and delays as we consolidate certain manufacturing sites; |
|
● |
difficulties and errors that may occur in integrating disparate accounting staffs, processes and systems; |
|
● |
the increased scale and complexity of Cohu’s operations resulting from the Merger; |
|
● |
Cohu’s ability to achieve the targeted cost synergies within the expected time frame, and significant costs of integration and restructuring; |
|
● |
retaining key employees of Cohu and Xcerra; |
|
● |
obligations that Cohu will have to counterparties of Xcerra that arise as a result of the change in control of Xcerra; |
|
● |
legal impediments, delays and significant costs to reduce headcounts in various geographies; |
|
● |
the impact of litigation and potential liabilities we may be inheriting from Xcerra; and |
|
● |
diversion of management’s attention to integration matters. |
Many of these factors are outside of our control and any one of them could result in increased costs, decreases in the amount of expected revenues, and diversion of management’s time and energy, which could adversely affect our business, financial condition, and results of operations and result in us becoming subject to litigation. In addition, even if Xcerra is integrated successfully, the full anticipated benefits of the Merger may not be realized, including the synergies, cost savings or sales or growth opportunities that are anticipated. These benefits may not be achieved within the anticipated time frame, or at all. Cohu incurred $16.2 million of restructuring charges for the Xcerra acquisition during fiscal year 2019 and additional restructuring charges or unanticipated costs may be incurred in the integration process. All of these factors could cause reductions in our earnings per share and decrease or delay the expected accretive effect of the Merger. As a result, it cannot be assured that the Merger will result in the realization of the full or any anticipated benefits.
We may underperform relative to our expectations.
Our business and financial performance, especially with our acquisition of Xcerra, are subject to certain risks and uncertainties. We may not be able to maintain the growth rate, levels of revenue, earnings, or operating efficiency that we and Xcerra have achieved or might achieve separately and, in fact, due to weak market conditions in 2019 sales and earnings related to the Xcerra related business declined significantly on a year-over-year basis. In addition, we believe Xcerra’s ATE products have been materially impacted by the Huawei export restrictions and may adversely affect our revenues and operating results in the near term (see risk factor entitled “Global economic and political conditions, including trade tariffs and export restrictions, have impacted our business and may continue to have an impact on our business and financial condition”). Any further underperformance could have a material adverse effect on our financial condition and results of operations.
Uncertainties underlie Cohu’s expectation that, relative to Cohu on a stand-alone basis, the Merger will be accretive to Cohu’s earnings per share.
Cohu currently believes that, relative to Cohu on a stand-alone basis, the Merger will be accretive to Cohu’s earnings per share upon completion of the ongoing restructuring and integration and after the recovery of market conditions. However, Cohu cannot give any assurance that the Merger will actually be accretive to Cohu’s earnings per share.
The use of cash and incurrence of substantial indebtedness in connection with the financing of the Merger may have an adverse impact on Cohu’s liquidity, limit Cohu’s flexibility in responding to other business opportunities and increase Cohu’s vulnerability to adverse economic and industry conditions.
The Merger was financed in part by using Cohu’s and Xcerra’s cash on hand and the incurrence of indebtedness. In connection with the Merger, Cohu entered into a term loan facility, with an aggregate principal amount of $350.0 million (the “Debt Financing” or “Credit Agreement”). Cohu used $160.5 million of Cohu’s and Xcerra’s cash on hand to complete the Merger. After completing the Merger and paying acquisition-related costs, Cohu’s (including Xcerra’s) cash, cash equivalents and short-term investments as of December 29, 2018, were approximately $165.0 million. Total cash, cash equivalents and short-term investments as of December 28, 2019, were approximately $156.1 million. The use of cash on hand and indebtedness to finance the acquisition has reduced Cohu’s liquidity and could cause Cohu to place more reliance on cash generated from operations to pay principal and interest on Cohu’s debt, thereby reducing the availability of Cohu’s cash flow for working capital, dividend and capital expenditure needs or to pursue other potential strategic plans.
Our Credit Agreement contains various representations and negative covenants that limit, subject to certain exceptions and baskets, our ability and/or our subsidiaries’ ability to, among other things:
|
● |
incur or assume liens or additional debt or provide guarantees in respect of obligations of other persons; |
|
● |
issue redeemable stock and preferred stock; |
|
● |
pay cash dividends or make distributions on capital stock, repurchase, redeem or make payments on capital stock; |
|
● |
enter into rate, commodity, equity or currency swap, hedging or other similar transactions; |
|
● |
make loans, investments or acquisitions; |
|
● |
enter into agreements that restrict distributions from our subsidiaries; |
|
● |
create or permit restrictions on the ability of our subsidiaries to pay dividends or make other distributions to us or to guarantee our debt, limit our or any of our subsidiaries’ ability to create liens, or that require the grant of a lien to secure an obligation if a lien is granted to secure another obligation; |
|
● |
sell assets and capital stock of our subsidiaries; |
|
● |
enter into certain transactions with affiliates; |
|
● |
sell, transfer, license, lease or dispose of our or our subsidiaries’ assets; and |
|
● |
dissolve, liquidate, consolidate or merge with or into, or sell substantially all the assets of us and our subsidiaries, taken as a whole, to, another person. |
The restrictions contained in our Credit Agreement could adversely affect our ability to:
|
● |
finance our operations; |
|
● |
make needed capital expenditures; |
|
● |
make strategic acquisitions or investments or enter into alliances; |
|
● |
withstand a future downturn in our business or the economy in general; |
|
● |
engage in business activities, including future opportunities, that may be in our interest; and |
|
● |
plan for or react to market conditions or otherwise execute our business strategies. |
A breach of any of these negative covenants could result in a default under the Credit Agreement. Further, additional indebtedness that we incur in the future may subject us to further covenants. Our failure to comply with these covenants could result in a default under the agreements governing the relevant indebtedness. The lender may accelerate the payment terms of the Credit Agreement upon the occurrence of certain events of default set forth therein, which include: the failure of Cohu to make timely payments of amounts due under the Credit Agreement, the failure of Cohu to adhere to the representations and covenants set forth in the Credit Agreement, the failure to provide notice of any event that causes a material adverse effect or to provide other required notices, upon the event that related collateral agreements become ineffective, upon the event that certain legal judgments are entered against Cohu, the insolvency of Cohu, or upon the change of control of Cohu. Any event that could require us to repay debt prior to its due date could have a material adverse impact on our financial condition and results of operations.
Our ability to comply with covenants contained in such debt agreements may be affected by events beyond our control, including prevailing economic, financial and industry conditions. Even if we are able to comply with all of the applicable covenants, the restrictions on our ability to manage our business in our sole discretion could adversely affect our business by, among other things, limiting our ability to take advantage of financings, mergers, acquisitions and other corporate opportunities that we believe would be beneficial to us. In addition, our obligations under the Credit Agreement are secured, on a first-priority basis, and such security interests could be enforced in the event of default by the collateral agent for the Credit Agreement.
Changes in the method of determining the London Interbank Offered Rate (LIBOR), or the replacement of LIBOR with an alternative reference rate, may adversely affect interest rates.
Interest rates under our Credit Agreement are calculated using LIBOR. On July 27, 2017, the Financial Conduct Authority (the authority that regulates LIBOR) announced that it intends to stop compelling banks to submit rates for the calculation of LIBOR after 2021 and it is unclear whether new methods of calculating LIBOR will be established. If LIBOR ceases to exist after 2021, a comparable or successor reference rate must be negotiated and agreed among the Administrative Agent, the Company and certain lenders under the Credit Agreement. The U.S. Federal Reserve, in conjunction with the Alternative Reference Rates Committee, is considering replacing U.S. dollar LIBOR with a newly created index, calculated based on repurchase agreements backed by treasury securities. It is not possible to predict the effect of these changes, other reforms or the establishment of alternative reference rates in the United Kingdom, the United States or elsewhere. To the extent these interest rates increase, our interest expense will increase, which could adversely affect our financial condition, operating results and cash flows.
Cohu has total consolidated long-term debt of $347 million and because of such high debt levels we may not be able to service our debt obligations in accordance with their terms; the Tax Cuts and Jobs Act severely limits the deductibility of interest expense.
Cohu’s ability to meet its expense and debt service obligations contained in the Debt Financing agreements will depend on Cohu’s future performance, which will be affected by financial, business, economic and other factors, including potential changes in industry conditions, industry supply and demand balance, customer preferences, the success of Cohu’s products, pressure from competitors, and Cohu’s ability to successfully integrate Xcerra in a timely manner. In addition, Cohu is subject to interest rate risks, and continuing increases in interest rates will increase Cohu’s debt service obligations. Should combined Cohu and Xcerra revenues decline after the Merger (on a year-over-year basis), as they did in fiscal year 2019, Cohu may not be able to generate sufficient cash flow to pay its debt service obligations when due. If Cohu is unable to meet its debt service obligations after the Merger or should Cohu fail to comply with the covenants contained in the agreements governing its indebtedness, Cohu may be required to refinance all or part of its debt, sell important strategic assets at unfavorable prices, incur additional indebtedness or issue Cohu Common Stock or other equity securities. Cohu may not be able to, at any given time, refinance its debt, sell assets, incur additional indebtedness or issue equity securities on terms acceptable to Cohu, in amounts sufficient to meet Cohu’s needs or at all. If Cohu is able to raise additional funds through the issuance of equity or equity-linked securities, such issuance would also result in dilution to Cohu’s stockholders. Cohu’s inability to service its debt obligations or refinance its debt could have a material adverse effect on its business, financial conditions or operating results after the Merger. In addition, Cohu’s debt obligations may limit its ability to make required investments in capacity, technology or other areas of its business, which could have a material adverse effect on its business, financial conditions or operating results. Furthermore, the Tax Cuts and Jobs Act limits the deductibility of interest expense in a given year to 30% of adjusted taxable income, as defined. This resulted in the inability of Cohu to utilize a substantial portion of its interest expense deductions in 2018 and 2019 and may impact our ability to utilize future deductions. However, the Act permits indefinite carryforward of any disallowed business interest, subject to Internal Revenue Code section 382 limitations on utilization.
Because a significant portion of Cohu’s total assets are represented by goodwill, which is subject to mandatory impairment evaluation, and other intangibles, Cohu could be required to write off some or all of this goodwill and other intangibles, which may adversely affect the combined company’s financial condition and results of operations.
Cohu has accounted for the acquisition of Xcerra using the purchase method of accounting. A portion of the purchase price for this business was allocated to identifiable tangible and intangible assets and assumed liabilities based on estimated fair values at the date of consummation of the merger. As a result of the Merger, 47.7% of Cohu’s total assets is comprised of goodwill and other intangibles, of which approximately $238.7 million is allocated to goodwill. In accordance with the ASC 350, Intangibles - Goodwill and Other, goodwill and certain other intangible assets with indefinite useful lives are not amortized but are reviewed at least annually for impairment, or more frequently if there are indications of impairment. Significant declines in the price of Cohu’s common stock, as we saw in third fiscal quarter 2019, could increase the risk of an impairment. All other intangible assets are subject to periodic amortization. Cohu evaluates the remaining useful lives of other intangibles each quarter to determine whether events and circumstances warrant a revision to the remaining period of amortization. If we are unable to realize the anticipated benefits of the Merger, when Cohu performs future impairment tests, it is possible that the carrying value of goodwill or other intangible assets could exceed their implied fair value and therefore would require adjustment. Such adjustment would result in a charge to operating income in that period. Once adjusted, there can be no assurance that there will not be further adjustments for impairment in future periods.
If we fail to maintain an effective system of internal control over financial reporting, we may not be able to accurately report our financial results, and current and potential stockholders may lose confidence in our financial reporting.
We are required by the Securities and Exchange Commission to establish and maintain adequate internal control over financial reporting that provides reasonable assurance regarding the reliability of our financial reporting and the preparation of financial statements in accordance with generally accepted accounting principles. We are likewise required, on a quarterly basis, to evaluate the effectiveness of our internal controls and to disclose any changes and material weaknesses in those internal controls.
Completing the Merger has significantly increased the size, number of employees, global operations and complexity of Cohu’s business. Although we believe that we have adequate internal controls in place at this time, we cannot be certain that, with significantly greater global complexity, we will be able to maintain adequate internal control over our financial reporting in future periods. Any failure to maintain such internal controls could adversely impact our ability to report our financial results on a timely and accurate basis. If our financial statements are not accurate, investors may not have a complete understanding of our operations. Likewise, if our financial statements are not filed on a timely basis as required by the Securities and Exchange Commission and Nasdaq Global Select Market, we could face severe consequences from those authorities. In either case, there could result a material adverse effect on our business. Inferior internal controls could also cause investors to lose confidence in our reported financial information, which could have a negative effect on the trading price of our stock.
Cohu has discovered and may discover additional liabilities or deficiencies associated with Xcerra that were not identified in advance.
We may discover liabilities, product return issues or deficiencies associated with Xcerra that were not identified in advance, which may result in significant unanticipated costs, including potential accounting and tax charges. The effectiveness of our due diligence review and our ability to evaluate the results of such due diligence are ultimately dependent upon the accuracy and completeness of statements and disclosures made or actions taken by Xcerra, as well as the limited amount of time in which the acquisition was executed. For example, since closing the Merger, we have incurred material product returns and associated expenses and were required to make material customer pricing concessions in order to resolve various Xcerra product issues. Any further unexpected liabilities, product return issues or deficiencies associated with Xcerra could have a material adverse effect on our financial condition and results of operations.
Cohu cannot provide assurance that it will be able to continue paying dividends at the current rate or at all.
Cohu stockholders may not receive the same or any dividends in the future for various reasons, including the following:
|
● |
as a result of the Merger and the issuance of shares of Cohu Common Stock in connection with the Merger, the total amount of cash required for Cohu to pay dividends at its current rate has increased; |
|
● |
Cohu’s credit agreement restricts payments of dividends under certain circumstances; |
|
● |
Cohu may not have enough cash to pay such dividends due to Cohu’s operational cash requirements, capital spending plans, cash flow or financial position; |
|
● |
rising interest rates, which increase Cohu’s debt service obligations; |
|
● |
Cohu may desire to retain cash to maintain or improve its credit ratings; |
|
● |
difficulties and increased costs in connection with integration of the personnel, operations, technologies and products of acquired businesses; |
|
● |
given weak market conditions that began in late 2018 and continued throughout 2019, and the associated business uncertainty, we may determine to take action to preserve cash; |
|
● |
Cohu may reduce or eliminate its dividend in order to pay down debt; |
|
● |
decisions on whether, when and in which amounts to make any future distributions will remain at all times entirely at the discretion of the Cohu Board, which reserves the right to change Cohu’s dividend practices at any time with no prior notice; and |
|
● |
the amount of dividends that Cohu’s subsidiaries may distribute to Cohu may be subject to restrictions imposed by state or foreign law, restrictions that may be imposed by state or foreign regulators, and restrictions imposed by the terms of any current or future indebtedness that these subsidiaries may incur. |
We are exposed to other risks associated with other acquisitions, investments and divestitures.
As part of our business strategy, we will continue to regularly evaluate investments in, or acquisitions of, complementary businesses, joint ventures, services and technologies, and we expect that periodically we will continue to make such investments and acquisitions in the future. Acquisitions and investments involve numerous risks, including, but not limited to:
|
● |
difficulties and increased costs in connection with integration of the personnel, operations, technologies and products of acquired businesses; |
|
● |
increasing the scope, geographic diversity and complexity of our business; |
|
● |
the cost and risk of having to potentially develop new and unfamiliar sales channels for acquired businesses; |
|
● |
diversion of management’s attention from other operational matters; |
|
● |
the potential loss of key employees, customers or suppliers of Cohu or acquired businesses; |
|
● |
lack of synergy, or the inability to realize expected synergies, resulting from the acquisition; |
|
● |
potential unknown liabilities associated with the acquired businesses; |
|
● |
failure to commercialize purchased technology; |
|
● |
the impairment of acquired intangible assets and goodwill that could result in significant charges to operating results in future periods; and |
|
● |
challenges caused by distance, language and cultural differences. |
We may decide to finance future acquisitions and investments through a combination of borrowings, proceeds from equity or debt offerings and the use of cash, cash equivalents and short-term investments. If we finance acquisitions or investments by issuing equity-linked (such as convertible debt) or equity securities, our existing stockholders may be diluted which would likely affect the market price of our stock. For example, the Merger resulted in significant dilution wherein it was financed in part by the issuance of additional shares of our common stock to shareholders of Xcerra, comprised approximately 11.8 million shares of common stock, or approximately 29% of our issued and outstanding shares of common stock immediately after completing the Merger.
Mergers, acquisitions and investments are inherently risky and the inability to effectively manage these risks could materially and adversely affect our business, financial condition and results of operations. At December 28, 2019, we had goodwill and net purchased intangible assets balances of $238.7 million and $275.0 million, respectively.
Further, as a strategy to pay down long-term debt, we expect to continue to evaluate and pursue divestitures of assets that management determines to be non-core to our overall business strategy. Any such divestitures may distract Cohu’s management team, disrupt employees, may not yield attractive valuations, may incur material restructuring and transaction expenses and tax obligations, and may otherwise be unsuccessful.
We are making investments in new products to enter new markets, which may adversely affect our operating results; these investments may not be successful.
Given the highly competitive and rapidly evolving technology environment in which we operate, we believe it is important to develop new product offerings to meet strategic opportunities as they evolve. This includes developing products that we believe are necessary to meet the future needs of the marketplace. We are currently significantly investing in new product development programs to enable us to compete in the test contactor markets, while also investing in next generation test handlers and automated test equipment. For example, in fiscal year 2019, we incurred $86.1 million in research and development expenses. We expect to continue to make investments and we may at any time, based on product need or marketplace demand, decide to significantly increase our product development expenditures in these or other products. The cost of investments in new product offerings can have a negative impact on our operating results. There can be no assurance that new products we develop will be accepted in the marketplace or generate material revenues for us.
We are exposed to the risks of operating a global business.
We are a global corporation with offices and subsidiaries in certain foreign locations to manufacture our products, support our sales and services to the global semiconductor industry and, as such, we face risks in doing business abroad. Certain aspects inherent in transacting business internationally could negatively impact our operating results, including:
|
● |
costs and difficulties in staffing and managing international operations; |
|
● |
legislative or regulatory requirements and potential changes in or interpretations of requirements in the United States and in the countries in which we manufacture or sell our products; |
|
● |
trade restrictions, including treaty changes, sanctions and the suspension of export licenses; |
|
● |
compliance with and changes in import/export tariffs and regulations; |
|
● |
complex labor laws and privacy regulations; |
|
● |
difficulties in enforcing contractual and intellectual property rights; |
|
● |
longer payment cycles; |
|
● |
health epidemics; |
|
● |
local political and economic conditions; |
|
● |
natural disasters, health epidemics and geopolitical instability; |
|
● |
complex tax laws and potentially adverse tax consequences, including restrictions on repatriating earnings and the threat of “double taxation;” and |
|
● |
fluctuations in foreign currency exchange rates against the U.S. Dollar, which can affect demand for our products and increase our costs. |
To highlight the complexity of foreign labor laws, in 2019, we incurred $9.5 million of severance and related costs to downsize and reduce headcount by approximately 105 employees in our Rosenheim, Germany facility, and we would incur material amounts of additional severance costs in the future should we determine to undertake other headcount reduction activities in foreign locations. Additionally, managing geographically dispersed operations presents difficult challenges associated with organizational alignment and infrastructure, communications and information technology, inventory control, customer relationship management, terrorist threats and related security matters and cultural diversities. If we are unsuccessful in managing such operations effectively, our business and results of operations will be adversely affected.
We continue to monitor global privacy laws and legislation to determine its impact on our business. We do not sell to consumers nor process individual credit card information, but do maintain certain personally identifiable information on our employees. Such employee information may be subject to the EU General Data Protection Regulation and the recently effective California Consumer Protection Act. We believe that we have implemented reasonable procedures and internal controls in compliance with these laws, but should such actions be insufficient, we may be subject to regulatory investigations, fines and legal costs.
We have manufacturing operations in Asia. Any failure to effectively manage multiple manufacturing sites and to secure raw materials meeting our quality, cost and other requirements, or failures by our suppliers to perform, could harm our sales, service levels and reputation.
Our reliance on overseas manufacturers exposes us to significant risks including complex management, foreign currency, legal, tax and economic risks, which we may not be able to address quickly and adequately. In addition, it is time consuming and costly to qualify overseas supplier relationships. If we should fail to effectively manage overseas manufacturing operations, or if one or more of them should experience delays, disruptions or quality control problems, or if we had to change or add additional manufacturing sites, our ability to ship products to our customers could be delayed. Also, the addition of overseas manufacturing locations increases the demands on our administrative and operations infrastructure and the complexity of our supply chain management. Our overseas sites are more susceptible to impacts from natural disasters, health epidemics and geopolitical instability (see risk factor entitled “The occurrence of natural disasters, health epidemics, and geopolitical instability caused by terrorist attacks and other threats may adversely impact our operations and sales”). If our overseas manufacturing locations are unable to meet our manufacturing requirements in a timely manner, our ability to ship products and to realize the related revenues when anticipated could be materially affected.
Our suppliers are subject to the fluctuations in general economic cycles, and global economic conditions may impact their ability to operate their businesses. They may also be impacted by possible import, export, tariff and other trade barriers, increasing costs of raw materials, labor and distribution, resulting in demands for less attractive contract terms or an inability for them to meet our requirements or conduct their own businesses. The performance and financial condition of a supplier may cause us to alter our business terms or to cease doing business with a particular supplier, or change our sourcing practices generally, which could in turn adversely affect our own business and financial condition.
Failure of critical suppliers to deliver sufficient quantities of parts in a timely and cost-effective manner could adversely impact our operations.
We use numerous vendors to supply parts, components and subassemblies for the manufacture of our products. It is not always possible to maintain multiple qualified suppliers for all of our parts, components and subassemblies. As a result, many key parts may be available only from a single supplier (“sole source”) or a limited number of suppliers. In addition, suppliers may significantly raise prices or cease manufacturing certain components (with or without advance notice to us) that are difficult to replace without significant reengineering of our products. On occasion, we have experienced problems in obtaining adequate and reliable quantities of various parts and components from certain key or sole source suppliers. Our results of operations may be materially and adversely impacted if we do not receive sufficient parts to meet our requirements in a timely and cost-effective manner.
The semiconductor industry we serve is seasonal, volatile and unpredictable.
Visibility into our markets is limited. The semiconductor equipment business is highly dependent on the overall strength of the semiconductor industry. Historically, the semiconductor industry has been seasonal with recurring periods of oversupply and excess capacity, which often have had a significant effect on the semiconductor industry’s demand for capital equipment, including equipment of the type we manufacture and market. We anticipate that the markets for newer generations of semiconductors and semiconductor equipment will also be subject to similar cycles and severe downturns. Any significant reductions in capital equipment investment by semiconductor integrated device manufacturers and test subcontractors will materially and adversely affect our business, financial position and results of operations. In addition, the seasonal, volatile and unpredictable nature of semiconductor equipment demand has in the past and may in the future expose us to significant excess and obsolete and lower of cost or net realizable value inventory write-offs and reserve requirements. In 2019, 2018 and 2017, we recorded pre-tax inventory-related charges of approximately $4.1 million, $1.4 million, and $1.1 million, respectively, primarily as a result of changes in customer forecasts. In the second half of 2018 and throughout 2019, we saw significantly weakened demand in automotive, mobility and consumer market segments, and overall geographic weakness in China and Taiwan. These trends adversely affected our second half 2018 results and full year 2019 results. Such adverse trends have materially impacted all of our business areas, including the businesses conducted by Xcerra. Finally, in 2019 and 2018 we incurred $2.7 million and $19.1 million, respectively, of inventory charges related to the decision to end manufacturing of certain of Xcerra’s semiconductor test handler products, and these charges may be insufficient as market conditions and demand changes.
Due to the nature of our business, we need continued access to capital, which if not available to us or if not available on favorable terms, could harm our ability to operate or expand our business.
Our business requires capital to finance accounts receivable and product inventory that is not financed by trade creditors when our business is expanding. If cash from available sources is insufficient or cash is used for unanticipated needs, we may require additional capital sooner than anticipated.
We believe that our existing sources of liquidity, including cash resources and cash provided by operating activities will provide sufficient resources to meet our working capital and cash requirements for at least the next twelve months. In the event we are required, or elect, to raise additional funds, we may be unable to do so on favorable terms, or at all, and may incur expenses in raising the additional funds and increase our interest rate exposure, and any future indebtedness could adversely affect our operating results and severely limit our ability to plan for, or react to, changes in our business or industry. Further, under our Credit Agreement, we are significantly limited by financial and other negative covenants in our credit arrangements, including limitations on our borrowing of additional funds and issuing dividends. At any time in the future, we may determine to issue new equity-linked (such as convertible debt) or equity securities in order to pay down long-term debt or for other corporate purposes. In such case, existing stockholders may be diluted which would likely affect the market price of our stock. Any such new equity securities may have rights, preferences or privileges senior to those of existing holders of common stock. If we cannot raise funds on acceptable terms, we may not be able to take advantage of future opportunities or respond to competitive pressures or unanticipated requirements. Any inability to raise additional capital when required could have an adverse effect on our business and operating results.
The semiconductor equipment industry is intensely competitive.
The semiconductor equipment industry is intensely competitive, and we face substantial competition from numerous companies throughout the world. The test handler industry, while relatively small in terms of worldwide market size compared to other segments of the semiconductor equipment industry, has several participants resulting in intense competitive pricing pressures. Future competition may include companies that do not currently supply test handlers. Some of our competitors are part of larger corporations that have substantially greater financial, engineering, manufacturing and customer support capabilities and provide more extensive product offerings. In addition, there are emerging semiconductor equipment companies that provide or may provide innovative technology incorporated in products that may compete successfully against our products. We expect our competitors to continue to improve the design and performance of their current products and introduce new products with improved performance capabilities. Our failure to introduce new products in a timely manner, the introduction by our competitors of products with perceived or actual advantages, or disputes over rights to use certain intellectual property or technology could result in a loss of our competitive position and reduced sales of, or margins on our existing products. Intense competition has adversely impacted our product average selling prices and gross margins on certain products. If we are unable to reduce the cost of our existing products and successfully introduce new lower cost products, then we expect that these competitive conditions would negatively impact our gross margin and operating results in the foreseeable future.
We have increased investments in our test contactor business and announced significant growth targets for the business over the next several years, but due to weak market conditions we did not achieve our growth goals in 2019. The test contactor market is fragmented, with many entrenched regional players, and subject to intense price competition and high customer support requirements. We believe that customer support and responsiveness and an ability to consistently meet tight deadlines is critical to our success. If we are unable to reduce the cost of our test contactor products, while also meeting customer support requirements and deadlines, then we expect that these competitive conditions would negatively impact our gross margin and operating results in the foreseeable future.
In addition, with the Xcerra acquisition, Cohu entered the automated test equipment (“ATE”) market. Our ability to increase our ATE sales will depend, in part, on our ability to obtain orders from new customers. Semiconductor and electronics manufacturers typically select a particular vendor’s product for testing new generations of a device and make substantial investments to develop related test program applications and interfaces. Once a manufacturer has selected an ATE vendor for a new generation of a device, that manufacturer is more likely to purchase systems from that vendor for that generation of the device, and, possibly, subsequent generations of that device as well. Further, Cohu has a niche position and relatively low share in the ATE market, and this market is primarily driven by two larger companies with significantly more resources to invest into the ATE market. Therefore, the opportunities to obtain orders from new customers or existing customers may be limited, which may impair our ability to grow our ATE revenue. In fact, as market conditions have weakened, we have seen a material reduction in sales within our ATE business. These developments may materially and adversely affect our current and future target markets and our ability to compete successfully in those markets.
Semiconductor equipment is subject to rapid technological change, product introductions and transitions which may result in inventory write-offs, and our new product development involves numerous risks and uncertainties.
Semiconductor equipment and processes are subject to rapid technological change. We believe that our future success will depend in part on our ability to enhance existing products and develop new products with improved performance capabilities. We expect to continue to invest heavily in research and development and must manage product transitions successfully, as introductions of new products, including the products obtained in our acquisitions, may adversely impact sales and/or margins of existing products. In addition, the introduction of new products by us or by our competitors, the concentration of our revenues in a limited number of large customers, the migration to new semiconductor testing methodologies and the custom nature of our inventory parts increases the risk that our established products and related inventory may become obsolete, resulting in significant excess and obsolete inventory exposure. This exposure resulted in charges to operations during each of the years in the three-year period ended December 28, 2019. Future inventory write-offs and increased inventory reserve requirements could have a material adverse impact on our results of operations and financial condition.
The design, development, commercial introduction and manufacture of new semiconductor equipment is an inherently complex process that involves a number of risks and uncertainties. These risks include potential problems in meeting customer acceptance and performance requirements, integration of the equipment with other suppliers’ equipment and the customers’ manufacturing processes, transitioning from product development to volume manufacturing and the ability of the equipment to satisfy the semiconductor industry’s constantly evolving needs and achieve commercial acceptance at prices that produce satisfactory profit margins. The design and development of new semiconductor equipment is heavily influenced by changes in integrated circuit assembly, test and final manufacturing processes and integrated circuit package design changes. We believe that the rate of change in such processes and integrated circuit packages is accelerating. As a result of these changes and other factors, assessing the market potential and commercial viability of handling, ATE, MEMS, system-level and burn-in test equipment and test contactors is extremely difficult and subject to a great deal of risk. In addition, not all integrated circuit manufacturers employ the same manufacturing processes. Differences in such processes make it difficult to design standard test products that can achieve broad market acceptance. As a result, we might not accurately assess the semiconductor industry’s future equipment requirements and fail to design and develop products that meet such requirements and achieve market acceptance. Failure to accurately assess customer requirements and market trends for new semiconductor test products may have a material adverse impact on our operations, financial condition and results of operations.
The transition from product development to the manufacture of new semiconductor equipment is a difficult process and delays in product introductions and problems in manufacturing such equipment are common. We have in the past and may in the future experience difficulties in manufacturing and volume production of our new equipment. In addition, as is common with semiconductor equipment, after sale support and warranty costs have typically been significantly higher with new products than with our established products. Future technologies, processes and product developments may render our current or future product offerings obsolete and we might not be able to develop, introduce and successfully manufacture new products or make enhancements to our existing products in a timely manner to satisfy customer requirements or achieve market acceptance. Furthermore, we might not realize acceptable profit margins on such products.
The seasonal nature of the semiconductor equipment industry places enormous demands on our employees, operations and infrastructure.
The semiconductor equipment industry is characterized by dramatic and sometimes rapid changes in demand for its products. These are generally dictated by introduction of new consumer products, launch of new model vehicles, implementation of new communications infrastructure, or in response to an increase in industrial equipment and machinery that utilizes semiconductors. A number of other factors including changes in integrated circuit design and packaging may affect demand for our products. Sudden changes in demand for semiconductor equipment commonly occur, and have a significant impact on our operations, and such changes in demand (up or down) are difficult to predict and proactively plan for. We have in the past and may in the future experience difficulties, particularly in manufacturing, in training and recruiting the large number of additions to our workforce. The volatility in headcount and business levels, combined with the seasonal nature of the semiconductor industry, may require that we invest substantial amounts in new operational and financial systems, procedures and controls. We may not be able to successfully adjust our systems, facilities and production capacity to meet our customers’ changing requirements. Any inability to meet such requirements will have an adverse impact on our business, financial position and results of operations. For example, in the second half of 2018 and throughout 2019, we saw significantly weakened demand in automotive, mobility and consumer market segments, and overall geographic weakness in China and Taiwan. These trends adversely affected our second half 2018 results and full year 2019 results.
Global economic conditions may have an impact on our business and financial condition in ways that we currently cannot predict.
Our operations and financial results depend on worldwide economic conditions and their impact on levels of business spending. Continued uncertainties may reduce future sales of our products and services. While we believe we have a strong customer base and have experienced strong collections in the past, if the current market conditions deteriorate, we may experience increased collection times and greater write-offs, either of which could have a material adverse effect on our cash flow.
In addition, the tightening of credit markets and concerns regarding the availability of credit may make it more difficult for our customers to raise capital, whether debt or equity, to finance their purchases of capital equipment, including the products we sell. Delays in our customers’ ability to obtain such financing, or the unavailability of such financing would adversely affect our product sales and revenues and therefore harm our business and operating results. Possible import, export, tariff and other trade barriers, which could be imposed by Asia, the United States, other countries or the European Union might also have a material adverse effect on our operating results. We cannot predict the timing, duration of or effect on our business of an economic slowdown or the timing or strength of a subsequent recovery.
Global economic and political conditions, including trade tariffs and export restrictions, have impacted our business and may continue to have an impact on our business and financial condition.
In fiscal year 2019, 88% of our revenue was from products shipped to customer locations outside the United States. We also purchase a significant portion of components and subassemblies from suppliers outside the United States. Additionally, a significant portion of our facilities are located outside the United States, including Malaysia, Germany, China and Japan.
The United States and other countries have levied tariffs and taxes on certain goods. General trade tensions between the U.S. and China have been escalating since 2018, with U.S. tariffs on Chinese goods and retaliatory Chinese tariffs on U.S. goods. Higher duties on existing tariffs and further rounds of tariffs have been announced or repeatedly threatened by U.S. and Chinese leaders. Additionally, the U.S. has threatened to impose tariffs on goods imported from other countries, which could also impact our or certain of our customers' operations. If the U.S. were to impose current or additional tariffs on components that we or our suppliers source, our cost for such components would increase. We may also incur increases in manufacturing costs and supply chain risks due to our efforts to mitigate the impact of tariffs on our customers and our operations. Tariffs on our customers' products could also impact their sales of such end products, resulting in lower demand for our products.
We cannot predict what further actions may ultimately be taken with respect to tariffs or trade relations between the U.S. and other countries, what products may be subject to such actions, or what actions may be taken by other countries in retaliation. Further changes in trade policy, tariffs, additional taxes, restrictions on exports or other trade barriers, or restrictions on supplies, equipment, and raw materials including rare earth minerals, may limit our ability to produce products, increase our selling and/or manufacturing costs, decrease margins, reduce the competitiveness of our products, or inhibit our ability to sell products or purchase necessary components and subassemblies, which could have a material adverse effect on our business, results of operations, or financial condition.
Furthermore, on May 16, 2019, the Bureau of Industry and Security (“BIS”) of the U.S. Department of Commerce added Huawei to the BIS’s Entity List, which imposes limitations on the supply of certain U.S. items and product support to Huawei. Although our sales to Huawei are immaterial, to ensure compliance with the Entity List restrictions, we suspended shipments of all products to Huawei, effective May 16, 2019. We then reviewed our product portfolio to determine whether our products and related support are subject to the Export Administration Regulations (“EAR”), and therefore within the scope of the Entity List restrictions. We have determined that certain products Huawei purchases from us are not subject to the EAR and consequently can be lawfully sold and shipped to Huawei. Accordingly, we have recently resumed shipping certain products to Huawei.
While Huawei remains on the Entity List, and in the absence of a license from the BIS, we may be unable to work with Huawei on future product development, which may have a negative effect on our ability to sell products to Huawei in the future. Entity List restrictions may also encourage Huawei to seek to obtain a greater supply of similar or substitute products from our competitors that are not subject to these restrictions, thereby decreasing our long-term competitiveness as a supplier to Huawei. More broadly, other China-based companies, unrelated to Huawei, may also seek alternative non-U.S. product sources driven by the ongoing unpredictability of U.S.-China trade relations.
We believe that the Entity List trade restrictions enacted during second quarter 2019 had, and will continue to have, an adverse effect on our business in that most of our customers’ businesses were disrupted as semiconductor companies evaluated the trade restrictions. We are not aware of any relief from these export restrictions in the U.S.-China “phase 1” trade deal signed on January 15, 2020, and continue to be unable to predict the duration of the export restrictions imposed with respect to Huawei or the long-term effects on our business. Additionally, other companies may be added to the Entity List and/or subject to trade restrictions. Further, there will likely continue to be indirect impacts to our business which we cannot reasonably quantify, including that some of our other customers’ products which utilize our solutions may also be impacted by these and other trade restrictions that may be imposed by the U.S., China, or other countries. Restrictions on our ability (or our customers’ ability) to sell and ship products to Huawei have had, and may continue to have, an adverse effect on our business, results of operations, or financial condition.
A limited number of customers account for a substantial percentage of our net sales.
A small number of customers have been responsible for a significant portion of our net sales. During the past five years, the percentage of our sales derived from these significant customers has varied greatly. Such variations are due to changes in the customers’ business, consolidation within the semiconductor industry and their purchase of products from our competitors. It is common in the semiconductor equipment industry for customers to purchase products from more than one equipment supplier, increasing the risk that our competitive position with a specific customer may deteriorate. No assurance can be given that we will continue to maintain our competitive position with these or other significant customers. Furthermore, we expect the percentage of our revenues derived from significant customers will vary greatly in future periods. The loss of, or a significant reduction in, orders by these or other significant customers as a result of competitive products, market conditions including end market demand for our customers’ products, outsourcing final semiconductor test to test subcontractors that are not our customers or other factors, would have a material adverse impact on our business, financial condition and results of operations. Furthermore, the concentration of our revenues in a limited number of large customers is likely to cause significant fluctuations in our future annual and quarterly operating results.
If we cannot continue to develop, manufacture and market products and services that meet customer requirements for innovation and quality, our revenue and gross margin may suffer.
The process of developing new high technology products and services and enhancing existing products and services is complex, costly and uncertain, and any failure by us to anticipate customers’ changing needs and emerging technological trends accurately could significantly harm our sales and results of operations. In addition, in the course of conducting our business, we must adequately address quality issues associated with our products and services, including defects in our engineering, design and manufacturing processes, as well as defects in third-party components included in our products. To address quality issues, we work extensively with our customers and suppliers and engage in product testing to determine the cause of quality problems and appropriate solutions. Finding solutions to quality issues can be expensive and may result in additional warranty, replacement and other costs, adversely affecting our profits. In addition, quality issues can impair our relationships with new or existing customers and adversely affect our reputation, which could lead to a material adverse effect on our operating results.
Our global Enterprise Resource Management (“ERP”) upgrade may adversely affect our business and results of operations or the effectiveness of internal controls over financial reporting.
We are in final development stages of a phased global replacement of our existing ERP solution and have launched the first phase of such new ERP solution in first quarter 2020. The second phase and rollout is planned throughout 2020. The new solution is being developed as an enterprise solution in partnership with a leading provider of ERP tools. Additional investments in enterprise tools that focus on product life-cycle management, our customer experience, and supply chain management are in process to support our growing business. These implementations are extremely complex and time-consuming projects that involve substantial expenditures on software and implementation activities. If we do not effectively implement the system or if the system does not operate as intended, it could result in the loss or corruption of data, delayed order processing and shipments and increased costs. It could also adversely affect our financial reporting systems and our ability to produce financial reports and process transactions, the effectiveness of internal controls over financial reporting, and our business, financial condition, results of operations and cash flows.
Our business and operations could suffer in the event of cybersecurity breaches.
Attempts by others to gain unauthorized access to information technology systems are becoming more sophisticated and are sometimes successful. These attempts, which might be related to industrial or other espionage, include covertly introducing malware to our computers and networks and impersonating authorized users, among others. We seek to detect and investigate all cybersecurity incidents and to prevent their recurrence, but in some cases, we might be unaware of an incident or its magnitude and effects. The company has been impacted by immaterial “phishing” schemes and is continuing its efforts to train employees on such risks but may still incur damages from such schemes in the future. The theft, unauthorized use or publication of our intellectual property and/or confidential business information could harm our competitive position, reduce the value of our investment in research and development and other strategic initiatives or otherwise adversely affect our business. To the extent that any security breach results in inappropriate disclosure of our customers' or licensees' confidential information, we may incur liability as a result. Further, any attack that disrupted our IT systems could impact our sales, financial results and stock price. In response to these risks, we expect to continue to devote additional resources to the security of our information technology systems.
The loss of key personnel could adversely impact our business.
Certain key personnel are critical to our business. Our future operating results depend substantially upon the continued service of our key personnel, many of whom are not bound by employment or non-competition agreements. Our future operating results also depend in significant part upon our ability to attract and retain qualified management, manufacturing, technical, engineering, marketing, sales and support personnel. Competition for qualified personnel, particularly those with technical skills, is intense, and we cannot ensure success in attracting or retaining qualified personnel. In addition, the cost of living in the San Diego and Bay Area, California, Boston, Massachusetts, Rosenheim and Kolbermoor, Germany, La Chaux-de-Fonds, Switzerland and Osaka, Japan areas, where the majority of our engineering personnel are located, is high and we have had difficulty in recruiting prospective employees from other locations. There may be only a limited number of persons with the requisite skills and relevant industry experience to serve in these positions and it may become increasingly difficult for us to hire personnel over time. Our business, financial condition and results of operations could be materially adversely affected by the loss of any of our key employees, by the failure of any key employee to perform in his or her current position, or by our inability to attract and retain skilled employees.
Third parties may violate our proprietary rights or accuse us of infringing upon their proprietary rights.
We rely on patent, copyright, trademark and trade secret laws to establish and maintain proprietary rights in our technology and products. Any of our proprietary rights may expire due to patent life, or be challenged, invalidated or circumvented. In addition, from time-to-time, we receive notices from third parties regarding patent or copyright claims. Any such claims, with or without merit, could be time-consuming to defend, result in costly litigation, divert management’s attention and resources and cause us to incur significant expenses. In the event of a successful claim of infringement against us and our failure or inability to license the infringed technology or to substitute similar non-infringing technology, our business, financial condition and results of operations could be adversely affected. We are also subject to the theft and misappropriation of intellectual property by others, including incidents relating to former employees. We believe we are taking reasonable actions to protect and improve our security, through strengthened IT infrastructure and internal controls, but if these actions are not successful our business could be adversely affected.
A majority of our revenues are generated from exports to foreign countries, primarily in Asia, that are subject to economic and political instability and we compete against a number of Asian test handling equipment suppliers.
The majority of our export sales are made to destinations in Asia. Political or economic instability, particularly in Asia, may adversely impact the demand for capital equipment, including equipment of the type we manufacture and market. In addition, we face intense competition from a number of Asian suppliers that have certain advantages over United States (U.S.) suppliers, including us. These advantages include, among other things, proximity to customers, lower cost structures, favorable tariffs and affiliation with significantly larger organizations. In addition, changes in the amount or price of semiconductors produced in Asia could impact the profitability or capital equipment spending programs of our foreign and domestic customers.
Unanticipated changes in our tax provisions, enactment of new tax laws, or exposure to additional income tax liabilities could affect our profitability.
We are subject to income and other taxes in the U.S. and numerous foreign jurisdictions. Our tax liabilities are affected by, among other things, the amounts our affiliated entities charge each other for intercompany transactions. Our German subsidiaries income tax returns for 2012 to 2016 are currently under routine examination by tax authorities in Germany. We may be subject to ongoing tax examinations in various jurisdictions. Tax authorities may disagree with our intercompany charges or other matters and assess additional taxes. While we regularly assess the likely outcomes of these examinations to determine the appropriateness of our tax provision, tax audits are inherently uncertain, and an unfavorable outcome could occur. An unanticipated, unfavorable outcome in any specific period could harm our operating results for that period or future periods. The financial cost and management attention and time devoted to defending income tax positions may divert resources from our business operations, which could harm our business and profitability. Tax examinations may also impact the timing and/or amount of our refund claims. In addition, our effective tax rate in the future could be adversely affected by changes in the mix of earnings in countries with differing statutory tax rates, changes in the valuation of our deferred tax assets and liabilities, changes in tax laws and the discovery of new information in the course of our tax return preparation process. In particular, the carrying value of our deferred tax assets and the utilization of our net operating loss and credit carryforwards are dependent on our ability to generate future taxable income in the U.S. and other countries. Furthermore, these carryforwards may be subject to annual limitations as a result of changes in Cohu’s ownership. As a result of the acquisition of Xcerra, a greater than 50% cumulative ownership change in Xcerra triggered a significant limitation in the utilization of their net operating loss and research credit carryforwards. Cohu’s ability to use the acquired Xcerra U.S. net operating loss and credit carryforwards is subject to annual limitations as defined in sections 382 and 383 of the Internal Revenue Code.
On December 22, 2017, the Tax Cuts and Jobs Act (“Tax Act”) was signed into law in the United States. The changes in the Tax Act are broad and complex and we continue to examine the impact the Tax Act may have on our business and financial results. Among its many provisions, the Tax Act imposed a mandatory one-time transition tax on undistributed foreign earnings regardless of whether they are repatriated, reduced the U.S. corporate income tax rate from 35% to 21%, imposed limitations on the deductibility of interest and certain other corporate deductions, moved from a “worldwide” system of taxation that generally allows deferral of U.S. tax on foreign earnings until repatriated to a “territorial”/dividend exemption system with a minimum tax that will subject foreign earnings to U.S. tax when earned and created new taxes on certain foreign-sourced earnings and related-party payments, which are referred to as the global intangible low-taxed income tax and the base erosion and anti-abuse tax, respectively. In accordance with applicable SEC guidance (SAB 118), we recorded provisional amounts as of December 30, 2017, however, these provisional amounts were subject to change in 2018, due to, among other things, changes in estimates, interpretations and assumptions we have made, changes in Internal Revenue Service (IRS) interpretations, the issuance of new guidance, legislative actions, changes in accounting standards or related interpretations in response to the Tax Act and future actions by states within the United States that have not currently adopted the Tax Act. During 2018 we completed the accounting for the effects of the Tax Act and recorded an increase in our transition tax liability of approximately $5.1 million that was fully offset by the use of net operating loss carryforwards resulting in no net increase in tax expense. We must continue to address new regulations and interpretations of the Tax Act as they are issued.
Compliance with regulations may impact sales to foreign customers and impose costs.
Certain products and services that we offer require compliance with U.S. and other foreign country export and other regulations. Compliance with complex U.S. and other foreign country laws and regulations that apply to our international sales activities increases our cost of doing business in international jurisdictions and could expose us or our employees to fines and penalties. These laws and regulations include import and export requirements, the U.S. State Department International Traffic in Arms Regulations (“ITAR”) and U.S. and other foreign country laws such as the Foreign Corrupt Practices Act (“FCPA”), and local laws prohibiting corrupt payments to governmental officials. Violations of these laws and regulations could result in fines, criminal sanctions against us, our officers or our employees, prohibitions on the conduct of our business and damage to our reputation. Although we have implemented policies and procedures designed to ensure compliance with these laws, there can be no assurance that our employees, contractors or agents will not violate our policies, or that our policies will be effective in preventing all potential violations. Any such violations could include prohibitions on our ability to offer our products and services to one or more countries, and could also materially damage our reputation, our brand, our international expansion efforts, our ability to attract and retain employees, our business and our operating results. Further, defending against claims of violations of these laws and regulations, even if we are successful, could be time-consuming, result in costly litigation, divert management’s attention and resources and cause us to incur significant expenses.
In addition to government regulations regarding sale and export, we are subject to other regulations regarding our products. For example, the U.S. Securities and Exchange Commission has adopted disclosure rules for companies that use conflict minerals in their products, with substantial supply chain verification requirements if the materials come from, or could have come from, the Democratic Republic of the Congo or adjoining countries. These new rules and verification requirements impose additional costs on us and on our suppliers and may limit the sources or increase the cost of materials used in our products. Further, if we are unable to certify that our products are conflict free, we may face challenges with our customers that could place us at a competitive disadvantage, and our reputation may be harmed.
There may be changes in, and uncertainty with respect to, legislation, regulation and governmental policy in the United States.
The change in administration in the United States has resulted and may continue to result in significant changes in, and uncertainty with respect to, legislation, regulation and government policy. Specific legislative and regulatory proposals that could have a material impact on us include, but are not limited to, infrastructure renewal programs; and modifications to international trade policy, such as approvals by the Committee on Foreign Investment in the United States; increased duties, tariffs or other restrictions; public company reporting requirements; environmental regulation and antitrust enforcement.
The occurrence of natural disasters, health epidemics, and geopolitical instability caused by terrorist attacks and other threats may adversely impact our operations and sales.
Our corporate headquarters is located in San Diego, California, our Asian sales and service headquarters is located in Singapore and the majority of our sales are made to destinations in Asia. In addition, we have Asia-based manufacturing plants in Malaysia, Philippines and Japan. These regions are known for being vulnerable to natural disasters and other risks, such as earthquakes, tsunamis, fires and floods, volcanic eruptions, and geopolitical risks, which at times have disrupted the local economies. For example, a significant earthquake or tsunami could materially affect operating results. We are not insured for most losses and business interruptions of this kind, or for geopolitical or terrorism impacts, and presently have limited redundant, multiple site capacity in the event of a disaster. In the event of such disaster, our business would materially suffer.
Our business could be adversely affected by the effects of a widespread outbreak of contagious disease, including the recent outbreak of respiratory illness caused by the novel coronavirus (COVID-19) first identified in Wuhan, Hubei Province, China. Any outbreak of contagious diseases, and other adverse public health developments, particularly in Asia where approximately 58% of our employees reside, could have a material and adverse effect on our business operations. These could include disruptions or restrictions on our ability to travel or to distribute our products, as well as temporary closures of our facilities or the facilities of our suppliers or customers and their contract manufacturers. Any disruption of our suppliers or customers and their contract manufacturers would likely impact our sales and operating results. In addition, a significant outbreak of contagious diseases in the human population could result in a widespread health crisis that could adversely affect the economies and financial markets of many countries, resulting in an economic downturn that could affect demand for our end customers’ products and likely impact our operating results. Our COVID-19 response measures have already disrupted business travel, customer visits and various company events. Should COVID-19 continue to spread, we would expect an adverse impact on our business, but we are unable to size or forecast the magnitude of any such impact at this time.
Our financial and operating results may vary and fall below analysts’ estimates, or credit rating agencies may change their ratings on Cohu, any of which may cause the price of our common stock to decline or make it difficult to obtain other financing.
Our operating results may fluctuate from quarter to quarter due to a variety of factors including, but not limited to:
● seasonal, volatile and unpredictable nature of the semiconductor equipment industry;
● timing and amount of orders from customers and shipments to customers;
● customer decisions to cancel orders or push out deliveries;
● inability to recognize revenue due to accounting requirements;
● inventory writedowns;
● unexpected expenses or cost overruns in the introduction and support of products;
● inability to deliver solutions as expected by our customers; and
● intangible and deferred tax asset writedowns.
Due to these factors or other unanticipated events, quarter-to-quarter comparisons of our operating results may not be reliable indicators of our future performance. In addition, from time-to-time our quarterly financial results may fall below the expectations of the securities and industry analysts who publish reports on our company or of investors in general. This could cause the market price of our stock to decline, perhaps significantly.
In addition, as a result of the Credit Facility, we maintain credit ratings with Moody’s Investors Service, Inc. (“Moody’s”) and S&P Global Ratings (“S&P”). The current Moody’s and S&P issuer credit ratings for Cohu are B2 and B, respectively. Moody’s and S&P downgraded their outlook on Cohu from B1 (to B2) and BB- (to B) on September 19, 2019 and October 16, 2019, respectively. The changes in outlook were primarily the result of Cohu's high leverage following a significant decline in operating performance year-to-date in fiscal 2019, weakness in the semiconductor industry, particularly in Cohu's mobility and automotive segments, depressed customer capital spending, and assumptions regarding Cohu’s 2019 cash consumption.
Any further downgrade of Cohu’s credit ratings or rating outlooks may materially and adversely affect the market price of our equity and the availability, cost or interest rate of other credit or financing. This could make it significantly more costly for Cohu or its subsidiaries to borrow money or enter into new credit facilities and to raise certain other types of capital and/or complete additional financings. Any such negative credit rating actions and the reasons for such actions could materially and adversely affect our cash flows, results of operations and financial condition and our ability to pay the principal of and interest on, our debt.
We have experienced significant volatility in our stock price.
A variety of factors may cause the price of our stock to be volatile. The stock market in general, and the market for shares of high-technology companies in particular, including ours, have experienced extreme price fluctuations, which have often been unrelated to the operating performance of affected companies. During the three-year period ended December 28, 2019, the price of our common stock has ranged from $27.83 to $11.37. The price of our stock may be more volatile than the stock of other companies due to, among other factors, the unpredictable, volatile and seasonal nature of the semiconductor industry, our significant customer concentration, intense competition in the test handler industry, our limited backlog and our relatively low daily stock trading volume. The market price of our common stock is likely to continue to fluctuate significantly in the future, including fluctuations related and unrelated to our performance.
Item 1B. Unresolved Staff Comments.
None.
Item 2. Properties.
Certain information concerning our principal properties at December 28, 2019, is set forth below:
|
Major |
Reportable |
Approx. |
||||||
|
Location |
Activities |
Segment |
Sq. Ft. |
Ownership |
||||
|
Poway, California |
1, 2, 4, 5 |
Semiconductor Test & Inspection |
147,000 |
Leased |
||||
|
Rosenheim, Germany |
2, 3, 4, 5 |
Semiconductor Test & Inspection |
216,000 |
* |
||||
|
Kolbermoor, Germany |
2, 3, 4, 5 |
Semiconductor Test & Inspection |
40,000 |
Owned |
||||
|
Malacca, Malaysia |
2, 3, 4, 5 |
Semiconductor Test & Inspection |
99,000 |
Leased |
||||
|
Calamba City, Laguna, Philippines |
2, 3, 4, 5 |
Semiconductor Test & Inspection |
51,000 |
Leased |
||||
|
La Chaux-de-Fonds, Switzerland |
2, 4, 5 |
Semiconductor Test & Inspection |
34,000 |
Leased |
||||
|
Osaka, Japan |
2, 3, 4, 5 |
Semiconductor Test & Inspection |
67,000 |
Owned |
||||
|
Suzhou, China |
2, 3, 4, 5 |
PCB Test/Semiconductor Test & Inspection |
22,000 |
Leased |
||||
|
Singapore |
2, 4, 5 |
Semiconductor Test & Inspection |
34,000 |
Leased |
||||
|
Milpitas, California |
2, 4, 5 |
Semiconductor Test & Inspection |
31,000 |
Leased |
||||
|
Norwood, Massachusetts |
2, 4, 5 |
Semiconductor Test & Inspection |
56,000 |
Leased |
||||
|
Lincoln, Rhode Island |
2, 3, 4, 5 |
Semiconductor Test & Inspection |
22,000 |
Leased |
||||
|
Wertheim, Germany |
2, 3, 4, 5 |
PCB Test |
23,000 |
Leased |
||||
|
* Multiple facilities at this location that are both owned and leased. |
||||||||
Major activities have been separated into the following categories: 1. Corporate Administration/Principal Executive Offices and Global Headquarters, 2. Sales, Service and Customer Support, 3. Manufacturing, 4. Engineering and Product Development, and 5. Marketing, Finance and General Administration
In addition to the locations listed above, we lease other properties primarily for manufacturing, sales, service, engineering, and general administration in various locations. We are also currently in the process of a facility consolidation plan that will result in the closure and consolidation of Rosenheim, Germany into our nearby Kolbermoor, Germany facility, that is being expanded, in 2020. We believe our facilities are suitable for their respective uses and are adequate for our present needs.
Item 3. Legal Proceedings.
From time-to-time we are involved in various legal proceedings, examinations by various tax and customs authorities and claims that have arisen in the ordinary course of our business.
The outcome of any litigation, examinations and claims is inherently uncertain. While there can be no assurance at the present time, we do not believe that the resolution of the matters described above will have a material adverse effect on our assets, financial position or results of operations.
Item 4. Mine Safety Disclosures.
Not applicable.
PART II
Item 5. Market for Registrant’s Common Equity, Related Stockholder Matters and Issuer Purchases of Equity Securities.
|
(a) |
Market Information |
Cohu, Inc. stock is traded on the Nasdaq Global Select Market under the symbol “COHU”.
Holders
At February 27, 2020, Cohu had 562 stockholders of record. The actual number of stockholders is greater than this number of record holders and includes stockholders who are beneficial owners but whose shares are held in street name by brokers and other nominees. This number of holders of record also does not include stockholders whose shares may be held in trust by other entities.
Dividends
We have paid consecutive quarterly dividends since 1977 and, as discussed below, expect to continue doing so. Cash dividends, per share, declared in 2019 and 2018 were as follows:
|
Fiscal 2019 |
Fiscal 2018 |
|||||||
|
First Quarter |
$ | 0.06 | $ | 0.06 | ||||
|
Second Quarter |
$ | 0.06 | $ | 0.06 | ||||
|
Third Quarter |
$ | 0.06 | $ | 0.06 | ||||
|
Fourth Quarter |
$ | 0.06 | $ | 0.06 | ||||
|
Total |
$ | 0.24 | $ | 0.24 | ||||
We intend to continue to pay quarterly dividends subject to capital availability and periodic determinations by our Board of Directors that cash dividends are in the best interests of our stockholders. Our dividend policy may be affected by, among other items, our views on potential future capital requirements, including those related to debt service requirements, research and development, investments and acquisitions, legal risks and stock repurchases.
Recent Sales of Unregistered Securities
During 2019, we did not issue any securities that were not registered under the Securities Act of 1933, as amended.
Issuer Purchases of Equity Securities
During the fourth quarter of 2019, we did not repurchase any equity securities.
Equity Compensation Plan Information
The information required by this Item regarding equity compensation plans is incorporated by reference to the information set forth in Part III, Item 12 of this Annual Report on Form 10-K.
Comparative Stock Performance Graph
The information contained in this Stock Performance Graph section shall not be deemed to be “soliciting material” or “filed” with the SEC or subject to the liabilities of Section 18 of the Exchange Act except to the extent that Cohu specifically incorporates it by reference into a document filed under the Securities Act or the Exchange Act.
The graph below compares the cumulative total stockholder return on the common stock of Cohu for the last five fiscal years with the cumulative total return on custom Peer Group Indexes and a Nasdaq Market Index over the same period (assuming the investment of $100 in Cohu’s common stock, Peer Group Index and Nasdaq Market Index on December 27, 2014, and reinvestment of all dividends). The custom Peer Group Index is comprised of the peer group companies associated with our performance stock units issued under our equity incentive plan. In 2019, the custom Peer Group Index was comprised of Advanced Energy Industries Inc., Advantest Corp, ASM Pacific Technology Ltd, Axcelis Technologies Inc., BE Semiconductor Industries NV, Brooks Automation Inc., Cabot Microelectronics Corp, Camtek Ltd, Electro Scientific Industries Inc., FormFactor Inc., Kulicke and Soffa Industries Inc., Micronics Japan Co Ltd, MKS Instruments Inc., Nanometrics Inc., Photronics Inc., Rudolph Technologies Inc., Teradyne Inc., Ultra Clean Holdings Inc., and Veeco Instruments Inc. (includes Ultratech through acquisition). This peer group is revised annually to reflect acquisitions and to include additional equivalent companies in the semiconductor equipment market to ensure a sufficiently large number of companies in the peer group composition to enable a meaningful comparison of our stock performance. As it relates to our 2017 Peer Group Index, the only change from peer group companies used in 2016 resulted from Veeco Instruments Inc.’s acquisition of Ultratech, Inc.
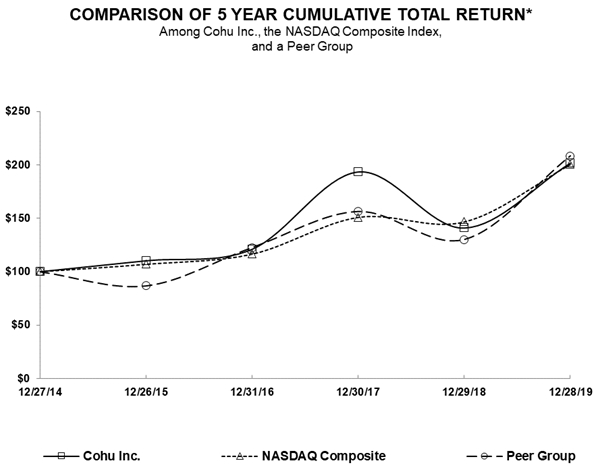
|
2014 |
2015 |
2016 |
2017 |
2018 |
2019 |
|||||||||||||||||||
|
Cohu, Inc. |
$ | 100 | $ | 110 | $ | 121 | $ | 194 | $ | 141 | $ | 202 | ||||||||||||
|
NASDAQ Index |
$ | 100 | $ | 107 | $ | 116 | $ | 151 | $ | 147 | $ | 200 | ||||||||||||
|
Peer Group |
$ | 100 | $ | 87 | $ | 123 | $ | 156 | $ | 130 | $ | 208 | ||||||||||||
Item 6. Selected Financial Data.
The following selected financial data should be read in conjunction with Cohu’s consolidated financial statements and notes thereto included in Part IV, Item 15(a) and with management’s discussion and analysis of financial condition and results of operations, included in Part II, Item 7. In February 2020, we sold our fixtures and services business and the operating results of this business is presented as discontinued operations for the periods ended December 28, 2019 and December 29, 2018. Additionally, in June 2015, we sold our mobile microwave communications equipment business and the operating results of this business are also presented as discontinued operations for all periods presented.
|
Years Ended, |
Dec. 28 |
Dec. 29 |
Dec. 30 |
Dec. 31 |
Dec. 26 |
||||||||||||||||||
|
(in thousands, except per share data) |
2019 (1) (2) |
2018 (1) (2) |
2017 (2) (3) |
2016 (4) |
2015 |
||||||||||||||||||
|
Consolidated Statement of Operations Data: |
|||||||||||||||||||||||
|
Net sales |
$ | 583,329 | $ | 451,768 | $ | 352,704 | $ | 282,084 | $ | 269,654 | |||||||||||||
|
Income (loss) from continuing operations |
$ | (68,995 | ) | $ | (32,543 | ) | $ | 33,121 | $ | 3,260 | $ | 5,792 | (5) | ||||||||||
|
Net income (loss) |
$ | (69,692 | ) | $ | (32,424 | ) | $ | 32,843 | $ | 3,039 | $ | 250 | |||||||||||
|
Net income (loss) attributable to noncontrolling interest |
$ | 8 | $ | (243 | ) | $ | - | $ | - | $ | - | ||||||||||||
|
Net income (loss) attributable to Cohu |
$ | (69,700 | ) | $ | (32,181 | ) | $ | 32,843 | $ | 3,039 | $ | 250 | |||||||||||
|
Income (loss) from continuing operations - basic |
$ | (1.68 | ) | $ | (1.02 | ) | $ | 1.19 | $ | 0.12 | $ | 0.22 | |||||||||||
|
Income (loss) from continuing operations - diluted |
$ | (1.68 | ) | $ | (1.02 | ) | $ | 1.15 | $ | 0.12 | $ | 0.22 | |||||||||||
|
Net income (loss) attributable to Cohu - basic |
$ | (1.69 | ) | $ | (1.01 | ) | $ | 1.18 | $ | 0.11 | $ | 0.01 | |||||||||||
|
Net income (loss) attributable to Cohu - diluted |
$ | (1.69 | ) | $ | (1.01 | ) | $ | 1.14 | $ | 0.11 | $ | 0.01 | |||||||||||
|
Cash dividends per share, paid quarterly |
$ | 0.24 | $ | 0.24 | $ | 0.24 | $ | 0.24 | $ | 0.24 | |||||||||||||
|
Consolidated Balance Sheet Data: |
|||||||||||||||||||||||
|
Total Consolidated Assets |
$ | 1,077,710 | $ | 1,134,002 | $ | 420,457 | $ | 345,512 | $ | 345,346 | |||||||||||||
|
Total Debt |
$ | 353,035 | $ | 352,828 | $ | 8,963 | $ | - | $ | - | |||||||||||||
|
Working Capital |
$ | 290,811 | $ | 324,650 | $ | 212,171 | $ | 176,460 | $ | 171,272 | |||||||||||||
|
(1) |
On October 1, 2018, we purchased Xcerra and the results of its operations have been included in our consolidated financial statements since that date. In 2019, total operating expenses related to the acquisition of Xcerra were as follows: $16.2 million in restructuring charges comprised of $2.7 million of inventory end-of-manufacturing write-downs related to one of Xcerra’s products, employee severance costs of $12.2 million and $1.3 million of other restructuring costs. We also recorded $35.5 million for the amortization of acquisition-related intangibles and $0.4 million of merger related costs. |
Total operating expenses in 2018 include charges related to the acquisition of Xcerra as follows: $37.8 million in restructuring charges comprised of $19.1 million of inventory end-of-manufacturing write-downs related to one of Xcerra’s products, employee severance costs of $17.8 million and $0.9 million of other restructuring costs. We also recorded $13.1 million for the amortization of acquisition-related intangibles and $9.8 million of merger related costs.
|
(2) |
Results for the years ended December 28, 2019, December 29, 2018 and December 30, 2017, include the impact from the Tax Act. See Note 8, “Income Taxes” in Part IV, Item 15(a) of this Form 10-K for additional information. |
|
(3) |
On January 4, 2017, we purchased Kita Manufacturing Co. LTD. (“Kita”) and the results of its operations have been included in our consolidated financial statements since that date. |
|
(4) |
The year ended December 31, 2016 consists of 53 weeks. All other years in the table above are comprised of 52 weeks. |
|
(5) |
Income from continuing operations for the year ended December 26, 2015, includes a gain on the sale of facility totaling $3.2 million. |
Item 7. Management’s Discussion and Analysis of Financial Condition and Results of Operations.
OVERVIEW
Cohu is a leading supplier of semiconductor test and inspection handlers, micro-electromechanical system (MEMS) test modules, test contactors and thermal subsystems, semiconductor automated test equipment and bare-board printed circuit board test systems used by global semiconductor and electronics manufacturers and test subcontractors. We offer a wide range of products and services and our revenue from capital equipment products is driven by the capital expenditure budgets and spending patterns of our customers, who often delay or accelerate purchases in reaction to variations in their business. The level of capital expenditures by these companies depends on the current and anticipated market demand for semiconductor devices and PCBs and the products that incorporate them. Our consumable products are driven by an increase in the number of semiconductor devices and printed circuit boards that are tested and by the continuous introduction of new products and new technologies by our customers. As a result, our consumable products provide a more stable recurring source of revenue and generally do not have the same degree of cyclicality as our capital equipment products.
For the year ended December 28, 2019, our net sales increased 29.1% year-over-year to $583.3 million driven by the acquisition of Xcerra Corporation, completed on October 1, 2018. Consolidated net sales for the year ended December 28, 2019, include Xcerra’s recognized sales for all twelve months of 2019 which totaled $300.8 million. The year ended December 29, 2018, only includes Xcerra’s sales for the three months subsequent to our acquisition which totaled $94.4 million. Excluding the impact of the additional sales from Xcerra, our consolidated net sales decreased year over year as a result of softer demand for smartphones, weaker automotive semiconductor demand and ongoing softness in the China market that is in part related to trade tensions between the U.S. and China and export restrictions.
During 2018 we saw growth in the global semiconductor market through the second quarter when it reached its peak. Business conditions then softened during the second half of 2018 with the weakness in demand continuing throughout 2019 and customer test cell utilization remains below levels that have historically triggered the need for additional capacity. Despite the near-term weakness, we remain optimistic about the long-term prospects for our business due to the increasing ubiquity of semiconductors, the future rollout of 5G networks, the diminishing impact of parallel test, increasing semiconductor complexity, increasing quality demands from semiconductor customers, and continued proliferation of electronics in a variety of products across the automotive, mobility and industrial markets. Our orders in the fourth quarter of 2019 strengthened, driven by demand for equipment used in testing mobility semiconductor applications and automotive related devices. We remain optimistic about our future business prospects and are focused on cross-selling opportunities and supporting our customers’ deployment of 5G RF capabilities on next generation smartphones and we remain focused on growing our sales to semiconductor and electronics manufacturers and test subcontractors.
Application of Critical Accounting Estimates and Policies
Our discussion and analysis of our financial condition and results of operations is based upon our Consolidated Financial Statements, which have been prepared in accordance with accounting principles generally accepted in the United States of America. The preparation of these financial statements requires us to make estimates and judgments that affect the reported amounts of assets, liabilities, revenues and expenses, and related disclosure of contingent assets and liabilities. We base our estimates on historical experience, forecasts and on various other assumptions that are believed to be reasonable under the circumstances; however actual results may differ from those estimates under different assumptions or conditions. The methods, estimates and judgments we use in applying our accounting policies have a significant impact on the results we report in our financial statements. Some of our accounting policies require us to make difficult and subjective judgments, often as a result of the need to make estimates of matters that are inherently uncertain. Our critical accounting estimates that we believe are the most important to investors’ understanding of our financial results and condition and require complex management judgment include:
|
● |
revenue recognition, including the deferral of revenue on sales to customers, which impacts our results of operations; |
|
● |
estimation of valuation allowances and accrued liabilities, specifically product warranty, inventory reserves and allowance for bad debts, which impact gross margin or operating expenses; |
|
● |
the recognition and measurement of current and deferred income tax assets and liabilities, unrecognized tax benefits, the valuation allowance on deferred tax assets and accounting for the impact of the recent change to U.S. tax law as described herein, which impact our tax provision; |
|
● |
the assessment of recoverability of long-lived assets including goodwill and other intangible assets, which primarily impacts gross margin or operating expenses if we are required to record impairments of assets or accelerate their depreciation; and |
|
● |
the valuation and recognition of share-based compensation, which impacts gross margin, research and development expense, and selling, general and administrative expense. |
Below, we discuss these policies further, as well as the estimates and judgments involved. We also have other policies that we consider key accounting policies; however, these policies typically do not require us to make estimates or judgments that are difficult or subjective.
Revenue Recognition: Our net sales are derived from the sale of products and services and are adjusted for estimated returns and allowances, which historically have been insignificant. We recognize revenue when the obligations under the terms of a contract with our customers are satisfied; generally, this occurs with the transfer of control of our systems, non-system products or services. In circumstances where control is not transferred until destination or acceptance, we defer revenue recognition until such events occur. Revenue for established products that have previously satisfied a customer’s acceptance requirements is generally recognized upon shipment. In cases where a prior history of customer acceptance cannot be demonstrated or from sales where customer payment dates are not determinable and in the case of new products, revenue and cost of sales are deferred until customer acceptance has been received. Our post-shipment obligations typically include installation and standard warranties. The estimated fair value of installation related revenue is recognized in the period the installation is performed. Service revenue is recognized over time as the transfer of control is completed for the related contract or upon completion of the services if they are short-term in nature. Spares, contactor and kit revenue is generally recognized upon shipment. Certain of our equipment sales have multiple performance obligations. These arrangements involve the delivery or performance of multiple performance obligations, and transfer of control of performance obligations may occur at different points in time or over different periods of time. For arrangements containing multiple performance obligations, the revenue relating to the undelivered performance obligation is deferred using the relative standalone selling price method utilizing estimated sales prices until satisfaction of the deferred performance obligation. Unsatisfied performance obligations primarily represent contracts for products with future delivery dates. At December 28, 2019 and December 29, 2018 we had $10.0 million and $19.1 million of revenue expected to be recognized in the future related to performance obligations that are unsatisfied (or partially unsatisfied), respectively. We generally sell our equipment with a product warranty. The product warranty provides assurance to customers that delivered products are as specified in the contract (an “assurance-type warranty”). Therefore, we account for such product warranties under ASC 460, Guarantees (“ASC 460”), and not as a separate performance obligation. The transaction price reflects our expectations about the consideration we will be entitled to receive from the customer and may include fixed or variable amounts. Fixed consideration primarily includes sales to customers that are known as of the end of the reporting period. Variable consideration includes sales in which the amount of consideration that we will receive is unknown as of the end of a reporting period. Such consideration primarily includes sales made to certain customers with cumulative tier volume discounts offered. Variable consideration arrangements are rare; however, when they occur, we estimate variable consideration as the expected value to which we expect to be entitled. Included in the transaction price estimate are amounts in which it is probable that a significant reversal of cumulative revenue recognized will not occur when the uncertainty associated with the variable consideration is subsequently resolved. The estimate is based on information available for projected future sales. Variable consideration that does not meet revenue recognition criteria is deferred. Accounts receivable represents our unconditional right to receive consideration from our customer. Payments terms do not exceed one year from the invoice date and therefore do not include a significant financing component. To date, there have been no material impairment losses on accounts receivable. There were no material contract assets recorded on the consolidated balance sheet in any of the periods presented. On shipments where sales are not recognized, gross profit is generally recorded as deferred profit in our consolidated balance sheet representing the difference between the receivable recorded and the inventory shipped.
On December 31, 2017, the first day of our fiscal 2018, we adopted ASU No. 2014-09, Revenue from Contracts with Customers (Topic 606) (ASU 2014-09), which amends the existing accounting standards for revenue recognition. For additional information on the impact this new standard had on our revenue recognition and results of operations see recently adopted accounting pronouncements in Note 1 “Accounting Policies” in Part IV, Item 15(a) of this Form 10-K.
Accounts Receivable: We maintain an allowance for doubtful accounts for estimated losses resulting from the inability of our customers to make required payments. If the financial condition of our customers deteriorates, resulting in an impairment of their ability to make payments, additional allowances may be required.
Inventory: The valuation of inventory requires us to estimate obsolete or excess inventory as well as inventory that is not of saleable quality. The determination of obsolete or excess inventory requires us to estimate the future demand for our products. The demand forecast is a direct input in the development of our short-term manufacturing plans. We record valuation reserves on our inventory for estimated excess and obsolete inventory and lower of cost or net realizable value concerns equal to the difference between the cost of inventory and the estimated realizable value based upon assumptions about future product demand, market conditions and product selling prices. If future product demand, market conditions or product selling prices are less than those projected by management or if continued modifications to products are required to meet specifications or other customer requirements, increases to inventory reserves may be required which would have a negative impact on our gross margin.
Income Taxes: We estimate our liability for income taxes based on the various jurisdictions where we conduct business. This requires us to estimate our (i) current taxes; (ii) temporary differences that result from differing treatment of certain items for tax and accounting purposes and (iii) unrecognized tax benefits. Temporary differences result in deferred tax assets and liabilities that are reflected in the consolidated balance sheet. The deferred tax assets are reduced by a valuation allowance if, based upon all available evidence, it is more likely than not that some or all of the deferred tax assets will not be realized. Establishing, reducing or increasing a valuation allowance in an accounting period generally results in an increase or decrease in tax expense in the statement of operations. We must make significant judgments to determine the provision for income taxes, deferred tax assets and liabilities, unrecognized tax benefits and any valuation allowance to be recorded against deferred tax assets. Our gross deferred tax asset balance as of December 28, 2019, was approximately $140.3 million, with a valuation allowance of approximately $93.5 million.
The Tax Cuts and Jobs Act (“Tax Act”) was enacted on December 22, 2017. The accounting for the tax effects of the enactment of the Tax Act was completed in 2018. See Note 8, “Income Taxes”, included in Part IV, Item 15(a) of this Form 10-K, which is incorporated herein by reference.
Segment Information: We applied the provisions of ASC Topic 280, Segment Reporting, (“ASC 280”), which sets forth a management approach to segment reporting and establishes requirements to report selected segment information quarterly and to report annually entity-wide disclosures about products, major customers and the geographies in which the entity holds material assets and reports revenue. An operating segment is defined as a component that engages in business activities whose operating results are reviewed by the chief operating decision maker and for which discrete financial information is available. After the acquisition of Xcerra on October 1, 2018, we have determined that our four identified operating segments are: Test Handler Group (“THG”), Semiconductor Tester Group (“STG”), Interface Solutions Group (“ISG”) and PCB Test Group (“PTG”). Our THG, STG and ISG operating segments qualify for aggregation under ASC 280 due to similarities in their customers, their economic characteristics, and the nature of products and services provided. As a result, we report in two segments, Semiconductor Test & Inspection and PCB Test.
Goodwill, Purchased Intangible Assets and Other Long-lived Assets: We evaluate goodwill for impairment annually and when an event occurs or circumstances change that indicate that the carrying value may not be recoverable. We test goodwill for impairment by comparing the book value of net assets to the fair value of the reporting units. If the fair value is determined to be less than the book value, an impairment charge is recognized as the amount by which the carrying amount of goodwill exceeds the reporting unit's fair value, not to exceed the carrying amount of goodwill. We estimated the fair values of our reporting units primarily using the income approach valuation methodology that includes the discounted cash flow method, taking into consideration the market approach and certain market multiples as a validation of the values derived using the discounted cash flow methodology. Forecasts of future cash flows are based on our best estimate of future net sales and operating expenses, based primarily on customer forecasts, industry trade organization data and general economic conditions.
We conduct our annual impairment test as of October 1st of each year, and have determined there was no impairment as of October 1, 2019, as we determined that the estimated fair values of our reporting units exceeded their carrying values on that date. Other events and changes in circumstances may also require goodwill to be tested for impairment between annual measurement dates. As of December 28, 2019, we do not believe that circumstances have occurred that indicate impairment of our goodwill is more-likely-than-not. In the event we determine that an interim goodwill impairment review is required in a future period, the review may result in an impairment charge, which would have a negative impact on our results of operations.
We evaluate our indefinite-lived intangible assets associated with in-process research and development by comparing the fair value of each project with its carrying value. This evaluation is completed annually and whenever indicators of impairment are present.
Long-lived assets, other than goodwill, are reviewed for impairment whenever events or changes in circumstances indicate that the carrying amount of the assets might not be recoverable. Conditions that would necessitate an impairment assessment include a significant decline in the observable market value of an asset, a significant change in the extent or manner in which an asset is used, or any other significant adverse change that would indicate that the carrying amount of an asset or group of assets may not be recoverable. For long-lived assets, impairment losses are only recorded if the asset’s carrying amount is not recoverable through its undiscounted, probability-weighted future cash flows. We measure the impairment loss based on the difference between the carrying amount and estimated fair value.
Warranty: We provide for the estimated costs of product warranties in the period sales are recognized. Our warranty obligation estimates are affected by historical product shipment levels, product performance and material and labor costs incurred in correcting product performance problems. Should product performance, material usage or labor repair costs differ from our estimates, revisions to the estimated warranty liability would be required.
Contingencies: We are subject to certain contingencies that arise in the ordinary course of our businesses which require us to assess the likelihood that future events will confirm the existence of a loss or an impairment of an asset. If a loss or asset impairment is probable and the amount of the loss or impairment is reasonably estimable, we accrue a charge to operations in the period such conditions become known.
Share-based Compensation: Share-based compensation expense related to restricted stock unit awards is calculated based on the market price of our common stock on the grant date, reduced by the present value of dividends expected to be paid on our common stock prior to vesting of the restricted stock unit. Share-based compensation on performance stock units with market-based goals is calculated using a Monte Carlo simulation model on the date of the grant. Share-based compensation expense related to stock options is recorded based on the fair value of the award on its grant date, which we estimate using the Black-Scholes valuation model.
Recent Accounting Pronouncements: For a description of accounting changes and recent accounting pronouncements, including the expected dates of adoption and estimated effects, if any, on our Consolidated Financial Statements, see Note 1, “Recent Accounting Pronouncements” in Part IV, Item 15(a) of this Form 10-K.
RESULTS OF OPERATIONS
Recent Transactions Impacting Results of Operations
On October 1, 2018 we completed the acquisition of Xcerra Corporation and the results of its operations have been included in our consolidated financial statements only since that date. Due to the timing of the acquisition our prior year results only include Xcerra for the three months ended December 29, 2018, and current year results include Xcerra for the twelve months ended December 28, 2019. Management determined that the fixtures services business, that was acquired as part of Xcerra, did not align with Cohu’s long-term strategic plan and management divested this portion of the business in February 2020. As a result, the assets of our fixtures business are considered “held for sale” and the operations of our fixtures business are considered “discontinued operations” as of both December 28, 2019 and December 29, 2018. Unless otherwise indicated, the discussion below covers the comparative results from continuing operations.
The following table summarizes certain operating data as a percentage of net sales:
|
2019 |
2018 |
2017 |
|||||||||||
|
Net sales |
100.0 | % | 100.0 | % | 100.0 | % | |||||||
|
Cost of sales |
(60.6 | ) | (64.7 | ) | (59.3 | ) | |||||||
|
Gross margin |
39.4 | 35.3 | 40.7 | ||||||||||
|
Research and development |
(14.8 | ) | (12.5 | ) | (11.6 | ) | |||||||
|
Selling, general and administrative |
(24.5 | ) | (21.4 | ) | (17.2 | ) | |||||||
|
Amortization of purchased intangible assets |
(6.8 | ) | (3.8 | ) | (1.2 | ) | |||||||
|
Restructuring charges |
(2.3 | ) | (4.1 | ) | - | ||||||||
|
Total operating expenses |
(48.4 | ) | (41.8 | ) | (30.0 | ) | |||||||
|
Income (loss) from operations |
(9.0 | )% | (6.6 | )% | 10.7 | % | |||||||
Please refer to “Management’s Discussion and Analysis of Financial Condition and Results of Operations” in Part II, Item 7 in our 2018 Annual Report on Form 10-K, filed with the SEC on March 14, 2019, for comparative discussion of our fiscal years ended December 29, 2018 and December 30, 2017.
2019 Compared to 2018
Net Sales
Cohu’s consolidated net sales increased 29.1% from $451.8 million in 2018 to $583.3 million in 2019. The increase in our consolidated net sales was a result of the acquisition of Xcerra which generated $300.8 million in 2019 and $94.4 million in 2018. Excluding the impact of Xcerra, our consolidated net sales decreased year over year as a result of softer demand for smartphones, weaker automotive semiconductor demand, ongoing softness in the China market that is in part related to trade tensions between the U.S. and China and export restrictions.
Gross Margin (exclusive of amortization of acquisition-related intangible assets described below)
Gross margin consists of net sales less cost of sales (excluding the impact of amortization of developed technology and backlog). Cost of sales consists primarily of the materials, assembly and test labor and overhead from operations. Our gross margin can fluctuate due to a number of factors, including, but not limited to, the mix of products sold, product support costs, increases to inventory reserves, the sale of previously reserved inventory and utilization of manufacturing capacity. Our gross margin, as a percentage of net sales, increased to 39.4% in 2019 from 35.3% in 2018. The significant components driving the improvement in our gross margin are discussed below.
We compute the majority of our excess and obsolete inventory reserve requirements using inventory usage forecasts ranging from one to three years. During 2019, we recorded net charges to cost of sales of approximately $4.1 million, for excess and obsolete inventory. Additionally, as part of the integration and restructuring activities related to Xcerra we recorded $2.7 million of inventory related charges related to the decision to end manufacturing of certain of Xcerra’s semiconductor test handler products. In 2018, net charges to cost of sales were $1.4 million, for excess and obsolete inventory and we recorded $19.1 million of inventory related charges related to the decision to end manufacturing of certain of Xcerra’s semiconductor test handler products.
We believe our reserves for excess and obsolete inventory and lower of cost or market concerns are adequate to cover known exposures at December 28, 2019. Reductions in customer forecasts, continued modifications to products, our failure to meet specifications or other customer requirements may result in additional charges to operations that could negatively impact our gross margin in future periods.
Additionally, our cost of sales was impacted by the amortization of inventory step-up related to fair value adjustments to inventory acquired from Xcerra. In 2019 and 2018, we amortized $6.0 million and $14.8 million of inventory step-up, respectively.
Research and Development Expense (“R&D Expense”)
R&D expense consists primarily of salaries and related costs of employees engaged in ongoing research, product design and development activities, costs of engineering materials and supplies and professional consulting expenses. Our future operating results depend, to a considerable extent, on our ability to maintain a competitive advantage in the products we provide, and historically we have maintained our commitment to investing in R&D in order to be able to continue to offer new products to our customers. R&D expense in 2019 was $86.1 million, or 14.8% of net sales, increasing from $56.4 million, or 12.5% of net sales in 2018. The increase in our R&D expense in 2019 was associated with the acquisition of Xcerra, which added product development expenses totaling $45.4 million in 2019 as compared to incremental costs of $11.6 million in 2018. R&D costs unrelated to Xcerra decreased due to cost control initiatives implemented as a result of current business conditions.
Selling, General and Administrative Expense (“SG&A Expense”)
SG&A expense consists primarily of salaries and benefit costs of employees, commission expense for independent sales representatives, product promotion and costs of professional services. SG&A expense as a percentage of net sales increased to 24.5% in 2019, from 21.4% in 2018, while increasing in absolute dollars from $96.8 million in 2018 to $142.9 million in 2019. The increase in SG&A expense recognized in 2019 was a result of a full year’s incremental expenses from Xcerra totaling $84.8 million. Incremental SG&A expense in 2018 from Xcerra was $24.9 million. Our SG&A expenses unrelated to Xcerra’s operations decreased primarily due to transaction related expenses and other items as described below.
During each of the last two years Cohu has incurred costs specifically related to business acquisitions. In 2019, acquisition costs totaled $0.4 million and were entirely comprised of professional service and other transaction related expenses associated with the acquisition of Xcerra. In 2018, acquisition costs totaled $10.5 million and were comprised of $9.8 million of professional service and other transaction related expenses associated with the acquisition of Xcerra. Additionally, during 2018 we recorded $0.7 million related to mark-to-market adjustments made to the fair value of the Kita acquisition-related contingent consideration liability.
In 2019 and 2018, we recorded $1.2 million and $0.9 million of expense, respectively, related to a reduction of an indemnification receivable related to an uncertain tax position recorded in the acquisition of Ismeca Semiconductor Holdings SA (“Ismeca”) in 2013. In connection with this reduction we also booked a corresponding amount as a credit to our income tax provision and, as a result, the impact of this reduction on net income was zero.
Amortization of Purchased Intangible Assets
Amortization of purchased intangibles is the process of expensing the cost of an intangible asset acquired through a business combination over the projected life of the asset. Amortization of acquisition-related intangible assets was $39.6 million and $17.2 million for 2019 and 2018, respectively. The year over year increase in amortization expense in 2019 was driven by amortization of purchased intangible assets obtained from Xcerra.
See Note 2, “Business Acquisitions” in Part IV, Item 15(a) of this Form 10-K for additional information with respect to intangible assets.
Restructuring Charges
Subsequent to the acquisition of Xcerra on October 1, 2018, during fourth quarter 2018, we began a strategic restructuring program designed to reposition our organization and improve our cost structure as part of our targeted integration plan regarding Xcerra. We recorded restructuring charges, exclusive of the inventory related charges described above, totaling $13.5 million and $18.7 million in 2019 and 2018, respectively.
See Note 5, “Restructuring Charges” in Part IV, Item 15(a) of this Form 10-K for additional information with respect to restructuring charges.
Interest Expense and Income
Interest expense was $20.6 million in 2019 as compared to $5.0 million in 2018. The increase was a result of interest associated with the Term B Loan obtained to finance part of the purchase of Xcerra on October 1, 2018. As a result of the timing of the transaction and the related financing, 2019 includes interest expense for the full twelve months of 2019, whereas 2018 only includes interest expense for the three months after the acquisition. See Note 4, “Borrowings and Credit Agreements”, included in Part IV, Item 15(a) of this Form 10-K, which is incorporated herein by reference.
Interest income was $0.8 million in 2019 as compared to $1.2 million in 2018 and decreased due to lower interest rates and lower investment holdings.
Foreign Transaction Gain (Loss) and Other
We have operations in foreign countries and conduct business in the local currency in these countries. In 2019 we incurred an insignificant foreign currency transaction gain for the year. In 2018, the U.S. Dollar weakened against primarily the Swiss Franc and Euro, which resulted in the recognition of $1.7 million in foreign currency transaction losses.
Income Taxes
The income tax provision (benefit) expressed as a percentage of pre-tax income or loss in 2019 and 2018 was (4.3)% and 2.0%, respectively. The income tax provision for the years ended December 28, 2019, and December 29, 2018, differs from the U.S. federal statutory rate primarily due to changes in the valuation allowance on our deferred tax assets, foreign income taxed at different rates, releases from statute expirations, impact of the Tax Act and other factors.
Companies are required to assess whether a valuation allowance should be recorded against their deferred tax assets (“DTAs”) based on the consideration of all available evidence, using a “more likely than not” realization standard. The four sources of taxable income that must be considered in determining whether DTAs will be realized are, (1) future reversals of existing taxable temporary differences (i.e. offset of gross deferred tax assets against gross deferred tax liabilities); (2) taxable income in prior carryback years, if carryback is permitted under the tax law; (3) tax planning strategies and (4) future taxable income exclusive of reversing temporary differences and carryforwards.
In assessing whether a valuation allowance is required, significant weight is to be given to evidence that can be objectively verified. We have evaluated our DTAs at each reporting period, including an assessment of our cumulative income or loss over the prior three-year period and future periods, to determine if a valuation allowance was required. A significant negative factor in our assessment was Cohu’s three-year cumulative loss history at the end of various fiscal periods including 2019.
As a result of our cumulative, three-year U.S. GAAP pretax loss from continuing operations at the end of 2019, we were unable to conclude that it was “more likely than not” that our U.S. DTAs would be realized. We will evaluate the realizability of our DTAs at the end of each quarterly reporting period in 2020 and, should circumstances change, it is possible an additional valuation allowance will be recorded or the remaining valuation allowance, or a portion thereof, will be reversed in a future period.
Our valuation allowance on our DTAs at December 28, 2019, and December 29, 2018, was approximately $93.5 million and $84.7 million, respectively. The remaining gross DTAs for which a valuation allowance was not recorded are realizable primarily through future reversals of existing taxable temporary differences and to a lesser extent future taxable income exclusive of reversing temporary differences and carryforwards.
As the realization of DTAs is determined by tax jurisdiction, the deferred tax liabilities recorded by our non-U.S. subsidiaries were not a source of taxable income in assessing the realization of our DTAs in the U.S.
For a full reconciliation of our effective tax rate to the U.S. federal statutory rate and further explanation of our provision for income taxes, see Note 8, “Income Taxes”, included in Part IV, Item 15(a) of this Form 10-K, which is incorporated herein by reference.
Income (Loss) from Continuing Operations and Net Income (Loss)
As a result of the factors set forth above, our net loss from continuing operations was $69.0 million in 2019, compared to $32.5 million in 2018. Including the results of our discontinued operations, our net loss in 2019 and 2018 was $69.7 million and $32.4 million, respectively.
LIQUIDITY AND CAPITAL RESOURCES
Our business is dependent on capital expenditures by semiconductor manufacturers and test subcontractors that are, in turn, dependent on the current and anticipated market demand for semiconductors. The seasonal and volatile nature of demand for semiconductor equipment, our primary industry, makes estimates of future revenues, results of operations and net cash flows difficult.
Our primary historical source of liquidity and capital resources has been cash flow generated by operations and we manage our business to maximize operating cash flows as our primary source of liquidity. We use cash to fund growth in our operating assets and to fund new products and product enhancements primarily through research and development.
On October 1, 2018, we entered into a bank credit agreement which provides for a $350.0 million seven-year Term B Loan facility and borrowed the full amount. The Term B Loan facility matures on October 1, 2025. These proceeds were used on October 1, 2018, together with our cash and cash equivalents, to finance the acquisition of Xcerra. See Note 4 “Borrowings and Credit Agreements” included in Part IV, Item 15(a) of this Form 10-K, which is incorporated herein by reference.
At December 28, 2019, our total indebtedness, net of discount and deferred financing costs, was $353.1 million, which included $339.1 million outstanding under the Term B Loan, $3.8 million outstanding under Kita’s term loans, $5.5 million outstanding under Rasco’s construction loans, $3.2 million outstanding under Kita’s lines of credit, and $1.5 million outstanding under Xcerra’s term loan.
We believe that our sources of liquidity will be sufficient to satisfy our anticipated cash requirements through at least the next 12 months. Our liquidity could be negatively affected by a decrease in demand for our products. In addition, we may make acquisitions or increase our capital expenditures and may need to raise additional capital through debt or equity financing to provide for greater flexibility to fund these activities. Additional financing may not be available or not available on terms favorable to us.
Liquidity
Working Capital: The following summarizes our cash, cash equivalents, short-term investments and working capital at December 28, 2019 and December 29, 2018:
|
(in thousands) |
2019 |
2018 |
Decrease |
Percentage Change |
||||||||||||
|
Cash, cash equivalents and short-term investments |
$ | 156,098 | $ | 165,020 | $ | (8,922 | ) | (5.4 | )% | |||||||
|
Working capital |
$ | 290,811 | $ | 324,650 | $ | (33,839 | ) | (10.4 | )% | |||||||
As of December 28, 2019, $92.7 million of our cash and cash equivalents was held by our foreign subsidiaries. If these funds are needed for our operations in the U.S., we may be required to accrue and pay foreign withholding taxes if we repatriate these funds. Except for working capital requirements in certain jurisdictions, we provide for all withholding and other residual taxes related to unremitted earnings of our foreign subsidiaries. Beginning in 2018, earnings realized in foreign jurisdictions are subject to U.S. tax in accordance with the Tax Act.
Cash Flows
Operating Activities: Cash provided by operating activities consists of our net loss adjusted for non-cash expenses and changes in operating assets and liabilities. These adjustments include depreciation expense on property, plant and equipment, share-based compensation expense, amortization of intangible assets, deferred income taxes and amortization of inventory step-up and inventory related charges related to Xcerra. Our net cash flows provided by operating activities in 2019 totaled $17.3 million compared to $34.4 million in 2018. The decrease in cash provided by operating activities in the current year was a result of weaker business conditions and our net loss, but was also impacted by changes in current assets and liabilities which included decreases in accounts receivable, income taxes payable and accounts payable. Lower business volume in the fourth quarter of 2019 and the timing of the resulting cash conversion cycle drove the $21.2 million reduction in accounts receivable. Income taxes payable decreased $10.7 million a result of tax payments made in certain foreign jurisdictions. Excluding the impact of amounts accrued for fixed assets and cloud computing, our accounts payable decreased $3.1 million as a result of decreased business conditions and the timing of cash payments made to our suppliers. Cash provided by operating activities was also impacted by increases in other current assets of $6.0 million and accrued compensation, warranty and other liabilities of $2.1 million which was driven, primarily by increases in interest payable and customer advances, offset by lower accruals for incentive compensation and warranty due to decreased sales in 2019.
Investing Activities: Investing cash flows consist primarily of cash used for capital expenditures in support of our business, purchases of investments, proceeds from investment maturities, business acquisitions, asset disposals and business divestitures. Our net cash used in investing activities in 2019 totaled $16.5 million. Additions to property, plant and equipment in 2019 were $18.0 million and were made to support the operating and development activities of our Semiconductor Test & Inspection segment. During 2019 we generated cash totaling $1.8 million from the sale of land and fixed assets.
Financing Activities: In fiscal 2019, our cash used in financing activities totaled $8.2 million. During 2019, we paid dividends totaling $9.8 million, or $0.24 per common share and on February 12, 2020, we announced a cash dividend of $0.06 per share on our common stock, payable on April 9, 2020, to stockholders of record as of February 25, 2020. We intend to continue to pay quarterly dividends subject to capital availability and periodic determinations by our Board of Directors that cash dividends are in the best interests of our stockholders. During 2019, we received proceeds under a construction loan totaling $5.5 million and made debt payments totaling $3.8 million. Proceeds from the construction loan are being used to expand our facility in Kolbermoor, Germany enabling us to consolidate the German operations of our Semiconductor Test & Inspection segment in 2020.
Capital Resources
In addition to the bank credit agreement which provides for a $350.0 million seven-year Term B Loan facility as described above, we have access to other credit facilities to finance our operations if needed.
As a result of our acquisition of Xcerra, we assumed a term loan related to the purchase of Xcerra’s facility in Rosenheim, Germany. The loan is payable over 10 years at an annual interest rate of 2.35%. Principal plus accrued interest is due quarterly over the duration of the term loan. At December 28, 2019, the outstanding loan balance was $1.5 million and $0.3 million of the outstanding balance is presented as current installments of long-term debt in our consolidated balance sheets. The term loan is denominated in Euros and, as a result, amounts disclosed herein will fluctuate because of changes in currency exchange rates.
In connection with the acquisition of Kita on January 4, 2017, we assumed a series of revolving credit facilities with various financial institutions in Japan. The revolving credit facilities renew monthly and provide Kita with access to working capital totaling up to $8.8 million. At December 28, 2019, total borrowings outstanding under the revolving lines of credit were $3.2 million. As these credit facility agreements renew monthly, they have been included in short-term borrowings in our consolidated balance sheet. We also assumed long-term term loans from a series of Japanese financial institutions totaling $3.8 million primarily related to the expansion of Kita’s facility in Osaka, Japan. The loans are collateralized by the facility and land. The loans carry interest rates ranging from 0.05% to 0.43% and expire at various dates through 2034. At December 28, 2019, $0.4 million of the term loans have been included in current installments of long-term debt in our consolidated balance sheet. The revolving lines of credit and term loans are denominated in Japanese Yen and, as a result, amounts will fluctuate as a result of changes in currency exchange rates.
On July 26, 2019, one of our wholly owned subsidiaries located in Germany entered into two construction loans (“Loan Facilities”) with a German financial institution providing total borrowing of €8.6 million. The Loan Facilities have 10-year and 15-year terms, which commenced on August 1, 2019, the initial draw-down date. The Loan Facilities are being utilized to finance the expansion of our facility in Kolbermoor, Germany, enabling us to combine the operations of multiple subsidiaries in one location as part of our previously announced strategic restructuring program. The Loan Facilities are secured by the land and the existing building on the site and bear interest at agreed upon rates based on separate €3.4 million and €5.2 million facility amounts.
On August 1, 2019, the full €3.4 million was drawn under the first facility, which is payable over 10 years at an annual interest rate of 0.8%. Interest payments only are required to be made each quarter starting in September 2019 with principal and interest payments due each quarter starting in the month of December 2021. Principal repayments will be made over 8 years starting at the end of 2021.
On December 10, 2019, we drew €1.5 million under the second facility, which is payable over 15 years at an annual interest rate of 1.05%. Interest payments only are required to be made each quarter starting in December 2019 with principal and interest payments due each quarter starting in the month of May 2020. Principal repayments will be made over 15 years starting at the end of May 2020. As of December 28, 2019, €3.7 million had not been drawn under the second facility as is expected to be drawn in the first half of 2020.
At December 28, 2019, total outstanding borrowings under the Loan Facilities was $5.5 million with $0.3 million of the total outstanding balance being presented as current installments of long-term debt in our consolidated balance sheets based on contractual due dates. The loans are denominated in Euros and, as a result, amounts disclosed herein will fluctuate because of changes in currency exchange rates. The fair value of the debt approximates the carrying value at December 28, 2019.
We have a secured letter of credit facility (the “Secured Facility”) under which Bank of America, N.A., has agreed to administer the issuance of letters of credit on behalf of Cohu and our subsidiaries. The Secured Facility requires us to maintain deposits of cash or other approved investments, which serve as collateral, in amounts that approximate our outstanding standby letters of credit. In addition, our wholly owned subsidiary, Xcerra, has arrangements with various financial institutions for the issuance of letters of credit and bank guarantees. As of December 28, 2019, $1.1 million was outstanding under standby letters of credit and bank guarantees. Our wholly owned subsidiary Ismeca Semiconductor Holdings SA (“Ismeca”) has an agreement with UBS (the “Ismeca Facility”) under which they administer lines of credit on behalf of Ismeca. Total borrowings available under the Ismeca Facility are 2.0 million Swiss Francs and at December 28, 2019, no amounts were outstanding.
We expect that we will continue to make capital expenditures to support our business and we anticipate that present working capital will be sufficient to meet our operating requirements for at least the next twelve months.
Contractual Obligations
The following table summarizes our significant contractual obligations at December 28, 2019, and the effect such obligations are expected to have on our liquidity and cash flows in future periods. Amounts excluded include our liability for unrecognized tax benefits that totaled approximately $34.6 million at December 28, 2019. We are currently unable to provide a reasonably reliable estimate of the amount or period(s) the cash settlement of this liability may occur.
|
Fiscal year-end |
||||||||||||||||||||
|
(in thousands) |
Total |
2020 |
2021-2022 | 2023-2024 |
Thereafter |
|||||||||||||||
|
Operating leases (1) |
$ | 45,001 | $ | 7,383 | $ | 11,625 | $ | 9,679 | $ | 16,314 | ||||||||||
|
Finance Leases (2) |
2,631 | 2,631 | ||||||||||||||||||
|
Bank term loans principal and interest |
462,534 | 22,498 | 45,104 | 44,152 | 350,780 | |||||||||||||||
|
Revolving credit facilities |
3,195 | 3,195 | - | - | - | |||||||||||||||
|
Total contractual obligations |
$ | 513,361 | $ | 35,707 | $ | 56,729 | $ | 53,831 | $ | 367,094 | ||||||||||
|
(1) |
Excludes an insignificant amount of short-term lease obligations. |
|
(2) |
Includes fair value mark-up of lease obligation as a result of Xcerra acquisition. |
The table above does not include pension, post-retirement benefit and warranty obligations because it is not certain when these liabilities will be funded. For additional information regarding our pension and post-retirement benefits obligations see Note 6, “Employee Benefit Plans” and for more information on our contractual obligations, see Note 12, “Guarantees” in Part IV, Item 15(a) of this Form 10-K.
Commitments to contract manufacturers and suppliers. From time-to-time, we enter into commitments with our vendors and outsourcing partners to purchase inventory at fixed prices or in guaranteed quantities. We are not able to determine the aggregate amount of such purchase orders that represent contractual obligations, as purchase orders may represent authorizations to purchase rather than binding agreements. Our purchase orders are based on our current manufacturing needs and are fulfilled by our vendors within relatively short time horizons. We typically do not have significant agreements for the purchase of raw materials or other goods specifying minimum quantities or set prices that exceed our expected requirements for the next three months.
Off-Balance Sheet Arrangements. During the ordinary course of business, we provide standby letters of credit instruments to certain parties as required. As of December 28, 2019, $1.1 million was outstanding under standby letters of credit.
Item 7A. Quantitative and Qualitative Disclosures About Market Risk.
Investment and Interest Rate Risk.
At December 28, 2019, our investment portfolio included short-term, fixed-income investment securities with a fair value of approximately $0.9 million, and we did not hold or issue financial instruments for trading purposes. These securities are subject to interest rate risk and will likely decline in value if interest rates increase. Our future investment income may fall short of expectations due to changes in interest rates or we may suffer losses in principal if we are forced to sell securities that decline in market value due to changes in interest rates. As we classify our short-term securities as available-for-sale, no gains or losses are recognized due to changes in interest rates unless such securities are sold prior to maturity or declines in fair value are determined to be other-than-temporary. Due to the relatively short duration of our investment portfolio, an immediate ten percent change in interest rates would have no material impact on our financial condition or results of operations.
We evaluate our investments periodically for possible other-than-temporary impairment by reviewing factors such as the length of time and extent to which fair value has been below cost basis, the financial condition of the issuer and our ability and intent to hold the investment for a period of time sufficient for anticipated recovery of market value. As of December 28, 2019, we had no investments with loss positions.
Our long-term debt is carried at amortized cost and fluctuations in interest rates do not impact our consolidated financial statements. However, the fair value of our debt will generally fluctuate with movements of interest rates, increasing in periods of declining rates of interest and declining in periods of increasing rates of interest. As of December 28, 2019, we have approximately $343.0 million of long-term debt due under a credit facility that is subject to quarterly interest payments that are based on either a base rate plus a margin of up to 2.0% per annum, or the London Interbank Offered Rate (LIBOR) plus a margin of up to 3.0% per annum. The selection of the interest rate formula is at our discretion. The interest rate otherwise payable under the credit facility will be subject to increase by 2.0% per annum during the continuance of a payment default and may be subject to increase by 2.0% per annum with respect to the overdue principal amount of any loans outstanding and overdue interest payments and other overdue fees and amounts. At December 28, 2019, the interest rate in effect on these borrowings was 5.20%.
In July 2017, the UK’s Financial Conduct Authority, which regulates the LIBOR, announced that it intends to phase out LIBOR by the end of 2021. After 2021, it is unclear whether banks will continue to provide LIBOR submissions to the administrator of LIBOR, and no consensus currently exists as to what benchmark rate or rates may become accepted alternatives to LIBOR. In the United States, efforts to identify a set of alternative U.S. dollar reference interest rates include proposals by the Alternative Reference Rates Committee that has been convened by the Federal Reserve Board and the Federal Reserve Bank of New York. We cannot currently predict the effect of the discontinuation of, or other changes to, LIBOR or any establishment of alternative reference rates in the United States, the European Union or elsewhere in the global capital markets. The uncertainty regarding the future of LIBOR, as well as the transition from LIBOR to any alternative reference rate or rates, could have adverse impacts on floating rate obligations, loans, deposits, derivatives and other financial instruments that currently use LIBOR as a benchmark rate. Our Term B Loan facility constitutes our most significant exposure to this transition and there is no guarantee that a shift from LIBOR to a new reference rate will not result in increases to our borrowing costs.
Foreign Currency Exchange Risk.
We have operations in several foreign countries and conduct business in the local currency in these countries. As a result, we have risk associated with currency fluctuations as the value of foreign currencies fluctuate against the U.S. dollar, in particular the Swiss Franc, Euro, Malaysian Ringgit, Chinese Yuan, Philippine Peso and Japanese Yen. These fluctuations can impact our reported earnings.
Fluctuations in currency exchange rates also impact the U.S. Dollar amount of our net investment in foreign operations. The assets and liabilities of our foreign subsidiaries are translated into U.S. Dollars at the exchange rates in effect at the fiscal year-end balance sheet date. Income and expense accounts are translated at an average exchange rate during the year which approximates the rates in effect at the transaction dates. The resulting translation adjustments are recorded in stockholders’ equity as a component of accumulated other comprehensive income. As a result of fluctuations in certain foreign currency exchange rates in relation to the U.S. Dollar as of December 28, 2019 compared to December 29, 2018, our stockholders’ equity decreased by $7.5 million as a result of the foreign currency translation.
Based upon the current levels of net foreign assets, a hypothetical 10% devaluation of the U.S. dollar as compared to these currencies as of December 28, 2019 would result in an approximate $41.3 million positive translation adjustment recorded in other comprehensive income within stockholders’ equity. Conversely, a hypothetical 10% appreciation of the U.S. dollar as compared to these currencies as of December 28, 2019 would result in an approximate $41.3 million negative translation adjustment recorded in other comprehensive income within stockholders’ equity.
Item 8. Financial Statements and Supplementary Data.
The information required by this Item is included in Part IV, Item 15(a).
Item 9. Changes in and Disagreements with Accountants on Accounting and Financial Disclosure.
None.
Item 9A. Controls and Procedures.
Conclusion Regarding the Effectiveness of Disclosure Controls and Procedures - Under the supervision and with the participation of our management, including our principal executive officer and principal financial officer, we conducted an evaluation of our disclosure controls and procedures, as such term is defined under Rules 13a-15(e) and 15d-15(e) promulgated under the Securities Exchange Act of 1934, as amended (the “Exchange Act”). Based on this evaluation, our principal executive officer and our principal financial officer concluded that our disclosure controls and procedures were effective as of December 28, 2019, the end of the period covered by this annual report.
Changes in Internal Control over Financial Reporting - There was no change in our internal control over financial reporting (as defined in Rules 13a-15(f) and 15d-15(f) under the Exchange Act) during the three months ended December 28, 2019, that has materially affected, or is reasonably likely to materially affect, our internal control over financial reporting.
Management’s Annual Report on Internal Control Over Financial Reporting - Our management is responsible for establishing and maintaining adequate internal control over financial reporting, as such term is defined in Exchange Act Rules 13a-15(f) and 15d-15(f). Under the supervision and with the participation of our management, including our principal executive officer and principal financial officer, we conducted an evaluation of the effectiveness of our internal control over financial reporting based on the framework in Internal Control - Integrated Framework issued by the Committee of Sponsoring Organizations of the Treadway Commission (2013 framework). Based on our evaluation under the framework in Internal Control - Integrated Framework, our management concluded that our internal control over financial reporting was effective as of December 28, 2019.
Ernst & Young LLP, the independent registered public accounting firm that audited the Consolidated Financial Statements included in this Annual Report on Form 10-K, has also audited the effectiveness of our internal control over financial reporting as of December 28, 2019, as stated in their report which is included herein.
Report of Independent Registered Public Accounting Firm
To the Shareholders and the Board of Directors of Cohu, Inc.
Opinion on Internal Control over Financial Reporting
We have audited Cohu, Inc.’s internal control over financial reporting as of December 28, 2019, based on criteria established in Internal Control—Integrated Framework issued by the Committee of Sponsoring Organizations of the Treadway Commission (2013 framework) (the COSO criteria). In our opinion, Cohu, Inc. (the Company) maintained, in all material respects, effective internal control over financial reporting as of December 28, 2019, based on the COSO criteria.
We also have audited, in accordance with the standards of the Public Company Accounting Oversight Board (United States) (PCAOB), the consolidated balance sheets of the Company as of December 28, 2019 and December 29, 2018, and the related consolidated statements of operations, comprehensive income (loss), stockholders’ equity, and cash flows for each of the three years in the period ended December 28, 2019, and the related notes and the financial statement schedule listed in the Index at Item 15(a) and our report dated March 10, 2020, expressed an unqualified opinion thereon.
Basis for Opinion
The Company’s management is responsible for maintaining effective internal control over financial reporting and for its assessment of the effectiveness of internal control over financial reporting included in the accompanying Management’s Annual Report on Internal Control Over Financial Reporting. Our responsibility is to express an opinion on the Company’s internal control over financial reporting based on our audit. We are a public accounting firm registered with the PCAOB and are required to be independent with respect to the Company in accordance with the U.S. federal securities laws and the applicable rules and regulations of the Securities and Exchange Commission and the PCAOB.
We conducted our audit in accordance with the standards of the PCAOB. Those standards require that we plan and perform the audit to obtain reasonable assurance about whether effective internal control over financial reporting was maintained in all material respects.
Our audit included obtaining an understanding of internal control over financial reporting, assessing the risk that a material weakness exists, testing and evaluating the design and operating effectiveness of internal control based on the assessed risk, and performing such other procedures as we considered necessary in the circumstances. We believe that our audit provides a reasonable basis for our opinion.
Definition and Limitations of Internal Control Over Financial Reporting
A company’s internal control over financial reporting is a process designed to provide reasonable assurance regarding the reliability of financial reporting and the preparation of financial statements for external purposes in accordance with generally accepted accounting principles. A company’s internal control over financial reporting includes those policies and procedures that (1) pertain to the maintenance of records that, in reasonable detail, accurately and fairly reflect the transactions and dispositions of the assets of the company; (2) provide reasonable assurance that transactions are recorded as necessary to permit preparation of financial statements in accordance with generally accepted accounting principles, and that receipts and expenditures of the company are being made only in accordance with authorizations of management and directors of the company; and (3) provide reasonable assurance regarding prevention or timely detection of unauthorized acquisition, use, or disposition of the company’s assets that could have a material effect on the financial statements.
Because of its inherent limitations, internal control over financial reporting may not prevent or detect misstatements. Also, projections of any evaluation of effectiveness to future periods are subject to the risk that controls may become inadequate because of changes in conditions, or that the degree of compliance with the policies or procedures may deteriorate.
/s/ Ernst & Young LLP
San Diego, California
March 10, 2020
Item 9B. Other Information.
None.
PART III
Item 10. Directors, Executive Officers and Corporate Governance.
The information under the heading “Executive Officers of the Registrant” in Part I, Item 1 of this Form 10-K is incorporated by reference in this section. The other information required by this item is hereby incorporated by reference to the Company’s definitive proxy statement, which will be filed with the Securities and Exchange Commission (SEC) within 120 days after the close of fiscal 2019.
Code of Business Conduct and Code of Ethics
Cohu has adopted a code of business conduct and ethics for directors, officers and employees. The code is available on the Investor Relations section of our website at www.cohu.com. We intend to make all required disclosures concerning any amendments to, or waivers from, our code of ethics on our website, within four business days of such amendment or waiver.
Corporate Governance Guidelines and Certain Committee Charters
Cohu has adopted Corporate Governance Guidelines as well as charters for its Audit, Compensation and Nominating and Governance Committees. These documents are available on the Investor Relations section of our website at www.cohu.com.
The information on our website is not incorporated by reference in or considered to be a part of this Annual Report on Form 10-K.
Item 11. Executive Compensation.
Information regarding Executive Compensation is hereby incorporated by reference to the Company’s definitive proxy statement, which will be filed with the SEC within 120 days after the close of fiscal 2019.
Item 12. Security Ownership of Certain Beneficial Owners and Management and Related Stockholder Matters.
Information regarding Security Ownership of Certain Beneficial Owners and Management and Related Stockholder Matters is hereby incorporated by reference to the Company’s definitive proxy statement, which will be filed with the SEC within 120 days after the close of fiscal 2019.
Item 13. Certain Relationships and Related Transactions, and Director Independence.
Information regarding Certain Relationships and Related Transactions, and Director Independence is hereby incorporated by reference to the Company’s definitive proxy statement, which will be filed with the SEC within 120 days after the close of fiscal 2019.
Item 14. Principal Accounting Fees and Services.
Information regarding the Principal Accounting Fees and Services is hereby incorporated by reference to the Company’s definitive proxy statement, which will be filed with the SEC within 120 days after the close of fiscal 2019.
PART IV
Item 15. Exhibits, Financial Statement Schedules.
|
(a) |
The following documents are filed as part of, or incorporated by reference into, this Annual Report on Form 10-K. |
|
(1) |
Financial Statements |
The following consolidated financial statements of Cohu, Inc., including the report thereon of Ernst & Young LLP, are included in this Annual Report on Form 10-K beginning on page 41:
|
Form 10-K |
|
|
Description |
Page Number |
|
Consolidated Balance Sheets at December 28, 2019 and December 29, 2018 |
41 |
|
42 |
|
|
43 |
|
|
44 |
|
|
45 |
|
|
46 |
|
|
78 |
|
(2) |
Financial Statement Schedule |
|
83 |
All other financial statement schedules have been omitted because the required information is not applicable or not present in amounts sufficient to require submission of the schedule, or because the information required is included in the Consolidated Financial Statements or the notes thereto.
|
(3) |
Exhibits |
The exhibits listed under Item 15(b) hereof are filed with, or incorporated by reference into, this Annual Report on Form 10-K.
| COHU, INC. |
|
CONSOLIDATED BALANCE SHEETS |
|
(in thousands, except par value) |
|
December 28, |
December 29, |
|||||||
|
|
2019 |
2018 |
||||||
| ASSETS | ||||||||
|
Current assets: |
||||||||
|
Cash and cash equivalents |
$ | 155,194 | $ | 164,460 | ||||
|
Short-term investments |
904 | 560 | ||||||
|
Accounts receivable, net |
127,921 | 149,276 | ||||||
|
Inventories |
130,706 | 139,314 | ||||||
|
Prepaid expenses |
17,483 | 26,206 | ||||||
|
Other current assets |
3,158 | 1,682 | ||||||
|
Assets held for sale |
827 | - | ||||||
|
Current assets of discontinued operations (Note 13) |
3,503 | 3,741 | ||||||
|
Total current assets |
439,696 | 485,239 | ||||||
|
Property, plant and equipment, net |
70,912 | 74,332 | ||||||
|
Goodwill |
238,669 | 242,127 | ||||||
|
Intangible assets, net |
275,019 | 318,961 | ||||||
|
Other assets |
20,030 | 13,264 | ||||||
|
Operating lease right of use assets |
33,269 | - | ||||||
|
Noncurrent assets of discontinued operations (Note 13) |
115 | 79 | ||||||
| $ | 1,077,710 | $ | 1,134,002 | |||||
|
LIABILITIES AND STOCKHOLDERS' EQUITY |
||||||||
|
Current liabilities: |
||||||||
|
Short-term borrowings |
$ | 3,195 | $ | 3,115 | ||||
|
Current installments of long-term debt |
3,322 | 3,672 | ||||||
|
Accounts payable |
48,697 | 48,117 | ||||||
|
Accrued compensation and benefits |
23,741 | 29,402 | ||||||
|
Accrued warranty |
5,893 | 7,769 | ||||||
|
Deferred profit |
7,645 | 6,896 | ||||||
|
Income taxes payable |
3,894 | 11,055 | ||||||
|
Other accrued liabilities |
51,899 | 50,045 | ||||||
|
Current liabilities of discontinued operations (Note 13) |
599 | 518 | ||||||
|
Total current liabilities |
148,885 | 160,589 | ||||||
|
Long-term debt |
346,518 | 346,041 | ||||||
|
Deferred income taxes |
31,310 | 38,942 | ||||||
|
Long-term lease liabilities |
28,877 | - | ||||||
|
Accrued retirement benefits |
21,930 | 19,740 | ||||||
|
Noncurrent deferred gain on sale of facility |
- | 8,776 | ||||||
|
Noncurrent income tax liabilities |
8,438 | 9,711 | ||||||
|
Other accrued liabilities |
8,656 | 4,259 | ||||||
|
Noncurrent liabilities of discontinued operations (Note 13) |
24 | - | ||||||
|
Stockholders' equity: |
||||||||
|
Preferred stock, $1 par value; 1,000 shares authorized, none issued |
- | - | ||||||
|
Common stock, $1 par value; 60,000 shares authorized, 41,395 shares issued and outstanding in 2019 and 40,763 shares in 2018 |
41,395 | 40,763 | ||||||
|
Paid-in capital |
433,190 | 419,690 | ||||||
|
Retained earnings |
42,517 | 111,670 | ||||||
|
Accumulated other comprehensive loss |
(34,030 | ) | (25,880 | ) | ||||
|
Total Cohu stockholders' equity |
483,072 | 546,243 | ||||||
|
Noncontrolling interest |
- | (299 | ) | |||||
|
Total equity |
483,072 | 545,944 | ||||||
| $ | 1,077,710 | $ | 1,134,002 | |||||
The accompanying notes are an integral part of these statements.
| COHU, INC. |
|
CONSOLIDATED STATEMENTS OF OPERATIONS |
|
(in thousands, except per share amounts) |
|
Years ended |
||||||||||||
|
December 28, |
December 29, |
December 30, |
||||||||||
|
2019 |
2018 |
2017 |
||||||||||
|
Net sales |
$ | 583,329 | $ | 451,768 | $ | 352,704 | ||||||
|
Cost and expenses: |
||||||||||||
|
Cost of sales (1) |
353,500 | 292,460 | 209,297 | |||||||||
|
Research and development |
86,147 | 56,434 | 40,737 | |||||||||
|
Selling, general and administrative |
142,936 | 96,754 | 60,737 | |||||||||
|
Amortization of purchased intangible assets |
39,590 | 17,197 | 4,208 | |||||||||
|
Restructuring charges (Note 5) |
13,484 | 18,704 | - | |||||||||
| 635,657 | 481,549 | 314,979 | ||||||||||
|
Income (loss) from operations |
(52,328 | ) | (29,781 | ) | 37,725 | |||||||
|
Other (expense) income: |
||||||||||||
|
Interest expense |
(20,556 | ) | (4,977 | ) | (54 | ) | ||||||
|
Interest income |
764 | 1,187 | 671 | |||||||||
|
Foreign transaction gain (loss) and other |
43 | 1,659 | (2,977 | ) | ||||||||
|
Income (loss) from continuing operations before taxes |
(72,077 | ) | (31,912 | ) | 35,365 | |||||||
|
Income tax provision (benefit) |
(3,082 | ) | 631 | 2,244 | ||||||||
|
Income (loss) from continuing operations |
(68,995 | ) | (32,543 | ) | 33,121 | |||||||
|
Income (loss) from discontinued operations, net of tax |
(697 | ) | 119 | (278 | ) | |||||||
|
Net income (loss) |
$ | (69,692 | ) | $ | (32,424 | ) | $ | 32,843 | ||||
|
Net income (loss) attributable to noncontrolling interest |
$ | 8 | $ | (243 | ) | $ | - | |||||
|
Net income (loss) attributable to Cohu |
$ | (69,700 | ) | $ | (32,181 | ) | $ | 32,843 | ||||
|
Income (loss) per share: |
||||||||||||
|
Basic: |
||||||||||||
|
Income (loss) from continuing operations before non-controlling interest |
$ | (1.68 | ) | $ | (1.02 | ) | $ | 1.19 | ||||
|
Income (loss) from discontinued operations |
(0.01 | ) | 0.00 | (0.01 | ) | |||||||
|
Net income (loss) attributable to noncontrolling interest |
0.00 | (0.01 | ) | - | ||||||||
|
Net income (loss) attributable to Cohu |
$ | (1.69 | ) | $ | (1.01 | ) | $ | 1.18 | ||||
|
Diluted: |
||||||||||||
|
Income (loss) from continuing operations before non-controlling interest |
$ | (1.68 | ) | $ | (1.02 | ) | $ | 1.15 | ||||
|
Income (loss) from discontinued operations |
(0.01 | ) | 0.00 | (0.01 | ) | |||||||
|
Net income (loss) attributable to noncontrolling interest |
0.00 | (0.01 | ) | - | ||||||||
|
Net income (loss) attributable to Cohu |
$ | (1.69 | ) | $ | (1.01 | ) | $ | 1.14 | ||||
|
Weighted average shares used in computing income (loss) per share: |
||||||||||||
|
Basic |
41,159 | 31,776 | 27,836 | |||||||||
|
Diluted |
41,159 | 31,776 | 28,916 | |||||||||
|
(1) |
Excludes amortization of $30,126, $13,586, and $2,689 for the years ended December 28, 2019, December 29, 2018, and December 30, 2017, respectively. |
The accompanying notes are an integral part of these statements.
| COHU, INC. |
|
CONSOLIDATED STATEMENTS OF COMPREHENSIVE INCOME (LOSS) |
|
(in thousands) |
|
Years ended |
||||||||||||
|
December 28, |
December 29, |
December 30, |
||||||||||
|
2019 |
2018 |
2017 |
||||||||||
|
Net income (loss) |
$ | (69,692 | ) | $ | (32,424 | ) | $ | 32,843 | ||||
|
Net income (loss) attributable to noncontrolling interest |
8 | (243 | ) | - | ||||||||
|
Net income (loss) attributable to Cohu |
(69,700 | ) | (32,181 | ) | 32,843 | |||||||
|
Other comprehensive income (loss), net of tax |
||||||||||||
|
Foreign currency translation adjustments |
(7,522 | ) | (8,905 | ) | 11,345 | |||||||
|
Adjustments related to postretirement benefits |
(628 | ) | 805 | (1,248 | ) | |||||||
|
Change in unrealized gain/loss on investments |
- | 7 | (2 | ) | ||||||||
|
Other comprehensive income (loss), net of tax |
(8,150 | ) | (8,093 | ) | 10,095 | |||||||
|
Other comprehensive income (loss) attributable to noncontrolling interest |
(4 | ) | (5 | ) | - | |||||||
|
Other comprehensive income (loss) attributable to Cohu |
(8,146 | ) | (8,088 | ) | 10,095 | |||||||
|
Comprehensive income (loss) |
(77,842 | ) | (40,517 | ) | 42,938 | |||||||
|
Comprehensive income (loss) attributable to noncontrolling interest |
4 | (248 | ) | - | ||||||||
|
Comprehensive income (loss) attributable to Cohu |
$ | (77,846 | ) | $ | (40,269 | ) | $ | 42,938 | ||||
The accompanying notes are an integral part of these statements.
| COHU, INC. |
|
CONSOLIDATED STATEMENTS OF STOCKHOLDERS’ EQUITY |
|
(in thousands, except par value and per share amounts) |
|
Accumulated |
||||||||||||||||||||||||
|
Common |
other |
|||||||||||||||||||||||
|
stock |
Paid-in |
Retained |
comprehensive |
Noncontrolling |
||||||||||||||||||||
|
$1 par value |
capital |
earnings |
loss |
Interest |
Total |
|||||||||||||||||||
|
Balance at December 31, 2016 |
$ | 26,842 | $ | 111,950 | $ | 124,559 | $ | (27,882 | ) | $ | - | $ | 235,469 | |||||||||||
|
Net income |
- | - | 32,843 | - | - | 32,843 | ||||||||||||||||||
|
Changes in cumulative translation adjustment |
- | - | - | 11,345 | - | 11,345 | ||||||||||||||||||
|
Adjustments related to postretirement benefits, net of tax |
- | - | - | (1,248 | ) | - | (1,248 | ) | ||||||||||||||||
|
Changes in unrealized gains and losses on investments, net of tax |
- | - | - | (2 | ) | - | (2 | ) | ||||||||||||||||
|
Cash dividends - $0.24 per share |
- | - | (6,676 | ) | - | - | (6,676 | ) | ||||||||||||||||
|
Exercise of stock options |
1,164 | 11,617 | - | - | - | 12,781 | ||||||||||||||||||
|
Shares issued under ESPP |
99 | 1,140 | - | - | - | 1,239 | ||||||||||||||||||
|
Shares issued for restricted stock units vested |
595 | (595 | ) | - | - | - | - | |||||||||||||||||
|
Repurchase and retirement of stock |
(211 | ) | (3,456 | ) | - | - | - | (3,667 | ) | |||||||||||||||
|
Share-based compensation expense |
- | 7,007 | - | - | - | 7,007 | ||||||||||||||||||
|
Balance at December 30, 2017 |
28,489 | 127,663 | 150,726 | (17,787 | ) | - | 289,091 | |||||||||||||||||
|
Balance at December 30, 2017 |
||||||||||||||||||||||||
|
Cumulative effect of accounting change (a) |
- | - | 1,057 | - | - | 1,057 | ||||||||||||||||||
|
Net loss |
- | - | (32,424 | ) | - | - | (32,424 | ) | ||||||||||||||||
|
Changes in cumulative translation adjustment |
- | - | - | (8,905 | ) | - | (8,905 | ) | ||||||||||||||||
|
Adjustments related to postretirement benefits, net of tax |
- | - | - | 805 | - | 805 | ||||||||||||||||||
|
Changes in unrealized gains and losses on investments, net of tax |
- | - | - | 7 | - | 7 | ||||||||||||||||||
|
Cash dividends - $0.24 per share |
- | - | (7,689 | ) | - | - | (7,689 | ) | ||||||||||||||||
|
Exercise of stock options |
67 | 613 | - | - | - | 680 | ||||||||||||||||||
|
Shares issued under ESPP |
85 | 1,438 | - | - | - | 1,523 | ||||||||||||||||||
|
Shares issued for restricted stock units vested |
541 | (541 | ) | - | - | - | - | |||||||||||||||||
|
Repurchase and retirement of stock |
(195 | ) | (11,405 | ) | - | - | - | (11,600 | ) | |||||||||||||||
|
Noncontrolling interest |
- | - | - | - | (299 | ) | (299 | ) | ||||||||||||||||
|
Share-based compensation expense |
- | 18,280 | - | - | - | 18,280 | ||||||||||||||||||
|
Shares issued for acquisition of Xcerra |
11,776 | 283,642 | - | - | - | 295,418 | ||||||||||||||||||
|
Balance at December 29, 2018 |
40,763 | 419,690 | 111,670 | (25,880 | ) | (299 | ) | 545,944 | ||||||||||||||||
|
Cumulative effect of accounting change (b) |
- | - | 10,352 | - | - | 10,352 | ||||||||||||||||||
|
Net loss |
- | - | (69,692 | ) | - | - | (69,692 | ) | ||||||||||||||||
|
Changes in cumulative translation adjustment |
- | - | - | (7,522 | ) | (4 | ) | (7,526 | ) | |||||||||||||||
|
Adjustments related to postretirement benefits, net of tax |
- | - | - | (628 | ) | - | (628 | ) | ||||||||||||||||
|
Cash dividends - $0.24 per share |
- | - | (9,866 | ) | - | - | (9,866 | ) | ||||||||||||||||
|
Exercise of stock options |
42 | 367 | - | - | - | 409 | ||||||||||||||||||
|
Shares issued under ESPP |
187 | 2,159 | - | - | - | 2,346 | ||||||||||||||||||
|
Shares issued for restricted stock units vested |
599 | (599 | ) | - | - | - | - | |||||||||||||||||
|
Repurchase and retirement of stock |
(196 | ) | (2,575 | ) | - | - | - | (2,771 | ) | |||||||||||||||
|
Noncontrolling interest |
- | - | 53 | - | (53 | ) | - | |||||||||||||||||
|
Share-based compensation expense |
- | 14,148 | - | - | - | 14,148 | ||||||||||||||||||
|
Divestiture of interest in consolidated entity |
- | - | - | - | 356 | 356 | ||||||||||||||||||
|
Balance at December 28, 2019 |
$ | 41,395 | $ | 433,190 | $ | 42,517 | $ | (34,030 | ) | $ | - | $ | 483,072 | |||||||||||
|
(a) |
Cumulative effect of accounting change relates to our adoption of ASU 2014-09. |
|
(b) |
Cumulative effect of accounting change relates to our adoption of ASU 2016-02. Please refer to Note 1 of the Consolidated Financial Statements for further detail on the adoption of this accounting standard. |
The accompanying notes are an integral part of these statements.
| COHU, INC. |
|
CONSOLIDATED STATEMENTS OF CASH FLOWS |
|
(in thousands) |
|
Years ended |
||||||||||||
|
December 28, |
December 29, |
December 30, |
||||||||||
|
2019 |
2018 |
2017 |
||||||||||
|
Cash flows from operating activities: |
||||||||||||
|
Net income (loss) attributable to Cohu |
$ | (69,700 | ) | $ | (32,181 | ) | $ | 32,843 | ||||
|
Net income (loss) from noncontrolling interest |
8 | (243 | ) | - | ||||||||
|
Adjustments to reconcile net income (loss) to net cash provided by operating activities: |
||||||||||||
|
Loss on impairment and disposal of segments held for sale (Note 13) |
1,138 | - | 278 | |||||||||
|
Interest capitalized associated with cloud computing implementation |
(168 | ) | - | - | ||||||||
|
Gain on divestiture of consolidated entity |
(149 | ) | - | - | ||||||||
|
Depreciation and amortization |
58,871 | 26,047 | 9,195 | |||||||||
|
Share-based compensation expense including restructuring charges |
14,148 | 18,279 | 7,007 | |||||||||
|
Amortization of inventory step-up and inventory related charges |
8,347 | 24,179 | 1,404 | |||||||||
|
Amortization of debt discounts and issuance costs |
1,110 | - | - | |||||||||
|
Accrued retiree benefits |
1,017 | (560 | ) | 322 | ||||||||
|
Deferred income taxes |
(5,385 | ) | (8,207 | ) | (3,791 | ) | ||||||
|
Adjustment to contingent consideration liability |
- | 657 | 1,423 | |||||||||
|
Changes in other assets |
(3,044 | ) | (2,961 | ) | 1,501 | |||||||
|
(Gain) loss on disposal of fixed assets |
173 | 293 | (42 | ) | ||||||||
|
Changes in other accrued liabilities |
5,348 | 198 | 979 | |||||||||
|
Changes in current assets and liabilities, excluding effects from acquisitions and divestitures: |
||||||||||||
|
Accounts receivable |
21,150 | 5,785 | (3,259 | ) | ||||||||
|
Inventories |
26 | 2,043 | (12,196 | ) | ||||||||
|
Accrued compensation, warranty and other liabilities |
2,143 | 3,985 | 937 | |||||||||
|
Accounts payable |
(3,122 | ) | (7,103 | ) | 4,157 | |||||||
|
Deferred profit |
997 | 37 | (442 | ) | ||||||||
|
Other current assets |
(5,996 | ) | 148 | 952 | ||||||||
|
Income taxes payable |
(10,719 | ) | 4,041 | (1,518 | ) | |||||||
|
Operating lease right-of-use assets |
7,159 | - | - | |||||||||
|
Current and long-term operating lease liabilities |
(6,083 | ) | - | - | ||||||||
|
Net cash provided by operating activities |
17,269 | 34,437 | 39,750 | |||||||||
|
Cash flows from investing activities, excluding effects from acquisitions and divestitures: |
||||||||||||
|
Purchases of property, plant and equipment |
(18,000 | ) | (4,967 | ) | (6,093 | ) | ||||||
|
Net cash received from sale of land, facility and assets |
1,767 | 1,005 | 104 | |||||||||
|
Purchases of short-term investments |
(315 | ) | (38,700 | ) | (37,010 | ) | ||||||
|
Payment for purchase of Xcerra, net of cash received |
- | (339,115 | ) | - | ||||||||
|
Sales and maturities of short-term investments |
- | 59,469 | 47,671 | |||||||||
|
Payment for purchase of Kita, net of cash received |
- | - | (11,716 | ) | ||||||||
|
Net cash used in investing activities |
(16,548 | ) | (322,308 | ) | (7,044 | ) | ||||||
|
Cash flows from financing activities: |
||||||||||||
|
Cash dividends paid |
(9,827 | ) | (6,949 | ) | (6,577 | ) | ||||||
|
Proceeds from construction loan |
5,477 | - | - | |||||||||
|
Repayments of long-term debt |
(3,817 | ) | (2,323 | ) | (1,631 | ) | ||||||
|
Issuance (repurchases) of common stock, net including awards settled in cash |
(16 | ) | (8,978 | ) | 10,353 | |||||||
|
Proceeds from Term B Loan |
- | 348,250 | - | |||||||||
|
Payment of debt issuance costs |
- | (7,072 | ) | - | ||||||||
|
Payment of contingent consideration |
- | (823 | ) | - | ||||||||
|
Net cash provided by (used in) financing activities |
(8,183 | ) | 322,105 | 2,145 | ||||||||
|
Effect of exchange rate changes on cash and cash equivalents |
(1,529 | ) | (3,599 | ) | 3,390 | |||||||
|
Net increase (decrease) in cash and cash equivalents |
(8,991 | ) | 30,635 | 38,241 | ||||||||
|
Cash and cash equivalents at beginning of year |
164,921 | 134,286 | 96,045 | |||||||||
|
Cash and cash equivalents at end of year |
155,930 | 164,921 | 134,286 | |||||||||
|
Cash held by discontinued operations (Note 13) |
(736 | ) | (461 | ) | - | |||||||
|
Cash and cash equivalents at end of year from continuing operations |
$ | 155,194 | $ | 164,460 | $ | 134,286 | ||||||
|
Supplemental disclosure of cash flow information: |
||||||||||||
|
Cash paid during the year for income taxes |
$ | 14,942 | $ | 6,243 | $ | 7,094 | ||||||
|
Cash paid for interest |
$ | 14,846 | $ | 4,977 | $ | - | ||||||
|
Dividends declared but not yet paid |
$ | 2,484 | $ | 2,445 | $ | 1,705 | ||||||
|
Property, plant and equipment purchases included in accounts payable |
$ | 1,601 | $ | 599 | $ | 260 | ||||||
|
Inventory capitalized as capital assets |
$ | 300 | $ | 857 | $ | 190 | ||||||
The accompanying notes are an integral part of these statements
|
COHU, INC. NOTES TO CONSOLIDATED FINANCIAL STATEMENTS |
1. Summary of Significant Accounting Policies
Basis of Presentation – Cohu, Inc. (“Cohu”, “we”, “our”, “us” and the “Company”), through our wholly owned subsidiaries, is a provider of semiconductor test equipment and services. Our Consolidated Financial Statements include the accounts of Cohu and our wholly owned subsidiaries and variable interest entities (“VIEs”) for which we are the primary beneficiary. All intercompany balances and transactions have been eliminated in consolidation. We evaluate the need to consolidate affiliates based on standards set forth in ASC Topic 810, Consolidation (“ASC 810”).
On December 28, 2019, we divested our entire 20% interest in ALBS Solutions Sdn Bhd (“ALBS”), our only consolidated VIE. As a result of the divestment, we determined that we no longer had a controlling interest in ALBS and we no longer consolidate ALBS as of that date. Divestment of our ownership interest resulted in a gain of $0.1 million which is included in restructuring charges for the year ended December 28, 2019.
All significant consolidated transactions and balances have been eliminated in consolidation.
The preparation of financial statements in conformity with accounting principles generally accepted in the United States of America (“GAAP”) requires management to make estimates and assumptions that affect the amounts reported in the financial statements and accompanying notes. Actual results could differ from these estimates.
Our fiscal years are based on a 52- or 53-week period ending on the last Saturday in December. Our current fiscal year, which ended on December 28, 2019, consisted of 52 weeks. Our fiscal years ended on December 29, 2018, and December 30, 2017, each consisted of 52 weeks.
Principles of Consolidation for Variable Interest Entities – Prior to the divestment of our ownership interest in ALBS we followed ASC Topic 810-10-15 guidance with respect to accounting for VIEs and as of December 28, 2019, we consolidated one VIE, ALBS.
Discontinued Operations – Management determined that the fixtures services business, that was acquired as part of Xcerra, did not align with Cohu’s long-term strategic plan and divested this portion of the business in February 2020. As a result, the assets of our fixtures business are considered “held for sale” and the operations of our fixtures business are considered “discontinued operations” as of December 28, 2019. See Note 13, “Discontinued Operations” for additional information. Unless otherwise indicated, all amounts herein relate to continuing operations.
Income (Loss) Per Share – Basic income (loss) per common share is computed by dividing net income (loss) by the weighted-average number of common shares outstanding during the reporting period. Diluted income (loss) per share includes the dilutive effect of common shares potentially issuable upon the exercise of stock options, vesting of outstanding restricted stock and performance stock units and issuance of stock under our employee stock purchase plan using the treasury stock method. In loss periods, potentially dilutive securities are excluded from the per share computations due to their anti-dilutive effect. For purposes of computing diluted income (loss) per share, stock options with exercise prices that exceed the average fair market value of our common stock for the period are excluded. For the years ended December 28, 2019, December 29, 2018 and December 30, 2017, approximately 422,000, 146,000 and 77,000 shares, respectively, of our common stock were excluded from the computation.
The following table reconciles the denominators used in computing basic and diluted income (loss) per share:
|
(in thousands) |
2019 |
2018 |
2017 |
|||||||||
|
Weighted average common shares outstanding |
41,159 | 31,776 | 27,836 | |||||||||
|
Effect of dilutive stock options and restricted stock units |
- | - | 1,080 | |||||||||
| 41,159 | 31,776 | 28,916 | ||||||||||
Cohu has utilized the “control number” concept in the computation of diluted earnings per share to determine whether potential common stock instruments are dilutive. The control number used is income from continuing operations. The control number concept requires that the same number of potentially dilutive securities applied in computing diluted earnings per share from continuing operations be applied to all other categories of income or loss, regardless of their anti-dilutive effect on such categories.
|
COHU, INC. NOTES TO CONSOLIDATED FINANCIAL STATEMENTS |
Cash, Cash Equivalents and Short-term Investments – Highly liquid investments with insignificant interest rate risk and original maturities of three months or less are classified as cash and cash equivalents. Investments with maturities greater than three months are classified as short-term investments. All of our short-term investments are classified as available-for-sale and are reported at fair value, with any unrealized gains and losses, net of tax, recorded in the statement of comprehensive income (loss). We manage our cash equivalents and short-term investments as a single portfolio of highly marketable securities. We have the ability and intent, if necessary, to liquidate any of our investments in order to meet the liquidity needs of our current operations during the next 12 months. Accordingly, investments with contractual maturities greater than one year have been classified as current assets in the accompanying consolidated balance sheets.
Fair Value of Financial Instruments – The carrying amounts of our financial instruments, including cash and cash equivalents, accounts receivable, accounts payable and accrued expenses, approximate fair value due to the short maturities of these financial instruments.
Concentration of Credit Risk – Financial instruments that potentially subject us to significant credit risk consist principally of cash equivalents, short-term investments and trade accounts receivable. We invest in a variety of financial instruments and, by policy, limit the amount of credit exposure with any one issuer.
Trade accounts receivable are presented net of allowance for doubtful accounts, which were insignificant at December 28, 2019 and December 29, 2018. Our customers primarily include semiconductor manufacturers and semiconductor test subcontractors located throughout many areas of the world. While we believe that our allowance for doubtful accounts is adequate and represents our best estimate of potential loss exposure at December 28, 2019, we will continue to monitor customer liquidity and other economic conditions, which may result in changes to our estimates regarding collectability.
Inventories – Inventories are stated at the lower of cost, determined on a first-in, first-out basis, or net realizable value. Cost includes labor, material and overhead costs. Determining market value of inventories involves numerous estimates and judgments including projecting average selling prices and sales volumes for future periods and costs to complete and dispose of inventory. As a result of these analyses, we record a charge to cost of sales in advance of the period when the inventory is sold when estimated market values are below our costs. Charges to cost of sales for excess and obsolete inventories totaled $4.8 million in 2019. Included in this amount is $0.7 million of inventory charges related to the decision to end manufacturing of certain of Xcerra’s semiconductor test handler products. Charges to cost of sales for excess and obsolete inventories totaled $10.8 million in 2018. Included in this amount is $9.4 million of inventory charges related to the decision to end manufacturing of certain of Xcerra’s semiconductor test handler products. In 2017 we recorded charges of $1.1 million.
Inventories by category were as follows (in thousands):
|
December 28, |
December 29, |
|||||||
|
2019 |
2018 |
|||||||
|
Raw materials and purchased parts |
$ | 69,665 | $ | 60,112 | ||||
|
Work in process |
46,591 | 57,953 | ||||||
|
Finished goods |
14,450 | 21,249 | ||||||
|
Total inventories |
$ | 130,706 | $ | 139,314 | ||||
Assets Held for Sale –We expect to complete the sale of our facility located in Penang, Malaysia in the first half of 2020 and, as a result, it is being presented as held for sale at December 28, 2019.
Property, Plant and Equipment – Depreciation and amortization of property, plant and equipment, both owned and under financing lease, is calculated principally on the straight-line method based on estimated useful lives of thirty to forty years for buildings, five to fifteen years for building improvements, three to ten years for machinery, equipment and software and the lease life for financing leases. Land is not depreciated.
|
COHU, INC. NOTES TO CONSOLIDATED FINANCIAL STATEMENTS |
Property, plant and equipment, at cost, consisted of the following (in thousands):
|
December 28, |
December 29, |
|||||||
|
2019 |
2018 |
|||||||
|
Land and land improvements (1) |
$ | 11,659 | $ | 11,905 | ||||
|
Buildings and building improvements (1) |
41,474 | 37,265 | ||||||
|
Machinery and equipment |
61,006 | 64,791 | ||||||
| 114,139 | 113,961 | |||||||
|
Less accumulated depreciation and amortization |
(43,227 | ) | (39,629 | ) | ||||
|
Property, plant and equipment, net |
$ | 70,912 | $ | 74,332 | ||||
|
(1) |
Includes assets under financing leases acquired with Xcerra totaling $2.6 million and $2.7 million as of December 28, 2019 and December 29, 2018, respectively. |
On December 9, 2019, we committed to exercise our bargain purchase option to acquire our leased facility located in Rosenheim, Germany, currently subject to a financing lease, for €1.1 million no later than June 30, 2020.
Depreciation expense was $19.3 million in 2019, $8.8 million in 2018 and $5.0 million in 2017. The increase in depreciation expense in 2019 was driven by depreciation recorded on assets acquired from Xcerra.
Cloud Computing Implementation Costs – We have capitalized certain costs associated with the implementation of our new cloud-based Enterprise Resource Planning (“ERP”) system in accordance with ASU 2018-15, Intangibles—Goodwill and Other—Internal-Use Software (Subtopic 350-40) Customer’s Accounting for Implementation Costs Incurred in a Cloud Computing Arrangement That Is a Service Contract. Capitalized costs include only external direct costs of materials and services consumed in developing of the system and interest costs incurred, when material, while developing the system.
Total unamortized capitalized cloud computing implementation costs totaled $10.3 million at December 28, 2019 and were insignificant at December 29, 2018.
We expect to begin amortizing these costs when the ERP system is placed into service in 2020, and will amortize the implementation costs using the straight-line method over seven years. Capitalized amounts are recorded within other assets in our consolidated balance sheets.
Segment Information – We applied the provisions of ASC Topic 280, Segment Reporting, (“ASC 280”), which sets forth a management approach to segment reporting and establishes requirements to report selected segment information quarterly and to report annually entity-wide disclosures about products, major customers and the geographies in which the entity holds material assets and reports revenue. An operating segment is defined as a component that engages in business activities whose operating results are reviewed by the chief operating decision maker and for which discrete financial information is available. Subsequent to the acquisition of Xcerra on October 1, 2018, we have determined that our four identified operating segments are: Test Handler Group (“THG”), Semiconductor Tester Group (“STG”), Interface Solutions Group (“ISG”) and PCB Test Group (“PTG”). Our THG, STG and ISG operating segments qualify for aggregation under ASC 280 due to similarities in their customers, their economic characteristics, and the nature of products and services provided. As a result, we report in two segments, Semiconductor Test and Inspection Equipment (“Semiconductor Test & Inspection”) and PCB Test Equipment (“PCB Test”).
Goodwill, Purchased Intangible Assets and Other Long-lived Assets – We evaluate goodwill for impairment annually and when an event occurs or circumstances change that indicate that the carrying value may not be recoverable. We test goodwill for impairment by comparing the book value of net assets to the fair value of the reporting units. If the fair value is determined to be less than the book value, an impairment charge is recognized as the amount by which the carrying amount of goodwill exceeds the reporting unit's fair value, not to exceed the carrying amount of goodwill. We estimated the fair values of our reporting units primarily using the income approach valuation methodology that includes the discounted cash flow method, taking into consideration the market approach and certain market multiples as a validation of the values derived using the discounted cash flow methodology. Forecasts of future cash flows are based on our best estimate of future net sales and operating expenses, based primarily on customer forecasts, industry trade organization data and general economic conditions.
We conduct our annual impairment test as of October 1st of each year, and have determined there was no impairment as of October 1, 2019, as we determined that the estimated fair values of our reporting units exceeded their carrying values on that date. Other events and changes in circumstances may also require goodwill to be tested for impairment between annual measurement dates. As of December 28, 2019, we do not believe that circumstances have occurred that indicate impairment of our goodwill is more-likely-than-not. In the event we determine that an interim goodwill impairment review is required, in a future period, the review may result in an impairment charge, which would have a negative impact on our results of operations.
Long-lived assets, other than goodwill, are reviewed for impairment whenever events or changes in circumstances indicate that the carrying amount of the assets might not be recoverable. Conditions that would necessitate an impairment assessment include a significant decline in the observable market value of an asset, a significant change in the extent or manner in which an asset is used, or any other significant adverse change that would indicate that the carrying amount of an asset or group of assets may not be recoverable. For long-lived assets, impairment losses are only recorded if the asset’s carrying amount is not recoverable through its undiscounted, probability-weighted future cash flows. We measure the impairment loss based on the difference between the carrying amount and estimated fair value.
|
COHU, INC. NOTES TO CONSOLIDATED FINANCIAL STATEMENTS |
Product Warranty – Product warranty costs are accrued in the period sales are recognized. Our products are generally sold with standard warranty periods, which differ by product, ranging from 12 to 36 months. Parts and labor are typically covered under the terms of the warranty agreement. Our warranty expense accruals are based on historical and estimated costs by product and configuration. From time-to-time we offer customers extended warranties beyond the standard warranty period. In those situations, the revenue relating to the extended warranty is deferred at its estimated fair value and recognized on a straight-line basis over the contract period. Costs associated with our extended warranty contracts are expensed as incurred.
Income Taxes – We assess our income tax positions and record tax benefits for all years subject to examination based upon management’s evaluation of the facts, circumstances and information available at the reporting dates. For those tax positions where it is more-likely-than-not that a tax benefit will be sustained, we have recorded the largest amount of tax benefit with a greater than 50 percent likelihood of being realized upon ultimate settlement with a taxing authority that has full knowledge of all relevant information. For those income tax positions where it is not more-likely-than-not that a tax benefit will be sustained, no tax benefit has been recognized in the financial statements. Where applicable, associated interest and penalties have also been recognized and recorded, net of federal and state tax benefits, in income tax expense.
The U.S. Tax Cuts and Jobs Act (“Tax Act”) was enacted on December 22, 2017. The accounting for the tax effects of the enactment of the Tax Act was completed in 2018.
Contingencies and Litigation – We assess the probability of adverse judgments in connection with current and threatened litigation. We would accrue the cost of an adverse judgment if, in our estimation, the adverse outcome is probable, and we can reasonably estimate the ultimate cost.
Adoption of New Revenue Accounting Standard – We adopted ASC Topic 606, Revenue from Contracts with Customers (“ASC 606”), on December 31, 2017, the first day of our 2018 fiscal year. We elected to implement the new standard using the modified retrospective method of adoption which only applies to those contracts which were not completed as of December 31, 2017. Revenue for the years ended December 28, 2019 and December 29, 2018, have been accounted for using ASC 606 and the prior year ended December 30, 2017, has not been adjusted. Upon adoption of ASC 606, we recorded a cumulative-effect adjustment to retained earnings of $1.1 million on December 31, 2017, which represents the impact of ASC 606 on our deferred revenue.
The adoption of ASC 606 had no impact to cash used in net operating, investing or financing activities in our consolidated statements of cash flows.
Under ASC 606 our revenue will continue to be recognized at a point in time when the performance obligation has been satisfied and transfer of control has occurred, typically, this occurs upon shipment of products to our customers. In certain instances, when customer payment terms provide that a minority portion of the equipment purchase price be paid only upon customer acceptance, recognition of revenue may occur sooner under ASC 606.
Revenue Recognition – Our net sales are derived from the sale of products and services and are adjusted for estimated returns and allowances, which historically have been insignificant. We recognize revenue when the obligations under the terms of a contract with our customers are satisfied; generally, this occurs with the transfer of control of our systems, non-system products or services. In circumstances where control is not transferred until destination or acceptance, we defer revenue recognition until such events occur.
Revenue for established products that have previously satisfied a customer’s acceptance requirements is generally recognized upon shipment. In cases where a prior history of customer acceptance cannot be demonstrated or from sales where customer payment dates are not determinable and in the case of new products, revenue and cost of sales are deferred until customer acceptance has been received. Our post-shipment obligations typically include installation and standard warranties. The estimated fair value of installation related revenue is recognized in the period the installation is performed. Service revenue is recognized over time as we transfer control to our customer for the related contract or upon completion of the services if they are short-term in nature. Spares, contactor and kit revenue is generally recognized upon shipment.
|
COHU, INC. NOTES TO CONSOLIDATED FINANCIAL STATEMENTS |
Certain of our equipment sales have multiple performance obligations. These arrangements involve the delivery or performance of multiple performance obligations, and transfer of control of performance obligations may occur at different points in time or over different periods of time. For arrangements containing multiple performance obligations, the revenue relating to the undelivered performance obligation is deferred using the relative standalone selling price method utilizing estimated sales prices until satisfaction of the deferred performance obligation.
Unsatisfied performance obligations primarily represent contracts for products with future delivery dates. At December 28, 2019 and December 29, 2018, we had $10.0 million and $19.1 million of revenue expected to be recognized in the future related to performance obligations that are unsatisfied (or partially unsatisfied), respectively.
We generally sell our equipment with a product warranty. The product warranty provides assurance to customers that delivered products are as specified in the contract (an “assurance-type warranty”). Therefore, we account for such product warranties under ASC 460, Guarantees (“ASC 460”), and not as a separate performance obligation.
The transaction price reflects our expectations about the consideration we will be entitled to receive from the customer and may include fixed or variable amounts. Fixed consideration primarily includes sales to customers that are known as of the end of the reporting period. Variable consideration includes sales in which the amount of consideration that we will receive is unknown as of the end of a reporting period. Variable consideration arrangements are rare; however, when they occur, we estimate variable consideration as the expected value to which we expect to be entitled. Included in the transaction price estimate are amounts in which it is probable that a significant reversal of cumulative revenue recognized will not occur when the uncertainty associated with the variable consideration is subsequently resolved. Variable consideration that does not meet revenue recognition criteria is deferred.
Our contracts are typically less than one year in duration and we have elected to use the practical expedient available in ASC 606 to expense cost to obtain contracts as they are incurred because they would be amortized over less than one year.
Accounts receivable represents our unconditional right to receive consideration from our customers. Payments terms do not exceed one year from the invoice date and therefore do not include a significant financing component. To date, there have been no material impairment losses on accounts receivable. There were no material contract assets or contract liabilities recorded on the consolidated balance sheet in any of the periods presented.
On shipments where sales are not recognized, gross profit is generally recorded as deferred profit in our consolidated balance sheet representing the difference between the receivable recorded and the inventory shipped. In certain instances where customer payments are received prior to product shipment, the customer’s payments are recorded as customer advances. At December 28, 2019, we had deferred revenue totaling approximately $16.1 million, current deferred profit of $7.6 million and deferred profit expected to be recognized after one year included in noncurrent other accrued liabilities of $7.2 million. At December 29, 2018, we had deferred revenue totaling approximately $10.8 million, current deferred profit of $6.9 million and deferred profit expected to be recognized after one year included in noncurrent other accrued liabilities of $2.0 million. Our balances at December 29, 2018, include a $1.1 million beginning retained earnings adjustment as a result of our adoption of ASC 606 on the first day of fiscal 2018. The periodic change is primarily a result of increases and decreases in deferrals of revenue associated with product shipments made to our customers in accordance with our revenue recognition policy.
|
COHU, INC. NOTES TO CONSOLIDATED FINANCIAL STATEMENTS |
Net sales by type and segment are as follows (in thousands):
|
Twelve Months Ended |
||||||||||||
|
Disaggregated Net Sales |
December 28, 2019 |
December 29, 2018 |
December 30, 2017 |
|||||||||
|
Systems-Semiconductor Test & Inspection |
$ | 299,473 | $ | 249,514 | $ | 197,454 | ||||||
|
Non-systems-Semiconductor Test & Inspection |
241,405 | 193,737 | 155,250 | |||||||||
|
Systems-PCB Test |
25,928 | 6,565 | - | |||||||||
|
Non-systems-PCB Test |
16,523 | 1,952 | - | |||||||||
|
Net sales |
$ | 583,329 | $ | 451,768 | $ | 352,704 | ||||||
Advertising Costs – Advertising costs are expensed as incurred and were not material for all periods presented.
Restructuring Costs – We record restructuring activities including costs for one-time termination benefits in accordance with ASC Topic 420 (“ASC 420”), Exit or Disposal Cost Obligations. The timing of recognition for severance costs accounted for under ASC 420 depends on whether employees are required to render service until they are terminated in order to receive the termination benefits. If employees are required to render service until they are terminated in order to receive the termination benefits, a liability is recognized ratably over the future service period. Otherwise, a liability is recognized when management has committed to a restructuring plan and has communicated those actions to employees. Employee termination benefits covered by existing benefit arrangements are recorded in accordance with ASC Topic 712, Nonretirement Postemployment Benefits. These costs are recognized when management has committed to a restructuring plan and the severance costs are probable and estimable.
Debt Issuance Costs – We capitalize costs related to the issuance of debt. Debt issuance costs directly related to our Term B Loan are presented within noncurrent liabilities as a reduction of long-term debt in our consolidated balance sheets. The amortization of such costs is recognized as interest expense using the effective interest method over the term of the respective debt issue. Amortization related to deferred debt issuance costs and original discount costs was $1.1 million and insignificant for the years ended December 28, 2019 and December 29, 2018, respectively.
Share-based Compensation – We measure and recognize all share-based compensation under the fair value method. Our estimate of share-based compensation expense requires a number of complex and subjective assumptions including our stock price volatility, employee exercise patterns (expected life of the options) and related tax effects. The assumptions used in calculating the fair value of share-based awards represent our best estimates, but these estimates involve inherent uncertainties and the application of management judgment. Although we believe the assumptions and estimates we have made are reasonable and appropriate, changes in assumptions could materially impact our reported financial results.
Foreign Remeasurement and Currency Translation – Assets and liabilities of our wholly owned foreign subsidiaries that use the U.S. Dollar as their functional currency are re-measured using exchange rates in effect at the end of the period, except for nonmonetary assets, such as inventories and property, plant and equipment, which are re-measured using historical exchange rates. Revenues and costs are re-measured using average exchange rates for the period, except for costs related to those balance sheet items that are re-measured using historical exchange rates. Gains and losses on foreign currency transactions are recognized as incurred. During the year ended December 28, 2019, foreign exchange gains included in our consolidated statement of operations were insignificant. During the year ended December 29, 2018, we recognized foreign exchange gains totaling $1.7 million. During the year ended December 30, 2017, we recognized foreign exchange losses totaling $3.0 million.
Certain of our foreign subsidiaries have designated the local currency as their functional currency and, as a result, their assets and liabilities are translated at the rate of exchange at the balance sheet date, while revenue and expenses are translated using the average exchange rate for the period. Cumulative translation adjustments resulting from the translation of the financial statements are included as a separate component of stockholders’ equity.
|
COHU, INC. NOTES TO CONSOLIDATED FINANCIAL STATEMENTS |
Accumulated Other Comprehensive Loss – Our accumulated other comprehensive loss totaled approximately $34.0 million at December 28, 2019, and $25.9 million at December 29, 2018, and was attributed to, net of income taxes where applicable: foreign currency adjustments resulting from the translation of certain accounts into U.S. Dollars, unrealized losses and gains on investments and adjustments to accumulated postretirement benefit obligations. The U.S. Dollar strengthened relative to certain foreign currencies in countries where we have operations as of December 28, 2019, compared to December 29, 2018 and consequently, our accumulated other comprehensive loss increased by $7.5 million. Similarly, in the previous year, the U.S. Dollar strengthened relative to certain foreign currencies in countries where we have operations and, as a result, our accumulated other comprehensive loss increased by $8.9 million. Additional information related to accumulated other comprehensive loss, on an after-tax basis is included in Note 14.
Recent Accounting Pronouncements
Recently Adopted Accounting Pronouncements – We adopted ASU 2016-02, Leases (Topic 842), as of December 30, 2018, using the optional transition method which allowed us to record existing leases at adoption and recognize a cumulative-effect adjustment to the opening balance of retained earnings in the period of adoption rather than in the earliest period presented. We elected the package of practical expedients permitted under the transition guidance within the new standard, which among other things, allows us to carryforward the historical lease classification.
We made an accounting policy election to not record right of use ("ROU") assets and lease liabilities for leases with an initial term of 12 months or less. We recognized those lease payments in our consolidated statements of operations on a straight-line basis over the lease term. We also made an accounting policy election to use the practical expedient allowed in the standard to not separate lease and non-lease components when calculating the ROU asset and lease liability. Related to adoption of the new standard, we have implemented internal controls and a lease accounting technology system to track the ROU asset and lease liability balances and prepare the related footnote disclosures.
Adoption of the new standard resulted in the recording of additional net lease assets and lease liabilities of approximately $30.7 million and $29.9 million, respectively, as of December 30, 2018. We had previously recorded a sale and operating leaseback transaction in accordance with Topic 840 and as a result of the adoption of the new standard, recognized $10.2 million of deferred gain as an adjustment to retained earnings. In addition, we had previously recognized assets and liabilities related to a build-to-suit designation under Topic 840 and as a result of the adoption of the new standard, derecognized assets and liabilities of $0.5 million and $0.6 million, respectively, with the difference recorded as an adjustment to retained earnings. The standard did not materially impact our consolidated net earnings and had no impact on cash flows.
Recently Issued Accounting Pronouncements – In June 2016, the FASB issued ASU 2016-13, Financial Instruments-Credit Losses (Topic 326): Measurement of Credit Losses on Financial Instruments. ASU 2016-13 was subsequently amended by ASU 2019-04, Codification Improvements to Topic 326, Financial Instruments-Credit Losses, ASU 2019-05, Financial Instruments-Credit Losses (Topic 326): Targeted Transition Relief, ASU 2019-10, Financial Instruments—Credit Losses (Topic 326), Derivatives and Hedging (Topic 815), and Leases (Topic 842): Effective Dates and ASU 2019-11, Codification Improvements to Topic 326, Financial Instruments—Credit Losses. ASU 2016-13, as amended, affects trade receivables, financial assets and certain other instruments that are not measured at fair value through net income. This ASU will replace the currently required incurred loss approach with an expected loss model for instruments measured at amortized cost and is effective for financial statements issued for fiscal years beginning after December 15, 2019, including interim periods within those fiscal years. We do not expect the adoption of this guidance will have a material impact on our consolidated financial statements.
In August 2018, the FASB issued ASU 2018-14, Disclosure Framework - Changes to the Disclosure Requirements for Defined Benefit Plans, which improves defined benefit disclosure requirements by removing disclosures that are not cost beneficial, clarifying disclosures’ specific requirements and adding relevant disclosure requirements. This ASU is effective for fiscal years ending after December 15, 2020 and early adoption is permitted. The amendments in this ASU are required to be applied on a retrospective basis to all periods presented. We are currently assessing and have not yet determined the impact that the adoption of ASU 2018-14 will have on the disclosures to our consolidated financial statements.
|
COHU, INC. NOTES TO CONSOLIDATED FINANCIAL STATEMENTS |
In August 2018, the FASB issued ASU 2018-13, Disclosure Framework - Changes to the Disclosure Requirements for Fair Value Measurement, which improves fair value disclosure requirements by removing disclosures that are not cost beneficial, clarifying disclosures’ specific requirements and adding relevant disclosure requirements. This ASU is effective for fiscal years, and interim periods within those fiscal years, beginning after December 15, 2019. The amendments on changes in unrealized gains and losses, the range and weighted average of significant unobservable inputs used to develop Level 3 fair value measurements, and the narrative description of measurement uncertainty should be applied prospectively for only the most recent interim or annual period presented in the initial fiscal year of adoption. All other amendments should be applied retrospectively to all periods presented upon their effective date. Early adoption is permitted, and an entity can choose to early adopt any removed or modified disclosures upon issuance of this ASU and delay adoption of the additional disclosures until their effective date. We are currently assessing and have not yet determined the impact that the adoption of ASU 2018-13 will have on our consolidated financial statements.
In December 2019, the FASB issued ASU No. 2019-12, Simplifying the Accounting for Income Taxes, which simplifies the accounting for income taxes, eliminates certain exceptions within ASC 740, Income Taxes, and clarifies certain aspects of the current guidance to promote consistency among reporting entities. ASU 2019-12 is effective for fiscal years beginning after December 15, 2020. Most amendments within the standard are required to be applied on a prospective basis, while certain amendments must be applied on a retrospective or modified retrospective basis. We are currently assessing and have not yet determined the impact that the adoption of ASU 2019-12 will have on our consolidated financial statements.
2. Business Acquisitions
Pursuant to the Agreement and Plan of Merger (the “Merger Agreement”) dated as of May 7, 2018, among Cohu, Inc., a Delaware corporation (“Cohu”), Xcerra Corporation, a Massachusetts corporation (“Xcerra”), and Xavier Acquisition Corporation, a Delaware corporation and a wholly owned subsidiary of Cohu (“Merger Sub”), Merger Sub merged with and into Xcerra (the “Merger”), with Xcerra surviving such merger as a wholly owned subsidiary of Cohu. The Merger was effective on October 1, 2018 (“the Effective Time”). At the Effective Time, each share of Xcerra Common Stock issued and outstanding immediately prior to the Effective Time (other than dissenting shares and shares held by Cohu, Merger Sub, Xcerra or any direct or indirect wholly owned subsidiary of Cohu or Xcerra), were converted into the right to receive, in the aggregate for all shares of Xcerra Common Stock, consideration, which totaled approximately $794.4 million as of the Effective Time.
Xcerra is comprised of four businesses in the semiconductor and electronics manufacturing test markets: atg-Luther & Maelzer, Everett Charles Technologies, LTX-Credence and Multitest. The combination of these businesses creates a company with a broad spectrum of semiconductor and PCB test expertise that drives innovative new products and services, and the ability to deliver to customers fully integrated semiconductor test cell solutions. Xcerra addresses the broad, divergent requirements of the mobility, industrial, automotive and consumer end markets, offering a comprehensive portfolio of solutions and technologies, and a global network of strategically deployed applications and support resources. The acquisition of Xcerra was a strategic transaction to expand our total available market, extend our market leadership and broaden our product offerings.
Cohu financed the Merger, including all related fees and expenses, with the following:
|
● |
$160.5 million cash from our combined balance sheets; |
|
● |
The incurrence of $350.0 million from the Credit Facility, as described below; |
|
● |
The issuance of 11,776,149 shares of Cohu common stock; and |
|
● |
The issuance of 529,995 assumed RSUs to Xcerra employees, of which $0.8 million of the fair value of the assumed RSUs was attributed to pre-merger services. |
On October 1, 2018, Cohu entered into a Credit Agreement with Cohu, as borrower, certain of its subsidiaries as guarantor subsidiaries, the financial institutions party thereto from time to time as lenders, and Deutsche Bank AG New York Branch, as administrative agent and collateral agent, providing for a $350.0 million Credit Facility (the “Credit Facility”), and borrowed the full amount. Loans under the Credit Facility amortize in equal quarterly installments equal to 0.25% of the original principal amount thereof, with the balance payable at maturity. Subject to certain exceptions and thresholds, the Credit Facility will also require mandatory prepayments in connection with (i) excess cash flow, (ii) non-ordinary course asset sales and other dispositions and (iii) the issuance of certain debt obligations, among other things. Cohu has the right to prepay loans under the Credit Agreement in whole or in part at any time, without premium or penalty. Amounts repaid in respect of loans under the Credit Facility may not be reborrowed. All outstanding principal and interest in respect of the Credit Facility must be repaid on or before October 1, 2025. The loans under the Term Loan Facility bear interest, at Cohu’s option, at a floating annual rate equal to LIBOR plus a margin of 3.00%. The lender may accelerate the payment terms of the Credit Agreement upon the occurrence of certain events of default set forth therein, which include: the failure of Cohu to make timely payments of amounts due under the Credit Agreement, the failure of the Cohu to adhere to the representations and covenants set forth in the Credit Agreement or to provide required notices, upon the event that related collateral agreements become ineffective, upon the event that certain legal judgments are entered against Cohu, the insolvency of Cohu, or upon the change of control of Cohu.
|
COHU, INC. NOTES TO CONSOLIDATED FINANCIAL STATEMENTS |
Immediately prior to the Effective Time, each Xcerra RSU that was vested was cancelled and the holder received cash and share consideration for the outstanding shares. Each unvested RSU held by employees of Xcerra were assumed by Cohu and converted into an RSU representing the number of whole shares of Cohu common stock based on a conversion formula resulting in the number of assumed RSUs described above.
The acquisition method of accounting is based on ASC 805, Business Combinations (“ASC 805”), and uses the fair value concepts defined in ASC 820, Fair Value Measurement (“ASC 820”). The purchase price allocation described herein contains adjustments made during the post-acquisition measurement period, which were made as a result of obtaining new facts and circumstances related to certain assets acquired and liabilities assumed as of the date of acquisition. The net impact of the measurement period adjustments was offset against goodwill.
The acquisition was nontaxable to Cohu and certain of the assets acquired, including goodwill and intangibles, will not be deductible for tax purposes. The acquired assets and liabilities of Xcerra were recorded at their respective fair values including an amount for goodwill which represents the purchase price paid in excess of the fair value of net tangible and intangible assets acquired, and is attributable primarily to expected synergies, economies of scale and the assembled workforce of Xcerra. Goodwill has been allocated to our THG, STG, ISG and PTG operating segments.
ASC 805 requires, among other things, that most assets acquired, and liabilities assumed be recognized at their fair values as of the acquisition date. In addition, ASC 805 requires that the consideration transferred be measured at the date the merger is completed at the then-current market price. The market price of the shares of Cohu Common Stock at the Effective Time was $25.10 which was based upon the closing price of shares of Cohu Common Stock on the NASDAQ Global Select Market on Friday, September 28, 2018, the last day of trading prior to the Effective Time.
ASC 820 defines the term “fair value” and sets forth the valuation requirements for any asset or liability measured at fair value, expands related disclosure requirements and specifies a hierarchy of valuation techniques based on the nature of the inputs used to develop the fair value measurements. Fair value is defined in ASC 820 as “the price that would be received to sell an asset or paid to transfer a liability in an orderly transaction between market participants at the measurement date.” This is an exit price concept for the valuation of the asset or liability. In addition, market participants are assumed to be buyers and sellers in the principal (or the most advantageous) market for the asset or liability. Fair value measurements for an asset assume the highest and best use by these market participants. As a result of these standards, Cohu may be required to record the fair value of assets which are not intended to be used or sold and/or to value assets at fair values that do not reflect Cohu’s intended use of those assets. Many of these fair value measurements can be highly subjective, and it is possible that other professionals, applying reasonable judgment to the same facts and circumstances, could develop and support a range of alternative estimated amounts.
Under ASC 805, acquisition-related transaction costs (e.g., advisory, legal, investment banking and other professional fees) are not included as a component of consideration transferred but are accounted for as expenses in the periods in which such costs are incurred. Total Merger-related transaction costs, that exclude other costs related to employee termination and restructuring, incurred by Cohu were $0.4 million and $9.8 million in the years ended December 28, 2019 and December 29, 2018, respectively. Severance and other separation payments made to certain executive officers of Xcerra related to change-in-control with double trigger provisions in their existing employment agreements totaled $6.9 million in the year ended December 29, 2018.
|
COHU, INC. NOTES TO CONSOLIDATED FINANCIAL STATEMENTS |
The table below summarizes the assets acquired and liabilities assumed as of the acquisition date, October 1, 2018, with purchase price allocation adjustments made subsequent to the preliminary purchase price allocation (in thousands):
|
Fair Value at |
Measurement |
Adjusted |
||||||||||
|
Acquisition Date |
Period Adjustments* |
Fair Value |
||||||||||
|
Current assets, including cash received |
$ | 375,990 | $ | 375,990 | ||||||||
|
Property, plant and equipment |
40,729 | 40,729 | ||||||||||
|
Other assets |
2,109 | (1,058 | ) | 1,051 | ||||||||
|
Intangible assets |
321,160 | 321,160 | ||||||||||
|
Goodwill |
179,263 | 1,134 | 180,397 | |||||||||
|
Total assets acquired |
919,251 | 919,327 | ||||||||||
|
Liabilities assumed |
(124,821 | ) | (76 | ) | (124,897 | ) | ||||||
|
Net assets acquired |
$ | 794,430 | $ | 794,430 | ||||||||
|
* |
Measurement period adjustments made as a result of obtaining new facts and circumstances related to certain assets acquired and liabilities assumed as of the date of acquisition. The net impact of the measurement period adjustments were offset against goodwill. |
We recorded a $19.6 million step-up of inventory to its fair value as of the acquisition date based on the valuation which has been fully amortized to cost of sales as of December 28, 2019.
The allocation of the intangible assets subject to amortization is as follows (in thousands):
|
Estimated Fair Value |
Weighted Average Useful Life (years) |
|||||||
|
Developed technology |
$ | 194,600 | 7.8 | |||||
|
Customer relationships |
65,890 | 10.6 | ||||||
|
In-process research and development |
36,360 |
|
indefinite | |||||
|
Product backlog |
6,410 | 0.8 | ||||||
|
Trademarks and trade names |
16,800 | 11.0 | ||||||
|
Favorable leases |
1,100 | 5.5 | ||||||
|
Total intangible assets |
$ | 321,160 | ||||||
Acquired intangible assets reported above are being amortized using the straight-line method over their estimated useful lives which approximates the pattern of how the economic benefit is expected to be used. This includes amounts allocated to customer relationships because of anticipated high customer retention rates that are common in the semiconductor capital equipment industry.
The value assigned to developed technology was determined by using the multi-period excess earnings method under the income approach. Developed technology, which comprises products that have reached technological feasibility, includes the products in Xcerra’s product line. The revenue estimates used to value the developed technology were based on estimates of relevant market sizes and growth factors, expected trends in technology and the nature and expected timing of new product introductions by Xcerra and competitors. The estimated cash flows were based on revenues for the developed technology net of operating expenses and net of contributory asset charges. The discount rate utilized to discount the net cash flows of the developed technology to present value was based on the risk associated with the respective cash flows taking into consideration the perceived risk of the technology relative to the other acquired assets, the weighted average cost of capital, the internal rate of return, and the weighted average return on assets.
The value assigned to customer relationships was determined by using the with and without method under the income approach, which analyzes the difference in discounted cash flows generated with the customer relationships in place compared to the discounted cash flows generated without the customer relationships in place.
In-process research and development (“IPR&D”) represents the estimated fair value assigned to research and development projects acquired in a business combination that have not been completed at the date of acquisition and which have no alternative future use. IPR&D is initially accounted for as an indefinite-lived intangible asset. Once a project reaches technological feasibility amounts capitalized related to the project are reclassified to developed technology and the intangible asset begins to be amortized over its estimated useful life. For the IPR&D, additional research and development will be required to assess technological feasibility.
The value assigned to backlog acquired was estimated based upon the contractual nature of the backlog as of October 1, 2018, using the income approach to discount back to present value the cash flows attributable to the backlog.
The value assigned to trademarks and trade names was estimated using the relief-from-royalty method of the income approach. This approach is based on the assumption that in lieu of ownership, a company would be willing to pay a royalty in order to exploit the related benefits of this intangible asset.
In our estimate of the fair value of Xcerra’s net assets, Cohu identified leases that appear to be at both favorable and unfavorable rates compared to current market rates. As a result, Cohu has recorded both favorable and unfavorable lease assets, which are being amortized to rent expense over the terms of the related lease. As of December 29, 2018, favorable leases were reclassified from intangible assets, net to operating lease right of use assets as a result of our adoption of ASU 2016-2, Leases (Topic 842).
|
COHU, INC. NOTES TO CONSOLIDATED FINANCIAL STATEMENTS |
3. Goodwill and Purchased Intangible Assets
Changes in the carrying value of our goodwill during the years ended December 28, 2019, and December 29, 2018, were as follows (in thousands):
|
Semiconductor Test & Inspection |
PCB Test |
Total Goodwill |
||||||||||
|
Balance December 30, 2017 |
$ | 65,613 | $ | - | $ | 65,613 | ||||||
|
Additions |
157,661 | 21,602 | 179,263 | |||||||||
|
Impact of currency exchange |
(2,466 | ) | (283 | ) | (2,749 | ) | ||||||
|
Balance December 29, 2018 |
220,808 | 21,319 | 242,127 | |||||||||
|
Adjustments |
2,117 | (983 | ) | 1,134 | ||||||||
|
Impairments (1) |
(715 | ) | - | (715 | ) | |||||||
|
Impact of currency exchange |
(3,435 | ) | (442 | ) | (3,877 | ) | ||||||
|
Balance December 28, 2019 |
$ | 218,775 | $ | 19,894 | $ | 238,669 | ||||||
|
(1) |
Impairment of goodwill associated with our FSG segment that is presented as discontinued operations. This amount was not pushed down in the consolidated financial statements and was included within the balance of our Semiconductor Test & Inspection segment. |
Purchased intangible assets, subject to amortization, are as follows (in thousands):
|
December 28, 2019 |
December 29, 2018 |
|||||||||||||||||||
|
Remaining |
||||||||||||||||||||
|
Gross Carrying |
Accumulated |
Useful Life |
Gross Carrying |
Accumulated |
||||||||||||||||
|
Amount |
Amortization |
(years) |
Amount |
Amortization |
||||||||||||||||
|
Developed technology |
$ | 227,619 | $ | 49,805 | 6.6 | $ | 214,266 | $ | 21,197 | |||||||||||
|
Customer relationships |
72,251 | 14,824 | 9.3 | 73,104 | 7,378 | |||||||||||||||
|
Trade names |
22,612 | 3,892 | 9.5 | 22,701 | 1,807 | |||||||||||||||
|
Backlog |
6,328 | 6,328 | - | 6,372 | 4,696 | |||||||||||||||
|
Favorable leases* |
- | - | - | 1,100 | 62 | |||||||||||||||
|
Covenant not-to-compete |
322 | 96 | 7.0 | 314 | 63 | |||||||||||||||
| $ | 329,132 | $ | 74,945 | $ | 317,857 | $ | 35,203 | |||||||||||||
|
* |
Favorable leases were reclassified to operating lease right of use assets on December 30, 2018 as a result of our adoption of ASU 2016-2. |
The table above excludes $20.8 million and $36.3 million of in-process technology in 2019 and 2018, respectively, which has an indefinite life and is subject to impairment or future amortization as developed technology when the projects are completed. During the current year $15.3 million of in-process technology was completed and transferred to developed technology and began being amortized. Changes in the carrying values of purchased intangible assets presented above are a result of the impact of fluctuation in currency exchange rates.
Amortization expense related to purchased intangible assets was approximately $39.6 million in 2019, $17.2 million in 2018 and $4.2 million in 2017. The increases in amortization expense is the result of amortization of purchased intangible assets acquired from Xcerra. As of December 28, 2019, we expect amortization expense in future periods to be as follows: 2020 - $38.4 million; 2021 - $34.8 million; 2022 - $34.8 million; 2023 - $34.8 million 2024 - $34.8 million; and thereafter $76.8 million.
|
COHU, INC. NOTES TO CONSOLIDATED FINANCIAL STATEMENTS |
|
4. |
Borrowings and Credit Agreements |
The following table is a summary of our borrowings as of December 28, 2019 and December 29, 2018:
|
Fiscal year ended |
||||||||
|
(in thousands) |
December 28, 2019 |
December 29, 2018 (1) |
||||||
|
Bank Term Loan under Credit Agreement |
$ | 346,500 | $ | 349,125 | ||||
|
Bank Term Loans-Kita |
3,830 | 4,576 | ||||||
|
Bank Term Loan-Xcerra |
1,475 | 1,839 | ||||||
|
Construction Loan-Rasco |
5,476 | - | ||||||
|
Lines of Credit |
3,195 | 3,115 | ||||||
|
Total debt |
360,476 | 358,655 | ||||||
|
Less: financing fees and discount |
(7,441 | ) | (8,551 | ) | ||||
|
Less: current portion |
(6,517 | ) | (6,676 | ) | ||||
|
Total long-term debt |
$ | 346,518 | $ | 343,428 | ||||
|
(1) |
Excludes financing lease obligations, which are included in long-term and short-term debt in our consolidated balance sheet, as they were not material at December 29, 2018. |
The debt principal payments, excluding financing lease obligations, for the next five years and thereafter are as follows:
|
(in thousands) |
||||
|
2020 |
$ | 7,679 | ||
|
2021 |
4,636 | |||
|
2022 |
4,997 | |||
|
2023 |
5,001 | |||
|
2024 |
4,467 | |||
|
Thereafter |
333,696 | |||
|
Total |
$ | 360,476 |
Credit Agreement
On October 1, 2018, we entered into a Credit Agreement providing for a $350.0 million Credit Facility and borrowed the full amount. Loans under the Credit Facility amortize in equal quarterly installments equal to 0.25% of the original principal amount, with the balance payable at maturity. All outstanding principal and interest in respect of the Credit Facility must be repaid on or before October 1, 2025. The loans under the Term Loan Facility bear interest, at Cohu’s option, at a floating annual rate equal to LIBOR plus a margin of 3.00%. At December 28, 2019, the outstanding loan balance, net of discount and deferred financing costs, was $339.1 million and $2.3 million of the outstanding balance is presented as current installments of long-term debt in our consolidated balance sheets. The outstanding loan balance as of December 28, 2019 includes $0.9 million of principal that was paid subsequent to year-end on December 31, 2019. As of December 28, 2019, the fair value of the debt was $344.8 million. The measurement of the fair value of debt is based on the average of the bid and ask trading quotes as of December 28, 2019 and is considered a Level 2 fair value measurement. See Note 2, “Business Acquisitions” for additional information on the Credit Facility.
Kita Term Loans
As a result of our acquisition of Kita, we assumed term loans from a series of Japanese financial institutions primarily related to the expansion of Kita’s facility in Osaka, Japan. The loans are collateralized by the facility and land, carry interest rates ranging from 0.05% to 0.43%, and expire at various dates through 2034. At December 28, 2019, the outstanding loan balance was $3.8 million and $0.4 million of the outstanding balance is presented as current installments of long-term debt in our consolidated balance sheets. The fair value of the debt approximates the carrying value at December 28, 2019.
The term loans are denominated in Japanese Yen and, as a result, amounts disclosed herein will fluctuate because of changes in currency exchange rates.
|
COHU, INC. NOTES TO CONSOLIDATED FINANCIAL STATEMENTS |
Xcerra Term Loan
As a result of our acquisition of Xcerra, we assumed a term loan related to the purchase of Xcerra’s facility in Rosenheim, Germany. The loan is payable over 10 years at an annual interest rate of 2.35%. Principal plus accrued interest is due quarterly over the duration of the term loan. At December 28, 2019, the outstanding loan balance was $1.5 million and $0.3 million of the outstanding balance is presented as current installments of long-term debt in our consolidated balance sheets. The fair value of the debt approximates the carrying value at December 28, 2019.
The term loan is denominated in Euros and, as a result, amounts disclosed herein will fluctuate because of changes in currency exchange rates.
Construction Loans
On July 26, 2019, one of our wholly owned subsidiaries located in Germany entered into two construction loans (“Loan Facilities”) with a German financial institution providing total borrowing of €8.6 million. The Loan Facilities have 10-year and 15-year terms, which commenced on August 1, 2019, the initial draw-down date. The Loan Facilities are being utilized to finance the expansion of our facility in Kolbermoor, Germany, enabling us to combine the operations of multiple subsidiaries in one location as part of our previously announced strategic restructuring program. The Loan Facilities are secured by the land and the existing building on the site and bear interest at agreed upon rates based on separate €3.4 million and €5.2 million facility amounts.
On August 1, 2019, the full €3.4 million was drawn under the first facility, which is payable over 10 years at an annual interest rate of 0.8%. Interest payments only are required to be made each quarter starting in September 2019 with principal and interest payments due each quarter starting in the month of December 2021. Principal repayments will be made over 8 years starting at the end of 2021.
On December 10, 2019, we drew €1.5 million under the second facility, which is payable over 15 years at an annual interest rate of 1.05%. Interest payments only are required to be made each quarter starting in December 2019 with principal and interest payments due each quarter starting in the month of May 2020. Principal repayments will be made over 15 years starting at the end of May 2020. As of December 28, 2019, €3.7 million had not been drawn under the second facility as is expected to be drawn in the first half of 2020.
At December 28, 2019, total outstanding borrowings under the Loan Facilities was $5.5 million with $0.3 million of the total outstanding balance being presented as current installments of long-term debt in our consolidated balance sheets based on contractual due dates. The loans are denominated in Euros and, as a result, amounts disclosed herein will fluctuate because of changes in currency exchange rates. The fair value of the debt approximates the carrying value at December 28, 2019.
Lines of Credit
As a result of our acquisition of Kita, we assumed a series of revolving credit facilities with various financial institutions in Japan. The credit facilities renew monthly and provide Kita with access to working capital totaling up to $8.8 million. At December 28, 2019, total borrowings outstanding under the revolving lines of credit were $3.2 million. As these credit facility agreements renew monthly, they have been included in short-term borrowings in our consolidated balance sheet.
The revolving lines of credit are denominated in Japanese Yen and, as a result, amounts disclosed herein will fluctuate because of changes in currency exchange rates.
Our wholly owned Ismeca subsidiary has one available line of credit which provides it with borrowings of up to a total of 2.0 million Swiss Francs. At December 28, 2019, and December 29, 2018, no amounts were outstanding under this line of credit.
|
COHU, INC. NOTES TO CONSOLIDATED FINANCIAL STATEMENTS |
5. Restructuring Charges
Subsequent to the acquisition of Xcerra on October 1st, during the fourth quarter of 2018, we began a strategic restructuring program designed to reposition our organization and improve our cost structure as part of our targeted integration plan regarding the recently acquired Xcerra (“Integration Program”). See Note 2, “Business Acquisitions, Goodwill and Purchased Intangible Assets” for additional information regarding the acquisition of Xcerra. As part of the Integration Program we consolidated our global handler and contactor manufacturing operations and closed our manufacturing operations in Penang, Malaysia and Fontana, California in 2019. Relating to the facility consolidation actions, we notified certain impacted employees of a reduction in force program. In the second quarter of 2019, we entered into a social plan (“Plan”) with the German labor organization representing certain of the employees of our wholly owned subsidiary, Multitest elektronische Systeme GmbH, as part of our Integration Program. The Plan will reduce headcount, enable us to consolidate the facilities of our multiple operations located near Rosenheim, Germany, as well as transition certain manufacturing to other lower cost regions. The facility consolidation and reduction in force programs are being implemented as part of a comprehensive review of our operations and are intended to streamline and reduce our operating cost structure and capitalize on acquisition synergies.
As a result of the activities described above, we recognized total pretax charges of $16.2 million and $37.8 million for the years ended December 28, 2019 and December 29, 2018, respectively, that are within the scope of ASC 420, Exit or Disposal Cost Obligations (“ASC 420”). Severance and other separation payments made to certain executive officers of Xcerra related to change-in-control with double trigger provisions in their existing employment agreements totaled $6.9 million in the year ended December 29, 2018. Additionally, in the year ended December 29, 2018, we incurred $8.2 million of compensation costs related to the acceleration of RSUs held by certain executive officers and the Board of Directors of Xcerra because of the change in control. This non-cash expense is included in restructuring in our consolidated statements of operations.
All costs of the Integration Program were, and are expected to be, incurred by our Semiconductor Test & Inspection segment.
Charges related to the Integration Program for the years ended December 28, 2019 and December 29, 2018, were as follows (in thousands):
|
Twelve Months Ended |
||||||||
|
December 28, 2019 |
December 29, 2018 |
|||||||
|
Employee severance costs |
$ | 12,170 | $ | 17,791 | ||||
|
Inventory related charges |
2,729 | 19,053 | ||||||
|
Other restructuring costs |
1,314 | 913 | ||||||
|
Total |
$ | 16,213 | $ | 37,757 | ||||
Costs associated with restructuring activities are presented in our consolidated statements of operations as restructuring charges, except for certain costs associated with inventory charges related to the decision to end manufacturing of certain of Xcerra’s semiconductor test handler products, which are classified within cost of sales. Other restructuring costs include expenses for professional fees associated with employee severance and impairments of fixed assets.
The following table summarizes the activity within the restructuring related accounts for the Integration Program during the years ended December 28, 2019 and December 29, 2018 (in thousands):
|
Employee Severance |
Other Exit Costs |
Total |
||||||||||
| Balance, December 30, 2017 | $ | - | $ | - | $ | - | ||||||
|
Costs accrued |
17,791 | 913 | 18,704 | |||||||||
|
Amounts paid or charged |
(13,750 | ) | (913 | ) | (14,663 | ) | ||||||
|
Impact of currency exchange |
(15 | ) | - | (15 | ) | |||||||
|
Balance, December 29, 2018 |
4,026 | - | 4,026 | |||||||||
|
Costs accrued |
12,170 | 1,314 | 13,484 | |||||||||
|
Amounts paid or charged |
(14,909 | ) | (1,314 | ) | (16,223 | ) | ||||||
|
Impact of currency exchange |
(51 | ) | - | (51 | ) | |||||||
|
Balance, December 28, 2019 |
$ | 1,236 | $ | - | $ | 1,236 | ||||||
At December 28, 2019, our total accrual for restructuring related items is reflected within current liabilities in our consolidated balance sheets as these amounts are expected to be paid out in 2020. The estimated costs associated with the employee severance and facility consolidation actions will be paid predominantly in cash. All amounts accrued related to inventory will remain in our consolidated balance sheet until it is scrapped.
|
COHU, INC. NOTES TO CONSOLIDATED FINANCIAL STATEMENTS |
6. Employee Benefit Plans
Defined Contribution Retirement Plans – Cohu and Xcerra each maintain defined contribution 401(k) retirement savings plans covering all their respective salaried and hourly U.S. employees. Participation is voluntary and participants’ contributions are based on their eligible compensation. Participants in the Cohu plan receive matching contributions of 50% up to 8% of salary contributed and participants in the Xcerra plan receive matching contributions of 50% up to 6% of salary contributed, both subject to various statutory limits. In 2019 we made matching contributions to the plan of $2.0 million. In 2018 we made contributions to the plan of $1.1 million, which includes matching contributions to the Xcerra 401(k) plan from October 1 through December 29, 2018. In 2017 we made contributions to the plan of $0.6 million.
Defined Benefit Retirement Plans – As a result of our acquisition of Ismeca in 2013, we took over the Ismeca Europe Semiconductor BVG Pension Plan in Switzerland (“the Swiss Plan”) and the following discussion relates solely to the Swiss Plan.
Net periodic benefit cost of the Swiss Plan was as follows:
|
(in thousands) |
2019 |
2018 |
2017 |
|||||||||
|
Service cost |
$ | 920 | $ | 925 | $ | 907 | ||||||
|
Interest cost |
267 | 207 | 198 | |||||||||
|
Expected return on assets |
(168 | ) | (124 | ) | (119 | ) | ||||||
|
Net periodic costs |
$ | 1,019 | $ | 1,008 | $ | 986 | ||||||
The following table sets forth the projected benefit obligation, the fair value of plan assets, the funded status and the liability we have recorded in our consolidated balance sheet related to the Swiss Plan:
|
(in thousands) |
2019 |
2018 |
||||||
|
Change in projected benefit obligation: |
||||||||
|
Benefit obligation at beginning of year |
$ | (29,910 | ) | $ | (30,512 | ) | ||
|
Service cost |
(920 | ) | (925 | ) | ||||
|
Interest cost |
(267 | ) | (207 | ) | ||||
|
Actuarial gain (loss) |
(1,456 | ) | 708 | |||||
|
Participant contributions |
(1,434 | ) | (816 | ) | ||||
|
Benefits paid |
2,313 | 1,079 | ||||||
|
Plan change |
- | 199 | ||||||
|
Foreign currency exchange adjustment |
(567 | ) | 564 | |||||
|
Benefit obligation at end of year |
(32,241 | ) | (29,910 | ) | ||||
|
Change in plan assets: |
||||||||
|
Fair value of plan assets at beginning of year |
18,088 | 17,746 | ||||||
|
Return on assets, net of actuarial loss |
281 | 114 | ||||||
|
Employer contributions |
882 | 816 | ||||||
|
Participant contributions |
1,434 | 816 | ||||||
|
Benefits paid |
(2,313 | ) | (1,079 | ) | ||||
|
Foreign currency exchange adjustment |
333 | (325 | ) | |||||
|
Fair value of plan assets at end of year |
18,705 | 18,088 | ||||||
|
Net liability at end of year |
$ | (13,536 | ) | $ | (11,822 | ) | ||
At December 28, 2019 and December 29, 2018, the Swiss Plan’s net liability is included in noncurrent accrued retirement benefits. Amounts recognized in accumulated other comprehensive income net of tax related to the Swiss Plan consisted of an unrecognized net actuarial loss totaling $4.1 million at December 28, 2019, and $2.7 million at December 29, 2018.
|
COHU, INC. NOTES TO CONSOLIDATED FINANCIAL STATEMENTS |
Weighted-average actuarial assumptions used to determine the projected benefit obligation under the Swiss Plan are as follows:
|
2019 |
2018 |
|||||||
|
Discount rate |
0.2 | % | 0.9 | % | ||||
|
Compensation increase |
1.1 | % | 1.8 | % | ||||
Weighted-average assumptions used to determine net periodic benefit cost of the Swiss Plan are as follows:
|
2019 |
2018 |
2017 |
||||||||||
|
Discount rate |
0.9 | % | 0.7 | % | 0.7 | % | ||||||
|
Rate of return on assets |
0.9 | % | 0.7 | % | 0.7 | % | ||||||
|
Compensation increase |
1.8 | % | 1.8 | % | 1.5 | % | ||||||
During 2020 employer and employee contributions to the Swiss Plan are expected to total $0.9 million. Estimated benefit payments are expected to be as follows: 2020 - $1.4 million; 2021 - $1.3 million; 2022 - $1.1 million; 2023 - $1.7 million; 2024 - $1.3 million; and $7.0 million thereafter through 2029.
As is customary with Swiss pension plans, the assets of the plan are invested in a collective fund with multiple employers. We have no investment authority over the assets of the plan that are held and invested by a Swiss insurance company. Investment holdings are made with respect to Swiss laws and target allocations for plan assets are 62% debt securities and cash, 17% real estate investments, 10% alternative investments and 11% equity securities. The valuation of the collective fund assets as a whole is a Level 3 measurement; however, the individual investments of the fund are generally Level 1 (equity securities), Level 2 (fixed income) and Level 3 (real estate and alternative) investments. We determine the fair value of the plan assets based on information provided by the collective fund, through review of the collective fund’s annual financial statements. See Note 7, “Financial Instruments Measured at Fair Value” for additional information on the three-tier fair value hierarchy.
We maintain other defined benefit plans for employees located outside the U.S. for which the majority of the obligations and net periodic benefit cost were determined to be immaterial for all periods presented.
Retiree Medical Benefits – We provide post-retirement health benefits to certain executives and directors under a noncontributory plan. The net periodic benefit cost was $0.1 million in 2019, 2018, and 2017. We fund benefits as costs are incurred and as a result there are no plan assets.
The weighted average discount rate used in determining the accumulated post-retirement benefit obligation was 3.0% in 2019, 4.1% in 2018 and 3.4% in 2017. The annual rates of increase of the cost of health benefits was assumed to be 7.4% in 2020. This rate was then assumed to decrease 0.4% per year to 4.4% in 2027 and remain level thereafter. A one percent increase (decrease) in health care cost trend rates would increase (decrease) the 2019 net periodic benefit cost by approximately $14,000 ($12,000) and the accumulated post-retirement benefit obligation as of December 28, 2019, by approximately $318,000 ($270,000).
Contributions to the post-retirement health benefit plan are expected to total $0.1 million in 2020. Estimated benefit payments are expected to be as follows: 2020 - $0.1 million; 2021 - $0.1 million; 2022 - $0.1 million; 2023 - $0.1 million; 2024 - $0.1 million and $0.7 million thereafter through 2029.
|
COHU, INC. NOTES TO CONSOLIDATED FINANCIAL STATEMENTS |
The following table sets forth the post-retirement benefit obligation, funded status and the liability we have recorded in our consolidated balance sheets:
|
(in thousands) |
2019 |
2018 |
||||||
|
Accumulated benefit obligation at beginning of year |
$ | 2,880 | $ | 3,148 | ||||
|
Interest cost |
115 | 105 | ||||||
|
Actuarial gain |
(258 | ) | (216 | ) | ||||
|
Benefits paid |
(166 | ) | (157 | ) | ||||
|
Accumulated benefit obligation at end of year |
2,571 | 2,880 | ||||||
|
Plan assets at end of year |
- | - | ||||||
|
Funded status |
$ | (2,571 | ) | $ | (2,880 | ) | ||
Deferred Compensation – The Cohu, Inc. Deferred Compensation Plan allows certain of our officers to defer a portion of their current compensation. We have purchased life insurance policies on the participants with Cohu as the named beneficiary. Participant contributions, distributions and investment earnings and losses are accumulated in a separate account for each participant. At December 28, 2019, the payroll liability to participants, included in accrued compensation and benefits in the consolidated balance sheet, was approximately $2.0 million and the cash surrender value of the related life insurance policies included in other current assets was approximately $1.7 million. At December 29, 2018, the liability totaled $2.0 million and the corresponding assets were $1.6 million.
Employee Stock Purchase Plan – The Cohu, Inc. 1997 Employee Stock Purchase Plan (“the Plan”) provides for the issuance of a maximum of 2,650,000 shares of our common stock. On May 8, 2019, our stockholders approved an amendment to the ESPP which increased the number of ESPP shares that may be issued by 500,000. Under the Plan, eligible employees may purchase shares of common stock through payroll deductions. The price paid for the common stock is equal to 85% of the fair market value of our common stock on specified dates. During the last three years we issued shares under the Plan as follows: 2019 - 187,273; 2018 - 84,678 and 2017 - 99,144. At December 28, 2019, there were 911,337 shares reserved for issuance under the Plan.
Stock Options – At December 28, 2019, a total of 2,503,918 shares were available for future equity grants under the Cohu, Inc. 2005 Equity Incentive Plan (“the 2005 Plan”). On May 8, 2019, our stockholders approved amendments to the 2005 Plan which increased the shares of stock available for issuance by 2,000,000 and eliminated a sublimit on the aggregate number of shares that may be issued pursuant to restricted stock, restricted stock units, performance shares or performance unit awards. Under the 2005 Plan stock options may be granted to employees, consultants and outside directors to purchase a fixed number of shares of our common stock at prices not less than 100% of the fair market value at the date of grant. Options generally vest and become exercisable after one year or in four annual increments beginning one year after the grant date and expire ten years from the grant date. We have historically issued new shares of Cohu common stock upon share option exercise.
During 2019, 2018 and 2017 no stock options were granted and the activity under our share-based compensation plans was as follows:
|
2019 |
2018 |
2017 |
||||||||||||||||||||||
|
Wt. Avg. |
Wt. Avg. |
Wt. Avg. |
||||||||||||||||||||||
|
(in thousands, except per share data) |
Shares |
Ex. Price |
Shares |
Ex. Price |
Shares |
Ex. Price |
||||||||||||||||||
|
Outstanding, beginning of year |
405 | $ | 10.22 | 472 | $ | 10.20 | 1,641 | $ | 10.79 | |||||||||||||||
|
Exercised |
(42 | ) | $ | 9.82 | (67 | ) | $ | 10.10 | (1,164 | ) | $ | 10.98 | ||||||||||||
|
Cancelled |
- | $ | - | - | $ | - | (5 | ) | $ | 20.73 | ||||||||||||||
|
Outstanding, end of year |
363 | $ | 10.27 | 405 | $ | 10.22 | 472 | $ | 10.20 | |||||||||||||||
|
Options exercisable at year end |
363 | $ | 10.27 | 405 | $ | 10.22 | 469 | $ | 10.20 | |||||||||||||||
The aggregate intrinsic value of options exercised was $0.2 million in 2019, $0.9 million in 2018, and $10.1 million in 2017. At December 28, 2019, the aggregate intrinsic value of options outstanding, vested and expected to vest and exercisable was $4.4 million.
|
COHU, INC. NOTES TO CONSOLIDATED FINANCIAL STATEMENTS |
Information about stock options outstanding at December 28, 2019 is as follows (options in thousands):
|
Options Outstanding |
Options Exercisable |
||||||||||||||||||||||||
|
Approximate |
|||||||||||||||||||||||||
|
Wt. Avg. |
|||||||||||||||||||||||||
|
Range of |
Number |
Remaining |
Wt. Avg. |
Number |
Wt. Avg. |
||||||||||||||||||||
|
Exercise Prices |
Outstanding |
Life (Years) |
Ex. Price |
Exercisable |
Ex. Price |
||||||||||||||||||||
| $ | 9.44 | - | $ | 10.54 | 200 | 3.2 | $ | 9.50 | 200 | $ | 9.50 | ||||||||||||||
| $ | 10.55 | - | $ | 10.58 | 126 | 2.2 | $ | 10.58 | 126 | $ | 10.58 | ||||||||||||||
| $ | 10.59 | - | $ | 15.89 | 37 | 2.3 | $ | 13.32 | 37 | $ | 13.23 | ||||||||||||||
| 363 | 2.8 | $ | 10.27 | 363 | $ | 10.27 | |||||||||||||||||||
Restricted Stock Units – Under our equity incentive plans, restricted stock units may be granted to employees, consultants and outside directors. Restricted stock units vest over a one-year, two-year or a four-year period from the date of grant. Prior to vesting, restricted stock units do not have dividend equivalent rights, do not have voting rights and the shares underlying the restricted stock units are not considered issued and outstanding. New shares of our common stock will be issued on the date the restricted stock units vest net of the statutory tax withholding requirements to be paid by us on behalf of our employees. As a result, the actual number of shares issued will be fewer than the actual number of RSUs outstanding at December 28, 2019.
Restricted stock unit activity under our share-based compensation plans was as follows:
|
2019 |
2018 |
2017 |
||||||||||||||||||||||
|
Wt. Avg. |
Wt. Avg. |
Wt. Avg. |
||||||||||||||||||||||
|
(in thousands, except per share data) |
Units |
Fair Value |
Units |
Fair Value |
Units |
Fair Value |
||||||||||||||||||
|
Outstanding, beginning of year |
1,265 | $ | 19.48 | 981 | $ | 12.50 | 1,083 | $ | 10.50 | |||||||||||||||
|
Granted |
694 | $ | 14.32 | 822 | $ | 23.70 | 353 | $ | 15.95 | |||||||||||||||
|
Released |
(563 | ) | $ | 19.08 | (500 | ) | $ | 13.10 | (409 | ) | $ | 10.26 | ||||||||||||
|
Cancelled |
(68 | ) | $ | 17.60 | (38 | ) | $ | 14.67 | (46 | ) | $ | 11.85 | ||||||||||||
|
Outstanding, end of year |
1,328 | $ | 17.05 | 1,265 | $ | 19.48 | 981 | $ | 12.50 | |||||||||||||||
RSUs granted in 2018 in the table above include the issuance of 529,995 assumed RSUs to Xcerra employees, based on a conversion formula.
Equity-Based Performance Stock Units – We grant performance stock units (“PSUs”) to certain senior executives as a part of our long-term equity compensation program. The performance criteria for the PSUs is based on a combination of the Company’s annualized Total Shareholder Return (“TSR”) for the performance period and the relative performance of the Company’s TSR compared with the annualized TSR of certain peer companies for the performance period.
The number of shares of common stock that will ultimately be issued to settle PSUs granted over the last four years is as follows:
| Year Granted |
Range of Awards |
Performance Criteria Period (in years) |
||||||||
|
2019 |
25% | - | 200% | 3 | ||||||
|
2018 |
25% | - | 200% | 3 | ||||||
|
2017 |
25% | - | 200% | 3 | ||||||
|
2016 |
25% | - | 200% | 3 | ||||||
PSUs granted in 2019, 2018, 2017 and 2016 vest 100% on the third anniversary of their grant.
We estimated the fair value of the PSUs using a Monte Carlo simulation model on the date of grant. Compensation expense is recognized over the derived service period. New shares of our common stock will be issued on the date the PSUs vest net of the minimum statutory tax withholding requirements to be paid by us on behalf of our employees. As a result, the actual number of shares issued will be fewer than the actual number of PSUs outstanding at December 28, 2019.
|
COHU, INC. NOTES TO CONSOLIDATED FINANCIAL STATEMENTS |
PSU activity under our share-based compensation plans was as follows:
|
2019 |
2018 |
2017 |
||||||||||||||||||||||
|
Wt. Avg. |
Wt. Avg. |
Wt. Avg. |
||||||||||||||||||||||
|
(in thousands, except per share data) |
Units |
Fair Value |
Units |
Fair Value |
Units |
Fair Value |
||||||||||||||||||
|
Outstanding, beginning of year |
340 | $ | 17.89 | 334 | $ | 14.31 | 403 | $ | 11.04 | |||||||||||||||
|
Granted |
167 | $ | 14.11 | 89 | $ | 24.32 | 185 | $ | 17.60 | |||||||||||||||
|
Released |
(36 | ) | $ | 11.35 | (41 | ) | $ | 9.92 | (186 | ) | $ | 11.35 | ||||||||||||
|
Cancelled |
(107 | ) | $ | 11.35 | (42 | ) | $ | 10.69 | (68 | ) | $ | 11.94 | ||||||||||||
|
Outstanding, end of year |
364 | $ | 18.72 | 340 | $ | 17.89 | 334 | $ | 14.31 | |||||||||||||||
Share-based Compensation – We estimate the fair value of each share-based award on the grant date using the Black-Scholes and the Monte Carlo simulation valuation models. Option valuation models require the input of highly subjective assumptions and changes in the assumptions used can materially affect the grant date fair value of an award. These assumptions for the Black-Scholes model include the risk-free rate of interest, expected dividend yield, expected volatility, and the expected life of the award. The risk-free rate of interest is based on the U.S. Treasury rates appropriate for the expected term of the award as of the grant date. Expected dividends are based primarily on historical factors related to our common stock. Expected volatility is based on historic weekly stock price observations of our common stock during the period immediately preceding the share-based award grant that is equal in length to the award’s expected term. We believe that historical volatility is the best estimate of future volatility. Expected life of the award is based on historical option exercise data. The Monte Carlo simulation model incorporates assumptions for the risk-free interest rate, Cohu and the selected peer group price volatility, the correlation between Cohu and the selected index, and dividend yields. Share-based compensation expense related to restricted stock unit awards is calculated based on the market price of our common stock on the date of grant, reduced by the present value of dividends expected to be paid on our common stock prior to vesting of the restricted stock unit.
The following weighted average assumptions were used to value share-based awards granted:
|
Employee Stock Purchase Plan |
2019 |
2018 |
2017 |
|||||||||
|
Dividend yield |
1.3 | % | 1.1 | % | 1.4 | % | ||||||
|
Expected volatility |
46.4 | % | 39.0 | % | 33.3 | % | ||||||
|
Risk-free interest rate |
2.2 | % | 1.7 | % | 0.7 | % | ||||||
|
Expected term (years) |
0.5 | 0.5 | 0.5 | |||||||||
|
Weighted-average grant date fair value per share |
$ | 5.35 | $ | 5.90 | $ | 4.63 | ||||||
|
Restricted Stock Units |
2019 |
2018 |
2017 |
|||||||||
|
Dividend yield |
1.6 | % | 1.0 | % | 1.4 | % | ||||||
Reported share-based compensation is classified in the Consolidated Financial Statements as follows:
|
(in thousands) |
2019 |
2018 |
2017 |
|||||||||
|
Cost of sales |
$ | 736 | $ | 546 | $ | 423 | ||||||
|
Research and development |
2,994 | 1,717 | 1,054 | |||||||||
|
Selling, general and administrative |
10,418 | 7,790 | 5,530 | |||||||||
|
Share-based compensation of continuing operations |
14,148 | 10,053 | 7,007 | |||||||||
|
Income tax benefit |
(587 | ) | (993 | ) | (530 | ) | ||||||
|
Total share-based compensation, net of tax |
$ | 13,561 | $ | 9,060 | $ | 6,477 | ||||||
We account for forfeitures of plan based awards as they occur. Share based compensation for the year ended December 29, 2018, excludes $8.2 million of compensation recorded related to the acceleration of RSU awards held by certain executive officers and the Board of Directors of Xcerra because of the change in control. This non-cash expense has been included in restructuring charges in our consolidated statements of operations for the year ended December 28, 2019.
At December 28, 2019, we had approximately $18.7 million of pre-tax unrecognized compensation cost related to unvested restricted stock units and performance stock units which is expected to be recognized over a weighted-average period of approximately 2.2 years.
|
COHU, INC. NOTES TO CONSOLIDATED FINANCIAL STATEMENTS |
|
7. |
Financial Instruments Measured at Fair Value |
Our cash, cash equivalents, and short-term investments consisted primarily of cash and other investment grade securities. We do not hold investment securities for trading purposes. All short-term investments, which are comprised entirely of short-term debt securities, are classified as available-for-sale and recorded at fair value. Investment securities are exposed to market risk due to changes in interest rates and credit risk and we monitor credit risk and attempt to mitigate exposure by making high-quality investments and through investment diversification.
Gains and losses on investments are calculated using the specific-identification method and are recognized during the period in which the investment is sold or when an investment experiences an other-than-temporary decline in value. Factors that could indicate an impairment exists include, but are not limited to earnings performance, changes in credit rating or adverse changes in the regulatory or economic environment of the asset. Gross realized gains and losses on sales of short-term investments are included in interest income. Realized gains and losses for the periods presented were not significant.
Investments that we have classified as short-term, by security type, are as follows (in thousands):
|
At December 28, 2019 |
||||||||||||||||
|
Gross |
Gross |
Estimated |
||||||||||||||
|
Amortized |
Unrealized |
Unrealized |
Fair |
|||||||||||||
|
Cost |
Gains |
Losses (1) |
Value |
|||||||||||||
|
Foreign government security |
$ | 904 | $ | - | $ | - | $ | 904 | ||||||||
|
At December 29, 2018 |
||||||||||||||||
|
Gross |
Gross |
Estimated |
||||||||||||||
|
Amortized |
Unrealized |
Unrealized |
Fair |
|||||||||||||
|
Cost |
Gains |
Losses (1) |
Value |
|||||||||||||
|
Foreign government security |
$ | 560 | $ | - | $ | - | $ | 560 | ||||||||
|
(1) |
As of December 28, 2019 and December 29, 2018 we had no investments with loss positions. |
Effective maturities of short-term investments at December 28, 2019, were as follows:
|
Amortized |
Estimated |
|||||||
|
(in thousands) |
Cost |
Fair Value |
||||||
|
Due after one year through three years |
$ | 904 | $ | 904 | ||||
Accounting standards pertaining to fair value measurements establish a three-tier fair value hierarchy, which prioritizes the inputs used in measuring fair value. These tiers include: Level 1, defined as observable inputs such as quoted prices in active markets; Level 2, defined as inputs other than quoted prices in active markets that are either directly or indirectly observable; and Level 3, defined as unobservable inputs in which little or no market data exists, therefore requiring an entity to develop its own assumptions. When available, we use quoted market prices to determine the fair value of our investments, and they are included in Level 1. When quoted market prices are unobservable, we use quotes from independent pricing vendors based on recent trading activity and other relevant information.
|
COHU, INC. NOTES TO CONSOLIDATED FINANCIAL STATEMENTS |
The following table summarizes, by major security type, our financial instruments that are measured at fair value on a recurring basis and are categorized using the fair value hierarchy (in thousands):
|
Fair value measurements at December 28, 2019 using: |
||||||||||||||||
|
Total estimated |
||||||||||||||||
|
Level 1 |
Level 2 |
Level 3 |
fair value |
|||||||||||||
|
Cash |
$ | 147,523 | $ | - | $ | - | $ | 147,523 | ||||||||
|
Money market funds |
- | 7,671 | - | 7,671 | ||||||||||||
|
Foreign government security |
- | 904 | - | 904 | ||||||||||||
| $ | 147,523 | $ | 8,575 | $ | - | $ | 156,098 | |||||||||
|
Fair value measurements at December 29, 2018 using: |
||||||||||||||||
|
Total estimated |
||||||||||||||||
|
Level 1 |
Level 2 |
Level 3 |
fair value |
|||||||||||||
|
Cash |
$ | 144,696 | $ | - | $ | - | $ | 144,696 | ||||||||
|
Money market funds |
- | 19,764 | - | 19,764 | ||||||||||||
|
Foreign government security |
- | 560 | - | 560 | ||||||||||||
| $ | 144,696 | $ | 20,324 | $ | - | $ | 165,020 | |||||||||
8. Income Taxes
Significant components of the provision (benefit) for income taxes for continuing operations are as follows:
|
(in thousands) |
2019 |
2018 |
2017 |
|||||||||
|
Current: |
||||||||||||
|
U.S. Federal |
$ | - | $ | - | $ | 12 | ||||||
|
U.S. State |
130 | 51 | 18 | |||||||||
|
Foreign |
2,173 | 8,787 | 6,005 | |||||||||
|
Total current |
2,303 | 8,838 | 6,035 | |||||||||
|
Deferred: |
||||||||||||
|
U.S. Federal |
98 | 56 | (3,451 | ) | ||||||||
|
U.S. State |
1 | - | (481 | ) | ||||||||
|
Foreign |
(5,484 | ) | (8,263 | ) | 141 | |||||||
|
Total deferred |
(5,385 | ) | (8,207 | ) | (3,791 | ) | ||||||
| $ | (3,082 | ) | $ | 631 | $ | 2,244 | ||||||
Income (loss) before income taxes from continuing operations consisted of the following:
|
(in thousands) |
2019 |
2018 |
2017 |
|||||||||
|
U.S. |
$ | (72,669 | ) | $ | (42,682 | ) | $ | 1,430 | ||||
|
Foreign |
592 | 10,770 | 33,935 | |||||||||
|
Total |
$ | (72,077 | ) | $ | (31,912 | ) | $ | 35,365 | ||||
The Tax Act was enacted on December 22, 2017, and introduced significant changes to U.S. income tax law. Effective in 2018, the Tax Act reduced the U.S. statutory tax rate from 35% to 21% and created new taxes on certain foreign-sourced earnings and related-party payments, which are referred to as the global intangible low-taxed income (“GILTI”) tax and the base erosion and anti-abuse tax, respectively. In addition, in 2017 we were subject to a one-time transition tax on accumulated foreign subsidiary earnings not previously subject to U.S. income tax. The Tax Act also repealed the alternative minimum tax (AMT) effective January 1, 2018, and made changes to net operating loss provisions, expensing of certain assets and capitalization of research and development expense with such changes effective for 2018 and later years.
Due to the timing of the enactment and the complexity involved in applying the provisions of the Tax Act, the Company made reasonable estimates of the effects and recorded provisional amounts in our financial statements as of December 30, 2017 by applying the guidance in SAB 118 because we had not completed our accounting for these effects. During 2018, the Company completed the accounting for these effects. Except as described below under “One-time transition tax”, due to the valuation allowance against our deferred tax assets, there was no net change made in 2018 to our 2017 enactment-date provisional income tax.
|
COHU, INC. NOTES TO CONSOLIDATED FINANCIAL STATEMENTS |
Under GAAP, we are allowed to make an accounting policy election to either (i) treat taxes due on future U.S. inclusions in taxable income related to GILTI as a current-period expense when incurred or (ii) factor such amounts into a company’s measurement of its deferred taxes. We have elected to account for GILTI as a period cost.
One-time transition tax
The Tax Act required us to pay U.S. income taxes on accumulated foreign subsidiary earnings not previously subject to U.S. income tax at a rate of 15.5% to the extent of foreign cash and certain other net current assets and 8% on the remaining earnings. Foreign tax credits and net operating losses may be used to reduce this tax which is referred to as a transition or deemed repatriation tax.
In 2017 we recorded a provisional amount for our one-time transition tax liability of $16.6 million and used foreign tax credits and net operating losses to fully offset this liability. In 2018 the IRS and U.S. Treasury issued Notice 2018-29 that addresses certain aspects of the calculation of the transition tax (“Notice 2018-29”). Application of Notice 2018-29 resulted in an increase to our transition tax liability of approximately $5.1 million that was fully offset by net operating losses resulting in no net increase to income tax expense.
Deferred tax effects
The Tax Act reduces the U.S. statutory tax rate from 35% to 21% for years after 2017. Accordingly, we remeasured our deferred taxes as of December 30, 2017 to reflect the reduced rate that will apply in future periods when these deferred taxes are settled or realized. We recognized a deferred tax benefit of $4.0 million, net of a reduction in the related valuation allowance, to reflect the reduced U.S. tax rate and other effects of the Tax Act including the change in the life of NOL carryforwards from 20 years to indefinite.
Beginning in 2018, the Tax Act provides a 100% deduction for dividends received from 10-percent owned foreign corporations by U.S. corporate shareholders, subject to a one-year holding period. Although dividend income is now exempt from U.S. federal tax in the hands of U.S. corporate shareholders, we must still apply the guidance of ASC 740-30-25-18 to account for the tax consequences of outside basis differences and other tax impacts of their investments in non-U.S. subsidiaries.
Except for working capital requirements in certain foreign jurisdictions, we provide for all taxes, including withholding and other residual taxes, related to unremitted earnings of our foreign subsidiaries.
|
COHU, INC. NOTES TO CONSOLIDATED FINANCIAL STATEMENTS |
Deferred income taxes reflect the net tax effects of temporary differences between the carrying amounts of assets and liabilities for financial reporting and tax purposes. Significant components of our deferred tax assets and liabilities were as follows:
|
(in thousands) |
2019 |
2018 |
||||||
|
Deferred tax assets: |
||||||||
|
Inventory, receivable and warranty reserves |
$ | 11,896 | $ | 12,560 | ||||
|
Net operating loss carryforwards |
69,096 | 65,587 | ||||||
|
Tax credit carryforwards |
36,489 | 34,251 | ||||||
|
Accrued employee benefits |
4,685 | 5,134 | ||||||
|
Stock-based compensation |
2,372 | 2,108 | ||||||
|
Lease liabilities |
7,890 | - | ||||||
|
Other |
7,885 | 7,827 | ||||||
|
Gross deferred tax assets |
140,313 | 127,467 | ||||||
|
Less valuation allowance |
(93,498 | ) | (84,718 | ) | ||||
|
Total deferred tax assets |
46,815 | 42,749 | ||||||
|
Deferred tax liabilities: |
||||||||
|
Depreciation and fixed asset related |
948 | 3,156 | ||||||
|
Intangible assets and other acquisition basis differences |
62,325 | 70,415 | ||||||
|
Operating lease right-of-use assets |
7,504 | - | ||||||
|
Unremitted earnings of foreign subsidiaries |
2,462 | 5,257 | ||||||
|
Total deferred tax liabilities |
73,239 | 78,828 | ||||||
|
Net deferred tax liabilities |
$ | (26,424 | ) | $ | (36,079 | ) | ||
Companies are required to assess whether a valuation allowance should be recorded against their deferred tax assets (“DTAs”) based on the consideration of all available evidence, using a “more likely than not” realization standard. The four sources of taxable income that must be considered in determining whether DTAs will be realized are, (1) future reversals of existing taxable temporary differences (i.e. offset of gross deferred tax assets against gross deferred tax liabilities); (2) taxable income in prior carryback years, if carryback is permitted under the tax law; (3) tax planning strategies and (4) future taxable income exclusive of reversing temporary differences and carryforwards.
In assessing whether a valuation allowance is required, significant weight is to be given to evidence that can be objectively verified. We have evaluated our DTAs each reporting period, including an assessment of our cumulative income or loss over the prior three-year period and future periods, to determine if a valuation allowance was required. A significant negative factor in our assessment was Cohu's three-year cumulative loss history at the end of various fiscal periods including 2019.
As a result of our cumulative, three-year U.S. GAAP pretax loss from continuing operations at the end of 2019 we were unable to conclude that it was “more likely than not” that our U.S. DTAs would be realized. We will evaluate the realizability of our DTAs at the end of each quarterly reporting period in 2020 and should circumstances change it is possible an additional valuation allowance will be recorded or the remaining valuation allowance, or a portion thereof, will be reversed in a future period.
Our valuation allowance on our DTAs at December 28, 2019, and December 29, 2018, was approximately $93.5 million and $84.7 million, respectively. The remaining gross DTAs for which a valuation allowance was not recorded are realizable primarily through future reversals of existing taxable temporary differences.
As the realization of DTAs is determined by tax jurisdiction, the deferred tax liabilities recorded by our non-U.S. subsidiaries were not a source of taxable income in assessing the realization of our DTAs in the U.S.
|
COHU, INC. NOTES TO CONSOLIDATED FINANCIAL STATEMENTS |
The reconciliation of income tax computed at the U.S. federal statutory tax rate to the provision (benefit) for income taxes for continuing operations is as follows:
|
(in thousands) |
2019 |
2018 |
2017 |
|||||||||
|
Tax provision at U.S. 21% statutory rate (35% in 2017) |
$ | (15,136 | ) | $ | (6,702 | ) | $ | 12,378 | ||||
|
Impact of Tax Act, before reduction in valuation allowance |
- | 5,095 | 12,397 | |||||||||
|
State income taxes, net of federal tax benefit |
(1,097 | ) | (663 | ) | 56 | |||||||
|
Settlements, adjustments and releases from statute expirations |
(1,204 | ) | (783 | ) | (1,731 | ) | ||||||
|
Federal tax credits |
(1,458 | ) | (864 | ) | (371 | ) | ||||||
|
Stock-based compensation |
587 | (838 | ) | (2,801 | ) | |||||||
|
Executive compensation limited by Section 162(m) |
190 | 3,456 | 246 | |||||||||
|
Change in valuation allowance |
11,270 | (2,015 | ) | (13,484 | ) | |||||||
|
Non-deductible transaction related costs |
- | 1,106 | 331 | |||||||||
|
GILTI |
2,480 | 3,531 | - | |||||||||
|
Foreign rate differential |
187 | (435 | ) | (4,866 | ) | |||||||
|
Other, net |
1,099 | (257 | ) | 89 | ||||||||
| $ | (3,082 | ) | $ | 631 | $ | 2,244 | ||||||
At December 28, 2019, including carryforwards from the Xcerra acquisition as described below, we had federal, state and foreign net operating loss carryforwards of approximately $246.9 million, $160.5 million and $25.1 million, respectively, that expire in various tax years beginning in 2020 through 2039 or have no expiration date. We also have federal and state tax credit carryforwards at December 28, 2019 of approximately $11.5 million and $31.6 million, respectively, certain of which expire in various tax years beginning in 2020 through 2039 or have no expiration date. The federal and state loss and credit carryforwards are subject to annual limitations under Sections 382 and 383 of the Internal Revenue Code and applicable state tax law. We believe the state tax credit is not likely to be realized in the foreseeable future.
The Company has completed a Section 382 and 383 analysis of the Internal Revenue Code and applicable state law, regarding the limitation of its net operating loss and business tax credit carryforwards as of December 28, 2019. As a result of the analysis, the Company concluded that the acquisition of Xcerra on October 1, 2018, triggered a limitation in the utilization of Xcerra’s net operating loss and research credit carryforwards. The Company has reduced its deferred tax assets related to the Xcerra U.S. net operating loss and credit carryforwards that are anticipated to expire unused as a result of ownership changes. These tax attributes have been excluded from deferred tax assets with a corresponding reduction of the valuation allowance with no net effect on the income tax provision or effective tax rate. The Company will continue to assess the realizability of these carryforwards in subsequent periods. Future changes in the ownership of Cohu could further limit the utilization of these carryforwards.
We have certain tax holidays with respect to our operations in Malaysia and the Philippines. These holidays require compliance with certain conditions and expire at various dates through 2027. The impact of these holidays was an increase in net income of approximately $2.1 million or $0.05 per share in 2019, $2.4 million, or $0.08 per share, in 2018 and $2.8 million, or $0.10 per share, in fiscal 2017.
A reconciliation of our gross unrecognized tax benefits, excluding accrued interest and penalties, is as follows:
|
(in thousands) |
2019 |
2018 |
2017 |
|||||||||
|
Balance at beginning of year |
$ | 34,701 | $ | 10,321 | $ | 10,075 | ||||||
|
Additions for tax positions of current year |
1,231 | 524 | 200 | |||||||||
|
Additions (reductions) for tax positions of prior years |
(484 | ) | 191 | 58 | ||||||||
|
Reductions due to lapse of the statute of limitations |
(957 | ) | (645 | ) | (1,148 | ) | ||||||
|
Additions related to Xcerra and Kita acquisitions |
- | 24,352 | 900 | |||||||||
|
Reductions due to settlements |
(30 | ) | - | - | ||||||||
|
Foreign exchange rate impact |
104 | (42 | ) | 236 | ||||||||
|
Balance at end of year |
$ | 34,565 | $ | 34,701 | $ | 10,321 | ||||||
|
COHU, INC. NOTES TO CONSOLIDATED FINANCIAL STATEMENTS |
If the unrecognized tax benefits at December 28, 2019 are ultimately recognized, excluding the impact of U.S. tax benefits netted against deferred taxes that are subject to a valuation allowance, approximately $7.0 million ($8.2 million at December 29, 2018) would result in a reduction in our income tax expense and effective tax rate. It is reasonably possible that our gross unrecognized tax benefits as of December 28, 2019, could decrease in 2020 by approximately $0.4 million as a result of the expiration of certain statutes of limitations.
We recognize interest and penalties related to unrecognized tax benefits in income tax expense. Cohu had approximately $1.3 million and $1.5 million accrued for the payment of interest and penalties at December 28, 2019, and December 29, 2018, respectively. Interest expense, net of accrued interest reversed, was $(0.3) million in 2019, $0.6 million in 2018 and $(0.3) million in 2017.
Our U.S. federal and state income tax returns for years after 2015 and 2014, respectively, remain open to examination, subject to the statute of limitations. Net operating loss and credit carryforwards arising prior to these years are also open to examination if and when utilized. The statute of limitations for the assessment and collection of income taxes related to our foreign tax returns varies by country. In the foreign countries where we have significant operations these time periods generally range from four to ten years after the year for which the tax return is due or the tax is assessed. Our German subsidiaries income tax returns for 2012 to 2016 are currently under routine examination by tax authorities in Germany. Our Philippines subsidiary income tax return for 2017 is currently under routine examination by the Bureau of Internal Revenue. The examination of our Japan subsidiary income tax returns for 2017 and 2018 was concluded in 2019.
9. Segment and Geographic Information
We applied the provisions of ASC Topic 280, Segment Reporting, (“ASC 280”), which sets forth a management approach to segment reporting and establishes requirements to report selected segment information quarterly and to report annually entity-wide disclosures about products, major customers and the geographies in which the entity holds material assets and reports revenue. An operating segment is defined as a component that engages in business activities whose operating results are reviewed by the chief operating decision maker and for which discrete financial information is available. After the acquisition of Xcerra on October 1, 2018, we determined that our four identified operating segments are: Test Handler Group (THG), Semiconductor Tester Group (STG), Interface Solutions Group (ISG) and PCB Test Group (PTG). Our THG, STG and ISG operating segments qualify for aggregation under ASC 280 due to similarities in their customers, their economic characteristics, and the nature of products and services provided. As a result, we report in two segments, Semiconductor Test & Inspection and PCB Test.
|
(in thousands) |
2019 |
2018 |
2017 |
|||||||||
|
Net sales by segment: |
||||||||||||
|
Semiconductor Test & Inspection |
$ | 540,878 | $ | 443,276 | $ | 352,704 | ||||||
|
PCB Test |
42,451 | 8,492 | - | |||||||||
|
Total consolidated net sales for reportable segments |
$ | 583,329 | $ | 451,768 | $ | 352,704 | ||||||
|
Segment profit (loss) before tax: |
||||||||||||
|
Semiconductor Test & Inspection |
$ | (45,072 | ) | $ | 2,489 | $ | 42,535 | |||||
|
PCB Test |
2,635 | (5,154 | ) | - | ||||||||
|
Profit (loss) for reportable segments |
(42,437 | ) | (2,665 | ) | 42,535 | |||||||
|
Other unallocated amounts: |
||||||||||||
|
Corporate expenses |
(9,848 | ) | (25,457 | ) | (7,787 | ) | ||||||
|
Interest expense |
(20,556 | ) | (4,977 | ) | (54 | ) | ||||||
|
Interest income |
764 | 1,187 | 671 | |||||||||
|
Income (loss) from continuing operations before taxes |
$ | (72,077 | ) | $ | (31,912 | ) | $ | 35,365 | ||||
|
COHU, INC. NOTES TO CONSOLIDATED FINANCIAL STATEMENTS |
|
(in thousands) |
2019 |
2018 |
2017 |
|||||||||
|
Depreciation and amortization by segment deducted in arriving at profit (loss): |
||||||||||||
|
Semiconductor Test & Inspection |
$ | 56,621 | $ | 24,634 | $ | 9,195 | ||||||
|
PCB Test |
2,250 | 1,413 | - | |||||||||
|
Total depreciation and amortization for reportable segments |
$ | 58,871 | $ | 26,047 | $ | 9,195 | ||||||
|
Capital expenditures by segment: |
||||||||||||
|
Semiconductor Test & Inspection |
$ | 17,831 | $ | 4,957 | $ | 6,093 | ||||||
|
PCB Test |
169 | 10 | - | |||||||||
|
Total consolidated capital expenditures |
$ | 18,000 | $ | 4,967 | $ | 6,093 | ||||||
|
(in thousands) |
2019 |
2018 |
2017 |
|||||||||
|
Total assets by segment: |
||||||||||||
|
Semiconductor Test & Inspection |
$ | 998,756 | $ | 1,038,053 | $ | 368,158 | ||||||
|
PCB Test |
56,938 | 57,762 | - | |||||||||
|
Total assets for reportable segments |
1,055,694 | 1,095,815 | 368,158 | |||||||||
|
Corporate, principally cash and investments |
18,398 | 34,367 | 52,299 | |||||||||
|
Discontinued operations |
3,618 | 3,820 | - | |||||||||
|
Total consolidated assets |
$ | 1,077,710 | $ | 1,134,002 | $ | 420,457 | ||||||
|
COHU, INC. NOTES TO CONSOLIDATED FINANCIAL STATEMENTS |
During the last three years, the following customers of our Semiconductor Test & Inspection segment that comprised 10% or greater of our consolidated net sales were as follows:
|
2019 |
2018 |
2017 |
||||||||||
|
Intel |
11.1 | % | ** | 11.2 | % | |||||||
|
NXP Semiconductors N.V. |
* | ** | 15.9 | % | ||||||||
|
* Less than 10% of consolidated net sales. |
||||||
|
**No single customer exceeded 10% of consolidated net sales for the year ended December 29, 2018. |
No customer of our PCB Test segment exceeded 10% of consolidated net sales for the years ended December 28, 2019 and December 29, 2018.
Net sales to customers, attributed to countries based on product shipment destination, were as follows:
|
(in thousands) |
2019 |
2018 |
2017 |
|||||||||
|
China |
$ | 118,213 | $ | 90,255 | $ | 82,474 | ||||||
|
Malaysia |
61,826 | 61,793 | 80,102 | |||||||||
|
United States |
71,963 | 61,177 | 38,729 | |||||||||
|
Philippines |
51,683 | 46,421 | 26,268 | |||||||||
|
Taiwan |
75,725 | 25,074 | 16,517 | |||||||||
|
Rest of the World |
203,919 | 167,048 | 108,614 | |||||||||
|
Total, net |
$ | 583,329 | $ | 451,768 | $ | 352,704 | ||||||
Geographic location of our property, plant and equipment and other long-lived assets was as follows:
|
(in thousands) |
2019 |
2018 |
||||||
|
Property, plant and equipment: |
||||||||
|
Germany |
$ | 25,234 | $ | 21,655 | ||||
|
United States |
16,671 | 20,417 | ||||||
|
Japan |
9,964 | 11,905 | ||||||
|
Malaysia |
7,151 | 10,535 | ||||||
|
Philippines |
8,637 | 5,842 | ||||||
|
Rest of the World |
3,255 | 3,978 | ||||||
|
Total, net |
$ | 70,912 | $ | 74,332 | ||||
|
Goodwill and other intangible assets: |
||||||||
|
Germany |
$ | 228,476 | $ | 249,605 | ||||
|
United States |
207,642 | 228,022 | ||||||
|
Malaysia |
44,140 | 43,569 | ||||||
|
Singapore |
13,915 | 15,173 | ||||||
|
Switzerland |
8,190 | 11,604 | ||||||
|
Japan |
3,872 | 4,138 | ||||||
|
Rest of the World |
7,453 | 8,977 | ||||||
|
Total, net |
$ | 513,688 | $ | 561,088 | ||||
10. Leases
We lease certain of our facilities, equipment and vehicles under non-cancelable operating and finance leases. Leases with initial terms with 12 months or less are not recorded in the consolidated balance sheet, but we recognized those lease payments in the consolidated statements of operations on a straight-line basis over the lease term. Lease and non-lease components are included in the calculation of the ROU asset and lease liabilities.
Our leases have remaining lease terms ranging from 1 year to 38 years, some of which include one or more options to extend the lease for up to 25 years. Our lease term includes renewal terms when we are reasonably certain that we will exercise the renewal options. We sublease certain leased assets to third parties, mainly as a result of unused space in our facilities.
|
COHU, INC. NOTES TO CONSOLIDATED FINANCIAL STATEMENTS |
Supplemental balance sheet information related to leases was as follows:
|
December 28, |
|||||
|
(in thousands) |
Classification |
2019 |
|||
|
Assets |
|||||
|
Operating lease assets |
Operating lease right-of-use assets |
$ | 33,269 | ||
|
Finance lease assets |
Property, plant and equipment, net (1) |
2,515 | |||
|
Total lease assets |
$ | 35,784 | |||
|
Liabilities |
|||||
|
Current |
|||||
|
Operating |
Other accrued liabilities |
$ | 5,458 | ||
|
Finance |
Other accrued liabilities |
2,574 | |||
|
Noncurrent |
|||||
|
Operating |
Long-term lease liabilities |
28,877 | |||
|
Total lease liabilities |
$ | 36,909 | |||
|
Weighted-average remaining lease term (years) |
|||||
|
Operating leases |
7.9 | ||||
|
Finance leases |
0.5 | ||||
|
Weighted-average discount rate |
|||||
|
Operating leases |
6.3 | % | |||
|
Finance leases |
4.5 | % | |||
|
(1) |
Finance lease assets are recorded net of accumulated amortization of $0.1 million. |
The components of lease expense were as follows:
|
December 28, |
||||
|
(in thousands) |
2019 |
|||
|
Operating leases (1) |
$ | 8,525 | ||
|
Variable lease expense |
2,318 | |||
|
Short-term operating leases |
256 | |||
|
Finance leases |
||||
|
Amortization of leased assets |
102 | |||
|
Interest on lease liabilities |
146 | |||
|
Sublease income |
(133 | ) | ||
|
Net lease cost |
$ | 11,214 | ||
|
(1) |
Operating lease cost excludes impairment expense of $0.2 million related to the write-down of the Fontana facility right-of-use asset. |
Prior to adoption of ASC ASU 2016-02, Leases, rental expense was $4.8 million and $3.6 million in 2018 and 2017. The increase in rental expense was a result of the acquisition of Xcerra on October 1, 2018.
|
COHU, INC. NOTES TO CONSOLIDATED FINANCIAL STATEMENTS |
Future minimum lease payments at December 28, 2019, are as follows:
|
Operating |
Finance |
|||||||||||
|
(in thousands) |
leases (1) |
leases |
Total |
|||||||||
|
2020 |
$ | 7,383 | $ | 2,631 | $ | 10,014 | ||||||
|
2021 |
6,090 | - | 6,090 | |||||||||
|
2022 |
5,535 | - | 5,535 | |||||||||
|
2023 |
4,987 | - | 4,987 | |||||||||
|
2024 |
4,692 | - | 4,692 | |||||||||
|
Thereafter |
16,314 | - | 16,314 | |||||||||
|
Total lease payments |
45,001 | 2,631 | 47,632 | |||||||||
|
Less: Interest |
(10,666 | ) | (57 | ) | (10,723 | ) | ||||||
|
Present value of lease liabilities |
$ | 34,335 | $ | 2,574 | $ | 36,909 | ||||||
|
(1) |
Excludes sublease income of $0.1 million in both 2020 and 2021 and also excludes $0.1 million of legally binding minimum lease payments for lease signed but not yet commenced. |
Supplemental cash flow information related to leases was as follows:
|
December 28, |
||||
|
(in thousands) |
2019 |
|||
|
Cash paid for amounts included in the measurement of lease liabilities: |
||||
|
Operating cash flows from operating leases |
$ | 6,932 | ||
|
Operating cash flows from finance leases |
$ | 117 | ||
|
Financing cash flows from finance leases |
$ | 34 | ||
|
Leased assets obtained in exchange for new operating lease liabilities |
$ | 40,488 | ||
|
11. |
Commitments and Contingencies |
From time-to-time we are involved in various legal proceedings, examinations by various tax authorities and claims that have arisen in the ordinary course of our business. The outcome of any litigation is inherently uncertain. While there can be no assurance, at the present time we do not believe that the resolution of the matters described above will have a material adverse effect on our assets, financial position or results of operations.
|
12. |
Guarantees |
Accrued Warranty
Changes in accrued warranty during the three-year period ended December 28, 2019, was as follows:
|
(in thousands) |
2019 |
2018 |
2017 |
|||||||||
|
Beginning balance |
$ | 8,014 | $ | 4,849 | $ | 4,350 | ||||||
|
Warranty accruals |
6,714 | 7,154 | 6,765 | |||||||||
|
Warranty payments |
(8,573 | ) | (8,358 | ) | (6,316 | ) | ||||||
|
Warranty liability assumed |
- | 4,369 | 50 | |||||||||
|
Ending balance |
$ | 6,155 | $ | 8,014 | $ | 4,849 | ||||||
Accrued warranty amounts expected to be incurred after one year are included in noncurrent other accrued liabilities in the consolidated balance sheet. These amounts totaled $0.3 million and $0.2 million at December 28, 2019 and December 29, 2018, respectively.
|
13. |
Discontinued Operations |
Fixtures Services Business (“FSG”)
On October 1, 2018, we acquired a fixtures services business as part of Xcerra. In the fourth quarter of 2018, our management determined that this business did not align with our core business and was not a strategic fit within our organization. As a result, the fixtures services business has been marketed for sale since we acquired Xcerra on October 1, 2018 and it has been presented as discontinued operation. For financial statement purposes, the results of operations for this business have been segregated from those of continuing operations and are presented in our consolidated financial statements as discontinued operations for the years ended December 28, 2019 and December 29, 2018.
|
COHU, INC. NOTES TO CONSOLIDATED FINANCIAL STATEMENTS |
In February 2020, we completed the sale of this business which generated a charge of $1.1 million, taken in the fourth quarter of 2019, as a result of the impairment of goodwill and purchased intangible assets associated with this operating segment. The goodwill and purchased intangible assets were not pushed down in consolidation and had previously been presented as part of our Semiconductor Test & Inspection segment.
Balance sheet information for our fixtures services business presented as discontinued operations is summarized as follows (in thousands):
|
December 28, |
December 29, |
|||||||
|
2019 |
2018 |
|||||||
|
Assets: |
||||||||
|
Cash |
$ | 736 | $ | 461 | ||||
|
Accounts receivable, net |
1,316 | 1,718 | ||||||
|
Inventories |
1,411 | 1,388 | ||||||
|
Other current assets |
40 | 174 | ||||||
|
Total current assets |
3,503 | 3,741 | ||||||
|
Property, plant and equipment, net |
33 | 66 | ||||||
|
Other noncurrent assets |
82 | 13 | ||||||
|
Total assets |
$ | 3,618 | $ | 3,820 | ||||
|
Liabilities: |
||||||||
|
Other accrued current liabilities |
$ | 599 | $ | 518 | ||||
|
Total current liabilities |
599 | 518 | ||||||
|
Noncurrent liabilities |
24 | - | ||||||
|
Total liabilities |
$ | 623 | $ | 518 | ||||
|
COHU, INC. NOTES TO CONSOLIDATED FINANCIAL STATEMENTS |
Operating results of our discontinued operations are summarized as follows (in thousands):
|
December 28, |
December 29, |
December 30, |
||||||||||
|
2019 |
2018 |
2017 |
||||||||||
|
Net sales |
$ | 6,136 | $ | 1,593 | $ | - | ||||||
|
Operating income |
$ | 478 | $ | 157 | $ | - | ||||||
|
Loss from impairment of FSG |
(1,086 | ) | - | - | ||||||||
|
Loss from sale of BMS (1) |
- | - | (278 | ) | ||||||||
|
Income (loss) before taxes |
(608 | ) | 157 | (278 | ) | |||||||
|
Income tax provision |
89 | 38 | - | |||||||||
|
Income (loss), net of tax |
$ | (697 | ) | $ | 119 | $ | (278 | ) | ||||
|
(1) |
Represents the write-off of the contingent consideration receivable from the sale of Broadcast Microwave Services, Inc. |
|
14. |
Accumulated Other Comprehensive Loss |
Components of other comprehensive loss, on an after-tax basis, were as follows:
|
(in thousands) |
Before Tax amount |
Tax (Expense) Benefit |
Net of Tax Amount |
|||||||||
|
Year ended December 30, 2017 |
||||||||||||
|
Foreign currency translation adjustments |
$ | 11,345 | $ | - | $ | 11,345 | ||||||
|
Adjustments related to postretirement benefits |
(1,369 | ) | 121 | (1,248 | ) | |||||||
|
Change in unrealized gain/loss on investments |
(2 | ) | - | (2 | ) | |||||||
|
Other comprehensive income (loss) |
$ | 9,974 | $ | 121 | $ | 10,095 | ||||||
|
Year ended December 29, 2018 |
||||||||||||
|
Foreign currency translation adjustments |
$ | (8,905 | ) | $ | - | $ | (8,905 | ) | ||||
|
Adjustments related to postretirement benefits |
865 | (60 | ) | 805 | ||||||||
|
Change in unrealized gain/loss on investments |
7 | - | 7 | |||||||||
|
Other comprehensive income (loss) |
$ | (8,033 | ) | $ | (60 | ) | $ | (8,093 | ) | |||
|
Year ended December 28, 2019 |
||||||||||||
|
Foreign currency translation adjustments |
$ | (7,522 | ) | $ | - | $ | (7,522 | ) | ||||
|
Adjustments related to postretirement benefits |
(856 | ) | 228 | (628 | ) | |||||||
|
Other comprehensive income (loss) |
$ | (8,378 | ) | $ | 228 | $ | (8,150 | ) | ||||
Components of accumulated other comprehensive loss, net of tax, at the end of each period are as follows:
|
(in thousands) |
2019 |
2018 |
||||||
|
Accumulated net currency translation adjustments |
$ | (30,198 | ) | $ | (22,676 | ) | ||
|
Accumulated net adjustments related to postretirement benefits |
(3,832 | ) | (3,204 | ) | ||||
|
Total accumulated other comprehensive loss |
$ | (34,030 | ) | $ | (25,880 | ) | ||
|
15. |
Related Party Transactions |
At December 28, 2019 certain of our cash and short-term investments were held and managed by BlackRock, Inc. which owns 15.5% of our outstanding common stock as reported in its Form 13-G filing made with the Securities and Exchange Commission on February 4, 2020.
As part of Xcerra, we gained ownership interests in two companies that supply components and provide services to wholly owned subsidiaries of Xcerra. Multitest elektronische Systeme GmbH and atg-Luther & Maelzer GmbH of FTZ Fraes-und Technologiezentrum GmbH Frasdorf (“FTZ”) and ETZ Elektrisches Testzentrum fuer Leiterplatten GmbH (“ETZ”), respectively. FTZ, based in Germany, provides milling services and ETZ, which is also based in Germany, provides certain component parts. These investments are accounted for under the equity method and are not material to our consolidated balance sheets. During 2019, purchases of products from FTZ and ETZ were not material.
|
COHU, INC. NOTES TO CONSOLIDATED FINANCIAL STATEMENTS |
|
16. |
Quarterly Financial Data (Unaudited) |
|
Quarter |
First (a) |
Second (a) |
Third (a) |
Fourth (a) |
Year |
|||||||||||||||||
|
(in thousands, except per share data) |
||||||||||||||||||||||
|
Net sales: |
2019 |
$ | 147,809 | $ | 150,011 | $ | 143,498 | $ | 142,011 | $ | 583,329 | |||||||||||
|
2018 |
$ | 95,150 | $ | 99,817 | $ | 86,164 | $ | 170,637 | $ | 451,768 | ||||||||||||
|
Cost of sales: |
2019 |
(b) |
$ | 93,394 | $ | 87,605 | $ | 84,565 | $ | 87,936 | $ | 353,500 | ||||||||||
|
2018 |
(b) |
$ | 54,923 | $ | 57,677 | $ | 51,142 | $ | 128,718 | $ | 292,460 | |||||||||||
|
Income (loss) from continuing operations |
2019 |
$ | (22,851 | ) | $ | (19,383 | ) | $ | (10,480 | ) | $ | (16,281 | ) | $ | (68,995 | ) | ||||||
|
|
2018 |
$ | 8,122 | $ | 11,648 | $ | 4,803 | $ | (57,116 | ) | $ | (32,543 | ) | |||||||||
|
Net income (loss) |
2019 |
$ | (22,687 | ) | $ | (19,359 | ) | $ | (10,326 | ) | $ | (17,320 | ) | $ | (69,692 | ) | ||||||
|
2018 |
$ | 8,122 | $ | 11,648 | $ | 4,803 | $ | (56,997 | ) | $ | (32,424 | ) | ||||||||||
|
Net income (loss) attributable to Cohu |
2019 |
$ | (22,643 | ) | $ | (19,323 | ) | $ | (10,468 | ) | $ | (17,266 | ) | $ | (69,700 | ) | ||||||
|
|
2018 |
$ | 8,122 | $ | 11,648 | $ | 4,803 | $ | (56,754 | ) | $ | (32,181 | ) | |||||||||
|
Income (loss) per share attributable to Cohu (c): |
||||||||||||||||||||||
|
Basic: |
||||||||||||||||||||||
|
Income (loss) from continuing operations |
2019 |
$ | (0.56 | ) | $ | (0.47 | ) | $ | (0.25 | ) | $ | (0.39 | ) | $ | (1.68 | ) | ||||||
|
|
2018 |
$ | 0.28 | $ | 0.40 | $ | 0.17 | $ | (1.40 | ) | $ | (1.02 | ) | |||||||||
|
Net income (loss) |
2019 |
$ | (0.55 | ) | $ | (0.47 | ) | $ | (0.25 | ) | $ | (0.42 | ) | $ | (1.69 | ) | ||||||
|
2018 |
$ | 0.28 | $ | 0.40 | $ | 0.17 | $ | (1.40 | ) | $ | (1.01 | ) | ||||||||||
|
Diluted: |
||||||||||||||||||||||
|
Income (loss) from continuing operations |
2019 |
$ | (0.56 | ) | $ | (0.47 | ) | $ | (0.25 | ) | $ | (0.39 | ) | $ | (1.68 | ) | ||||||
|
|
2018 |
$ | 0.28 | $ | 0.39 | $ | 0.16 | $ | (1.40 | ) | $ | (1.02 | ) | |||||||||
|
Net income (loss) |
2019 |
$ | (0.55 | ) | $ | (0.47 | ) | $ | (0.25 | ) | $ | (0.42 | ) | $ | (1.69 | ) | ||||||
|
2018 |
$ | 0.28 | $ | 0.39 | $ | 0.16 | $ | (1.40 | ) | $ | (1.01 | ) | ||||||||||
|
(a) |
All quarters presented above were comprised of 13 weeks. We acquired Xcerra on October 1, 2018. The results of Xcerra have been included in our results of operations from the date of acquisition. See Note 2, “Business Acquisitions” for additional information regarding this transaction. Total operating expenses in 2019 and 2018 include acquisition costs and amounts related to the integration and our announced restructuring plan as follows. The fourth quarter of 2018 includes $19.1 million of inventory write-offs, $14.8 million of amortization of inventory step-up, and $18.7 million of restructuring charges. The first quarter of 2019 includes $6.0 million of amortization of inventory step-up. The second quarter of 2019 includes $8.5 million of restructuring charges. |
|
(b) |
Cost of sales is shown exclusive of the amortization of purchased intangible assets. |
|
(c) |
The sum of the four quarters may not agree to the year total due to rounding or losses within a quarter and the inclusion or exclusion of common stock equivalents. |
Report of Independent Registered Public Accounting Firm
To the Shareholders and the Board of Directors of Cohu, Inc.
Opinion on the Financial Statements
We have audited the accompanying consolidated balance sheets of Cohu, Inc. (the Company) as of December 28, 2019, and December 29, 2018, and the related consolidated statements of operations, comprehensive income (loss), stockholders’ equity, and cash flows for each of the three years in the period ended December 28, 2019, and the related notes and the financial statement schedule listed in the Index at Item 15(a) (collectively referred to as the “consolidated financial statements”). In our opinion, the consolidated financial statements present fairly, in all material respects, the consolidated financial position of the Company at December 28, 2019, and December 29, 2018, and the consolidated results of its operations and its cash flows for each of the three years in the period ended December 28, 2019, in conformity with U.S. generally accepted accounting principles.
We also have audited, in accordance with the standards of the Public Company Accounting Oversight Board (United States) (PCAOB), the Company’s internal control over financial reporting as of December 28, 2019, based on criteria established in Internal Control-Integrated Framework issued by the Committee of Sponsoring Organizations of the Treadway Commission (2013 framework) and our report dated March 10, 2020 expressed an unqualified opinion thereon.
Adoption of ASU No. 2016-02
As discussed in Note 1 to the consolidated financial statements, the Company changed its method of accounting for leases in 2019 due to the adoption of ASU No. 2016-02, Leases (Topic 842) and related amendments.
Basis for Opinion
These financial statements are the responsibility of the Company’s management. Our responsibility is to express an opinion on the Company’s financial statements based on our audits. We are a public accounting firm registered with the PCAOB and are required to be independent with respect to the Company in accordance with the U.S. federal securities laws and the applicable rules and regulations of the Securities and Exchange Commission and the PCAOB.
We conducted our audits in accordance with the standards of the PCAOB. Those standards require that we plan and perform the audit to obtain reasonable assurance about whether the financial statements are free of material misstatement, whether due to error or fraud. Our audits included performing procedures to assess the risks of material misstatement of the financial statements, whether due to error or fraud, and performing procedures that respond to those risks. Such procedures included examining, on a test basis, evidence regarding the amounts and disclosures in the financial statements. Our audits also included evaluating the accounting principles used and significant estimates made by management, as well as evaluating the overall presentation of the financial statements. We believe that our audits provide a reasonable basis for our opinion.
/s/ Ernst & Young LLP
We have served as the Company’s auditor since 1956
San Diego, California
March 10, 2020
|
Index to Exhibits |
|||
|
15. (b) |
The following exhibits are filed as part of, or incorporated into, the 2019 Cohu, Inc. Annual Report on Form 10-K: |
||
|
Exhibit No. |
Description |
||
|
2.1 |
|||
|
3.1 |
|||
|
3.2 |
|||
| 4.1 | Description of Capital Stock | ||
|
10.1 |
|||
|
10.2 |
|||
|
10.3 |
|||
|
10.4 |
|||
|
10.5 |
|||
|
10.6 |
|||
|
10.7 |
|||
|
10.8 |
|||
|
10.9 |
|||
|
10.10 |
|||
|
10.11 |
|||
|
10.12 |
|||
|
10.13 |
|||
|
10.14 |
|||
|
10.15 |
|||
|
10.16 |
|||
|
10.17 |
|||
|
21 |
|||
|
23 |
|||
|
31.1 |
Certification pursuant to Section 302(a) of the Sarbanes-Oxley Act of 2002 for Luis A. Müller |
||
|
31.2 |
Certification pursuant to Section 302(a) of the Sarbanes-Oxley Act of 2002 for Jeffrey D. Jones |
||
|
32.1 |
|||
|
32.2 |
|||
|
101.INS |
XBRL Instance Document |
||
|
101.SCH |
XBRL Taxonomy Extension Schema Document |
||
|
101.CAL |
XBRL Taxonomy Extension Calculation Linkbase Document |
||
|
101.DEF |
XBRL Taxonomy Extension Definition Linkbase Document |
||
|
101.LAB |
XBRL Taxonomy Extension Label Linkbase Document |
||
|
101.PRE |
XBRL Taxonomy Extension Presentation Linkbase Document |
||
|
* Management contract or compensatory plan or arrangement |
|||
Item 16. Form 10-K Summary.
None.
|
SIGNATURES |
|
Pursuant to the requirements of Section 13 or 15(d) of the Securities Exchange Act of 1934, the registrant has duly caused this report to be signed on its behalf by the undersigned, thereunto duly authorized. |
|
COHU, INC. |
||||||
|
Date: March 10, 2020 |
By: |
/s/ Luis A. Müller |
||||
|
Luis A. Müller |
||||||
|
President and Chief Executive Officer |
||||||
|
Pursuant to the requirements of the Securities Exchange Act of 1934, this report has been signed below by the following persons on behalf of the registrant and in the capacities and on the dates indicated. |
|
Signature |
Title |
Date |
||||
|
/s/ James A. Donahue |
Chairman of the Board, |
March 10, 2020 |
||||
|
James A. Donahue |
Director |
|||||
|
/s/ Luis A. Müller |
President and Chief Executive Officer, Director |
March 10, 2020 |
||||
|
Luis A. Müller |
(Principal Executive Officer) |
|||||
|
/s/ Jeffrey D. Jones |
Vice President, Finance and CFO |
March 10, 2020 |
||||
|
Jeffrey D. Jones |
(Principal Financial and Accounting Officer) |
|||||
|
/s/ William E. Bendush |
Director |
March 10, 2020 |
||||
|
William E. Bendush |
||||||
|
/s/ Steven J. Bilodeau |
Director |
March 10, 2020 |
||||
|
Steven J. Bilodeau |
||||||
|
/s/ Andrew M. Caggia |
Director |
March 10, 2020 |
||||
|
Andrew M. Caggia |
||||||
|
/s/ Lynne J. Camp |
Director |
March 10, 2020 |
||||
|
Lynne J. Camp |
||||||
|
/s/ Robert L. Ciardella |
Director |
March 10, 2020 |
||||
|
Robert L. Ciardella |
||||||
|
/s/ Nina L. Richardson |
Director |
March 10, 2020 |
||||
|
Nina L. Richardson |
||||||
|
/s/ Jorge L. Titinger |
Director |
March 10, 2020 |
||||
|
Jorge L. Titinger |
||||||
|
COHU, INC. |
|
SCHEDULE II |
|
VALUATION AND QUALIFYING ACCOUNTS |
|
(in thousands) |
|
Additions |
Additions |
|||||||||||||||||||
|
(Reductions) |
(Reductions) |
|||||||||||||||||||
|
Balance at |
Not |
Charged |
Balance |
|||||||||||||||||
|
Beginning |
Charged |
(Credited) |
Deductions/ |
at End |
||||||||||||||||
|
Description |
of Year |
to Expense |
to Expense |
Write-offs |
of Year |
|||||||||||||||
|
Allowance for doubtful accounts: |
||||||||||||||||||||
|
Year ended December 31, 2017 |
$ | 81 | $ | 174 | (1) | $ | 6 | $ | 61 | $ | 200 | |||||||||
|
Year ended December 30, 2018 |
$ | 200 | $ | (20 | ) (1) | $ | (109 | ) | $ | 31 | $ | 40 | ||||||||
|
Year ended December 28, 2019 |
$ | 40 | $ | 24 | (1) | $ | (28 | ) | $ | 27 | $ | 9 | ||||||||
|
Reserve for excess and obsolete inventories: |
||||||||||||||||||||
|
Year ended December 31, 2017 |
$ | 21,485 | $ | (1,165 | ) (1) | $ | 1,148 | $ | 4,106 | $ | 17,362 | |||||||||
|
Year ended December 29, 2018 |
$ | 17,362 | $ | (300 | ) (1) | $ | 10,783 | $ | 3,907 | $ | 23,938 | |||||||||
|
Year ended December 28, 2019 |
$ | 23,938 | $ | 1,285 | (1) | $ | 4,792 | $ | 9,057 | $ | 20,958 | |||||||||
|
All amounts presented above have been restated to exclude the impact of our discontinued operations. |
||||||||||||||
|
(1) Changes in reserve balances resulting from foreign currency impact and reclassifications from other reserves. |
||||||||||||||
83