Attached files
| file | filename |
|---|---|
| 8-K - 8-K - American Airlines Group Inc. | d875847d8k.htm |

American Airlines Group Inc. J.P. Morgan 2020 Industrials Conference March 10, 2020 Doug Parker Chairman and CEO Exhibit 99.1
Cautionary Statement Regarding Forward-Looking Statements and Information Certain of the statements contained in this report should be considered forward-looking statements within the meaning of the Securities Act of 1933, as amended (the Securities Act), the Securities Exchange Act of 1934, as amended (the Exchange Act), and the Private Securities Litigation Reform Act of 1995. These forward-looking statements may be identified by words such as “may,” “will,” “expect,” “intend,” “anticipate,” “believe,” “estimate,” “plan,” “project,” “could,” “should,” “would,” “continue,” “seek,” “target,” “guidance,” “outlook,” “if current trends continue,” “optimistic,” “forecast” and other similar words. Such statements include, but are not limited to, statements about our plans, objectives, expectations, intentions, estimates and strategies for the future, and other statements that are not historical facts. These forward-looking statements are based on our current objectives, beliefs and expectations, and they are subject to significant risks and uncertainties that may cause actual results and financial position and timing of certain events to differ materially from the information in the forward-looking statements. These risks and uncertainties include, but are not limited to, those set forth in our Annual Report on Form 10-K for the year ended December 31, 2019 (especially in Part I, Item 1A. Risk Factors and Part II, Item 7. Management’s Discussion and Analysis of Financial Condition and Results of Operations), and other risks and uncertainties listed from time to time in our other filings with the Securities and Exchange Commission. There may be other factors of which we are not currently aware that may affect matters discussed in the forward-looking statements and may also cause actual results to differ materially from those discussed. In particular, the consequences of the coronavirus outbreak to economic conditions and the travel industry in general and the financial position and operating results of our company in particular have been material, are changing rapidly, and cannot be predicted. We do not assume any obligation to publicly update or supplement any forward-looking statement to reflect actual results, changes in assumptions or changes in other factors affecting these forward-looking statements other than as required by law. Any forward-looking statements speak only as of the date hereof or as of the dates indicated in the statement.
COVID-19 Update The demand environment remains very fluid due to COVID-19 Suspended Q1 and FY 2020 guidance Taking action to lead through the uncertainty Load factor and demand Capacity changes Fuel and other costs Liquidity Customers and team
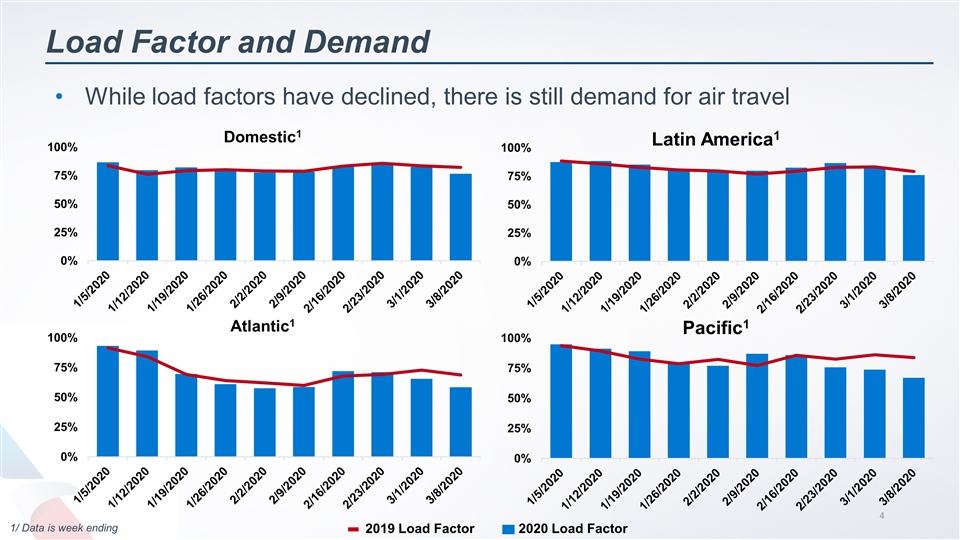
Load Factor and Demand While load factors have declined, there is still demand for air travel 2019 Load Factor 2020 Load Factor 1/ Data is week ending
Capacity Changes Capacity changes to date have been demand-based 10% reduction in international peak summer capacity vs. current schedule 55% reduction in trans-Pacific summer capacity Further international reductions subject to slot waivers 7.5% reduction in domestic capacity in April vs. current schedule American will continue to monitor the situation and take further actions if necessary
Fuel and Other Costs The decline in fuel price alone is expected to drive ~$3 billion1 in 2020 cost savings versus previous guidance Other expense actions: Aggressively reducing all costs related to capacity reductions Placing constraints on discretionary operating expenditures Reducing capital expenditures Use this opportunity to become a more efficient airline over the long term 1/ Fuel data as of March 9, 2020
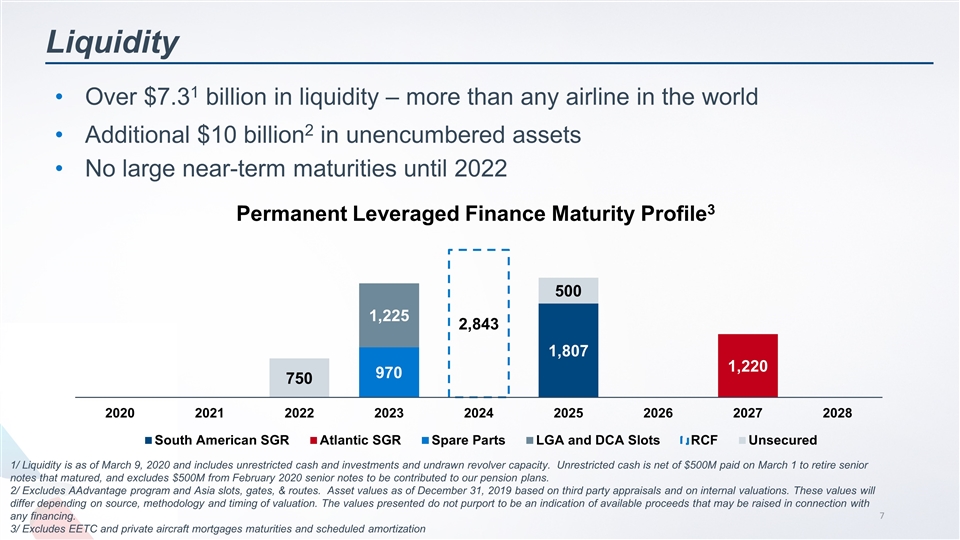
Liquidity Over $7.31 billion in liquidity – more than any airline in the world Additional $10 billion2 in unencumbered assets No large near-term maturities until 2022 1/ Liquidity is as of March 9, 2020 and includes unrestricted cash and investments and undrawn revolver capacity. Unrestricted cash is net of $500M paid on March 1 to retire senior notes that matured, and excludes $500M from February 2020 senior notes to be contributed to our pension plans. 2/ Excludes AAdvantage program and Asia slots, gates, & routes. Asset values as of December 31, 2019 based on third party appraisals and on internal valuations. These values will differ depending on source, methodology and timing of valuation. The values presented do not purport to be an indication of available proceeds that may be raised in connection with any financing. 3/ Excludes EETC and private aircraft mortgages maturities and scheduled amortization
Customers and Team Safety is the top priority Close contact with the CDC and other government agencies Flexibility for customers Safety and sanitation
Continued Focus on Long-Term Value While managing the near-term volatility, American remains focused on three areas of long-term value creation: Driving operational excellence Pursuing efficient and profitable growth Generating free cash flow
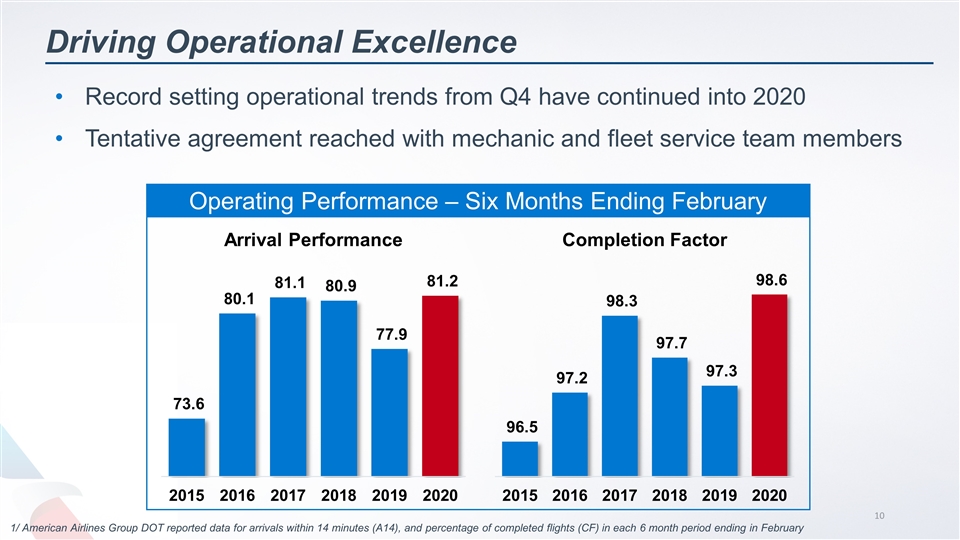
Driving Operational Excellence Record setting operational trends from Q4 have continued into 2020 Tentative agreement reached with mechanic and fleet service team members 1/ American Airlines Group DOT reported data for arrivals within 14 minutes (A14), and percentage of completed flights (CF) in each 6 month period ending in February Operating Performance – Six Months Ending February
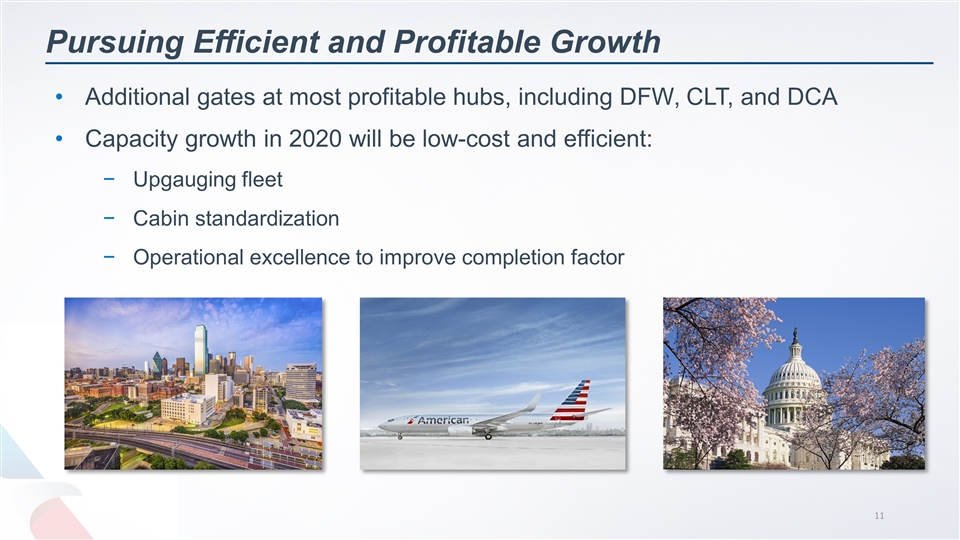
Pursuing Efficient and Profitable Growth Additional gates at most profitable hubs, including DFW, CLT, and DCA Capacity growth in 2020 will be low-cost and efficient: Upgauging fleet Cabin standardization Operational excellence to improve completion factor
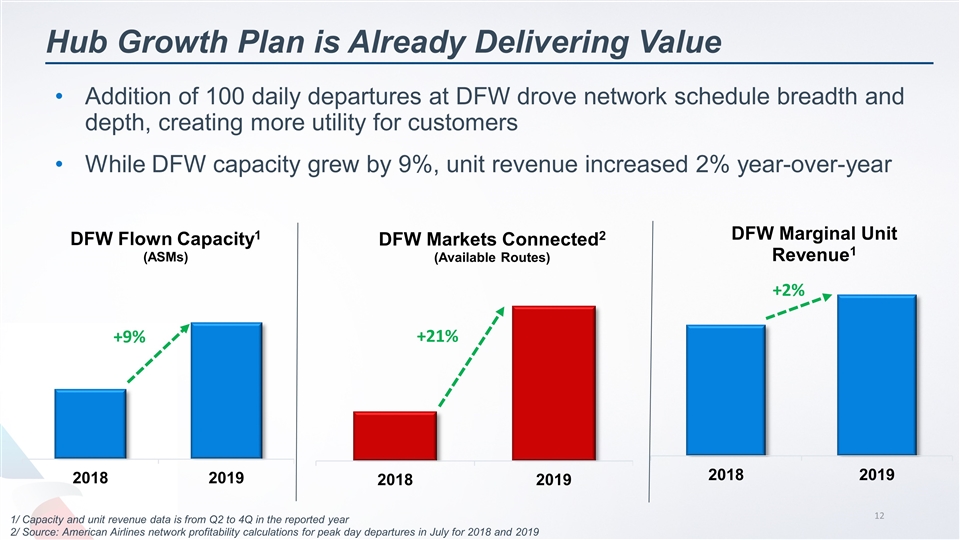
Hub Growth Plan is Already Delivering Value Addition of 100 daily departures at DFW drove network schedule breadth and depth, creating more utility for customers While DFW capacity grew by 9%, unit revenue increased 2% year-over-year 1/ Capacity and unit revenue data is from Q2 to 4Q in the reported year 2/ Source: American Airlines network profitability calculations for peak day departures in July for 2018 and 2019 +9% +2% +21%
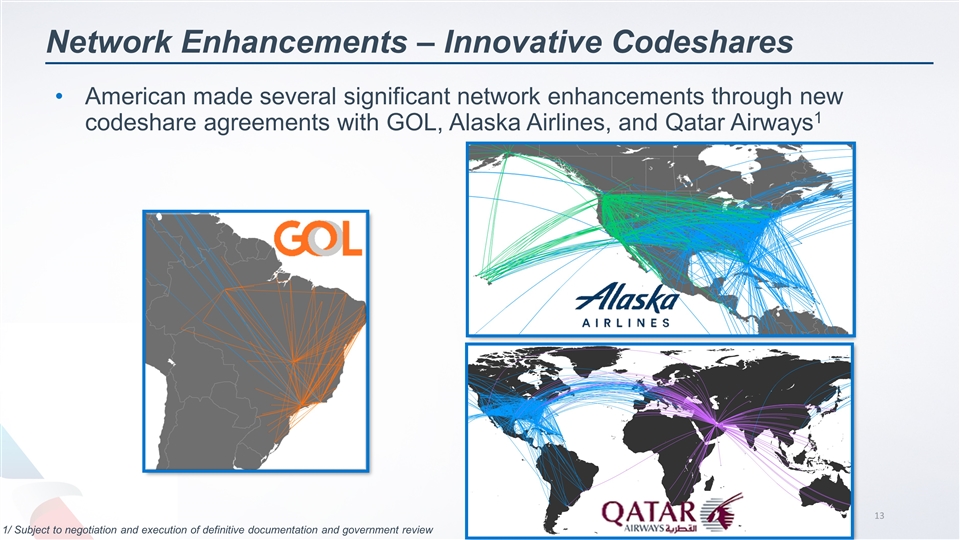
Network Enhancements – Innovative Codeshares American made several significant network enhancements through new codeshare agreements with GOL, Alaska Airlines, and Qatar Airways1 1/ Subject to negotiation and execution of definitive documentation and government review
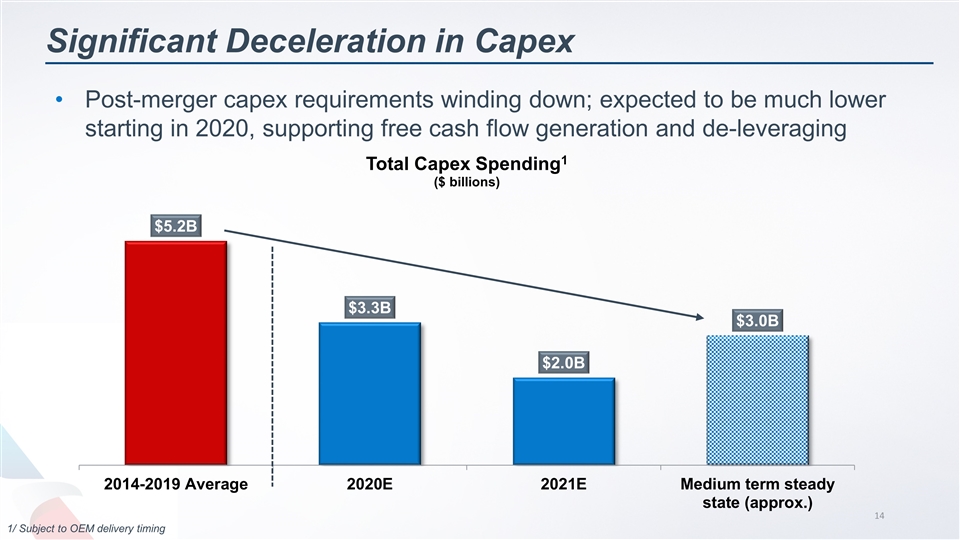
Significant Deceleration in Capex Post-merger capex requirements winding down; expected to be much lower starting in 2020, supporting free cash flow generation and de-leveraging 1/ Subject to OEM delivery timing
Conclusion COVID-19 has created uncertainty, but American is well-positioned to manage through it and will emerge in a better competitive position While managing the near-term, we remain focused on three key areas of value creation: Driving operational excellence Pursuing efficient and profitable growth Generating free cash flow

Questions?
