Attached files
| file | filename |
|---|---|
| EX-32.1 - Omega Flex, Inc. | ex32-1.htm |
| EX-31.2 - Omega Flex, Inc. | ex31-2.htm |
| EX-31.1 - Omega Flex, Inc. | ex31-1.htm |
| EX-23.1 - Omega Flex, Inc. | ex23-1.htm |
| EX-21.1 - Omega Flex, Inc. | ex21-1.htm |
| EX-10.21 - Omega Flex, Inc. | ex10-21.htm |
| EX-10.20 - Omega Flex, Inc. | ex10-20.htm |
| EX-10.17 - Omega Flex, Inc. | ex10-17.htm |
| EX-10.3 - Omega Flex, Inc. | ex10-3.htm |
| EX-10.2 - Omega Flex, Inc. | ex10-2.htm |
| EX-4.1 - Omega Flex, Inc. | ex4-1.htm |
UNITED STATES
SECURITIES AND EXCHANGE COMMISSION
Washington, D.C. 20549
FORM 10-K
(Mark One)
| [X] | ANNUAL REPORT PURSUANT TO SECTION 13 OR 15(d) OF THE SECURITIES EXCHANGE ACT OF 1934 |
For the fiscal year ended December 31, 2019
Or
| [ ] | TRANSITION REPORT PURSUANT TO SECTION 13 OR 15(d) OF THE SECURITIES EXCHANGE ACT OF 1934 |
For the transition period from ________________________ to ______________________
| Commission File Number | 000-51372 |
Omega Flex, Inc.
(Exact name of registrant as specified in its charter)
| Pennsylvania | 23-1948942 | |
| (State or other jurisdiction of | (I.R.S. Employer | |
| incorporation or organization) | Identification No.) | |
| 451 Creamery Way, Exton, PA | 19341 | |
| (Address of principal executive offices) | (Zip Code) |
| Registrant’s telephone number, including area code | 610-524-7272 |
Securities registered pursuant to Section 12(b) of the Act:
| Title of each class | Trading Symbol | Name of each exchange on which registered | ||
| Common | OFLX | NASDAQ Global Market |
Securities registered pursuant to section 12(g) of the Act:
Not applicable
(Title of class)
Indicate by check mark if the registrant is a well-known seasoned issuer, as defined in Rule 405 of the Securities Act. Yes [ ] No [X]
Indicate by check mark if the registrant is not required to file reports pursuant to Section 13 or Section 15(d) of the Act. Yes [ ] No [X]
Indicate by check mark whether the registrant (1) has filed all reports required to be filed by Section 13 or 15(d) of the Securities Exchange Act of 1934 during the preceding 12 months (or for such shorter period that the registrant was required to file such reports), and (2) has been subject to such filing requirements for the past 90 days. Yes [X] No [ ]
Indicate by check mark whether the registrant has submitted electronically every Interactive Data File required to be submitted pursuant to Rule 405 of Regulation S-T (§232.405 of this chapter) during the preceding 12 months (or for such shorter period that the registrant was required to submit such files). Yes [X] No [ ]
Indicate by check mark whether the registrant is a large accelerated filer, an accelerated filer, a non-accelerated filer, a smaller reporting company or an emerging growth company. See the definitions of “large accelerated filer,” and “accelerated filer”, “smaller reporting company” and “emerging growth company” in Rule 12b-2 of the Exchange Act. (check one):
| Large accelerated filer [ ] | Accelerated filer [X] | Non-accelerated filer [ ] | Smaller reporting company [ ] |
| Emerging Growth Company [ ] |
If an emerging growth company, indicate by check mark if the registrant has elected not to use the extended transition period for complying with any new or revised financial accounting standards provided pursuant to Section 13(a) of the Exchange Act Yes [ ] No [ ]
Indicate by check mark whether the registrant is a shell company (as defined in Rule 12b-2 of the Exchange Act). Yes [ ] No [X]
The aggregate market value of voting and non-voting common shares held by non-affiliates of the registrant as of June 28, 2019, the last business day of the second quarter of 2019, was $220,797,258.
The number of shares of common stock outstanding as of March 1, 2020 was 10,094,322.
DOCUMENTS INCORPORATED BY REFERENCE
The information required by Part III (Items 10, 11, 12, 13, and 14) is incorporated by reference from the registrant’s definitive proxy statement (to be filed pursuant to Regulation 14A no later than April 29, 2020) for the 2020 annual meeting of shareholders to be held on June 3, 2020.
Omega Flex, Inc.
TABLE OF CONTENTS
| -2- |
CAUTIONARY NOTE REGARDING FORWARD-LOOKING STATEMENTS
Certain statements in this Annual Report on Form 10-K that are not historical facts — but rather reflect our current expectations concerning future results and events — constitute forward-looking statements. The words “believes,” “expects,” “intends,” “plans,” “anticipates,” “intend,” “estimate,” “potential,” “continue,” “hopes,” “likely,” “will,” and similar expressions, or the negative of these terms, identify such forward-looking statements. Such forward-looking statements involve known and unknown risks, uncertainties and other important factors that could cause the actual results, performance or achievements of Omega Flex, Inc., or industry results, to differ materially from future results, performance or achievements expressed or implied by such forward-looking statements.
Readers are cautioned not to place undue reliance on these forward-looking statements, which reflect management’s view only as of the date of this annual report statement. We undertake no obligation to update the result of any revisions to these forward-looking statements which may be made to reflect events or circumstances after the date hereof or to reflect the occurrence of unanticipated events, conditions or circumstances.
GENERAL
DESCRIPTION OF OUR BUSINESS
Overview of the Company
The Company’s business is controlled as a single operating segment that consists of the manufacture and sale of flexible metal hose (also described as corrugated tubing), as well as the sale of the Company’s related proprietary fittings and a vast array of accessories.
The Company is a leading manufacturer of flexible metal hose, which is used in a variety of ways to carry gases and liquids within their particular applications. Some of the more prominent uses include:
| ● | carrying fuel gases within residential and commercial buildings; | |
| ● | carrying gasoline and diesel gasoline products (both above and below the ground) in a double containment piping to contain any possible leaks, which is used in automotive and marina refueling, and fueling for back-up generation; | |
| ● | using copper-alloy corrugated piping in medical or health care facilities to carry medical gases (oxygen, nitrogen, vacuum) or pure gases for pharmaceutical applications; and | |
| ● | industrial applications where the customer requires the piping to have both a degree of flexibility and/or an ability to carry corrosive compounds or mixtures, or to carry at both very high and very low (cryogenic) temperatures. |
The Company manufactures flexible metal hose at its facilities in Exton, Pennsylvania, and Houston, Texas in the United States, and in Banbury, Oxfordshire in the United Kingdom, and primarily sells its products through distributors, wholesalers and to original equipment manufacturers (“OEMs”) throughout North America and Europe, and to a lesser extent other global markets.
| -3- |
Industry Overview
The flexible metal hose industry is highly fragmented and diverse, with more than 10 companies producing flexible metal hose in the United States, and at least that many in Europe and Asia. Because of its simple and ubiquitous nature, flexible metal hose can be applied and has been applied to a number of different applications across a broad range of industries.
The major market categories for flexible metallic hose include (1) automotive, (2) aerospace, (3) residential, commercial, and institutional construction, and (4) general industrial. Omega Flex participates in the latter two markets for flexible metallic hose. The residential and commercial construction markets utilize corrugated stainless steel tubing (CSST) primarily for flexible gas piping, double containment piping for conveying diesel fuel and gasoline from a storage tank to a dispenser or back-up generator. The Company utilizes corrugated copper tubing for medical gases in medical care facilities, including hospitals, clinics, dental and veterinary offices and long-term care facilities. The general industrial market includes all of the processing industries, the most important of which include primary steel, petrochemical, pharmaceutical, and specialty applications for the transfer of fluids at both extremely low and high temperatures, (such as the conveying of cryogenic liquids) and a highly fragmented Original Equipment Manufacturers (OEM) market, as well as the maintenance and repair market.
None of our competitors appear to be dominant in more than one market. We are a leading supplier of flexible metal hose in each of the markets in which we participate. Our assessment of our overall competitive position is based on several factors. The flexible gas piping market in the U.S. is currently concentrated in the residential housing market. Based on the reports issued by the national trade groups on housing construction, the level of acceptance of flexible gas piping in the construction market, and the average usage of flexible gas piping in a residential building, we believe that we are able to estimate with a reasonable level of accuracy the size of the total gas piping market. In addition, the Company is a member of an industry trade group comprised of the largest manufacturers of CSST in the United States, which compiles and distributes sales volume statistics for its members relative to flexible gas piping. Based on our sales and the statistics described above, the Company believes it can estimate its position within that market. For other applications, industry trade groups collect and report data related to these markets, and we can then compare and estimate our status within that group as a whole. In addition, the customer base for the products that we sell, and the identity of the manufacturers aligned with those customers is fairly well known, which again allows the Company to extract information and estimate its market position. Lastly, the term “leading” implies a host of factors other than sales volume and market share position. It includes the range and capability of the product line, history of product development and new product launches, all of which information is in the public domain. Based on all of this information, the Company is reasonably confident that it is indeed a leader in the major market segments in which it participates.
Development of Business
Incorporated in 1975 under the name of Tofle America, Inc., the Company was originally established as the subsidiary of a Japanese manufacturer of flexible metal hose. For a number of years, we were a manufacturer of flexible metal hose that was sold primarily to customers using the hose for incorporation into finished assemblies for industrial applications. We later changed our name to Omega Flex, Inc., and in 1996, we were acquired by Mestek, Inc. (Mestek).
In January 2005, Mestek announced its intention to distribute its equity ownership in our common stock to the Mestek shareholders. A registration statement for the Omega Flex common stock was filed with the Securities and Exchange Commission and the registration statement was declared effective on July 22, 2005. We also listed our common stock on the NASDAQ National Market (now the NASDAQ Global Market) under the stock symbol “OFLX”, and began public trading of our common stock on August 1, 2005. All Mestek shareholders as of the record date for the distribution received one share of Omega Flex common stock for each share of Mestek common stock owned as of the record date. We are now a totally separate company from Mestek, and we do not use or share any material assets or services of Mestek in conducting our business.
Over the years, most of the Company’s business has been generated from Omega Flex, Inc., and concentrated in North America, but the Company also has foreign subsidiaries located in the United Kingdom, which are largely focused on European and other international markets. The Company also has a local subsidiary which owns the Company’s Exton, Pennsylvania real estate.
| -4- |
Overview of Current Business
Products
The Company’s business is managed as a single operating segment that consists of the manufacture and sale of flexible metal hose and accessories.
The Company has had the most success within the residential construction industry with its flexible gas piping products, TracPipe®, which was introduced in 1997, and its more robust counterpart TracPipe® CounterStrike®, which came to market in 2004. Partnered with the development of our AutoFlare® and AutoSnap® patented fittings and accessories, both have enjoyed wide acceptance due to their reliability and durability. Within the residential construction industry, the flexible gas piping products that we offer and similar products offered by our competitors have sought to overcome the use of black iron pipe that has traditionally been used by the construction industry in the United States and Canada for the piping of fuel gases within a building. Prior to the introduction of the first CSST system in 1989, nearly all construction in the United States and Canada used traditional black iron pipe for gas piping. However, the advantages of CSST in areas subject to high incidence and likelihood of seismic events had been first demonstrated in Japan. In seismic testing, the CSST was shown to withstand the stresses on a piping system created by the shifting and movement of an earthquake better than rigid pipe. The advantages of CSST over the traditional black iron pipe also include lower overall installation costs because it can be installed in long uninterrupted lines within the building.
The flexibility of the tube allows it to be bent by hand without any tools when a change in direction in the line is required. In contrast, black iron pipe requires that each bend in the pipe have a separate fitting attached. This requires the installer to thread the ends of the black iron pipe, apply an adhesive to the threads, and then screw on the fitting, all of which is labor intensive and costly, including testing and rework if the work is not done properly. As a result of these advantages, the Company estimates that CSST now commands slightly over one-half of the market for fuel gas piping in new and remodeled residential construction in the United States, and the use of rigid iron pipe, and to a lesser degree copper tubing, accounts for the remainder of the market. The Company plans to continue its growth trend by demonstrating its advantages against other technologies, in both the residential and commercial markets, in both the United States and overseas in geographic areas that have access to natural gas distribution systems.
In 2004, we introduced a new brand of flexible gas piping sold under the registered trademark “CounterStrike®”. CounterStrike® is designed to be more resistant to damage from transient electrical arcing. This feature is particularly desirable in areas that are subject to high levels of lightning strikes, such as the Southeast and Ohio Valley sections of the United States. In a lightning strike, the electrical energy of the lightning can energize all metal systems and components in a building. This electrical energy, in attempting to reach ground, may arc between metal systems that have different electrical resistance, and arcing can cause damage to the metal systems. In standard CSST systems, an electrical bond between the CSST and the building’s grounding electrode would address this issue, but lightning is an extremely powerful and unpredictable force. CounterStrike® CSST is designed to be electrically conductive and therefore disperse the energy of any electrical charge over the entire surface of the CounterStrike® line. In 2007, we introduced a new version of CounterStrike® CSST that was tested to be even more resistant to damage from electrical arcing than the original version, and substantially more effective than standard CSST products. As a result of its robust performance, the new version of CounterStrike® has been widely accepted in the market, and thus during 2011, the Company made the decision to sell exclusively CounterStrike® within the United States. This move demonstrated the Company’s commitment to innovation and safety, and further enhanced our leadership in the marketplace.
In 2008, the Company introduced its first double containment piping product – DoubleTrac®. DoubleTrac® double containment piping has earned stringent industry certifications for its ability to safely contain and convey liquid fuels. DoubleTrac® received certification from Underwriters Laboratory, the testing and approval agency, that our product is fully compliant with UL971A, which is the product standard in the United States for metallic underground fuel piping, ULc S667 which is the product standard in Canada for metallic underground fuel piping, as well as approvals from other relevant state agencies that have more stringent testing procedures for the product. Similar to our flexible gas piping, DoubleTrac® provides advantages over older rigid pipe technologies. DoubleTrac® is made and can be installed in long continuous runs, eliminating the need for manually assembling rigid pipe junctions at the end of a pipe or at a turn in direction. In addition, DoubleTrac® has superior performance in terms of its ability to safely convey fuel from the storage tank to the dispenser, primarily because DoubleTrac® is essentially a zero permeation piping system, far exceeding the most stringent government regulations. Originally designed for applications involving automotive fueling stations running from the storage tank to the fuel dispenser, the ability of DoubleTrac® to handle a variety of installation challenges has broadened its applications to include refueling at marinas, fuel lines for back-up generators, and corrosive liquids at waste treatment plants. In short, in applications where double containment piping is required to handle potentially contaminating fluids or corrosive fluids, DoubleTrac® is engineered to handle those demanding applications.
| -5- |
DEF-Trac®, a complementary product which is very similar to DoubleTrac®, was brought to the marketplace in 2011. DEF-Trac® piping is specifically engineered to handle the demanding requirements for diesel emissions fluid (DEF). Federal regulations require all diesel engines to use DEF to reduce the particulate contaminants from the diesel combustion process. However, DEF is highly corrosive and cannot be pre-mixed with the diesel fuel. This requires that new diesel trucks and automobiles must have separate tanks built into the vehicle so that the diesel emissions fluid can be injected into the catalytic converter after the point of combustion. Similarly, a large portion of fueling stations carrying diesel fuel are now also selling DEF through a separate dispenser. In addition to being highly corrosive, DEF also has a high freezing temperature, requiring a heat trace in the piping in applications in northern areas of the United States. DEF-Trac® flexible piping is uniquely suited to handle all of these challenges, as the stainless steel inner core is corrosion resistant, and DEF-Trac® also comes with options for heat trace that is extruded directly into the wall of the product. In summary, DEF-Trac® provides a complete solution to the demanding requirements of this unique application, as such, DEF-Trac® has been met with enormous acceptance from the industry that was searching for a solution to the new environmental requirement. The advantageous market position of DEF-Trac® has leveraged the penetration of DoubleTrac® into the broader market for automotive fueling applications.
In September 2013, the Company announced that it would be releasing a newly developed fitting, AutoSnap®, as part of its flexible gas piping product line. After successfully completing all required testing by independent testing agencies, as well as extensive field trials across the United States by trained TracPipe® CounterStrike® installers, AutoSnap® was officially introduced to the market in January 2014 to wide acceptance. With its patent-pending design, the product simplified the installation process, and addressed installer preferences for both speed and ease of installation. The AutoSnap® fitting now commands a significant portion of the Company’s fittings demand.
In 2019, the Company commercialized MediTrac®, corrugated medical tubing (“CMT”), following its 2018 launch with several beta sites. Developed for the healthcare industry, the product can be used in hospitals, ambulatory care centers, dental, physician and veterinary clinics, laboratories, and any facility that uses medical gas. Made from a copper alloy with an exterior fire-retardant jacket, MediTrac® is made and sold in long continuous-length rolls. MediTrac’s flexible nature and storage in rolls allows it t to be transported to and installed in health care facilities much more easily and quickly than traditional medical grade rigid copper pipe, which comes in 20 foot long sections. MediTrac® is unrolled from a spool and installed in a medical facility in one long continuous length, and is bent by hand when a change in direction is needed. The long lengths and ability to change direction with ease eliminates labor that would otherwise be needed to braze connections to straight sections of copper pipe or elbows or tees for changes in direction, while increasing installation efficiency and operational safety and minimizing downtime for healthcare facilities. Easy to assemble axial swaged brass fittings connect with all K, L and DWV medical tubing that is sized from ½” to 2” in diameter, and provides a leak-tight seal using ordinary hand tools. The patent-pending fitting also prevents tampering or disassembly through the use of a tamper-proof sleeve that is required by the Health Care Facilities Code (NFPA 99 – 2018 edition). Rated for 185 psig, MediTrac® can deliver the necessary volume of gas wherever it is needed across a facility. A recent case study comparing the installation of rigid copper pipe and MediTrac® showed that MediTrac® increases installation efficiency by a factor of five (i.e., a 500% increase in efficiency). By reducing the number of joints and brazed connections, MediTrac® also reduces possible contamination into the medical gas system along with the fire risk associated with brazing. . MediTrac® is currently listed to UL 1365 and has an ASTM E84 rating of 25/50, and meets all 2018 requirements of the Health Care Facilities Code (NFPA 99 – 2018).
| -6- |
In addition to the flexible gas piping and other previously described markets, our flexible metal hose is used in a wide variety of other applications. Our involvement in these markets is important because just as the flexible gas piping applications have sprung from our expertise in manufacturing annular metal hose, other applications may also evolve from our participation in the industry. Flexible metal hose is used in a wide variety of industrial and processing applications where the characteristics of the flexible hose in terms of its flexibility, and its ability to absorb vibration and thermal expansion and contraction, have substantial benefits over rigid piping. For example, in certain pharmaceutical processing applications, the process of developing the specific pharmaceutical may require rapid freezing of various compounds through the use of liquefied gases, such as liquefied nitrogen, helium or Freon. The use of flexible metal tubing is particularly appropriate in these types of applications. Flexible metal hose can accommodate the thermal expansion caused by the liquefied gases carried through the hose, and the total length of the hose will not significantly vary. In contrast, fixed or rigid metal pipe would expand and contract along its length as the liquid gases passed through it, causing stresses on the pipe junctions that would over time cause fatigue and failure. Alternatively, within certain industrial or commercial applications using steam, either as a heat source or in the industrial process itself, the pumps used to transfer the liquid or steam within the system are subject to varying degrees of vibration. Additionally, flexible metal hoses can also be used as connections between the pump and the intake of the fluids being transferred to eliminate the vibration effects of the pumps on the piping transfer system. All of these areas provide opportunities for the flexible metal hose arena, and thus the Company continues to participate in these markets, as it seeks new innovative solutions which will generate additional revenue streams for the future.
Manufacturing
In each instance, whether the application is for CSST for fuel gases, flexible metal hose for handling specialty chemicals or gases, flexible double containment piping, unique industrial applications requiring the ability to withstand wide variations in temperature and vibration, or copper alloyed CMT for medical facilities, all of our success rests on our metal hose. Most of our flexible metal hoses range in diameter from 1/4” to 2” while certain applications require diameters of up to 16”. All of our smaller diameter pipe (2” inner diameter and smaller) is made by a proprietary process that is known as the rotary process. The proprietary process that we use to manufacture our annular hose is the result of a long-term development effort begun in 1995. Through continuous improvement over the years, we have developed and fine-tuned the process so that we can manufacture annular flexible metal hose on a high speed, continuous process. We believe that our own rotary process for manufacturing annular corrugated metal hose is the most cost efficient method in the industry, and that our rotary process provides us with a significant advantage in many of the industries in which we participate. As a result, we are able to provide our product on a demand basis. Over the years, the Company has had great success in achieving on-time delivery performance to the scheduled ship date. The quick inventory turnover reduces our costs for in-process inventory, and further contributes to our gross margin levels. We have also improved our productivity on a historical basis.
Raw Materials
We use various materials in the manufacture of our products, primarily stainless steel for our flexible metal hose and plastics for our jacketing material on TracPipe® CounterStrike® flexible gas piping and DoubleTrac® double containment piping, as well as a copper alloy for our MediTrac® CMT. We also purchase all of our proprietary fittings for use with the TracPipe® and CounterStrike® flexible gas piping, DoubleTrac® double containment piping, and MediTrac® CMT. Although we have multiple sources qualified for all of our major raw materials and components, we have historically used only one or two sources of supply for such raw materials and components. Our current orders for stainless steel and fittings are each placed with one or two suppliers. If any one of these sources of supply were interrupted for any reason, then we would have to devote additional time and expense in obtaining the same volume of supply from our other qualified sources. This potential transition, if it were to occur, could affect our operations and financial results during the period of such transition. During 2019, the commodity prices of nickel were reasonably similar to last year, but ended higher. Copper was reasonably flat. The Company experienced increases in most of its core components, as our vendors sought to recoup pricing and production burdens. Nickel is a prime material in stainless steel which the Company utilizes to manufacture CSST, and copper is a key component of the Company’s brass fittings and our MediTrac® CMT. Fortunately, the Company was able to maintain reasonably stable margins during 2019. This was accomplished by implementing our own pricing actions to help offset the upward movements in our material costs. The supply of our main raw materials appears to be sufficient with ample volume. We believe that with our purchase commitments for stainless steel, polyethylene and for our proprietary fittings, we have adequate sources of supply for these raw materials and components. We have not had difficulty in obtaining the raw materials, component parts or finished goods from our suppliers. We believe that the supply sufficiency of stainless steel will continue until there is a reduction in global capacity, such as mine closures, which would then cause a constriction. Volatility in the commodities marketplace and competitive conditions in the sale of our products could potentially restrict us from passing along raw materials or component part price increases to our customers.
| -7- |
Business Seasonality
The demand for our flexible piping products that are related to construction activity including TracPipe®, Counterstrike®, DoubleTrac® and MediTrac®, may be affected by the construction industry’s demand, which generally tightens during the winter months of each year due to cold and inclement weather. Accordingly, sales are usually higher in the spring, summer and fall.
Customers
We sell our products to customers scattered across a wide and diverse set of industries ranging from construction to pharmaceutical with close to 9,500 customers on record. These sales channels include sales through independent sales representatives, distributors, original equipment manufacturers, direct sales, and sales through our website on the internet. We utilize various distribution companies in the sale of our TracPipe® and Counterstrike® flexible gas piping, and these distribution customers in the aggregate represent a significant portion of our business. In particular, the Company has one significant customer, Ferguson Enterprises, whose various branches had sales in the range of 14% to 15% of total sales during the period of 2017 to 2019, and was in the range of 22% to 24% of the Company’s accounts receivable balance over the last two years. All of this business is done on a purchase order basis for immediate resale commitments or stocking, and there are no long-term purchase commitments. In the event we were to lose an account, we would not expect any long-term reduction in our sales due to the broad end-user acceptance of our products. We would anticipate that in the event of a loss of any one or more distributors, that after an initial transition period, the sale of our products would resume at or near their historical levels. Furthermore, in the case of certain national distribution chains, which is the case regarding the Company’s largest customer noted above, and other distributors, it is possible that there would continue to be purchasing activity from one or more regional or branch distribution customers. We sell our products within North America, primarily in the United States and Canada, and we also sell our products internationally, primarily in Europe through our manufacturing facility located in Banbury, England. Our sales outside of North America were in the range of 10% to 11% of our total sales during the last three years, with most of the sales occurring in the United Kingdom and elsewhere in Europe. We do not have a material portion of our long-lived assets located outside of the United States.
Distribution of Sales
As mentioned previously, we sell our products primarily through independent outside sales organizations, including independent sales representatives, distributors, fabricating distributors, wholesalers, and original equipment manufacturers (OEMs). We have a limited internal sales function that sells our products to key accounts, including OEMs and distributors of bulk hose. We believe that within each geographic market in which the independent sales representative, distributor or wholesaler is located that our outside sales organizations are the first or second most successful outside sales organization for the particular product line within that geographic area.
| -8- |
Competition
There are approximately 10 manufacturers of flexible metal hose in the United States, and approximately that number in Europe and Asia. The U.S. manufacturers include Titeflex Corporation, Ward Manufacturing, Microflex, United Flexible, Hose Master and several smaller privately held companies. No one manufacturer, as a general rule, participates in more than two of the major market categories, automotive, aerospace, residential and commercial construction, and general industrial, with most concentrating in just one. We estimate that we are at or near the top position of the two major categories in which we participate in regards to market share. In the flexible gas piping market, the U.S. market is currently concentrated in the residential housing market. Based on the reports issued by the national trade groups on housing construction, the level of acceptance of flexible gas piping in the construction market, and the average usage of flexible gas piping in a residential building, as well as through our sales position within that market, we are able to estimate with a high level of accuracy the size of the total gas piping market. In addition, the Company is a member of an industry trade group, which compiles and distributes sales statistics for its members relative to flexible gas piping. For other applications, industry trade groups collect and report on the size of the relevant market, and we can estimate our percentage of the relevant market based on our sales as compared to the market as a whole. The larger of our two markets, the construction industry, has seen a modest increase in the number of residential housing starts in 2019, as compared to the previous year. As discussed elsewhere, black iron pipe or copper tubing was historically used by all builders of commercial and residential buildings until the advent of flexible gas piping and changes in the relevant building codes. Since that time, flexible gas piping has taken an increasing share of the total amount of fuel gas piping used in construction.
Due to the number of applications in which flexible metal hose may be used, and the number of companies engaged in the manufacture and sale of flexible metal hose, the general industrial market is very fragmented, and we estimate that no one company has a predominant market share of the business over other competitors. In the market for double containment piping, we compete primarily against rigid pipe systems that are more costly to install than DoubleTrac® double containment piping. For medical tubing applications, the main competitor is medical grade (Type K or Type L) rigid copper pipe. MediTrac® is the only corrugated medical tubing in the United States that is approved to the stringent requirements of UL 1365. The general industrial markets within Europe are very mature and tend to offer opportunities that are interesting to us in niche markets or during periods in which a weak dollar increases the demand for our products on a competitive basis. Such has been the case for several years and has created new relationships for us. Currently, we are not heavily engaged in the manufacture of flexible metal hose for the aerospace or automotive markets, but we continue to review opportunities in all markets for our products to determine appropriate applications that will provide growth potential and high margins. In some cases, where the product offering is considered a commodity, price is the overriding competing factor. In other cases, a proprietary product offering or superior performance will be the major factors with pricing being secondary and in some cases, a non-factor. The majority of our sales are to distributors and wholesalers, and our relationships with these customers are on an arms-length basis in that neither we, nor the customers are so dependent on the other to yield any significant business advantage. From our perspective, we are able to maintain a steady demand for our products due to the broad acceptance of our products by end users, regardless of which distributor or wholesaler sells the product.
Backlog
Management does not believe that backlog figures are material to an understanding of our business because most products are shipped promptly after the receipt of orders.
Intellectual Property
We have a comprehensive portfolio of intellectual property, including approximately 270 patents issued in various countries around the world. The patents cover (a) the fittings used by the flexible gas piping to join the piping to a junction or assembly, (b) pre-sleeved CSST for use in underground applications, (c) an electrically conductive jacket for flexible gas piping that we sell under the trademark CounterStrike®, and (d) a tubing containment system for our DoubleTrac® double containment piping and CMT fittings. In combination, our AutoFlare® and AutoSnap® fittings are the leading products used with flexible gas piping because they offer a metal-to-metal seal between the fitting and the tubing, and because of their robustness and ease of use. The metal-to-metal contact provides for a longer lasting and more reliable seal than fittings which use gaskets or sealing compounds that can deteriorate over time. In applications involving fuel gases in a building, the ability to maintain the seal and prevent the leaking of such gases over long periods of time is valued by our customers. In addition, the AutoSnap® fitting provides the installer with greater ease of use by preassembling all the securing elements inside the body of the fitting. We also have received a patent for the composition of the polyethylene jacket used in our CounterStrike® flexible gas piping product, which has increased ability to dissipate electrical energy in the event of a nearby lightning strike. The tubing containment system of our DoubleTrac® double containment piping, which is also patented in the U.S. and in other countries, allows for the monitoring and collection of any liquids that may leak from the stainless steel containment layer. We have filed patent applications for the MediTrac® fittings to cover the unique requirements in the United States for fittings that permanently affix the fitting to the CMT system, and provides a tamper-proof connection to the CMT system. The expiration dates for the several patents covering our AutoFlare® fittings will be expiring through 2020 and the Counterstrike® patent will expire in 2025. We currently have several patent applications pending in the United States and internationally covering improvements to our AutoFlare® fittings and our CounterStrike® polyethylene jacket, and also have a patent pending on our new AutoSnap® fitting. Finally, and as mentioned above, our unique rotary process for manufacturing flexible metal hose has been developed over the last ten years, and constitutes a valuable trade secret. In 2007, a Pennsylvania court issued a ruling that confirms our proprietary rotary manufacturing process does constitute a “trade secret” under Pennsylvania law, and is entitled to protection against unauthorized disclosure or misappropriation.
| -9- |
Employees
As of December 31, 2019, the Company had 151 employees. Most of our employees are located in our manufacturing facilities in Exton, Pennsylvania, which contain our factory personnel, engineering, finance, human resources and most of our sales staff. Our factory workforce in Exton, Pennsylvania, is not party to a collective bargaining agreement. A small amount of employees work at our facility in Houston, Texas. We also maintain an office in Middletown, Connecticut where certain management, sales and administrative personnel reside. A number of individual sales personnel are also scattered across the United States. We also maintain a manufacturing facility in Banbury, United Kingdom, which contains employees of similar functions to those in the U.S., but on a much smaller scale. The sales personnel in England handle all sales and service for our products in Europe, most notably the United Kingdom, and the majority of our transactions with other international territories.
Environmental
Our manufacturing processes do not require the use of significant quantities of hazardous substances or materials, and therefore we are able to operate our Exton facility as a “small quantity generator” under the Resource Conservation and Recovery Act, 42 U.S.C. §§ 321 et seq. As a result, compliance with federal, state and local environmental laws do not pose a material burden on our business, and we are not required to expend any material amounts on capital expenditures for environmental control facilities for our manufacturing facility.
Internet Website
You may learn more about our company by visiting our website at www.omegaflexcorp.com. Among other things, you can access our filings with the Securities and Exchange Commission, which maintains a website at www.sec.gov that contains the Company’s various reports, proxy and information statements. These filings include proxy statements, annual reports (Form 10-K), quarterly reports (Form 10-Q), and current reports (Form 8-K), as well as Section 16 reports filed by our officers and directors (Forms 3, 4 and 5). All of these reports will be available on the website as soon as reasonably practicable after we file the reports with the SEC. In addition, we have made available on our website under the heading “Compliance Policies” the charters for the Audit, Compensation and Nominating/Governance Committees of our Board of Directors and our Code of Business Ethics. We intend to make available on our website any future amendments or waivers to our Code of Business Ethics. The information on our website is not part of this report.
You should carefully consider the following risk factors and all the other information contained in this annual report and our other filings in evaluating our business and investment in our common stock. We have not disclosed general risk factors that may be applicable to any for-profit organization, such as general economic conditions, interest rates, labor supply and technological changes. Investors are cautioned to take into consideration the specific risk factors we have disclosed below and general risk factors before making an investment decision.
| -10- |
Risk Relating to Our Business
We are primarily dependent on one product line for most of our sales.
Most of the Company’s sales are derived from the sale of TracPipe® and CounterStrike® flexible gas piping systems, including Autoflare® and AutoSnap® fittings and a variety of accessories. Sales of our flexible metal hose for other applications represent a small portion of our overall sales and income. Any event or circumstance that adversely affects our TracPipe® or CounterStrike® flexible gas piping could have a greater impact on our business and financial results than if our business were more evenly distributed across several different product lines. The effects of such an adverse event or circumstance would be magnified in terms of our Company as a whole as compared to one or more competitors whose product lines may be more diversified, or who are not as reliant on the sales generated by their respective flexible gas piping products. Therefore, risks relating to our TracPipe® and CounterStrike® flexible gas piping business – in particular loss of distributors or sales channels, technological changes, loss of our key personnel involved in the flexible gas piping product line, increases in commodity prices, particularly in stainless steel and polyethylene – could damage our business, competitive position, results of operations or financial condition.
Our manufacturing plant(s) may be damaged or destroyed.
The majority of the company’s manufacturing capacity is currently located in Exton, Pennsylvania, where we own two manufacturing facilities which are in close proximity to each other, and in Banbury, United Kingdom where we rent a manufacturing facility. On a smaller scale the Company also manufactures product in Houston, Texas. We do not have any operational manufacturing capacity for flexible metal hose outside of these locations. We cannot replicate our manufacturing methods at a supplier’s facility due to the confidential and proprietary nature of our manufacturing process. If one of the manufacturing facilities were destroyed or damaged in a significant manner, we would likely experience a delay or some interruption of our flexible metal hose operations. This could lead to a reduction in sales volume if customers were to purchase their requirements from our competitors, claims for breach of contract by certain customers with contracts for delivery of flexible metal hose by a certain date, and costs to replace our destroyed or damaged manufacturing capacity. The fittings and accessories for the flexible metal hose are manufactured for us by suppliers not located in Exton, Pennsylvania, and the Company also has outside warehouses which contain finished goods inventory. Disruption of or damage to our supply of these items could damage our business, competitive position, results of operations or financial condition.
We are dependent on certain raw materials and supplies that could be subject to volatile price escalation.
As a manufacturer of flexible metal hose, we must use certain raw materials in the manufacture of the hose. The primary raw material is stainless steel that is used in the forming of the hose, and various other steel products used in the wire braid overlay over some flexible metal hoses for additional strength and durability, as well as copper alloy for MediTrac® CMT. We also use polyethylene in pellet form for the forming and extrusion of a polyethylene jacket over CSST for use in fuel gas applications, underground installations, and other installations that require that the metal hose be isolated from the environment. Finally, we also purchase our proprietary brass and stainless steel fittings used with the flexible metal hose that provide a mechanical means of attaching the hose to an assembly or junction. We attempt to limit the effects of volatile raw material prices, and to ensure adequate and timely supply of material, by committing to annual purchase contracts for the bulk of our steel and polyethylene requirements, and for our fitting requirements. The contracts typically represent a significant portion of the Company’s annual planned usage, and are set at a designated fixed price or a range of prices. These agreements sometimes require the Company to accept delivery of the commodity in the quantities committed, at the agreed upon prices. Transactions in excess of the pre-arranged commitments are conducted at current market prices at the Company’s discretion. The Company has identified multiple qualified vendors to produce or manufacture our critical purchase requirements. The Company does however tend to rely on one or two sources for each or our primary components to leverage the relationship and pricing. Therefore, there is no assurance that the Company would be able to eliminate all or most of the adverse effects of a sudden increase in the cost of materials or key components, or that the loss of one or more of our key sources would not lead to higher costs or a disruption in our business, which could damage our business, competitive position, results of operations or financial condition.
| -11- |
Susceptibility of litigation and significant legal costs or settlements.
In the ordinary and normal conduct of the Company’s business, it is subject to periodic lawsuits, investigations and claims (collectively, the “Claims”). The Company has continued to receive repeat pattern Claims relating to our flexible gas piping products, although the pace of the new Claims has declined. While the Company does not believe the Claims have legal merit, and has successfully defended itself vigorously against such Claims, there is no guarantee that the pace of claims will not increase or subside. Any significant increase in the number of Claims, the financial magnitude of Claims brought against the Company, the costs of defending the Claims, particularly under higher retentions of the Company’s current product liability insurance policies, could have a detrimental impact on the Company’s business, competitive position, results of operations or financial condition, perhaps materially.
We face intense competition in all of our markets.
The markets for flexible metal hose are intensely competitive. There are a number of competitors in all markets in which we operate, and generally none of these markets have one dominant competitor – rather a large number of competitors exist, each having a proportion of the total market. One or more of our competitors may develop technologies and products that are more effective or which may cost less than our current or future products, or could potentially render our products noncompetitive or obsolete. Our prior success has been due to our ability to develop new products and product improvements, and establish and maintain an effective distribution network which to some extent came at the expense of several competing manufacturers. Our business, competitive position, results of operations or financial condition could be negatively impacted if we are unable to maintain and develop our competitive products.
We may not retain our independent sales organizations.
Almost all of the Company’s products and product lines are sold by outside sales organizations. These independent sales organizations or sales representatives are geographically dispersed in certain territorial markets across the United States, Canada and elsewhere. These outside sales organizations are independent of us, and are typically owned by the individual principals of such firms. We enter into agreements with such outside sales organizations for the exclusive representation or distribution of our products, but such agreements are generally for terms of one year or less. At the expiration of the agreement, the agent or distributor may elect to represent a different manufacturer. As a result, we have no ability to control which flexible metal hose manufacturer any such sales organization may represent or carry. The competition to retain quality outside sales organizations is also intense between manufacturers of flexible metal hose since it is these sales organizations that generally can direct the sales volume to distributors and, ultimately, contractors and installers in important markets across the country, and in other countries in which we operate. The failure to obtain the best outside sales organization within a particular geographic market can limit our ability to generate sales of our products. While we currently have a fully developed sales and distribution network of superior outside sales organizations, there can be no assurance that any one or more of the outside sales organizations will elect to remain with us, or that our competitors will not be able to disrupt our distribution network by causing one or more of our sales representatives to drop our product lines. Our business, competitive position, results of operation or financial condition could be negatively impacted if we cannot maintain adequate sales and distribution networks.
We are dependent on certain sales channels for a significant portion of our business.
Of the various sales channels that we use to sell our products, a significant portion of such sales are made through our wholesale stocking distributors that include Ferguson Enterprises and several other distributors. These and other distributors purchase our products, and stock the goods in warehouses for resale, either to their own local branches or to end-users. Because of the breadth and penetration of the distribution networks, and the range of complementary products they offer for sale, these wholesale distributors are able to sell large amounts of our products to end users across the United States and Canada. The decision by a major wholesaler distributor to stop distributing our products such as TracPipe® and CounterStrike® flexible gas piping, and to distribute a competitive flexible gas piping product, could significantly affect our business, competitive position, results of operations or financial condition.
| -12- |
Our business may be subject to the supply and availability of fuel gas supplies and infrastructure.
Our TracPipe® and CounterStrike® flexible gas piping products are used to convey fuel gas, primarily natural gas, but also propane, within a building from the exterior wall of the building to any gas-fired appliances within the building. Because those products are used in the transmission of fuel gas, the applications are limited to geographic areas where such fuel gas is available. Certain geographic areas of the United States and other countries do not have the infrastructure to make natural gas available. Other types of fuel gas may be used in areas where there are no natural gas pipelines, but these alternate fuel gas sources have other distribution issues that may constrict their availability. Our prospects for future growth of the TracPipe® and CounterStrike® products are largely limited to those areas that have natural gas transmission lines available for use in residences and commercial buildings.
With increasing debate on the effect of human activities on climate change, there has been a focus on transitioning energy and heating in buildings away from fossil fuels, such as natural gas and liquid propane. Several municipalities in the United States have announced policy decisions to move away from fossil fuel applications in the future. Although there are significant technical and economic hurdles, it is possible that a large scale movement, in individual cities and states or on a federal level, away from fossil fuels may increase in the future. Such moves could reduce the demand for our flexible gas piping products, which represent a major part of the company’s sales and net profits. As a result, it is possible in the future that proposals to limit or eliminate the use of fossil fuels could adversely impact the financial results of the company, perhaps materially.
If we are not able to protect our intellectual property rights, we may not be able to compete as effectively.
We possess a wide array of intellectual property rights, including patents, trademarks, copyrights, and applications for the above, as well as trade secrets, manufacturing know-how, and other proprietary information. Certain of these intellectual property rights form the basis of our competitive advantage in the market place through a superior product design, a superior business process, superior manufacturing methods or other features that provide an advantage over our competitors. The intellectual property rights are sometimes subject to infringement or misappropriation by other organizations, and failing an amiable resolution, we may be forced to resort to legal proceedings to protect our rights in such intellectual property.
In the past, the Company has needed to protect itself and resort to legal action, in one instance regarding a trade secret, and in another where we sued a flexible gas pipe competitor for infringement on one or more of our U.S. patents covering our AutoFlare® fittings. In both instances, the Company received favorable rulings, thus solidifying the validity of our intellectual property. Although the Company has had past success, the results we may obtain from resorting to any such legal proceedings are never assured, and it is possible that an adverse decision may be delivered in any particular proceeding. As a result, we may not be able to retain the exclusive rights to utilize and practice such intellectual property rights, and one or more of our competitors could utilize and practice such intellectual property rights. This development may lessen our competitive advantage vis-à-vis one or more competitors, and lead to a reduction in sales volume in one or more product lines, a reduction in profit margin in such product lines, or both, which would damage our business, competitive position, results of operations or financial condition.
If we were to lose the services of one or more of our senior management team, we may not be able to execute our business strategy
Our future success depends in a large part upon the continued service of key members of our senior management team. The senior executives are critical to the development of our products and our strategic direction, and have a keen knowledge of business operations and processes. Their unique abilities, experience and expertise cannot be easily duplicated or replaced. As much as possible, senior executives strive to educate and develop other layers of staff and succession planning, but the loss of any of our senior management could seriously harm our business.
| -13- |
Certain of our competitors may have greater resources, or they may acquire greater resources.
Some of our competitors have substantially more resources than are available to us as a stand-alone company. For example, in the CSST market, two of our competitors are divisions of large corporations with revenues measured in the billions of dollars. These competitors may be able to devote substantially greater resources to the development, manufacture, distribution and sale of their products than would be available to us as a stand-alone company. One or more competitors may acquire several other competitors, or may be acquired by a larger entity, and through a combination of resources be able to devote additional resources to their businesses. These additional resources could be devoted to product development, reduced costs in an effort to obtain market share, greater flexibility in terms of profit margin as part of a larger business organization, increased investment in plant, machinery, distribution and sales concessions. As a stand-alone company, the resources that may be devoted by us to meet any potential developments by larger, well-financed competitors may be limited.
We may substantially increase our debt in the future, or be restricted from accessing funds.
We are currently not carrying any long-term debt, although the Company has a line of credit facility available for use as described in Note 5, Line of Credit, to the Consolidated Financial Statements included in this report. We may consider borrowing funds for purposes of working capital, capital purchases, research and development, potential acquisitions and business development. If we do use credit facilities, interest costs associated with any such borrowings and the terms of the loan could potentially adversely affect our profitability. Additionally, the current line of credit has debt covenants associated with it which may restrict the level of borrowing the Company may take on. Lack of access to financing, or desirable terms or at all, could damage our business, competitive position, results of operations or financial condition.
Changes in the method pursuant to which the LIBOR rates are determined and potential phasing out of LIBOR after 2021 may affect our financial results.
Borrowings under our line of credit facility bear interest at variable rates based on LIBOR or Prime. The LIBOR or Prime rates and certain other interest “benchmarks” may be subject to regulatory guidance and/or reform that could cause interest rates under our current or future debt agreements to perform differently than in the past or cause other unanticipated consequences. The United Kingdom’s Financial Conduct Authority, which regulates LIBOR, has announced that it intends to stop encouraging or requiring banks to submit rates for the calculation of LIBOR rates after 2021, and it is unclear if LIBOR will cease to exist or if new methods of calculating LIBOR will evolve. If LIBOR ceases to exist or if the methods of calculating LIBOR change from their current form, interest rates on our current or future debt obligations may be adversely affected.
Our business may be subject to varying demands based on market interest rates.
Our TracPipe® and CounterStrike® flexible gas piping products are used in the construction industry, both in residential, commercial and industrial segments, for the piping of fuel gas within a building. The demand for new or remodeled construction in the construction industry – and in particular the residential construction industry – is susceptible to fluctuations in interest rates charged by banks and other financial institutions as well as consumer demand. The purchasers of new or remodeled construction generally finance the construction or acquisition of the residential, commercial or industrial buildings, and any increase in the interest rates on such financing will raise the acquisition cost of the potential purchaser. While interest rates have been reasonably low over the recent past, they have increased slightly over the last year. If costs increase significantly, a higher amount of potential buyers may not be able to support the level of financing under a higher interest rate environment. Increased acquisition costs may lead to a decline in the demand for new or remodeled construction, and as a result may also lead to a reduced demand for our products used in construction industry, which could damage our business, competitive position, results of operations or financial condition.
| -14- |
Our business may be subject to cyclical demands.
The demand for our products may be subject to cyclical demands in the markets in which we operate. Our customers who use our products in industrial and commercial applications are generally manufacturing capital equipment for their customers. Similarly, our TracPipe® and CounterStrike® flexible gas piping products are used primarily in residential construction, both in single-family buildings, and in larger multi-unit buildings. Should there be any change in factors that affect the rate of new residential construction, our growth rate would likely be impacted. To the extent that interest rates increase, in conjunction with an economic cycle or as part of the general economic conditions in the United States or abroad, the demand for our products in such applications may decrease as well, which could damage our business, competitive position, results of operations or financial condition.
Our business may be subject to seasonal or weather related factors.
The demand for our products may be affected by factors relating to seasonal demand for the product, or a decline in demand due to inclement weather. Our TracPipe® and CounterStrike® flexible gas piping products are installed in new or remodeled buildings, including homes, apartment buildings, office buildings, warehouses, and other commercial or industrial buildings. Generally, the rate of new or remodeled buildings in the United States and in the other geographic markets in which we are present decline in the winter months due to the inability to dig foundations, problems at the job site relating to snow, or generally due to low temperatures and stormy weather. As the rate of construction activity declines during the winter, the demand for our corrugated stainless steel tubing may also decrease or remain static.
The concentration of ownership of our common stock may depress its market price.
Approximately 71% of the issued and outstanding common stock is owned or controlled by inside affiliated parties to the Company, with the largest being: The Estate of John E. Reed, Stewart B. Reed, Kevin R. Hoben and Mark F. Albino. Stewart B. Reed currently serves on the Board of Directors, where he presided as Chairman until December 2018, and Mr. Hoben and Mr. Albino also serve on the Board of Directors, and are officers of the Company. Mr. Hoben was elevated to Chairman in December 2018. This concentration of ownership may have the effect of reducing the volume of trading of the common stock on the NASDAQ, which could result in lower prices for the common stock because there is not a sufficient supply of shares to create a vibrant market for our shares on the NASDAQ.
The concentration of ownership of common stock could exert significant influence over matters requiring shareholder approval, including takeover attempts.
Because of their significant ownership of our common stock, our officer and directors and their respective affiliates may, as a practical matter, be able to exert influence over matters requiring approval by our shareholders, including the election of directors and the approval of mergers or other business combinations. This concentration also could have the effect of delaying or preventing a change in control of the Company.
Our business may be subject to the impact of currency volatility.
The Company has operations in the United Kingdom, and does business transactions elsewhere in the world outside of the United States. While the magnitude of these transactions outside of the United States have thus far not been significant, and typically not in currencies of high volatility, it is possible that they could be material. In June 2016, the United Kingdom made the decision to leave the European Union, an event commonly known as Brexit, as described below. As a result of Brexit, and the political and economic uncertainty that ensued, the British Pound weakened in comparison to other currencies. This in turn had a direct negative impact on the Company’s financial statements and results, most notably during 2018, as we experienced losses when settling transactions in other currencies, and experienced unfavorable results due to the translation of financial statements with a lower exchange rate. During 2017 and 2019 the impact of currency volatility on the financial statements was not as severe, but going forward, it is possible that the British Pound, other currencies that we engage in, or even the U.S. Dollar may weaken, and materially impact the financial position, operations and liquidity of the Company.
| -15- |
A cyber attack or other computer system breach could harm us.
In recent years, the topic of cybersecurity, or the lack thereof, has been an issue of high concern. The Company currently maintains a robust firewall and other safeguards to either prevent or detect against nefarious actors looking to breach or infiltrate our data, and has backup systems in place. The Company’s website is housed and maintained by a third party who maintain their own controls. The Company currently has a very low volume of sales coming through the internet, and processes very few credit card transactions. While it currently appears that the Company has a low level of risk related to cybercrime, the vulnerability still exists and could affect the Company negatively.
Our business may be subject to the impact of Brexit.
The Company’s main operating subsidiary, Omega Flex Limited, is headquartered in Banbury, United Kingdom. The result of the referendum held by the United Kingdom during June 2016 to withdraw from the European Union (“Brexit”) has created a level of uncertainty regarding the final terms of that withdrawal that has not yet been completely agreed upon by the United Kingdom (UK) and the European Union (EU). Some clarity was provided during January 2020, when the UK officially left the EU, but the UK and EU have now entered a transition period which is anticipated to last approximately one year. Depending upon the negotiated terms reached by the parties, there could be risks related to border and customs controls and on the movement of people and goods between the UK and EU, and the rest of the world. These border and customs controls could increase costs on materials imported into the UK and finished goods exported from the UK. In addition, it is possible that logistical delays created by those controls could delay shipments of materials and supplies into the Banbury manufacturing plant, and could also affect our ability to ship goods to customers outside of the UK, into the EU, Africa, and the Near East. Omega Flex Limited has stockpiled materials and supplies for its manufacturing operations in Banbury in light of Brexit, and are positioned to stage some finished goods inventory in warehouses in the EU, in an attempt to cushion any possible adversity experienced regarding changes in border and customs controls. Most of the business of Omega Flex Limited is domestic, and should therefore not be unduly disrupted. However, the macroeconomic effects of Brexit on the economies of the UK and the EU are unknown, and those effects could dampen economic activity and the overall demand for the Company’s products in those markets. However, it is not expected that increased costs, logistical delays, nor possible economic declines in those markets would be material to the Company.
Our business may be subject to macroeconomic effects caused by increased trade tariffs and reduced international trade, as well as other global risks.
Recent events have caused various governments around the world to impose increased trade tariffs on imported goods. These increased tariffs may cause the cost of materials to rise and may add additional expense on exported goods. However, the company does not believe that increased tariffs will materially affect the company’s sales or operating margins, as most of the raw materials and supplies used to manufacture our products are sourced domestically in the United States. Further, exports of our flexible gas piping products from our Exton, Pennsylvania facility are primarily to Canada, which recently agreed to a revised North American trade treaty, and to a lesser extent to the Caribbean and South America. Sales to Europe, Asia and Africa are primarily handled from our Banbury, England facility, which are not affected by U.S. trade tariffs and retaliatory tariffs, but may be subject to other constraints as discussed in the Brexit risk factor, above.
Conflicts, wars, natural disasters, infectious disease outbreaks or terrorist acts could also cause significant damage or disruption to our operations, employees, facilities, systems, suppliers, supply chain, distributors, resellers or customers in the United States and internationally for extended periods of time and could also affect demand for our products. In December 2019, a strain of coronavirus surfaced in Wuhan, China, and the outbreak appears to be spreading throughout the region and the world. The extent to which the coronavirus impacts our operations and our results will depend on future developments, which are highly uncertain and unpredictable, including new information concerning the severity of the coronavirus and the actions to contain or treat its impact, among others.
Item 1B – UNRESOLVED STAFF COMMENTS
None.
| -16- |
The Company utilizes two facilities in Exton, Pennsylvania, which is located about one hour west of Philadelphia. One facility which is owned by the Company, contains about 83,000 square feet of manufacturing and office space. The other facility which is located nearby provides another 30,000 square feet of space, mostly used for manufacturing. The Company previously had a rental agreement running through January 2018 for this facility, but in early 2017 consummated an agreement to purchase the land and structure for cash. The majority of the manufacturing of our flexible metal hose is performed at the Exton facilities. Also within the US, the Company leases a facility in Houston, Texas, which contains manufacturing, stocking and sales operations, and a corporate office located in Middletown, Connecticut. In the United Kingdom, the Company rents a facility in Banbury, England, which manufactures products and serves sales, warehousing and operational functions as well.
In the ordinary and normal conduct of the Company’s business, it is subject to periodic lawsuits, investigations and claims (collectively, the “Claims”). Most of the Claims, including a putative class-action claim, relate to potential lightning damage to our flexible gas piping products, which impact legal and product liability related expenses. The Company does not believe the Claims have legal merit, and therefore has commenced a vigorous defense in response to the Claims. It is possible that the Company may incur increased litigation costs in the future due to a variety of factors, including a higher numbers of Claims, higher legal costs, and higher insurance deductibles or retentions.
In 2010, the Company took its first Claim to trial in Pennsylvania, and the jury returned a verdict that the Company was not negligent in designing and selling the TracPipe® product, but also returned a verdict for plaintiff on strict liability. The Company appealed that portion of the verdict, and in December 2014, the Supreme Court of Pennsylvania ruled in favor of the Company, and returned the case to the trial court for further hearings. The cash bond of $1,600,000, which was previously included in Other Long Term Assets and posted as security for a subsequent appeal, was returned to the Company in May 2018. This case was finally settled and closed on August 7, 2018.
In March 2017, a putative class action case was re-filed against the Company and other parties in Missouri state court after the predecessor case was dismissed without prejudice by the federal court. The Company successfully removed the case to federal court and is currently vigorously defending the case.
The Company has in place commercial general liability insurance policies that cover most Claims, which are subject to deductibles or retentions, ranging primarily from $25,000 to $1,000,000 per claim (depending on the terms of the policy and the applicable policy year), up to an aggregate amount. Litigation is subject to many uncertainties and management is unable to predict the outcome of the pending suits and claims. The potential liability for a given claim could range from zero to a maximum of $1,000,000, depending upon the circumstances, and insurance deductible or retention in place for the respective claim year. The aggregate maximum exposure for all current open Claims, excluding the Missouri class action case, as of December 31, 2019 is estimated to not exceed approximately $3,300,000, which represents the potential costs that may be incurred over time for the Claims within the applicable insurance policy deductibles or retentions. From time to time, depending upon the nature of a particular case, the Company may decide to spend in excess of a deductible or retention to enable more discretion regarding the defense, although this is not common. It is possible that the results of operations or liquidity of the Company, as well as the Company’s ability to procure reasonably priced insurance, could be adversely affected by the pending litigation, potentially materially. The Company is currently unable to estimate the ultimate liability, if any, that may result from the pending litigation, or potential litigation from future claims or claims that have not yet come to our attention, and accordingly, the liability in the consolidated financial statements primarily represents an accrual for legal costs for services previously rendered, and outstanding or anticipated settlements for Claims. The liabilities recorded on the Company’s books at December 31, 2019 and December 31, 2018 were $215,000 and $150,000, respectively, and are included in Other Liabilities.
Item 4 – MINE SAFETY DISCLOSURES
The Company does not have any disclosures applicable to mine safety.
| -17- |
Item 5 - MARKET FOR REGISTRANT’S COMMON EQUITY, AND RELATED STOCKHOLDER MATTERS AND ISSUER PURCHASES OF EQUITY SECURITIES
Common Stock
Our common stock is listed on the NASDAQ Global Market, under the symbol OFLX. The number of shareholders of record as of December 31, 2019, based on inquiries of the registrant’s transfer agent, was 338. For this purpose, shareholders whose shares are held by brokers on behalf of such shareholders (shares held in “street name”) are not separately counted or included in that total.
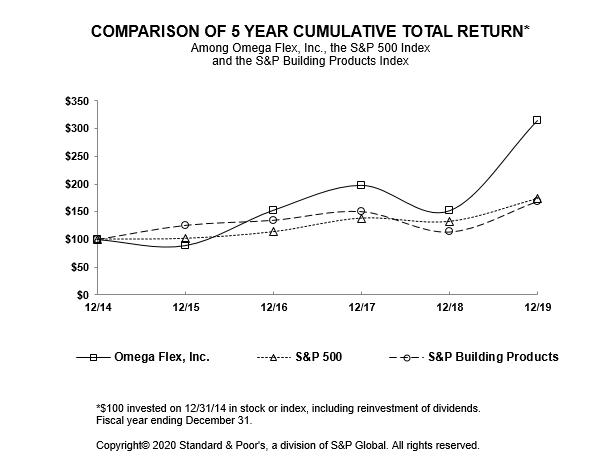
Shareholder Return Performance Presentation
The Shareholder Return Performance Presentation shall not be deemed to be “soliciting material” or subject to Regulations 14A or 14C of the Securities and Exchange Commission or to the liabilities of Section 18 of the Securities and Exchange Act of 1934 (the “Exchange Act”) and shall not be deemed incorporated by reference by any general statement incorporating by reference this annual report into any filing under the Securities Act of 1933 or under the Exchange Act, and shall not otherwise be deemed filed under such Acts.
The following graph shows the changes on a cumulative basis in the total shareholder return on the Omega Flex common stock, and compares those changes in shareholder return with the total return on the S&P 500 Index and the total return on the S&P 500 Building Products Index. The graph begins with a base value of $100 on December 31, 2014, and shows the cumulative changes over the last five years, ending on December 31, 2019. The graph assumes $100 was invested on December 31, in each of the three alternatives, and that all dividends have been reinvested.
| -18- |
| Company / Index | Base Period 12/31/14 | Indexed Returns – Year Ending | ||||||||||||||||||||||
| 12/14 | 12/15 | 12/16 | 12/17 | 12/18 | 12/19 | |||||||||||||||||||
| Omega Flex, Inc. | 100.00 | 89.21 | 152.95 | 197.78 | 151.97 | 314.62 | ||||||||||||||||||
| S&P 500 | 100.00 | 101.38 | 113.51 | 138.29 | 132.23 | 173.86 | ||||||||||||||||||
| S&P Building Products | 100.00 | 125.42 | 134.51 | 150.02 | 113.44 | 168.25 | ||||||||||||||||||
Dividends
The Company currently has a policy of paying regular quarterly dividends, which is expected to continue. In addition, the Company may pay special dividends from time to time, as we did during December 2019 and January 2017. Further details regarding dividends are contained in Note 6, Shareholders’ Equity to the Consolidated Financial Statements included in this report.
The Board, in its sole discretion, has a general policy of reviewing the cash needs of the Company from time to time, and based on results of operations, financial condition and capital expenditure plans, possible acquisitions, as well as other factors that the Board may consider relevant, determining on a quarterly basis whether to declare a regular quarterly dividend, or a special dividend.
Item 6 - SELECTED FINANCIAL DATA
Selected financial data for the Company for each of the last five years is shown in the following table, which is derived from and should be read in conjunction with the Consolidated Financial Statements included elsewhere in this report.
SUMMARY OF FINANCIAL POSITION - as of December 31,
| 2019 | 2018 | 2017 | 2016 | 2015 | ||||||||||||||||
| (dollars in thousands except per share data) | ||||||||||||||||||||
| Total Assets | $ | 60,984 | $ | 86,836 | $ | 77,091 | $ | 70,562 | $ | 66,274 | ||||||||||
| Working Capital | $ | 25,836 | $ | 55,217 | $ | 45,372 | $ | 36,941 | $ | 33,139 | ||||||||||
| Total Shareholders’ Equity | $ | 37,576 | $ | 66,321 | $ | 56,069 | $ | 46,061 | $ | 41,154 | ||||||||||
| Cash Dividends Declared per Common Share | $ | 4.58 | $ | 0.94 | $ | 0.66 | $ | 0.85 | $ | 0.85 | ||||||||||
SUMMARY OF OPERATIONS - for the years ended December 31,
| 2019 | 2018 | 2017 | 2016 | 2015 | ||||||||||||||||
| (dollars in thousands except per share data) | ||||||||||||||||||||
| Net Sales | $ | 111,360 | $ | 108,313 | $ | 101,799 | $ | 94,051 | $ | 93,278 | ||||||||||
| Net Income attributable to Omega Flex, Inc.(1) | $ | 17,286 | $ | 20,139 | $ | 15,662 | $ | 14,377 | $ | 15,788 | ||||||||||
| Basic and Diluted Earnings per Common Share | $ | 1.71 | $ | 2.00 | $ | 1.55 | $ | 1.42 | $ | 1.56 | ||||||||||
| (1) | Total Net Income for these periods was $17,425, $20,277, $15,846, $14,546, and $15,961, respectively. The difference is attributable to the Net Income - Noncontrolling Interest. |
| -19- |
Item 7 - MANAGEMENT’S DISCUSSION AND ANALYSIS OF FINANCIAL CONDITION AND RESULTS OF OPERATIONS
This report contains forward-looking statements, which are subject to inherent uncertainties. These uncertainties include, but are not limited to, variations in weather, changes in the regulatory environment, customer preferences, general economic conditions, increased competition, the outcome of outstanding litigation, and future developments affecting environmental matters. All of these are difficult to predict, and many are beyond the ability of the Company to control.
Certain statements in this Annual Report on Form 10-K that are not historical facts, but rather reflect the Company’s current expectations concerning future results and events, constitute forward-looking statements within the meaning of the Private Securities Litigation Reform Act of 1995. The words “believes”, “expects”, “intends”, “plans”, “anticipates”, “hopes”, “likely”, “will”, and similar expressions identify such forward-looking statements. Such forward-looking statements involve known and unknown risks, uncertainties and other important factors that could cause the actual results, performance or achievements of the Company, or industry results, to differ materially from future results, performance or achievements expressed or implied by such forward-looking statements.
Readers are cautioned not to place undue reliance on these forward-looking statements, which reflect management’s view only as of the date of this Form 10-K. The Company undertakes no obligation to update the result of any revisions to these forward-looking statements which may be made to reflect events or circumstances after the date hereof or to reflect the occurrence of unanticipated events, conditions or circumstances.
OVERVIEW
The Company is a leading manufacturer of flexible metal hose, and is currently engaged in a number of different markets, including construction, manufacturing, transportation, petrochemical, pharmaceutical and other industries.
The Company’s business is managed as a single operating segment that consists of the manufacture and sale of flexible metal hose and accessories. The Company’s products are concentrated in residential and commercial construction, and general industrial markets, with a comprehensive portfolio of intellectual property and patents issued in various countries around the world. The Company’s primary product, flexible gas piping, is used for gas piping within residential and commercial buildings. Through its flexibility and ease of use, the Company’s TracPipe® and TracPipe® CounterStrike® flexible gas piping, along with its fittings distributed under the trademarks AutoSnap® and AutoFlare®, allows users to substantially cut the time required to install gas piping, as compared to traditional methods. The Company’s newest product line MediTrac® corrugated medical tubing is used for piping medical gases (oxygen, nitrogen, nitrous oxide, carbon dioxide, and medical vacuum) in health care facilities. Building on the recognized strengths and strategies employed in the flexible gas piping market, MediTrac® can be used in place of rigid copper pipe, and due to its long continuous lengths and flexibility, it can be installed approximately five times faster than rigid copper pipe, saving on installation labor and construction schedules. The Company’s products are manufactured at its Exton, Pennsylvania and Houston, Texas facilities in the United States, and in Banbury, Oxfordshire in the UK. A majority of the Company’s sales across all industries are generated through independent outside sales organizations such as sales representatives, wholesalers and distributors, or a combination of both. The Company has a broad distribution network in North America and to a lesser extent in other global markets.
CHANGES IN FINANCIAL CONDITION
The Company’s cash balance of $16,098,000 at December 31, 2019 decreased $16,294,000 (50.3%) from a $32,392,000 balance at December 31, 2018. The primary reason for the decrease in cash related to dividend payments during 2019 totaling $46,028,000, which included a $3.50 per share special dividend paid during December 2019 totaling $35,330,000, as detailed in Note 6, Shareholders’ Equity, to the Consolidated Financial Statements included in this report. Further, the Company used funds for the purchase of inventory in anticipation of stronger customer demand. Those cash outflows were partially offset by income generated from operations during 2019.
| -20- |
Investments were $0 and $14,944,000 as of December 31, 2019 and December 31, 2018, respectively. During 2018 and 2019, the Company invested excess funds in various liquid interest earning instruments including U.S. Treasury bills. The purpose of the short-term investments was to earn a higher level of investment income while maintaining a minimal level of risk. The investments were stated at fair value, which approximates amortized cost, and were classified as available-for-sale in accordance with Accounting Standards Codification 320, Investments – Debt and Equity Securities (or “ASC 320”). Maturities for these investments, from the date of purchase, ranged between three months and one year. During December 2019, to assist with the funding of the $3.50 per share special dividend described above, the Company liquidated its short-term investments, which provided net proceeds of $14,944,000. The net proceeds from the short-term investments were composed of $70,882,000 of sales, net of $55,938,000 of purchases, which occurred during the year.
Inventories were $11,078,000 and $7,976,000 as of December 31, 2019 and December 31, 2018, respectively, increasing $3,102,000 or 38.9%. Most notably, the Company directed a build-up of inventory for the Company’s newest product, MediTrac® flexible medical gas piping, in anticipation of customer orders, and preemptively increased levels of DoubleTrac® inventory to ensure there was ample supply.
Other Liabilities were $5,404,000 and $3,591,000 at December 31, 2019 and December 31, 2018, respectively. The primary contributors to the $1,813,000, or 50.5%, increase, related to accruals for legal expenses mostly associated with one class action case, and executive compensation for prior equity awards impacted by the surging stock price.
Retained Earnings were $27,165,000 and $56,110,000 at December 31, 2019 and December 31, 2018, respectively, decreasing $28,945,000 or 51.6%. The decrease was primarily due to dividend payments made during 2019, in particular the $35,330,000 special dividend previously noted, and discussed in detail in Note 6, Shareholders’ Equity, to the Consolidated Financial Statements included to this report.
RESULTS OF OPERATIONS
Twelve-months ended December 31, 2019 vs. twelve months ended December 31, 2018
The Company reported comparative results from operations for the twelve-month periods ended December 31, 2019 and 2018 as follows:
Twelve-months ended December 31, (dollars in thousands) | ||||||||||||||||
| 2019 | 2019 | 2018 | 2018 | |||||||||||||
| Net Sales | $ | 111,360 | 100.0 | % | $ | 108,313 | 100.0 | % | ||||||||
| Gross Profit | $ | 70,487 | 63.3 | % | $ | 66,096 | 61.0 | % | ||||||||
| Operating Profit | $ | 21,922 | 19.7 | % | $ | 26,366 | 24.3 | % | ||||||||
Net Sales. The Company’s sales for the full year of 2019 were $111,360,000, reflecting an increase of $3,047,000, or 2.8%, over $108,313,000 in 2018. The increase in sales resulted mostly from an increase in selling prices that were necessary to help offset a rise in the Company’s material costs.
Gross Profit. The Company’s gross profit margins increased between the two periods, at 63.3% and 61.0% for the twelve-months ended December 31, 2019 and 2018, respectively.
| -21- |
Selling Expenses. Selling expenses consist primarily of employee salaries and associated overhead costs, commissions, and the cost of marketing programs such as advertising, trade shows and related communication costs, and freight. Selling expense was $19,032,000 and $17,117,000 for 2019 and 2018, respectively, representing a year over year increase of $1,915,000, or 11.2%. A majority of the additional expense relates to atypical consulting costs attributable to the Company’s new product, MediTrac® flexible medical gas piping, increasing $977,000 over last year. The Company has also expanded its sales related staffing resources, and recognized an increase in commissions during the year, largely driven by the increase in sales. Travel expenses, partially associated with the increase in staffing, were also higher. For the same periods, selling expense as a percentage of net sales was 17.1% and 15.8%, respectively.
General and Administrative Expenses. General and administrative expenses consist primarily of employee salaries, benefits for administrative, executive and finance personnel, legal and accounting, insurance, and corporate general and administrative services. General and administrative expenses were $24,818,000 and $17,800,000 for the years ended December 31, 2019 and 2018, respectively, increasing $7,018,000, or 39.4% between periods. Legal and product liability defense costs increased $4,659,000, associated primarily with one pending class action case, which the Company continues to vigorously defend itself against. There was also a $1,390,000 increase in incentive compensation. The increase was primarily created by an increase in the value of prior equity awards driven by the surge in the Company’s stock price during 2019; however, the impact of the equity awards was partially offset by a decrease in the incentive compensation component which is aligned with profitability. Other professional fees also expanded by $780,000. As a percentage of net sales, general and administrative expenses were 22.3% and 16.4% for the twelve-months ended December 31, 2019 and 2018, respectively.
Engineering Expenses. Engineering expenses consist of development expenses associated with the development of new products, and costs related to enhancements of existing products and manufacturing processes. Engineering expenses decreased $98,000 or 2.0% between periods, being $4,715,000 and $4,813,000 for the years ended December 31, 2019 and 2018, respectively. The Company had ramped up spending on experimental materials during 2018, a majority of which related to the new MediTrac® products, as well as increases in certification and qualification costs. During 2019, the Company had additional staffing and consulting related charges. As a percentage of net sales for the year, engineering expenses were 4.2% in 2019 and 4.4% in 2018.
Operating Profit. Reflecting all of the factors mentioned above, operating profits decreased $4,444,000, or 16.9%, between periods, reflecting a profit of $21,922,000 in 2019, as compared to $26,366,000 in 2018.
Interest Income. Interest income is recorded on cash investments, and interest expense is recorded at times when the Company has debt amounts outstanding on its line of credit. There was $876,000 of interest income recorded during 2019 and $488,000 in 2018.
Other Income (Expense). Other income (expense) primarily consists of foreign currency exchange gains (losses) on transactions within our foreign subsidiaries, and therefore tends to fluctuate with the strengthening and or weakening of the British Pound. The Company recognized other income of $56,000 during 2019 and other expense of $126,000 during 2018.
Income Tax Expense. Income Tax Expense was $5,429,000 for 2019, compared to $6,451,000 for 2018. The $1,022,000 or 15.8% decrease in tax expense was largely the result of the decrease in income before taxes. A lower rate was in effect during both 2019 and 2018 attributable to the Tax Cuts and Jobs Act enacted at the end of 2017. The Act reduced the U.S. federal tax rate from 35% to 21%, effective for the Company’s 2018 tax year. The Company’s tax provision also reflects other changes as a result of the Act, including the impact of the Global Intangible Low Taxed Income provisions, and changes effecting the deductibility of certain executive compensation.
| -22- |
Twelve-months ended December 31, 2018 vs. December 31, 2017
The Company reported comparative results from operations for the twelve-month period ended December 31, 2018 and 2017 as follows:
Twelve-months ended December 31, (dollars in thousands) | ||||||||||||||||
| 2018 | 2018 | 2017 | 2017 | |||||||||||||
| Net Sales | $ | 108,313 | 100.0 | % | $ | 101,799 | 100.0 | % | ||||||||
| Gross Profit | $ | 66,096 | 61.0 | % | $ | 61,766 | 60.7 | % | ||||||||
| Operating Profit | $ | 26,366 | 24.3 | % | $ | 24,217 | 23.8 | % | ||||||||
Net Sales. The Company’s sales for the full year of 2018 were $108,313,000, reflecting an increase of $6,514,000, or 6.4%, over $101,799,000 in 2017. The increase in sales resulted from an increase in unit volume, combined with higher sales prices that were necessary to help offset a rise in the Company’s material costs.
Gross Profit. The Company’s gross profit margins increased slightly between the two periods, at 61.0% and 60.7% for the twelve-months ended December 31, 2018 and 2017, respectively.
Selling Expenses. Selling expenses consist primarily of employee salaries and associated overhead costs, commissions, and the cost of marketing programs such as advertising, trade shows and related communication costs, and freight. Selling expense was $17,117,000 and $16,359,000 for 2018 and 2017, respectively, representing a year over year increase of $758,000, or 4.6%. The increase was primarily attributable to an increase in freight and commissions, which change in conjunction with sales unit volume. For the same periods, selling expense as a percentage of net sales was 15.8% and 16.1%, respectively.
General and Administrative Expenses. General and administrative expenses consist primarily of employee salaries, benefits for administrative, executive and finance personnel, legal and accounting, insurance, and corporate general and administrative services. General and administrative expenses were $17,800,000 and $17,897,000 for the years ended December 31, 2018 and 2017, respectively, decreasing $97,000, or 0.5% between periods. As a percentage of net sales, general and administrative expenses were 16.4% and 17.6% for the twelve-months ended December 31, 2018 and 2017, respectively.
Engineering Expenses. Engineering expenses consist of development expenses associated with the development of new products, and costs related to enhancements of existing products and manufacturing processes. Engineering expenses increased $1,520,000 or 46.2% between periods, being $4,813,000 and $3,293,000 for the years ended December 31, 2018 and 2017, respectively. The Company had ramped up spend on experimental materials during 2018, a majority of which related to the new MediTrac products. The Company also had additional staffing and consulting related charges. As a percentage of net sales for the year, engineering expenses were 4.4% in 2018 and 3.2% in 2017.
Operating Profit. Reflecting all of the factors mentioned above, operating profits increased $2,149,000, or 8.9%, between periods, ending with a profit of $26,366,000 in 2018, compared to $24,217,000 in 2017.
Interest Income. Interest income is recorded on cash investments, and interest expense is recorded at times when the Company has debt amounts outstanding on its line of credit. Interest rates in general have improved in the market, and the Company has therefore been able to purchase short-term investments during 2018 which resulted in an increase of interest income in excess of those generated from last year. There was $488,000 of interest income recorded during 2018 and $117,000 in 2017.
Other Income (Expense). Other income (expense) primarily consists of foreign currency exchange gains (losses) on transactions within our foreign subsidiaries, and therefore tends to fluctuate with the strengthening and or weakening of the British Pound. The Company recognized other expense of $126,000 and $38,000 during 2018 and 2017, respectively.
| -23- |
Income Tax Expense. Income tax expense was $6,451,000 during 2018, compared to $8,450,000 in 2017, decreasing by $1,999,000, or 23.7%. The Company recognized a one-time tax charge of $709,000 during the fourth quarter of 2017 primarily related to unremitted foreign earnings resulting from the change in the tax code during the end of 2017, described as the “Act”, which is outlined in Note 7, “Income Taxes”. There was also a lower tax rate in effect during 2018 attributable to the Act, which reduced the U.S. corporate tax rate from 35% to 21%, effective for the Company’s 2018 tax year. The Company’s tax provision also reflects other changes as a result of the Act, including the impact of GILTI provisions, and changes affecting the deductibility of certain executive compensation. The decrease in taxes attributable to the Act, was partially offset by higher taxes associated with an increase in income before taxes.
COMMITMENTS AND CONTINGENCIES
See Note 10, to the Consolidated Financial Statements included in this report for a detailed description of commitments and contingencies.
FUTURE IMPACT OF KNOWN TRENDS OR UNCERTAINTIES
The Company’s operations are sensitive to a number of market and extrinsic factors, any one of which could materially adversely affect the Company’s business, competitive position, results of operations or financial condition in any given year. See Item 1A, Risk Factors, for a detailed description.
CRITICAL ACCOUNTING POLICIES AND USE OF ESTIMATES
Note 2, Significant Accounting Policies, to the Consolidated Financial Statements included in this report, includes a summary of the significant accounting policies and methods used in the preparation of our Consolidated Financial Statements.
The preparation of financial statements in conformity with generally accepted accounting principles (GAAP) requires management to make estimates and assumptions that affect the reported amounts of assets and liabilities and the disclosure of contingent assets and liabilities at the dates of the financial statements and the reported amounts of revenues and expenses during the reporting periods. The most significant estimates and assumptions relate to revenue recognition and related sales incentives, accounts receivable allowances, investment valuations, inventory valuations, goodwill valuation, product liability reserve, phantom stock and accounting for income taxes. Actual amounts could differ significantly from these estimates.
Our critical accounting policies and significant estimates and assumptions are described in more detail as follows:
Revenue Recognition
Effective January 1, 2018, the Company adopted the requirements of Accounting Standards Update 2014-09, Revenue from Contracts with Customers (Topic 606). The standard is a comprehensive new revenue recognition model that requires revenue to be recognized in a manner to depict the transfer of goods or services to a customer at an amount that reflects the consideration expected to be received in exchange for those goods or services.
The guidance permits two methods of adoption: retrospectively to each prior reporting period presented (full retrospective method), or retrospectively with the cumulative effect of initially applying the guidance recognized at the date of initial application (the modified retrospective approach). The Company selected the modified retrospective approach however there was no material impact which required a cumulative effect adjustment.
The principle of Topic 606 was achieved through applying the following five-step approach:
| ● | Identification of the contract, or contracts, with a customer — a contract with a customer exists when the Company enters into an enforceable contract with a customer, typically a purchase order initiated by the customer, that defines each party’s rights regarding the goods to be transferred and identifies the payment terms related to these goods. |
| -24- |
| ● | Identification of the performance obligations in the contract — performance obligations promised in a contract are identified based on the goods that will be transferred to the customer that are distinct, whereby the customer can benefit from the goods on their own or together with other resources that are readily available from third parties or from us. Persuasive evidence of an arrangement for the sale of product must exist. The Company ships product in accordance with the purchase order and standard terms as reflected within the Company’s order acknowledgments and sales invoices. | |
| ● | Determination of the transaction price —the transaction price is determined based on the consideration to which the Company will be entitled in exchange for transferring goods to the customer. This would be the agreed upon quantity and price per product type in accordance with the customer purchase order, which is aligned with the Company’s internally approved pricing guidelines. | |
| ● | Allocation of the transaction price to the performance obligations in the contract — if the contract contains a single performance obligation, the entire transaction price is allocated to the single performance obligation. This applies to the Company as there is only one performance obligation to ship the goods. | |
| ● | Recognition of revenue when, or as, the Company satisfies a performance obligation — the Company satisfies performance obligations at a point in time when control of the goods transfers to the customer. Determining the point in time when control transfers requires judgment. Indicators considered in determining whether the customer has obtained control of a good include: |
| ● | The Company has a present right to payment | |
| ● | The customer has legal title to the goods | |
| ● | The Company has transferred physical possession of the goods | |
| ● | The customer has the significant risks and rewards of ownership of the goods | |
| ● | The customer has accepted the goods |
It is important to note that the indicators are not a set of conditions that must be met before the Company can conclude that control of the goods has transferred to the customer. The indicators are a list of factors that are often present if a customer has control of the goods.
The Company has typical, unmodified FOB shipping point terms. As the seller, the Company can determine that the shipped goods meet the agreed-upon specifications in the contract or customer purchase order (e.g. items, quantities, and prices) with the buyer, so customer acceptance would be deemed a formality, as noted in ASC 606-10-55-86. As a result, the Company has a legal right to payment upon shipment of the goods.
Based upon the above, the Company has concluded that transfer of control substantively transfers to the customer upon shipment.
Other considerations of Topic 606 include the following:
| ● | Contract Costs - costs to obtain a contract (e.g. customer purchase order) include sales commissions. Under Topic 606, these costs may be expensed as incurred for contracts with a duration of one year or less. The majority of the Company’s customer purchase orders are fulfilled (e.g. goods are shipped) within two days of receipt. | |
| ● | Warranties - the Company does not offer customers to purchase a warranty separately. Therefore there is not a separate performance obligation. The Company does account for warranties as a cost accrual and the warranties do not include any additional distinct services other than the assurance that the goods comply with agreed-upon specifications. There is no impact of warranties under Topic 606 upon the financial reporting of the Company. | |
| ● | Returned Goods - from time to time, the Company provides authorization to customers to return goods. If deemed to be material, the Company would record a “right of return” asset for the cost of the returned goods which would reduce cost of sales. |
| -25- |
| ● | Volume Rebates (Promotional Incentives) - volume rebates are variable (dependent upon the volume of goods purchased by our eligible customers) and, under Topic 606, must be estimated and recognized as a reduction of revenue as performance obligations are satisfied (e.g. upon shipment of goods). Also under Topic 606, to ensure that revenue recognized would not be probable of a significant reversal, the four following factors are considered: |
| ● | The amount of consideration is highly susceptible to factors outside the Company’s influence. | |
| ● | The uncertainty about the amount of consideration is not expected to be resolved for a long period of time. | |
| ● | The Company’s experience with similar types of contracts is limited. | |
| ● | The contract has a large number and broad range of possible consideration amounts. |
If it was concluded that the above factors were in place for the Company, it would support the probability of a significant reversal of revenue. However, as none of the four factors apply to the Company, promotional incentives are recorded as a reduction of revenue based upon estimates of the eligible products expected to be sold.
Regarding disaggregated revenue disclosures, as previously noted, the Company’s business is controlled as a single operating segment that consists of the manufacture and sale of flexible metal hose. Most of the Company’s transactions are very similar in nature, contract, terms, timing, and transfer of control of goods. As indicated within Note 2, Significant Accounting Policies, to the Consolidated Financial Statements included in this report, under the caption “Significant Concentration”, the majority of the Company’s sales were geographically contained within North America, with the remainder scattered internationally. All performance assessments and resource allocations are generally based upon the review of the results of the Company as a whole.
Accounts Receivable and Provision for Doubtful Accounts
Accounts receivable are reduced by an allowance for amounts that may become uncollectible in the future. The estimated allowance for uncollectible amounts is based primarily on specific analysis of accounts in the receivable portfolio and historical write-off experience. While management believes the allowance to be adequate, if the financial condition of the Company’s customers were to deteriorate, resulting in their inability to make payments, additional allowances may be required.
Investments
The Company invests excess funds in liquid interest earning instruments including U.S. Treasury bills and bank time deposits. These investments are stated at fair value, which approximates amortized cost, and are classified as available-for-sale in accordance with Accounting Standards Codification 320, Investments – Debt and Equity Securities (or “ASC 320”). Investments were $0 and $14,944,000 as of December 31, 2019 and 2018, respectively. Maturities, from the date of purchase, were six months or less.
Inventories
Inventories are valued at the lower of cost or net realizable value. The cost of inventories is determined by the first-in, first-out (FIFO) method. The Company generally considers inventory quantities beyond two years of non-usage, measured on a historical usage basis, to be excess inventory and reduces the gross carrying value of inventory accordingly.
Goodwill
In accordance with Financial Accounting Standards Board (FASB) ASC Topic 350, Intangibles – Goodwill and Other, the Company performed an annual impairment test in accordance with this guidance as of December 31, 2019 and also at December 31, 2018. These analyses did not indicate any impairment of goodwill at the end of either period.
| -26- |
Stock-Based Compensation Plans
In 2006, the Company adopted a Phantom Stock Plan (the “Plan”), which allows the Company to grant phantom stock units (Units) to certain key employees, officers or directors. The Units each represent a contractual right to payment of compensation in the future based upon the market value of the Company’s common stock. The Units follow a vesting schedule of three years from the grant date, and are then paid upon maturity. In accordance with FASB ASC Topic 718, Stock Compensation, the Company uses the Black-Scholes option pricing model as its method for determining the fair value of the Units. Further details of the Plan are provided in Note 11, Stock-Based Compensation Plans, to the Consolidated Financial Statements included in this report.
Product Liability Reserves
Product liability reserves represent the estimated unpaid amounts under the Company’s insurance policies with respect to existing claims. The Company uses the most current available data to estimate claims. As explained more fully under Note 10, Commitments and Contingencies, to the Consolidated Financial Statements included in this report for various product liability claims covered under the Company’s general liability insurance policies, the Company must pay certain defense and settlement costs within its deductible or self-insured retention limits, ranging primarily from $25,000 to $1,000,000 per claim, depending on the terms of the policy in the applicable policy year, up to an aggregate amount. The Company is vigorously defending against all known claims.
Leases
Effective January 1, 2019, the Company adopted the requirements of FASB ASU 2016-02, Leases (Topic 842) which defines a lease as any contract that conveys the right to use a specific asset for a period of time in exchange for consideration. Leases are classified as a finance lease, formerly called a capital lease, if any of the following criteria are met:
| 1. | The lease transfers ownership of the underlying asset to the lessee by the end of the lease term. | |
| 2. | The lease grants the lessee an option to purchase the underlying asset that the lessee is reasonably certain to exercise. | |
| 3. | The lease term is for the major part of the remaining economic life of the underlying asset. | |
| 4. | The present value of the sum of lease payments and any residual value guaranteed by the lessee equals or exceeds substantially all of the fair value of the underlying asset. | |
| 5. | The underlying asset is of such a specialized nature that it is expected to have no alternative use to the lessor at the end of the lease term. |
For any leases that do not meet the criteria identified above for finance leases, the Company treats such leases as operating leases. As of December 31, 2019, each of the Company’s leases are classified as operating leases.
Under the new guidance, both finance and operating leases are reflected on the balance sheet as lease or “right-of-use” assets and lease liabilities. It should be noted that under previous guidance operating leases (non-capital leases) were not required to be recorded as an asset on the balance sheet.
There are some exceptions, which the Company has elected in its accounting policies. For leases with terms of twelve months or less, or below the Company’s general capitalization policy threshold, the Company elects an accounting policy to not recognize lease assets and lease liabilities for all asset classes. The Company recognizes lease expense for such leases generally on a straight-line basis over the lease term.
The Company determines if a contract is a lease at the inception of the arrangement. The Company reviews all options to extend, terminate, or purchase its right-of-use assets at the inception of the lease and accounts for these options when they are reasonably certain to be exercised. Certain leases contain non-lease components, such as common area maintenance, which are generally accounted for separately. In general, the Company will assess if non-lease components are fixed and determinable, or variable, when determining if the component should be included in the lease liability. For purposes of calculating the present value of the lease obligations, the Company utilizes the implicit interest rate within the lease agreement when known and/or determinable, and otherwise utilizes its incremental borrowing rate at the time of the lease agreement.
| -27- |
As permitted under ASU 2018-11, the Company elected the optional transition method to adopt the new leases standard. Under this new transition method, the Company initially applied the new leases standard at the adoption date of January 1, 2019 and would have recognized a cumulative-effect adjustment, if appropriate, to the opening balance of retained earnings in the period of adoption. No cumulative-effect adjustment was recognized. The Company’s reporting for the comparative periods prior to 2019 in the financial statements are presented in accordance with existing GAAP in effect for 2018 and earlier (ASC Topic 840, Leases).
The impact of the adoption of this new standard resulted in an increase to the Company’s operating lease assets and liabilities on January 1, 2019 of approximately $800,000. The implementation did not have a material impact on the Company’s consolidated statements of income and statements of cash flows.
Fair Value of Financial and Nonfinancial Instruments
The Company measures financial instruments in accordance with FASB ASC Topic 820, Fair Value Measurements and Disclosures. The accounting standard defines fair value, establishes a framework for measuring fair value under GAAP, and enhances disclosures about fair value measurements. Fair value is defined as the exchange price that would be received for an asset or paid to transfer a liability (an exit price) in the principal or most advantageous market for the asset or liability in an orderly transaction between market participants on the measurement date. Valuation techniques used to measure fair value must maximize the use of observable inputs and minimize the use of unobservable inputs. The standard creates a fair value hierarchy which prioritizes the inputs to valuation techniques used to measure fair value into three broad levels as follows: Level 1 inputs are quoted prices (unadjusted) in active markets for identical assets or liabilities; Level 2 inputs are inputs other than quoted prices included within Level 1 that are observable for the asset or liability, either directly or indirectly; and Level 3 inputs are unobservable inputs that reflect the Company’s own assumptions about the assumptions market participants would use in pricing the asset or liability. The Company relies upon Level 1 inputs in determining the fair value of investments and the fair value of the Company’s reporting unit in its annual impairment test as described in the FASB ASC Topic 350, Intangibles - Goodwill and Other.
Earnings per Common Share
Basic earnings per share have been computed using the weighted-average number of common shares outstanding. For the periods presented, there are no dilutive securities. Consequently, basic and dilutive earnings per share are the same.
Currency Translation
Assets and liabilities denominated in foreign currencies are translated into U.S. dollars at exchange rates prevailing on the balance sheet dates. The Statements of Operations are translated into U.S. dollars at average exchange rates for the period. Adjustments resulting from the translation of financial statements are excluded from the determination of income and are accumulated in a separate component of shareholders’ equity. Exchange gains and losses resulting from foreign currency transactions are included in the Statements of Operations (other income (expense)) in the period in which they occur.
Income Taxes
The Company accounts for tax liabilities in accordance with the FASB ASC Topic 740, Income Taxes. Under this method the Company recorded tax expense, related deferred taxes and tax benefits, and uncertainties in tax positions.
| -28- |
Deferred tax assets and liabilities are recognized for the future tax consequences attributable to differences between the financial statements carrying amounts of existing assets and liabilities and their respective tax bases. Deferred tax assets and liabilities are measured using enacted tax rates expected to apply to taxable income in the years in which those temporary differences are expected to be recovered or settled. The effect on deferred tax assets and liabilities from a change in tax rates is recognized in income in the period that includes the enactment date. A valuation allowance is provided for deferred tax assets if it is more likely than not that these items will either expire before the Company is able to realize the benefit, or that future deductibility is uncertain.
The FASB ASC Topic 740, Income Taxes, clarifies the criteria that an individual tax position must satisfy for some or all of the benefits of that position to be recognized in a company’s financial statements. This guidance prescribes a recognition threshold of more-likely than-not, and a measurement attribute for all tax positions taken or expected to be taken on a tax return, in order for those tax positions to be recognized in the financial statements.
The Company follows the provisions of ASC 740-10 relative to accounting for uncertainties in tax positions. These provisions provide guidance on the recognition, de-recognition and measurement of potential tax benefits associated with tax positions.
The Company reflected the effects of the 2017 Tax Cuts and Jobs Act (the “Act”), in its 2017 financial statements. This included the effects of the change in the US corporate tax rate from 35% to 21% on deferred tax assets and liabilities, and a provision related to previously deferred taxes on earnings of the Company’s foreign subsidiary. The Company’s tax expense for the periods ended December 31, 2018 and 2019 includes the continuing effect of the reduction in the US corporate tax rate from 35% to 21%, effective for the Company’s 2018 tax year. The Company’s tax provision also reflects other changes as a result of the Act, including the impact of the Global Intangible Low Taxed Income (“GILTI”) provisions, and changes affecting the deductibility of certain executive compensation.
LIQUIDITY AND CAPITAL RESOURCES
Historically, the Company’s primary cash needs have been related to working capital items, which the Company has largely funded through cash generated from operations.
With regards to liquidity and capital resources, the Company had a cash balance of $16,098,000 at December 31, 2019, with no short-term investments, and the full use of a $15,000,000 line of credit available with Santander Bank, N.A. as discussed in detail in Note 5, Line of Credit, to the Consolidated Financial Statements included in this report. At December 31, 2018, the Company had cash of $32,392,000 and short-term investments of $14,944,000. The $15,000,000 line of credit from Santander Bank, N.A. was also fully available as of December 31, 2018.
Operating Activities
Cash provided by operating activities is net income adjusted for certain non-cash items and changes in certain assets and liabilities, such as those included in working capital.
For 2019, the Company’s cash provided from operating activities was $16,041,000, compared to $21,058,000 of cash provided during 2018, a decrease of $5,017,000 between periods. For 2018, the Company’s cash provided from operating activities was $21,058,000, compared to $18,048,000 of cash provided during 2017, thus increasing by $3,010,000 between periods. For details of the operating cash flows refer to the consolidated statements of cash flows in Item 8. Financial Statements and Supplementary Data on page 40.
As a general trend, the Company tends to deplete cash early in the year, as significant payments are typically made for accrued promotional incentives, incentive compensation, and taxes. Cash has then historically shown a tendency to be restored and accumulated during the latter portion of the year. However, as described previously, during December 2019, the Company liquidated its investments to support the payment of a special dividend to shareholders totaling $35,330,000, as outlined in Note 6, Shareholders’ Equity, to the Consolidated Financial Statements included in this report.
| -29- |
Investing Activities
Cash provided by investing activities during 2019 was $13,719,000 and cash used in investing activities during 2018 was $16,868,000. During 2019, the Company liquidated its short-term investments to support the payment of a special dividend to shareholders. Cash proceeds from the sale of short-term investments of $70,882,000 were partially offset by the purchase of the short-term investments of $55,938,000. The net cash provided from the liquidation of the short-term investments was partially offset by capital expenditures of $1,225,000. Capital expenditures during 2019 continued to mainly relate to capital projects designated for the new MediTrac® products. Cash used in investing activities during 2018 and 2017 was $16,868,000 and $3,093,000, respectively. During 2018, cash was used to purchase short-term investments of $35,099,000 and for capital expenditures of $1,924,000, which was partially offset by cash received from net proceeds from the sale of short-term investments of $20,155,000. Capital expenditures during 2018 mainly related to capital projects designated for the new MediTrac® products. During 2017, cash was used solely for capital expenditures mainly related to the purchase of a 30,000 square foot facility in Exton, Pennsylvania, which required a cash outlay of approximately $2,500,000. This facility was previously under lease through January 2018.
Financing Activities
Omega Flex, Inc. declared regular quarterly dividends in the aggregate amount of $2,422,000 in April 2019, and $2,826,000 each in June, September and December 2019, which were subsequently paid in April 2019, July 2019, October 2019, and January 2020, respectively. In December 2019, a special dividend was declared and paid to shareholders totaling $35,330,000. Additionally, there were dividends paid in July and December 2019 by the Company’s foreign subsidiary, which amounted to an outlay of cash of $202,000 to the foreign subsidiary’s noncontrolling interest. Also, the Company declared regular quarterly dividends in the aggregate amount of $2,220,000 in April, and $2,422,000 each in June, September and December 2018, which were subsequently paid in April 2018, July 2018, October 2018, and January 2019, respectively. Additionally, there was a dividend that was paid in April 2018 by the Company’s foreign subsidiary, which amounted to an outlay of cash of $491,000 to the foreign subsidiary’s noncontrolling interest.
Each of these dividends are outlined in Note 6, Shareholders’ Equity, to the Consolidated Financial Statements included in this report. The Company had no borrowings or payments on its line of credit during 2019 or 2018.
Liquidity
We believe our existing cash and cash equivalents will be sufficient to meet our anticipated cash needs for at least the next 12 months. Our future capital requirements will depend upon many factors including our rate of revenue growth, the timing and extent of any expansion efforts, and the potential for investments in, or the acquisition of any complementary products, businesses or supplementary facilities for additional capacity.
RECENT ACCOUNTING PRONOUNCEMENTS
In January 2017, the FASB amended ASC Topic 350, Intangibles – Goodwill and Other (issued under ASU 2017-04, “Simplifying the Test for Goodwill Impairment”). This amendment simplifies the test for goodwill impairment by only requiring an entity to perform an annual or interim goodwill impairment test by comparing the fair value of a reporting unit with its carrying amount and recognize an impairment charge for the amount that the carrying amount exceeds the reporting unit’s fair value. Any loss recognized should not exceed the total amount of goodwill allocated to that reporting unit. The amendment requires adoption on January 1, 2020. The Company does not expect that the adoption of ASU 2017-04 will have a material impact on its consolidated financial statements.
| -30- |
In June 2016, the FASB issued ASU 2016-13, Financial Instruments—Credit Losses (Topic 326): Measurement of Credit Losses on Financial Instruments, which creates a new credit impairment standard for financial assets measured at amortized cost and available-for-sale debt securities. The ASU requires financial assets measured at amortized cost (including loans, trade receivables and held-to-maturity debt securities) to be presented at the net amount expected to be collected, through an allowance for credit losses that are expected to occur over the remaining life of the asset, rather than incurred losses. The ASU requires that credit losses on available-for-sale debt securities be presented as an allowance rather than as a direct write-down. The measurement of credit losses for newly recognized financial assets (other than certain purchased assets) and subsequent changes in the allowance for credit losses are recorded in the statement of income as the amounts expected to be collected change. The ASU is effective for fiscal years beginning after December 15, 2019. The Company is currently evaluating the impact of adopting this new guidance on its consolidated financial statements and does not expect the impact to be significant.
Off-Balance Sheet Obligations or Arrangements
None.
TABULAR DISCLOSURE OF CONTRACTUAL OBLIGATIONS AND OFF-BALANCE SHEET ARRANGEMENTS
Contractual Obligation and Commercial Commitments
The Company’s primary contractual obligations as of December 31, 2019 are summarized in the following table and are more fully explained in Notes to the Consolidated Financial Statements.
| Payments Due by Period | ||||||||||||||||||||
| (in thousands) | ||||||||||||||||||||
| Contractual Obligations | Total | Less than 1-year | 1 -3 years | 4 -5 years | After 5 year | |||||||||||||||
| Operating Lease Obligations | $ | 787 | $ | 369 | $ | 338 | $ | 80 | $ | — | ||||||||||
| Purchase Obligations | 27,595 | 27,595 | 0 | 0 | 0 | |||||||||||||||
| Other Long-Term Liabilities | 72 | 12 | 24 | 24 | 12 | |||||||||||||||
| Total Contractual Cash Obligations | $ | 28,454 | $ | 27,976 | $ | 362 | $ | 104 | $ | 12 | ||||||||||
The Company is obligated to make payments related to a deferred compensation plan, as detailed in Note 10, Commitments and Contingencies, to the Company’s financial statements. The timing of all of these payments is currently not known as it is contingent upon the retirement of the applicable employee(s), and therefore such payments are not included in the above table. The total net present value of the amount of deferred compensation which is not expressed in the above table is $425,000 at December 31, 2019, which would be paid over a period of 15 years. Additionally, as explained in Note 11, Stock Based Compensation Plans, to the Consolidated Financial Statements included in this report, the Company is obligated to make payments to plan participants. Due to the uncertain nature of the payments, due to numerous variables, including the potential change in stock price, and employment status of participants and any applicable forfeitures, the amounts are not disclosed in the above table. The liability associated with this Plan as of December 31, 2019 was $3,201,000, of which $1,508,000 is anticipated to be paid within the next year, and the remainder thereafter.
Item 7A - QUANTITATIVE AND QUALITATIVE DISCLOSURES ABOUT MARKET RISKS
The Company does not engage in the purchase or trading of market risk sensitive instruments. The Company does not presently have any positions with respect to hedge transactions such as forward contracts relating to currency fluctuations. No market risk sensitive instruments are held for speculative or trading purposes.
| -31- |
Item 8. FINANCIAL STATEMENTS AND SUPPLEMENTARY DATA
| -32- |
REPORT OF INDEPENDENT REGISTERED PUBLIC ACCOUNTING FIRM
To the Shareholders and the Board of Directors of Omega Flex, Inc.
Opinion on the Financial Statements
We have audited the accompanying consolidated balance sheets of Omega Flex, Inc. and its subsidiaries (the Company) as of December 31, 2019 and 2018, the related consolidated statements of operations, comprehensive income, shareholders’ equity and cash flows for each of the three years in the period ended December 31, 2019, and the related notes to the consolidated financial statements (collectively, the financial statements). In our opinion, the financial statements present fairly, in all material respects, the financial position of the Company as of December 31, 2019 and 2018, and the results of its operations and its cash flows for each of the three years in the period ended December 31, 2019, in conformity with accounting principles generally accepted in the United States of America.
We have also audited, in accordance with the standards of the Public Company Accounting Oversight Board (United States) (PCAOB), the Company’s internal control over financial reporting as of December 31, 2019, based on criteria established in Internal Control — Integrated Framework issued by the Committee of Sponsoring Organizations of the Treadway Commission in 2013, and our report dated March 9, 2020 expressed an unqualified opinion on the effectiveness of the Company’s internal control over financial reporting.
Basis for Opinion
These financial statements are the responsibility of the Company’s management. Our responsibility is to express an opinion on the Company’s financial statements based on our audits. We are a public accounting firm registered with the PCAOB and are required to be independent with respect to the Company in accordance with U.S. federal securities laws and the applicable rules and regulations of the Securities and Exchange Commission and the PCAOB.
We conducted our audits in accordance with the standards of the PCAOB. Those standards require that we plan and perform the audits to obtain reasonable assurance about whether the financial statements are free of material misstatement, whether due to error or fraud. Our audits included performing procedures to assess the risks of material misstatement of the financial statements, whether due to error or fraud, and performing procedures that respond to those risks. Such procedures included examining, on a test basis, evidence regarding the amounts and disclosures in the financial statements. Our audits also included evaluating the accounting principles used and significant estimates made by management, as well as evaluating the overall presentation of the financial statements. We believe that our audits provide a reasonable basis for our opinion.
/s/ RSM US LLP
We have served as the Company’s auditor since 2010.
Blue Bell, Pennsylvania
March 9, 2020
| -33- |
REPORT OF INDEPENDENT REGISTERED PUBLIC ACCOUNTING FIRM
To the Shareholders and the Board of Directors of Omega Flex, Inc.
Opinion on the Internal Control Over Financial Reporting
We have audited Omega Flex, Inc.’s (the Company) internal control over financial reporting as of December 31, 2019, based on criteria established in Internal Control — Integrated Framework issued by the Committee of Sponsoring Organizations of the Treadway Commission in 2013. In our opinion, the Company maintained, in all material respects, effective internal control over financial reporting as of December 31, 2019, based on criteria established in Internal Control — Integrated Framework issued by the Committee of Sponsoring Organizations of the Treadway Commission in 2013.
We have also audited, in accordance with the standards of the Public Company Accounting Oversight Board (United States) (PCAOB), the 2019 consolidated financial statements of the Company and our report dated March 9, 2020 expressed an unqualified opinion.
Basis for Opinion
The Company’s management is responsible for maintaining effective internal control over financial reporting and for its assessment of the effectiveness of internal control over financial reporting in the accompanying Management’s Report on Internal Control over Financial Reporting. Our responsibility is to express an opinion on the Company’s internal control over financial reporting based on our audit. We are a public accounting firm registered with the PCAOB and are required to be independent with respect to the Company in accordance with U.S. federal securities laws and the applicable rules and regulations of the Securities and Exchange Commission and the PCAOB.
We conducted our audit in accordance with the standards of the PCAOB. Those standards require that we plan and perform the audit to obtain reasonable assurance about whether effective internal control over financial reporting was maintained in all material respects. Our audit included obtaining an understanding of internal control over financial reporting, assessing the risk that a material weakness exists, and testing and evaluating the design and operating effectiveness of internal control based on the assessed risk. Our audit also included performing such other procedures as we considered necessary in the circumstances. We believe that our audit provides a reasonable basis for our opinion.
Definition and Limitations of Internal Control Over Financial Reporting
A company’s internal control over financial reporting is a process designed to provide reasonable assurance regarding the reliability of financial reporting and the preparation of financial statements for external purposes in accordance with generally accepted accounting principles. A company’s internal control over financial reporting includes those policies and procedures that (1) pertain to the maintenance of records that, in reasonable detail, accurately and fairly reflect the transactions and dispositions of the assets of the company; (2) provide reasonable assurance that transactions are recorded as necessary to permit preparation of financial statements in accordance with generally accepted accounting principles, and that receipts and expenditures of the company are being made only in accordance with authorizations of management and directors of the company; and (3) provide reasonable assurance regarding prevention or timely detection of unauthorized acquisition, use or disposition of the company’s assets that could have a material effect on the financial statements.
Because of its inherent limitations, internal control over financial reporting may not prevent or detect misstatements. Also, projections of any evaluation of effectiveness to future periods are subject to the risk that controls may become inadequate because of changes in conditions, or that the degree of compliance with the policies or procedures may deteriorate.
/s/ RSM US LLP
Blue Bell, Pennsylvania
March 9, 2020
| -34- |
OMEGA FLEX, INC. AND SUBSIDIARIES
December 31,
(Dollars in Thousands, except Common Stock par value)
| 2019 | 2018 | |||||||
| ASSETS | ||||||||
| Current Assets: | ||||||||
| Cash and Cash Equivalents | $ | 16,098 | $ | 32,392 | ||||
| Accounts Receivable - less allowances of $1,433 and $985, respectively | 17,047 | 16,451 | ||||||
| Investments | - | 14,944 | ||||||
| Inventories – Net | 11,078 | 7,976 | ||||||
| Other Current Assets | 2,097 | 1,859 | ||||||
| Total Current Assets | 46,320 | 73,622 | ||||||
| Right-Of-Use Assets - Operating | 771 | - | ||||||
| Property and Equipment - Net | 8,909 | 8,378 | ||||||
| Goodwill – Net | 3,526 | 3,526 | ||||||
| Deferred Taxes | 4 | 3 | ||||||
| Other Long Term Assets | 1,454 | 1,307 | ||||||
| Total Assets | $ | 60,984 | $ | 86,836 | ||||
| LIABILITIES AND SHAREHOLDERS’ EQUITY | ||||||||
| Current Liabilities: | ||||||||
| Accounts Payable | $ | 2,383 | $ | 2,775 | ||||
| Accrued Compensation | 4,618 | 5,295 | ||||||
| Accrued Commissions and Sales Incentives | 4,461 | 4,264 | ||||||
| Dividends Payable | 2,826 | 2,422 | ||||||
| Taxes Payable | 423 | 58 | ||||||
| Lease Liability - Operating | 369 | - | ||||||
| Other Liabilities | 5,404 | 3,591 | ||||||
| Total Current Liabilities | 20,484 | 18,405 | ||||||
| Lease Liability - Operating, net of current portion | 418 | - | ||||||
| Deferred Taxes | 331 | 566 | ||||||
| Other Long Term Liabilities | 2,175 | 1,544 | ||||||
| Total Liabilities | 23,408 | 20,515 | ||||||
| Commitments and Contingencies (Note 10) | ||||||||
| Shareholders’ Equity: | ||||||||
| Omega Flex, Inc. Shareholders’ Equity: | ||||||||
| Common Stock – par value $0.01 share: authorized 20,000,000 shares: 10,153,633 shares issued at December 31, 2019 and 2018, respectively, and 10,094,322 and 10,091,822 outstanding at December 31, 2019 and 2018, respectively | 102 | 102 | ||||||
| Treasury Stock | (1 | ) | (1 | ) | ||||
| Paid-in Capital | 11,025 | 10,808 | ||||||
| Retained Earnings | 27,165 | 56,110 | ||||||
| Accumulated Other Comprehensive Loss | (909 | ) | (950 | ) | ||||
| Total Omega Flex, Inc. Shareholders’ Equity | 37,382 | 66,069 | ||||||
| Noncontrolling Interest | 194 | 252 | ||||||
| Total Shareholders’ Equity | 37,576 | 66,321 | ||||||
| Total Liabilities and Shareholders’ Equity | $ | 60,984 | $ | 86,836 | ||||
See accompanying Notes which are an integral part of the Consolidated Financial Statements.
| -35- |
OMEGA FLEX, INC. AND SUBSIDIARIES
CONSOLIDATED STATEMENTS OF OPERATIONS
For the years ended December 31,
(Amounts in thousands, except earnings per common shares)
| 2019 | 2018 | 2017 | ||||||||||
| Net Sales | $ | 111,360 | $ | 108,313 | $ | 101,799 | ||||||
| Cost of Goods Sold | 40,873 | 42,217 | 40,033 | |||||||||
| Gross Profit | 70,487 | 66,096 | 61,766 | |||||||||
| Selling Expense | 19,032 | 17,117 | 16,359 | |||||||||
| General and Administrative Expense | 24,818 | 17,800 | 17,897 | |||||||||
| Engineering Expense | 4,715 | 4,813 | 3,293 | |||||||||
| Operating Profit | 21,922 | 26,366 | 24,217 | |||||||||
| Interest Income | 876 | 488 | 117 | |||||||||
| Other Income (Expense) | 56 | (126 | ) | (38 | ) | |||||||
| Income Before Income Taxes | 22,854 | 26,728 | 24,296 | |||||||||
| Income Tax Expense | 5,429 | 6,451 | 8,450 | |||||||||
| Net Income | 17,425 | 20,277 | 15,846 | |||||||||
| Less: Net Income – Noncontrolling Interest | (139 | ) | (138 | ) | (184 | ) | ||||||
| Net Income attributable to Omega Flex, Inc. | $ | 17,286 | $ | 20,139 | $ | 15,662 | ||||||
| Basic and Diluted Earnings per Common Share | $ | 1.71 | $ | 2.00 | $ | 1.55 | ||||||
| Cash Dividends Declared per Common Share | $ | 4.58 | $ | 0.94 | $ | 0.66 | ||||||
| Basic and Diluted Weighted Average Shares Outstanding | 10,093 | 10,092 | 10,092 | |||||||||
See accompanying Notes which are an integral part of the Consolidated Financial Statements.
| -36- |
OMEGA FLEX, INC.
CONSOLIDATED STATEMENTS OF COMPREHENSIVE INCOME
For the years ended December 31,
(Dollars in Thousands)
| 2019 | 2018 | 2017 | ||||||||||
| Net Income | $ | 17,425 | $ | 20,277 | $ | 15,846 | ||||||
| Other Comprehensive Income (Loss): | ||||||||||||
| Foreign Currency Translation Adjustment | 46 | (48 | ) | 822 | ||||||||
| Other Comprehensive Income (Loss) | 46 | (48 | ) | 822 | ||||||||
| Comprehensive Income | 17,471 | 20,229 | 16,668 | |||||||||
| Less: Comprehensive Income Attributable to the Noncontrolling Interest | (144 | ) | (132 | ) | (229 | ) | ||||||
| Total Other Comprehensive Income | $ | 17,327 | $ | 20,097 | $ | 16,439 | ||||||
See accompanying Notes which are an integral part of the Consolidated Financial Statements.
| -37- |
OMEGA FLEX, INC. AND SUBSIDIARIES
CONSOLIDATED STATEMENTS OF SHAREHOLDERS’ EQUITY
For the years ended December 31, 2019, 2018 and 2017
(Dollars in Thousands)
Common Stock Outstanding | Common Stock | Treasury Stock | Paid In Capital | Retained Earnings | Accumulated Other Comprehensive Income (Loss) | Noncontrolling Interest | Shareholders’ Equity | |||||||||||||||||||||||||
| Balance - December 31, 2016 | 10,091,822 | $ | 102 | $ | (1 | ) | $ | 10,808 | $ | 36,455 | $ | (1,685 | ) | $ | 382 | $ | 46,061 | |||||||||||||||
| Net Income | 15,662 | 184 | 15,846 | |||||||||||||||||||||||||||||
| Cumulative Translation Adjustment | 777 | 45 | 822 | |||||||||||||||||||||||||||||
| Dividends Declared | (6,660 | ) | (6,660 | ) | ||||||||||||||||||||||||||||
| Balance - December 31, 2017 | 10,091,822 | $ | 102 | $ | (1 | ) | $ | 10,808 | $ | 45,457 | $ | (908 | ) | $ | 611 | $ | 56,069 | |||||||||||||||
| Net Income | 20,139 | 138 | 20,277 | |||||||||||||||||||||||||||||
| Cumulative Translation Adjustment | (42 | ) | (6 | ) | (48 | ) | ||||||||||||||||||||||||||
| Dividends Declared | (9,486 | ) | (491 | ) | (9,977 | ) | ||||||||||||||||||||||||||
| Balance - December 31, 2018 | 10,091,822 | $ | 102 | $ | (1 | ) | $ | 10,808 | $ | 56,110 | $ | (950 | ) | $ | 252 | $ | 66,321 | |||||||||||||||
| Net Income | 17,286 | 139 | 17,425 | |||||||||||||||||||||||||||||
| Cumulative Translation Adjustment | 41 | 5 | 46 | |||||||||||||||||||||||||||||
| Shares Reissued From Treasury Pursuant To Restricted Stock Unit Awards | 2,500 | 217 | 217 | |||||||||||||||||||||||||||||
| Dividends Declared | (46,231 | ) | (202 | ) | (46,433 | ) | ||||||||||||||||||||||||||
| Balance - December 31, 2019 | 10,094,322 | $ | 102 | $ | (1 | ) | $ | 11,025 | $ | 27,165 | $ | (909 | ) | $ | 194 | $ | 37,576 | |||||||||||||||
See accompanying Notes which are an integral part of the Consolidated Financial Statements.
| -38- |
OMEGA FLEX, INC. AND SUBSIDIARIES
CONSOLIDATED STATEMENTS OF CASH FLOWS
For the years ended December 31,
(Dollars in Thousands)
| 2019 | 2018 | 2017 | ||||||||||
| Cash Flows from Operating Activities: | ||||||||||||
| Net Income | $ | 17,425 | $ | 20,277 | $ | 15,846 | ||||||
| Adjustments to Reconcile Net Income to Net Cash Provided by Operating Activities: | ||||||||||||
| Non-Cash Compensation Expense | 2,472 | 118 | 1,042 | |||||||||
| Depreciation and Amortization | 719 | 543 | 502 | |||||||||
| Provision for Losses on Accounts | ||||||||||||
| Receivable, net of write-offs and recoveries | 748 | 57 | 6 | |||||||||
| Deferred Taxes | (236 | ) | 366 | 72 | ||||||||
| Provision for Inventory Reserves | (15 | ) | (105 | ) | 171 | |||||||
| Changes in Assets and Liabilities: | ||||||||||||
| Accounts Receivable | (1,282 | ) | (979 | ) | (463 | ) | ||||||
| Inventories | (3,025 | ) | 61 | (699 | ) | |||||||
| Other Assets | (383 | ) | 1,804 | (40 | ) | |||||||
| Accounts Payable | (401 | ) | 205 | 251 | ||||||||
| Accrued Compensation | (693 | ) | 468 | 490 | ||||||||
| Accrued Commissions and Sales Incentives | 190 | (11 | ) | 574 | ||||||||
| Lease Liability, Net | 16 | - | - | |||||||||
| Other Liabilities | 506 | (1,746 | ) | 296 | ||||||||
| Net Cash Provided by Operating Activities | 16,041 | 21,058 | 18,048 | |||||||||
| Cash Flows from Investing Activities: | ||||||||||||
| Purchase of Investments | (55,938 | ) | (35,099 | ) | - | |||||||
| Net Proceeds from Sale of Investments | 70,882 | 20,155 | - | |||||||||
| Capital Expenditures | (1,225 | ) | (1,924 | ) | (3,093 | ) | ||||||
| Net Cash Provided by (Used In) Investing Activities | 13,719 | (16,868 | ) | (3,093 | ) | |||||||
| Cash Flows from Financing Activities: | ||||||||||||
| Dividends Paid | (46,028 | ) | (9,775 | ) | (13,018 | ) | ||||||
| Net Cash Used In Financing Activities | (46,028 | ) | (9,775 | ) | (13,018 | ) | ||||||
| Net (Decrease) Increase in Cash and Cash Equivalents | (16,268 | ) | (5,585 | ) | 1,937 | |||||||
| Translation effect on cash | (26 | ) | 39 | 683 | ||||||||
| Cash and Cash Equivalents - Beginning of Year | 32,392 | 37,938 | 35,318 | |||||||||
| Cash and Cash Equivalents - End of Year | $ | 16,098 | $ | 32,392 | $ | 37,938 | ||||||
| Supplemental Disclosure of Cash Flow Information | ||||||||||||
| Cash paid for Income Taxes | $ | 5,431 | $ | 7,310 | $ | 7,608 | ||||||
| Declared Dividend | $ | 2,826 | $ | 2,422 | $ | 2,220 | ||||||
See accompanying Notes which are an integral part of the Consolidated Financial Statements.
| -39- |
OMEGA FLEX, INC.
NOTES TO THE CONSOLIDATED FINANCIAL STATEMENTS
1. BASIS OF PRESENTATION AND CONSOLIDATION
Description of Business
The accompanying consolidated financial statements include the accounts of Omega Flex, Inc. (Omega) and its subsidiaries (collectively the “Company”). The Company’s audited consolidated financial statements for the years ended December 31, 2019, 2018 and 2017 have been prepared in accordance with accounting standards set by the Financial Accounting Standards Board (FASB), and with the instructions of Form 10-K and Article 5 of Regulation S-X. All material inter-company accounts and transactions have been eliminated in consolidation.
The Company is a leading manufacturer of flexible metal hose, which is used in a variety of applications to carry gases and liquids within their particular applications. The Company’s business is controlled as a single operating segment that consists of the manufacture and sale of flexible metal hose and accessories. These applications include carrying liquefied gases in certain processing applications, fuel gases within residential and commercial buildings, medical gases in health care facilities, and vibration absorbers in high vibration applications. The Company’s flexible metal piping is also used to carry other types of gases and fluids in a number of industrial applications where the customer requires the piping to have both a degree of flexibility and/or an ability to carry corrosive compounds or mixtures, or to carry at both very high and very low (cryogenic) temperatures.
The Company manufactures flexible metal hose at its facilities in Exton, Pennsylvania and Houston, Texas, in the United States, and in Banbury, Oxfordshire in the UK, and sells its products through distributors, wholesalers and to original equipment manufacturers (“OEMs”) throughout North America, and in certain European markets.
2. SIGNIFICANT ACCOUNTING POLICIES
Use of Estimates
The preparation of financial statements in conformity with generally accepted accounting principles (GAAP) requires management to make estimates and assumptions that affect the reported amounts of assets and liabilities and the disclosure of contingent assets and liabilities at the dates of the financial statements and the reported amounts of revenues and expenses during the reporting periods. The most significant estimates and assumptions relate to revenue recognition and related sales incentives, accounts receivable allowances, investment valuations, inventory valuations, goodwill valuation, product liability reserves, phantom stock and accounting for income taxes. Actual amounts could differ significantly from these estimates.
Revenue Recognition
Effective January 1, 2018, the Company adopted the requirements of Accounting Standards Update 2014-09, Revenue from Contracts with Customers (Topic 606). The standard is a comprehensive new revenue recognition model that requires revenue to be recognized in a manner to depict the transfer of goods or services to a customer at an amount that reflects the consideration expected to be received in exchange for those goods or services.
The guidance permits two methods of adoption: retrospectively to each prior reporting period presented (full retrospective method), or retrospectively with the cumulative effect of initially applying the guidance recognized at the date of initial application (the modified retrospective approach). The Company selected the modified retrospective approach however there was no material impact which required a cumulative effect adjustment.
| -40- |
The principle of Topic 606 was achieved through applying the following five-step approach:
| ● | Identification of the contract, or contracts, with a customer — a contract with a customer exists when the Company enters into an enforceable contract with a customer, typically a purchase order initiated by the customer, that defines each party’s rights regarding the goods to be transferred and identifies the payment terms related to these goods. | |
| ● | Identification of the performance obligations in the contract — performance obligations promised in a contract are identified based on the goods that will be transferred to the customer that are distinct, whereby the customer can benefit from the goods on their own or together with other resources that are readily available from third parties or from us. Persuasive evidence of an arrangement for the sale of product must exist. The Company ships product in accordance with the purchase order and standard terms as reflected within the Company’s order acknowledgments and sales invoices. | |
| ● | Determination of the transaction price —the transaction price is determined based on the consideration to which the Company will be entitled in exchange for transferring goods to the customer. This would be the agreed upon quantity and price per product type in accordance with the customer purchase order, which is aligned with the Company’s internally approved pricing guidelines. | |
| ● | Allocation of the transaction price to the performance obligations in the contract — if the contract contains a single performance obligation, the entire transaction price is allocated to the single performance obligation. This applies to the Company as there is only one performance obligation to ship the goods. | |
| ● | Recognition of revenue when, or as, the Company satisfies a performance obligation — the Company satisfies performance obligations at a point in time when control of the goods transfers to the customer. Determining the point in time when control transfers requires judgment. Indicators considered in determining whether the customer has obtained control of a good include: |
| ● | The Company has a present right to payment | |
| ● | The customer has legal title to the goods | |
| ● | The Company has transferred physical possession of the goods | |
| ● | The customer has the significant risks and rewards of ownership of the goods | |
| ● | The customer has accepted the goods |
It is important to note that the indicators are not a set of conditions that must be met before the Company can conclude that control of the goods has transferred to the customer. The indicators are a list of factors that are often present if a customer has control of the goods.
The Company has typical, unmodified FOB shipping point terms. As the seller, the Company can determine that the shipped goods meet the agreed-upon specifications in the contract or customer purchase order (e.g. items, quantities, and prices) with the buyer, so customer acceptance would be deemed a formality, as noted in ASC 606-10-55-86. As a result, the Company has a legal right to payment upon shipment of the goods.
Based upon the above, the Company has concluded that transfer of control substantively transfers to the customer upon shipment.
Other considerations of Topic 606 include the following:
| ● | Contract Costs - costs to obtain a contract (e.g. customer purchase order) include sales commissions. Under Topic 606, these costs may be expensed as incurred for contracts with a duration of one year or less. The majority of the Company’s customer purchase orders are fulfilled (e.g. goods are shipped) within two days of receipt. | |
| ● | Warranties - the Company does not offer customers to purchase a warranty separately. Therefore there is not a separate performance obligation. The Company does account for warranties as a cost accrual and the warranties do not include any additional distinct services other than the assurance that the goods comply with agreed-upon specifications. There is no impact of warranties under Topic 606 upon the financial reporting of the Company. |
| -41- |
| ● | Returned Goods - from time to time, the Company provides authorization to customers to return goods. If deemed to be material, the Company would record a “right of return” asset for the cost of the returned goods which would reduce cost of sales. | |
| ● | Volume Rebates (Promotional Incentives) - volume rebates are variable (dependent upon the volume of goods purchased by our eligible customers) and, under Topic 606, must be estimated and recognized as a reduction of revenue as performance obligations are satisfied (e.g. upon shipment of goods). Also under Topic 606, to ensure that revenue recognized would not be probable of a significant reversal, the four following factors are considered: |
| ● | The amount of consideration is highly susceptible to factors outside the Company’s influence. | |
| ● | The uncertainty about the amount of consideration is not expected to be resolved for a long period of time. | |
| ● | The Company’s experience with similar types of contracts is limited. | |
| ● | The contract has a large number and broad range of possible consideration amounts. |
If it was concluded that the above factors were in place for the Company, it would support the probability of a significant reversal of revenue. However, as none of the four factors apply to the Company, promotional incentives are recorded as a reduction of revenue based upon estimates of the eligible products expected to be sold.
Regarding disaggregated revenue disclosures, as previously noted, the Company’s business is controlled as a single operating segment that consists of the manufacture and sale of flexible metal hose. Most of the Company’s transactions are very similar in nature, contract, terms, timing, and transfer of control of goods. As indicated within Note 2, under the caption “Significant Concentration”, the majority of the Company’s sales were geographically contained within North America, with the remainder scattered internationally. All performance assessments and resource allocations are generally based upon the review of the results of the Company as a whole.
Cash Equivalents
The Company considers all highly liquid investments with an original maturity of 90 days or less at the time of purchase to be cash equivalents. Cash equivalents include investments in an institutional money market fund, which invests in U.S. Treasury bills, notes and bonds, and/or repurchase agreements, backed by such obligations. Carrying value approximates fair value. Cash and cash equivalents are deposited at various area banks, which at times may exceed federally insured limits. The Company monitors the viability of the banking institutions carrying its assets on a regular basis, and has the ability to transfer cash to various institutions during times of risk. The Company has not experienced any losses related to these cash balances, and believes its credit risk to be minimal.
Accounts Receivable and Provision for Doubtful Accounts
Accounts receivable are reduced by an allowance for amounts that may become uncollectible in the future. The estimated allowance for uncollectible amounts is based primarily on specific analysis of accounts in the receivable portfolio and historical write-off experience. While management believes the allowance to be adequate, if the financial condition of the Company’s customers were to deteriorate, resulting in their inability to make payments, additional allowances may be required.
The allowance for doubtful accounts reflects our best estimate of probable losses inherent in the accounts receivable balance. The Company determines the allowance based on any known collection issues, historical experience, and other currently available evidence. The reserve for future credits, discounts, and doubtful accounts was $1,433,000 and $985,000 as of December 31, 2019 and 2018, respectively. In regards to identifying uncollectible accounts, the Company reviews an aging report on a consistent basis to determine past due accounts, and utilizes a well-established credit rating agency. The Company charges off those accounts that are deemed uncollectible once all collection efforts have been exhausted.
| -42- |
Investments
The Company invests excess funds in liquid interest earning instruments including U.S. Treasury bills and bank time deposits. These investments are stated at fair value, which approximates amortized cost, and are classified as available-for-sale in accordance with Accounting Standards Codification 320, Investments – Debt and Equity Securities (or “ASC 320”). Investments were $0 and $14,944,000 as of December 31, 2019 and 2018, respectively. Maturities, from the date of purchase, were six months or less.
Inventories
Inventories are valued at the lower of cost or net realizable value. The cost of inventories is determined by the first-in, first-out (FIFO) method. The Company generally considers inventory quantities beyond two years of non-usage, measured on a historical usage basis, to be excess inventory and reduces the carrying value of inventory accordingly.
Property and Equipment
Property and equipment are carried at cost. Depreciation and amortization are computed using the straight-line method over the estimated useful lives of the assets or, for leasehold improvements, the life of the lease, if shorter. When assets are retired or otherwise disposed of, the cost and related accumulated depreciation are removed from the accounts and any resulting gain or loss is reflected in other income or expense for the period. The cost of maintenance and repairs is expensed as incurred; significant improvements are capitalized.
Goodwill
In accordance with Financial Accounting Standards Board (FASB) ASC Topic 350, Intangibles – Goodwill and Other, the Company performed an annual impairment test in accordance with this guidance as of December 31, 2019 and also at December 31, 2018. These analyses did not indicate any impairment of goodwill at the end of either period.
Stock-Based Compensation Plans
In 2006, the Company adopted a Phantom Stock Plan (the “Plan”), which allows the Company to grant phantom stock units (Units) to certain key employees, officers or directors. The Units each represent a contractual right to payment of compensation in the future based upon the market value of the Company’s common stock. The Units follow a vesting schedule of three years from the grant date, and are then paid upon maturity. In accordance with FASB ASC Topic 718, Stock Compensation, the Company uses the Black-Scholes option pricing model as its method for determining the fair value of the Units. Further details of the Plan are provided in Note 11.
Product Liability Reserves
Product liability reserves represent the estimated unpaid amounts under the Company’s insurance policies with respect to existing claims. The Company uses the most current available data to estimate claims. As explained more fully under Note 10, for various product liability claims covered under the Company’s general liability insurance policies, the Company must pay certain defense and settlement costs within its deductible or self-insured retention limits, ranging primarily from $25,000 to $1,000,000 per claim, depending on the terms of the policy in the applicable policy year, up to an aggregate amount. The Company is vigorously defending against all known claims.
Leases
Effective January 1, 2019, the Company adopted the requirements of FASB ASU 2016-02, Leases (Topic 842) which defines a lease as any contract that conveys the right to use a specific asset for a period of time in exchange for consideration. Leases are classified as a finance lease, formerly called a capital lease, if any of the following criteria are met:
| -43- |
| 1. | The lease transfers ownership of the underlying asset to the lessee by the end of the lease term. | |
| 2. | The lease grants the lessee an option to purchase the underlying asset that the lessee is reasonably certain to exercise. | |
| 3. | The lease term is for the major part of the remaining economic life of the underlying asset. | |
| 4. | The present value of the sum of lease payments and any residual value guaranteed by the lessee equals or exceeds substantially all of the fair value of the underlying asset. | |
| 5. | The underlying asset is of such a specialized nature that it is expected to have no alternative use to the lessor at the end of the lease term. |
For any leases that do not meet the criteria identified above for finance leases, the Company treats such leases as operating leases. As of December 31, 2019, each of the Company’s leases are classified as operating leases.
Under the new guidance, both finance and operating leases are reflected on the balance sheet as lease or “right-of-use” assets and lease liabilities. It should be noted that under previous guidance operating leases (non-capital leases) were not required to be recorded as an asset on the balance sheet.
There are some exceptions, which the Company has elected in its accounting policies. For leases with terms of twelve months or less, or below the Company’s general capitalization policy threshold, the Company elects an accounting policy to not recognize lease assets and lease liabilities for all asset classes. The Company recognizes lease expense for such leases generally on a straight-line basis over the lease term.
The Company determines if a contract is a lease at the inception of the arrangement. The Company reviews all options to extend, terminate, or purchase its right-of-use assets at the inception of the lease and accounts for these options when they are reasonably certain to be exercised. Certain leases contain non-lease components, such as common area maintenance, which are generally accounted for separately. In general, the Company will assess if non-lease components are fixed and determinable, or variable, when determining if the component should be included in the lease liability. For purposes of calculating the present value of the lease obligations, the Company utilizes the implicit interest rate within the lease agreement when known and/or determinable, and otherwise utilizes its incremental borrowing rate at the time of the lease agreement.
As permitted under ASU 2018-11, the Company elected the optional transition method to adopt the new leases standard. Under this new transition method, the Company initially applied the new leases standard at the adoption date of January 1, 2019 and would have recognized a cumulative-effect adjustment, if appropriate, to the opening balance of retained earnings in the period of adoption. No cumulative-effect adjustment was recognized. The Company’s reporting for the comparative periods prior to 2019 in the financial statements are presented in accordance with existing GAAP in effect for 2018 and earlier (ASC Topic 840, Leases).
The impact of the adoption of this new standard resulted in an increase to the Company’s operating lease assets and liabilities on January 1, 2019 of approximately $800,000. The implementation did not have a material impact on the Company’s consolidated statements of income and statements of cash flows.
Fair Value of Financial and Nonfinancial Instruments
The Company measures financial instruments in accordance with FASB ASC Topic 820, Fair Value Measurements and Disclosures. The accounting standard defines fair value, establishes a framework for measuring fair value under GAAP, and enhances disclosures about fair value measurements. Fair value is defined as the exchange price that would be received for an asset or paid to transfer a liability (an exit price) in the principal or most advantageous market for the asset or liability in an orderly transaction between market participants on the measurement date. Valuation techniques used to measure fair value must maximize the use of observable inputs and minimize the use of unobservable inputs. The standard creates a fair value hierarchy which prioritizes the inputs to valuation techniques used to measure fair value into three broad levels as follows: Level 1 inputs are quoted prices (unadjusted) in active markets for identical assets or liabilities; Level 2 inputs are inputs other than quoted prices included within Level 1 that are observable for the asset or liability, either directly or indirectly; and Level 3 inputs are unobservable inputs that reflect the Company’s own assumptions about the assumptions market participants would use in pricing the asset or liability. The Company relies upon Level 1 inputs in determining the fair value of investments and the fair value of the Company’s reporting unit in its annual impairment test as described in the FASB ASC Topic 350, Intangibles - Goodwill and Other.
| -44- |
Advertising Expense
Advertising costs are charged to operations as incurred and are included in selling expenses in the accompanying consolidated Statement of Operations. Such charges aggregated $1,056,000, $1,037,000 and $1,075,000 for the years ended December 31, 2019, 2018, and 2017, respectively.
Research and Development Expense
Research and development expenses are charged to operations as incurred. Such charges totaled $1,191,000, $1,531,000 and $923,000 for the years ended December 31, 2019, 2018 and 2017, respectively and are included in engineering expense in the accompanying consolidated statements of operations.
Shipping Costs
Shipping costs are included in selling expense on the consolidated statements of operations. The expense relating to shipping was $2,862,000, $2,973,000 and $2,562,000 for the years ended December 31, 2019, 2018 and 2017, respectively.
Earnings per Common Share
Basic earnings per share have been computed using the weighted-average number of common shares outstanding. For the periods presented, there are no dilutive securities. Consequently, basic and dilutive earnings per share are the same.
Currency Translation
Assets and liabilities denominated in foreign currencies are translated into U.S. dollars at exchange rates prevailing on the balance sheet dates. The Statements of Operations are translated into U.S. dollars at average exchange rates for the period. Adjustments resulting from the translation of financial statements are excluded from the determination of income and are accumulated in a separate component of shareholders’ equity. Exchange gains and losses resulting from foreign currency transactions are included in the Statements of Operations (other income (expense)) in the period in which they occur.
Income Taxes
The Company accounts for tax liabilities in accordance with the FASB ASC Topic 740, Income Taxes. Under this method the Company recorded tax expense, related deferred taxes and tax benefits, and uncertainties in tax positions.
Deferred tax assets and liabilities are recognized for the future tax consequences attributable to differences between the financial statement carrying amounts of existing assets and liabilities and their respective tax bases. Deferred tax assets and liabilities are measured using enacted tax rates expected to apply to taxable income in the years in which those temporary differences are expected to be recovered or settled. The effect on deferred tax assets and liabilities from a change in tax rates is recognized in income in the period that includes the enactment date. A valuation allowance is provided for deferred tax assets if it is more likely than not that these items will either expire before the Company is able to realize the benefit, or that future deductibility is uncertain.
The FASB ASC Topic 740, Income Taxes, clarifies the criteria that an individual tax position must satisfy for some or all of the benefits of that position to be recognized in a company’s financial statements. This guidance prescribes a recognition threshold of more-likely than-not, and a measurement attribute for all tax positions taken or expected to be taken on a tax return, in order for those tax positions to be recognized in the financial statements.
| -45- |
The Company follows the provisions of ASC 740-10 relative to accounting for uncertainties in tax positions. These provisions provide guidance on the recognition, de-recognition and measurement of potential tax benefits associated with tax positions.
The Company reflected the effects of the Tax Cuts and Jobs Act (the “Act”), in its 2017 financial statements. This included the effects of the change in the US corporate tax rate from 35% to 21% on deferred tax assets and liabilities, and a provision related to previously deferred taxes on earnings of the Company’s foreign subsidiary. The Company’s tax expense for the periods ended December 31, 2018 and 2019 includes the effect of the reduction in the US corporate tax rate from 35% to 21%, effective for the Company’s 2018 and 2019 tax years. The Company’s tax provision also reflects other changes as a result of the Act, including the impact of the Global Intangible Low Taxed Income (“GILTI”) provisions, and changes affecting the deductibility of certain executive compensation.
Other Comprehensive Income
For the years ended December 31, 2019, 2018 and 2017, respectively, the components of other comprehensive income consisted solely of foreign currency translation adjustments.
Significant Concentrations
One customer represented 14% to 15% of sales during the period from 2017 to 2019, and that same customer accounted for approximately 22% to 24% of the Accounts Receivable balance over the last two years. No other customer represented more that 10% of Accounts Receivable or Sales. Geographically, North America accounted for approximately 90% of the Company’s sales during the last three years. The remaining portion of sales for each respective year was scattered among other countries, with the United Kingdom being the Company’s most dominant market outside North America.
Subsequent Events
The Company evaluates all events or transactions through the date of the related filing that may have a material impact on its consolidated financial statements. Refer to Note 13.
Recent Accounting Pronouncements
In January 2017, the FASB amended ASC Topic 350, Intangibles – Goodwill and Other (issued under ASU 2017-04, “Simplifying the Test for Goodwill Impairment”). This amendment simplifies the test for goodwill impairment by only requiring an entity to perform an annual or interim goodwill impairment test by comparing the fair value of a reporting unit with its carrying amount and recognize an impairment charge for the amount that the carrying amount exceeds the reporting unit’s fair value. Any loss recognized should not exceed the total amount of goodwill allocated to that reporting unit. The amendment requires adoption on January 1, 2020. The Company does not expect that the adoption of ASU 2017-04 will have a material impact on its consolidated financial statements.
In June 2016, the FASB issued ASU 2016-13, Financial Instruments—Credit Losses (Topic 326): Measurement of Credit Losses on Financial Instruments, which creates a new credit impairment standard for financial assets measured at amortized cost and available-for-sale debt securities. The ASU requires financial assets measured at amortized cost (including loans, trade receivables and held-to-maturity debt securities) to be presented at the net amount expected to be collected, through an allowance for credit losses that are expected to occur over the remaining life of the asset, rather than incurred losses. The ASU requires that credit losses on available-for-sale debt securities be presented as an allowance rather than as a direct write-down. The measurement of credit losses for newly recognized financial assets (other than certain purchased assets) and subsequent changes in the allowance for credit losses are recorded in the statement of income as the amounts expected to be collected change. The ASU is effective for fiscal years beginning after December 15, 2019. The Company is currently evaluating the impact of adopting this new guidance on its consolidated financial statements and does not expect the impact to be significant.
| -46- |
3. INVENTORIES
Inventories, net of reserves of $355,000 and $363,000, respectively, were as follows at December 31:
| 2019 | 2018 | |||||||
| (in thousands) | ||||||||
| Finished Goods | $ | 5,409 | $ | 4,756 | ||||
| Raw Materials | 5,669 | 3,220 | ||||||
| Total Inventories - Net | $ | 11,078 | $ | 7,976 | ||||
4. PROPERTY AND EQUIPMENT
Property and equipment consisted of the following at December 31:
| 2019 | 2018 | Depreciation and Amortization Est. Useful Lives | ||||||||
| (in thousands) | ||||||||||
| Land | $ | 1,205 | $ | 1,205 | ||||||
| Buildings | 6,630 | 6,452 | 39 Years | |||||||
| Leasehold Improvements | 409 | 403 | 3-10 Years (Lesser of Life or Lease) | |||||||
| Equipment | 13,064 | 11,960 | 3-10 Years | |||||||
| 21,308 | 20,020 | |||||||||
| Accumulated Depreciation | (12,399 | ) | (11,642 | ) | ||||||
| Property and Equipment - Net | $ | 8,909 | $ | 8,378 | ||||||
The above amounts include capital related items of $199,000 and $511,000 as of December 31, 2019 and 2018, respectively, which had not yet been placed in service by the Company, and therefore no depreciation was recorded in the related periods for those assets. Depreciation and amortization expense was approximately $719,000, $543,000 and $502,000 for the years ended December 31, 2019, 2018 and 2017, respectively.
5. LINE OF CREDIT
The Company has a line of credit with Santander Bank, N.A. (the “Bank”). The Amended and Restated Revolving Line of Credit Note and Third Amendment to the Loan Agreement with the Bank has been in place since December 1, 2017. The line of credit facility allows for borrowing up to the maximum amount of $15,000,000, and matures on December 1, 2022, with funds available for working capital purposes and other cash needs. The loan is unsecured. The loan agreement provides for the payment of any borrowings under the agreement at an interest rate range of either LIBOR plus 0.75% to plus 1.75% (for borrowings with a fixed term of 30, 60, or 90 days), or, Prime Rate up to Prime Rate plus 0.50% (for borrowings with no fixed term other than the December 1, 2022 maturity date), depending upon the Company’s then existing financial ratios. Currently, the Company’s ratio would allow for the most favorable rate under the agreement’s range, which would be a rate of 2.51%. The Company is also required to pay on a quarterly basis an unused facility fee of 10 basis points of the average unused balance of the note. The Company may terminate the line at any time during the five year term, as long as there are no amounts outstanding.
As of December 31, 2019 and 2018, the Company had no outstanding borrowings on its line of credit, and was in compliance with all debt covenants.
| -47- |
6. SHAREHOLDERS’ EQUITY
As of December 31, 2019 and December 31, 2018, the Company had authorized 20,000,000 common stock shares with par value of $0.01 per share. At these same dates, the total number of outstanding shares was 10,094,322 and 10,091,822, shares held in Treasury was 59,311 and 61,811, and total shares issued was 10,153,633 for both periods.
During 2019 and 2018, upon approval of the Board of Directors (the “Board”) the Company has made regular quarterly dividend payments, as set forth in the following table:
| Dividend Declared | Dividend Paid | |||||||||
| Date | Price Per Share | Date | Amount | |||||||
| December 16, 2019 | $ | 3.50 | December 30, 2019* | $ | 35,330,000 | |||||
| December 14, 2019 | $ | 0.28 | January 3, 2020* | $ | 2,826,000 | |||||
| September 6, 2019 | $ | 0.28 | October 2, 2019* | $ | 2,826,000 | |||||
| June 13, 2019 | $ | 0.28 | July 2, 2019* | $ | 2,826,000 | |||||
| April 9, 2019 | $ | 0.24 | April 29, 2019** | $ | 2,422,000 | |||||
| December 13, 2018 | $ | 0.24 | January 3, 2019** | $ | 2,422,000 | |||||
| September 11, 2018 | $ | 0.24 | October 2, 2018** | $ | 2,422,000 | |||||
| June 18, 2018 | $ | 0.24 | July 3, 2018** | $ | 2,422,000 | |||||
| April 10, 2018 | $ | 0.22 | April 30, 2018** | $ | 2,220,000 | |||||
| December 13, 2017 | $ | 0.22 | January 3, 2018** | $ | 2,220,000 | |||||
The number of shares outstanding on the dividend payment date was *10,094,322 and **10,091,822.
In addition to the above dividend amounts, there were dividends approved by the Company’s foreign subsidiary during April 2018, which amounted to an outlay of cash of $491,000 to the foreign subsidiary’s noncontrolling interest, and in 2019 during July and December, with the cash distribution to the noncontrolling interest of $137,000 and $65,000, respectively, also paid during those respective months.
It should be noted that from time to time, the Board may elect to pay special dividends, in addition to or in lieu of the regular quarterly dividends, depending upon the financial condition of the Company.
The Board approved and granted a total of 2,500 restricted stock unit awards (the “Awards”) to be allocated to the existing non-employee directors of the Company. The Awards were approved by the shareholders’ of the Company at the annual meeting on June 11, 2019, and distributed on June 20, 2019. A Form S-8 registration statement, and the restricted stock unit award agreements, were filed with the SEC on December 13, 2018 (2,000 units) and May 24, 2019 (500 units). The related director compensation cost of approximately $217,000 was recognized during June 2019.
On April 4, 2014, the Board authorized an extension of its stock repurchase program without expiration, up to a maximum amount of $1,000,000. The original program established in December 2007 authorized the purchase of up to $5,000,000 of its common stock. The purchases may be made from time-to-time in the open market or in privately negotiated transactions, depending on market and business conditions. The Board retained the right to cancel, extend, or expand the share buyback program, at any time and from time-to-time. Since inception, the Company has purchased a total of 61,811 shares for approximately $932,000, or approximately $15 per share, which were held as treasury shares. The Company has not made any stock repurchases since 2014; however, as stated above, there were 2,500 shares distributed from treasury to non-employee directors during June 2019.
| -48- |
7. INCOME TAXES
Income tax expense consisted of the following:
| December 31, | ||||||||||||
| 2019 | 2018 | 2017 | ||||||||||
(in thousands) | ||||||||||||
| Federal Income Tax: | ||||||||||||
| Current | $ | 4,310 | $ | 4,618 | $ | 6,848 | ||||||
| Deferred | (216 | ) | 306 | 48 | ||||||||
| State Income Tax: | ||||||||||||
| Current | 748 | 885 | 667 | |||||||||
| Deferred | (36 | ) | 50 | 16 | ||||||||
| Foreign Income Tax: | ||||||||||||
| Current | 607 | 575 | 863 | |||||||||
| Deferred | 16 | 17 | 8 | |||||||||
| Income Tax Expense | $ | 5,429 | $ | 6,451 | $ | 8,450 | ||||||
Pre-tax income included foreign income of $3,330,000, $3,123,000 and $4,528,000 in 2019, 2018 and 2017, respectively.
Total income tax expense differed from statutory income tax expense, computed by applying the U.S. federal income tax rate of 21% (2019 and 2018) and 35% (2017) to earnings before income tax, as follows:
| December 31, | ||||||||||||
| 2019 | 2018 | 2017 | ||||||||||
(in thousands)
| ||||||||||||
| Computed Statutory Income Tax Expense | $ | 4,770 | $ | 5,584 | $ | 8,440 | ||||||
| State Income Tax, Net of Federal Tax Benefit | 598 | 760 | 447 | |||||||||
| Foreign Tax Rate Differential | (67 | ) | (63 | ) | (713 | ) | ||||||
| Impact of Deemed Repatriation Related to the 2017 U.S. Tax Law Changes | — | — | 827 | |||||||||
| Manufacturing Deduction | — | — | (401 | ) | ||||||||
| Impact of Federal Tax Rate Reduction on Deferred Taxes | — | — | (118 | ) | ||||||||
| Executive Compensation Limitation | 340 | 440 | — | |||||||||
| Foreign Derived Intangible Income Deduction | (76 | ) | (100 | ) | — | |||||||
| Research Credit | (141 | ) | (143 | ) | (47 | ) | ||||||
| Increase/(Reduction) in Tax Uncertainties | — | — | — | |||||||||
| Valuation Allowance for Foreign Loss Carryover | — | — | — | |||||||||
| Other - Net | 5 | (27 | ) | 15 | ||||||||
| Income Tax Expense | $ | 5,429 | $ | 6,451 | $ | 8,450 | ||||||
The 2017 tax expense reflects changes made by the 2017 Tax Cuts and Jobs Act, which resulted in a reduction of the U.S. federal tax rate from 35% to 21%, and also included a one-time repatriation of accumulated earnings of foreign subsidiaries. During 2017, the Company was deemed to have paid a dividend out of its U.K. subsidiary of all its unremitted earnings, resulting in U.S. incremental taxes of $827,000.
| -49- |
A deferred income tax (expense) benefit results from temporary timing differences in the recognition of income and expense for income tax and financial reporting purposes. The components of and changes in the net deferred tax assets (liabilities) which give rise to this deferred income tax (expense) benefit for the years ended December 31, 2019 and 2018 are as follows:
| December 31, | ||||||||
| 2019 | 2018 | |||||||
| (in thousands) | ||||||||
| Deferred Tax Assets: | ||||||||
| Compensation Assets | $ | 118 | $ | 103 | ||||
| Inventory Valuation | 238 | 164 | ||||||
| Accounts Receivable Valuation | 265 | 232 | ||||||
| Deferred Litigation Costs | 12 | 12 | ||||||
| Foreign Net Operating Losses | 70 | 70 | ||||||
| Valuation Allowance for Loss Carryover | (70 | ) | (70 | ) | ||||
| Other | 82 | 71 | ||||||
| Compensation Liabilities | 877 | 510 | ||||||
| Total Deferred Assets | $ | 1,592 | $ | 1,092 | ||||
| Deferred Tax Liabilities: | ||||||||
| Prepaid Expenses | (476 | ) | (409 | ) | ||||
| Depreciation and Amortization | (1,443 | ) | (1,246 | ) | ||||
| Total Deferred Liabilities | $ | (1,919 | ) | $ | (1,655 | ) | ||
| Total Deferred Tax Liability | $ | (327 | ) | $ | (563 | ) | ||
Management believes it is more likely than not that the Company will have sufficient taxable income when these timing differences reverse and that the deferred tax assets will be realized with the exception of a carryover of foreign operating losses. Due to the uncertainty of future income in the foreign subsidiary, the Company has recognized a valuation allowance related to the foreign operating losses carrying forward.
The Company is currently subject to audit by the Internal Revenue Service for the calendar years ended 2016 through 2018. The Company and its Subsidiaries’ state income tax returns are subject to audit for the calendar years ended 2015 through 2018.
As of December 31, 2019, the Company had no liability for unrecognized tax benefits related to various federal and state income tax matters.
8. LEASES
In the United States, the Company owns its two main operating facilities located in Exton, PA. In addition to the owned facilities, the Company also has operations in other locations that are leased, as well as other leased assets. In conjunction with the new guidance for leases, as defined by the FASB with ASU 2016-02, Leases (Topic 842), the Company has described the existing leases, which are all classified as operating leases, pursuant to the below.
In the United States, the Company owns its main operating facility located at 451 Creamery Way in Exton, PA, and in early 2017 consummated an agreement to purchase another facility at 427 Creamery Way in Exton, which was previously under lease through January 2018. Both facilities provide manufacturing, warehousing and distribution space. The Company also leases a warehousing and distribution center in Houston, Texas, which currently provides manufacturing, stocking and sales operations, with the original lease term running through October 2019. In April 2019, the Company entered into a new operating lease agreement extending the lease term through October 2024. Additionally, the Company leases its corporate office space in Middletown, CT, with the lease term expiring in 2022.
| -50- |
In the United Kingdom, the Company leases a facility in Banbury, England, which serves sales, warehousing and operational functions. The lease in Banbury was effective April 1, 2006 and has a 15-year term ending in March 2021.
In addition to property rentals, the Company also has lease agreements in place for various fleet vehicles and equipment with various lease terms.
In the December 31, 2019 consolidated balance sheet, the Company has recorded right-of-use assets of $771,000, and a lease liability of $787,000, of which $369,000 is reported as a current liability. The respective weighted average remaining lease term and discount rate are approximately 2.70 years and 3.50%.
Rent expense for operating leases was approximately $298,000, $377,000 and $393,000 for the years ended December 31, 2019, 2018 and 2017, respectively.
Future minimum lease payments under non-cancelable leases as of December 31, 2019 is as follows:
| Year Ending December 31, | Operating Leases | ||||
| (in thousands) | |||||
| 2020 | $ | 369 | |||
| 2021 | 218 | ||||
| 2022 | 119 | ||||
| 2023 | 43 | ||||
| 2024 | 38 | ||||
| Thereafter | — | ||||
| Total Minimum Lease Payments | $ | 787 | |||
9. EMPLOYEE BENEFIT PLANS
Defined Contribution and 401(K) Plans
The Company maintains a qualified non-contributory profit-sharing plan (the “Plan”) covering all eligible employees. There were $380,000, $361,000 and $338,000 of contributions accrued for the Plan in 2019, 2018 and 2017 respectively, which were charged to expense in those respective years.
Contributions to the Plan are defined as three percent (3%) of gross wages up to the current Old Age, Survivors, and Disability (OASDI) limit and six percent (6%) of the excess over the OASDI limit, subject to the maximum allowed under the Employee Retirement Income Security Act (ERISA). Participants vest over six years.
The Company also maintains a savings and retirement plan qualified under Internal Revenue Code Section 401(k) for all employees. Employees are eligible to participate in the Plan the first day of the month following date of hire. Participants may elect to have up to fifty percent (50%) of their compensation withheld, up to the maximum allowed by the Internal Revenue Code. After completing one year of service, the Company contributed an additional amount equal to 50% of all employee contributions, up to a maximum of 6% of an employee’s gross wages. Contributions are funded on a current basis. Contributions to the Plan charged to expense for the years ended December 31, 2019, 2018 and 2017 were $276,000, $256,000 and $227,000, respectively. The participant’s Company contribution vests ratably over six years.
| -51- |
10. COMMITMENTS AND CONTINGENCIES
Commitments:
Under a number of indemnity agreements between the Company and each of its officers and directors, the Company has agreed to indemnify each of its officers and directors against any liability asserted against them in their capacity as an officer or director, or both. The Company’s indemnity obligations under the indemnity agreements are subject to certain conditions and limitations set forth in each of the agreements. Under the terms of the Agreement, the Company is contingently liable for costs which may be incurred by the officers and directors in connection with claims arising by reason of these individuals’ roles as officers and directors. The Company has obtained directors’ and officers’ insurance policies to fund certain obligations under the indemnity agreements.
The Company has salary continuation agreements with one current employee, and one former employee who retired at the end of 2010. These agreements provide for monthly payments to each of the employees or their designated beneficiary upon the employee’s retirement or death. The payment benefits range from $1,000 per month to $3,000 per month with the term of such payments limited to 15 years after the employee’s retirement. The agreements also provide for survivorship benefits if the employee dies before attaining age 65, and severance payments if the employee is terminated without cause; the amount of which is dependent on the length of company service at the date of termination. The net present value of the retirement payments associated with these agreements is $492,000 at December 31, 2019, of which $480,000 is included in Other Long Term Liabilities, and the remaining current portion of $12,000 is included in Other Liabilities, associated with the retired employee previously noted who is now receiving benefit payments. The December 31, 2018 liability of $462,000 had $450,000 reported in Other Long Term Liabilities, and a current portion of $12,000 in Other Liabilities.
The Company has obtained and is the beneficiary of three life insurance policies with respect to the two employees discussed above, and one other employee policy. The cash surrender value of such policies (included in Other Long Term Assets) amounts to $1,417,000 at December 31, 2019 and $1,296,000 at December 31, 2018.
In addition to the above, the Company has other contractual employment and or change of control agreements in place with key employees, as previously disclosed and noted in the Exhibit Index to this Form 10-K. Obligations related to these arrangements are currently indeterminable due to the variable nature and timing of possible events required to incur such obligations.
As disclosed in detail in Note 8, under the caption “Leases”, the Company has several lease obligations in place that will be paid out over time. Most notably, the Company leases a facility in Banbury, England that serves the manufacturing, warehousing and distribution functions. Additionally, the Company purchased the operating facility at 427 Creamery Way in Exton, PA in February 2017, which was previously under lease through January 2018.
Lastly, as provided earlier in Item 7 under the “Tabular Disclosure of Contractual Obligations and Off-Balance Sheet Arrangements”, the Company has numerous purchase obligations in place for the forthcoming year, largely related to the Company’s core material inventory components, totaling $27,595,000.
Contingencies:
In the ordinary and normal conduct of the Company’s business, it is subject to periodic lawsuits, investigations and claims (collectively, the “Claims”). Most of the Claims, including a putative class-action claim, relate to potential lightning damage to our flexible gas piping products, which impact legal and product liability related expenses. The Company does not believe the Claims have legal merit, and therefore has commenced a vigorous defense in response to the Claims. It is possible that the Company may incur increased litigation costs in the future due to a variety of factors, including a higher numbers of Claims, higher legal costs, and higher insurance deductibles or retentions.
In 2010, the Company took its first Claim to trial in Pennsylvania, and the jury returned a verdict that the Company was not negligent in designing and selling the TracPipe® product, but also returned a verdict for plaintiff on strict liability. The Company appealed that portion of the verdict, and in December 2014, the Supreme Court of Pennsylvania ruled in favor of the Company, and returned the case to the trial court for further hearings. The cash bond of $1,600,000, which was previously included in Other Long Term Assets and posted as security for a subsequent appeal, was returned to the Company in May 2018. This case was finally settled and closed on August 7, 2018.
| -52- |
In March 2017, a putative class action case was re-filed against the Company and other parties in Missouri state court after the predecessor case was dismissed without prejudice by the federal court. The Company successfully removed the case to federal court and is currently vigorously defending the case.
The Company has in place commercial general liability insurance policies that cover most Claims, which are subject to deductibles or retentions, ranging primarily from $25,000 to $1,000,000 per claim (depending on the terms of the policy and the applicable policy year), up to an aggregate amount. Litigation is subject to many uncertainties and management is unable to predict the outcome of the pending suits and claims. The potential liability for a given claim could range from zero to a maximum of $1,000,000, depending upon the circumstances, and insurance deductible or retention in place for the respective claim year. The aggregate maximum exposure for all current open Claims, excluding the Missouri class action case, as of December 31, 2019 is estimated to not exceed approximately $3,300,000, which represents the potential costs that may be incurred over time for the Claims within the applicable insurance policy deductibles or retentions. From time to time, depending upon the nature of a particular case, the Company may decide to spend in excess of a deductible or retention to enable more discretion regarding the defense, although this is not common. It is possible that the results of operations or liquidity of the Company, as well as the Company’s ability to procure reasonably priced insurance, could be adversely affected by the pending litigation, potentially materially. The Company is currently unable to estimate the ultimate liability, if any, that may result from the pending litigation, or potential litigation from future claims or claims that have not yet come to our attention, and accordingly, the liability in the consolidated financial statements primarily represents an accrual for legal costs for services previously rendered, and outstanding or anticipated settlements for Claims. The liabilities recorded on the Company’s books at December 31, 2019 and 2018 were $215,000 and $150,000, respectively, and are included in Other Liabilities.
11. STOCK – BASED COMPENSATION PLANS
Phantom Stock Plan
Plan Description. On April 1, 2006, the Company adopted the Omega Flex, Inc. 2006 Phantom Stock Plan (the “Plan”). The Plan authorizes the grant of up to 1 million units of phantom stock to employees, officers or directors of the Company and of any of its subsidiaries. The phantom stock units (“Units”) each represent a contractual right to payment of compensation in the future based on the market value of the Company’s common stock. The Units are not shares of the Company’s common stock, and a recipient of the Units does not receive any of the following:
| ● | ownership interest in the Company | |
| ● | shareholder voting rights | |
| ● | other incidents of ownership to the Company’s common stock |
The Units are granted to participants upon the recommendation of the Company’s CEO, and the approval of the Compensation Committee. Each of the Units that are granted to a participant will be initially valued by the Compensation Committee, at an amount equal to the closing price of the Company’s common stock on the grant date, but are recorded at fair value using the Black-Scholes method as described below. The Units follow a vesting schedule, with a maximum vesting of three years after the grant date. Upon vesting, the Units represent a contractual right of payment for the value of the Unit. The Units will be paid on their maturity date, one year after all of the Units granted in a particular award have fully vested, unless an acceptable event occurs under the terms of the Plan prior to one year, which would allow for earlier payment. The amount to be paid to the participant on the maturity date is dependent on the type of Unit granted to the participant.
The Units may be Full Value, in which the value of each Unit at the maturity date, will equal the closing price of the Company’s common stock as of the maturity date; or Appreciation Only, in which the value of each Unit at the maturity date will be equal to the closing price of the Company’s common stock at the maturity date minus the closing price of the Company’s common stock at the grant date.
| -53- |
On December 9, 2009, the Board of Directors authorized an amendment to the Plan to pay an amount equal to the value of any cash or stock dividend declared by the Company on its common stock to be accrued to the phantom stock units outstanding as of the record date of the common stock dividend. The dividend equivalent will be paid at the same time the underlying phantom stock units are paid to the participant.
In certain circumstances, the Units may be immediately vested upon the participant’s death or disability. All Units granted to a participant are forfeited if the participant is terminated from his relationship with the Company or its subsidiary for “cause,” which is defined under the Plan. If a participant’s employment or relationship with the Company is terminated for reasons other than for “cause,” then any vested Units will be paid to the participant upon termination. However, Units granted to certain “specified employees” as defined in Section 409A of the Internal Revenue Code will be paid approximately 181 days after termination.
Grants of Phantom Stock Units. As of December 31, 2018, the Company had 17,805 unvested units outstanding, all of which were granted at Full Value. On February 15, 2019, the Company granted an additional 6,050 Full Value Units with a fair value of $65.40 per unit on grant date, using historical volatility. In February 2019, the Company paid $746,000 for the 10,460 fully vested and matured units that were granted during 2015, including their respective earned dividend values. On August 27, 2019, the Company granted an additional 1,508 Full Value Units with a fair value of $76.79 per unit on grant date, using historical volatility. As of December 31, 2019, the Company had 15,493 unvested units outstanding.
The Company uses the Black-Scholes option pricing model as its method for determining fair value of the Units. The Company uses the straight-line method of attributing the value of the stock-based compensation expense relating to the Units. The compensation expense (including adjustment of the liability to its fair value) from the Units is recognized over the vesting period of each grant or award.
The FASB ASC Topic 718, Stock Compensation, requires forfeitures to be estimated at the time of grant and revised, if necessary, in subsequent periods if actual forfeitures differ from those estimates in order to derive the Company’s best estimate of awards ultimately to vest.
Forfeitures represent only the unvested portion of a surrendered Unit and are typically estimated based on historical experience. Based on an analysis of the Company’s historical data, which has limited experience related to any stock-based plan forfeitures, the Company applied a 0% forfeiture rate to Plan Units outstanding in determining its Plan Unit compensation expense as of December 31, 2019.
The total Phantom Stock related liability as of December 31, 2019 was $3,201,000 of which $1,508,000 is included in Other Liabilities, as it is expected to be paid in February and August 2020, and the balance of $1,693,000 is included in Other Long Term Liabilities. The total Phantom Stock related liability as of December 31, 2018 was $1,692,000 of which $599,000 is included in Other Liabilities, and the balance of $1,093,000 is included in Other Long Term Liabilities.
In accordance with FASB ASC Topic 718, Stock Compensation, the Company recorded compensation expense of approximately $2,255,000, $118,000 and $1,042,000 related to the Phantom Stock Plan for the years ended December 31, 2019, 2018 and 2017, respectively.
| -54- |
The following table summarizes information about the Company’s nonvested phantom stock Units at December 31, 2019:
| Units | Weighted Average Grant Date Fair Value | |||||||
| Number of Phantom Stock Unit Awards: | ||||||||
| Nonvested at December 31, 2018 | 17,805 | $ | 46.08 | |||||
| Granted | 7,558 | $ | 67.67 | |||||
| Vested | (9,870 | ) | $ | 41.31 | ||||
| Forfeited | — | — | ||||||
| Canceled | — | — | ||||||
| Nonvested at December 31, 2019 | 15,493 | $ | 59.65 | |||||
| Phantom Stock Unit Awards Expected to Vest | 15,493 | $ | 59.65 | |||||
The total unrecognized compensation costs calculated at December 31, 2019 are $957,000 which will be recognized through August of 2022. The Company will recognize the related expense over the weighted average period of 1.1 years.
12. RELATED PARTY TRANSACTIONS
From time to time the Company may have related party transactions (“RPTs”). In short, RPTs represent any transaction between the Company and any Company employee, director or officer, or any related entity, or relative, etc. The Company performs a review of transactions each year to determine if any RPTs exist, and if so, determines if the related parties act independently of each other in a fair transaction. Through this investigation the Company noted a handful of RPTs which are disclosed hereto. Legal services were performed by a firm which formerly employed one member of the board. On occasion the Company shares a small amount of services with its former parent Mestek, Inc., mostly related to board meeting expenses. The Company is aware of transactions between a few service providers which employ individuals indirectly associated to Omega Flex employees. In all cases, these transactions have been determined to be independent transactions with no indication that they are influenced by the related relationships. The Company had note agreement assets with related parties amounting to approximately $5,000 at December 31, 2018, which were contractually secured by the Company. In February 2019, the amounts due from related parties were collected. Other than as disclosed above, the Company is currently not aware of any RPTs between the Company and any of its current directors or officers outside the scope of their normal business functions or expected contractual duties.
13. SUBSEQUENT EVENTS
The Company evaluated all events or transactions that occurred through the date of this filing. During this period, no events came to the Company’s attention that would impact the consolidated financial statements for 2019.
During February 2020, the Company was made aware of the incurrence of a potential legal liability. After reviewing currently available information and a range of possible scenarios, the loss is estimated to be between $200,000 and $500,000.
| -55- |
14. QUARTERLY CONSOLIDATED FINANCIAL STATEMENTS (UNAUDITED)
The table below sets forth selected quarterly information for each quarter of 2019 and 2018.
| For the Year-Ended December 31, 2019 | ||||||||||||||||||||
| First | Second | Third | Fourth | Year | ||||||||||||||||
| (dollars in thousands except per share data) | ||||||||||||||||||||
| Net Sales | $ | 26,788 | $ | 26,809 | $ | 28,030 | $ | 29,733 | $ | 111,360 | ||||||||||
| Gross Profit | $ | 16,946 | $ | 16,736 | $ | 17,704 | $ | 19,101 | $ | 70,487 | ||||||||||
| Net Income attributable to Omega Flex, Inc. | $ | 4,382 | $ | 3,983 | $ | 3,368 | $ | 5,553 | $ | 17,286 | ||||||||||
| Basic and Diluted Earnings per common share | $ | 0.43 | $ | 0.39 | $ | 0.33 | $ | 0.55 | $ | 1.71 | ||||||||||
| For the Year-Ended December 31, 2018 | ||||||||||||||||||||
| First | Second | Third | Fourth | Year | ||||||||||||||||
| (dollars in thousands except per share data) | ||||||||||||||||||||
| Net Sales | $ | 25,397 | $ | 26,847 | $ | 27,199 | $ | 28,870 | $ | 108,313 | ||||||||||
| Gross Profit | $ | 15,033 | $ | 16,214 | $ | 16,547 | $ | 18,302 | $ | 66,096 | ||||||||||
| Net Income attributable to Omega Flex, Inc. | $ | 4,163 | $ | 4,776 | $ | 5,176 | $ | 6,024 | $ | 20,139 | ||||||||||
| Basic and Diluted Earnings per common share | $ | 0.41 | $ | 0.47 | $ | 0.51 | $ | 0.60 | $ | 2.00 | ||||||||||
Item 9 – CHANGES IN AND DISAGREEMENTS WITH ACCOUNTANTS ON ACCOUNTING AND FINANCIAL DISCLOSURES
None
Item 9A – CONTROLS AND PROCEDURES
(a) Evaluation of Disclosure Controls and Procedures.
We evaluated, under the supervision and with the participation of the Chief Executive Officer and Chief Financial Officer, the effectiveness of the design and operation of our disclosure controls and procedures (as defined in Rules 13a-15(e) and 15d-15(e) under the Securities Exchange Act of 1934 (“Exchange Act”), as amended, as of December 31, 2019, the end of the period covered by this report on Form 10-K. Based on this evaluation, our Chief Executive Officer (principal executive officer) and Chief Financial Officer (principal financial officer) have concluded that our disclosure controls and procedures were effective as of December 31, 2019. Disclosure controls and procedures are designed to ensure that information required to be disclosed by us in the reports that we file or submit under the Exchange Act (i) is recorded, processed, summarized and reported within the time periods specified in the SEC’s rules and forms and (ii) is accumulated and communicated to management, including the chief executive officer and chief financial officer, as appropriate, to allow timely decisions regarding required disclosures.
| -56- |
(b) Management’s Report on Internal Control Over Financial Reporting.
Our management is responsible for establishing and maintaining adequate internal control over financial reporting. Internal control over financial reporting is defined in Rule 13a-15(f) or 15d-15(f) promulgated under the Exchange Act and is a process designed by, or under the supervision of, our principal executive and principal financial officers and effected by our board of directors, management and other personnel, to provide reasonable assurance regarding the reliability of financial reporting and the preparation of financial statements for external purposes in accordance with generally accepted accounting principles and includes those policies and procedures that:
| ● | Pertain to the maintenance of records that in reasonable detail accurately and fairly reflect the transactions and dispositions of our assets; | |
| ● | Provide reasonable assurance that transactions are recorded as necessary to permit preparation of financial statements in accordance with generally accepted accounting principles, and that receipts and expenditures of the company are being made only in accordance with authorizations of our management and directors; and | |
| ● | Provide reasonable assurance regarding prevention or timely detection of unauthorized acquisition, use or disposition of the Company’s assets that could have a material effect on the financial statements. |
Because of its inherent limitations, internal control over financial reporting may not prevent or detect misstatements. Projections of any evaluation of effectiveness to future periods are subject to the risk that controls may become inadequate because of changes in conditions, or that the degree of compliance with the policies or procedures may deteriorate.
Our management assessed the effectiveness of the Company’s internal control over financial reporting as of December 31, 2019. In making this assessment, the Company’s management used the criteria set forth by the Committee of Sponsoring Organizations (COSO) in Internal Control-Integrated Framework (2013).
Based on the assessment, management has concluded that the Company maintained effective internal control over financial reporting as of December 31, 2019 based on criteria in the Internal Control-Integrated Framework (2013) issued by COSO.
The Company’s independent registered public accounting firm, RSM US LLP, audited the effectiveness of the Company’s internal control over financial reporting as of December 31, 2019. RSM US LLP’s report on the effectiveness of the Company’s internal control over financial reporting as of December 31, 2019 is included herein on page 34.
(d) Changes in Internal Control over Financial Reporting.
There were no changes on our internal control over financial reporting during the most recent quarter ended December 31, 2019, that have materially affected, or are reasonably likely to materially affect, our internal control over financial reporting.
None.
| -57- |
With respect to items 10 through 14, the Company will file with the Securities and Exchange Commission, within 120 days after December 31, 2019, a definitive proxy statement relating to the Company’s annual meeting of shareholders to be held June 3, 2020 (the “2020 Proxy Statement”).
Item 10 – DIRECTORS, EXECUTIVE OFFICERS AND CORPORATE GOVERNANCE
Information regarding directors of the Company will be set forth in the 2020 Proxy Statement, under the caption “Current Directors and Nominees for Election – Background Information”, and to the extent required and except as set forth therein, is incorporated herein by reference.
Information regarding executive officers of the Company will be set forth under the caption “Executive Officers” in the 2020 Proxy Statement, and to the extent required and except as set forth therein, incorporated herein by reference.
Information regarding the Company’s Audit Committee and its “Audit Committee Financial Expert” will be set forth in the 2020 Proxy Statement, under the caption “Board Committees”, and incorporated herein by reference. Information concerning any delinquent filings under Section 16(a) of the Securities Exchange Act of 1934 will be set forth in the Company’s proxy statement also, under the Caption “Delinquent Section 16(a) Reports” incorporated herein by reference.
The Company has adopted a Code of Business Ethics (“Code”) applicable to its principal executive officer and principal financial officer, its directors and all other employees generally. A copy of the Code may be found at the Company’s website www.omegaflex.com. Any changes to or waivers from this Code will be disclosed on the Company’s website as well as in appropriate filings with the Securities and Exchange Commission.
Item 11 - EXECUTIVE COMPENSATION
Information required by Item 11 will be set forth in the 2020 Proxy Statement, under the caption “Executive Compensation” and to the extent required and except as set forth therein, is incorporated herein by reference.
The report of the Compensation Committee of the Board of Directors of the Company shall not be deemed incorporated by reference by any general statement incorporating by reference the proxy statement into any filing under the Securities Exchange Act of 1934, and shall not otherwise be deemed filed under such Act.
Item 12 - SECURITY OWNERSHIP OF CERTAIN BENEFICIAL OWNERS AND MANAGEMENT
Information required by Item 12 will be set forth in the 2020 Proxy Statement, under the caption “Security Ownership of Certain Beneficial Owners and Management”, and to the extent required and except as set forth therein, is incorporated herein by reference.
Item 13 - CERTAIN RELATIONSHIPS AND RELATED PARTY TRANSACTIONS, AND DIRECTOR INDEPENDENCE
Information required by Item 13 will be set forth in the 2020 Proxy Statement, under the caption “Certain Relationships and Related Party Transactions” and to the extent required and except as set forth therein, is incorporated herein by reference.
Item 14 – PRINCIPAL ACCOUNTING FEES AND SERVICES
Information required by Item 14 will be set forth in the 2020 Proxy Statement, under the caption “Principal Accounting Fees and Services”, and to the extent required, and except as set forth therein, is incorporated herein by reference.
| -58- |
Item 15 – EXHIBITS AND FINANCIAL STATEMENTS SCHEDULES
(a) The following documents are filed as part of this Form 10-K:
1. Exhibits. See Index to Exhibits on pages 59 through 61.
2. Consolidated Financial Statements. See Index to Consolidated Financial Statements on page 32.
EXHIBIT INDEX
Those documents followed by a parenthetical notation are incorporated herein by reference to previous filings with the Securities and Exchange Commission, under Commission File No. 000-51372, as set forth below.
| -59- |
| -60- |
Reference Key
| (A) | Filed as an Exhibit to the Registration Statement on Form 10-12G filed on June 22, 2005. |
| (B) | Filed as an Exhibit to the Quarterly Report on Form 10-Q filed May 6, 2019. |
| (C) | Filed as an Exhibit to the Annual Report on Form 10-K filed March 18, 2009. |
| (D) | Filed as an Exhibit to the Annual Report on Form 10-K filed April 2, 2007. |
| (E) | Filed as an Exhibit to the Annual Report on Form 10-K filed March 17, 2010. |
| (F) | Filed as an Exhibit to the Annual Report on Form 10-K filed March 10, 2011. |
| (G) | Filed as an Exhibit to the Current Report on Form 8-K/A filed July 24, 2014. |
| (H) | Filed as an Exhibit to the Current Report on Form 8-K filed December 29, 2014. |
| (I) | Filed as an Exhibit to the Current Report on Form 8-K filed December 5, 2017. |
| (J) | Filed as an Exhibit to the Registration Statement on Form S-8 filed December 12, 2018. |
| (K) | Attached as Exhibit 101 to this report are the following documents formatted in XBRL (Extensible Business Reporting Language) as of and for the year ended December 31, 2019: (i) the Consolidated Statement of Operations, (ii) the Consolidated Balance Sheet, (ii) the Consolidated Statement of Comprehensive Income, (iv) the Consolidated Statement of Shareholders’ Equity, (v) the Consolidated Statement of Cash Flows and (vi) Notes to the Consolidated Financial Statements. |
| * | Management contract, compensatory plan or arrangement |
| ** | Filed herewith |
| *** | Furnished herewith |
| -61- |
None.
| -62- |
SIGNATURES
Pursuant to the requirements of Section 13 or 15(d) of the Securities Exchange Act of 1934, the registrant has caused this report be signed on its behalf by the undersigned, thereunto duly authorized.
| OMEGA FLEX, INC. |
| Date: March 9, 2020 | By: | /S/ Kevin R. Hoben |
| Kevin R. Hoben, Chairman and | ||
| Chief Executive Officer (Principal Executive Officer) | ||
| Date: March 9, 2020 | By: | /S/ Paul J. Kane |
| Paul J. Kane, Vice President Finance, | ||
| Chief Financial Officer (Principal Financial Officer) | ||
| Date: March 9, 2020 | By: | /S/ Matthew F. Unger |
| Matthew F. Unger | ||
| Financial Controller |
Pursuant to the requirements of the Securities Exchange Act of 1934, this report has been signed below by the following persons on behalf of the registrant and in the capacities and on the dates indicated.
| Date: March 9, 2020 | By: | /S/ Mark F. Albino |
| Mark F. Albino, Director | ||
| Date: March 9, 2020 | By: | /S/ James M. Dubin |
| James M. Dubin, Director | ||
| Date: March 9, 2020 | By: | /S/ David K. Evans |
| David K. Evans, Director | ||
| Date: March 9, 2020 | By: | /S/ J. Nicholas Filler |
| J. Nicholas Filler, Director | ||
| Date: March 9, 2020 | By: | /S/ Derek W. Glanvill |
| Derek W. Glanvill, Director | ||
| Date: March 9, 2020 | By: | /S/ Kevin R. Hoben |
| Kevin R. Hoben, Director | ||
| Date: March 9, 2020 | By: | /S/ Bruce C. Klink |
| Bruce C. Klink, Director | ||
| Date: March 9, 2020 | By: | /S/ Stewart B. Reed |
| Stewart B. Reed, Director |
| -63- |