Attached files
| file | filename |
|---|---|
| EX-31.2 - EXHIBIT 31.2 - AMERICAN NATIONAL BANKSHARES INC. | exhibit312q42019.htm |
| EX-32.2 - EXHIBIT 32.2 - AMERICAN NATIONAL BANKSHARES INC. | exhibit322q42019.htm |
| EX-32.1 - EXHIBIT 32.1 - AMERICAN NATIONAL BANKSHARES INC. | exhibit321q42019.htm |
| EX-31.1 - EXHIBIT 31.1 - AMERICAN NATIONAL BANKSHARES INC. | exhibit311q42019.htm |
| EX-23.1 - EXHIBIT 23.1 - AMERICAN NATIONAL BANKSHARES INC. | exhibit231consent.htm |
| EX-21.1 - EXHIBIT 21.1 - AMERICAN NATIONAL BANKSHARES INC. | exhibit211subsidiariesofth.htm |
| EX-4.1 - EXHIBIT 4.1 - AMERICAN NATIONAL BANKSHARES INC. | exhibit41descriptionofsecu.htm |
UNITED STATES SECURITIES AND EXCHANGE COMMISSION
Washington, D.C. 20549
FORM 10-K
ANNUAL REPORT PURSUANT TO SECTION 13 OR 15(d)
OF THE SECURITIES EXCHANGE ACT OF 1934
For the fiscal year ended December 31, 2019
Commission file number 0-12820
AMERICAN NATIONAL BANKSHARES INC.
(Exact name of registrant as specified in its charter)
Virginia | 54-1284688 | |
(State of incorporation) | (I.R.S. Employer Identification No.) | |
628 Main Street, Danville, VA | 24541 | |
(Address of principal executive offices) | (Zip Code) | |
434-792-5111
Registrant's telephone number, including area code
Securities registered pursuant to Section 12(b) of the Act:
Title of Each Class | Trading Symbol(s) | Name of Each Exchange on Which Registered | ||
Common Stock, $1 par value | AMNB | Nasdaq Global Select Market | ||
Securities registered pursuant to section 12(g) of the Act: None
Indicate by check mark if the registrant is a well-known seasoned issuer, as defined in Rule 405 of the Securities Act.
☐ Yes þ No
Indicate by check mark if the registrant is not required to file reports pursuant to Section 13 or Section 15(d) of the Act.
☐ Yes þ No
Indicate by check mark whether the registrant (1) has filed all reports required to be filed by section 13 or 15(d) of the Securities Exchange Act of 1934 during the preceding 12 months (or for such shorter period that the registrant was required to file such reports), and (2) has been subject to such filing requirements for the past 90 days.
þ Yes ☐ No
Indicate by check mark whether the registrant has submitted electronically every Interactive Data File required to be submitted pursuant to Rule 405 of Regulation S-T (§ 232.405 of this chapter) during the preceding 12 months (or for such shorter period that the registrant was required to submit such files).
þ Yes ☐ No
Indicate by check mark whether the registrant is a large accelerated filer, an accelerated filer, a non-accelerated filer, a smaller reporting company, or an emerging growth company. See the definitions of "large accelerated filer," "accelerated filer," "smaller reporting company," and "emerging growth company" in Rule 12b-2 of the Exchange Act.
Large accelerated filer ☐ Accelerated filer þ
Non-accelerated filer ☐ Smaller reporting company þ
Emerging growth company ☐
If an emerging growth company, indicate by check mark if the registrant has elected not to use the extended transition period for complying with any new or revised financial accounting standards provided pursuant to Section 13(a) of the Exchange Act.
☐
Indicate by check mark whether the registrant is a shell company (as defined in Rule 12b-2 of the Act.)
☐ Yes þ No
The aggregate market value of the voting stock held by non-affiliates of the registrant at June 30, 2019, based on the closing price, was $401,638,000.
The number of shares of the registrant's common stock outstanding on March 2, 2020 was 10,965,458.
1
DOCUMENTS INCORPORATED BY REFERENCE
Portions of the Proxy Statement of the Registrant for the Annual Meeting of Shareholders to be held on May 19, 2020, are incorporated by reference into Part III of this report.
2
CROSS REFERENCE INDEX | ||
PART I | PAGE | |
ITEM 1 | ||
ITEM 1A | ||
ITEM 1B | Unresolved Staff Comments | None |
ITEM 2 | ||
ITEM 3 | ||
ITEM 4 | ||
PART II | ||
ITEM 5 | ||
ITEM 6 | ||
ITEM 7 | ||
ITEM 7A | ||
ITEM 8 | ||
ITEM 9 | Changes in and Disagreements With Accountants on Accounting and Financial Disclosure | None |
ITEM 9A | ||
ITEM 9B | Other Information | None |
PART III | ||
ITEM 10 | Directors, Executive Officers and Corporate Governance | * |
ITEM 11 | Executive Compensation | * |
ITEM 12 | Security Ownership of Certain Beneficial Owners and Management and Related Stockholder Matters | * |
ITEM 13 | Certain Relationships and Related Transactions, and Director Independence | * |
ITEM 14 | Principal Accounting Fees and Services | * |
PART IV | ||
ITEM 15 | ||
ITEM 16 | Form 10-K Summary | None |
_______________________________
*Certain information required by Item 10 is incorporated herein by reference to the information that appears under the headings "Election of Directors," "Election of Directors – Board Members Serving on Other Publicly Traded Company Boards of Directors," "Election of Directors – Board of Directors and Committees," "Report of the Audit Committee," and "Code of Conduct" in the Registrant's Proxy Statement for the 2020 Annual Meeting of Shareholders. The information required by Item 401 of Regulation S-K on executive officers is disclosed herein.
The information required by Item 11 is incorporated herein by reference to the information that appears under the headings "Compensation Discussion and Analysis," "Compensation Committee Interlocks and Insider Participation," and "Compensation Committee Report" in the Registrant's Proxy Statement for the 2020 Annual Meeting of Shareholders.
The information required by Item 12 is incorporated herein by reference to the information that appears under the heading "Security Ownership" in the Registrant's Proxy Statement for the 2020 Annual Meeting of Shareholders.
The information required by Item 13 is incorporated herein by reference to the information that appears under the headings "Related Party Transactions" and "Election of Directors – Board Independence" in the Registrant's Proxy Statement for the 2020 Annual Meeting of Shareholders.
The information required by Item 14 is incorporated herein by reference to the information that appears under the heading "Independent Registered Public Accounting Firm" in the Registrant's Proxy Statement for the 2020 Annual Meeting of Shareholders.
3
PART I
Forward-Looking Statements
This report contains forward-looking statements with respect to the financial condition, results of operations and business of American National Bankshares Inc. (the "Company") and its wholly owned subsidiary, American National Bank and Trust Company (the "Bank"). These forward-looking statements involve risks and uncertainties and are based on the beliefs and assumptions of management of the Company and on information available to management at the time these statements and disclosures were prepared. Forward-looking statements are subject to numerous assumptions, estimates, risks, and uncertainties that could cause actual conditions, events, or results to differ materially from those stated or implied by such forward-looking statements.
A variety of factors, some of which are discussed in more detail in Item 1A – Risk Factors, may affect the operations, performance, business strategy, and results of the Company. Those factors include but are not limited to the following:
• | financial market volatility including the level of interest rates could affect the values of financial instruments and the amount of net interest income earned; |
• | general economic or business conditions, either nationally or in the market areas in which the Company does business, may be less favorable than expected, resulting in deteriorating credit quality, reduced demand for credit, or a weakened ability to generate deposits; |
• | competition among financial institutions may increase and competitors may have greater financial resources and develop products and technology that enable those competitors to compete more successfully than the Company; |
• | businesses that the Company is engaged in may be adversely affected by legislative or regulatory changes, including changes in accounting standards and tax laws; |
• | the ability to recruit and retain key personnel; |
• | technological risks and developments, and cyber-threats, attacks or events; |
• | the failure of assumptions underlying the allowance for loan losses; and |
• | risks associated with mergers, acquisitions, and other expansion activities. |
ITEM 1 – BUSINESS
American National Bankshares Inc. is a one-bank holding company organized under the laws of the Commonwealth of Virginia in 1984. On September 1, 1984, the Company acquired all of the outstanding capital stock of American National Bank and Trust Company, a national banking association chartered in 1909 under the laws of the United States. American National Bank and Trust Company is the only banking subsidiary of the Company.
As of December 31, 2019, the operations of the Company are conducted at twenty-six banking offices and one loan production office in Roanoke, Virginia. Through these offices, the Company serves its primary market area of south central Virginia and north central North Carolina. The Bank provides a full array of financial products and services, including commercial, mortgage, and consumer banking; trust and investment services; and insurance. Services are also provided through thirty-eight Automated Teller Machines ("ATMs"), "Online Banking," and "Telephone Banking."
On April 1, 2019, the Company completed the acquisition of Roanoke-based HomeTown Bankshares Corporation ("HomeTown"). The acquisition of HomeTown deepened the Company’s footprint in the Roanoke, Virginia metropolitan area and created a presence in the New River Valley with an office in Christiansburg, Virginia.
The Company has two reportable segments, (i) community banking and (ii) trust and investment services. For more financial data and other information about each of the Company’s operating segments, refer to "Note 24 - Segment and Related Information" of the Consolidated Financial Statements contained in Item 8 of this Form 10-K.
Competition and Markets
Vigorous competition exists in the Company's service areas. The Company competes not only with national, regional, and community banks, but also with other types of financial institutions including finance companies, mutual and money market fund providers, financial technology companies, brokerage firms, insurance companies, credit unions, and mortgage companies.
The Company’s primary market area is south central Virginia and north central North Carolina. The Company also has a significant presence in Roanoke, Virginia that increased substantially in connection with the acquisition of HomeTown. The Company's Virginia banking offices are located in the cities of Danville, Lynchburg, Martinsville, Roanoke, and Salem and in the counties of Campbell, Franklin, Halifax, Henry, Montgomery, Pittsylvania and Roanoke. In North Carolina, the Company's banking offices are located in the cities of Burlington, Graham, Greensboro, Mebane, Winston-Salem, and Yanceyville, which are within the counties of Alamance, Caswell, Forsyth, and Guilford.
4
The Company has the largest deposit market share in the City of Danville, Virginia. The Company had a deposit market share in the Danville Micropolitan Statistical Area of 36.3% at June 30, 2019 based on Federal Deposit Insurance Corporation ("FDIC") data. The Company has the second largest deposit market share in Pittsylvania County, Virginia. The Company had a deposit market share in the County of 22.9% at June 30, 2019, based on FDIC data.
Throughout our Virginia footprint, employment continues to see positive growth from several business segments, but particularly within the educational, medical, and service sectors. The market area has experienced job growth in the manufacturing and technology area. Other important industries include farming, tobacco processing and sales, food processing, forestry management and lumber production.
The Company's market area in North Carolina has strong competition in attracting deposits and making loans. Its most direct competition for deposits comes from commercial banks and credit unions located in the market area, including large financial institutions that have greater financial and marketing resources available to them. The Company had a deposit market share in Alamance County of 12.9% at June 30, 2019, based on FDIC data, which was the third largest of any FDIC-insured institution.
Supervision and Regulation
The Company and the Bank are extensively regulated under federal and state law. The following information describes certain aspects of that regulation applicable to the Company and the Bank and does not purport to be complete. Proposals to change the laws, regulations, and policies governing the banking industry are frequently raised in U.S. Congress, in state legislatures, and before the various bank regulatory agencies. The likelihood and timing of any changes and the impact such changes might have on the Company and the Bank are impossible to determine with any certainty. A change in applicable laws, regulations or policies, or a change in the way such laws, regulations or policies are interpreted by regulatory agencies or courts, may have a material impact on the business, operations, and earnings of the Company and the Bank.
American National Bankshares Inc.
American National Bankshares Inc. is qualified as a bank holding company ("BHC") within the meaning of the Bank Holding Company Act of 1956, as amended (the "BHC Act"), and is registered as such with the Board of Governors of the Federal Reserve System (the "FRB"). As a bank holding company, the Company is subject to supervision, regulation and examination by the FRB and is required to file various reports and additional information with the FRB. The Company is also registered under the bank holding company laws of Virginia and is subject to supervision, regulation and examination by the Bureau of Financial Institutions of the Virginia State Corporation Commission (the "SCC").
Under the Gramm-Leach-Bliley Act, a BHC may elect to become a financial holding company and thereby engage in a broader range of financial and other activities than are permissible for traditional BHC's. In order to qualify for the election, all of the depository institution subsidiaries of the BHC must be well capitalized, well managed, and have achieved a rating of "satisfactory" or better under the Community Reinvestment Act (the "CRA"). Financial holding companies are permitted to engage in activities that are "financial in nature" or incidental or complementary thereto as determined by the FRB. The Gramm-Leach-Bliley Act identifies several activities as "financial in nature," including insurance underwriting and sales, investment advisory services, merchant banking and underwriting, and dealing or making a market in securities. The Company has not elected to become a financial holding company, and has no plans to become a financial holding company.
American National Bank and Trust Company
American National Bank and Trust Company is a federally chartered national bank and is a member of the Federal Reserve System. As a national bank, the Bank is subject to supervision, regulation and examination by the Office of the Comptroller of the Currency (the "OCC") and is required to file various reports and additional information with the OCC. The OCC has primary supervisory and regulatory authority over the operations of the Bank. Because the Bank accepts insured deposits from the public, it is also subject to examination by the FDIC.
Depository institutions, including the Bank, are subject to extensive federal and state regulations that significantly affect their business and activities. Regulatory bodies have broad authority to implement standards and initiate proceedings designed to prohibit depository institutions from engaging in unsafe and unsound banking practices. The standards relate generally to operations and management, asset quality, interest rate exposure, and capital. The bank regulatory agencies are authorized to take action against institutions that fail to meet such standards.
As with other financial institutions, the earnings of the Bank are affected by general economic conditions and by the monetary policies of the FRB. The FRB exerts a substantial influence on interest rates and credit conditions, primarily through open market operations in U.S. Government securities, setting the reserve requirements of member banks, and establishing the
5
discount rate on member bank borrowings. The policies of the FRB have a direct impact on loan and deposit growth and the interest rates charged and paid thereon. They also impact the source, cost of funds, and the rates of return on investments. Changes in the FRB's monetary policies have had a significant impact on the operating results of the Bank and other financial institutions and are expected to continue to do so in the future; however, the exact impact of such conditions and policies upon the future business and earnings cannot accurately be predicted.
The Dodd-Frank Act
On July 21, 2010, President Obama signed into law the Dodd-Frank Wall Street Reform and Consumer Protection Act (the "Dodd-Frank Act"). The Dodd-Frank Act significantly restructured the financial regulatory regime in the United States and has had a broad impact on the financial services industry as a result of the significant regulatory and compliance changes required under the act. A summary of certain provisions of the Dodd-Frank Act is set forth below:
Increased Capital Standards. The federal banking agencies are required to establish minimum leverage and risk-based capital requirements for banks and bank holding companies. See "Capital Requirements" below. Among other things, the Dodd-Frank Act provides for stronger capital standards.
Deposit Insurance. The Dodd-Frank Act made permanent the $250,000 deposit insurance limit for insured deposits. Amendments to the Federal Deposit Insurance Act ("FDIA") also revised the assessment base against which an insured depository institution's deposit insurance premiums paid to the Deposit Insurance Fund (the "DIF") are calculated. Under the amendments, the assessment base is the institution's average consolidated total assets less its average tangible equity during the assessment period. Additionally, the Dodd-Frank Act made changes to the minimum designated reserve ratio of the DIF, increasing the minimum from 1.15% to 1.35% of the estimated amount of total insured deposits and eliminating the requirement that the FDIC pay dividends to depository institutions when the reserve ratio exceeds certain thresholds. The Dodd-Frank Act also provides that depository institutions may pay interest on demand deposits.
The Consumer Financial Protection Bureau ("CFPB"). The Dodd-Frank Act created the CFPB. The CFPB is charged with establishing rules and regulations under certain federal consumer protection laws with respect to the conduct of providers of certain consumer financial products and services.
Compensation Practices. The Dodd-Frank Act provides that the appropriate federal regulators must establish standards prohibiting as an unsafe and unsound practice any compensation plan of a bank holding company or bank that provides an insider or other employee with "excessive compensation" or could lead to a material financial loss to such firm. In June 2010, prior to the Dodd-Frank Act, the federal bank regulatory agencies promulgated the Interagency Guidance on Sound Incentive Compensation Policies, which requires that financial institutions establish metrics for measuring the impact of activities to achieve incentive compensation with the related risk to the financial institution of such behavior. See "Incentive Compensation" below.
Recent Amendments to the Dodd-Frank Act. The Economic Growth, Regulatory Relief and Consumer Protection Act of 2018, which was signed into law on May 24, 2018 (the "EGRRCPA"), amended the Dodd-Frank Act to provide regulatory relief for certain smaller and regional financial institutions. The EGRRCPA, among other things, provides financial institutions with less than $10 billion in assets with relief from certain capital requirements and exempts banks with less than $250 billion in total consolidated assets from the enhanced prudential standards and the company-run and supervisory stress tests required under the Dodd-Frank Act.
The Dodd-Frank Act has had, and may in the future have, a material impact on the Company’s operations, particularly through increased compliance costs resulting from new and possible future consumer and fair lending regulations. The future changes resulting from the Dodd-Frank Act may affect the profitability of business activities, require changes to certain business practices, impose more stringent regulatory requirements or otherwise adversely affect the business and financial condition of the Company and the Bank. These changes may also require the Company to invest significant management attention and resources to evaluate and make necessary changes to comply with new statutory and regulatory requirements.
Deposit Insurance
The deposits of the Bank are insured up to applicable limits by the DIF and are subject to deposit insurance assessments to maintain the DIF. The deposit insurance assessment base of the Bank is based on its average total assets minus average tangible equity, pursuant to a rule issued by the FDIC as required by the Dodd-Frank Act. The FDIC uses a "financial ratios method" based on CAMELS composite ratings to determine assessment rates for small established institutions with less than $10 billion in assets, such as the Bank. The CAMELS rating system is a supervisory rating system designed to take into account and reflect all financial and operational risks that a bank may face, including capital adequacy, asset quality, management capability,
6
earnings, liquidity and sensitivity to market risk ("CAMELS"). CAMELS composite ratings set a maximum assessment for CAMELS 1 and 2 rated banks, and set minimum assessments for lower rated institutions.
The FDIC’s "reserve ratio" of the DIF to total industry deposits reached its 1.15% target effective June 30, 2016. On March 15, 2016, the FDIC implemented by final rule certain Dodd-Frank Act provisions by raising the DIF’s minimum reserve ratio from 1.15% to 1.35%. The FDIC imposed a 4.5 basis point annual surcharge on insured depository institutions with total consolidated assets of $10 billion or more. The new rule granted credits to smaller banks for the portion of their regular assessments that contributed to increasing the reserve ratio from 1.15% to 1.35%, to be applied when the reserve ratio reached at least 1.38%. The 1.35% target was achieved in the third quarter of 2018, resulting in the termination of the surcharge. The reserve ratio reached 1.40% as of June 30, 2019, and the FDIC first applied small bank credits on the assessment for the second quarter of 2019, which was invoiced September 30, 2019. The FDIC will continue to apply the balance of small bank credits as long as the reserve ratio is at least 1.35%. Prior to when the new assessment system became effective, the Bank’s overall rate for assessment calculations was 9 basis points or less, which was within the range of assessment rates for the lowest risk category under the former FDIC assessment rules. In 2019 and 2018, the Company recorded expense of $119,000 and $537,000, respectively, for FDIC insurance premiums.
In addition, all FDIC insured institutions were required to pay assessments to the FDIC at an annual rate of approximately one basis point of insured deposits to fund interest payments on bonds issued by the Financing Corporation, an agency of the federal government established to recapitalize the predecessor to the Savings Association Insurance Fund. These assessments continued until the Financing Corporation bonds matured in 2019.
Capital Requirements
The FRB, the OCC and the FDIC have issued substantially similar capital guidelines applicable to all banks and bank holding companies. In addition, those regulatory agencies may from time to time require that a banking organization maintain capital above the minimum levels because of its financial condition or actual or anticipated growth.
Effective January 1, 2015, the Company and the Bank became subject to rules implementing the Basel III regulatory capital reforms from the Basel Committee on Banking Supervision (the "Basel Committee") and certain provisions of the Dodd-Frank Act (the "Basel III Capital Rules"). The Basel III Capital Rules require the Company and the Bank to comply with the following minimum capital ratios: (i) a ratio of common equity Tier 1 to risk-weighted assets ("CET1") of at least 4.5%, plus a 2.5% "capital conservation buffer" (effectively resulting in a minimum CET1 ratio of at least 7%), (ii) a ratio of Tier 1 capital to risk-weighted assets of at least 6.0%, plus the 2.5% capital conservation buffer (effectively resulting in a minimum Tier 1 capital ratio of 8.5%), (iii) a ratio of total capital to risk-weighted assets of at least 8.0%, plus the 2.5% capital conservation buffer (effectively resulting in a minimum total capital ratio of 10.5%), and (iv) a leverage ratio of 4%, calculated as the ratio of Tier 1 capital to average assets. The phase-in of the capital conservation buffer requirement began on January 1, 2016, at 0.625% of risk-weighted assets, increasing by the same amount each year until it was fully implemented at 2.5% on January 1, 2019.
With respect to the Bank, the "prompt corrective action" regulations pursuant to Section 38 of the FDIA were also revised, effective as of January 1, 2015, to incorporate a CET1 ratio and to increase certain other capital ratios. To be well capitalized under the revised regulations, a bank must have the following minimum capital ratios: (i) a CET1 ratio of at least 6.5%; (ii) a Tier 1 capital to risk-weighted assets ratio of at least 8.0%; (iii) a total capital to risk-weighted assets ratio of at least 10.0%; and (iv) a leverage ratio of at least 5.0%. See "The Federal Deposit Insurance Corporation Improvement Act" below.
The Tier 1 and total capital to risk-weighted asset ratios of the Company were 12.98% and 14.04%, respectively, as of December 31, 2019, thus exceeding the minimum requirements. The CET 1 ratio of the Company was 11.56% and the Bank was 12.38% as of December 31, 2019. The Tier 1 and total capital to risk-weighted asset ratios of the Bank were 12.38% and 13.06%, respectively, as of December 31, 2019, also exceeding the minimum requirements.
The Basel III Capital Rules provide for a number of deductions from and adjustments to CET1. In July 2019, the federal banking agencies adopted final rules (the “Capital Simplification Rules”) that, among other things, revised these deductions and adjustments. Following the adoption of the Capital Simplification Rules, certain deferred tax assets and significant investments in non-consolidated financial entities must be deducted from CET1 to the extent that any one such category exceeds 25% of CET1. Prior to the adoption of the Capital Simplification Rules, amounts were deducted from CET1 to the extent that any one such category exceeded 10% of CET1 or all such items, in the aggregate, exceeded 15% of CET1. The Capital Simplification Rules took effect for the Company as of January 1, 2020. These limitations did not impact regulatory capital during any of the reported periods.
The Basel III Capital Rules prescribe a standardized approach for risk weightings that expanded the risk-weighting categories from the general risk-based capital rules to a much larger and more risk-sensitive number of categories, depending
7
on the nature of the assets, generally ranging from 0% for U.S. government and agency securities, to 600% for certain equity exposures (and higher percentages for certain other types of interests), and resulting in higher risk weights for a variety of asset categories. In November 2019, the federal banking agencies adopted a rule revising the scope of commercial real estate mortgages subject to a 150% risk weight.
In December 2017, the Basel Committee published standards that it described as the finalization of the Basel III post-crisis regulatory reforms (the standards are commonly referred to as "Basel IV"). Among other things, these standards revise the Basel Committee’s standardized approach for credit risk (including by recalibrating risk weights and introducing new capital requirements for certain "unconditionally cancellable commitments," such as unused credit card lines of credit) and provide a new standardized approach for operational risk capital. Under the proposed framework, these standards will generally be effective on January 1, 2022, with an aggregate output floor phasing-in through January 1, 2027. Under the current capital rules, operational risk capital requirements and a capital floor apply only to advanced approaches institutions, and not to the Company. The impact of Basel IV on the Company and the Bank will depend on the manner in which it is implemented by the federal bank regulatory agencies.
On August 28, 2018, the FRB issued an interim final rule required by the EGRRCPA that expands the applicability of the FRB’s small bank holding company policy statement (the "SBHC Policy Statement") to bank holding companies with total consolidated assets of less than $3 billion (up from the prior $1 billion threshold). Under the SBHC Policy Statement, qualifying bank holding companies have additional flexibility in the amount of debt they can issue and are also exempt from the Basel III Capital Rules (subsidiary depository institutions of qualifying bank holding companies are still subject to capital requirements). The Company currently has less than $3 billion in total consolidated assets and would likely qualify under the revised SBHC Policy Statement. However, the Company does not currently intend to issue a material amount of debt or take any other action that would cause its capital ratios to fall below the minimum ratios required by the Basel III Capital Rules.
On September 17, 2019, the federal banking agencies jointly issued a final rule required by the EGRRCPA that will permit qualifying banks and bank holding companies that have less than $10 billion in consolidated assets to elect to be subject to a 9% leverage ratio (commonly referred to as the community bank leverage ratio or "CBLR"). Under the final rule, banks and bank holding companies that opt into the CBLR framework and maintain a CBLR of greater than 9% would not be subject to other risk-based and leverage capital requirements under the Basel III Capital Rules and will be deemed to have met the well capitalized ratio requirements under the "prompt corrective action" framework. In addition, a community bank that falls out of compliance with the framework will have a two-quarter grace period to come back into full compliance, provided its leverage ratio remains above 8%, and will be deemed well-capitalized during the grace period. The CBLR framework will first be available for banking organizations to use in their March 31, 2020 regulatory reports. The Company and the Bank do not currently expect to opt into the CBLR framework.
Dividends
The Company's principal source of cash flow, including cash flow to pay dividends to its shareholders, is dividends it receives from the Bank. Statutory and regulatory limitations apply to the Bank's payment of dividends to the Company. As a general rule, the amount of a dividend may not exceed, without prior regulatory approval, the sum of net income in the calendar year to date and the retained net earnings of the immediately preceding two calendar years. A depository institution may not pay any dividend if payment would cause the institution to become "undercapitalized" or if it already is "undercapitalized." The OCC may prevent the payment of a dividend if it determines that the payment would be an unsafe and unsound banking practice. The OCC also has advised that a national bank should generally pay dividends only out of current operating earnings.
Permitted Activities
As a bank holding company, the Company is limited to managing or controlling banks, furnishing services to or performing services for its subsidiaries, and engaging in other activities that the FRB determines by regulation or order to be so closely related to banking or managing or controlling banks as to be a proper incident thereto. In determining whether a particular activity is permissible, the FRB must consider whether the performance of such an activity reasonably can be expected to produce benefits to the public that outweigh possible adverse effects. Possible benefits include greater convenience, increased competition, and gains in efficiency. Possible adverse effects include undue concentration of resources, decreased or unfair competition, conflicts of interest, and unsound banking practices. Despite prior approval, the FRB may order a bank holding company or its subsidiaries to terminate any activity or to terminate ownership or control of any subsidiary when the FRB has reasonable cause to believe that a serious risk to the financial safety, soundness or stability of any bank subsidiary of that bank holding company may result from such an activity.
8
Banking Acquisitions; Changes in Control
The BHC Act requires, among other things, the prior approval of the FRB in any case where a bank holding company proposes to (i) acquire direct or indirect ownership or control of more than 5% of the outstanding voting stock of any bank or bank holding company (unless it already owns a majority of such voting shares), (ii) acquire all or substantially all of the assets of another bank or bank holding company, or (iii) merge or consolidate with any other bank holding company. In determining whether to approve a proposed bank acquisition, the FRB will consider, among other factors, the effect of the acquisition on competition, the public benefits expected to be received from the acquisition, the projected capital ratios and levels on a post-acquisition basis, and the acquiring institution's performance under the CRA and its compliance with fair housing and other consumer protection laws.
Subject to certain exceptions, the BHC Act and the Change in Bank Control Act, together with the applicable regulations, require FRB approval (or, depending on the circumstances, no notice of disapproval) prior to any person or company acquiring "control" of a bank or bank holding company. A conclusive presumption of control exists if an individual or company acquires the power, directly or indirectly, to direct the management or policies of an insured depository institution or to vote 25% or more of any class of voting securities of any insured depository institution. A rebuttable presumption of control exists if a person or company acquires 10% or more but less than 25% of any class of voting securities of an insured depository institution and either the institution has registered its securities with the Securities and Exchange Commission under Section 12 of the Securities Exchange Act of 1934 (the "Exchange Act") or no other person will own a greater percentage of that class of voting securities immediately after the acquisition. The Company's common stock is registered under Section 12 of the Exchange Act.
In addition, Virginia law requires the prior approval of the SCC for (i) the acquisition of more than 5% of the voting shares of a Virginia bank or any holding company that controls a Virginia bank, or (ii) the acquisition by a Virginia bank holding company of a bank or its holding company domiciled outside Virginia.
Source of Strength
FRB policy has historically required bank holding companies to act as a source of financial and managerial strength to their subsidiary banks. The Dodd-Frank Act codified this policy as a statutory requirement. Under this requirement, the Company is expected to commit resources to support the Bank, including at times when the Company may not be in a financial position to provide such resources. Any capital loans by a bank holding company to any of its subsidiary banks are subordinate in right of payment to depositors and to certain other indebtedness of such subsidiary banks. In the event of a bank holding company's bankruptcy, any commitment by the bank holding company to a federal bank regulatory agency to maintain the capital of a subsidiary bank will be assumed by the bankruptcy trustee and entitled to priority of payment.
Safety and Soundness
There are a number of obligations and restrictions imposed on bank holding companies and their subsidiary banks by law and regulatory policy that are designed to minimize potential loss to the depositors of such depository institutions and the FDIC insurance fund in the event of a depository institution default. For example, under the Federal Deposit Insurance Corporation Improvement Act of 1991, to avoid receivership of an insured depository institution subsidiary, a bank holding company is required to guarantee the compliance of any subsidiary bank that may become "undercapitalized" with the terms of any capital restoration plan filed by such subsidiary with its appropriate federal bank regulatory agency up to the lesser of (i) an amount equal to 5% of the institution's total assets at the time the institution became undercapitalized or (ii) the amount that is necessary (or would have been necessary) to bring the institution into compliance with all applicable capital standards as of the time the institution fails to comply with such capital restoration plan.
Under the FDIA, the federal bank regulatory agencies have adopted guidelines prescribing safety and soundness standards. These guidelines establish general standards relating to internal controls and information systems, internal audit systems, loan documentation, credit underwriting, interest rate exposure, asset growth and compensation, fees and benefits. In general, the guidelines require, among other things, appropriate systems and practices to identify and manage the risk and exposures specified in the guidelines.
The Federal Deposit Insurance Corporation Improvement Act
Under the Federal Deposit Insurance Corporation Improvement Act of 1991 ("FDICIA"), the federal bank regulatory agencies possess broad powers to take prompt corrective action to resolve problems of insured depository institutions. The extent of these powers depends upon whether the institution is "well capitalized," "adequately capitalized," "undercapitalized," "significantly undercapitalized," or "critically undercapitalized," as defined by the law.
9
Reflecting changes under the new Basel III capital requirements, the relevant capital measures that became effective on January 1, 2015 for prompt corrective action are the total capital ratio, the common equity Tier 1 capital ratio, the Tier 1 capital ratio and the leverage ratio. A bank will be (i) "well capitalized" if the institution has a total risk-based capital ratio of 10.0% or greater, a common equity Tier 1 capital ratio of 6.5% or greater, a Tier 1 risk-based capital ratio of 8.0% or greater, and a leverage ratio of 5.0% or greater, and is not subject to any capital directive order; (ii) "adequately capitalized" if the institution has a total risk-based capital ratio of 8.0% or greater, a common equity Tier 1 capital ratio of 4.5% or greater, a Tier 1 risk-based capital ratio of 6.0% or greater, and a leverage ratio of 4.0% or greater and is not "well capitalized"; (iii) "undercapitalized" if the institution has a total risk-based capital ratio that is less than 8.0%, a common equity Tier 1 capital ratio less than 4.5%, a Tier 1 risk-based capital ratio of less than 6.0% or a leverage ratio of less than 4.0%; (iv) "significantly undercapitalized" if the institution has a total risk-based capital ratio of less than 6.0%, a common equity Tier 1 capital ratio less than 3.0%, a Tier 1 risk-based capital ratio of less than 4.0% or a leverage ratio of less than 3.0%; and (v) "critically undercapitalized" if the institution's tangible equity is equal to or less than 2.0% of average quarterly tangible assets. An institution may be downgraded to, or deemed to be in, a capital category that is lower than indicated by its capital ratios if it is determined to be in an unsafe or unsound condition or if it receives an unsatisfactory examination rating with respect to certain matters. A bank's capital category is determined solely for the purpose of applying prompt corrective action regulations, and the capital category may not constitute an accurate representation of the bank's overall financial condition or prospects for other purposes. Management believes, as of December 31, 2019 and 2018, the Bank met the requirements for being classified as "well capitalized."
As described above, on September 17, 2019, the federal banking agencies jointly issued a final rule required by the EGRRCPA that will permit qualifying banks and bank holding companies that have less than $10 billion in consolidated assets to elect to opt into the CBLR framework. Banks opting into the CBLR framework and maintaining a CBLR of greater than 9% will be deemed to have met the well capitalized ratio requirements under the "prompt corrective action" framework. In addition, a community bank that falls out of compliance with the framework will have a two-quarter grace period to come back into full compliance, provided its leverage ratio remains above 8%, and will be deemed well-capitalized during the grace period. The CBLR framework will first be available for banking organizations to use in their March 31, 2020 regulatory reports. The Company and the Bank do not currently expect to opt into the CBLR framework.
As required by FDICIA, the federal bank regulatory agencies also have adopted guidelines prescribing safety and soundness standards relating to, among other things, internal controls and information systems, internal audit systems, loan documentation, credit underwriting, and interest rate exposure. In general, the guidelines require appropriate systems and practices to identify and manage the risks and exposures specified in the guidelines. In addition, the agencies adopted regulations that authorize, but do not require, an institution which has been notified that it is not in compliance with safety and soundness standard to submit a compliance plan. If, after being so notified, an institution fails to submit an acceptable compliance plan, the agency must issue an order directing action to correct the deficiency and may issue an order directing other actions of the types to which an undercapitalized institution is subject under the prompt corrective action provisions described above.
Branching
Pursuant to the Dodd-Frank Act, national and state-chartered banks may open an initial branch in a state other than its home state (e.g., a host state) by establishing a de novo branch at any location in such host state at which a bank chartered in such host state could establish a branch. Applications to establish such branches must still be filed with the appropriate primary federal bank regulatory agency and state bank regulatory authorities may require applications or notices.
Transactions with Affiliates
Pursuant to Sections 23A and 23B of the Federal Reserve Act and Regulation W, the authority of the Bank to engage in transactions with related parties or "affiliates" or to make loans to insiders is limited. Loan transactions with an affiliate generally must be collateralized and certain transactions between the Bank and its affiliates, including the sale of assets, the payment of money or the provision of services, must be on terms and conditions that are substantially the same, or at least as favorable to the Bank, as those prevailing for comparable nonaffiliated transactions. In addition, the Bank generally may not purchase securities issued or underwritten by affiliates.
Loans to executive officers, directors or to any person who directly or indirectly, or acting through or in concert with one or more persons, owns, controls or has the power to vote more than 10% of any class of voting securities of a bank (a "10% Shareholders"), are subject to Sections 22(g) and 22(h) of the Federal Reserve Act and their corresponding regulations (Regulation O) and Section 13(k) of the Exchange Act relating to the prohibition on personal loans to executives (which exempts financial institutions in compliance with the insider lending restrictions of Section 22(h) of the Federal Reserve Act). Among other things, these loans must be made on terms substantially the same as those prevailing on transactions made to
10
unaffiliated individuals and certain extensions of credit to those persons must first be approved in advance by a disinterested majority of the entire board of directors. Section 22(h) of the Federal Reserve Act prohibits loans to any of those individuals where the aggregate amount exceeds an amount equal to 15% of an institution's unimpaired capital and surplus plus an additional 10% of unimpaired capital and surplus in the case of loans that are fully secured by readily marketable collateral, or when the aggregate amount on all of the extensions of credit outstanding to all of these persons would exceed the Bank's unimpaired capital and unimpaired surplus. Section 22(g) of the Federal Reserve Act identifies limited circumstances in which the Bank is permitted to extend credit to executive officers.
Consumer Financial Protection
The Company is subject to a number of federal and state consumer protection laws that extensively govern its relationship with its customers. These laws include the Equal Credit Opportunity Act, the Fair Credit Reporting Act, the Truth in Lending Act, the Truth in Savings Act, the Electronic Fund Transfer Act, the Expedited Funds Availability Act, the Home Mortgage Disclosure Act, the Fair Housing Act, the Real Estate Settlement Procedures Act, the Fair Debt Collection Practices Act, the Service Members Civil Relief Act, laws governing flood insurance, federal and state laws prohibiting unfair and deceptive business practices, foreclosure laws, and various regulations that implement some or all of the foregoing. These laws and regulations mandate certain disclosure requirements and regulate the manner in which financial institutions must deal with customers when taking deposits, making loans, collecting loans and providing other services. If the Company fails to comply with these laws and regulations, it may be subject to various penalties. Failure to comply with consumer protection requirements may also result in failure to obtain any required bank regulatory approval for merger or acquisition transactions the Company may wish to pursue or being prohibited from engaging in such transactions even if approval is not required.
The Dodd-Frank Act centralized responsibility for consumer financial protection by creating a new agency, the CFPB, and giving it responsibility for implementing, examining, and enforcing compliance with federal consumer protection laws. The CFPB focuses on (i) risks to consumers and compliance with the federal consumer financial laws, (ii) the markets in which firms operate and risks to consumers posed by activities in those markets, (iii) depository institutions that offer a wide variety of consumer financial products and services, and (iv) non-depository companies that offer one or more consumer financial products or services. The CFPB has broad rule making authority for a wide range of consumer financial laws that apply to all banks, including, among other things, the authority to prohibit "unfair, deceptive or abusive" acts and practices. Abusive acts or practices are defined as those that materially interfere with a consumer's ability to understand a term or condition of a consumer financial product or service or take unreasonable advantage of a consumer's (i) lack of financial savvy, (ii) inability to protect himself in the selection or use of consumer financial products or services, or (iii) reasonable reliance on a covered entity to act in the consumer's interests. The CFPB can issue cease-and-desist orders against banks and other entities that violate consumer financial laws. The CFPB may also institute a civil action against an entity in violation of federal consumer financial law in order to impose a civil penalty or injunction.
Community Reinvestment Act
The CRA requires the appropriate federal banking agency, in connection with its examination of a bank, to assess the bank's record in meeting the credit needs of the communities served by the bank, including low and moderate income neighborhoods. Furthermore, such assessment is also required of banks that have applied, among other things, to merge or consolidate with or acquire the assets or assume the liabilities of an insured depository institution, or to open or relocate a branch. In the case of a BHC applying for approval to acquire a bank or BHC, the record of each subsidiary bank of the applicant BHC is subject to assessment in considering the application. Under the CRA, institutions are assigned a rating of "outstanding," "satisfactory," "needs to improve," or "substantial non-compliance." The Bank was rated "satisfactory" in its most recent CRA evaluation.
In December 2019, the FDIC and the OCC jointly proposed rules that would significantly change existing CRA regulations. The proposed rules are intended to increase bank activity in low- and moderate-income communities where there is significant need for credit, more responsible lending, greater access to banking services, and improvements to critical infrastructure. The proposals change four key areas: (i) clarifying what activities qualify for CRA credit; (ii) updating where activities count for CRA credit; (iii) providing a more transparent and objective method for measuring CRA performance; and (iv) revising CRA-related data collection, record keeping, and reporting. The Company is evaluating what impact this proposed rule, if implemented, may have on its operations.
Anti-Money Laundering Legislation
The Company is subject to the Bank Secrecy Act and other anti-money laundering laws and regulations, including the USA Patriot Act of 2001. Among other things, these laws and regulations require the Company to take steps to prevent the use of the Company for facilitating the flow of illegal or illicit money, to report large currency transactions, and to file suspicious activity reports. The Company is also required to carry out a comprehensive anti-money laundering compliance program. Violations
11
can result in substantial civil and criminal sanctions. In addition, provisions of the USA Patriot Act require the federal bank regulatory agencies to consider the effectiveness of a financial institution's anti-money laundering activities when reviewing bank mergers and BHC acquisitions.
Office of Foreign Assets Control
The U.S. Treasury Department’s Office of Foreign Assets Control ("OFAC") is responsible for administering and enforcing economic and trade sanctions against specified foreign parties, including countries and regimes, foreign individuals and other foreign organizations and entities. OFAC publishes lists of prohibited parties that are regularly consulted by the Company in the conduct of its business in order to assure compliance. The Company is responsible for, among other things, blocking accounts of, and transactions with, prohibited parties identified by OFAC, avoiding unlicensed trade and financial transactions with such parties and reporting blocked transactions after their occurrence. Failure to comply with OFAC requirements could have serious legal, financial and reputational consequences for the Company.
Privacy Legislation
Several recent laws, including the Right to Financial Privacy Act, and related regulations issued by the federal bank regulatory agencies, also provide new protections against the transfer and use of customer information by financial institutions. A financial institution must provide to its customers information regarding its policies and procedures with respect to the handling of customers' personal information. Each institution must conduct an internal risk assessment of its ability to protect customer information. These privacy provisions generally prohibit a financial institution from providing a customer's personal financial information to unaffiliated parties without prior notice and approval from the customer.
Incentive Compensation
In June 2010, the federal bank regulatory agencies issued comprehensive final guidance on incentive compensation policies intended to ensure that the incentive compensation policies of financial institutions do not undermine the safety and soundness of such institutions by encouraging excessive risk-taking. The Interagency Guidance on Sound Incentive Compensation Policies, which covers all employees that have the ability to materially affect the risk profile of a financial institutions, either individually or as part of a group, is based upon the key principles that a financial institution's incentive compensation arrangements should (i) provide incentives that do not encourage risk-taking beyond the institution's ability to effectively identify and manage risks, (ii) be compatible with effective internal controls and risk management, and (iii) be supported by strong corporate governance, including active and effective oversight by the financial institution's board of directors.
Section 956 of the Dodd-Frank Act requires the federal banking agencies and the Securities and Exchange Commission to establish joint regulations or guidelines prohibiting incentive-based payment arrangements at specified regulated entities that encourage inappropriate risk-taking by providing an executive officer, employee, director or principal shareholder with excessive compensation, fees, or benefits or that could lead to material financial loss to the entity. The federal banking agencies issued such proposed rules in March 2011 and issued a revised proposed rule in June 2016 implementing the requirements and prohibitions set forth in Section 956. The revised proposed rule would apply to all banks, among other institutions, with at least $1 billion in average total consolidated assets, like the Bank, for which it would go beyond the existing Interagency Guidance on Sound Incentive Compensation Policies to (i) prohibit certain types and features of incentive-based compensation arrangements for senior executive officers, (ii) require incentive-based compensation arrangements to adhere to certain basic principles to avoid a presumption of encouraging inappropriate risk, (iii) require appropriate board or committee oversight, (iv) establish minimum recordkeeping, and (v) mandate disclosures to the appropriate federal banking agency. The proposed rules have not yet been finalized.
The FRB will review, as part of the regular, risk-focused examination process, the incentive compensation arrangements of financial institutions, such as the Company, that are not "large, complex banking organizations." These reviews will be tailored to each financial institution based on the scope and complexity of the institution's activities and the prevalence of incentive compensation arrangements. The findings of the supervisory initiatives will be included in reports of examination. Deficiencies will be incorporated into the institution's supervisory ratings, which can affect the institution's ability to make acquisitions and take other actions. Enforcement actions may be taken against a financial institution if its incentive compensation arrangements, or related risk-management control or governance processes, pose a risk to the institution's safety and soundness and the financial institution is not taking prompt and effective measures to correct the deficiencies. At December 31, 2019, the Company had not been made aware of any instances of non-compliance with the final guidance.
12
Ability-to-Repay and Qualified Mortgage Rule
Pursuant to the Dodd-Frank Act, the CFPB has issued a final rule amending Regulation Z as implemented by the Truth in Lending Act, requiring mortgage lenders to make a reasonable and good faith determination based on verified and documented information that a consumer applying for a mortgage loan has a reasonable ability to repay the loan according to its terms. Mortgage lenders are required to determine consumers' ability to repay in one of two ways. The first alternative requires the mortgage lender to consider the following eight underwriting factors when making the credit decision: (i) current or reasonably expected income or assets; (ii) current employment status; (iii) the monthly payment on the covered transaction; (iv) the monthly payment on any simultaneous loan; (v) the monthly payment for mortgage-related obligations; (vi) current debt obligations, alimony, and child support; (vii) the monthly debt-to-income ratio or residual income; and (viii) credit history. Alternatively, the mortgage lender can originate "qualified mortgages," which are entitled to a presumption that the creditor making the loan satisfied the ability-to-repay requirements. In general, a "qualified mortgage" is a mortgage loan without negative amortization, interest-only payments, balloon payments, or terms exceeding 30 years. In addition, to be a qualified mortgage the points and fees paid by a consumer cannot exceed 3% of the total loan amount. Qualified mortgages that are "higher-priced" (e.g. subprime loans) garner a rebuttable presumption of compliance with the ability-to-repay rules, while qualified mortgages that are not "higher-priced" (e.g. prime loans) are given a safe harbor of compliance. The Company is predominantly an originator of compliant qualified mortgages.
Cybersecurity
In March 2015, federal regulators issued two related statements regarding cybersecurity. One statement indicates that financial institutions should design multiple layers of security controls to establish lines of defense and to ensure that their risk management processes also address the risk posed by compromised customer credentials, including security measures to reliably authenticate customers accessing internet-based services of the financial institution. The other statement indicates that a financial institution’s management is expected to maintain sufficient business continuity planning processes to ensure the rapid recovery, resumption and maintenance of the institution’s operations after a cyber-attack involving destructive malware. A financial institution is also expected to develop appropriate processes to enable recovery of data and business operations and address rebuilding network capabilities and restoring data if the institution or its critical service providers fall victim to this type of cyber-attack. If the Company fails to observe the regulatory guidance, it could be subject to various regulatory sanctions, including financial penalties.
Future Legislation and Regulation
Congress may enact legislation from time to time that affects the regulation of the financial services industry, and state legislatures may enact legislation from time to time affecting the regulation of financial institutions chartered by or operating in those states. Federal and state regulatory agencies also periodically propose and adopt changes to their regulations or change the manner in which existing regulations are applied. The substance or impact of pending or future legislation or regulation, or the application thereof, cannot be predicted, although enactment of the proposed legislation could impact the regulatory structure under which the Company and the Bank operate and may significantly increase costs, impede the efficiency of internal business processes, require an increase in regulatory capital, require modifications to business strategy, and limit the ability to pursue business opportunities in an efficient manner. A change in statutes, regulations or regulatory policies applicable to the Company or the Bank could have a material adverse effect on the business, financial condition and results of operations of the Company and the Bank.
Effect of Governmental Monetary Policies
The Company's operations are affected not only by general economic conditions, but also by the policies of various regulatory authorities. In particular, the FRB regulates money and credit conditions and interest rates to influence general economic conditions. These policies have a significant impact on overall growth and distribution of loans, investments and deposits; they affect interest rates charged on loans or paid for time and savings deposits. FRB monetary policies have had a significant effect on the operating results of commercial banks, including the Company, in the past and are expected to do so in the future. As a result, it is difficult for the Company to predict the potential effects of possible changes in monetary policies upon its future operating results.
Tax Reform
On December 22, 2017, the President of the United States signed into law the Tax Cut and Jobs Act of 2017 (the "Tax Reform Act"). The legislation made key changes to the U.S. tax law, including the reduction of the U.S. federal corporate tax rate from 35% to 21%, effective January 1, 2018. As a result of the reduction in the U.S. corporate income tax rate from 35% to 21% under the Tax Reform Act, the Company revalued its ending net deferred tax assets at December 31, 2017 and recognized
13
a provisional $2.7 million tax expense in the Company’s consolidated statement of income for the year ended December 31, 2017.
Employees
At December 31, 2019, the Company employed 355 full-time equivalent persons. In the opinion of the management of the Company, the relationship with employees of the Company and the Bank is good.
Internet Access to Company Documents
The Company provides access to its Securities and Exchange Commission (the "SEC") filings through a link on the Investor Relations page of the Company's website at www.amnb.com. Reports available at no cost include the annual report on Form 10-K, quarterly reports on Form 10-Q, current reports on Form 8-K, and all amendments to those reports as soon as reasonably practicable after the reports are filed electronically with the SEC. The information on the Company's website is not incorporated into this Annual Report on Form 10-K or any other filing the Company makes with the SEC. The SEC maintains an Internet site that contains reports, proxy and information statements, and other information regarding issuers that file electronically with the SEC at www.sec.gov.
Executive Officers of the Company
The following table lists, as of December 31, 2019, the executive officers of the Company, their ages, and their positions:
Name | Age | Position | ||
Jeffrey V. Haley | 59 | President and Chief Executive Officer of the Company and the Bank since January 2013. President of the Company and Chief Executive Officer of the Bank since January 2012. Executive Vice President of the Company from June 2010 to December 2011. Senior Vice President of the Company from July 2008 to May 2010. President of the Bank since June 2010. Executive Vice President of the Bank, as well as President of Trust and Financial Services from July 2008 to May 2010. Executive Vice President and Chief Operating Officer of the Bank from November 2005 to June 2007. | ||
Jeffrey W. Farrar | 59 | Executive Vice President, Chief Financial Officer, Treasurer and Secretary of the Company since October 2019. Executive Vice President and Chief Operating Officer for the Bank since August 2019. Senior Vice President/Finance and Chief Financial Officer of Old Point Financial Corporation from June 2017 to August 2019. Director of Wealth Management, Mortgage and Insurance for Union Bankshares Corporation (now Atlantic Union Bankshares Corporation) from January 2014 to June 2017. Chief Financial Officer of StellarOne Corporation and its predecessor companies from January 1996 to June 2017. | ||
H. Gregg Strader | 61 | Executive Vice President and Chief Banking Officer of the Company since January 2015. Executive Vice President and Chief Banking Officer of the Bank since January 2014. Executive Vice President of the Bank from June 2013 until December 2013. Executive Vice President and Chief Credit Officer of IBERIABANK Corporation from 2009 to June 2013. | ||
Edward C. Martin | 46 | Executive Vice President and Chief Credit Officer of the Company since December 2019. Executive Vice President and Chief Credit Officer of the Bank since March 2017. Senior Credit Officer of the Bank from September 2016 until March 2017. Regional Credit Officer of Bank of North Carolina from July 2015 to September 2016. Chief Credit Officer of Valley Bank from June 2007 to June 2015. | ||
John H. Settle, Jr. | 61 | Executive Vice President and President of Trust and Investment Services since October 2016. Senior Vice President and Senior Fiduciary Advisory Specialist with Wells Fargo Private Bank from March 2012 to October 2016. Prior thereto, Managing Director with SunTrust Private Wealth Management. | ||
ITEM 1A – RISK FACTORS
Risks Related to the Company's Business
The Company's business is subject to interest rate risk, and variations in interest rates and inadequate management of interest rate risk may negatively affect financial performance.
Changes in the interest rate environment may reduce the Company's profits. It is expected that the Company will continue to realize income from the spread between the interest earned on loans, securities, and other interest earning assets, and interest paid on deposits, borrowings and other interest bearing liabilities. Net interest spreads are affected by the difference between
14
the maturities and repricing characteristics of interest earning assets and interest bearing liabilities. In addition, loan volume and yields are affected by market interest rates on loans, and the current interest rate environment encourages extreme competition for new loan originations from qualified borrowers. Management cannot ensure that it can minimize the Company's interest rate risk.
If the interest rates paid on deposits and other borrowings increase at a faster rate than the interest rates received on loans and other investments, the Company’s net interest income, and therefore earnings, could be adversely affected. Earnings could also be adversely affected if the interest rates received on loans and other investments fall more quickly than the interest rates paid on deposits and other borrowings. Any substantial, unexpected, or prolonged change in market interest rates could have a material adverse effect on the Company’s financial condition and results of operations.
The Company faces strong competition from financial services companies and other companies that offer banking and other financial services, which could negatively affect the Company's business.
The Company encounters substantial competition from other financial institutions in its market area. Ultimately, the Company may not be able to compete successfully against current and future competitors. Many competitors offer the same banking services that the Company offers. These competitors include national, regional, and community banks. The Company also faces competition from many other types of financial institutions, including finance companies, mutual and money market fund providers, financial technology ("fintech") companies, brokerage firms, insurance companies, credit unions, financial subsidiaries of certain industrial corporations, and mortgage companies. In particular, competitors include several major financial companies whose greater resources may afford them a marketplace advantage by enabling them to maintain numerous banking locations and ATMs and conduct extensive promotional and advertising campaigns. Increased competition may result in reduced business for the Company.
Additionally, banks and other financial institutions with larger capitalization and financial intermediaries not subject to bank regulatory restrictions have larger lending limits and are thereby able to serve the credit needs of larger customers. These institutions also may have differing pricing and underwriting standards, which may adversely affect the Company through the loss of business or causing a misalignment in the Company’s risk-return relationship. Areas of competition include interest rates for loans and deposits, efforts to obtain loans and deposits, and range and quality of products and services provided, including new technology-driven products and services. Technological innovation continues to contribute to greater competition in domestic financial services markets as technological advances enable more companies to provide financial services. If the Company is unable to attract and retain banking customers, it may be unable to continue to grow loan and deposit portfolios and its results of operations and financial condition may be adversely affected.
Changes in economic conditions could materially and negatively affect the Company's business.
The Company's business is directly impacted by economic, political, and market conditions, broad trends in industry and finance, legislative and regulatory changes, changes in government monetary and fiscal policies, and inflation, all of which are beyond the Company's control. A deterioration in economic conditions, whether caused by global, national or local events, especially within the Company's market area, could result in potentially negative material consequences such as the following, among others: loan delinquencies increasing; problem assets and foreclosures increasing; demand for products and services decreasing; low cost or noninterest bearing deposits decreasing; and collateral for loans, especially real estate, declining in value, in turn reducing customers' borrowing power, and reducing the value of assets and collateral associated with existing loans. Each of these consequences may have a material adverse effect on the Company's financial condition and results of operations.
Trust division income is a major source of non-interest income for the Company. Trust and brokerage fee revenue is largely dependent on the fair market value of assets under management and on trading volumes in the brokerage business. General economic conditions and their subsequent effect on the securities markets tend to act in correlation. When general economic conditions deteriorate, securities markets generally decline in value, and the Company's trust and brokerage fee revenue is negatively impacted as asset values and trading volumes decrease.
The Company's credit standards and its on-going credit assessment processes might not protect it from significant credit losses.
The Company takes credit risk by virtue of making loans and extending loan commitments and letters of credit. The Company manages credit risk through a program of underwriting standards, the review of certain credit decisions and an on-going process of assessment of the quality of the credit already extended. The Company's exposure to credit risk is managed through the use of consistent underwriting standards that emphasize local lending while avoiding highly leveraged transactions as well as excessive industry and other concentrations. The Company's credit administration function employs risk management techniques to help ensure that problem loans are promptly identified. While these procedures are designed to
15
provide the Company with the information needed to implement policy adjustments where necessary and to take appropriate corrective actions, and have proven to be reasonably effective to date, there can be no assurance that such measures will be effective in avoiding future undue credit risk.
The Company's focus on lending to small to mid-sized community-based businesses may increase its credit risk.
Most of the Company's commercial business and commercial real estate loans are made to small business or middle market customers. These businesses generally have fewer financial resources in terms of capital or borrowing capacity than larger entities and have a heightened vulnerability to economic conditions. Additionally, these loans may increase concentration risk as to industry or collateral securing the loans. If general economic conditions in the market areas in which the Company operates negatively impact this important customer sector, the Company's results of operations and financial condition may be adversely affected. Moreover, a portion of these loans have been made by the Company in recent years and the borrowers may not have experienced a complete business or economic cycle. The deterioration of the borrowers' businesses may hinder their ability to repay their loans with the Company, which could have a material adverse effect on the Company's financial condition and results of operations.
The Company depends on the accuracy and completeness of information about clients and counterparties, and its financial condition could be adversely affected if it relies on misleading information.
In deciding whether to extend credit or to enter into other transactions with clients and counterparties, the Company may rely on information furnished to it by or on behalf of clients and counterparties, including financial statements and other financial information, which the Company does not independently verify. The Company also may rely on representations of clients and counterparties as to the accuracy and completeness of that information and, with respect to financial statements, on reports of independent auditors. For example, in deciding whether to extend credit to clients, the Company may assume that a customer's audited financial statements conform with accounting principles generally accepted in the United States ("GAAP") and present fairly, in all material respects, the financial condition, results of operations and cash flows of the customer. The Company's financial condition and results of operations could be negatively impacted to the extent it relies on financial statements that do not comply with GAAP or are materially misleading.
The allowance for loan losses may not be adequate to cover actual losses.
In accordance with GAAP, an allowance for loan losses is maintained by the Company to provide for loan losses. The allowance for loan losses may not be adequate to cover actual credit losses, and future provisions for credit losses could materially and adversely affect operating results. The allowance for loan losses is based on prior experience, as well as an evaluation of the risks in the current portfolio. The amount of future losses is susceptible to changes in economic, operating, and other outside forces and conditions, including changes in interest rates, all of which are beyond the Company's control; and these losses may exceed current estimates. Federal bank regulatory agencies, as a part of their examination process, review the Company's loans and allowance for loan losses. While management believes that the allowance for loan losses is adequate to cover current losses, it cannot make assurances that it will not further increase the allowance for loan losses or that regulators will not require it to increase this allowance. Either of these occurrences could adversely affect earnings.
In addition, the adoption of Accounting Standards Update (“ASU”) 2016-13, as amended, could result in an increase in the allowance for loan losses as a result of changing from an “incurred loss” model, which encompasses allowances for current known and inherent losses within the portfolio, to an “expected loss” model, which encompasses allowances for losses expected to be incurred over the life of the portfolio. As a smaller reporting company, the Company has elected to defer adoption of ASU 2016-13 until January 2023. Refer to Note 1 of the Consolidated Financial Statements contained in Item 8 of this Form 10-K for a discussion of recent accounting pronouncements.
Nonperforming assets take significant time to resolve and adversely affect the Company's results of operations and financial condition.
The Company's nonperforming assets adversely affect its net income in various ways. The Company does not record interest income on nonaccrual loans, which adversely affects its income and increases credit administration costs. When the Company receives collateral through foreclosures and similar proceedings, it is required to mark the related asset to the then fair market value of the collateral less estimated selling costs, which may, and often does, result in a loss. An increase in the level of nonperforming assets also increases the Company's risk profile and may impact the capital levels regulators believe are appropriate in light of such risks. The Company utilizes various techniques such as workouts, restructurings and loan sales to manage problem assets. Increases in or negative adjustments in the value of these problem assets, the underlying collateral, or in the borrowers' performance or financial condition, could adversely affect the Company's business, results of operations and financial condition. In addition, the resolution of nonperforming assets requires significant commitments of time from
16
management and staff, which can be detrimental to the performance of their other responsibilities, including generation of new loans. There can be no assurance that the Company will avoid increases in nonperforming loans in the future.
A downturn in the local real estate market could materially and negatively affect the Company's business.
The Company offers a variety of secured loans, including commercial lines of credit, commercial term loans, real estate, construction, home equity lines of credit, consumer and other loans. Many of these loans are secured by real estate (both residential and commercial) located in the Company's market area. A downturn in the real estate market in the areas in which the Company conducts its operations could negatively affect the Company's business because significant portions of its loans are secured by real estate. At December 31, 2019, the Company had approximately $1.8 billion in loans, of which approximately $1.5 billion (80.9%) were secured by real estate. The ability to recover on defaulted loans by selling the real estate collateral could then be diminished and the Company would be more likely to suffer losses.
Substantially all of the Company's real property collateral is located in its market area. If there is a decline in real estate values, especially in the Company's market area, the collateral for loans would deteriorate and provide significantly less security.
The Company relies upon independent appraisals to determine the value of the real estate which secures a significant portion of its loans, and the values indicated by such appraisals may not be realizable if the Company is forced to foreclose upon such loans.
A significant portion of the Company's loan portfolio consists of loans secured by real estate. The Company relies upon independent appraisers to estimate the value of such real estate. Appraisals are only estimates of value and the independent appraisers may make mistakes of fact or judgment which adversely affect the reliability of their appraisals. In addition, events occurring after the initial appraisal may cause the value of the real estate to increase or decrease. As a result of any of these factors, the real estate securing some of the Company's loans may be more or less valuable than anticipated at the time the loans were made. If a default occurs on a loan secured by real estate that is less valuable than originally estimated, the Company may not be able to recover the outstanding balance of the loan and will suffer a loss.
The Company is dependent on key personnel and the loss of one or more of those key personnel may materially and adversely affect the Company's operations and prospects.
The Company is a relationship-driven organization. A key aspect of the Company’s business strategy is for its senior officers to have primary contact with current and potential customers. The Company’s growth and development are in large part a result of these personalized relationships with the customer base. The success of the Company also often depends on its ability to hire and retain qualified banking officers.
The Company’s senior officers have considerable experience in the banking industry and related financial services and are extremely valuable and would be difficult to replace. The loss of the services of these officers could have a material adverse effect upon future prospects. Although the Company has entered into employment contracts with certain of its senior executive officers, and purchased key man life insurance policies to mitigate the risk of an unforeseen departure or death of certain of the senior executive officers, it cannot offer any assurance that they and other key employees will remain employed by the Company. The unexpected loss of services of one or more of these key employees could have a material adverse effect on operations and possibly result in reduced revenues.
The inability of the Company to successfully manage its growth or implement its growth strategy may adversely affect the Company's results of operations and financial condition.
The Company may not be able to successfully implement its growth strategy if it is unable to identify attractive markets, locations or opportunities to expand in the future. In addition, the ability to manage growth successfully depends on whether the Company can maintain adequate capital levels, cost controls and asset quality, and successfully integrate any businesses acquired into the Company.
As the Company continues to implement its growth strategy by opening new branches or acquiring branches or banks, it expects to incur increased personnel, occupancy and other operating expenses. In the case of new branches, the Company must absorb those higher expenses while it begins to generate new deposits; there is also further time lag involved in redeploying new deposits into attractively priced loans and other higher yielding earning assets. The Company's plans to expand could depress earnings in the short run, even if it efficiently executes a growth strategy leading to long-term financial benefits.
17
Difficulties in combining the operations of acquired entities with the Company's own operations may prevent the Company from achieving the expected benefits from acquisitions.
The Company may not be able to achieve fully the strategic objectives and operating efficiencies expected in an acquisition. Inherent uncertainties exist in integrating the operations of an acquired entity. In addition, the markets and industries in which the Company and its potential acquisition targets operate are highly competitive. The Company may lose customers or the customers of acquired entities as a result of an acquisition; the Company may lose key personnel, either from the acquired entity or from itself; and the Company may not be able to control the incremental increase in noninterest expense arising from an acquisition in a manner that improves its overall operating efficiencies. These factors could contribute to the Company not achieving the expected benefits from its acquisitions within desired time frames, if at all. Future business acquisitions could be material to the Company and it may issue additional shares of common stock to pay for those acquisitions, which would dilute current shareholders' ownership interests. Acquisitions also could require the Company to use substantial cash or other liquid assets or to incur debt; the Company could therefore become more susceptible to economic downturns and competitive pressures.
The Company is subject to extensive regulation which could adversely affect its business.
The Company's operations as a publicly traded corporation, a bank holding company, and a parent company to an insured depository institution are subject to extensive regulation by federal, state, and local governmental authorities and are subject to various laws and judicial and administrative decisions imposing requirements and restrictions on part or all of the Company's operations. Because the Company's business is highly regulated, the laws, rules, and regulations applicable to it are subject to frequent and sometimes extensive change. Such changes could include higher capital requirements, increased insurance premiums, increased compliance costs, reductions of non-interest income and limitations on services that can be provided. Actions by regulatory agencies or significant litigation against the Company could cause it to devote significant time and resources to defend itself and may lead to liability or penalties that materially affect the Company and its shareholders. Any future changes in the laws, rules or regulations applicable to the Company may negatively affect the Company's business and results of operations.
Regulatory capital standards may have an adverse effect on the Company's profitability, lending, and ability to pay dividends on the Company's securities.
The Company is subject to capital adequacy guidelines and other regulatory requirements specifying minimum amounts and types of capital that the Company and the Bank must maintain. From time to time, regulators implement changes to these regulatory capital adequacy guidelines. If the Company fails to meet these minimum capital guidelines and/or other regulatory requirements, its financial condition would be materially and adversely affected. The Basel III Capital Rules require bank holding companies and their subsidiaries to maintain significantly more capital as a result of higher required capital levels and more demanding regulatory capital risk weightings and calculations. While the Company is exempt from these capital requirements under the Federal Reserve’s SBHC Policy Statement, the Bank is not exempt and must comply. The Bank must also comply with the capital requirements set forth in the “prompt corrective action” regulations pursuant to Section 38 of the FDIA. Satisfying capital requirements may require the Company to limit its banking operations, retain net income or reduce dividends to improve regulatory capital levels, which could negatively affect its business, financial condition and results of operations.
Regulations issued by the CFPB could adversely impact earnings due to, among other things, increased compliance costs or costs due to noncompliance.
The CFPB has broad rulemaking authority to administer and carry out the provisions of the Dodd-Frank Act with respect to financial institutions that offer covered financial products and services to consumers. The CFPB has also been directed to write rules identifying practices or acts that are unfair, deceptive or abusive in connection with any transaction with a consumer for a consumer financial product or service, or the offering of a consumer financial product or service. For example, the CFPB has issued a final rule requiring mortgage lenders to make a reasonable and good faith determination based on verified and documented information that a consumer applying for a mortgage loan has a reasonable ability to repay the loan according to its terms, or to originate “qualified mortgages” that meet specific requirements with respect to terms, pricing and fees. The rule also contains additional disclosure requirements at mortgage loan origination and in monthly statements. The requirements under the CFPB’s regulations and policies could limit the Company’s ability to make certain types of loans or loans to certain borrowers, or could make it more expensive and/or time consuming to make these loans, which could adversely impact the Company’s profitability.
18
Changes in accounting standards could impact reported earnings.
From time to time, with increasing frequency, there are changes in the financial accounting and reporting standards that govern the preparation of the Company's financial statements. These changes can materially impact how the Company records and reports its financial condition and results of operations. In some instances, the Company could be required to apply a new or revised standard retroactively, resulting in the restatement of prior period financial statements. Refer to Note 1 of the Consolidated Financial Statements contained in Item 8 of this Form 10-K for a discussion of recent accounting pronouncements.
Failure to maintain effective systems of internal and disclosure control could have a material adverse effect on the Company's results of operation and financial condition.
Effective internal and disclosure controls are necessary for the Company to provide reliable financial reports and effectively prevent fraud and to operate successfully as a public company. If the Company cannot provide reliable financial reports or prevent fraud, its reputation and operating results would be harmed. As part of the Company's ongoing monitoring of internal control, it may discover material weaknesses or significant deficiencies in its internal control that require remediation. A "material weakness" is a deficiency, or a combination of deficiencies, in internal control over financial reporting, such that there is a reasonable possibility that a material misstatement of a company's annual or interim financial statements will not be prevented or detected on a timely basis.
The Company has in the past discovered, and may in the future discover, areas of its internal controls that need improvement. Even so, the Company is continuing to work to improve its internal controls. The Company cannot be certain that these measures will ensure that it implements and maintains adequate controls over its financial processes and reporting in the future. Any failure to maintain effective controls or to timely effect any necessary improvement of the Company's internal and disclosure controls could, among other things, result in losses from fraud or error, harm the Company's reputation or cause investors to lose confidence in the Company's reported financial information, all of which could have a material adverse effect on the Company's results of operation and financial condition.
The carrying value of goodwill may be adversely impacted.
When the Company completes an acquisition, generally goodwill is recorded on the date of acquisition as an asset. Current accounting guidance requires for goodwill to be tested for impairment, which the Company performs an impairment analysis at least annually, rather than amortizing it over a period of time. A significant adverse change in expected future cash flows or sustained adverse change in the Company's common stock could require the asset to become impaired. If impaired, the Company would incur a non-cash charge to earnings that would have a significant impact on the results of operations. The carrying value of goodwill was approximately $84.0 million at December 31, 2019.
The Company may need to raise additional capital in the future to continue to grow, but may be unable to obtain additional capital on favorable terms or at all.
Federal and state banking regulators and safe and sound banking practices require the Company to maintain adequate levels of capital to support its operations. The Company's business strategy calls for it to continue to grow in its existing banking markets (internally and through additional offices) and to expand into new markets as appropriate opportunities arise. Continued growth in the Company's earning assets, which may result from internal expansion and new branch offices, at rates in excess of the rate at which its capital is increased through retained earnings, will reduce the Company's capital ratios. If the Company's capital ratios fell below "well capitalized" levels, the FDIC deposit insurance assessment rate would increase until capital was restored and maintained at a "well capitalized" level. A higher assessment rate would cause an increase in the assessments the Company pays for federal deposit insurance, which would have an adverse effect on the Company's operating results.
Management of the Company believes that its current and projected capital position is sufficient to maintain capital ratios significantly in excess of regulatory requirements for the next several years and allow the Company flexibility in the timing of any possible future efforts to raise additional capital. However, if, in the future, the Company needs to increase its capital to fund additional growth or satisfy regulatory requirements, its ability to raise that additional capital will depend on conditions at that time in the capital markets, economic conditions, the Company's financial performance and condition, and other factors, many of which are outside its control. There is no assurance that the Company will be able to raise additional capital on terms favorable to it or at all. Any future inability to raise additional capital on terms acceptable to the Company may have a material adverse effect on its ability to expand operations, and on its financial condition, results of operations and future prospects.
The Bank may be required to transition from the use of the London Interbank Offered Rate ("LIBOR") index in the future.
19
In 2017, the United Kingdom’s Financial Conduct Authority announced that after 2021 it would no longer compel banks to submit the rates required to calculate LIBOR. As a result, the continuation of LIBOR on the current basis cannot and will not be guaranteed after 2021. At this time, it is impossible to predict whether and to what extent banks will continue to provide submissions for the calculation of LIBOR. Similarly, it is impossible to predict whether LIBOR will continue to be viewed as an acceptable market benchmark, what rate or rates may become accepted alternatives to LIBOR, or what effects any such changes in views or alternatives may have on the markets for LIBOR-indexed financial instruments.
Regulators, industry groups, and others have, among other things, published recommended replacement language for LIBOR-linked financial instruments, identified recommended alternatives for certain LIBOR rates (e.g., the Secured Overnight Financing Rate), and proposed implementations of the recommended alternatives in floating rate instruments. There is not yet any consensus on what recommendations and proposals will be broadly accepted.
The Company has a significant number of loans, borrowings and other financial instruments with attributes that are either directly or indirectly dependent on LIBOR. The transition from LIBOR could create considerable costs and additional risk. Since proposed alternative rates are calculated differently, payments under contracts referencing new rates will differ from those referencing LIBOR. The transition will change the Company’s market risk profiles, requiring changes to risk and pricing models, valuation tools, product design and hedging strategies. Furthermore, failure to adequately manage this transition process with customers could adversely impact the Company’s reputation. Although the Company is currently unable to assess what the ultimate impact of the transition from LIBOR will be, failure to adequately manage the transition could have a material adverse effect on the Company’s business, financial condition and results of operations.
The Company relies on other companies to provide key components of the Company's business infrastructure.
Third parties provide key components of the Company's business operations such as data processing, recording and monitoring transactions, online banking interfaces and services, Internet connections and network access. While the Company has selected these third party vendors carefully, it does not control their actions. Any problem caused by these third parties, including those resulting from disruptions in communication services provided by a vendor, failure of a vendor to handle current or higher volumes, cybersecurity breaches, failure of a vendor to provide services for any reason or poor performance of services, could adversely affect the Company's ability to deliver products and services to its customers and otherwise conduct its business. Financial or operational difficulties of a third party vendor could also hurt the Company's operations if those difficulties interface with the vendor's ability to serve the Company. Replacing these third party vendors could also create significant delay and expense. Accordingly, use of such third parties creates an unavoidable inherent risk to the Company's business operations.
The Company's exposure to operational, technological and organizational risk may adversely affect the Company.
The Company is exposed to many types of operational risks, including reputation, legal, and compliance risk, the risk of fraud or theft by employees or outsiders, unauthorized transactions by employees or operational errors, clerical or record-keeping errors, and errors resulting from faulty or disabled computer or telecommunications systems.
Negative public opinion can result from the actual or alleged conduct in any number of activities, including lending practices, corporate governance, and acquisitions, and from actions taken by government regulators and community organizations in response to those activities. Negative public opinion can adversely affect the Company's ability to attract and retain customers and can expose it to litigation and regulatory action.
Certain errors may be repeated or compounded before they are discovered and successfully rectified. The Company's necessary dependence upon automated systems to record and process its transactions may further increase the risk that technical system flaws or employee tampering or manipulation of those systems will result in losses that are difficult to detect. The Company may also be subject to disruptions of its operating systems arising from events that are wholly or partially beyond its control (for example, computer viruses or electrical or telecommunications outages), which may give rise to disruption of service to customers and to financial loss or liability. The Company is further exposed to the risk that its external vendors may be unable to fulfill their contractual obligations (or will be subject to the same risk of fraud or operational errors by their respective employees as is the Company) and to the risk that the Company's (or its vendors') business continuity and data security systems prove to be inadequate.
The Company's operations may be adversely affected by cybersecurity risks.
The Company relies heavily on communications and information systems to conduct business. Any failure, interruption, or breach in security of these systems could result in failures or disruptions in the Company's internet banking, deposit, loan, and other systems. While the Company has policies and procedures designed to prevent or limit the effect of such failure, interruption, or security breach of the Company's information systems, there can be no assurance that they will not occur or, if
20
they do occur, that they will be adequately addressed. Further, to access the Company’s products and services, its customers may use computers and mobile devices that are beyond the Company’s security control systems. The occurrence of any failure, interruption or security breach of the Company's communications and information systems could damage the Company's reputation, result in a loss of customer business, subject the Company to additional regulatory scrutiny, or expose the Company to civil litigation and possible financial liability. Additionally, the Company outsources its data processing to a third party. If the Company's third party provider encounters difficulties or if the Company has difficulty in communicating with such third party, it will significantly affect the Company's ability to adequately process and account for customer transactions, which would significantly affect its business operations.
In the ordinary course of business, the Company collects and stores sensitive data, including proprietary business information and personally identifiable information of its customers and employees in systems and on networks. The secure processing, maintenance and use of this information is critical to operations and the Company's business strategy. The Company has invested in accepted technologies, and annually reviews processes and practices that are designed to protect its networks, computers and data from damage or unauthorized access. Despite these security measures, the Company's computer systems and infrastructure may be vulnerable to attacks by hackers or breached due to employee error, malfeasance or other disruptions. A breach of any kind could compromise systems and the information stored there could be accessed, damaged or disclosed. A breach in security could result in legal claims, regulatory penalties, disruption in operations, and damage to the Company's reputation, which could adversely affect the Company's business. Furthermore, as cyberattacks continue to evolve and increase, the Company may be required to expend significant additional resources to modify or enhance its protective measures, or to investigate and remediate any identified information security vulnerabilities.
Multiple major U.S. retailers, financial institutions, government agencies and departments have experienced data systems incursions reportedly resulting in the thefts of credit and debit card information, online account information, and other financial data of tens of millions of individuals and customers. Retailer incursions affect cards issued and deposit accounts maintained by many financial institutions, including the Bank. Although neither the Company's nor the Bank's systems are breached in government or retailer incursions, these events can cause the Bank to reissue a significant number of cards and take other costly steps to avoid significant theft loss to the Bank and its customers. In some cases, the Bank may be required to reimburse customers for the losses they incur. Other possible points of intrusion or disruption not within the Company's nor the Bank's control include internet service providers, electronic mail portal providers, social media portals, distant-server (so called "cloud") service providers, electronic data security providers, personal computers and mobile phones, telecommunications companies, and mobile phone manufacturers.
The Company’s risk-management framework may not be effective in mitigating risk and loss.
The Company maintains an enterprise risk management program that is designed to identify, quantify, monitor, report, and control the risks that it faces. These risks include, but are not limited to: strategic, interest-rate, credit, liquidity, operations, pricing, reputation, compliance, litigation and cybersecurity. While the Company assesses and improves this program on an ongoing basis, there can be no assurance that its approach and framework for risk management and related controls will effectively mitigate all risk and limit losses in its business. If conditions or circumstances arise that expose flaws or gaps in the Company’s risk-management program, or if its controls break down, the Company’s results of operations and financial condition may be adversely affected.
Current and proposed regulation addressing consumer privacy and data use and security could increase the Company's costs and impact its reputation.
The Company is subject to a number of laws concerning consumer privacy and data use and security, including information safeguard rules under the Gramm-Leach-Bliley Act. These rules require that financial institutions develop, implement and maintain a written, comprehensive information security program containing safeguards that are appropriate to the financial institution's size and complexity, the nature and scope of the financial institution's activities, and the sensitivity of any customer information at issue. The United States has experienced a heightened legislative and regulatory focus on privacy and data security, including requiring consumer notification in the event of a data breach. In addition, most states have enacted security breach legislation requiring varying levels of consumer notification in the event of certain types of security breaches. New regulations in these areas may increase the Company's compliance costs, which could negatively impact earnings. In addition, failure to comply with the privacy and data use and security laws and regulations to which the Company is subject, including by reason of inadvertent disclosure of confidential information, could result in fines, sanctions, penalties or other adverse consequences and loss of consumer confidence, which could materially adversely affect the Company's results of operations, overall business, and reputation.
21
Consumers may increasingly decide not to use the Bank to complete their financial transactions because of technological and other changes, which would have a material adverse impact on the Company's financial condition and operations.
Technology and other changes are allowing parties to complete financial transactions through alternative methods that historically have involved banks. In particular, the activity of fintech companies has grown significantly over recent years and is expected to continue to grow. Fintech companies have and may continue to offer bank or bank-like products and some fintech companies have applied for bank charters. In addition, other fintech companies have partnered with existing banks to allow them to offer deposit products to their customers. For example, consumers can now maintain funds that would have historically been held as bank deposits in brokerage accounts, mutual funds or general-purpose reloadable prepaid cards. Consumers can also complete transactions such as paying bills and/or transferring funds directly without the assistance of banks. The process of eliminating banks as intermediaries, known as "disintermediation," could result in the loss of fee income, as well as the loss of customer deposits and the related income generated from those deposits. The loss of these revenue streams and the lower cost of deposits as a source of funds could have a material adverse effect on the Company's financial condition and results of operations.
Negative perception of the Company through media may adversely affect the Company’s reputation and business.
The Company’s reputation is critical to the success of its business. The Company believes that its brand image has been well received by customers, reflecting the fact that the brand image, like the Company’s business, is based in part on trust and confidence. The Company’s reputation and brand image could be negatively affected by rapid and widespread distribution of publicity through social and traditional media channels. The Company’s reputation could also be affected by the Company’s association with clients affected negatively through social and traditional media distribution, or other third parties, or by circumstances outside of the Company’s control. Negative publicity, whether deserved or undeserved, could affect the Company’s ability to attract or retain customers, or cause the Company to incur additional liabilities or costs, or result in additional regulatory scrutiny.
The Company is subject to claims and litigation pertaining to fiduciary responsibility.
From time to time, customers make claims and take legal action pertaining to the performance of the Company's fiduciary responsibilities. Whether customer claims and legal action related to the performance of the Company's fiduciary responsibilities are founded or unfounded, if such claims and legal actions are not resolved in a manner favorable to the Company, they may result in significant financial liability and/or adversely affect the market perception of the Company and its products and services, as well as impact customer demand for those products and services. Any financial liability or reputation damage could have a material adverse effect on the Company's business, which, in turn, could have a material adverse effect on the Company's financial condition and results of operations.
Severe weather, natural disasters, acts of war or terrorism, and other external events could significantly impact the Company’s business.
Severe weather, natural disasters, acts of war or terrorism, and other adverse external events could have a significant impact on the Company’s ability to conduct business. In addition, such events could affect the stability of the Company’s deposit base, impair the ability of borrowers to repay outstanding loans, impair the value of collateral securing loans, cause significant property damage, result in loss of revenue, and/or cause the Company to incur additional expenses. The occurrence of any such event in the future could have a material adverse effect on the Company’s business, which, in turn, could have a material adverse effect on its financial condition and results of operations.
Risks Related to the Company's Common Stock
While the Company's common stock is currently traded on the Nasdaq Global Select Market, it has less liquidity than stocks for larger companies quoted on a national securities exchange.
The trading volume in the Company's common stock on the Nasdaq Global Select Market has been relatively low when compared with larger companies listed on the Nasdaq Global Select Market or other stock exchanges. There is no assurance that a more active and liquid trading market for the common stock will exist in the future. Consequently, shareholders may not be able to sell a substantial number of shares for the same price at which shareholders could sell a smaller number of shares. In addition, we cannot predict the effect, if any, that future sales of the Company's common stock in the market, or the availability of shares of common stock for sale in the market, will have on the market price of the common stock.
Economic and other conditions may cause volatility in the price of the Company’s common stock.
In the current economic environment, the prices of publicly traded stocks in the financial services sector have been volatile. However, even in a more stable economic environment the price of the Company’s common stock can be affected by
22
a variety of factors such as expected or actual results of operations, changes in analysts’ recommendations or projections, announcements of developments related to its businesses, operating and stock performance of other companies deemed to be peers, news or expectations based on the performance of others in the financial services industry, and expected impacts of a changing regulatory environment. These factors not only impact the price of the Company’s common stock but could also affect the liquidity of the stock given the Company’s size, geographical footprint, and industry. The price for shares of the Company’s common stock may fluctuate significantly in the future, and these fluctuations may be unrelated to the Company’s performance. General market price declines or market volatility in the future could adversely affect the price for shares of the Company’s common stock, and the current market price of such shares may not be indicative of future market prices.
Future issuances of the Company's common stock could adversely affect the market price of the common stock and could be dilutive.
The Company is not restricted from issuing additional shares of common stock, including any securities that are convertible into or exchangeable for, or that represent the right to receive, shares of common stock. Issuances of a substantial number of shares of common stock, or the expectation that such issuances might occur, including in connection with acquisitions by the Company, could materially adversely affect the market price of the shares of the common stock and could be dilutive to shareholders. Because the Company's decision to issue common stock in the future will depend on market conditions and other factors, it cannot predict or estimate the amount, timing or nature of possible future issuances of its common stock. Accordingly, the Company's shareholders bear the risk that future issuances will reduce the market price of the common stock and dilute their stock holdings in the Company.
The primary source of the Company's income from which it pays cash dividends is the receipt of dividends from its subsidiary bank.
The availability of dividends from the Company is limited by various statutes and regulations. It is possible, depending upon the financial condition of the Bank and other factors, that the OCC could assert that payment of dividends or other payments is an unsafe or unsound practice. In the event the Bank was unable to pay dividends to the Company, or be limited in the payment of such dividends, the Company would likely have to reduce or stop paying common stock dividends. The Company's reduction, limitation or failure to pay such dividends on its common stock could have a material adverse effect on the market price of the common stock.
The Company's governing documents and Virginia law contain anti-takeover provisions that could negatively impact its shareholders.
The Company's Articles of Incorporation and Bylaws and the Virginia Stock Corporation Act contain certain provisions designed to enhance the ability of the Company's Board of Directors to deal with attempts to acquire control of the Company. These provisions and the ability to set the voting rights, preferences and other terms of any series of preferred stock that may be issued, may be deemed to have an anti-takeover effect and may discourage takeovers (which certain shareholders may deem to be in their best interest). To the extent that such takeover attempts are discouraged, temporary fluctuations in the market price of the Company's common stock resulting from actual or rumored takeover attempts may be inhibited. These provisions also could discourage or make more difficult a merger, tender offer, or proxy contest, even though such transactions may be favorable to the interests of shareholders, and could potentially adversely affect the market price of the Company's common stock.
ITEM 2 – PROPERTIES
As of December 31, 2019, the Company maintained twenty-six banking offices. The Company's Virginia banking offices are located in the cities of Danville, Lynchburg, Martinsville, Roanoke, and Salem and in the counties of Campbell, Franklin, Halifax, Henry, Montgomery, Pittsylvania and Roanoke. In North Carolina, the Company's banking offices are located in the cities of Burlington, Graham, Greensboro, Mebane, Winston-Salem, and Yanceyville, which are within the counties of Alamance, Caswell, Forsyth, and Guilford. The Company also operates one loan production office.
The principal executive offices of the Company are located at 628 Main Street in the business district of Danville, Virginia. This building, owned by the Company, has three floors totaling approximately 27,000 square feet.
The Company owns a building located at 103 Tower Drive in Danville, Virginia. This three-story facility serves as an operations center.
The Company has an office at 445 Mount Cross Road in Danville, Virginia where it consolidated two banking offices in January 2009 and gained additional administrative space.
23
The Company leases certain space located at 202 S. Jefferson Street, Roanoke, Virginia as a result of the merger with HomeTown. This office serves as the Virginia banking headquarters and the center for its corporate credit function.
The Company leases an office at 703 Green Valley Road in Greensboro, North Carolina. This building serves as the head office for the Company's North Carolina banking headquarters.
The Company owns twenty other offices for a total of twenty-three owned buildings. There are no mortgages or liens against any of the properties owned by the Company. The Company operates thirty-eight ATMs on owned or leased facilities. The Company leases five other offices for a total of seven leased office locations and leases one storage warehouse.
ITEM 3 – LEGAL PROCEEDINGS
In the ordinary course of operations, the Company and the Bank are parties to various legal proceedings. Based upon information currently available, management believes that such legal proceedings, in the aggregate, will not have a material adverse effect on the business, financial condition, or results of operations of the Company.
ITEM 4 – MINE SAFETY DISCLOSURES
None.
24
PART II
ITEM 5 – MARKET FOR REGISTRANT'S COMMON EQUITY, RELATED STOCKHOLDER MATTERS AND ISSUER PURCHASES OF EQUITY SECURITIES
Market and Dividend Information
The Company's common stock is traded on the Nasdaq Global Select Market under the symbol "AMNB." At December 31, 2019, the Company had 3,882 shareholders of record.
The Company paid quarterly cash dividends of $0.25 per share for the first and second quarters and $0.27 per share for the third and fourth quarters of 2019. The Company’s future dividend policy is subject to the discretion of the Boards of Directors of the Company and the Bank and will depend upon a number of factors, including future earnings, financial condition, cash requirements and general business conditions. The Company and the Bank are also subject to certain restrictions imposed by the reserve and capital requirements of federal and state statutes and regulations. See "Part I, Item 1. Business - Supervision and Regulation - Dividends," for information on regulatory restrictions on dividends.
Stock Compensation Plans
Until its expiration date on February 18, 2018, the Company maintained the 2008 Stock Incentive Plan, which was designed to attract and retain qualified personnel in key positions, provide employees with an equity interest in the Company as an incentive to contribute to the success of the Company, and reward employees for outstanding performance and the attainment of targeted goals. The Company's 2018 Stock Incentive Plan was adopted by the Board of Directors of the Company on February 20, 2018 and approved by shareholders on May 15, 2018 at the Company's 2018 Annual Meeting of Shareholders. The plans and stock compensation in general are discussed in Note 16 of the Consolidated Financial Statements contained in Item 8 of this Form 10-K.
The following table summarizes information, as of December 31, 2019, relating to the Company's equity based compensation plans, pursuant to which grants of options to acquire shares of common stock have been and may be granted from time to time.
December 31, 2019 | |||||||||
Number of Shares to be Issued Upon Exercise of Outstanding Options | Weighted-Average Per Share Exercise Price of Outstanding Options | Number of Shares Remaining Available for Future Issuance Under Stock Compensation Plans | |||||||
Equity compensation plans approved by shareholders | 13,944 | $ | 16.63 | 622,553 | |||||
Equity compensation plans not approved by shareholders | — | — | — | ||||||
Total | 13,944 | $ | 16.63 | 622,553 | |||||
Stock Repurchase Program
On January 19, 2018 the Company filed a Form 8-K with the SEC to announce the approval by its Board of Directors of a stock repurchase program. The program authorized the repurchase of up to 300,000 shares of the Company's common stock over a two year period that ended on December 31, 2019.
25
Shares of the Company's common stock were repurchased during the three months ended December 31, 2019, as detailed below. Under the share repurchase program, the Company had the remaining authority to repurchase up to 214,132 shares of the Company's common stock had the program not expired on December 31, 2019.
Period Beginning on First Day of Month Ended | Total Number of Shares Purchased | Average Price Paid Per Share | Total Number of Shares Purchased as Part of Publicly Announced Plans or Programs | Maximum Number of Shares that May Yet Be Purchased Under Plans or Programs | |||||||||
October 31, 2019 | 4,242 | $ | 35.68 | 4,242 | 263,593 | ||||||||
November 30, 2019 | 35,580 | 37.45 | 35,580 | 228,013 | |||||||||
December 31, 2019 | 13,881 | 37.78 | 13,881 | 214,132 | |||||||||
Total | 53,703 | $ | 37.39 | 53,703 | |||||||||
In 2019, the Company repurchased 85,868 shares at an average cost of $36.64 per share, for a total cost of $3,146,000. The Company did not repurchase any shares in 2018.
On December 19, 2019, the Company filed a Form 8-K with the SEC to announce the approval by its Board of Directors of another stock repurchase program. The program authorizes the repurchase of up to 400,000 shares of the Company's common stock through December 31, 2020.
26
Comparative Stock Performance
The following graph compares the Company's cumulative total return to its shareholders with the returns of two indexes for the five-year period ended December 31, 2019. The cumulative total return was calculated taking into consideration changes in stock price, cash dividends, stock dividends, and stock splits since December 31, 2014. The indexes are the Nasdaq Composite Index and the SNL Bank $1 Billion - $5 Billion Index, which includes bank holding companies with assets of $1 billion to $5 billion and is published by SNL Financial, LC.
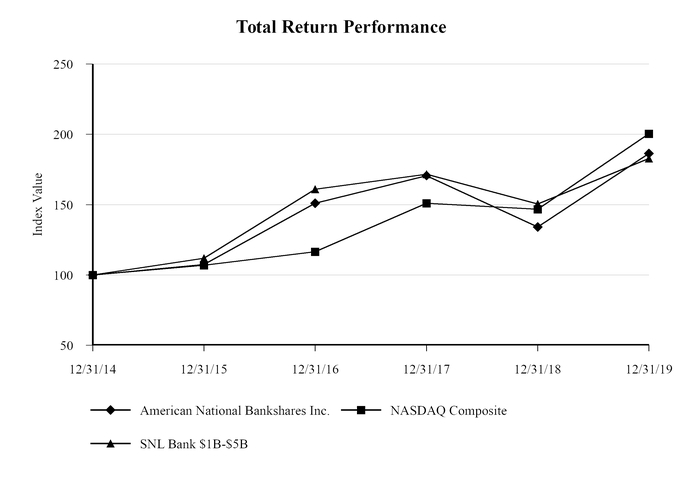
American National Bankshares Inc. |
Period Ending | |||||||||||||||||||||||
Index | 12/31/14 | 12/31/15 | 12/31/16 | 12/31/17 | 12/31/18 | 12/31/19 | |||||||||||||||||
American National Bankshares Inc. | $ | 100.00 | $ | 107.38 | $ | 151.05 | $ | 170.64 | $ | 134.09 | $ | 186.38 | |||||||||||
Nasdaq Composite | 100.00 | 106.96 | 116.45 | 150.96 | 146.67 | 200.49 | |||||||||||||||||
SNL Bank $1B-$5B | 100.00 | 111.94 | 161.04 | 171.69 | 150.42 | 182.85 | |||||||||||||||||
27
ITEM 6 - SELECTED FINANCIAL DATA
The following table sets forth selected financial data for the Company for the last five years:
(Amounts in thousands, except share and per share information and ratios) | |||||||||||||||||||
December 31, | |||||||||||||||||||
2019 | 2018 | 2017 | 2016 | 2015 | |||||||||||||||
Results of Operations: | |||||||||||||||||||
Interest income | $ | 92,855 | $ | 68,768 | $ | 63,038 | $ | 56,170 | $ | 55,169 | |||||||||
Interest expense | 15,728 | 9,674 | 7,291 | 6,316 | 5,904 | ||||||||||||||
Net interest income | 77,127 | 59,094 | 55,747 | 49,854 | 49,265 | ||||||||||||||
Provision for (recovery of) loan losses | 456 | (103 | ) | 1,016 | 250 | 950 | |||||||||||||
Noninterest income | 15,170 | 13,274 | 14,227 | 13,505 | 13,287 | ||||||||||||||
Noninterest expense | 66,074 | 44,246 | 42,883 | 39,801 | 40,543 | ||||||||||||||
Income before income tax provision | 25,767 | 28,225 | 26,075 | 23,308 | 21,059 | ||||||||||||||
Income tax provision | 4,861 | 5,646 | 10,826 | 7,007 | 6,020 | ||||||||||||||
Net income | $ | 20,906 | $ | 22,579 | $ | 15,249 | $ | 16,301 | $ | 15,039 | |||||||||
Financial Condition: | |||||||||||||||||||
Assets | $ | 2,478,550 | $ | 1,862,866 | $ | 1,816,078 | $ | 1,678,638 | $ | 1,547,599 | |||||||||
Loans, net of unearned income | 1,830,815 | 1,357,476 | 1,336,125 | 1,164,821 | 1,005,525 | ||||||||||||||
Securities | 387,825 | 339,730 | 327,447 | 352,726 | 345,661 | ||||||||||||||
Deposits | 2,060,547 | 1,566,227 | 1,534,726 | 1,370,640 | 1,262,660 | ||||||||||||||
Shareholders' equity | 320,258 | 222,542 | 208,717 | 201,380 | 197,835 | ||||||||||||||
Shareholders' equity, tangible (1) | 228,528 | 177,744 | 163,654 | 155,789 | 151,280 | ||||||||||||||
Per Share Information: | |||||||||||||||||||
Earnings per share, basic | $ | 1.99 | $ | 2.60 | $ | 1.76 | $ | 1.89 | $ | 1.73 | |||||||||
Earnings per share, diluted | 1.98 | 2.59 | 1.76 | 1.89 | 1.73 | ||||||||||||||
Cash dividends paid | 1.04 | 1.00 | 0.97 | 0.96 | 0.93 | ||||||||||||||
Book value | 28.93 | 25.52 | 24.13 | 23.37 | 22.95 | ||||||||||||||
Book value, tangible (1) | 20.64 | 20.38 | 18.92 | 18.08 | 17.55 | ||||||||||||||
Average common shares outstanding - basic | 10,531,572 | 8,698,014 | 8,641,717 | 8,611,507 | 8,680,502 | ||||||||||||||
Average common shares outstanding - diluted | 10,541,337 | 8,708,462 | 8,660,628 | 8,621,241 | 8,688,450 | ||||||||||||||
Selected Ratios: | |||||||||||||||||||
Return on average assets | 0.91 | % | 1.24 | % | 0.87 | % | 1.02 | % | 0.99 | % | |||||||||
Return on average equity (2) | 7.16 | % | 10.56 | % | 7.34 | % | 8.07 | % | 7.65 | % | |||||||||
Return on average tangible equity (1)(3) | 10.43 | % | 13.49 | % | 9.59 | % | 10.85 | % | 10.62 | % | |||||||||
Dividend payout ratio | 52.45 | % | 38.54 | % | 54.98 | % | 50.71 | % | 53.65 | % | |||||||||
Efficiency ratio (1)(4) | 57.25 | % | 59.20 | % | 60.14 | % | 59.97 | % | 61.93 | % | |||||||||
Net interest margin | 3.68 | % | 3.49 | % | 3.50 | % | 3.52 | % | 3.69 | % | |||||||||
Asset Quality Ratios: | |||||||||||||||||||
Allowance for loan losses to period end loans | 0.72 | % | 0.94 | % | 1.02 | % | 1.10 | % | 1.25 | % | |||||||||
Allowance for loan losses to period end non-performing loans | 570.59 | % | 1,101.98 | % | 531.37 | % | 360.39 | % | 242.09 | % | |||||||||
Non-performing assets to total assets | 0.15 | % | 0.11 | % | 0.21 | % | 0.29 | % | 0.48 | % | |||||||||
Net charge-offs to average loans | 0.01 | % | 0.05 | % | 0.02 | % | 0.00 | % | 0.08 | % | |||||||||
Capital Ratios: | |||||||||||||||||||
Total risk-based capital ratio | 14.04 | % | 15.35 | % | 14.39 | % | 14.81 | % | 16.34 | % | |||||||||
Common equity tier 1 capital ratio | 11.56 | % | 12.55 | % | 11.50 | % | 11.77 | % | 12.88 | % | |||||||||
Tier 1 capital ratio | 12.98 | % | 14.46 | % | 13.42 | % | 13.83 | % | 15.23 | % | |||||||||
Tier 1 leverage ratio | 10.75 | % | 11.62 | % | 10.95 | % | 11.67 | % | 12.05 | % | |||||||||
Tangible equity to tangible assets ratio (1)(5) | 9.57 | % | 9.78 | % | 9.24 | % | 9.54 | % | 10.08 | % | |||||||||
28
(1) | Non-GAAP financial measure. See the Non-GAAP Presentations section of Item 7, "Management's Discussion and Analysis of Financial Condition and Results of Operations" of this Form 10-K for reconciliation. |
(2) | Return on average common equity is calculated by dividing net income available to common shareholders by average common equity. |
(3) | Return on average tangible common equity is calculated by dividing net income available to common shareholders plus amortization of intangibles tax effected by average common equity less average intangibles. |
(4) | The efficiency ratio is calculated by dividing noninterest expense excluding (i) gains or losses on the sale of other real estate owned, (ii) core deposit intangible amortization, and (iii) merger related expenses by net interest income including tax equivalent income on nontaxable loans and securities and noninterest income excluding (x) gains or losses on securities and (y) gains or losses on sale of premises and equipment. |
(5) | Tangible equity to tangible assets ratio is calculated by dividing period-end common equity less period-end intangibles by period-end assets less period-end intangibles. |
ITEM 7 - MANAGEMENT'S DISCUSSION AND ANALYSIS OF FINANCIAL CONDITION AND RESULTS OF OPERATIONS
The purpose of this discussion is to focus on significant changes in the financial condition and results of operations of the Company during the past three years. The discussion and analysis are intended to supplement and highlight information contained in the accompanying Consolidated Financial Statements and the selected financial data presented elsewhere in this Annual Report on Form 10-K.
RECLASSIFICATION
In certain circumstances, reclassifications have been made to prior period information to conform to the 2019 presentation. There were no material reclassifications.
CRITICAL ACCOUNTING POLICIES
The accounting and reporting policies followed by the Company conform with GAAP and they conform to general practices within the banking industry. The Company's critical accounting policies, which are summarized below, relate to (1) the allowance for loan losses, (2) mergers and acquisitions, (3) acquired loans with specific credit-related deterioration, (4) goodwill and intangible assets, (5) deferred tax assets and liabilities, and (6) other-than-temporary impairment of securities. A summary of the Company's significant accounting policies is set forth in Note 1 to the Consolidated Financial Statements.
The financial information contained within the Company's financial statements is, to a significant extent, financial information that is based on measures of the financial effects of transactions and events that have already occurred. A variety of factors could affect the ultimate value that is obtained when earning income, recognizing an expense, recovering an asset, or relieving a liability. In addition, GAAP itself may change from one previously acceptable method to another method.
Allowance for Loan Losses
The purpose of the allowance for loan losses ("ALLL") is to provide for probable losses inherent in the loan portfolio. The allowance is increased by the provision for loan losses and by recoveries of previously charged-off loans. Loan charge-offs decrease the allowance.
The goal of the Company is to maintain an appropriate, systematic, and consistently applied process to determine the amounts of the ALLL and the provision for loan loss expense.
The Company uses certain practices to manage its credit risk. These practices include (1) appropriate lending limits for loan officers, (2) a loan approval process, (3) careful underwriting of loan requests, including analysis of borrowers, cash flows, collateral, and market risks, (4) regular monitoring of the portfolio, including diversification by type and geography, (5) review of loans by the Loan Review department, which operates independently of loan production (the Loan Review function consists of a co-sourced arrangement using both internal personnel and external vendors to provide the Company with a more robust review function of the loan portfolio), (6) regular meetings of the Credit Committee to discuss portfolio and policy changes and make decisions on large or unusual loan requests, and (7) regular meetings of the Asset Quality Committee which reviews the status of individual loans.
Risk grades are assigned as part of the loan origination process. From time to time, risk grades may be modified as warranted by the facts and circumstances surrounding the credit.
29
Calculation and analysis of the ALLL is prepared quarterly by the Finance Department. The Company's Credit Committee, Risk and Compliance Committee, Audit Committee, and the Board of Directors review the allowance for adequacy.
The Company's ALLL has two basic components: the formula allowance and the specific allowance. Each of these components is determined based upon estimates and judgments.
The formula allowance uses historical loss experience as an indicator of future losses, along with various qualitative factors, including levels and trends in delinquencies, nonaccrual loans, charge-offs and recoveries, trends in volume and terms of loans, effects of changes in underwriting standards, experience of lending staff, economic conditions, portfolio concentrations, regulatory, legal, competition, quality of loan review system, and value of underlying collateral. In the formula allowance for commercial and commercial real estate loans, the historical loss rate is combined with the qualitative factors, resulting in an adjusted loss factor for each risk-grade category of loans. The period-end balances for each loan risk-grade category are multiplied by the adjusted loss factor. Allowance calculations for residential real estate and consumer loans are calculated based on historical losses for each product category without regard to risk grade. This loss rate is combined with qualitative factors resulting in an adjusted loss factor for each product category.
The specific allowance uses various techniques to arrive at an estimate of loss for specifically identified impaired loans. These include:
• | The present value of expected future cash flows discounted at the loan's effective interest rate. The effective interest rate on a loan is the rate of return implicit in the loan (that is, the contractual interest rate adjusted for any net deferred loan fees or costs and any premium or discount existing at the origination or acquisition of the loan); |
• | The loan's observable market price; or |
• | The fair value of the collateral, net of estimated costs to dispose, if the loan is collateral dependent. |
The use of these computed values is inherently subjective and actual losses could be greater or less than the estimates.
No single statistic, formula, or measurement determines the adequacy of the allowance. Management makes subjective and complex judgments about matters that are inherently uncertain, and different amounts would be reported under different conditions or using different assumptions. For analytical purposes, management allocates a portion of the allowance to specific loan categories and specific loans. However, the entire allowance is used to absorb credit losses inherent in the loan portfolio, including identified and unidentified losses.
The relationships and ratios used in calculating the allowance, including the qualitative factors, may change from period to period as facts and circumstances evolve. Furthermore, management cannot provide assurance that in any particular period the Bank will not have sizable credit losses in relation to the amount reserved. Management may find it necessary to significantly adjust the allowance, considering current factors at the time.
Mergers and Acquisitions
Business combinations are accounted for under the Financial Accounting Standards Board ("FASB") Accounting Standards Codification ("ASC") 805, Business Combinations, using the acquisition method of accounting. The acquisition method of accounting requires an acquirer to recognize the assets acquired and the liabilities assumed at the acquisition date measured at their fair values as of that date. To determine the fair values, the Company will rely on third party valuations, such as appraisals, or internal valuations based on discounted cash flow analysis or other valuation techniques. Under the acquisition method of accounting, the Company will identify the acquirer and the closing date and apply applicable recognition principles and conditions.
Acquisition-related costs are costs the Company incurs to effect a business combination. Those costs include advisory, legal, accounting, valuation, and other professional or consulting fees. Some other examples of costs to the Company include systems conversions, integration planning, consultants, and advertising costs. The Company will account for acquisition-related costs as expenses in the periods in which the costs are incurred and the services are received, with one exception. The costs to issue debt or equity securities will be recognized in accordance with other applicable GAAP. These acquisition-related costs have been and will be included within the consolidated statements of income classified within the noninterest expense caption.
Acquired Loans with Specific Credit-Related Deterioration
Acquired loans with specific credit deterioration are accounted for by the Company in accordance with FASB ASC 310-30, Receivables - Loans and Debt Securities Acquired with Deteriorated Credit Quality. Certain acquired loans, those for which specific credit-related deterioration since origination is identified, are recorded at the amount paid, such that there is no carryover of the seller's allowance for loan losses. Income recognition on these loans is based on a reasonable expectation about the timing and amount of cash flows to be collected.
30
Goodwill and Intangible Assets
The Company follows ASC 350, Goodwill and Other Intangible Assets, which prescribes the accounting for goodwill and intangible assets subsequent to initial recognition. Goodwill resulting from business combinations prior to January 1, 2009 represents the excess of the purchase price over the fair value of the net assets of businesses acquired. Goodwill resulting from business combinations after January 1, 2009 is generally determined as the excess of the fair value of the consideration transferred, plus the fair value of any noncontrolling interests in the acquiree, over the fair value of the net assets acquired and liabilities assumed as of the acquisition date. Goodwill and intangible assets acquired in a purchase business combination and determined to have an indefinite useful life are not amortized, but tested for impairment at least annually or more frequently if events and circumstances exists that indicate that a goodwill impairment test should be performed. The Company has selected June 30 as the date to perform the annual impairment test. Intangible assets with definite useful lives are amortized over their estimated useful lives, which range from 8.25 to 10 years, to their estimated residual values. Goodwill is the only intangible asset with an indefinite life on the Company’s consolidated balance sheets. No indicators of impairment were identified during the years ended December 31, 2019, 2018, or 2017.
Deferred Tax Assets and Liabilities
The realization of deferred income tax assets is assessed and a valuation allowance is recorded if it is "more likely than not" that all or a portion of the deferred tax asset will not be realized. "More likely than not" is defined as greater than a 50% chance. Management considers all available evidence, both positive and negative, to determine whether, based on the weight of that evidence, a valuation allowance is needed.
Other-than-temporary Impairment of Securities
Impairment of securities occurs when the fair value of a security is less than its amortized cost. For debt securities, impairment is considered other-than-temporary and recognized in its entirety in net income if either (1) the Company intends to sell the security or (2) it is more-likely-than-not that the Company will be required to sell the security before recovery of its amortized cost basis. If, however, the Company does not intend to sell the security and it is not more-likely-than-not that it will be required to sell the security before recovery, the Company must determine what portion of the impairment is attributable to a credit loss, which occurs when the amortized cost basis of the security exceeds the present value of the cash flows expected to be collected from the security. If there is no credit loss, there is no other-than-temporary impairment. If there is a credit loss, other-than-temporary impairment exists, and the credit loss must be recognized in net income and the remaining portion of impairment must be recognized in other comprehensive income.
COMPLETED ACQUISITION
On April 1, 2019, the Company completed its acquisition of HomeTown. The combination deepened the Company's footprint in the Roanoke, Virginia metropolitan area and created a presence in the New River Valley with an office in Christiansburg, Virginia. After the merger and with two office consolidations, the Company has eight offices in the combined Roanoke/New River Valley market area. As a result of the merger, the holders of shares of HomeTown common stock received 0.4150 shares of the Company's common stock for each share of HomeTown common stock held immediately prior to the effective date of the merger. Following completion of the merger, HomeTown's subsidiary bank, HomeTown Bank, was merged with and into the Bank.
NON-GAAP PRESENTATIONS
Non-GAAP presentations are provided because the Company believes these may be valuable to investors. These include (1) the calculation of the efficiency ratio, (2) the analysis of net interest income presented on a taxable equivalent basis to facilitate performance comparisons among various taxable and tax-exempt assets, (3) return on average tangible equity, (4) tangible equity to tangible assets ratio, and (5) tangible book value.
The efficiency ratio is calculated by dividing noninterest expense excluding (1) gains or losses on the sale of other real estate owned ("OREO"), (2) core deposit intangible amortization and (3) merger related expense by net interest income including tax equivalent income on nontaxable loans and securities and noninterest income and excluding (x) gains or losses on securities and (y) gains or losses on sale of premises and equipment. The efficiency ratio for 2019, 2018, and 2017 was 57.25%, 59.20%, and 60.14%, respectively. The Company expects continued improvement in this ratio in 2020. This is a non-GAAP financial measure that the Company believes provides investors with important information regarding operational efficiency. Such information is not prepared in accordance with GAAP and should not be construed as such. Management believes, however, such financial information is meaningful to the reader in understanding operating performance but cautions that such information not be viewed as a substitute for GAAP. In addition, the Company’s non-GAAP financial measures may not be comparable to non-GAAP financial measures of other companies. The Company, in referring to its net income, is referring to
31
income under GAAP. The components of the efficiency ratio calculation are summarized in the following table (dollars in thousands):
Year Ended December 31, | |||||||||||
2019 | 2018 | 2017 | |||||||||
Efficiency Ratio | |||||||||||
Noninterest expense | $ | 66,074 | $ | 44,246 | $ | 42,883 | |||||
Add/subtract: gain/loss on sale OREO | 52 | (44 | ) | (164 | ) | ||||||
Subtract: core deposit intangible amortization | (1,398 | ) | (265 | ) | (528 | ) | |||||
Subtract: merger related expenses | (11,782 | ) | (872 | ) | — | ||||||
$ | 52,946 | $ | 43,065 | $ | 42,191 | ||||||
Net interest income | $ | 77,127 | $ | 59,094 | $ | 55,747 | |||||
Tax equivalent adjustment | 369 | 556 | 1,339 | ||||||||
Noninterest income | 15,170 | 13,274 | 14,227 | ||||||||
Subtract: gain on securities | (607 | ) | (123 | ) | (812 | ) | |||||
Add/subtract: loss/gain on sale of fixed assets | 427 | (60 | ) | (344 | ) | ||||||
$ | 92,486 | $ | 72,741 | $ | 70,157 | ||||||
Efficiency ratio | 57.25 | % | 59.20 | % | 60.14 | % | |||||
Net interest margin is calculated by dividing tax equivalent net interest income by total average earning assets. Because a portion of interest income earned by the Company is nontaxable, the tax equivalent net interest income is considered in the calculation of this ratio. Tax equivalent net interest income is calculated by adding the tax benefit realized from interest income that is nontaxable to total interest income then subtracting total interest expense. The tax rate utilized in calculating the tax benefit is 21% for 2019 and 2018 and 35% for 2017. The reconciliation of tax equivalent net interest income, which is not a measurement under GAAP, to net interest income, is reflected in the table below (in thousands):
Year Ended December 31, | |||||||||||
2019 | 2018 | 2017 | |||||||||
Reconciliation of Net Interest Income to Tax-Equivalent Net Interest Income | |||||||||||
Non-GAAP measures: | |||||||||||
Interest income - loans | $ | 82,869 | $ | 60,159 | $ | 55,581 | |||||
Interest income - investments and other | 10,355 | 9,165 | 8,796 | ||||||||
Interest expense - deposits | (13,143 | ) | (8,086 | ) | (5,794 | ) | |||||
Interest expense - customer repurchase agreements | (595 | ) | (164 | ) | (142 | ) | |||||
Interest expense - other short-term borrowings | (55 | ) | (22 | ) | (31 | ) | |||||
Interest expense - long-term borrowings | (1,935 | ) | (1,402 | ) | (1,324 | ) | |||||
Total net interest income | $ | 77,496 | $ | 59,650 | $ | 57,086 | |||||
Less non-GAAP measures: | |||||||||||
Tax benefit realized on non-taxable interest income - loans | $ | (185 | ) | $ | (192 | ) | $ | (305 | ) | ||
Tax benefit realized on non-taxable interest income - municipal securities | (184 | ) | (364 | ) | (1,034 | ) | |||||
GAAP measures | $ | 77,127 | $ | 59,094 | $ | 55,747 | |||||
Return on average tangible common equity is calculated by dividing net income available to common shareholders by average common equity.
Years Ended December 31, | ||||||
2019 | 2018 | |||||
Return on Average Tangible Equity | ||||||
Return on average equity (GAAP basis) | 7.16 | % | 10.56 | % | ||
Impact of excluding average goodwill and other intangibles | 3.27 | % | 2.93 | % | ||
Return on average tangible equity (non-GAAP) | 10.43 | % | 13.49 | % | ||
32
Tangible equity to tangible assets ratio is calculated by dividing period-end common equity less period-end intangibles by period-end assets less period-end intangibles.
As of December 31, | ||||||
2019 | 2018 | |||||
Tangible Equity to Tangible Assets | ||||||
Equity to assets ratio (GAAP basis) | 12.92 | % | 11.95 | % | ||
Impact of excluding goodwill and other intangibles | (3.35 | )% | (2.17 | )% | ||
Tangible equity to tangible assets ratio (non-GAAP) | 9.57 | % | 9.78 | % | ||
The Company presents book value per share (period-end shareholders' equity divided by period-end common shares outstanding) and tangible book value per share. In calculating tangible book value, the Company excludes goodwill and other intangible assets.
As of December 31, | ||||||||
2019 | 2018 | |||||||
Tangible Book Value Per Share | ||||||||
Book value per share (GAAP basis) | $ | 28.93 | $ | 25.52 | ||||
Impact of excluding goodwill and other intangibles | (8.29 | ) | (5.14 | ) | ||||
Tangible book value per share (non-GAAP) | $ | 20.64 | $ | 20.38 | ||||
RESULTS OF OPERATIONS
Net Income
Net income for 2019 was $20,906,000 compared to $22,579,000 for 2018, a decrease of $1,673,000 or 7.4%. Basic earnings per share were $1.99 for 2019 compared to $2.60 for 2018. Diluted earnings per share were $1.98 for 2019 compared to $2.59 for 2018. This net income produced for 2019 a return on average assets of 0.91%, a return on average equity of 7.16%, and a return on average tangible equity of 10.43%.
The decrease in earnings in 2019 was primarily related to the April 1, 2019 merger with HomeTown, as earnings were impacted adversely by $11,782,000 in one-time merger expenses. Partially offsetting this impact were increases in net interest income associated with higher loan yields and greater loan volume also associated with the HomeTown acquisition augmented by organic growth throughout the rest of the Company's franchise.
Net income for 2018 was $22,579,000 compared to $15,249,000 for 2017, an increase of $7,330,000 or 48.1%. Basic earnings per share were $2.60 for 2018 compared to $1.76 for 2017. Diluted earnings per share were $2.59 for 2018 compared to $1.76 for 2017. This net income produced for 2018 a return on average assets of 1.24%, a return on average equity of 10.56%, and a return on average tangible equity of 13.49%.
Earnings for 2018 as compared to 2017 were also positively impacted by increased net interest income, resulting mostly from higher yields on the loan portfolio and greater loan volume. Additionally, earnings in 2018 increased due to a significant reduction in the loan loss provision. The need for a loan loss provision was reduced by three factors: loan balances, continued strong asset quality metrics, and improvements in various qualitative factors used in computing the allowance for loan losses. Lastly, benefiting 2018 earnings was the substantial decrease in the corporate tax rate. The corporate tax rate reduction from 35% to 21%, enacted into law by the Tax Reform Act in late 2017, became effective in 2018.
Although the corporate tax rate reduction from 35% to 21% became effective in 2018, the enactment required companies to revalue their deferred tax assets at the new tax rate in 2017. Accordingly, in December 2017 the Company recognized a $2.7 million charge ($0.31 per share) to its deferred tax asset and a corresponding increase in income tax expense.
Net Interest Income
Net interest income is the difference between interest income on earning assets, primarily loans and securities, and interest expense on interest bearing liabilities, primarily deposits and borrowings. Fluctuations in interest rates as well as volume and mix changes in earning assets and interest bearing liabilities can materially impact net interest income. The 2011 acquisition of MidCarolina Financial Corporation ("MidCarolina"), the 2015 acquisition of MainStreet Bankshares, Inc. ("Mainstreet"), and the 2019 acquisition of HomeTown impacted net interest income positively for 2019, 2018, and 2017 through increased earning assets.
33
The following discussion of net interest income is presented on a taxable equivalent basis to facilitate performance comparisons among various taxable and tax-exempt assets, such as certain state and municipal securities. A tax rate of 21% was used in adjusting interest on tax-exempt assets to a fully taxable equivalent basis for 2019 and 2018, and a tax rate of 35% was used for 2017. Net interest income divided by average earning assets is referred to as the net interest margin. The net interest spread represents the difference between the average rate earned on earning assets and the average rate paid on interest bearing liabilities. All references in this section relate to average yields and rates and average asset and liability balances during the periods discussed.
Net interest income on a taxable equivalent basis increased $17,846,000, or 29.9%, in 2019 from 2018, following a $2,564,000, or 4.5%, increase in 2018 from 2017. The increase in net interest income in 2019 was primarily due to increased volumes of earning assets and higher loan yields related to the acquisition of HomeTown coupled with organic growth in the legacy bank.
Yields on loans were 4.86% in 2019 compared to 4.51% in 2018. Cost of funds was 1.08% in 2019 compared to 0.82% in 2018. Between 2019 and 2018, deposit rates for demand accounts increased to 0.12% from 0.02%, money market accounts increased to 1.18% from 0.89%, and time deposits increased to 1.58% from 1.20%. Management regularly reviews deposit pricing and attempts to keep costs as low as possible, while remaining competitive. The net interest margin was 3.68% for 2019, compared to 3.49% for 2018.
The Federal Open Market Committee ("FOMC") raised the target federal funds rate by 0.25% on each of March 15, June 14, and December 13, 2017, ending the year at 1.50%. In 2018, the FOMC raised the target federal funds rate by 0.25% on each of March 21, June 13, September 26, and December 19, ending the year at 2.50%. The FOMC reduced the target federal funds rate by 0.25% on each of July 31, September 18, and October 30, 2019, ending the year at 1.75%.
Net interest income on a taxable equivalent basis increased $2,564,000, or 4.5%, in 2018 from 2017, following a $5,386,000, or 10.4%, increase in 2017 from 2016. The increase in net interest income in 2018 was primarily due to increased volumes of earning assets related to organic growth and increasing market interest rates.
Yields on loans were 4.51% in 2018 compared to 4.39% in 2017. Cost of funds was 0.82% in 2018 compared to 0.64% in 2017. Between 2018 and 2017, deposit rates for demand accounts remained the same at 0.02%, money market accounts increased to 0.89% from 0.50%, and time deposits increased to 1.20% from 1.05%. The increase in money market rates was related mainly to high dollar volume commercial and municipal customer accounts. The net interest margin was 3.49% for 2018, compared to 3.50% for 2017.
The following presentation is an analysis of net interest income and related yields and rates, on a taxable equivalent basis, for the last three years. Nonaccrual loans are included in average balances. Interest income on nonaccrual loans, if recognized, is recorded on a cash basis or when the loan returns to accrual status.
34
Net Interest Income Analysis
(in thousands, except yields and rates)
Average Balance | Interest Income/Expense(1) | Average Yield/Rate | ||||||||||||||||||||||||||||||
2019 | 2018 | 2017 | 2019 | 2018 | 2017 | 2019 | 2018 | 2017 | ||||||||||||||||||||||||
Loans: | ||||||||||||||||||||||||||||||||
Commercial | $ | 306,065 | $ | 264,241 | $ | 229,239 | $ | 14,125 | $ | 10,579 | $ | 8,829 | 4.62 | % | 4.00 | % | 3.85 | % | ||||||||||||||
Real estate | 1,388,188 | 1,063,950 | 1,031,558 | 68,050 | 49,275 | 46,400 | 4.90 | 4.63 | 4.50 | |||||||||||||||||||||||
Consumer | 10,046 | 4,676 | 4,652 | 694 | 305 | 352 | 6.91 | 6.52 | 7.57 | |||||||||||||||||||||||
Total loans(2) | 1,704,299 | 1,332,867 | 1,265,449 | 82,869 | 60,159 | 55,581 | 4.86 | 4.51 | 4.39 | |||||||||||||||||||||||
Securities: | ||||||||||||||||||||||||||||||||
Federal agencies and GSEs | 132,916 | 121,923 | 97,670 | 3,191 | 2,708 | 1,849 | 2.40 | 2.22 | 1.89 | |||||||||||||||||||||||
Mortgage-backed and CMOs | 134,458 | 109,048 | 82,042 | 3,350 | 2,467 | 1,725 | 2.49 | 2.26 | 2.10 | |||||||||||||||||||||||
State and municipal | 58,293 | 85,061 | 105,869 | 1,650 | 2,399 | 3,781 | 2.83 | 2.82 | 3.57 | |||||||||||||||||||||||
Other securities | 16,552 | 14,950 | 15,796 | 903 | 718 | 707 | 5.46 | 4.80 | 4.48 | |||||||||||||||||||||||
Total securities | 342,219 | 330,982 | 301,377 | 9,094 | 8,292 | 8,062 | 2.66 | 2.51 | 2.68 | |||||||||||||||||||||||
Deposits in other banks | 60,651 | 45,434 | 65,027 | 1,261 | 873 | 734 | 2.08 | 1.92 | 1.13 | |||||||||||||||||||||||
Total interest earning assets | 2,107,169 | 1,709,283 | 1,631,853 | 93,224 | 69,324 | 64,377 | 4.42 | 4.06 | 3.95 | |||||||||||||||||||||||
Nonearning assets | 196,455 | 118,375 | 126,159 | |||||||||||||||||||||||||||||
Total assets | $ | 2,303,624 | $ | 1,827,658 | $ | 1,758,012 | ||||||||||||||||||||||||||
Deposits: | ||||||||||||||||||||||||||||||||
Demand | $ | 307,329 | $ | 234,857 | $ | 217,833 | 370 | 49 | 43 | 0.12 | 0.02 | 0.02 | ||||||||||||||||||||
Money market | 445,505 | 393,321 | 335,085 | 5,246 | 3,505 | 1,668 | 1.18 | 0.89 | 0.50 | |||||||||||||||||||||||
Savings | 166,842 | 132,182 | 125,157 | 284 | 40 | 38 | 0.17 | 0.03 | 0.03 | |||||||||||||||||||||||
Time | 457,746 | 374,152 | 383,444 | 7,243 | 4,492 | 4,045 | 1.58 | 1.20 | 1.05 | |||||||||||||||||||||||
Total deposits | 1,377,422 | 1,134,512 | 1,061,519 | 13,143 | 8,086 | 5,794 | 0.95 | 0.71 | 0.55 | |||||||||||||||||||||||
Customer repurchase agreements | 39,134 | 18,401 | 46,335 | 596 | 164 | 142 | 1.52 | 0.89 | 0.31 | |||||||||||||||||||||||
Other short-term borrowings | 2,694 | 1,149 | 3,158 | 54 | 22 | 31 | 2.00 | 1.91 | 0.98 | |||||||||||||||||||||||
Long-term borrowings | 33,644 | 27,874 | 36,887 | 1,935 | 1,402 | 1,324 | 5.75 | 5.03 | 3.59 | |||||||||||||||||||||||
Total interest bearing liabilities | 1,452,894 | 1,181,936 | 1,147,899 | 15,728 | 9,674 | 7,291 | 1.08 | 0.82 | 0.64 | |||||||||||||||||||||||
Noninterest bearing demand deposits | 537,775 | 421,527 | 392,663 | |||||||||||||||||||||||||||||
Other liabilities | 20,933 | 10,374 | 9,643 | |||||||||||||||||||||||||||||
Shareholders' equity | 292,022 | 213,821 | 207,807 | |||||||||||||||||||||||||||||
Total liabilities and shareholders' equity | $ | 2,303,624 | $ | 1,827,658 | $ | 1,758,012 | ||||||||||||||||||||||||||
Interest rate spread | 3.34 | % | 3.24 | % | 3.31 | % | ||||||||||||||||||||||||||
Net interest margin | 3.68 | % | 3.49 | % | 3.50 | % | ||||||||||||||||||||||||||
Net interest income (taxable equivalent basis) | 77,496 | 59,650 | 57,086 | |||||||||||||||||||||||||||||
Less: Taxable equivalent adjustment(3) | 369 | 556 | 1,339 | |||||||||||||||||||||||||||||
Net interest income | $ | 77,127 | $ | 59,094 | $ | 55,747 | ||||||||||||||||||||||||||
(1) Interest income includes net accretion/amortization of acquired loan fair value adjustments and the net accretion/amortization of deferred loan fees/costs.
(2) Nonaccrual loans are included in the average balances.
(3) A tax rate of 21% in 2019 and 2018 and 35% in 2017 was used in adjusting interest on tax-exempt assets to a fully taxable equivalent basis.
35
The following table presents the dollar amount of changes in interest income and interest expense, and distinguishes between changes resulting from fluctuations in average balances of interest earning assets and interest bearing liabilities (volume), and changes resulting from fluctuations in average interest rates on such assets and liabilities (rate). Changes attributable to both volume and rate have been allocated proportionately (dollars in thousands):
Changes in Net Interest Income (Rate / Volume Analysis)
2019 vs. 2018 | 2018 vs. 2017 | ||||||||||||||||||||||
Increase | Change Attributable to | Increase | Change Attributable to | ||||||||||||||||||||
Interest income | (Decrease) | Rate | Volume | (Decrease) | Rate | Volume | |||||||||||||||||
Loans: | |||||||||||||||||||||||
Commercial | $ | 3,546 | $ | 1,741 | $ | 1,805 | $ | 1,750 | $ | 360 | $ | 1,390 | |||||||||||
Real estate | 18,775 | 3,022 | 15,753 | 2,875 | 1,396 | 1,479 | |||||||||||||||||
Consumer | 389 | 19 | 370 | (47 | ) | (49 | ) | 2 | |||||||||||||||
Total loans | 22,710 | 4,782 | 17,928 | 4,578 | 1,707 | 2,871 | |||||||||||||||||
Securities: | |||||||||||||||||||||||
Federal agencies and GSEs | 483 | 228 | 255 | 859 | 353 | 506 | |||||||||||||||||
Mortgage-backed and CMOs | 883 | 268 | 615 | 742 | 139 | 603 | |||||||||||||||||
State and municipal | (749 | ) | 9 | (758 | ) | (1,382 | ) | (714 | ) | (668 | ) | ||||||||||||
Other securities | 185 | 103 | 82 | 11 | 50 | (39 | ) | ||||||||||||||||
Total securities | 802 | 608 | 194 | 230 | (172 | ) | 402 | ||||||||||||||||
Deposits in other banks | 388 | 76 | 312 | 139 | 407 | (268 | ) | ||||||||||||||||
Total interest income | 23,900 | 5,466 | 18,434 | 4,947 | 1,942 | 3,005 | |||||||||||||||||
Interest expense | |||||||||||||||||||||||
Deposits: | |||||||||||||||||||||||
Demand | 321 | 301 | 20 | 6 | 3 | 3 | |||||||||||||||||
Money market | 1,741 | 1,232 | 509 | 1,837 | 1,506 | 331 | |||||||||||||||||
Savings | 244 | 231 | 13 | 2 | — | 2 | |||||||||||||||||
Time | 2,751 | 1,616 | 1,135 | 447 | 547 | (100 | ) | ||||||||||||||||
Total deposits | 5,057 | 3,380 | 1,677 | 2,292 | 2,056 | 236 | |||||||||||||||||
Customer repurchase agreements | 432 | 166 | 266 | 22 | 147 | (125 | ) | ||||||||||||||||
Other borrowings | 565 | 179 | 386 | 69 | 506 | (437 | ) | ||||||||||||||||
Total interest expense | 6,054 | 3,725 | 2,329 | 2,383 | 2,709 | (326 | ) | ||||||||||||||||
Net interest income | $ | 17,846 | $ | 1,741 | $ | 16,105 | $ | 2,564 | $ | (767 | ) | $ | 3,331 | ||||||||||
36
Noninterest Income
For the year ended December 31, 2019, noninterest income increased $1,896,000 or 14.3% compared to the year ended December 31, 2018.
Years Ended December 31, | ||||||||||||||
(Dollars in thousands) | ||||||||||||||
2019 | 2018 | $ Change | % Change | |||||||||||
Noninterest income: | ||||||||||||||
Trust fees | $ | 3,847 | $ | 3,783 | $ | 64 | 1.7 | % | ||||||
Service charges on deposit accounts | 2,866 | 2,455 | 411 | 16.7 | ||||||||||
Other fees and commissions | 3,693 | 2,637 | 1,056 | 40.0 | ||||||||||
Mortgage banking income | 2,439 | 1,862 | 577 | 31.0 | ||||||||||
Securities gains, net | 607 | 123 | 484 | 393.5 | ||||||||||
Brokerage fees | 721 | 795 | (74 | ) | (9.3 | ) | ||||||||
Income from Small Business Investment Companies | 211 | 637 | (426 | ) | (66.9 | ) | ||||||||
Gains (losses) on premises and equipment, net | (427 | ) | 60 | (487 | ) | (811.7 | ) | |||||||
Other | 1,213 | 922 | 291 | 31.6 | ||||||||||
Total noninterest income | $ | 15,170 | $ | 13,274 | $ | 1,896 | 14.3 | % | ||||||
A substantial portion of trust fees are earned based on account fair values, so changes in the equity markets may have a large and potentially volatile impact on revenue. Trust fees remained stable while service charges increased $411,000 for 2019 compared to 2018, primarily due to the HomeTown acquisition. Other fees and commissions increased $1,056,000 in 2019 compared to 2018, mostly as a result of the acquisition but also from the strength of increased debit card fee revenue. As a result of increased volume, mortgage banking income increased $577,000 in 2019 over 2018. Secondary market mortgage loan volume for 2019 was $102,708,000 compared to $77,739,000 for 2018. Net securities gains were up $484,000, or 393.5%. Income from Small Business Investment Company ("SBIC") investments decreased $426,000 or 66.9% for 2019 compared to 2018. Net gains (losses) on premises and equipment were a loss of $427,000 for 2019 compared to a gain of $60,000 in 2018. The loss was primarily due to a write-down of carrying value on existing equipment in connection with an ATM replacement initiative.
Years Ended December 31, | ||||||||||||||
(Dollars in thousands) | ||||||||||||||
2018 | 2017 | $ Change | % Change | |||||||||||
Noninterest income: | ||||||||||||||
Trust fees | $ | 3,783 | $ | 3,926 | $ | (143 | ) | (3.6 | )% | |||||
Service charges on deposit accounts | 2,455 | 2,426 | 29 | 1.2 | ||||||||||
Other fees and commissions | 2,637 | 2,471 | 166 | 6.7 | ||||||||||
Mortgage banking income | 1,862 | 2,208 | (346 | ) | (15.7 | ) | ||||||||
Securities gains, net | 123 | 812 | (689 | ) | (84.9 | ) | ||||||||
Brokerage fees | 795 | 829 | (34 | ) | (4.1 | ) | ||||||||
Income from Small Business Investment Companies | 637 | 236 | 401 | 169.9 | ||||||||||
Gains on premises and equipment, net | 60 | 344 | (284 | ) | (82.6 | ) | ||||||||
Other | 922 | 975 | (53 | ) | (5.4 | ) | ||||||||
Total noninterest income | $ | 13,274 | $ | 14,227 | $ | (953 | ) | (6.7 | )% | |||||
Trust fees decreased slightly while service charges increased slightly for 2018 compared to 2017. Other fees and commissions were positively impacted by higher levels of debit card transaction volume. Mortgage banking income decreased in 2018, primarily due to lower demand. Secondary market mortgage loan volume for 2018 was $77,739,000 compared to $86,612,000 for 2017. Net securities gains were down $689,000, or 84.9%. Income from SBIC investments increased $401,000 or 169.9% for 2018 compared to 2017. Net gains on premises and equipment decreased $284,000 for 2018 compared to 2017 primarily due to a $337,000 gain from the 2017 sale of a bank owned commercial lot.
37
Noninterest Expense
For the year ended December 31, 2019, noninterest expense increased $21,828,000, or 49.3%, as compared to the year ended December 31, 2018.
Years Ended December 31, | ||||||||||||||
(Dollars in thousands) | ||||||||||||||
2019 | 2018 | $ Change | % Change | |||||||||||
Noninterest expense: | ||||||||||||||
Salaries | $ | 24,672 | $ | 20,509 | $ | 4,163 | 20.3 | % | ||||||
Employee benefits | 5,343 | 4,370 | 973 | 22.3 | ||||||||||
Occupancy and equipment | 5,417 | 4,378 | 1,039 | 23.7 | ||||||||||
FDIC assessment | 119 | 537 | (418 | ) | (77.8 | ) | ||||||||
Bank franchise tax | 1,644 | 1,054 | 590 | 56.0 | ||||||||||
Core deposit intangible amortization | 1,398 | 265 | 1,133 | 427.5 | ||||||||||
Data processing | 2,567 | 1,691 | 876 | 51.8 | ||||||||||
Software | 1,295 | 1,279 | 16 | 1.3 | ||||||||||
Other real estate owned, net | 31 | 122 | (91 | ) | (74.6 | ) | ||||||||
Merger related expenses | 11,782 | 872 | 10,910 | 1,251.1 | ||||||||||
Other | 11,806 | 9,169 | 2,637 | 28.8 | ||||||||||
Total noninterest expense | $ | 66,074 | $ | 44,246 | $ | 21,828 | 49.3 | % | ||||||
Salaries expense and employee benefits combined increased $5,136,000, or 20.46%, in 2019 compared to 2018. Total full-time equivalent employees ("FTEs") were 355 at the end of 2019, up from 305 at the end of 2018, for an increase of 50 FTEs primarliy associated with the HomeTown acquisition. Occupancy and equipment expense increased $1,039,000 in 2019 compared to 2018, primarily due to the acquisition. The FDIC assessment expense in 2019 was positively impacted by the Small Bank Assessment Credit, which reduced insurance expense $492,000. Core deposit intangible amortization increased $1,133,000 in 2019 compared to 2018, and data processing expense increased $876,000 in 2019 compared to 2018, again as a result of the merger. Merger related expenses, which are related to the HomeTown acquisition and are nonrecurring in nature, totaled $11,782,000 during 2019 compared to $872,000 in 2018.
Years Ended December 31, | ||||||||||||||
(Dollars in thousands) | ||||||||||||||
2018 | 2017 | $ Change | % Change | |||||||||||
Noninterest expense: | ||||||||||||||
Salaries | $ | 20,509 | $ | 19,829 | $ | 680 | 3.4 | % | ||||||
Employee benefits | 4,370 | 4,274 | 96 | 2.2 | ||||||||||
Occupancy and equipment | 4,378 | 4,487 | (109 | ) | (2.4 | ) | ||||||||
FDIC assessment | 537 | 538 | (1 | ) | (0.2 | ) | ||||||||
Bank franchise tax | 1,054 | 1,072 | (18 | ) | (1.7 | ) | ||||||||
Core deposit intangible amortization | 265 | 528 | (263 | ) | (49.8 | ) | ||||||||
Data processing | 1,691 | 2,014 | (323 | ) | (16.0 | ) | ||||||||
Software | 1,279 | 1,144 | 135 | 11.8 | ||||||||||
Other real estate owned, net | 122 | 303 | (181 | ) | (59.7 | ) | ||||||||
Merger related expenses | 872 | — | 872 | — | ||||||||||
Other | 9,169 | 8,694 | 475 | 5.5 | ||||||||||
Total noninterest expense | $ | 44,246 | $ | 42,883 | $ | 1,363 | 3.2 | % | ||||||
Salaries expense increased $680,000, or 3.4%, in 2018 compared to 2017 as a result of normal annual salary adjustments, additional employees, anticipated retirements and adjustments to fringe benefit accruals. Core deposit intangible amortization decreased in 2018 compared to 2017 as the amortization expense relating to the Company's acquisition of MidCarolina in July 2011 is recognized under the accelerated method and will be fully amortized in 2020. The primary driver of the increase in
38
noninterest expense was merger related expenses pursuant to the acquisition of HomeTown; these nonrecurring expenses totaled $872,000 in the fourth quarter of 2018.
Income Taxes
Income taxes on 2019 earnings amounted to $4,861,000, resulting in an effective tax rate of 18.9%, compared to 20.0% in 2018 and 41.5% in 2017. Income tax expense for 2017 includes a one-time write-down of net deferred tax assets in the amount of $2.7 million, recorded as a result of the enactment of the Tax Reform Act on December 22, 2017. The Tax Reform Act reduced the federal corporate tax rate from 35% to 21% effective January 1, 2018.
The effective tax rate is lowered by income that is not taxable for federal income tax purposes. The primary non-taxable income is from state and municipal securities and loans.
Fair Value Impact to Net Interest Margin
The Company's fully taxable equivalent net interest margin includes the impact of acquisition accounting fair value adjustments. The impact of net accretion for 2017, 2018, and 2019 and the remaining estimated net accretion are reflected in the following table (dollars in thousands):
Loans Accretion | Deposit Accretion | Borrowings Amortization | Total | ||||||||||||
For the year ended December 31, 2017 | $ | 2,236 | $ | — | $ | (122 | ) | $ | 2,114 | ||||||
For the year ended December 31, 2018 | 1,390 | — | (102 | ) | 1,288 | ||||||||||
For the year ended December 31, 2019 | 3,101 | 375 | (89 | ) | 3,387 | ||||||||||
For the years ending (estimated): | |||||||||||||||
2020 | 1,871 | 181 | (84 | ) | 1,968 | ||||||||||
2021 | 1,503 | 78 | (102 | ) | 1,479 | ||||||||||
2022 | 1,032 | 50 | (102 | ) | 980 | ||||||||||
2023 | 729 | 30 | (102 | ) | 657 | ||||||||||
2024 | 468 | 5 | (102 | ) | 371 | ||||||||||
Thereafter | 2,471 | 5 | (845 | ) | 1,631 | ||||||||||
Impact of Inflation and Changing Prices
The majority of assets and liabilities of a financial institution are monetary in nature and therefore differ greatly from most commercial and industrial companies that have significant investments in fixed assets or inventories. The most significant effect of inflation is on noninterest expenses that tend to rise during periods of inflation. Changes in interest rates have a greater impact on a financial institution's profitability than do the effects of higher costs for goods and services. Through its balance sheet management practices, the Company has the ability to react to those changes and measure and monitor its interest rate and liquidity risk.
Market Risk Management
Effectively managing market risk is essential to achieving the Company's financial objectives. Market risk reflects the risk of economic loss resulting from changes in interest rates and market prices. The Company is generally not subject to currency exchange risk or commodity price risk. The Company's primary market risk exposure is interest rate risk; however, market risk also includes liquidity risk. Both are discussed in the following sections.
Interest Rate Risk Management
Interest rate risk and its impact on net interest income is a primary market risk exposure. The Company manages its exposure to fluctuations in interest rates through policies approved by its Asset Liability Committee ("ALCO") and Board of Directors, both of which receive and review periodic reports of the Company's interest rate risk position.
The Company uses computer simulation analysis to measure the sensitivity of projected earnings to changes in interest rates. Simulation takes into account current balance sheet volumes and the scheduled repricing dates, instrument level optionality, and maturities of assets and liabilities. It incorporates numerous assumptions including growth, changes in the mix of assets and liabilities, prepayments, and average rates earned and paid. Based on this information, management uses the model to project net interest income under multiple interest rate scenarios.
39
A balance sheet is considered asset sensitive when its earning assets (loans and securities) reprice faster or to a greater extent than its liabilities (deposits and borrowings). An asset sensitive balance sheet will produce relatively more net interest income when interest rates rise and less net interest income when they decline. Based on the Company's simulation analysis, management believes the Company's interest sensitivity position at December 31, 2019 is asset sensitive.
Earnings Simulation
The table below shows the estimated impact of changes in interest rates on net interest income as of December 31, 2019 (dollars in thousands), assuming gradual and parallel changes in interest rates, and consistent levels of assets and liabilities. Net interest income for the following twelve months is projected to increase when interest rates are higher than current rates.
Estimated Changes in Net Interest Income
December 31, 2019 | ||||||
Change in net interest income | ||||||
Change in interest rates | Amount | Percent | ||||
Up 4.0% | $ | 10,860 | 13.1 | % | ||
Up 3.0% | 8,267 | 10.0 | ||||
Up 2.0% | 5,615 | 6.8 | ||||
Up 1.0% | 2,877 | 3.5 | ||||
Flat | — | — | ||||
Down 0.25% | (659 | ) | (0.8 | ) | ||
Down 0.50% | (3,681 | ) | (4.5 | ) | ||
Management cannot predict future interest rates or their exact effect on net interest income. Computations of future effects of hypothetical interest rate changes are based on numerous assumptions and should not be relied upon as indicative of actual results. Certain limitations are inherent in such computations. Assets and liabilities may react differently than projected to changes in market interest rates. The interest rates on certain types of assets and liabilities may fluctuate in advance of changes in market interest rates, while rates on other types of assets and liabilities may lag changes in market interest rates. Interest rate shifts may not be parallel.
Changes in interest rates can cause substantial changes in the amount of prepayments of loans and mortgage-backed securities, which may in turn affect the Company's interest rate sensitivity position. Additionally, credit risk may rise if an interest rate increase adversely affects the ability of borrowers to service their debt.
Economic Value Simulation
Economic value simulation is used to calculate the estimated fair value of assets and liabilities over different interest rate environments. Economic values are calculated based on discounted cash flow analysis. The net economic value of equity is the economic value of all assets minus the economic value of all liabilities. The change in net economic value over different rate environments is an indication of the longer-term earnings capability of the balance sheet. The same assumptions are used in the economic value simulation as in the earnings simulation. The economic value simulation uses instantaneous rate shocks to the balance sheet.
The following table reflects the estimated change in net economic value over different rate environments using economic value simulation for the balances at the period ended December 31, 2019 (dollars in thousands):
Estimated Changes in Economic Value of Equity
December 31, 2019 | ||||||||||
Change in interest rates | Amount | $ Change | % Change | |||||||
Up 4.0% | $ | 424,956 | $ | 131,657 | 44.9 | % | ||||
Up 3.0% | 405,360 | 112,061 | 38.2 | |||||||
Up 2.0% | 379,684 | 86,385 | 29.5 | |||||||
Up 1.0% | 345,074 | 51,775 | 17.7 | |||||||
Flat | 293,299 | — | — | |||||||
Down 0.25% | 279,435 | (13,864 | ) | (4.7 | ) | |||||
Down 0.50% | 232,969 | (60,330 | ) | (20.6 | ) | |||||
40
Liquidity Risk Management
Liquidity is the ability of the Company in a timely manner to convert assets into cash or cash equivalents without significant loss and to raise additional funds by increasing liabilities. Liquidity management involves maintaining the Company's ability to meet the daily cash flow requirements of its customers, whether they are borrowers requiring funds or depositors desiring to withdraw funds. Additionally, the Company requires cash for various operating needs including dividends to shareholders, the servicing of debt, and the payment of general corporate expenses. The Company manages its exposure to fluctuations in interest rates and liquidity needs through policies approved by the ALCO and Board of Directors, both of which receive periodic reports of the Company's interest rate risk and liquidity position. The Company uses a computer simulation model to assist in the management of the future liquidity needs of the Company.
Liquidity sources include on balance sheet and off balance sheet sources.
Balance sheet liquidity sources include cash, amounts due from banks, loan repayments, bond maturities and calls, and increases in deposits. Further, the Company maintains a large, high quality, very liquid bond portfolio, which is generally 50% to 60% unpledged and would, accordingly, be available for sale if necessary.
Off balance sheet sources include lines of credit from the Federal Home Loan Bank of Atlanta ("FHLB"), federal funds lines of credit, and access to the Federal Reserve Bank of Richmond's discount window.
The Company has a line of credit with the FHLB, equal to 30% of the Company's assets, subject to the amount of collateral pledged. Under the terms of its collateral agreement with the FHLB, the Company provides a blanket lien covering all of its residential first mortgage loans, home equity lines of credit, commercial real estate loans and commercial construction loans. In addition, the Company pledges as collateral its capital stock in and deposits with the FHLB. At December 31, 2019 and 2018, there were no principal advance obligations to the FHLB. The Company had outstanding $170,000,000 in FHLB letters of credit at December 31, 2019 compared to $190,250,000 in letters of credit at December 31, 2018. The letters of credit provide the Bank with additional collateral for securing public entity deposits above FDIC insurance levels, thereby providing less need for collateral pledging from the securities portfolio and accordingly increasing the Company's balance sheet liquidity.
Short-term borrowing is discussed in Note 11 and long-term borrowing is discussed in Note 12 of the Consolidated Financial Statements contained in Item 8 of this Form 10-K.
The Company has federal funds lines of credit established with one correspondent bank in the amount of $15,000,000 and another correspondent bank in the amount of $10,000,000, and has access to the Federal Reserve Bank of Richmond's discount window. There were no amounts outstanding under these facilities at December 31, 2019. The Company, through its subsidiary bank, has a relationship with Promontory Network, the sponsoring entity for the Certificate of Deposit Account Registry Service® ("CDARS"). Through CDARS, the Company is able to provide deposit customers with access to aggregate FDIC insurance in amounts far exceeding $250,000. This gives the Company the ability, as and when needed, to attract and retain large deposits from insurance sensitive customers. Under the EGRRCPA signed into law on May 24, 2018, a well-capitalized bank with a CAMELS rating of 1 or 2 may hold reciprocal deposits up to the lesser of 20% of its total liabilities or $5 billion without those deposits being treated as brokered deposits. With CDARS, the Company has the option to keep deposits on balance sheet or sell them to other members of the network. Additionally, subject to certain limits, the Company can use CDARS to purchase cost-effective funding without collateralization and in lieu of generating funds through traditional brokered CDs or the FHLB. Thus, CDARS serves as a deposit-gathering tool and an additional liquidity management tool. Deposits through the CDARS program as of December 31, 2019 and 2018 were $14,864,000 and $22,431,000, respectively.
The Bank also participates with the Promontory Network using Insured Cash Sweep®, a product which provides the Bank the capability of providing additional deposit insurance to customers in the context of a money market account arrangement. The product is analogous to the CDARS product discussed above.
Management believes that these sources provide sufficient and timely liquidity, both on and off balance sheet.
BALANCE SHEET ANALYSIS
Securities
The securities portfolio generates income, plays a strategic role in the management of interest rate sensitivity, provides a source of liquidity, and is used to meet collateral requirements. The securities portfolio consists of high quality investments, mostly federal agency, mortgage-backed, and state and municipal securities.
The Company is cognizant of the continuing historically low and currently decreasing to stable rate environment and has elected to execute an asset liability strategy of purchasing high quality taxable securities of somewhat greater duration and
41
average life than previously held. The objective is to improve yield and duration on the portfolio in advance of any major market moves. During 2019, indications were that market rates had peaked and the yield curve had flattened.
The following table presents information on the amortized cost, maturities, and taxable equivalent yields of available for sale securities at the end of the last three years (dollars in thousands):
As of December 31, | ||||||||||||||||||||
2019 | 2018 | 2017 | ||||||||||||||||||
Amortized Cost | Taxable Equivalent Yield | Amortized Cost | Taxable Equivalent Yield | Amortized Cost | Taxable Equivalent Yield | |||||||||||||||
U. S. Treasury | ||||||||||||||||||||
Within 1 year | $ | 14,992 | 1.52 | % | $ | — | — | % | $ | — | — | % | ||||||||
1 to 5 years | — | — | — | — | — | — | ||||||||||||||
5 to 10 years | — | — | — | — | — | — | ||||||||||||||
Over 10 years | — | — | — | — | — | — | ||||||||||||||
Total | 14,992 | 1.52 | — | — | — | — | ||||||||||||||
Federal Agencies: | ||||||||||||||||||||
Within 1 year | 24,987 | 1.52 | — | — | 7,001 | 1.49 | ||||||||||||||
1 to 5 years | 24,920 | 2.28 | 68,786 | 2.27 | 48,789 | 1.91 | ||||||||||||||
5 to 10 years | 46,946 | 2.71 | 55,797 | 2.66 | 45,973 | 2.23 | ||||||||||||||
Over 10 years | 29,976 | 2.32 | 12,487 | 2.05 | 12,483 | 2.02 | ||||||||||||||
Total | 126,829 | 2.30 | 137,070 | 2.40 | 114,246 | 2.02 | ||||||||||||||
Mortgage-backed: | ||||||||||||||||||||
Within 1 year | 73 | 3.26 | 72 | 3.14 | — | — | ||||||||||||||
1 to 5 years | 2,794 | 2.84 | 2,946 | 2.62 | 2,770 | 2.59 | ||||||||||||||
5 to 10 years | 38,993 | 2.27 | 36,241 | 2.44 | 22,849 | 2.29 | ||||||||||||||
Over 10 years | 140,872 | 2.46 | 74,624 | 2.54 | 80,544 | 2.28 | ||||||||||||||
Total | 182,732 | 2.42 | 113,883 | 2.51 | 106,163 | 2.29 | ||||||||||||||
State and Municipal: | ||||||||||||||||||||
Within 1 year | 1,255 | 3.85 | 6,872 | 2.25 | 4,539 | 2.73 | ||||||||||||||
1 to 5 years | 25,619 | 2.72 | 46,287 | 2.93 | 52,975 | 3.52 | ||||||||||||||
5 to 10 years | 9,086 | 2.82 | 20,199 | 2.82 | 27,411 | 3.77 | ||||||||||||||
Over 10 years | 5,467 | 3.50 | 6,664 | 2.71 | 7,786 | 3.03 | ||||||||||||||
Total | 41,427 | 2.88 | 80,022 | 2.82 | 92,711 | 3.52 | ||||||||||||||
Corporate Securities: | ||||||||||||||||||||
Within 1 year | — | — | — | — | — | — | ||||||||||||||
1 to 5 years | 500 | 2.42 | 500 | 2.42 | 1,042 | 1.50 | ||||||||||||||
5 to 10 years | 505 | 5.28 | — | — | 500 | 2.42 | ||||||||||||||
Over 10 years | 8,509 | 5.56 | 6,299 | 5.41 | 6,300 | 5.41 | ||||||||||||||
Total | 9,514 | 5.38 | 6,799 | 4.70 | 7,842 | 4.70 | ||||||||||||||
Common Stock: | ||||||||||||||||||||
No maturity | — | — | — | — | 1,383 | — | ||||||||||||||
Total | — | — | — | — | 1,383 | — | ||||||||||||||
Total portfolio | $ | 375,494 | 2.47 | % | $ | 337,774 | 2.59 | % | $ | 322,345 | 2.60 | % | ||||||||
The Company adopted ASU 2016-01 effective January 1, 2018 and had no equity securities at December 31, 2019. The Company recognized in income $333,000 of unrealized holding gains during 2019. During the year ended December 31, 2019, the Company sold $445,000 in equity securities at fair value.
42
Loans
The loan portfolio consists primarily of commercial and residential real estate loans, commercial loans to small and medium-sized businesses, construction and land development loans, and home equity loans.
Average loans increased $371,432,000, or 27.9%, from 2018 to 2019, mostly impacted by the HomeTown merger. Average loans increased $67,418,000, or 5.3%, from 2017 to 2018.
At December 31, 2019, total loans were $1,830,815,000, an increase of $473,339,000, or 34.9%, from the prior year. Of this increase, $444,324,000 was related to the HomeTown merger, and $29,015,000 represents growth throughout the rest of the franchise.
Loans held for sale and associated with secondary mortgage activity totaled $2,027,000 at December 31, 2019 and $640,000 at December 31, 2018. Loan production volume was $102,708,000 and $77,739,000 for 2019 and 2018, respectively. These loans were approximately 60% purchase, 40% refinancing.
Management of the loan portfolio is organized around portfolio segments. Each segment is comprised of various loan types that are reflective of operational and regulatory reporting requirements. The following table presents the Company's portfolio as of the dates indicated by segment (dollars in thousands):
Loans
As of December 31, | |||||||||||||||||||
2019 | 2018 | 2017 | 2016 | 2015 | |||||||||||||||
Real estate: | |||||||||||||||||||
Construction and land development | $ | 137,920 | $ | 97,240 | $ | 123,147 | $ | 114,258 | $ | 72,968 | |||||||||
Commercial real estate | 899,199 | 655,800 | 637,701 | 510,960 | 430,186 | ||||||||||||||
Residential real estate | 324,315 | 209,438 | 209,326 | 215,104 | 220,434 | ||||||||||||||
Home equity | 119,423 | 103,933 | 109,857 | 110,751 | 98,449 | ||||||||||||||
Total real estate | 1,480,857 | 1,066,411 | 1,080,031 | 951,073 | 822,037 | ||||||||||||||
Commercial and industrial | 339,077 | 285,972 | 251,666 | 208,717 | 177,481 | ||||||||||||||
Consumer | 10,881 | 5,093 | 4,428 | 5,031 | 6,007 | ||||||||||||||
Total loans | $ | 1,830,815 | $ | 1,357,476 | $ | 1,336,125 | $ | 1,164,821 | $ | 1,005,525 | |||||||||
The following table provides loan balance information by geographic regions. In some circumstances, loans may be originated in one region for borrowers located in other regions (dollars in thousands):
Loans by Geographic Region
As of December 31, 2019 | Percentage Change in Balance Since December 31, 2018 | ||||||||
Balance | Percentage of Portfolio | ||||||||
Danville region | $ | 220,650 | 12.0 | % | 0.6 | % | |||
Central region | 137,822 | 7.5 | (8.3 | ) | |||||
Southside region | 69,248 | 3.8 | (2.1 | ) | |||||
Eastern region | 93,651 | 5.1 | 0.4 | ||||||
Franklin region | 120,139 | 6.6 | 8.5 | ||||||
Roanoke region | 424,086 | 23.2 | 264.9 | ||||||
New River Valley region | 113,223 | 6.2 | 100.0 | ||||||
Alamance region | 286,035 | 15.6 | 8.8 | ||||||
Guilford region | 275,819 | 15.1 | 3.5 | ||||||
Winston-Salem region | 90,142 | 4.9 | 34.0 | ||||||
Total loans | $ | 1,830,815 | 100.0 | % | 34.9 | % | |||
The Danville region consists of offices in Danville, Virginia and Yanceyville, North Carolina. The Central region consists of offices in Lynchburg, and Campbell County, Virginia. The Southside region consists of offices in Martinsville and Henry
43
County, Virginia. The Eastern region consists of offices in South Boston and the counties of Halifax and Pittsylvania, Virginia. The Franklin region consists of offices in Rocky Mount and Hardy, Virginia. The Roanoke region consists of offices in Roanoke, Salem, and Roanoke County, Virginia. The New River Valley region consists of an office in Christiansburg, Virginia. The Alamance region consists of offices in Burlington, Graham, and Mebane, North Carolina. The Guilford region consists of offices in Greensboro, North Carolina. The Winston-Salem region consists of an office in Winston-Salem, North Carolina.
The Company does not participate in or have any highly leveraged lending transactions, as defined by bank regulations. The Company has no foreign loans. There were no concentrations of loans to any individual, group of individuals, business, or industry that exceeded 10% of total loans at December 31, 2019 or 2018.
The following table presents the maturity schedule of selected loan types (dollars in thousands):
Maturities of Selected Loan Types
December 31, 2019
Commercial and Industrial (1) | Construction and Land Development | Total | |||||||||
1 year or less | $ | 122,535 | $ | 25,136 | $ | 147,671 | |||||
1 to 5 years (2) | 149,971 | 95,295 | 245,266 | ||||||||
After 5 years (2) | 66,571 | 17,489 | 84,060 | ||||||||
Total | $ | 339,077 | $ | 137,920 | $ | 476,997 | |||||
______________________
(1) | Includes agricultural loans. |
(2) | Of the loans due after one year, $265,967 have predetermined interest rates and $63,359 have floating or adjustable interest rates. |
Provision for Loan Losses
The Company had a provision for loan losses of $456,000 for the year ended December 31, 2019, compared to a negative provision for loan losses of $103,000 and a provision for loan losses of $1,016,000 for the years ended December 31, 2018 and 2017, respectively.
The provision for 2019 primarily related to a $156,000 increase in the impaired loan reserve and loan growth during the fourth quarter of 2019. The negative provision for 2018 related to favorable adjustments on the purchased credit impaired loan loss allowance. The larger provision for 2017 related to continued loan growth but was mitigated by continued strong asset quality metrics and improving local and national economic indicators.
Allowance for Loan Losses
The purpose of the ALLL is to provide for probable losses inherent in the loan portfolio. The allowance is increased by the provision for loan losses and by recoveries of previously charged-off loans. Loan charge-offs decrease the allowance.
The ALLL was $13,152,000, $12,805,000, and $13,603,000 at December 31, 2019, 2018, and 2017, respectively. The ALLL as a percentage of loans at each of those dates was 0.72%, 0.94%, and 1.02%, respectively.
The decrease in the allowance as a percentage of loans during 2019 as compared to 2018 and 2017 was primarily due to the acquired loan portfolio of HomeTown recorded at fair value with no continuing allowance and the continued high asset quality, low charge-offs, and improvement in various qualitative factors, notably economic, used in the determination of the allowance.
In an effort to better evaluate the adequacy of its ALLL, the Company computes its ASC 450, Contingencies, loan balance by reducing total loans by acquired loans and loans that were evaluated for impairment individually or smaller balance nonaccrual loans evaluated for impairment in homogeneous pools. It also adjusts its ASC 450 loan loss reserve balance total by removing allowances associated with these other pools of loans.
The general allowance, ASC 450 (FAS 5) reserves to ASC 450 loans, was 0.87% at December 31, 2019, compared to 0.94% at December 31, 2018. On a dollar basis, the reserve was $12,684,000 at December 31, 2019, compared to $12,560,000 at December 31, 2018. The percentage of the reserve to total loans has declined due to improving local and national economic
44
conditions and continued improvement in asset quality metrics. This segment of the allowance represents by far the largest portion of the loan portfolio and the largest aggregate risk.
The specific allowance, ASC 310-40 (FAS 114) reserves to ASC 310-40 loans, was 10.51% at December 31, 2019, compared to 4.78% at December 31, 2018. On a dollar basis, the reserve was $230,000 at December 31, 2019, compared to $64,000 at December 31, 2018. There is ongoing turnover in the composition of the impaired loan population, which increased $858,000 from December 31, 2018.
The specific allowance does not include reserves related to acquired loans with deteriorated credit quality. This reserve was $238,000 at December 31, 2019, compared to $181,000 at December 31, 2018. This is the only portion of the reserve related to acquired loans. Cash flow expectations for these loans are reviewed on a quarterly basis and unfavorable changes in those estimates relative to the initial estimates can result in the need for specific loan loss provisions.
The following table presents the Company's loan loss and recovery experience for the past five years (dollars in thousands):
Summary of Loan Loss Experience
Year Ended December 31, | ||||||||||||||||||||
2019 | 2018 | 2017 | 2016 | 2015 | ||||||||||||||||
Balance at beginning of period | $ | 12,805 | $ | 13,603 | $ | 12,801 | $ | 12,601 | $ | 12,427 | ||||||||||
Charge-offs: | ||||||||||||||||||||
Construction and land development | — | — | 35 | — | 20 | |||||||||||||||
Commercial real estate | 6 | 11 | 58 | 10 | 462 | |||||||||||||||
Residential real estate | 20 | — | 159 | 21 | 15 | |||||||||||||||
Home equity | 50 | 86 | 13 | 66 | 308 | |||||||||||||||
Total real estate | 76 | 97 | 265 | 97 | 805 | |||||||||||||||
Commercial and industrial | 12 | 787 | 282 | 40 | 175 | |||||||||||||||
Consumer | 245 | 136 | 143 | 189 | 220 | |||||||||||||||
Total charge-offs | 333 | 1,020 | 690 | 326 | 1,200 | |||||||||||||||
Recoveries: | ||||||||||||||||||||
Construction and land development | — | 4 | 43 | 11 | 81 | |||||||||||||||
Commercial real estate | 9 | 6 | 17 | 21 | 43 | |||||||||||||||
Residential real estate | 40 | 45 | 45 | 53 | 121 | |||||||||||||||
Home equity | 18 | 104 | 40 | 15 | 18 | |||||||||||||||
Total real estate | 67 | 159 | 145 | 100 | 263 | |||||||||||||||
Commercial and industrial | 13 | 69 | 223 | 40 | 32 | |||||||||||||||
Consumer | 144 | 97 | 108 | 136 | 129 | |||||||||||||||
Total recoveries | 224 | 325 | 476 | 276 | 424 | |||||||||||||||
Net charge-offs | 109 | 695 | 214 | 50 | 776 | |||||||||||||||
Provision for (recovery of) loan losses | 456 | (103 | ) | 1,016 | 250 | 950 | ||||||||||||||
Balance at end of period | $ | 13,152 | $ | 12,805 | $ | 13,603 | $ | 12,801 | $ | 12,601 | ||||||||||
45
The following table summarizes the allocation of the allowance for loan losses by major portfolio segments for the past five years (dollars in thousands):
Allocation of Allowance for Loan Losses
Year Ended December 31, | ||||||||||||||||||||||||||||||||||
2019 | 2018 | 2017 | 2016 | 2015 | ||||||||||||||||||||||||||||||
Amount | % | Amount | % | Amount | % | Amount | % | Amount | % | |||||||||||||||||||||||||
Commercial | $ | 2,657 | 18.5 | % | $ | 2,537 | 21.0 | % | $ | 2,413 | 18.8 | % | $ | 2,095 | 17.9 | % | $ | 2,065 | 17.7 | % | ||||||||||||||
Commercial real estate | 7,416 | 56.7 | 7,246 | 55.5 | 8,321 | 57.0 | 7,355 | 53.7 | 6,930 | 50.0 | ||||||||||||||||||||||||
Residential real estate | 3,023 | 24.2 | 2,977 | 23.1 | 2,825 | 23.9 | 3,303 | 28.0 | 3,546 | 31.7 | ||||||||||||||||||||||||
Consumer | 56 | 0.6 | 45 | 0.4 | 44 | 0.3 | 48 | 0.4 | 60 | 0.6 | ||||||||||||||||||||||||
Total | $ | 13,152 | 100.0 | % | $ | 12,805 | 100.0 | % | $ | 13,603 | 100.0 | % | $ | 12,801 | 100.0 | % | $ | 12,601 | 100.0 | % | ||||||||||||||
% - represents the percentage of loans in each category to total loans.
Asset Quality Indicators
The following table provides certain qualitative indicators relevant to the Company's loan portfolio for the past five years.
Asset Quality Ratios | ||||||||||||||
As of or for the Years Ended December 31, | ||||||||||||||
2019 | 2018 | 2017 | 2016 | 2015 | ||||||||||
Allowance to loans | 0.72 | % | 0.94 | % | 1.02 | % | 1.10 | % | 1.25 | % | ||||
ASC 450/general allowance | 0.87 | 0.94 | 1.04 | 1.17 | 1.40 | |||||||||
Net charge-offs to year-end allowance | 0.83 | 5.43 | 1.57 | 0.39 | 6.16 | |||||||||
Net charge-offs to average loans | 0.01 | 0.05 | 0.02 | 0.00 | 0.08 | |||||||||
Nonperforming assets to total assets | 0.15 | 0.11 | 0.21 | 0.29 | 0.48 | |||||||||
Nonperforming loans to loans | 0.13 | 0.09 | 0.19 | 0.30 | 0.52 | |||||||||
Provision to net charge-offs (recoveries) | 418.35 | (14.82 | ) | 474.77 | 500.00 | 122.42 | ||||||||
Provision to average loans | 0.03 | (0.01 | ) | 0.08 | 0.02 | 0.10 | ||||||||
Allowance to nonperforming loans | 570.59 | 1,101.98 | 531.37 | 360.39 | 242.09 | |||||||||
Nonperforming Assets (Loans and Other Real Estate Owned)
Nonperforming loans include loans on which interest is no longer accrued and accruing loans that are contractually past due 90 days or more. Nonperforming loans include loans originated and loans acquired.
Nonperforming loans to total loans were 0.13% at December 31, 2019 compared to 0.09% at December 31, 2018. The increase in nonperforming loans during 2019 was $1,143,000.
Nonperforming assets include nonperforming loans and foreclosed real estate. Nonperforming assets represented 0.15% at December 31, 2019 compared to 0.11% of total assets at December 31, 2018.
In most cases, it is the policy of the Company that any loan that becomes 90 days past due will automatically be placed on nonaccrual loan status, accrued interest reversed out of income, and further interest accrual ceased. Any payments received on such loans will be credited to principal. In some cases a loan in process of renewal may become 90 days past due. In these instances the loan may still be accruing because of a delayed renewal process in which the customer has not been billed. In accounting for acquired impaired loans, such loans are not classified as nonaccrual when they become 90 days past due. They are considered to be accruing because their interest income relates to the accretable yield and not to contractual interest payments.
Loans will only be restored to full accrual status after six consecutive months of payments that were each less than 30 days delinquent. The Company strictly adheres with this policy before restoring a loan to normal accrual status.
46
The following table presents the Company's nonperforming asset history, including acquired impaired loans as of the dates indicated (dollars in thousands):
Nonperforming Assets
As of December 31, | |||||||||||||||||||
2019 | 2018 | 2017 | 2016 | 2015 | |||||||||||||||
Nonaccrual loans: | |||||||||||||||||||
Real estate | $ | 1,083 | $ | 1,007 | $ | 2,111 | $ | 2,928 | $ | 5,022 | |||||||||
Commercial | 857 | 83 | 90 | 19 | 90 | ||||||||||||||
Consumer | 4 | — | — | 18 | 2 | ||||||||||||||
Total nonaccrual loans | 1,944 | 1,090 | 2,201 | 2,965 | 5,114 | ||||||||||||||
Loans past due 90 days and accruing interest: | |||||||||||||||||||
Real estate | 309 | 72 | 359 | 587 | 84 | ||||||||||||||
Commercial | 52 | — | — | — | — | ||||||||||||||
Consumer | — | — | — | — | 7 | ||||||||||||||
Total past due loans | 361 | 72 | 359 | 587 | 91 | ||||||||||||||
Total nonperforming loans | 2,305 | 1,162 | 2,560 | 3,552 | 5,205 | ||||||||||||||
Other real estate owned, net | 1,308 | 869 | 1,225 | 1,328 | 2,184 | ||||||||||||||
Total nonperforming assets | $ | 3,613 | $ | 2,031 | $ | 3,785 | $ | 4,880 | $ | 7,389 | |||||||||
Impaired Loans
A loan is considered impaired when, based on current information and events, it is probable that the Company will be unable to collect the scheduled payments of principal or interest when due according to the contractual terms of the loan agreement. The following table shows loans that were considered impaired, exclusive of purchased credit impaired loans, as of the dates indicated (dollars in thousands):
Impaired Loans
As of December 31, | |||||||||||||||||||
2019 | 2018 | 2017 | 2016 | 2015 | |||||||||||||||
Accruing | $ | 969 | $ | 848 | $ | 1,016 | $ | 2,059 | $ | 1,171 | |||||||||
On nonaccrual status | 1,223 | 486 | 2,201 | 2,785 | 3,536 | ||||||||||||||
Total impaired loans | $ | 2,192 | $ | 1,334 | $ | 3,217 | $ | 4,844 | $ | 4,707 | |||||||||
Troubled Debt Restructurings ("TDRs")
TDRs exist whenever the Company makes a concession to a customer based on the customer's financial distress that would not have otherwise been made in the normal course of business.
There were $1,058,000 in TDRs at December 31, 2019 compared to $1,090,000 at December 31, 2018.
Other Real Estate Owned
OREO is carried on the consolidated balance sheets at $1,308,000 and $869,000 as of December 31, 2019 and 2018, respectively. Foreclosed assets are initially recorded at fair value, less estimated costs to sell, at the date of foreclosure. Loan losses resulting from foreclosure are charged against the ALLL at that time. Subsequent to foreclosure, valuations are periodically performed by management and the assets are carried at the lower of the new cost basis or fair value, less estimated costs to sell with any additional write-downs charged against earnings. For significant assets, these valuations are typically outside annual appraisals.
47
The following table shows OREO as of the dates indicated (dollars in thousands):
As of December 31, | |||||||||||||||||||
2019 | 2018 | 2017 | 2016 | 2015 | |||||||||||||||
Construction and land development | $ | 600 | $ | 78 | $ | 318 | $ | 139 | $ | 886 | |||||||||
1-4 family residential | 285 | 719 | 629 | 653 | 643 | ||||||||||||||
Commercial real estate | 423 | 72 | 278 | 536 | 655 | ||||||||||||||
Total OREO | $ | 1,308 | $ | 869 | $ | 1,225 | $ | 1,328 | $ | 2,184 | |||||||||
Deposits
The Company's deposits consist primarily of checking, money market, savings, and consumer and commercial time deposits. Average deposits increased $359,158,000, or 23.1%, in 2019, mostly impacted by the HomeTown merger. Average deposits increased $101,857,000, or 7.0%, from 2017 to 2018.
Period-end total deposits increased $494,320,000, or 31.6%, during 2019. Of this increase, $483,626,000 was related to the HomeTown merger, and $10,694,000 represents growth throughout the rest of the franchise. The Company has only a relatively small portion of its time deposits provided by wholesale sources. These include time deposits through the CDARS program, which at year end totaled $14,864,000 for 2019, $22,431,000 for 2018, and $25,838,000 for 2017. Management considers the CDARS deposits the functional, though not regulatory, equivalent of core deposits, because they relate to balances derived from customers with long standing relationships with the Company.
Average deposits and rates for the years indicated (dollars in thousands):
Deposits
Years Ended December 31, | ||||||||||||||||||||
2019 | 2018 | 2017 | ||||||||||||||||||
Average Balance | Rate | Average Balance | Rate | Average Balance | Rate | |||||||||||||||
Noninterest bearing deposits | $ | 537,775 | — | % | $ | 421,527 | — | % | $ | 392,663 | — | % | ||||||||
Interest bearing accounts: | ||||||||||||||||||||
NOW accounts | $ | 307,329 | 0.12 | % | $ | 234,857 | 0.02 | % | $ | 217,833 | 0.02 | % | ||||||||
Money market | 445,505 | 1.18 | 393,321 | 0.89 | 335,085 | 0.50 | ||||||||||||||
Savings | 166,842 | 0.17 | 132,182 | 0.03 | 125,157 | 0.03 | ||||||||||||||
Time | 457,746 | 1.58 | 374,152 | 1.20 | 383,444 | 1.05 | ||||||||||||||
Total interest bearing deposits | $ | 1,377,422 | 0.95 | % | $ | 1,134,512 | 0.71 | % | $ | 1,061,519 | 0.55 | % | ||||||||
Average total deposits | $ | 1,915,197 | 0.68 | % | $ | 1,556,039 | 0.52 | % | $ | 1,454,182 | 0.40 | % | ||||||||
Certificates of Deposit of $100,000 or More
Certificates of deposit at December 31, 2019 in amounts of $100,000 or more were classified by maturity as follows (dollars in thousands):
December 31, 2019 | |||
3 months or less | $ | 53,493 | |
Over 3 through 6 months | 35,631 | ||
Over 6 through 12 months | 85,368 | ||
Over 12 months | 162,086 | ||
Total | $ | 336,578 | |
48
Certificates of Deposit of $250,000 or More
Certificates of deposit at December 31, 2019 in amounts of $250,000 or more were classified by maturity as follows (dollars in thousands):
December 31, 2019 | |||
3 months or less | $ | 35,219 | |
Over 3 through 6 months | 18,332 | ||
Over 6 through 12 months | 52,633 | ||
Over 12 months | 94,528 | ||
Total | $ | 200,712 | |
Borrowed Funds
In addition to internal deposit generation, the Company also relies on borrowed funds as a supplemental source of funding. Borrowed funds consist of customer repurchase agreements, overnight borrowings from the FHLB and longer-term FHLB advances, subordinated debt acquired in the HomeTown merger, and trust preferred capital notes. Additionally, on August 21, 2019, the Company secured a $3,000,000 line of credit with a regional commercial bank at 0.25% under Prime maturing August 21, 2020. Customer repurchase agreements are borrowings collateralized by securities of the U.S. Government, its agencies, or Government Sponsored Enterprises ("GSEs") and generally mature daily. The Company considers these accounts to be a stable and low cost source of funds. The securities underlying these agreements remain under the Company's control. Refer to Notes 12, 13 and 14 of the Consolidated Financial Statements contained in Item 8 of this Form 10-K for a discussion of long-term debt.
The following table presents information pertaining to the Company's short-term borrowed funds as of the dates indicated (dollars in thousands):
Short-Term Borrowings
As of December 31, | ||||||||
2019 | 2018 | |||||||
Customer repurchase agreements | $ | 40,475 | $ | 35,243 | ||||
Weighted interest rate | 1.40 | % | 1.67 | % | ||||
Average for the year ended: | ||||||||
Outstanding | $ | 41,890 | $ | 19,550 | ||||
Interest rate | 1.54 | % | 0.95 | % | ||||
Maximum month-end outstanding | $ | 42,986 | $ | 39,157 | ||||
In the regular course of conducting its business, the Company takes deposits from political subdivisions of the states of Virginia and North Carolina. At December 31, 2019, the Bank's public deposits totaled $256,984,000. The Company is legally required to provide collateral to secure the deposits that exceed the insurance coverage provided by the FDIC. This collateral can be provided in the form of certain types of government agency bonds or letters of credit from the FHLB. At year-end 2019, the Company had $170,000,000 in letters of credit with the FHLB outstanding to supplement collateral for such deposits.
Shareholders' Equity
The Company's goal with capital management is to comply with all regulatory capital requirements and to support growth, while generating acceptable returns on equity and paying a high rate of dividends.
Shareholders' equity was $320,258,000 at December 31, 2019 and $222,542,000 at December 31, 2018.
The Company declared and paid quarterly dividends totaling $1.04 per share for 2019, $1.00 per share for 2018, and $0.96 per share for 2017. Cash dividends in 2019 totaled $10,965,000 and represented a 52.4% payout of 2019 net income, compared to a 38.5% payout in 2018, and a 55.0% payout in 2017.
Effective January 1, 2015, the Company and the Bank became subject to the Basel III Capital Rules. The Basel III Capital Rules require the Company and the Bank to comply with the following minimum capital ratios: (i) a ratio of common equity Tier 1 to risk-weighted assets of at least 4.5%, plus a 2.5% “capital conservation buffer” (effectively resulting in a minimum
49
ratio of common equity Tier 1 to risk-weighted assets of at least 7%), (ii) a ratio of Tier 1 capital to risk-weighted assets of at least 6.0%, plus the 2.5% capital conservation buffer (effectively resulting in a minimum Tier 1 capital ratio of 8.5%), (iii) a ratio of total capital to risk-weighted assets of at least 8.0%, plus the 2.5% capital conservation buffer (effectively resulting in a minimum total capital ratio of 10.5%), and (iv) a leverage ratio of 4%, calculated as the ratio of Tier 1 capital to average assets. The phase-in of the capital conservation buffer requirement began on January 1, 2016, at 0.625% of risk-weighted assets, increasing by the same amount each year until it was fully implemented at 2.5% on January 1, 2019. In addition, to be well capitalized under the “prompt corrective action” regulations pursuant to Section 38 of the FDIA, the Bank must have the following minimum capital ratios: (i) a common equity Tier 1 capital ratio of at least 6.5%; (ii) a Tier 1 capital to risk-weighted assets ratio of at least 8.0%; (iii) a total capital to risk-weighted assets ratio of at least 10.0%; and (iv) a leverage ratio of at least 5.0%.
On August 28, 2018, the FRB issued an interim final rule required by the EGRRCPA that expands the applicability of the FRB’s SBHC Policy Statement to bank holding companies with total consolidated assets of less than $3 billion (up from the prior $1 billion threshold). Under the SBHC Policy Statement, qualifying bank holding companies, such as the Company, have additional flexibility in the amount of debt they can issue and are also exempt from the Basel III Capital Rules. However, the Company does not currently intend to issue a material amount of debt or take any other action that would cause its capital ratios to fall below the minimum ratios required by the Basel III Capital Rules. The SBHC Policy Statement does not apply to the Bank, and the Bank must comply with the Basel III Capital Rules.
On September 17, 2019, the federal banking agencies jointly issued a final rule required by the EGRRCPA that will permit qualifying banks and bank holding companies that have less than $10 billion in consolidated assets to elect to opt into the CBLR framework. Under the final rule, banks and bank holding companies that opt into the CBLR framework and maintain a CBLR of greater than 9% would not be subject to other risk-based and leverage capital requirements under the Basel III Capital Rules and will be deemed to have met the well capitalized ratio requirements under the "prompt corrective action" framework. In addition, a community bank that falls out of compliance with the framework will have a two-quarter grace period to come back into full compliance, provided its leverage ratio remains above 8%, and will be deemed well-capitalized during the grace period. The CBLR framework will first be available for banking organizations to use in their March 31, 2020 regulatory reports. The Company and the Bank do not currently expect to opt into the CBLR framework.
The following table represents the major regulatory capital ratios for the Company as of the dates indicated:
As of December 31, | ||||||||||||||
2019 | 2018 | 2017 | 2016 | 2015 | ||||||||||
Risk-Based Capital Ratios: | ||||||||||||||
Common equity tier 1 capital ratio | 11.56 | % | 12.55 | % | 11.50 | % | 11.77 | % | 12.88 | % | ||||
Tier 1 capital ratio | 12.98 | % | 14.46 | % | 13.42 | % | 13.83 | % | 15.23 | % | ||||
Total capital ratio | 14.04 | % | 15.35 | % | 14.39 | % | 14.81 | % | 16.34 | % | ||||
Leverage Capital Ratios: | ||||||||||||||
Tier 1 leverage ratio | 10.75 | % | 11.62 | % | 10.95 | % | 11.67 | % | 12.05 | % | ||||
Management believes the Company is in compliance with all regulatory capital requirements applicable to it and the Bank meets the requirements to be considered "well capitalized" under the prompt corrective action framework as of December 31, 2019 and 2018.
Stock Repurchase Programs
On January 19, 2018 the Company filed a Form 8-K with the SEC to announce the approval by its Board of Directors of a stock repurchase program. The program authorized the repurchase of up to 300,000 shares of the Company's common stock over a two year period that ended on December 31, 2019.
In 2019, the Company repurchased 85,868 shares at an average cost of $36.64 per share, for a total cost of $3,146,000. The Company did not repurchase any shares in 2018.
On December 19, 2019, the Company filed a Form 8-K with the SEC to announce the approval by its Board of Directors of another stock repurchase program. The program authorizes the repurchase of up to 400,000 shares of the Company's common stock through December 31, 2020.
50
CONTRACTUAL OBLIGATIONS
The following items are contractual obligations of the Company as of December 31, 2019 (dollars in thousands):
Payments Due By Period | |||||||||||||||||||
Total | Under 1 Year | 1-3 Years | 3-5 Years | More than 5 years | |||||||||||||||
Time deposits | $ | 471,770 | $ | 242,784 | $ | 177,098 | $ | 47,576 | $ | 4,312 | |||||||||
Repurchase agreements | 40,475 | 40,475 | — | — | — | ||||||||||||||
Operating leases | 6,160 | 959 | 1,863 | 1,316 | 2,022 | ||||||||||||||
Subordinated debt | 7,517 | — | — | — | 7,517 | ||||||||||||||
Junior subordinated debt | 28,029 | — | — | — | 28,029 | ||||||||||||||
OFF-BALANCE SHEET ACTIVITIES
The Company enters into certain financial transactions in the ordinary course of performing traditional banking services that result in off-balance sheet transactions. Other than AMNB Statutory Trust I, formed in 2006 to issue trust preferred securities, and MidCarolina Trust I and MidCarolina Trust II, the Company does not have any off-balance sheet subsidiaries. Refer to Note 14 of the Consolidated Financial Statements contained in Item 8 of this Form 10-K for a discussion of junior subordinated debt. Off-balance sheet transactions were as follows as of the dates indicated (dollars in thousands):
December 31, | |||||||
Off-Balance Sheet Commitments | 2019 | 2018 | |||||
Commitments to extend credit | $ | 557,364 | $ | 362,586 | |||
Standby letters of credit | 13,611 | 15,555 | |||||
Mortgage loan rate-lock commitments | 10,791 | 9,710 | |||||
Commitments to extend credit to customers represent legally binding agreements with fixed expiration dates or other termination clauses. Since many of the commitments are expected to expire without being funded, the total commitment amounts do not necessarily represent future funding requirements. Standby letters of credit are conditional commitments issued by the Company guaranteeing the performance of a customer to a third party. Those guarantees are primarily issued to support public and private borrowing arrangements.
ITEM 7A – QUANTITATIVE AND QUALITATIVE DISCLOSURES ABOUT MARKET RISK
This information is incorporated herein by reference from Item 7, "Management's Discussion and Analysis of Financial Condition and Results of Operations" of this Form 10-K.
51
ITEM 8 – FINANCIAL STATEMENTS AND SUPPLEMENTARY DATA
Quarterly Financial Results
(in thousands, except per share amounts)
First | Second | Third | Fourth | ||||||||||||||||
2019 | Quarter | Quarter | Quarter | Quarter | Total | ||||||||||||||
Interest income | $ | 18,096 | $ | 25,211 | $ | 24,958 | $ | 24,590 | $ | 92,855 | |||||||||
Interest expense | 3,028 | 4,222 | 4,336 | 4,142 | 15,728 | ||||||||||||||
Net interest income | 15,068 | 20,989 | 20,622 | 20,448 | 77,127 | ||||||||||||||
Provision for (recovery of) loan losses | 16 | (10 | ) | (12 | ) | 462 | 456 | ||||||||||||
Net interest income after provision for loan losses | 15,052 | 20,999 | 20,634 | 19,986 | 76,671 | ||||||||||||||
Noninterest income | 3,451 | 3,682 | 4,171 | 3,866 | 15,170 | ||||||||||||||
Noninterest expense | 10,929 | 26,316 | 13,792 | 15,037 | 66,074 | ||||||||||||||
Income before income taxes | 7,574 | (1,635 | ) | 11,013 | 8,815 | 25,767 | |||||||||||||
Income taxes | 1,571 | (405 | ) | 2,321 | 1,374 | 4,861 | |||||||||||||
Net income | $ | 6,003 | $ | (1,230 | ) | $ | 8,692 | $ | 7,441 | $ | 20,906 | ||||||||
Per common share: | |||||||||||||||||||
Net income - basic | $ | 0.69 | $ | (0.11 | ) | $ | 0.78 | $ | 0.67 | $ | 1.99 | ||||||||
Net income - diluted | 0.69 | (0.11 | ) | 0.78 | 0.67 | 1.98 | |||||||||||||
Cash dividends | 0.25 | 0.25 | 0.27 | 0.27 | 1.04 | ||||||||||||||
First | Second | Third | Fourth | ||||||||||||||||
2018 | Quarter | Quarter | Quarter | Quarter | Total | ||||||||||||||
Interest income | $ | 16,668 | $ | 16,992 | $ | 17,217 | $ | 17,891 | $ | 68,768 | |||||||||
Interest expense | 2,125 | 2,204 | 2,466 | 2,879 | 9,674 | ||||||||||||||
Net interest income | 14,543 | 14,788 | 14,751 | 15,012 | 59,094 | ||||||||||||||
Provision for (recovery of) loan losses | (44 | ) | (30 | ) | (23 | ) | (6 | ) | (103 | ) | |||||||||
Net interest income after provision for loan losses | 14,587 | 14,818 | 14,774 | 15,018 | 59,197 | ||||||||||||||
Noninterest income | 3,333 | 3,563 | 3,380 | 2,998 | 13,274 | ||||||||||||||
Noninterest expense | 10,702 | 11,002 | 10,904 | 11,638 | 44,246 | ||||||||||||||
Income before income taxes | 7,218 | 7,379 | 7,250 | 6,378 | 28,225 | ||||||||||||||
Income taxes | 1,406 | 1,399 | 1,465 | 1,376 | 5,646 | ||||||||||||||
Net income | $ | 5,812 | $ | 5,980 | $ | 5,785 | $ | 5,002 | $ | 22,579 | |||||||||
Per common share: | |||||||||||||||||||
Net income - basic | $ | 0.67 | $ | 0.69 | $ | 0.66 | $ | 0.57 | $ | 2.60 | |||||||||
Net income - diluted | 0.67 | 0.69 | 0.66 | 0.57 | 2.59 | ||||||||||||||
Cash dividends | 0.25 | 0.25 | 0.25 | 0.25 | 1.00 | ||||||||||||||
52

REPORT OF INDEPENDENT REGISTERED PUBLIC ACCOUNTING FIRM
To the Board of Directors and Shareholders
American National Bankshares Inc.
Danville, Virginia
Opinion on the Financial Statements
We have audited the accompanying consolidated balance sheets of American National Bankshares Inc. and Subsidiary (the Company) as of December 31, 2019 and 2018, the related consolidated statements of income, comprehensive income, changes in shareholders' equity and cash flows for each of the three years in the period ended December 31, 2019, and the related notes to the consolidated financial statements (collectively, the financial statements). In our opinion, the financial statements present fairly, in all material respects, the financial position of the Company as of December 31, 2019 and 2018, and the results of its operations and its cash flows for each of the three years in the period ended December 31, 2019, in conformity with accounting principles generally accepted in the United States of America.
We have also audited, in accordance with the standards of the Public Company Accounting Oversight Board (United States) (PCAOB), the Company's internal control over financial reporting as of December 31, 2019, based on criteria established in Internal Control - Integrated Framework issued by the Committee of Sponsoring Organizations of the Treadway Commission in 2013, and our report dated March 9, 2020 expressed an unqualified opinion on the effectiveness of the Company's internal control over financial reporting.
Basis for Opinion
These financial statements are the responsibility of the Company’s management. Our responsibility is to express an opinion on the Company’s financial statements based on our audits. We are a public accounting firm registered with the PCAOB and are required to be independent with respect to the Company in accordance with U.S. federal securities laws and the applicable rules and regulations of the Securities and Exchange Commission and the PCAOB.
We conducted our audits in accordance with the standards of the PCAOB. Those standards require that we plan and perform the audits to obtain reasonable assurance about whether the financial statements are free of material misstatement, whether due to error or fraud. Our audits included performing procedures to assess the risks of material misstatement of the financial statements, whether due to error or fraud, and performing procedures that respond to those risks. Such procedures included examining, on a test basis, evidence regarding the amounts and disclosures in the financial statements. Our audits also included evaluating the accounting principles used and significant estimates made by management, as well as evaluating the overall presentation of the financial statements. We believe that our audits provide a reasonable basis for our opinion.
/s/ Yount, Hyde & Barbour, P.C.
We have served as the Company's auditor since 2002.
Winchester, Virginia
March 9, 2020
53

REPORT OF INDEPENDENT REGISTERED PUBLIC ACCOUNTING FIRM
To the Board of Directors and Shareholders
American National Bankshares Inc.
Danville, Virginia
Opinion on the Internal Control over Financial Reporting
We have audited American National Bankshares Inc. and Subsidiary’s (the Company) internal control over financial reporting as of December 31, 2019, based on criteria established in Internal Control - Integrated Framework issued by the Committee of Sponsoring Organizations of the Treadway Commission in 2013. In our opinion, the Company maintained, in all material respects, effective internal control over financial reporting as of December 31, 2019, based on criteria established in Internal Control - Integrated Framework issued by the Committee of Sponsoring Organizations of the Treadway Commission in 2013.
We have also audited, in accordance with the standards of the Public Company Accounting Oversight Board (United States) (PCAOB), the consolidated balance sheets as of December 31, 2019 and 2018, the related consolidated statements of income, comprehensive income, changes in shareholders’ equity and cash flows for each of the three years in the period ended December 31, 2019, and the related notes to the consolidated financial statements of the Company and our report dated March 9, 2020 expressed an unqualified opinion.
Basis for Opinion
The Company’s management is responsible for maintaining effective internal control over financial reporting and for its assessment of the effectiveness of internal control over financial reporting in the accompanying Management’s Annual Report on Internal Control over Financial Reporting. Our responsibility is to express an opinion on the Company’s internal control over financial reporting based on our audit. We are a public accounting firm registered with the PCAOB and are required to be independent with respect to the Company in accordance with U.S. federal securities laws and the applicable rules and regulations of the Securities and Exchange Commission and the PCAOB.
We conducted our audit in accordance with the standards of the PCAOB. Those standards require that we plan and perform the audit to obtain reasonable assurance about whether effective internal control over financial reporting was maintained in all material respects. Our audit included obtaining an understanding of internal control over financial reporting, assessing the risk that a material weakness exists, and testing and evaluating the design and operating effectiveness of internal control based on the assessed risk. Our audit also included performing such other procedures as we considered necessary in the circumstances. We believe that our audit provides a reasonable basis for our opinion.
Definition and Limitations of Internal Control over Financial Reporting
A company's internal control over financial reporting is a process designed to provide reasonable assurance regarding the reliability of financial reporting and the preparation of financial statements for external purposes in accordance with generally accepted accounting principles. A company's internal control over financial reporting includes those policies and procedures that (1) pertain to the maintenance of records that, in reasonable detail, accurately and fairly reflect the transactions and dispositions of the assets of the company; (2) provide reasonable assurance that transactions are recorded as necessary to permit preparation of financial statements in accordance with generally accepted accounting principles, and that receipts and expenditures of the company are being made only in accordance with authorizations of management and directors of the company; and (3) provide reasonable assurance regarding prevention or timely detection of unauthorized acquisition, use or disposition of the company's assets that could have a material effect on the financial statements.
Because of its inherent limitations, internal control over financial reporting may not prevent or detect misstatements. Also, projections of any evaluation of effectiveness to future periods are subject to the risk that controls may become
54
inadequate because of changes in conditions, or that the degree of compliance with the policies or procedures may deteriorate.
/s/ Yount, Hyde & Barbour, P.C.
Winchester, Virginia
March 9, 2020
55
American National Bankshares Inc.
Consolidated Balance Sheets
As of December 31, 2019 and 2018
(Dollars in thousands, except per share data)
ASSETS | 2019 | 2018 | |||||
Cash and due from banks | $ | 32,505 | $ | 29,587 | |||
Interest-bearing deposits in other banks | 47,077 | 34,668 | |||||
Equity securities, at fair value | — | 1,830 | |||||
Securities available for sale, at fair value | 379,195 | 332,653 | |||||
Restricted stock, at cost | 8,630 | 5,247 | |||||
Loans held for sale | 2,027 | 640 | |||||
Loans, net of unearned income | 1,830,815 | 1,357,476 | |||||
Less allowance for loan losses | (13,152 | ) | (12,805 | ) | |||
Net loans | 1,817,663 | 1,344,671 | |||||
Premises and equipment, net | 39,848 | 26,675 | |||||
Other real estate owned, net of valuation allowance of $153 in 2019 and $109 in 2018 | 1,308 | 869 | |||||
Goodwill | 84,002 | 43,872 | |||||
Core deposit intangibles, net | 7,728 | 926 | |||||
Bank owned life insurance | 27,817 | 18,941 | |||||
Accrued interest receivable and other assets | 30,750 | 22,287 | |||||
Total assets | $ | 2,478,550 | $ | 1,862,866 | |||
LIABILITIES and SHAREHOLDERS' EQUITY | |||||||
Liabilities: | |||||||
Demand deposits -- noninterest bearing | $ | 578,606 | $ | 435,828 | |||
Demand deposits -- interest bearing | 328,015 | 234,621 | |||||
Money market deposits | 504,651 | 401,461 | |||||
Savings deposits | 177,505 | 132,360 | |||||
Time deposits | 471,770 | 361,957 | |||||
Total deposits | 2,060,547 | 1,566,227 | |||||
Customer repurchase agreements | 40,475 | 35,243 | |||||
Subordinated debt | 7,517 | — | |||||
Junior subordinated debt | 28,029 | 27,927 | |||||
Accrued interest payable and other liabilities | 21,724 | 10,927 | |||||
Total liabilities | 2,158,292 | 1,640,324 | |||||
Commitments and contingencies | |||||||
Shareholders' equity: | |||||||
Preferred stock, $5 par, 2,000,000 shares authorized, none outstanding | — | — | |||||
Common stock, $1 par, 20,000,000 shares authorized, 11,071,540 shares outstanding at December 31, 2019 and 8,720,337 shares outstanding at December 31, 2018 | 11,019 | 8,668 | |||||
Capital in excess of par value | 158,244 | 78,172 | |||||
Retained earnings | 151,478 | 141,537 | |||||
Accumulated other comprehensive loss, net | (483 | ) | (5,835 | ) | |||
Total shareholders' equity | 320,258 | 222,542 | |||||
Total liabilities and shareholders' equity | $ | 2,478,550 | $ | 1,862,866 | |||
The accompanying notes are an integral part of the consolidated financial statements.
56
American National Bankshares Inc.
Consolidated Statements of Income
For the Years Ended December 31, 2019, 2018, and 2017
(Dollars in thousands, except per share data)
2019 | 2018 | 2017 | |||||||||
Interest and Dividend Income: | |||||||||||
Interest and fees on loans | $ | 82,684 | $ | 59,966 | $ | 55,276 | |||||
Interest and dividends on securities: | |||||||||||
Taxable | 7,682 | 6,106 | 4,666 | ||||||||
Tax-exempt | 777 | 1,502 | 2,043 | ||||||||
Dividends | 451 | 321 | 319 | ||||||||
Other interest income | 1,261 | 873 | 734 | ||||||||
Total interest and dividend income | 92,855 | 68,768 | 63,038 | ||||||||
Interest Expense: | |||||||||||
Interest on deposits | 13,143 | 8,086 | 5,794 | ||||||||
Interest on short-term borrowings | 650 | 186 | 173 | ||||||||
Interest on long-term borrowings | 14 | — | 296 | ||||||||
Interest on subordinated debt | 367 | — | — | ||||||||
Interest on junior subordinated debt | 1,554 | 1,402 | 1,028 | ||||||||
Total interest expense | 15,728 | 9,674 | 7,291 | ||||||||
Net Interest Income | 77,127 | 59,094 | 55,747 | ||||||||
Provision for (recovery of) loan losses | 456 | (103 | ) | 1,016 | |||||||
Net Interest Income after Provision for (Recovery of) Loan Losses | 76,671 | 59,197 | 54,731 | ||||||||
Noninterest Income: | |||||||||||
Trust fees | 3,847 | 3,783 | 3,926 | ||||||||
Service charges on deposit accounts | 2,866 | 2,455 | 2,426 | ||||||||
Other fees and commissions | 3,693 | 2,637 | 2,471 | ||||||||
Mortgage banking income | 2,439 | 1,862 | 2,208 | ||||||||
Securities gains, net | 607 | 123 | 812 | ||||||||
Brokerage fees | 721 | 795 | 829 | ||||||||
Income from Small Business Investment Companies | 211 | 637 | 236 | ||||||||
Gains (losses) on premises and equipment, net | (427 | ) | 60 | 344 | |||||||
Other | 1,213 | 922 | 975 | ||||||||
Total noninterest income | 15,170 | 13,274 | 14,227 | ||||||||
Noninterest Expense: | |||||||||||
Salaries | 24,672 | 20,509 | 19,829 | ||||||||
Employee benefits | 5,343 | 4,370 | 4,274 | ||||||||
Occupancy and equipment | 5,417 | 4,378 | 4,487 | ||||||||
FDIC assessment | 119 | 537 | 538 | ||||||||
Bank franchise tax | 1,644 | 1,054 | 1,072 | ||||||||
Core deposit intangible amortization | 1,398 | 265 | 528 | ||||||||
Data processing | 2,567 | 1,691 | 2,014 | ||||||||
Software | 1,295 | 1,279 | 1,144 | ||||||||
Other real estate owned, net | 31 | 122 | 303 | ||||||||
Merger related expenses | 11,782 | 872 | — | ||||||||
Other | 11,806 | 9,169 | 8,694 | ||||||||
Total noninterest expense | 66,074 | 44,246 | 42,883 | ||||||||
Income Before Income Taxes | 25,767 | 28,225 | 26,075 | ||||||||
Income Taxes | 4,861 | 5,646 | 10,826 | ||||||||
Net Income | $ | 20,906 | $ | 22,579 | $ | 15,249 | |||||
Net Income Per Common Share: | |||||||||||
Basic | $ | 1.99 | $ | 2.60 | $ | 1.76 | |||||
Diluted | $ | 1.98 | $ | 2.59 | $ | 1.76 | |||||
Average Common Shares Outstanding: | |||||||||||
Basic | 10,531,572 | 8,698,014 | 8,641,717 | ||||||||
Diluted | 10,541,337 | 8,708,462 | 8,660,628 | ||||||||
The accompanying notes are an integral part of the consolidated financial statements.
57
American National Bankshares Inc.
Consolidated Statements of Comprehensive Income
For the Years Ended December 31, 2019, 2018, and 2017
(Dollars in thousands)
Year Ended December 31, | |||||||||||
2019 | 2018 | 2017 | |||||||||
Net income | $ | 20,906 | $ | 22,579 | $ | 15,249 | |||||
Other comprehensive income (loss): | |||||||||||
Unrealized gains (losses) on securities available for sale | 9,095 | (3,209 | ) | 35 | |||||||
Tax effect | (2,005 | ) | 745 | (12 | ) | ||||||
Reclassification adjustment for gain on sale or call of securities | (274 | ) | (81 | ) | (812 | ) | |||||
Tax effect | 59 | 18 | 284 | ||||||||
Unrealized losses on cash flow hedges | (1,854 | ) | (804 | ) | — | ||||||
Tax effect | 394 | 180 | — | ||||||||
Change in unfunded pension liability | (64 | ) | 1,291 | (234 | ) | ||||||
Tax effect | 1 | (249 | ) | 82 | |||||||
Other comprehensive income (loss) | 5,352 | (2,109 | ) | (657 | ) | ||||||
Comprehensive income | $ | 26,258 | $ | 20,470 | $ | 14,592 | |||||
58
American National Bankshares Inc.
Consolidated Statements of Changes in Shareholders' Equity
For the Years Ended December 31, 2019, 2018, and 2017
(Dollars in thousands except per share data)
Common Stock | Capital in Excess of Par Value | Retained Earnings | Accumulated Other Comprehensive Income (Loss) | Total Shareholders' Equity | |||||||||||||||
Balance, December 31, 2016 | $ | 8,578 | $ | 75,076 | $ | 119,600 | $ | (1,874 | ) | $ | 201,380 | ||||||||
Net income | — | — | 15,249 | — | 15,249 | ||||||||||||||
Other comprehensive loss | — | — | — | (657 | ) | (657 | ) | ||||||||||||
Reclass "stranded" tax effects from tax rate change | — | — | 545 | (545 | ) | — | |||||||||||||
Stock options exercised (4,950 shares) | 5 | 108 | — | — | 113 | ||||||||||||||
Vesting of restricted stock (8,116 shares) | 8 | (8 | ) | — | — | — | |||||||||||||
Equity based compensation (27,546 shares) | 13 | 1,003 | — | — | 1,016 | ||||||||||||||
Cash dividends paid, $0.97 per share | — | — | (8,384 | ) | — | (8,384 | ) | ||||||||||||
Balance, December 31, 2017 | 8,604 | 76,179 | 127,010 | (3,076 | ) | 208,717 | |||||||||||||
Net income | — | — | 22,579 | — | 22,579 | ||||||||||||||
Other comprehensive loss | — | — | — | (2,109 | ) | (2,109 | ) | ||||||||||||
Reclassification for ASU 2016-01 adoption | — | — | 650 | (650 | ) | — | |||||||||||||
Stock options exercised (35,310 shares) | 35 | 826 | — | — | 861 | ||||||||||||||
Vesting of restricted stock (12,712 shares) | 13 | (13 | ) | — | — | — | |||||||||||||
Equity based compensation (34,480 shares) | 16 | 1,180 | — | — | 1,196 | ||||||||||||||
Cash dividends paid, $1.00 per share | — | — | (8,702 | ) | — | (8,702 | ) | ||||||||||||
Balance, December 31, 2018 | 8,668 | 78,172 | 141,537 | (5,835 | ) | 222,542 | |||||||||||||
Net income | — | — | 20,906 | — | 20,906 | ||||||||||||||
Other comprehensive income | — | — | — | 5,352 | 5,352 | ||||||||||||||
Issuance of common stock (2,361,686 shares) | 2,362 | 80,108 | — | — | 82,470 | ||||||||||||||
Issuance of replacement options/restricted stock | — | 870 | — | — | 870 | ||||||||||||||
Stock repurchased (85,868 shares) | (86 | ) | (3,060 | ) | — | — | (3,146 | ) | |||||||||||
Stock options exercised (37,104 shares) | 37 | 651 | — | — | 688 | ||||||||||||||
Vesting of restricted stock (21,747 shares) | 22 | (22 | ) | — | — | — | |||||||||||||
Equity based compensation (38,281 shares) | 16 | 1,525 | — | — | 1,541 | ||||||||||||||
Cash dividends paid, $1.04 per share | — | — | (10,965 | ) | — | (10,965 | ) | ||||||||||||
Balance, December 31, 2019 | $ | 11,019 | $ | 158,244 | $ | 151,478 | $ | (483 | ) | $ | 320,258 | ||||||||
The accompanying notes are an integral part of the consolidated financial statements.
59
American National Bankshares Inc.
Consolidated Statements of Cash Flows
For the Years Ended December 31, 2019, 2018, and 2017
(Dollars in thousands)
2019 | 2018 | 2017 | |||||||||
Cash Flows from Operating Activities: | |||||||||||
Net income | $ | 20,906 | $ | 22,579 | $ | 15,249 | |||||
Adjustments to reconcile net income to net cash provided by operating activities: | |||||||||||
Provision for (recovery of) loan losses | 456 | (103 | ) | 1,016 | |||||||
Depreciation | 2,064 | 1,775 | 1,877 | ||||||||
Net accretion of acquisition accounting adjustments | (3,387 | ) | (1,288 | ) | (2,114 | ) | |||||
Core deposit intangible amortization | 1,398 | 265 | 528 | ||||||||
Net amortization of securities | 1,100 | 1,617 | 1,831 | ||||||||
Net gain on sale or call of securities available for sale | (274 | ) | (81 | ) | (812 | ) | |||||
Net change in fair value of equity securities | (333 | ) | (42 | ) | — | ||||||
Gain on sale of loans held for sale | (2,439 | ) | (1,862 | ) | (1,765 | ) | |||||
Proceeds from sales of loans held for sale | 103,760 | 80,600 | 92,733 | ||||||||
Originations of loans held for sale | (102,708 | ) | (77,739 | ) | (86,611 | ) | |||||
Net (gain) loss on other real estate owned | (120 | ) | 14 | 22 | |||||||
Valuation allowance on other real estate owned | 68 | 30 | 143 | ||||||||
Net (gain) loss on sale of premises and equipment | 427 | (60 | ) | (344 | ) | ||||||
Equity based compensation expense | 1,541 | 1,196 | 1,016 | ||||||||
Net change in bank owned life insurance | (630 | ) | (481 | ) | (297 | ) | |||||
Deferred income tax expense | 1,068 | 556 | 3,471 | ||||||||
Net change in interest receivable | 980 | (218 | ) | (148 | ) | ||||||
Net change in other assets | 10,157 | (100 | ) | (379 | ) | ||||||
Net change in interest payable | (574 | ) | 121 | 51 | |||||||
Net change in other liabilities | (780 | ) | 723 | 284 | |||||||
Net cash provided by operating activities | 32,680 | 27,502 | 25,751 | ||||||||
Cash Flows from Investing Activities: | |||||||||||
Proceeds from sales of equity securities | 445 | 431 | — | ||||||||
Proceeds from sales of securities available for sale | 29,878 | 57,607 | 55,903 | ||||||||
Proceeds from maturities, calls and paydowns of securities available for sale | 123,915 | 30,607 | 52,397 | ||||||||
Purchases of securities available for sale | (155,746 | ) | (106,575 | ) | (84,931 | ) | |||||
Net change in restricted stock | (795 | ) | 863 | 114 | |||||||
Net increase in loans | (26,257 | ) | (21,256 | ) | (170,515 | ) | |||||
Proceeds from sale of premises and equipment | — | 234 | 653 | ||||||||
Purchases of premises and equipment | (3,555 | ) | (2,723 | ) | (2,648 | ) | |||||
Proceeds from sales of other real estate owned | 1,289 | 911 | 1,171 | ||||||||
Cash paid in bank acquisition | (27 | ) | — | — | |||||||
Cash acquired in bank acquisition | 26,283 | — | — | ||||||||
Net cash used in investing activities | (4,570 | ) | (39,901 | ) | (147,856 | ) | |||||
Cash Flows from Financing Activities: | |||||||||||
Net change in demand, money market, and savings deposits | 41,968 | 53,202 | 159,283 | ||||||||
Net change in time deposits | (30,899 | ) | (21,701 | ) | 4,803 | ||||||
Net change in customer repurchase agreements | 5,232 | 24,517 | (28,440 | ) | |||||||
Net change in other short-term borrowings | (14,883 | ) | (24,000 | ) | 4,000 | ||||||
Net change in long-term borrowings | (778 | ) | — | (10,000 | ) | ||||||
Common stock dividends paid | (10,965 | ) | (8,702 | ) | (8,384 | ) | |||||
Repurchase of common stock | (3,146 | ) | — | — | |||||||
Proceeds from exercise of stock options | 688 | 861 | 113 | ||||||||
Net cash (used in) provided by financing activities | (12,783 | ) | 24,177 | 121,375 | |||||||
Net Increase (Decrease) in Cash and Cash Equivalents | 15,327 | 11,778 | (730 | ) | |||||||
Cash and Cash Equivalents at Beginning of Period | 64,255 | 52,477 | 53,207 | ||||||||
Cash and Cash Equivalents at End of Period | $ | 79,582 | $ | 64,255 | $ | 52,477 | |||||
The accompanying notes are an integral part of the consolidated financial statements.
60
American National Bankshares Inc.
Notes to Consolidated Financial Statements
December 31, 2019, 2018, and 2017
Note 1 – Summary of Significant Accounting Policies
Nature of Operations and Consolidation
The consolidated financial statements include the accounts of American National Bankshares Inc. (the "Company") and its wholly owned subsidiary, American National Bank and Trust Company (the "Bank"). The Bank offers a wide variety of retail, commercial, secondary market mortgage lending, and trust and investment services which also include non-deposit products such as mutual funds and insurance policies.
The preparation of consolidated financial statements in conformity with accounting principles generally accepted in the United States of America ("GAAP") requires management to make estimates and assumptions that affect the reported amounts of assets and liabilities and disclosure of contingent assets and liabilities at the date of the financial statements and the reported amounts of revenues and expenses during the reporting period. Actual results could differ from those estimates. Material estimates that are particularly susceptible to significant change in the near term relate to the determination of the allowance for loan losses, goodwill and intangible assets, other-than-temporary impairment of securities, accounting for merger and acquisition activity, accounting for acquired loans with specific credit-related deterioration, and the valuation of deferred tax assets and liabilities.
In April 2006, AMNB Statutory Trust I, a Delaware statutory trust (the "AMNB Trust") and an unconsolidated wholly owned subsidiary of the Company, was formed for the purpose of issuing preferred securities (the "Trust Preferred Securities") in a private placement pursuant to an applicable exemption from registration. Proceeds from the securities were used to fund the acquisition of Community First Financial Corporation ("Community First") which occurred in April 2006.
In July 2011, and in connection with its acquisition of MidCarolina Financial Corporation ("MidCarolina"), the Company assumed liabilities of MidCarolina Trust I and MidCarolina Trust II, two separate unconsolidated Delaware statutory trusts (the "MidCarolina Trusts"), which were also formed for the purpose of issuing preferred securities. Refer to Note 14 for further details concerning these entities.
All significant inter-company transactions and accounts are eliminated in consolidation, with the exception of the AMNB Trust and the MidCarolina Trusts, as detailed in Note 14.
Cash and Cash Equivalents
Cash includes cash on hand, cash with correspondent banks, and cash on deposit at the Federal Reserve Bank of Richmond. Cash equivalents are short-term, highly liquid investments that are readily convertible to cash with original maturities of three months or less and are subject to an insignificant risk of change in value. Cash and cash equivalents are carried at cost.
Interest-bearing Deposits in Other Banks
Interest-bearing deposits in other banks mature within one year and are carried at cost.
Securities
Certain debt securities that management has the positive intent and ability to hold to maturity are classified as "held to maturity" and recorded at amortized cost. Trading securities are recorded at fair value with changes in fair value included in earnings. Debt securities not classified as held to maturity or trading are classified as "available for sale" and recorded at fair value, with unrealized gains and losses excluded from earnings and reported in other comprehensive income. Purchase premiums and discounts are recognized in interest income using the interest method over the terms of the securities. Gains and losses on the sale of securities are recorded on the trade date and are determined using the specific identification method.
The Company does not currently have any securities in held to maturity or trading and has no plans to add any to either category. Management evaluates securities for other-than-temporary impairment ("OTTI") on at least a quarterly basis, and more frequently when economic or market conditions warrant such an evaluation. For securities in an unrealized loss position, management considers the extent and duration of the unrealized loss and the financial condition and near-term prospects of the issuer. Management also assesses whether it intends to sell, or it is more likely than not that it will be required to sell, a security in an unrealized loss position before recovery of its amortized cost basis. If either of the criteria regarding intent or requirement to sell is met, the entire difference between amortized cost and fair value is recognized as impairment through earnings. For
61
debt securities that do not meet the aforementioned criteria, the amount of impairment is split into two components as follows: (1) OTTI related to credit loss, which must be recognized in the income statement and, (2) OTTI related to other factors, which is recognized in other comprehensive income. The credit loss is defined as the difference between the present value of the cash flows expected to be collected and the amortized cost basis.
Equity securities with readily determinable fair values that are not held for trading are carried at fair value with the unrealized gains and losses included in noninterest income.
Due to the nature and restrictions placed on the Company's investment in common stock of the Federal Home Loan Bank of Atlanta ("FHLB") and the Federal Reserve Bank of Richmond, these securities have been classified as restricted equity securities and carried at cost.
Loans Held for Sale
Secondary market mortgage loans are designated as held for sale at the time of their origination. These loans are pre-sold with servicing released and the Company does not retain any interest after the loans are sold. These loans consist primarily of fixed-rate, single-family residential mortgage loans which meet the underwriting characteristics of certain government-sponsored enterprises (conforming loans). In addition, the Company requires a firm purchase commitment from a permanent investor before a loan can be committed, thus limiting interest rate risk. Loans held for sale are carried at fair value. Gains on sales of loans are recognized at the loan closing date and are included in noninterest income.
Derivative Loan Commitments
The Company enters into mortgage loan commitments whereby the interest rate on the loan is determined prior to funding (rate lock commitments). Mortgage loan commitments are referred to as derivative loan commitments if the loan that will result from exercise of the commitment will be held for sale upon funding. Loan commitments that are derivatives are recognized at fair value on the consolidated balance sheets with net changes in their fair values recorded in other expenses.
The period of time between issuance of a loan commitment and sale of the loan generally ranges from 30 to 60 days. The Company protects itself from changes in interest rates through the use of best efforts forward delivery contracts, by committing to sell a loan at the time the borrower commits to an interest rate with the intent that the buyer has assumed the interest rate risk on the loan. As a result, the Company is not generally exposed to significant losses nor will it realize significant gains related to its rate lock commitments due to changes in interest rates. The correlation between the rate lock commitments and the best efforts contracts is very high due to their similarity.
The fair value of rate lock commitments and best efforts contracts is not readily ascertainable with precision because rate lock commitments and best efforts contracts are not actively traded in stand-alone markets. The Company determines the fair value of rate lock commitments and best efforts contracts by measuring the change in the estimated value of the underlying assets while taking into consideration the probability that the loan will be funded.
Loans
The Company makes mortgage, commercial, and consumer loans. A substantial portion of the loan portfolio is secured by real estate. The ability of the Company's debtors to honor their contracts is dependent upon the real estate market and general economic conditions in the Company's market area.
Loans that management has the intent and ability to hold for the foreseeable future or until maturity or pay-off, generally are reported at their outstanding unpaid principal balance adjusted for the allowance for loan losses, and any deferred fees or costs. Interest income is accrued on the unpaid principal balance. Loan origination fees, net of certain direct origination costs, are deferred and recognized as an adjustment of the related loan yield using the interest method. The accrual of interest on loans is generally discontinued at the time the loan is 90 days delinquent unless the credit is well-secured and in process of collection. Loans are typically charged off when the loan is 120 days past due, unless secured and in process of collection. Loans are placed on nonaccrual status or charged-off at an earlier date if collection of principal or interest is considered doubtful.
Interest accrued but not collected for loans that are placed on nonaccrual status or charged-off is reversed against interest income. The interest on these loans is accounted for on the cash basis or cost recovery method, until qualifying for return to accrual status. Loans are returned to accrual status when all the principal and interest amounts contractually due are brought current and future payments are reasonably assured.
A loan is considered past due when a payment of principal or interest or both is due but not paid. Management closely monitors past due loans in timeframes of 30-59 days, 60-89 days, and 90 or more days past due.
62
These policies apply to all loan portfolio classes and segments.
Substandard and doubtful risk graded commercial, commercial real estate, and construction loans are reviewed for impairment. All troubled debt restructurings ("TDRs"), regardless of dollar amount, are also evaluated for impairment. A loan is considered impaired when, based on current information and events, it is probable that the Company will be unable to collect the scheduled payments of principal or interest when due according to the contractual terms of the loan agreement. Factors considered by management in determining impairment and establishing a specific allowance include payment status, collateral value, and the probability of collecting scheduled principal and interest payments when due. Loans that experience insignificant payment delays and payment shortfalls generally are not classified as impaired. Management determines the significance of payment delays and payment shortfalls on a case-by-case basis, taking into consideration all of the circumstances surrounding the loan and the borrower, including the length of the delay, the reasons for the delay, the borrower's prior payment record, and the amount of the shortfall in relation to the principal and interest owed. Impairment is measured on a loan-by-loan basis for commercial, commercial real estate, and construction loans by either the present value of expected future cash flows discounted at the loan's effective interest rate, the loan's obtainable market price, or the fair value of the collateral if the loan is collateral dependent.
Generally, large groups of smaller balance homogeneous loans (residential real estate and consumer loans) are collectively evaluated for impairment. The Company's policy for recognizing interest income on impaired loans is consistent with its nonaccrual policy.
The Company's loan portfolio is organized by major segment. These include: commercial, commercial real estate, residential real estate and consumer loans. Each segment has particular risk characteristics that are specific to the borrower and the generic category of credit. Commercial loan repayments are highly dependent on cash flows associated with the underlying business and its profitability. They can also be impacted by changes in collateral values. Commercial real estate loans share the same general risk characteristics as commercial loans, but are often more dependent on the value of the underlying real estate collateral and, when construction is involved, the ultimate completion of and sale of the project. Residential real estate loans are generally dependent on the value of collateral and the credit worthiness of the underlying borrower. Consumer loans are very similar in risk characteristics to residential real estate.
In connection with mergers, certain loans were acquired which exhibited deteriorated credit quality since origination and for which the Company does not expect to collect all contractual payments. These purchased credit impaired loans are accounted for in accordance with Accounting Standards Codification ("ASC") 310-30, Receivables - Loans and Debt Securities Acquired with Deteriorated Credit Quality, and are recorded at the amount paid, such that there is no carryover of the seller's allowance for loan losses. After acquisition, losses are recognized by an increase in the allowance for loan losses.
Such purchased credit impaired loans are accounted for individually or aggregated into pools of loans based on common risk characteristics such as, credit score, loan type, and date of origination. The Company estimates the amount and timing of expected cash flows for each loan or pool, and the expected cash flows in excess of amount paid is recorded as interest income over the remaining life of the loan or pool (accretable yield). The excess of the loan's or pool's contractual principal and interest over expected cash flows is not recorded (nonaccretable difference).
Over the life of the loan or pool, expected cash flows continue to be estimated. If the present value of expected cash flows is less than the carrying amount, a loss is recorded as a provision for loan losses. If the present value of expected cash flows is greater than the carrying amount, it is recognized as part of future interest income.
Troubled Debt Restructurings
In situations where, for economic or legal reasons related to a borrower's financial condition, management may grant a concession to the borrower that it would not otherwise consider, the related loan is classified as a TDR. Management strives to identify borrowers in financial difficulty early and work with them to modify their loan to more affordable terms before their loan reaches nonaccrual status. These modified terms may include rate reductions, principal forgiveness, payment forbearance and other actions intended to minimize the economic loss and to avoid foreclosure or repossession of the collateral. In cases where borrowers are granted new terms that provide for a reduction of either interest or principal, management measures any impairment on the restructuring as noted above for impaired loans. The Company has $1,058,000 in loans classified as TDRs as of December 31, 2019 and $1,090,000 as of December 31, 2018.
Allowance for Loan Losses
The purpose of the allowance for loan losses ("ALLL") is to provide for probable losses inherent in the loan portfolio. The allowance is increased by the provision for loan losses and by recoveries of previously charged-off loans. Loan charge-offs decrease the allowance.
63
The goal of the Company is to maintain an appropriate, systematic, and consistently applied process to determine the amounts of the ALLL and the provision for loan loss expense.
The Company uses certain practices to manage its credit risk. These practices include (1) appropriate lending limits for loan officers, (2) a loan approval process, (3) careful underwriting of loan requests, including analysis of borrowers, cash flows, collateral, and market risks, (4) regular monitoring of the portfolio, including diversification by type and geography, (5) review of loans by the Loan Review department, which operates independently of loan production (the Loan Review function consists of a co-sourced arrangement using both internal personnel and external vendors to provide the Company with a more robust review function of the loan portfolio), (6) regular meetings of the Credit Committees to discuss portfolio and policy changes and make decisions on large or unusual loan requests, and (7) regular meetings of the Asset Quality Committee which reviews the status of individual loans.
Risk grades are assigned as part of the loan origination process. From time to time risk grades may be modified as warranted by the facts and circumstances surrounding the credit.
Calculation and analysis of the allowance for loan losses is prepared quarterly by the Finance Department. The Company's Credit Committee, Risk and Compliance Committee, Audit Committee, and the Board of Directors review the allowance for adequacy.
The Company's allowance for loan losses has two basic components: the formula allowance and the specific allowance. Each of these components is determined based upon estimates and judgments.
The formula allowance uses historical loss experience as an indicator of future losses, along with various qualitative factors, including levels and trends in delinquencies, nonaccrual loans, charge-offs and recoveries, trends in volume and terms of loans, effects of changes in underwriting standards, experience of lending staff, economic conditions, and portfolio concentrations. In the formula allowance for commercial and commercial real estate loans, the historical loss rate is combined with the qualitative factors, resulting in an adjusted loss factor for each risk-grade category of loans. The period-end balances for each loan risk-grade category are multiplied by the adjusted loss factor. Allowance calculations for consumer loans are calculated based on historical losses for each product category without regard to risk grade. This loss rate is combined with qualitative factors resulting in an adjusted loss factor for each product category.
The specific allowance uses various techniques to arrive at an estimate of loss for specifically identified impaired loans. These include:
• | The present value of expected future cash flows discounted at the loan's effective interest rate. The effective interest rate on a loan is the rate of return implicit in the loan (that is, the contractual interest rate adjusted for any net deferred loan fees or costs and any premium or discount existing at the origination or acquisition of the loan); |
• | The loan's observable market price, or |
• | The fair value of the collateral, net of estimated costs to dispose, if the loan is collateral dependent. |
The use of these computed values is inherently subjective and actual losses could be greater or less than the estimates. No single statistic, formula, or measurement determines the adequacy of the allowance. Management makes subjective and complex judgments about matters that are inherently uncertain, and different amounts would be reported under different conditions or using different assumptions. For analytical purposes, management allocates a portion of the allowance to specific loan categories and specific loans. However, the entire allowance is used to absorb credit losses inherent in the loan portfolio, including identified and unidentified losses.
The relationships and ratios used in calculating the allowance, including the qualitative factors, may change from period to period as facts and circumstances evolve. Furthermore, management cannot provide assurance that in any particular period the Company will not have sizeable credit losses in relation to the amount reserved. Management may find it necessary to significantly adjust the allowance, considering current factors at the time.
Premises and Equipment
Land is carried at cost. Premises and equipment are stated at cost, less accumulated depreciation and amortization. Premises and equipment are depreciated over their estimated useful lives ranging from three years to thirty-nine years; leasehold improvements are amortized over the lives of the respective leases or the estimated useful lives of the improvements, whichever is less. Software is generally amortized over three years. Depreciation and amortization are recorded on the straight-line method.
64
Costs of maintenance and repairs are charged to expense as incurred. Costs of replacing structural parts of major units are considered individually and are expensed or capitalized as the facts dictate. Gains and losses on routine dispositions are reflected in current operations.
Goodwill and Intangible Assets
Goodwill is subject to at least an annual assessment for impairment by applying a fair value based test. Additionally, acquired intangible assets (such as core deposit intangibles) are separately recognized if the benefit of the assets can be sold, transferred, licensed, rented, or exchanged, and amortized over their useful lives. Intangible assets related to branch transactions continued to amortize. The cost of purchased deposit relationships and other intangible assets, based on independent valuation, are being amortized over their estimated lives ranging from eight to ten years.
The Company records as goodwill the excess of purchase price over the fair value of the identifiable net assets acquired. Impairment testing is performed annually, as well as when an event triggering impairment may have occurred. The Company performs its annual analysis as of June 30 each fiscal year. Accounting guidance permits preliminary assessment of qualitative factors to determine whether more substantial impairment testing is required. The Company chose to bypass the preliminary assessment and utilized a two-step process for impairment testing of goodwill. The first step tests for impairment, while the second step, if necessary, measures the impairment. No indicators of impairment were identified during the years ended December 31, 2019, 2018, or 2017.
Trust Assets
Securities and other property held by the trust and investment services segment in a fiduciary or agency capacity are not assets of the Company and are not included in the accompanying consolidated financial statements.
Other Real Estate Owned
OREO represents real estate that has been acquired through loan foreclosures or deeds received in lieu of loan payments. Generally, such properties are appraised at the time acquired, and are recorded at fair value less estimated selling costs. Subsequent to foreclosure, valuations are periodically performed by management and the assets are carried at the lower of carrying amount or fair value less cost to sell. Revenue and expenses from operations and changes in the valuation allowance are included in noninterest expense.
Bank Owned Life Insurance
In connection with mergers, the Company has acquired bank owned life insurance ("BOLI"). The asset is reflected as the cash surrender value of the policies as provided by the insurer on a monthly basis.
Transfers of Financial Assets
Transfers of financial assets are accounted for as sales, when control over the assets has been surrendered. Control over transferred assets is deemed to be surrendered when (1) the assets have been isolated from the Company – put presumptively beyond reach of the transferor and its creditors, even in bankruptcy or other receivership, (2) the transferee obtains the right (free of conditions that constrain it from taking advantage of that right) to pledge or exchange the transferred assets, and (3) the Company does not maintain effective control over the transferred assets through an agreement to repurchase them before their maturity or the ability to unilaterally cause the holder to return specific assets.
Income Taxes
The Company uses the balance sheet method to account for deferred income tax assets and liabilities. Under this method, the net deferred tax asset or liability is determined based on the tax effects of the temporary differences between the book and tax bases of the various balance sheet assets and liabilities and gives current recognition to changes in tax rates and laws.
When tax returns are filed, it is highly certain that some positions taken would be sustained upon examination by the taxing authorities, while others are subject to uncertainty about the merits of the position taken or the amount of the position that would be ultimately sustained. The benefit of a tax position is recognized in the financial statements in the period during which, based on all available evidence, management believes it is more likely than not that the position will be sustained upon examination, including the resolution of appeals or litigation processes, if any. Tax positions taken are not offset or aggregated with other positions. Tax positions that meet the more-likely-than-not recognition threshold are measured as the largest amount of tax benefit that is more than 50 percent likely of being realized upon settlement with the applicable taxing authority. The portion of the benefits associated with tax positions taken that exceeds the amount measured as described above is reflected as a liability for unrecognized tax benefits in the accompanying consolidated balance sheet along with any associated interest and
65
penalties that would be payable to the taxing authorities upon examination. The Company had no liability for unrecognized tax benefits as of December 31, 2019 and 2018.
Stock-Based Compensation
Stock compensation accounting guidance ASC 718, Compensation - Stock Compensation, requires that the compensation cost relating to share-based payment transactions be recognized in financial statements. That cost will be measured based on the grant date fair value of the equity or liability instruments issued. The stock compensation accounting guidance covers a wide range of share-based compensation arrangements including stock options, restricted share plans, performance-based awards, share appreciation rights, and employee share purchase plans.
The stock compensation accounting guidance requires that compensation cost for all stock awards be calculated and recognized over the employees' service period, generally defined as the vesting period. For awards with graded-vesting, compensation cost is recognized on a straight-line basis over the requisite service period for the entire award. A Black-Scholes model is used to estimate the fair value of stock options, while the market price of the Company's common stock at the date of grant is used for restricted stock awards.
Earnings Per Common Share
Basic earnings per common share represent income available to common shareholders divided by the average number of common shares outstanding during the period. Diluted earnings per common share reflect the impact of additional common shares that would have been outstanding if dilutive potential common shares had been issued, as well as any adjustment to income that would result from the assumed issuance. Potential common shares that may be issued by the Company consist solely of outstanding stock options, and are determined using the treasury method. Nonvested shares of restricted stock are included in the computation of basic earnings per share because the holder has voting rights and shares in non-forfeitable dividends during the vesting period.
Comprehensive Income
Comprehensive income is shown in a two statement approach; the first statement presents total net income and its components followed by a second statement that presents all the components of other comprehensive income which include unrealized gains and losses on available for sale securities, unrealized gains and losses on cash flow hedges, and changes in the funded status of the defined benefit postretirement plan.
In February 2018, the Financial Accounting Standards Board ("FASB") issued Accounting Standards Update ("ASU") No. 2018-02, Reclassification of Certain Tax Effects from Accumulated Other Comprehensive Income ("AOCI"). The Company early adopted this new standard as of December 31, 2017. ASU 2018-02 requires reclassification from AOCI to retained earnings for "stranded" tax effects resulting from the impact of the newly enacted federal corporate income tax rate on items included in AOCI. The amount of this reclassification in 2017 was $545,000 and is reflected in the Consolidated Statements of Changes in Shareholders' equity.
Advertising and Marketing Costs
Advertising and marketing costs are expensed as incurred, and were $473,000, $365,000, and $352,000 in 2019, 2018, and 2017, respectively.
Mergers and Acquisitions
Business combinations are accounted for under ASC 805, Business Combinations, using the acquisition method of accounting. The acquisition method of accounting requires an acquirer to recognize the assets acquired and the liabilities assumed at the acquisition date measured at their fair values as of that date. To determine the fair values, the Company relies on third party valuations, such as appraisals, or internal valuations based on discounted cash flow analyses or other valuation techniques. Under the acquisition method of accounting, the Company identifies the acquirer and the closing date and applies applicable recognition principles and conditions. Acquisition-related costs are costs the Company incurs to effect a business combination. Those costs include advisory, legal, accounting, valuation, and other professional or consulting fees. Some other examples of costs to the Company include systems conversions, integration planning consultants and advertising costs. The Company accounts for acquisition-related costs as expenses in the periods in which the costs are incurred and the services are received, with one exception. The costs to issue debt or equity securities is recognized in accordance with other applicable GAAP. These acquisition-related costs have been and will be included within the consolidated statements of income classified within the noninterest expense caption.
66
Derivative Financial Instruments
The Company uses derivatives primarily to manage risk associated with changing interest rates. The Company's derivative financial instruments consist of interest rate swaps that qualify as cash flow hedges of the Company's trust preferred capital notes. The Company recognizes derivative financial instruments at fair value as either an other asset or other liability in the consolidated balance sheets. The effective portion of the gain or loss on the Company's cash flow hedges is reported as a component of other comprehensive income, net of deferred income taxes, and is reclassified into earnings in the same period or periods during which the hedged transactions affect earnings.
Reclassifications
Certain reclassifications have been made in prior years financial statements to conform to classifications used in the current year. There were no material reclassifications.
Adoption of New Accounting Standards
On January 1, 2019, the Company adopted ASU 2016-02, "Leases (Topic 842)." Among other things, in the amendments in ASU 2016-02, lessees are required to recognize the following for all leases (with the exception of short-term leases) at the commencement date: (i) a lease liability, which is a lessee's obligation to make lease payments arising from a lease, measured on a discounted basis; and (ii) a right-of-use asset, which is an asset that represents the lessee's right to use, or control the use of, a specified asset for the lease term. Under the new guidance, lessor accounting is largely unchanged. Certain targeted improvements were made to align, where necessary, lessor accounting with the lessee accounting model and Topic 606, Revenue from Contracts with Customers. Lessees (for capital and operating leases) and lessors (for sales-type, direct financing, and operating leases) must apply a modified retrospective transition approach for leases existing at, or entered into after, the beginning of the earliest comparative period presented in the financial statements. The modified retrospective approach would not require any transition accounting for leases that expired before the earliest comparative period presented. Lessees and lessors may not apply a full retrospective transition approach. The FASB made subsequent amendments to Topic 842 in July 2018 through ASU 2018-10 ("Codification Improvements to Topic 842, Leases.") and ASU 2018-11 ("Leases (Topic 842): Targeted Improvements."). Among these amendments is the provision in ASU 2018-11 that provides entities with an additional (and optional) transition method to adopt the new leases standard. Under this new transition method, an entity initially applies the new leases standard at the adoption date and recognizes a cumulative-effect adjustment to the opening balance of retained earnings in the period of adoption. Consequently, an entity's reporting for the comparative periods presented in the financial statements in which it adopts the new leases standard continue to be in accordance with current GAAP (Topic 840, Leases). The Company adopted the standard using the additional (and optional) transition method. The effect of adopting this standard on January 1, 2019 was an approximately $4.4 million increase in assets and liabilities on the Company's consolidated balance sheet.
Recent Accounting Pronouncements
In June 2016, the FASB issued ASU 2016-13, "Financial Instruments - Credit Losses (Topic 326): Measurement of Credit Losses on Financial Instruments." The amendments in this ASU, among other things, require the measurement of all expected credit losses for financial assets held at the reporting date based on historical experience, current conditions, and reasonable and supportable forecasts. Financial institutions and other organizations will now use forward-looking information to better inform their credit loss estimates. Many of the loss estimation techniques applied today will still be permitted, although the inputs to those techniques will change to reflect the full amount of expected credit losses. In addition, the ASU amends the accounting for credit losses on available-for-sale debt securities and purchased financial assets with credit deterioration. For public business entities that qualify as smaller reporting companies under U.S. Securities and Exchange Commission ("SEC") rules, including the Company, the standard is effective for fiscal years, and interim periods within those years, beginning after December 15, 2022. The Company has elected to defer adoption of ASU 2016-13 until January 1, 2023. The Company has implemented a program for the new standard and is running concurrent models with the assistance of an outside vendor. We will update both models quarterly until the required implementation. The Company is currently assessing the impact that ASU 2016-13 will have on its consolidated financial statements.
In January 2017, the FASB issued ASU 2017-04, "Intangibles - Goodwill and Other (Topic 350): Simplifying the Test for Goodwill Impairment". The amendments in this ASU simplify how an entity is required to test goodwill for impairment by eliminating Step 2 from the goodwill impairment test. Step 2 measures a goodwill impairment loss by comparing the implied fair value of a reporting unit’s goodwill with the carrying amount of that goodwill. Instead, under the amendments in this ASU, an entity should perform its annual, or interim, goodwill impairment test by comparing the fair value of a reporting unit with its carrying amount. An entity still has the option to perform the qualitative assessment for a reporting unit to determine if the quantitative impairment test is necessary. Public business entities that are SEC filers must adopt the amendments in this ASU for annual or interim goodwill impairment tests in fiscal years beginning after December 15, 2019. Early adoption is permitted
67
for interim or annual goodwill impairment tests performed on testing dates after January 1, 2017. The Company does not expect the adoption of ASU 2017-04 to have a material impact on its consolidated financial statements.
In August 2018, the FASB issued ASU 2018-13, "Fair Value Measurement (Topic 820): Disclosure Framework - Changes to the Disclosure Requirements for Fair Value Measurement." The amendments in this ASU modify the disclosure requirements in Topic 820 to add disclosures regarding changes in unrealized gains and losses, the range and weighted average of significant unobservable inputs used to develop Level 3 fair value measurements and the narrative description of measurement uncertainty. Certain disclosure requirements in Topic 820 are also removed or modified. The amendments are effective for fiscal years beginning after December 15, 2019, and interim periods within those fiscal years. Certain of the amendments are to be applied prospectively while others are to be applied retrospectively. Early adoption is permitted. The Company does not expect the adoption of ASU 2018-13 to have a material impact on its consolidated financial statements.
In August 2018, the FASB issued ASU 2018-14, "Compensation-Retirement Benefits-Defined Benefit Plans-General (Subtopic 715-20): Disclosure Framework - Changes to the Disclosure Requirements for Defined Benefit Plans." The amendments in this ASU modify the disclosure requirements for employers that sponsor defined benefit pension or other postretirement plans. Certain disclosure requirements have been deleted while the following disclosure requirements have been added: the weighted-average interest crediting rates for cash balance plans and other plans with promised interest crediting rates and an explanation of the reasons for significant gains and losses related to changes in the benefit obligation for the period. The amendments also clarify the disclosure requirements in paragraph 715-20-50-3, which state that the following information for defined benefit pension plans should be disclosed: the projected benefit obligation ("PBO") and fair value of plan assets for plans with PBOs in excess of plan assets and the accumulated benefit obligation ("ABO") and fair value of plan assets for plans with ABOs in excess of plan assets. The amendments are effective for fiscal years ending after December 15, 2020. Early adoption is permitted. The Company does not expect the adoption of ASU 2018-14 to have a material impact on its consolidated financial statements.
In April 2019, the FASB issued ASU 2019-04, "Codification Improvements to Topic 326, Financial Instruments-Credit Losses, Topic 815, Derivatives and Hedging, and Topic 825, Financial Instruments." This ASU clarifies and improves areas of guidance related to the recently issued standards on credit losses, hedging, and recognition and measurement including improvements resulting from various Transition Resource Group meetings. The effective date of each of the amendments depends on the adoption date of ASU 2016-1, ASU 2016-03, and ASU 2017-12. The Company is currently assessing the impact that ASU 2019-04 will have on its consolidated financial statements.
In May 2019, the FASB issued ASU 2019-05, "Financial Instruments-Credit Losses (Topic 326): Targeted Transition Relief." The amendments in this ASU provide entities that have certain instruments within the scope of Subtopic 326-20 with an option to irrevocably elect the fair value option in Subtopic 825-10, applied on an instrument-by-instrument basis for eligible instruments, upon the adoption of Topic 326. The fair value option election does not apply to held-to-maturity debt securities. An entity that elects the fair value option should subsequently measure those instruments at fair value with changes in fair value flowing through earnings. The effective date and transition methodology for the amendments in ASU 2019-05 are the same as in ASU 2016-13. The Company is currently assessing the impact that ASU 2019-05 will have on its consolidated financial statements.
In November 2019, the FASB issued ASU 2019-11, "Codification Improvements to Topic 326, Financial Instruments - Credit Losses." This ASU addresses issues raised by stakeholders during the implementation of ASU No. 2016-13, "Financial Instruments-Credit Losses (Topic 326): Measurement of Credit Losses on Financial Instruments." Among other narrow-scope improvements, the new ASU clarifies guidance around how to report expected recoveries. "Expected recoveries" describes a situation in which an organization recognizes a full or partial write-off of the amortized cost basis of a financial asset, but then later determines that the amount written off, or a portion of that amount, will in fact be recovered. While applying the credit losses standard, stakeholders questioned whether expected recoveries were permitted on assets that had already shown credit deterioration at the time of purchase (also known as PCD assets). In response to this question, the ASU permits organizations to record expected recoveries on PCD assets. In addition to other narrow technical improvements, the ASU also reinforces existing guidance that prohibits organizations from recording negative allowances for available-for-sale debt securities. The ASU includes effective dates and transition requirements that vary depending on whether or not an entity has already adopted ASU 2016-13. The Company is currently assessing the impact that ASU 2019-11 will have on its consolidated financial statements.
In December 2019, the FASB issued ASU 2019-12, "Income Taxes (Topic 740) - Simplifying the Accounting for Income Taxes." The ASU is expected to reduce cost and complexity related to the accounting for income taxes by removing specific exceptions to general principles in Topic 740 (eliminating the need for an organization to analyze whether certain exceptions apply in a given period) and improving financial statement preparers' application of certain income tax-related guidance. This ASU is part of the FASB's simplification initiative to make narrow-scope simplifications and improvements to accounting
68
standards through a series of short-term projects. For public business entities, the amendments are effective for fiscal years beginning after December 15, 2020, and interim periods within those fiscal years. Early adoption is permitted. The Company is currently assessing the impact that ASU 2019-12 will have on its consolidated financial statements.
In January 2020, the FASB issued ASU 2020-01, "Investments - Equity Securities (Topic 321), Investments - Equity Method and Joint Ventures (Topic 323), and Derivatives and Hedging (Topic 815) - Clarifying the Interactions between Topic 321, Topic 323, and Topic 815." The ASU is based on a consensus of the Emerging Issues Task Force and is expected to increase comparability in accounting for these transactions. ASU 2016-01 made targeted improvements to accounting for financial instruments, including providing an entity the ability to measure certain equity securities without a readily determinable fair value at cost, less any impairment, plus or minus changes resulting from observable price changes in orderly transactions for the identical or a similar investment of the same issuer. Among other topics, the amendments clarify that an entity should consider observable transactions that require it to either apply or discontinue the equity method of accounting. For public business entities, the amendments in the ASU are effective for fiscal years beginning after December 15, 2020, and interim periods within those fiscal years. Early adoption is permitted. The Company does not expect the adoption of ASU 2020-01 to have a material impact on its consolidated financial statements.
Effective November 25, 2019, the SEC adopted Staff Accounting Bulletin ("SAB") 119. SAB 119 updated portions of SEC interpretative guidance to align with FASB ASC 326, "Financial Instruments - Credit Losses." It covers topics including (1) measuring current expected credit losses; (2) development, governance, and documentation of a systematic methodology; (3) documenting the results of a systematic methodology; and (4) validating a systematic methodology.
Note 2 - Acquisitions
On April 1, 2019, the Company completed its acquisition of Roanoke-based HomeTown Bankshares Corporation ("HomeTown") and its wholly-owned subsidiary bank, HomeTown Bank. Pursuant and subject to the terms of the merger agreement, as a result of the merger, the holders of shares of HomeTown common stock received 0.4150 shares of the Company's common stock for each share of HomeTown common stock held immediately prior to the effective date of the merger.
The transaction was accounted for using the acquisition method of accounting and, accordingly, assets acquired, liabilities assumed, and consideration exchanged were recorded at estimated fair values on the acquisition date. Fair values are preliminary and subject to refinement for up to one year after the closing date of the acquisition, in accordance with ASC 350, Intangibles-Goodwill and Other.
69
The following table provides a preliminary assessment of the consideration transferred, assets acquired, and liabilities assumed as of the date of the acquisition (dollars in thousands):
Consideration Paid: | |||
Common shares issued (2,361,686) | $ | 82,470 | |
Issuance of replacement stock options/restricted stock | 753 | ||
Cash paid in lieu of fractional shares | 27 | ||
Value of consideration | 83,250 | ||
Assets acquired: | |||
Cash and cash equivalents | 26,283 | ||
Investment securities | 34,876 | ||
Restricted stock | 2,588 | ||
Loans | 444,324 | ||
Premises and equipment | 12,554 | ||
Deferred income taxes | 2,960 | ||
Core deposit intangible | 8,200 | ||
Other real estate owned | 1,442 | ||
Banked owned life insurance | 8,246 | ||
Other assets | 14,244 | ||
Total assets | 555,717 | ||
Liabilities assumed: | |||
Deposits | 483,626 | ||
Short-term FHLB advances | 14,883 | ||
Long-term FHLB advances | 778 | ||
Subordinated debt | 7,530 | ||
Other liabilities | 5,780 | ||
Total liabilities | 512,597 | ||
Net assets acquired | 43,120 | ||
Goodwill resulting from merger with HomeTown | $ | 40,130 | |
The following table details the changes in fair value of net assets acquired and liabilities assumed from the amounts reported in the Form 10-Q for the quarterly period ended September 30, 2019 (dollars in thousands):
Goodwill at September 30, 2019 | $ | 40,761 | |
Effect of adjustments to deferred income taxes | (631 | ) | |
Goodwill at December 31, 2019 | $ | 40,130 | |
The decrease in goodwill made during the fourth quarter of 2019 was due to a revaluation of deferred income taxes after the filing of HomeTown's final income tax return.
The acquired loans were recorded at fair value at the acquisition date without carryover of HomeTown's previously established allowance for loan losses. The fair value of the loans was determined using market participant assumptions in estimating the amount and timing of both principal and interest cash flows expected to be collected on the loans and leases and then applying a market-based discount rate to those cash flows. In this regard, the acquired loans were segregated into pools based on loan type and credit risk. Loan type was determined based on collateral type, purpose, and lien position. Credit risk characteristics included risk rating groups (pass rated loans and adversely classified loans) and past due status. For valuation purposes, these pools were further disaggregated by maturity, pricing characteristics (e.g., fixed-rate, adjustable-rate) and re-payment structure (e.g., interest only, fully amortizing, balloon). If new information is obtained about expected cash flows that existed as of the acquisition date, management will adjust fair values in accordance with accounting for business combinations.
70
The acquired loans were divided into loans with evidence of credit quality deterioration, which are accounted for under ASC 310-30, Receivables - Loans and Debt Securities Acquired with Deteriorated Credit Quality (acquired impaired), and loans that do not meet these criteria, which are accounted for under ASC 310-20, Receivables - Nonrefundable Fees and Other Costs (acquired performing).
The following table presents the acquired impaired loans receivable at the acquisition date (dollars in thousands):
Contractually required principal and interest at acquisition | $ | 45,551 | |
Contractual cash flows not expected to be collected (nonaccretable difference) | 8,296 | ||
Expected cash flows at acquisition | 37,255 | ||
Interest component of expected cash flows (accretable yield) | 4,410 | ||
Fair value of acquired loans accounted for under FASB ASC 310-30 | $ | 32,845 | |
Direct costs related to the acquisition were expensed as incurred. During the year ended December 31, 2019, the Company incurred $11.8 million in merger and acquisition integration expenses related to the merger, including $9.1 million in data processing termination and conversion costs, $1.7 million in legal and professional fees, $0.4 million in salary related expense, and $0.6 million in other noninterest expenses. The majority of these expenses were related to integration and are deductible for tax purposes.
The following table presents unaudited pro forma information as if the acquisition of HomeTown had occurred on January 1, 2018. These results combine the historical results of HomeTown in the Company's Consolidated Statements of Income and, while certain adjustments were made for the estimated impact of certain fair value adjustments and other acquisition-related activity, they are not indicative of what would have occurred had the acquisition taken place on January 1, 2018. In particular, no adjustments have been made to eliminate the amount of HomeTown's provision for credit losses that would not have been necessary had the acquired loans been recorded at fair value as of January 1, 2018. Pro forma adjustments below include the net impact of accretion for 2018 and the elimination of merger-related costs for 2019. The Company expects to achieve further operating cost savings and other business synergies as a result of the acquisition which are not reflected in the pro forma amounts below (dollars in thousands, except per share data):
(1) Includes net interest income and noninterest income.
Pro forma Years Ended December 31, | |||||||
2019 | 2018 | ||||||
Total revenues (1) | $ | 95,178 | $ | 98,232 | |||
Net income | $ | 29,841 | $ | 27,974 | |||
Earnings per share | $ | 2.70 | $ | 2.52 | |||
Note 3 – Restrictions on Cash
The Company is a member of the Federal Reserve System and is required to maintain certain levels of its cash and cash equivalents as reserves based on regulatory requirements. The gross reserve requirement with the Federal Reserve Bank of Richmond was $14.4 million and $3.0 million at December 31, 2019 and 2018, respectively. The required balance to be maintained with the Federal Reserve Bank of Richmond was $2.6 million and zero at December 31, 2019 and December 31, 2018, respectively.
The Company maintains cash accounts in other commercial banks. The amount on deposit with correspondent institutions at December 31, 2019 exceeded the insurance limits of the Federal Deposit Insurance Corporation by $678,000.
71
Note 4 - Securities
The amortized cost and estimated fair value of investments in securities at December 31, 2019 and 2018 were as follows (dollars in thousands):
December 31, 2019 | |||||||||||||||
Amortized Cost | Unrealized Gains | Unrealized Losses | Fair Value | ||||||||||||
Securities available for sale: | |||||||||||||||
U.S. Treasury | $ | 14,992 | $ | — | $ | 5 | $ | 14,987 | |||||||
Federal agencies and GSEs | 126,829 | 1,504 | 219 | 128,114 | |||||||||||
Mortgage-backed and CMOs | 182,732 | 1,901 | 393 | 184,240 | |||||||||||
State and municipal | 41,427 | 769 | 42 | 42,154 | |||||||||||
Corporate | 9,514 | 186 | — | 9,700 | |||||||||||
Total securities available for sale | $ | 375,494 | $ | 4,360 | $ | 659 | $ | 379,195 | |||||||
The Company adopted ASU 2016-01 effective January 1, 2018 and had no equity securities at December 31, 2019 and recognized in income $333,000 of unrealized holding gains during 2019. During the year ended December 31, 2019, the Company sold $445,000 in equity securities at fair value.
December 31, 2018 | |||||||||||||||
Amortized Cost | Unrealized Gains | Unrealized Losses | Fair Value | ||||||||||||
Securities available for sale: | |||||||||||||||
Federal agencies and GSEs | $ | 137,070 | $ | 442 | $ | 3,473 | $ | 134,039 | |||||||
Mortgage-backed and CMOs | 113,883 | 385 | 2,401 | 111,867 | |||||||||||
State and municipal | 80,022 | 411 | 531 | 79,902 | |||||||||||
Corporate | 6,799 | 68 | 22 | 6,845 | |||||||||||
Total securities available for sale | $ | 337,774 | $ | 1,306 | $ | 6,427 | $ | 332,653 | |||||||
The amortized cost and estimated fair value of investments in debt securities at December 31, 2019, by contractual maturity, are shown in the following table. Expected maturities will differ from contractual maturities because borrowers may have the right to call or prepay obligations with or without call or prepayment penalties. Because mortgage-backed securities have both known principal repayment terms as well as unknown principal repayments due to potential borrower pre-payments, it is difficult to accurately predict the final maturity of these investments. Mortgage-backed securities are shown separately (dollars in thousands):
Available for Sale | |||||||
Amortized Cost | Fair Value | ||||||
Due in one year or less | $ | 41,234 | $ | 41,207 | |||
Due after one year through five years | 51,039 | 51,814 | |||||
Due after five years through ten years | 56,537 | 57,763 | |||||
Due after ten years | 43,952 | 44,171 | |||||
Mortgage-backed and CMOs | 182,732 | 184,240 | |||||
$ | 375,494 | $ | 379,195 | ||||
72
Gross realized gains and losses on and the proceeds from the sale of securities available for sale were as follows (dollars in thousands):
For the Years Ended December 31, | |||||||||||
2019 | 2018 | 2017 | |||||||||
Gross realized gains | $ | 328 | $ | 342 | $ | 825 | |||||
Gross realized losses | (54 | ) | (261 | ) | (13 | ) | |||||
Proceeds from sales of securities | 29,878 | 57,607 | 55,903 | ||||||||
Securities with a carrying value of approximately $179,852,000 and $143,064,000 at December 31, 2019 and 2018, respectively, were pledged to secure public deposits, repurchase agreements, and for other purposes as required by law. FHLB letters of credit were used as additional collateral in the amounts of $170,000,000 at December 31, 2019 and $190,250,000 at December 31, 2018.
Temporarily Impaired Securities
The following table shows estimated fair value and gross unrealized losses, aggregated by investment category and length of time that individual securities have been in a continuous unrealized loss position, at December 31, 2019. The reference point for determining when securities are in an unrealized loss position is month-end. Therefore, it is possible that a security's market value exceeded its amortized cost on other days during the past twelve-month period.
Available for sale securities that have been in a continuous unrealized loss position are as follows (dollars in thousands):
Total | Less than 12 Months | 12 Months or More | |||||||||||||||||||||
Fair Value | Unrealized Loss | Fair Value | Unrealized Loss | Fair Value | Unrealized Loss | ||||||||||||||||||
U.S. Treasury | $ | 14,987 | $ | 5 | $ | 14,987 | $ | 5 | $ | — | $ | — | |||||||||||
Federal agencies and GSEs | 69,095 | 219 | 31,779 | 44 | 37,316 | 175 | |||||||||||||||||
Mortgage-backed and CMOs | 89,391 | 393 | 66,324 | 266 | 23,067 | 127 | |||||||||||||||||
State and municipal | 4,262 | 42 | 3,108 | 37 | 1,154 | 5 | |||||||||||||||||
Total | $ | 177,735 | $ | 659 | $ | 116,198 | $ | 352 | $ | 61,537 | $ | 307 | |||||||||||
U.S. Treasury: The unrealized loss associated with one U.S. Treasury bill is due to normal market fluctuations. The contractual cash flows of this investment are guaranteed by the U.S. Government. Accordingly, it is expected that this security would not be settled at a price less than the amortized cost basis of the Company's investment. Because the decline in fair value is attributable to changes in interest rates and not credit quality, and because the Company does not intend to sell the investment and it is not more likely than not that the Company will be required to sell the investment before recovery of its amortized cost basis, which may be maturity, the Company does not consider this investment to be other-than-temporarily impaired at December 31, 2019.
Federal agencies and GSEs: The unrealized losses on the Company's investment in 26 government sponsored entities ("GSEs") were caused by interest rate increases. The contractual terms of those investments do not permit the issuer to settle the securities at a price less than the amortized cost bases of the investments. Because the Company does not intend to sell the investments and it is not more likely than not that the Company will be required to sell the investments before recovery of their amortized cost bases, which may be maturity, the Company does not consider those investments to be other-than-temporarily impaired at December 31, 2019.
Mortgage-backed securities: The unrealized losses on the Company's investment in 32 GSE mortgage-backed securities were caused by interest rate increases. Fifteen of these securities were in an unrealized loss position for 12 months or more. The contractual cash flows of those investments are guaranteed by an agency of the U.S. Government. Accordingly, it is expected that the securities would not be settled at a price less than the amortized cost bases of the Company's investments. Because the decline in fair value is attributable to changes in interest rates and not credit quality, and because the Company does not intend to sell the investments and it is not more likely than not that the Company will be required to sell the investments before recovery of their amortized cost bases, which may be maturity, the Company does not consider those investments to be other-than-temporarily impaired at December 31, 2019.
Collateralized Mortgage Obligations: The unrealized loss associated with one private GSE collateralized mortgage obligation ("CMO") is due to normal market fluctuations. This one security has been in an unrealized loss position for 12 months or more. The contractual cash flows of this investment are guaranteed by an agency of the U.S. Government. Accordingly, it is expected
73
that this security would not be settled at a price less than the amortized cost basis of the Company's investment. Because the decline in fair value is attributable to changes in interest rates and not credit quality, and because the Company does not intend to sell the investment and it is not more likely than not that the Company will be required to sell the investment before recovery of its amortized cost basis, which may be maturity, the Company does not consider this investment to be other-than-temporarily impaired at December 31, 2019.
State and municipal securities: The unrealized losses on six state and municipal securities were caused by interest rate increases and not credit deterioration. The contractual terms of those investments do not permit the issuer to settle the securities at a price less than the amortized cost bases of the investments. Because the Company does not intend to sell the investments and it is not more likely than not that the Company will be required to sell the investments before recovery of their amortized cost bases, which may be maturity, the Company does not consider those investments to be other-than-temporarily impaired at December 31, 2019.
Due to restrictions placed upon the Bank's common stock investment in the Federal Reserve Bank of Richmond and FHLB, these securities have been classified as restricted equity securities and carried at cost. These restricted securities are not subject to the investment security classifications and are included as a separate line item on the Company's consolidated balance sheet. The FHLB requires the Bank to maintain stock in an amount equal to 4.25% of outstanding borrowings and a specific percentage of the Bank's total assets. The Federal Reserve Bank of Richmond requires the Bank to maintain stock with a par value equal to 3.0% of its outstanding capital and an additional 3.0% is on call. Restricted equity securities consist of Federal Reserve Bank of Richmond stock in the amount of $6,415,000 and $3,621,000 as of December 31, 2019 and 2018, respectively, and FHLB stock in the amount of $2,215,000 and $1,626,000 as of December 31, 2019 and 2018, respectively.
The table below shows gross unrealized losses and fair value, aggregated by investment category and length of time that individual securities had been in a continuous unrealized loss position, at December 31, 2018 (dollars in thousands):
Total | Less than 12 Months | 12 Months or More | |||||||||||||||||||||
Fair Value | Unrealized Loss | Fair Value | Unrealized Loss | Fair Value | Unrealized Loss | ||||||||||||||||||
Federal agencies and GSEs | $ | 103,797 | $ | 3,473 | $ | 14,982 | $ | 8 | $ | 88,815 | $ | 3,465 | |||||||||||
Mortgage-backed and CMOs | 86,852 | 2,401 | 5,473 | 15 | 81,379 | 2,386 | |||||||||||||||||
State and municipal | 39,755 | 531 | 7,199 | 18 | 32,556 | 513 | |||||||||||||||||
Corporate | 484 | 22 | — | — | 484 | 22 | |||||||||||||||||
Total | $ | 230,888 | $ | 6,427 | $ | 27,654 | $ | 41 | $ | 203,234 | $ | 6,386 | |||||||||||
Other-Than-Temporary-Impaired Securities
As of December 31, 2019 and 2018, there were no securities classified as other-than-temporary impaired.
Note 5 – Loans
Loans, excluding loans held for sale, at December 31, 2019 and 2018 were comprised of the following (dollars in thousands):
December 31, | |||||||
2019 | 2018 | ||||||
Commercial | $ | 339,077 | $ | 285,972 | |||
Commercial real estate: | |||||||
Construction and land development | 137,920 | 97,240 | |||||
Commercial real estate | 899,199 | 655,800 | |||||
Residential real estate: | |||||||
Residential | 324,315 | 209,438 | |||||
Home equity | 119,423 | 103,933 | |||||
Consumer | 10,881 | 5,093 | |||||
Total loans, net of unearned income | $ | 1,830,815 | $ | 1,357,476 | |||
Net deferred loan (fees) costs included in the above loan categories are $1,197,000 for 2019 and $720,000 for 2018.
74
Overdraft deposits were reclassified to consumer loans in the amount of $134,000 and $127,000 for 2019 and 2018, respectively.
Acquired Loans
The outstanding principal balance and the carrying amount of these loans, including ASC 310-30 loans, included in the consolidated balance sheets at December 31, 2019 and 2018 are as follows (dollars in thousands):
2019 | 2018 | ||||||
Outstanding principal balance | $ | 393,618 | $ | 63,619 | |||
Carrying amount | 377,130 | 58,886 | |||||
The outstanding principal balance and related carrying amount of purchased credit impaired loans, for which the Company applies ASC 310-30 to account for interest earned, at December 31, 2019 and 2018 are as follows (dollars in thousands):
2019 | 2018 | ||||||
Outstanding principal balance | $ | 53,600 | $ | 24,500 | |||
Carrying amount | 43,028 | 20,611 | |||||
The following table presents changes in the accretable yield on purchased credit impaired loans, for which the Company applies ASC 310-30, for the years ended December 31, 2019, 2018, and 2017 (dollars in thousands):
2019 | 2018 | 2017 | |||||||||
Balance at January 1 | $ | 4,633 | $ | 4,890 | $ | 6,103 | |||||
Additions from merger with HomeTown | 4,410 | — | — | ||||||||
Accretion | (3,304 | ) | (2,362 | ) | (3,117 | ) | |||||
Reclassification from nonaccretable difference | 736 | 956 | 1,006 | ||||||||
Other changes, net | 1,418 | 1,149 | 898 | ||||||||
Balance at December 31 | $ | 7,893 | $ | 4,633 | $ | 4,890 | |||||
Past Due Loans
The following table shows an analysis by portfolio segment of the Company's past due loans at December 31, 2019 (dollars in thousands):
30- 59 Days Past Due | 60-89 Days Past Due | 90 Days + Past Due and Still Accruing | Non- Accrual Loans | Total Past Due | Current | Total Loans | |||||||||||||||||||||
Commercial | $ | 325 | $ | 163 | $ | 52 | $ | 857 | $ | 1,397 | $ | 337,680 | $ | 339,077 | |||||||||||||
Commercial real estate: | |||||||||||||||||||||||||||
Construction and land development | 58 | — | — | 11 | 69 | 137,851 | 137,920 | ||||||||||||||||||||
Commercial real estate | 217 | 434 | — | 274 | 925 | 898,274 | 899,199 | ||||||||||||||||||||
Residential: | |||||||||||||||||||||||||||
Residential | 639 | 260 | 282 | 685 | 1,866 | 322,449 | 324,315 | ||||||||||||||||||||
Home equity | 49 | 90 | 27 | 113 | 279 | 119,144 | 119,423 | ||||||||||||||||||||
Consumer | 73 | 13 | — | 4 | 90 | 10,791 | 10,881 | ||||||||||||||||||||
Total | $ | 1,361 | $ | 960 | $ | 361 | $ | 1,944 | $ | 4,626 | $ | 1,826,189 | $ | 1,830,815 | |||||||||||||
75
The following table shows an analysis by portfolio segment of the Company's past due loans at December 31, 2018 (dollars in thousands):
30- 59 Days Past Due | 60-89 Days Past Due | 90 Days + Past Due and Still Accruing | Non- Accrual Loans | Total Past Due | Current | Total Loans | |||||||||||||||||||||
Commercial | $ | 20 | $ | — | $ | — | $ | 83 | $ | 103 | $ | 285,869 | $ | 285,972 | |||||||||||||
Commercial real estate: | |||||||||||||||||||||||||||
Construction and land development | — | — | — | 27 | 27 | 97,213 | 97,240 | ||||||||||||||||||||
Commercial real estate | 42 | — | — | 197 | 239 | 655,561 | 655,800 | ||||||||||||||||||||
Residential: | |||||||||||||||||||||||||||
Residential | 456 | 157 | 72 | 659 | 1,344 | 208,094 | 209,438 | ||||||||||||||||||||
Home equity | 126 | — | — | 124 | 250 | 103,683 | 103,933 | ||||||||||||||||||||
Consumer | 21 | 3 | — | — | 24 | 5,069 | 5,093 | ||||||||||||||||||||
Total | $ | 665 | $ | 160 | $ | 72 | $ | 1,090 | $ | 1,987 | $ | 1,355,489 | $ | 1,357,476 | |||||||||||||
76
Impaired Loans
The following table presents the Company's impaired loan balances by portfolio segment, excluding acquired impaired loans, at December 31, 2019 (dollars in thousands):
Recorded Investment | Unpaid Principal Balance | Related Allowance | Average Recorded Investment | Interest Income Recognized | |||||||||||||||
With no related allowance recorded: | |||||||||||||||||||
Commercial | $ | 49 | $ | 49 | $ | — | $ | 16 | $ | 5 | |||||||||
Commercial real estate: | |||||||||||||||||||
Construction and land development | — | — | — | — | — | ||||||||||||||
Commercial real estate | 502 | 500 | — | 424 | 39 | ||||||||||||||
Residential: | |||||||||||||||||||
Residential | 611 | 612 | — | 652 | 38 | ||||||||||||||
Home equity | 41 | 41 | — | 45 | 6 | ||||||||||||||
Consumer | — | — | — | — | — | ||||||||||||||
$ | 1,203 | $ | 1,202 | $ | — | $ | 1,137 | $ | 88 | ||||||||||
With a related allowance recorded: | |||||||||||||||||||
Commercial | $ | 735 | $ | 730 | $ | 204 | $ | 191 | $ | 41 | |||||||||
Commercial real estate: | |||||||||||||||||||
Construction and land development | — | — | — | — | — | ||||||||||||||
Commercial real estate | — | — | — | — | — | ||||||||||||||
Residential | |||||||||||||||||||
Residential | 254 | 254 | 26 | 225 | 16 | ||||||||||||||
Home equity | — | — | — | — | — | ||||||||||||||
Consumer | — | — | — | — | — | ||||||||||||||
$ | 989 | $ | 984 | $ | 230 | $ | 416 | $ | 57 | ||||||||||
Total: | |||||||||||||||||||
Commercial | $ | 784 | $ | 779 | $ | 204 | $ | 207 | $ | 46 | |||||||||
Commercial real estate: | |||||||||||||||||||
Construction and land development | — | — | — | — | — | ||||||||||||||
Commercial real estate | 502 | 500 | — | 424 | 39 | ||||||||||||||
Residential: | |||||||||||||||||||
Residential | 865 | 866 | 26 | 877 | 54 | ||||||||||||||
Home equity | 41 | 41 | — | 45 | 6 | ||||||||||||||
Consumer | — | — | — | — | — | ||||||||||||||
$ | 2,192 | $ | 2,186 | $ | 230 | $ | 1,553 | $ | 145 | ||||||||||
In the table above, recorded investment may exceed unpaid principal balance due to acquired loans with a premium and loans with unearned costs that exceed unearned fees.
77
The following table presents the Company's impaired loan balances by portfolio segment, excluding acquired impaired loans, at December 31, 2018 (dollars in thousands):
Recorded Investment | Unpaid Principal Balance | Related Allowance | Average Recorded Investment | Interest Income Recognized | |||||||||||||||
With no related allowance recorded: | |||||||||||||||||||
Commercial | $ | 28 | $ | 28 | $ | — | $ | 44 | $ | 14 | |||||||||
Commercial real estate: | |||||||||||||||||||
Construction and land development | — | — | — | — | — | ||||||||||||||
Commercial real estate | 376 | 373 | — | 542 | 36 | ||||||||||||||
Residential: | |||||||||||||||||||
Residential | 646 | 646 | — | 875 | 29 | ||||||||||||||
Home equity | 49 | 49 | — | 108 | 10 | ||||||||||||||
Consumer | — | — | — | 2 | — | ||||||||||||||
$ | 1,099 | $ | 1,096 | $ | — | $ | 1,571 | $ | 89 | ||||||||||
With a related allowance recorded: | |||||||||||||||||||
Commercial | $ | 62 | $ | 58 | $ | 55 | $ | 354 | $ | 40 | |||||||||
Commercial real estate: | |||||||||||||||||||
Construction and land development | — | — | — | 21 | — | ||||||||||||||
Commercial real estate | — | — | — | 18 | — | ||||||||||||||
Residential: | |||||||||||||||||||
Residential | 173 | 173 | 9 | 342 | 9 | ||||||||||||||
Home equity | — | — | — | 128 | 1 | ||||||||||||||
Consumer | — | — | — | — | — | ||||||||||||||
$ | 235 | $ | 231 | $ | 64 | $ | 863 | $ | 50 | ||||||||||
Total: | |||||||||||||||||||
Commercial | $ | 90 | $ | 86 | $ | 55 | $ | 398 | $ | 54 | |||||||||
Commercial real estate: | |||||||||||||||||||
Construction and land development | — | — | — | 21 | — | ||||||||||||||
Commercial real estate | 376 | 373 | — | 560 | 36 | ||||||||||||||
Residential: | |||||||||||||||||||
Residential | 819 | 819 | 9 | 1,217 | 38 | ||||||||||||||
Home equity | 49 | 49 | — | 236 | 11 | ||||||||||||||
Consumer | — | — | — | 2 | — | ||||||||||||||
$ | 1,334 | $ | 1,327 | $ | 64 | $ | 2,434 | $ | 139 | ||||||||||
In the table above, recorded investment may exceed unpaid principal balance due to acquired loans with a premium and loans with unearned costs that exceed unearned fees.
78
The following table shows the detail of loans modified as TDRs during the year ended December 31, 2019, 2018, and 2017, included in the impaired loan balances (dollars in thousands):
Loans Modified as TDRs for the Year Ended December 31, 2019 | ||||||||||
Number of Contracts | Pre-Modification Outstanding Recorded Investment | Post-Modification Outstanding Recorded Investment | ||||||||
Commercial | — | $ | — | $ | — | |||||
Commercial real estate | — | — | — | |||||||
Home equity | — | — | — | |||||||
Residential real estate | 1 | 207 | 207 | |||||||
Consumer | — | — | — | |||||||
Total | 1 | $ | 207 | $ | 207 | |||||
Loans Modified as TDRs for the Year Ended December 31, 2018 | ||||||||||
Number of Contracts | Pre-Modification Outstanding Recorded Investment | Post-Modification Outstanding Recorded Investment | ||||||||
Commercial | — | $ | — | $ | — | |||||
Commercial real estate | — | — | — | |||||||
Home equity | — | — | — | |||||||
Residential real estate | 1 | 11 | 11 | |||||||
Consumer | — | — | — | |||||||
Total | 1 | $ | 11 | $ | 11 | |||||
Loans Modified as TDRs for the Year Ended December 31, 2017 | ||||||||||
Number of Contracts | Pre-Modification Outstanding Recorded Investment | Post-Modification Outstanding Recorded Investment | ||||||||
Commercial | 5 | $ | 212 | $ | 212 | |||||
Commercial real estate | — | — | — | |||||||
Home equity | 2 | 57 | 57 | |||||||
Residential real estate | 1 | 36 | 36 | |||||||
Consumer | — | — | — | |||||||
Total | 8 | $ | 305 | $ | 305 | |||||
All loans modified as TDRs during the years ended December 31, 2019, 2018, and 2017 were structure modifications. The impact on the allowance for loan losses for the residential real estate loan modified as a TDR in 2019 was $24,000. There was no impact on the allowance for loan losses for the residential real estate loans modified as TDRs in 2018 and 2017. In 2017, the impact on the allowance for loan losses for loans modified as TDRs in the commercial and home equity segments was $137,000 and $1,000, respectively.
During the years ended December 31, 2019 and 2018, the Company had no loans that subsequently defaulted within twelve months of modification. During the year ended December 31, 2017, there were three commercial loans with a total recorded investment of $109,000 and one residential real estate loan with a recorded investment of $143,000 that defaulted within twelve months of modification. The Company defines default as one or more payments that occur more than 90 days past the due date, charge-off or foreclosure subsequent to modification. Any charge-offs resulting in default were adjusted through the allowance for loan losses.
79
The Company had $161,000 and $112,000 in residential real estate loans in the process of foreclosure and $285,000 and $719,000 in residential OREO at December 31, 2019 and December 31, 2018, respectively.
Risk Ratings
The following table shows the Company's loan portfolio broken down by internal risk grading as of December 31, 2019 (dollars in thousands):
Commercial and Consumer Credit Exposure
Credit Risk Profile by Internally Assigned Grade
Commercial | Construction and Land Development | Commercial Real Estate | Residential Real Estate | Home Equity | |||||||||||||||
Pass | $ | 328,488 | $ | 130,694 | $ | 860,615 | $ | 316,454 | $ | 118,960 | |||||||||
Special Mention | 8,710 | 4,133 | 22,117 | 4,370 | — | ||||||||||||||
Substandard | 1,879 | 3,093 | 16,467 | 3,491 | 463 | ||||||||||||||
Doubtful | — | — | — | — | — | ||||||||||||||
Total | $ | 339,077 | $ | 137,920 | $ | 899,199 | $ | 324,315 | $ | 119,423 | |||||||||
Consumer Credit Exposure
Credit Risk Profile Based on Payment Activity
Consumer | |||
Performing | $ | 10,877 | |
Nonperforming | 4 | ||
Total | $ | 10,881 | |
Loans classified in the Pass category typically are fundamentally sound and risk factors are reasonable and acceptable.
Loans classified in the Special Mention category typically have been criticized internally, by loan review or the loan officer, or by external regulators under the current credit policy regarding risk grades.
Loans classified in the Substandard category typically have a well-defined weakness or weaknesses that jeopardize the liquidation of the debt; they are typically characterized by the possibility that the Bank will sustain some loss if the deficiencies are not corrected.
Loans classified in the Doubtful category typically have all the weaknesses inherent in loans classified as substandard, plus the added characteristic the weaknesses make collection or liquidation in full on the basis of currently existing facts, conditions, and values highly questionable and improbable. However, these loans are not yet rated as loss because certain events may occur that may salvage the debt.
Consumer loans are classified as performing or nonperforming. A loan is nonperforming when payments of interest and principal are past due 90 days or more.
The following table shows the Company's loan portfolio broken down by internal risk grading as of December 31, 2018 (dollars in thousands):
Commercial and Consumer Credit Exposure
Credit Risk Profile by Internally Assigned Grade
Commercial | Construction and Land Development | Commercial Real Estate | Residential Real Estate | Home Equity | |||||||||||||||
Pass | $ | 285,092 | $ | 93,000 | $ | 647,519 | $ | 204,261 | $ | 103,541 | |||||||||
Special Mention | 154 | 1,840 | 4,403 | 1,685 | — | ||||||||||||||
Substandard | 726 | 2,400 | 3,878 | 3,492 | 392 | ||||||||||||||
Doubtful | — | — | — | — | — | ||||||||||||||
Total | $ | 285,972 | $ | 97,240 | $ | 655,800 | $ | 209,438 | $ | 103,933 | |||||||||
80
Consumer Credit Exposure
Credit Risk Profile Based on Payment Activity
Consumer | |||
Performing | $ | 5,093 | |
Nonperforming | — | ||
Total | $ | 5,093 | |
Note 6 – Allowance for Loan Losses and Reserve for Unfunded Lending Commitments
Changes in the allowance for loan losses and the reserve for unfunded lending commitments for each of the years in the three-year period ended December 31, 2019, are presented below (dollars in thousands):
Years Ended December 31, | |||||||||||
2019 | 2018 | 2017 | |||||||||
Allowance for Loan Losses | |||||||||||
Balance, beginning of year | $ | 12,805 | $ | 13,603 | $ | 12,801 | |||||
Provision for (recovery of) loan losses | 456 | (103 | ) | 1,016 | |||||||
Charge-offs | (333 | ) | (1,020 | ) | (690 | ) | |||||
Recoveries | 224 | 325 | 476 | ||||||||
Balance, end of year | $ | 13,152 | $ | 12,805 | $ | 13,603 | |||||
Years Ended December 31, | |||||||||||
2019 | 2018 | 2017 | |||||||||
Reserve for Unfunded Lending Commitments | |||||||||||
Balance, beginning of year | $ | 217 | $ | 206 | $ | 203 | |||||
Provision for unfunded commitments | 112 | 11 | 3 | ||||||||
Charge-offs | — | — | — | ||||||||
Balance, end of year | $ | 329 | $ | 217 | $ | 206 | |||||
81
The reserve for unfunded loan commitments is included in other liabilities, and the provision for unfunded commitments is included in noninterest expense. The following table presents the Company's allowance for loan losses by portfolio segment and the related loan balance total by segment for the year ended December 31, 2019 (dollars in thousands):
Commercial | Commercial Real Estate | Residential Real Estate | Consumer | Total | |||||||||||||||
Allowance for Loan Losses | |||||||||||||||||||
Balance at December 31, 2018 | $ | 2,537 | $ | 7,246 | $ | 2,977 | $ | 45 | $ | 12,805 | |||||||||
Charge-offs | (12 | ) | (6 | ) | (70 | ) | (245 | ) | (333 | ) | |||||||||
Recoveries | 13 | 9 | 58 | 144 | 224 | ||||||||||||||
Provision | 119 | 167 | 58 | 112 | 456 | ||||||||||||||
Balance at December 31, 2019 | $ | 2,657 | $ | 7,416 | $ | 3,023 | $ | 56 | $ | 13,152 | |||||||||
Balance at December 31, 2019: | |||||||||||||||||||
Allowance for Loan Losses | |||||||||||||||||||
Individually evaluated for impairment | $ | 204 | $ | — | $ | 26 | $ | — | $ | 230 | |||||||||
Collectively evaluated for impairment | 2,448 | 7,386 | 2,794 | 56 | 12,684 | ||||||||||||||
Purchased credit impaired loans | 5 | 30 | 203 | — | 238 | ||||||||||||||
Total | $ | 2,657 | $ | 7,416 | $ | 3,023 | $ | 56 | $ | 13,152 | |||||||||
Loans | |||||||||||||||||||
Individually evaluated for impairment | $ | 784 | $ | 502 | $ | 906 | $ | — | $ | 2,192 | |||||||||
Collectively evaluated for impairment | 337,312 | 1,004,296 | 433,121 | 10,866 | 1,785,595 | ||||||||||||||
Purchased credit impaired loans | 981 | 32,321 | 9,711 | 15 | 43,028 | ||||||||||||||
Total | $ | 339,077 | $ | 1,037,119 | $ | 443,738 | $ | 10,881 | $ | 1,830,815 | |||||||||
The following table presents the Company's allowance for loan losses by portfolio segment and the related loan balance total by segment for the year ended December 31, 2018 (dollars in thousands):
Commercial | Commercial Real Estate | Residential Real Estate | Consumer | Total | |||||||||||||||
Allowance for Loan Losses | |||||||||||||||||||
Balance at December 31, 2017 | $ | 2,413 | $ | 8,321 | $ | 2,825 | $ | 44 | $ | 13,603 | |||||||||
Charge-offs | (787 | ) | (11 | ) | (86 | ) | (136 | ) | (1,020 | ) | |||||||||
Recoveries | 69 | 10 | 149 | 97 | 325 | ||||||||||||||
Provision | 842 | (1,074 | ) | 89 | 40 | (103 | ) | ||||||||||||
Balance at December 31, 2018 | $ | 2,537 | $ | 7,246 | $ | 2,977 | $ | 45 | $ | 12,805 | |||||||||
Balance at December 31, 2018: | |||||||||||||||||||
Allowance for Loan Losses | |||||||||||||||||||
Individually evaluated for impairment | $ | 55 | $ | — | $ | 9 | $ | — | $ | 64 | |||||||||
Collectively evaluated for impairment | 2,482 | 7,211 | 2,822 | 45 | 12,560 | ||||||||||||||
Purchased credit impaired loans | — | 35 | 146 | — | 181 | ||||||||||||||
Total | $ | 2,537 | $ | 7,246 | $ | 2,977 | $ | 45 | $ | 12,805 | |||||||||
Loans | |||||||||||||||||||
Individually evaluated for impairment | $ | 90 | $ | 376 | $ | 868 | $ | — | $ | 1,334 | |||||||||
Collectively evaluated for impairment | 285,431 | 742,365 | 302,657 | 5,078 | 1,335,531 | ||||||||||||||
Purchased credit impaired loans | 451 | 10,299 | 9,846 | 15 | 20,611 | ||||||||||||||
Total | $ | 285,972 | $ | 753,040 | $ | 313,371 | $ | 5,093 | $ | 1,357,476 | |||||||||
82
The allowance for loan losses is allocated to loan segments based upon historical loss factors, risk grades on individual loans, portfolio analysis of smaller balance, homogenous loans, and qualitative factors. Qualitative factors include trends in delinquencies, nonaccrual loans, and loss rates; trends in volume and terms of loans, effects of changes in risk selection, underwriting standards, and lending policies; experience of lending officers, other lending staff and loan review; national, regional, and local economic trends and conditions; legal, regulatory and collateral factors; and concentrations of credit.
Note 7 – Premises and Equipment
Major classifications of premises and equipment at December 31, 2019 and 2018 are summarized as follows (dollars in thousands):
December 31, | |||||||
2019 | 2018 | ||||||
Land | $ | 10,421 | $ | 6,509 | |||
Buildings | 36,247 | 28,075 | |||||
Leasehold improvements | 1,469 | 1,011 | |||||
Furniture and equipment | 17,695 | 17,521 | |||||
65,832 | 53,116 | ||||||
Accumulated depreciation | (25,984 | ) | (26,441 | ) | |||
Premises and equipment, net | $ | 39,848 | $ | 26,675 | |||
Depreciation expense for the years ended December 31, 2019, 2018, and 2017 was $2,064,000, $1,775,000, and $1,877,000, respectively.
Note 8 – Goodwill and Other Intangible Assets
The Company records as goodwill the excess of purchase price over the fair value of the identifiable net assets acquired. Impairment testing is performed annually, as well as when an event triggering impairment may have occurred. The Company performs its annual analysis as of June 30 each fiscal year. Accounting guidance permits preliminary assessment of qualitative factors to determine whether more substantial impairment testing is required. The Company chose to bypass the preliminary assessment and utilized a two-step process for impairment testing of goodwill. The first step tests for impairment, while the second step, if necessary, measures the impairment. No indicators of impairment were identified during the years ended December 31, 2019, 2018, or 2017.
Core deposit intangibles resulting from the MidCarolina acquisition in July 2011 were $6,556,000 and are being amortized on an accelerated basis over 108 months. Core deposit intangibles resulting from the MainStreet Bankshares, Inc. acquisition in January 2015 were $1,839,000 and are being amortized on an accelerated basis over 120 months. Core deposit intangibles resulting from the acquisition of HomeTown in April 2019 were $8,200,000 and are being amortized on an accelerated basis over 120 months.
The changes in the carrying amount of goodwill and intangibles for the twelve months ended December 31, 2019, are as follows (dollars in thousands):
Goodwill | Intangibles | ||||||
Balance at December 31, 2018 | $ | 43,872 | $ | 926 | |||
Additions | 40,130 | 8,200 | |||||
Amortization | — | (1,398 | ) | ||||
Balance at December 31, 2019 | $ | 84,002 | $ | 7,728 | |||
83
Goodwill and intangible assets at December 31, 2019 and 2018 are as follow (dollars in thousands):
Gross Carrying Value | Accumulated Amortization | Net Carrying Value | |||||||||
December 31, 2019 | |||||||||||
Core deposit intangibles | $ | 19,708 | $ | (11,980 | ) | $ | 7,728 | ||||
Goodwill | 84,002 | — | 84,002 | ||||||||
December 31, 2018 | |||||||||||
Core deposit intangibles | $ | 11,508 | $ | (10,582 | ) | $ | 926 | ||||
Goodwill | 43,872 | — | 43,872 | ||||||||
Amortization expense of core deposit intangibles for the years ended December 31, 2019, 2018, and 2017 was $1,398,000, $265,000, and $528,000, respectively. As of December 31, 2019, the estimated future amortization expense of core deposit intangibles is as follows (dollars in thousands):
Year | Amount | ||
2020 | $ | 1,637 | |
2021 | 1,464 | ||
2022 | 1,260 | ||
2023 | 1,069 | ||
2024 | 800 | ||
2025 and after | 1,498 | ||
Total | $ | 7,728 | |
Note 9 – Leases
On January 1, 2019, the Company adopted ASU No. 2016-02 "Leases (Topic 842)" and all subsequent ASUs that modified Topic 842. The Company elected the prospective application approach provided by ASU 2018-11 and did not adjust prior periods for ASC 842. The Company also elected certain practical expedients within the standard and, consistent with such elections, did not reassess whether any expired or existing contracts are or contain leases, did not reassess the lease classification for any expired or existing leases, and did not reassess any initial direct costs for existing leases. As stated in the Company's 2018 Form 10-K, the implementation of the new standard resulted in recognition of a right-of-use asset and lease liability of $4.4 million at the date of adoption, which is related to the Company's lease of premises used in operations. In connection with the HomeTown merger, the Company added $1.8 million to the right-of-use asset and lease liability. The right-of-use asset and lease liability are included in other assets and other liabilities, respectively, in the Company's consolidated balance sheets.
Lease liabilities represent the Company's obligation to make lease payments and are presented at each reporting date as the net present value of the remaining contractual cash flows. Cash flows are discounted at the Company's incremental borrowing rate in effect at the commencement date of the lease. Right-of-use assets represent the Company's right to use the underlying asset for the lease term and are calculated as the sum of the lease liability and if applicable, prepaid rent, initial direct costs and any incentives received from the lessor.
The Company's long-term lease agreements are classified as operating leases. Certain of these leases offer the option to extend the lease term, and the Company has included such extensions in its calculation of the lease liabilities to the extent the options are reasonably assured of being exercised. The lease agreements do not provide for residual value guarantees and have no restrictions or covenants that would impact dividends or require incurring additional financial obligations.
The following tables present information about the Company's leases as of and for the year ended December 31, 2019 (dollars in thousands):
December 31, 2019 | |||
Lease liabilities | $ | 5,369 | |
Right-of-use assets | $ | 5,340 | |
Weighted average remaining lease term | 8.17 years | ||
Weighted average discount rate | 3.21 | % | |
84
Year Ended December 31, 2019 | |||
Lease cost | |||
Operating lease cost | $ | 1,040 | |
Short-term lease cost | 3 | ||
Total lease cost | $ | 1,043 | |
Cash paid for amounts included in the measurement of lease liabilities | $ | 1,013 | |
A maturity analysis of operating lease liabilities and reconciliation of the undiscounted cash flows to the total of operating lease liabilities is as follows (dollars in thousands):
Lease payments due | As of December 31, 2019 | ||
2020 | $ | 959 | |
2021 | 943 | ||
2022 | 920 | ||
2023 | 817 | ||
2024 | 499 | ||
2025 and after | 2,022 | ||
Total undiscounted cash flows | $ | 6,160 | |
Discount | (791 | ) | |
Lease liabilities | $ | 5,369 | |
Lease expense, a component of occupancy and equipment expense, for the years ended December 31, 2019, 2018, and 2017 was $1,187,000, $919,000, and $961,000, respectively. The amounts recognized in lease expense include insurance, property taxes, and common area maintenance.
Note 10 - Deposits
The aggregate amount of time deposits in denominations of $250,000 or more at December 31, 2019 and 2018 was $200,712,000 and $159,996,000, respectively.
At December 31, 2019, the scheduled maturities and amounts of certificates of deposits (included in "time" deposits on the consolidated balance sheet) were as follows (dollars in thousands):
Year | Amount | ||
2020 | $ | 242,784 | |
2021 | 127,672 | ||
2022 | 49,426 | ||
2023 | 31,401 | ||
2024 | 16,175 | ||
2025 and after | 4,312 | ||
Total | $ | 471,770 | |
There were no brokered time deposits at December 31, 2019 or December 31, 2018. Time deposits through the Certificate of Deposit Account Registry Service ("CDARS") program totaled $14,864,000 at December 31, 2019 compared to $22,431,000 at December 31, 2018. Deposits through the CDARS program are generated from major customers with substantial relationships with the Bank.
85
Note 11 – Short-term Borrowings
Short-term borrowings consist of customer repurchase agreements, overnight borrowings from the FHLB, federal funds purchased, and a promissory note. The Company has federal funds lines of credit established with one correspondent bank in the amount of $15,000,000 and another correspondent bank in the amount of $10,000,000, and additionally, has access to the Federal Reserve Bank of Richmond's discount window. On August 21, 2019, the Company secured a $3,000,000 line of credit with a regional commercial bank at 0.25% under Prime maturing August 21, 2020. There were no outstanding borrowings on this line at December 31, 2019. The Company paid $4,000 in interest on this line during 2019. Customer repurchase agreements are collateralized by securities of the U.S. Government, its agencies or GSEs. They mature daily. The interest rates are generally fixed but may be changed at the discretion of the Company. The securities underlying these agreements remain under the Company's control. FHLB overnight borrowings contain floating interest rates that may change daily at the discretion of the FHLB. Short-term borrowings consisted solely of the following at December 31, 2019 and 2018 (dollars in thousands):
December 31, 2019 | December 31, 2018 | ||||||||||||
Amount | Weighted Average Rate | Amount | Weighted Average Rate | ||||||||||
Customer repurchase agreements | $ | 40,475 | 1.40 | % | $ | 35,243 | 1.67 | % | |||||
Note 12 – Long-term Borrowings
Under the terms of its collateral agreement with the FHLB, the Company provides a blanket lien covering all of its residential first mortgage loans, second mortgage loans, home equity lines of credit, and commercial real estate loans. In addition, the Company pledges as collateral its capital stock in the FHLB and deposits with the FHLB. The Company has a line of credit with the FHLB equal to 30% of the Company's assets, subject to the amount of collateral pledged. As of December 31, 2019, $846,767,000 in eligible collateral was pledged under the blanket floating lien agreement which covers both short-term and long-term borrowings.
There were no long-term borrowings as of December 31, 2019 or 2018.
In the regular course of conducting its business, the Company takes deposits from political subdivisions of the states of Virginia and North Carolina. At December 31, 2019, the Bank's public deposits totaled $256,984,000. The Company is required to provide collateral to secure the deposits that exceed the insurance coverage provided by the Federal Deposit Insurance Corporation. This collateral can be provided in the form of certain types of government or agency bonds or letters of credit from the FHLB. At December 31, 2019, the Company had $170,000,000 in letters of credit with the FHLB outstanding as well as $126,814,000 in agency, state, and municipal securities to provide collateral for such deposits.
Note 13 – Subordinated Debt
On April 1, 2019, in connection with the HomeTown merger, the Company assumed $7,500,000 in aggregate principal amount of fixed-to-floating rate subordinated notes issued to various institutional accredited investors. The notes have a maturity date of December 30, 2025 and have an annual fixed interest rate of 6.75% until December 30, 2020. Thereafter, the notes will have a floating interest rate based on LIBOR. Interest will be paid semi-annually, in arrears, on June 30 and December 30 of each year during the time that the notes remain outstanding through the fixed interest rate period or earlier redemption date. Interest will be paid quarterly, in arrears, on March 30, June 30, September 30 and December 30 throughout the floating interest rate period or earlier redemption date.
The indebtedness evidenced by the notes, including principal and interest, is unsecured and subordinate and junior in right of the Company's payments to general and secured creditors and depositors of the Bank. The notes are redeemable, without penalty, on or after December 30, 2020 and, in certain limited circumstances, prior to that date. The notes limit the Company from declaring or paying any dividend, or making any distribution on capital stock or other equity securities of any kind of the Company if the Company is not "well capitalized" for regulatory purposes, immediately prior to the declaration of such dividend or distribution, except for dividends payable solely in shares of common stock of the Company.
The carrying value of the subordinated debt includes a fair value adjustment of $17,000 at December 31, 2019. The original fair value adjustment of $30,000 was recorded as a result of the acquisition of HomeTown on April 1, 2019, and is being amortized into interest expense through December 30, 2020.
86
Note 14 – Junior Subordinated Debt
On April 7, 2006, AMNB Statutory Trust I, a Delaware statutory trust and a wholly owned subsidiary of the Company, issued $20,000,000 of preferred securities in a private placement pursuant to an applicable exemption from registration. The Trust Preferred Securities mature on June 30, 2036, but may be redeemed at the Company's option beginning on September 30, 2011. Initially, the securities required quarterly distributions by the trust to the holder of the Trust Preferred Securities at a fixed rate of 6.66%. Effective September 30, 2011, the rate resets quarterly at the three-month LIBOR plus 1.35%. Distributions are cumulative and will accrue from the date of original issuance, but may be deferred by the Company from time to time for up to 20 consecutive quarterly periods. The Company has guaranteed the payment of all required distributions on the Trust Preferred Securities. The proceeds of the Trust Preferred Securities received by the trust, along with proceeds of $619,000 received by the trust from the issuance of common securities by the trust to the Company, were used to purchase $20,619,000 of the Company's junior subordinated debt securities (the "Trust Preferred Capital Notes"), issued pursuant to a junior subordinated debenture entered into between the Company and Wilmington Trust Company, as trustee. The proceeds of the Trust Preferred Securities were used to fund the cash portion of the merger consideration to the former shareholders of Community First in connection with the Company's acquisition of that company, and for general corporate purposes.
On July 1, 2011, in connection with the MidCarolina merger, the Company assumed $8,764,000 in junior subordinated debentures to the MidCarolina Trusts, to fully and unconditionally guarantee the preferred securities issued by the MidCarolina Trusts. These long-term obligations, which currently qualify as Tier 1 capital, constitute a full and unconditional guarantee by the Company of the MidCarolina Trusts' obligations. The MidCarolina Trusts are not consolidated in the Company's financial statements.
In accordance with ASC 810-10-15-14, Consolidation - Overall - Scope and Scope Exceptions, the Company did not eliminate through consolidation the Company's $619,000 equity investment in AMNB Statutory Trust I or the $264,000 equity investment in the MidCarolina Trusts. Instead, the Company reflected this equity investment in the "Accrued interest receivable and other assets" line item in the consolidated balance sheets.
A description of the junior subordinated debt securities outstanding payable to the trusts is shown below (dollars in thousands):
Principal Amount | ||||||||||||||
As of December 31, | ||||||||||||||
Issuing Entity | Date Issued | Interest Rate | Maturity Date | 2019 | 2018 | |||||||||
AMNB Trust I | 4/7/2006 | Libor plus 1.35% | 6/30/2036 | $ | 20,619 | $ | 20,619 | |||||||
MidCarolina Trust I | 10/29/2002 | Libor plus 3.45% | 11/7/2032 | 4,433 | 4,377 | |||||||||
MidCarolina Trust II | 12/3/2003 | Libor plus 2.95% | 10/7/2033 | 2,977 | 2,931 | |||||||||
$ | 28,029 | $ | 27,927 | |||||||||||
The principal amounts reflected for the MidCarolina Trusts as of December 31, 2019 and 2018, are net of fair value marks of $722,000 and $632,000, respectively. The original fair value marks of $1,197,000 and $1,021,000 were recorded as a result of the merger with MidCarolina on July 1, 2011 and are being amortized into interest expense over the remaining lives of the respective borrowings.
Note 15 - Derivative Financial Instruments and Hedging Activities
The Company uses derivative financial instruments ("derivatives") primarily to manage risks associated with changing interest rates. The Company's derivatives are hedging instruments in a qualifying hedge accounting relationship (cash flow or fair value hedge).
The Company designates derivatives as cash flow hedges when they are used to manage exposure to variability in cash flows on variable rate borrowings such as the Company's Trust Preferred Capital Notes. The Company uses interest rate swap agreements as part of its hedging strategy by exchanging variable-rate interest payments on a notional amount equal to the principal amount of the borrowings for fixed-rate interest payments, with such interest rates set based on benchmarked interest rates.
All interest rate swaps were entered into with counterparties that met the Company's credit standards and the agreements contain collateral provisions protecting the at-risk party. The Company believes that the credit risk inherent in these derivative contracts is not significant.
87
Terms and conditions of the interest rate swaps vary and amounts receivable or payable are recognized as accrued under the terms of the agreements. The Company assesses the effectiveness of each hedging relationship on a periodic basis. In accordance with ASC 815, Derivatives and Hedging, the effective portions of the derivatives' unrealized gains or losses are recorded as a component of other comprehensive income. Based on the Company's assessment, its cash flow hedges are highly effective, but to the extent that any ineffectiveness exists in the hedge relationships, the amounts would be recorded in the Company's consolidated statements of income.
(Dollars in thousands) | December 31, 2019 | |||||||||||||||||
Notional Amount | Positions | Assets | Liabilities | Cash Collateral Pledged | ||||||||||||||
Cash flow hedges: | ||||||||||||||||||
Interest rate swaps: | ||||||||||||||||||
Variable-rate to fixed-rate swaps with counterparty | $ | 28,500 | 3 | $ | — | $ | 2,658 | $ | 3,450 | |||||||||
(Dollars in thousands) | December 31, 2018 | |||||||||||||||||
Notional Amount | Positions | Assets | Liabilities | Cash Collateral Pledged | ||||||||||||||
Cash flow hedges: | ||||||||||||||||||
Interest rate swaps: | ||||||||||||||||||
Variable-rate to fixed-rate swaps with counterparty | $ | 28,500 | 3 | $ | — | $ | 804 | $ | 650 | |||||||||
In addition, the Company has commitments to fund certain mortgage loans (interest rate lock commitments) to be sold into the secondary market and forward commitments for the future delivery of mortgage loans to third party investors which are considered derivatives. It is the Company's practice to enter into forward commitments for the future delivery of residential mortgage loans when interest rate lock commitments are entered into in order to economically hedge the effect of change in interest rates resulting from its commitments to fund the loans. These mortgage banking derivatives are not designated in hedge relationships.
Note 16 – Stock-Based Compensation
The Company's 2018 Stock Incentive Plan (the "2018 Plan") was adopted by the Board of Directors of the Company on February 20, 2018 and approved by shareholders on May 15, 2018 at the Company's 2018 Annual Meeting of Shareholders. The 2018 Plan provides for the granting of restricted stock awards, incentive and non-statutory options, and other equity-based awards to employees and directors at the discretion of the Compensation Committee of the Board of Directors. The 2018 Plan authorizes the issuance of up to 675,000 shares of common stock. The 2018 Plan replaced the Company's stock incentive plan that was approved by the shareholders at the 2008 Annual Meeting that expired in February 2018 (the "2008 Plan").
Stock Options
Accounting guidance requires that compensation cost relating to share-based payment transactions be recognized in the financial statements with measurement based upon the fair value of the equity or liability instruments issued.
88
A summary of stock option transactions for the year ended December 31, 2019 is as follows:
Option Shares | Weighted Average Exercise Price | Weighted Average Remaining Contractual Term | Aggregate Intrinsic Value ($000) | |||||||||
Outstanding at December 31, 2018 | 13,200 | $ | 21.97 | |||||||||
Replacement stock options | 40,753 | 16.63 | ||||||||||
Granted | — | — | ||||||||||
Exercised | (37,104 | ) | 18.53 | |||||||||
Forfeited | (2,075 | ) | 16.63 | |||||||||
Expired | (830 | ) | 16.63 | |||||||||
Outstanding at December 31, 2019 | 13,944 | $ | 16.63 | 4.97 years | $ | 320 | ||||||
Exercisable at December 31, 2019 | 13,944 | $ | 16.63 | 4.97 years | $ | 320 | ||||||
The aggregate intrinsic value of stock options in the table above represents the total pre-tax intrinsic value (the amount by which the current fair value of the underlying stock exceeds the exercise price of the option) that would have been received by the option holders had all option holders exercised their options on December 31, 2019. This amount changes based on changes in the fair value of the Company's common stock.
The total proceeds of the in-the-money options exercised during the years ended December 31, 2019, 2018, and 2017 were $688,000, $861,000, and $113,000, respectively. Total intrinsic value of options exercised during the years ended December 31, 2019, 2018, and 2017 was $616,000, $732,000, and $287,000, respectively.
In connection with the HomeTown acquisition, there was $147,000 in recognized stock compensation expense attributable to outstanding stock options in the year ended December 31, 2019. There was no recognized stock compensation expense attributable to outstanding stock options in 2018 and 2017. As of December 31, 2019, 2018, and 2017, there was no unrecognized compensation expense attributable to the outstanding stock options.
The following table summarizes information related to stock options outstanding on December 31, 2019:
Options Outstanding and Exercisable | |||||||||
Range of Exercise Prices | Number of Outstanding Options | Weighted-Average Remaining Contractual Life | Weighted-Average Exercise Price | ||||||
$15.01 to $20.00 | 13,944 | 4.97 years | $ | 16.63 | |||||
No stock options were granted in 2019, 2018 and 2017.
89
Restricted Stock
The Company from time-to-time grants shares of restricted stock to key employees and non-employee directors. These awards help align the interests of these employees and directors with the interests of the shareholders of the Company by providing economic value directly related to increases in the value of the Company's common stock. The value of the stock awarded is established as the fair market value of the stock at the time of the grant. The Company recognizes expense, equal to the total value of such awards, ratably over the vesting period of the stock grants. Restricted stock granted in 2019 cliff vests at the end of a 36-month period beginning on the date of grant. Nonvested restricted stock activity for the year ended December 31, 2019 is summarized in the following table:
Restricted Stock | Shares | Weighted Average Grant Date Value Per Share | ||||
Nonvested at December 31, 2018 | 52,798 | $ | 31.71 | |||
Replacement stock awards | 7,137 | 27.28 | ||||
Granted | 22,274 | 32.79 | ||||
Vested | (23,572 | ) | 23.70 | |||
Forfeited | (1,366 | ) | 33.22 | |||
Nonvested at December 31, 2019 | 57,271 | 34.84 | ||||
As of December 31, 2019, 2018, and 2017, there was $751,000, $647,000, and $538,000, respectively, in unrecognized compensation cost related to nonvested restricted stock granted under the 2008 Plan and the 2018 Plan. This cost is expected to be recognized over the next 12 to 36 months. The share based compensation expense for nonvested restricted stock was $915,000, $610,000, and $532,000 during 2019, 2018, and 2017, respectively.
Starting in 2010, the Company began offering its outside directors alternatives with respect to director compensation. The regular monthly board retainer can be received quarterly in the form of immediately vested, but restricted stock, with a market value of $7,500. Monthly meeting fees can be received as $725 per meeting in cash or $900 in immediately vested, but restricted stock. For 2019, 12 of the 13 outside directors elected to receive stock in lieu of cash for either all of part of their retainer or meeting fees. Only outside directors receive board fees. The Company issued 17,373, 15,471 and 13,093 shares and recognized share based compensation expense of $626,000, $586,000, and $484,000 during 2019, 2018 and 2017, respectively.
Note 17 – Income Taxes
The Company files income tax returns in the U.S. federal jurisdiction and the states of Virginia and North Carolina. With few exceptions, the Company is no longer subject to U.S. federal, state, and local income tax examinations by tax authorities for years prior to 2016.
90
The components of the Company's net deferred tax assets were as follows (dollars in thousands):
December 31, | |||||||
2019 | 2018 | ||||||
Deferred tax assets: | |||||||
Allowance for loan losses | $ | 2,841 | $ | 2,868 | |||
Nonaccrual loan interest | 490 | 460 | |||||
Other real estate owned valuation allowance | 120 | 69 | |||||
Deferred compensation | 1,184 | 832 | |||||
Net unrealized losses on securities | — | 1,147 | |||||
Acquisition accounting adjustments | 3,670 | 734 | |||||
Accrued pension liability | 50 | 36 | |||||
NOL Carryforward | 456 | — | |||||
Net unrealized loss on cash flow hedges | 573 | 180 | |||||
Other | 601 | 420 | |||||
Total deferred tax assets | 9,985 | 6,746 | |||||
Deferred tax liabilities: | |||||||
Depreciation | 1,079 | 759 | |||||
Accretion of discounts on securities | — | 24 | |||||
Core deposit intangibles | 1,669 | 208 | |||||
Net unrealized gains on securities | 799 | — | |||||
Other | 574 | 238 | |||||
Total deferred tax liabilities | 4,121 | 1,229 | |||||
Net deferred tax assets | $ | 5,864 | $ | 5,517 | |||
The provision for income taxes consists of the following (dollars in thousands):
Years Ended December 31, | |||||||||||
2019 | 2018 | 2017 | |||||||||
Current tax expense | $ | 3,793 | $ | 5,090 | $ | 7,355 | |||||
Deferred tax expense | 1,068 | 556 | 724 | ||||||||
Deferred tax asset adjustment for tax rate change | — | — | 2,747 | ||||||||
Total income tax expense | $ | 4,861 | $ | 5,646 | $ | 10,826 | |||||
A reconcilement of the "expected" federal income tax expense to reported income tax expense is as follows (dollars in thousands):
Years Ended December 31, | |||||||||||
2019 | 2018 | 2017 | |||||||||
Expected federal tax expense | $ | 5,411 | $ | 5,927 | $ | 9,126 | |||||
Tax impact from enacted change in tax rate | — | — | 2,747 | ||||||||
Nondeductible interest expense | 67 | 69 | 85 | ||||||||
Tax-exempt interest | (478 | ) | (504 | ) | (949 | ) | |||||
State income taxes | 149 | 337 | 296 | ||||||||
Other, net | (288 | ) | (183 | ) | (479 | ) | |||||
Total income tax expense | $ | 4,861 | $ | 5,646 | $ | 10,826 | |||||
Income tax expense for 2017 includes a downward adjustment of net deferred tax assets in the amount of $2,747,000, recorded as a result of the enactment of the Tax Cuts and Jobs Act on December 22, 2017 (the "Tax Reform Act"). The Tax Reform Act reduced the corporate federal tax rate from 35% to 21% effective January 1, 2018.
91
Note 18 – Earnings Per Common Share
The following shows the weighted average number of shares used in computing earnings per common share and the effect on the weighted average number of shares of potentially dilutive common stock. Potentially dilutive common stock had no effect on income available to common shareholders. Nonvested restricted shares are included in the computation of basic earnings per share as the holder is entitled to full shareholder benefits during the vesting period including voting rights and sharing in nonforfeitable dividends.
Years Ended December 31, | ||||||||||||||||||||
2019 | 2018 | 2017 | ||||||||||||||||||
Shares | Per Share Amount | Shares | Per Share Amount | Shares | Per Share Amount | |||||||||||||||
Basic earnings per share | 10,531,572 | $ | 1.99 | 8,698,014 | $ | 2.60 | 8,641,717 | $ | 1.76 | |||||||||||
Effect of dilutive securities - stock options | 9,765 | (0.01 | ) | 10,448 | (0.01 | ) | 18,911 | — | ||||||||||||
Diluted earnings per share | 10,541,337 | $ | 1.98 | 8,708,462 | $ | 2.59 | 8,660,628 | $ | 1.76 | |||||||||||
Outstanding stock options on common stock, which were not included in computing diluted earnings per share in 2019, 2018, and 2017 because their effects were anti-dilutive, were zero shares for 2019 and 2018, and 330 shares for 2017.
Note 19 – Off-Balance Sheet Activities
The Company is party to credit-related financial instruments with off-balance sheet risk in the normal course of business to meet the financing needs of its customers. These financial instruments include commitments to extend credit and standby letters of credit. Such commitments involve, to varying degrees, elements of credit and interest rate risk in excess of the amount recognized in the consolidated balance sheets. The Company evaluates each customer's credit worthiness on a case-by-case basis. The amount of collateral obtained, if applicable, is based on management's credit evaluation of the customer.
The Company's exposure to credit loss is represented by the contractual amount of these commitments. The Company follows the same credit policies in making commitments as it does for on-balance sheet instruments.
The following off-balance sheet financial instruments whose contract amounts represent credit risk were outstanding at December 31, 2019 and 2018 (dollars in thousands):
December 31, | |||||||
2019 | 2018 | ||||||
Commitments to extend credit | $ | 557,364 | $ | 362,586 | |||
Standby letters of credit | 13,611 | 15,555 | |||||
Mortgage loan rate lock commitments | 10,791 | 9,710 | |||||
Commitments to extend credit are agreements to lend to a customer as long as there is no violation of any condition established in the contract. These commitments generally consist of unused portions of lines of credit issued to customers. Commitments generally have fixed expiration dates or other termination clauses and may require payment of a fee. Since some of the commitments are expected to expire without being drawn upon, the total commitment amounts do not necessarily represent future cash requirements.
Standby letters of credit are conditional commitments issued by the Company to guarantee the performance of a customer to a third party. Those letters of credit are primarily issued to support public and private borrowing arrangements. The credit risk involved in issuing letters of credit is essentially the same as that involved in extending loans to customers.
At December 31, 2019, the Company had locked-rate commitments to originate mortgage loans amounting to approximately $10,791,000 and loans held for sale of $2,027,000. Risks arise from the possible inability of counterparties to meet the terms of their contracts, though the Company has never experienced a failure of one of its counterparties to perform. If a loan becomes past due 90 days within 180 days of sale, the Company would be required to repurchase the loan.
Note 20 – Related Party Transactions
In the ordinary course of business, loans are granted to executive officers, directors, and their related entities. Management believes that all such loans are made on substantially the same terms, including interest rates and collateral, as those prevailing at the time for comparable loans to similar, unrelated borrowers, and do not involve more than a normal risk of collectibility or
92
present other unfavorable features. As of December 31, 2019 and 2018, none of these loans was restructured, past due, or on nonaccrual status.
An analysis of these loans for 2019 is as follows (dollars in thousands):
Balance at December 31, 2018 | $ | 18,074 | |
Additions | 8,421 | ||
Repayments | (9,738 | ) | |
Reclassifications(1) | (7,163 | ) | |
Balance at December 31, 2019 | $ | 9,594 | |
(1) Includes loans to persons no longer affiliated with the Company and therefore not considered related party loans as of period end.
Related party deposits totaled $14,741,000 at December 31, 2019 and $18,280,000 at December 31, 2018.
93
Note 21 – Employee Benefit Plans
Defined Benefit Plan
The Company previously maintained a non-contributory defined benefit pension plan which covered substantially all employees who were 21 years of age or older and who had at least one year of service. The Company froze its pension plan to new participants and converted its pension plan to a cash balance plan effective December 31, 2009. Each year, existing participants will receive, with some adjustments, income based on the yield of the 10 year U.S. Treasury Note in December of the preceding year. Information pertaining to the activity in the plan is as follows (dollars in thousands):
As of and for the Years Ended December 31, | |||||||||||
2019 | 2018 | 2017 | |||||||||
Change in Benefit Obligation: | |||||||||||
Projected benefit obligation at beginning of year | $ | 5,812 | $ | 8,313 | $ | 7,932 | |||||
Service cost | — | — | — | ||||||||
Interest cost | 209 | 235 | 237 | ||||||||
Actuarial (gain) loss | 489 | (782 | ) | 611 | |||||||
Settlement gain | (236 | ) | (120 | ) | (3 | ) | |||||
Benefits paid | (12 | ) | (1,834 | ) | (464 | ) | |||||
Projected benefit obligation at end of year | 6,262 | 5,812 | 8,313 | ||||||||
Change in Plan Assets: | |||||||||||
Fair value of plan assets at beginning of year | 5,653 | 7,556 | 7,647 | ||||||||
Actual return (loss) on plan assets | 498 | (69 | ) | 373 | |||||||
Benefits paid | (236 | ) | (1,834 | ) | (464 | ) | |||||
Fair value of plan assets at end of year | 5,915 | 5,653 | 7,556 | ||||||||
Funded Status at End of Year | $ | (347 | ) | $ | (159 | ) | $ | (757 | ) | ||
Amounts Recognized in the Consolidated Balance Sheets | |||||||||||
Other liabilities | $ | (347 | ) | $ | (159 | ) | $ | (757 | ) | ||
Amounts Recognized in Accumulated Other Comprehensive Loss | |||||||||||
Net actuarial loss | $ | 1,658 | $ | 1,594 | $ | 2,886 | |||||
Deferred income taxes | (358 | ) | (357 | ) | (606 | ) | |||||
Amount recognized | $ | 1,300 | $ | 1,237 | $ | 2,280 | |||||
As of and for the Years Ended December 31, | |||||||||||
2019 | 2018 | 2017 | |||||||||
Components of Net Periodic Benefit Cost | |||||||||||
Service cost | $ | — | $ | — | $ | — | |||||
Interest cost | 209 | 235 | 237 | ||||||||
Expected return on plan assets | (269 | ) | (353 | ) | (353 | ) | |||||
Recognized net loss due to settlement | 52 | 540 | 135 | ||||||||
Recognized net actuarial loss | 133 | 272 | 218 | ||||||||
Net periodic benefit cost | $ | 125 | $ | 694 | $ | 237 | |||||
Other Changes in Plan Assets and Benefit Obligations Recognized in Other Comprehensive (Income) Loss | |||||||||||
Net actuarial (gain) loss | $ | 64 | $ | (1,291 | ) | $ | 234 | ||||
Amortization of prior service cost | — | — | — | ||||||||
Total recognized in other comprehensive (income) loss | $ | 64 | $ | (1,291 | ) | $ | 234 | ||||
Total Recognized in Net Periodic Benefit Cost and Other Comprehensive (Income) Loss | $ | 189 | $ | (597 | ) | $ | 471 | ||||
94
The accumulated benefit obligation as of December 31, 2019, 2018, and 2017 was $6,262,000, $5,812,000, and $8,313,000, respectively. The rate of compensation increase is no longer applicable since the defined benefit plan was frozen and converted to a cash balance plan.
The plan sponsor selected the expected long-term rate-of-return-on-assets assumption in consultation with their investment advisors and actuary. This rate was intended to reflect the average rate of earnings expected to be earned on the funds invested or to be invested to provide plan benefits. Historical performance is reviewed, especially with respect to real rates of return (net of inflation), for the major asset classes held or anticipated to be held by the trust, and for the trust itself. Undue weight is not given to recent experience that may not continue over the measurement period, with higher significance placed on current forecasts of future long-term economic conditions.
Because assets are held in a qualified trust, anticipated returns are not reduced for taxes. Further, solely for this purpose, the plan is assumed to continue in force and not terminate during the period in which assets are invested. However, consideration is given to the potential impact of current and future investment policy, cash flow into and out of the trust, and expenses (both investment and non-investment) typically paid from plan assets (to the extent such expenses are not explicitly estimated within periodic cost).
Below is a description of the plan's assets. The plan's weighted-average asset allocations by asset category are as follows as of December 31, 2019 and 2018:
Asset Category | December 31, | ||||
2019 | 2018 | ||||
Fixed Income | 61.8 | % | 68.0 | % | |
Equity | 27.5 | % | 25.2 | % | |
Cash and Accrued Income | 10.7 | % | 6.8 | % | |
Total | 100.0 | % | 100.0 | % | |
The investment policy and strategy for plan assets can best be described as a growth and income strategy. Diversification is accomplished by limiting the holding of any one equity issuer to no more than 5% of total equities. Exchange traded funds are used to provide diversified exposure to the small capitalization and international equity markets. All fixed income investments are rated as investment grade, with the majority of these assets invested in corporate issues. The assets are managed by the Company's Trust and Investment Services Division. No derivatives are used to manage the assets. Equity securities do not include holdings in the Company.
The fair value of the Company's pension plan assets at December 31, 2019 and 2018, by asset category are as follows (dollars in thousands):
Fair Value Measurements at December 31, 2019 Using | |||||||||||||||
Balance at December 31, | Quoted Prices in Active Markets for Identical Assets | Significant Other Observable Inputs | Significant Unobservable Inputs | ||||||||||||
Asset Category | 2019 | Level 1 | Level 2 | Level 3 | |||||||||||
Cash | $ | 636 | $ | 636 | $ | — | $ | — | |||||||
Fixed income securities | |||||||||||||||
Government sponsored entities | 1,648 | — | 1,648 | — | |||||||||||
Municipal bonds and notes | 1,792 | — | 1,792 | — | |||||||||||
Corporate bonds and notes | 212 | — | 212 | — | |||||||||||
Equity securities | |||||||||||||||
U.S. companies | 1,385 | 1,385 | — | — | |||||||||||
Foreign companies | 242 | 242 | — | — | |||||||||||
$ | 5,915 | $ | 2,263 | $ | 3,652 | $ | — | ||||||||
95
Fair Value Measurements at December 31, 2018 Using | |||||||||||||||
Balance at December 31, | Quoted Prices in Active Markets for Identical Assets | Significant Other Observable Inputs | Significant Unobservable Inputs | ||||||||||||
Asset Category | 2018 | Level 1 | Level 2 | Level 3 | |||||||||||
Cash | $ | 359 | $ | 359 | $ | — | $ | — | |||||||
Fixed income securities | |||||||||||||||
Government sponsored entities | 2,119 | — | 2,119 | — | |||||||||||
Municipal bonds and notes | 1,513 | — | 1,513 | — | |||||||||||
Corporate bonds and notes | 237 | — | 237 | — | |||||||||||
Equity securities | |||||||||||||||
U.S. companies | 1,227 | 1,227 | — | — | |||||||||||
Foreign companies | 198 | 198 | — | — | |||||||||||
$ | 5,653 | $ | 1,784 | $ | 3,869 | $ | — | ||||||||
Projected benefit payments for the years 2020 to 2029 are as follows (dollars in thousands):
Year | Amount | ||
2020 | $ | 496 | |
2021 | 637 | ||
2022 | 346 | ||
2023 | 960 | ||
2024 | 242 | ||
2025 - 2029 | 3,031 | ||
401(k) Plan
The Company maintains a 401(k) plan that covers substantially all full-time employees of the Company. The Company matches a portion of the contribution made by employee participants after at least one year of service. The Company contributed $932,000, $778,000, and $763,000 to the 401(k) plan in 2019, 2018, and 2017, respectively. These amounts are included in employee benefits expense for the respective years.
Deferred Compensation Arrangements
Prior to 2015, the Company maintained deferred compensation agreements with former employees providing for annual payments to each ranging from $25,000 to $50,000 per year for ten years upon their retirement. The liabilities under these agreements are being accrued over the officers' remaining periods of employment so that, on the date of their retirement, the then-present value of the annual payments would have been accrued. As of December 31, 2019, the Company only had one remaining agreement under which payments are being made to a former officer. The liabilities were $250,000 and $300,000 at December 31, 2019 and 2018, respectively. The expense for these agreements was $0, $0, and $3,000 for the years ended December 31, 2019, 2018, and 2017, respectively. As a result of acquisitions, the Company has various agreements with current and former employees and executives with balances of $5,235,000 and $3,412,000 at December 31, 2019 and 2018, respectively that accrue through eligibility and are payable upon retirement.
Beginning in 2015, certain named executive officers became eligible to participate in a voluntary, nonqualified deferred compensation plan pursuant to which the officers may defer any portion of their annual cash incentive payments. In addition, the Company may make discretionary cash bonus contributions to the deferred compensation plan. Such contributions, if any, are made on an annual basis after the Committee assesses the performance of each of the named executive officers and the Company during the most recently completed fiscal year. The contributions charged to salary expense were $158,000, $141,000 and $135,000 for the years ended December 31, 2019, 2018 and 2017, respectively.
Incentive Arrangements
The Company maintains a cash incentive compensation plan for officers based on the Company's performance and individual officer goals. The total amount charged to salary expense for this plan was $1,217,000, $1,643,000, and $1,108,000 for the years ended December 31, 2019, 2018, and 2017, respectively.
96
Note 22 – Fair Value Measurements
Determination of Fair Value
The Company uses fair value measurements to record fair value adjustments to certain assets and liabilities and to determine fair value disclosures. In accordance with the fair value measurements and disclosures topic of FASB ASC 825, Financial Instruments, the fair value of a financial instrument is the price that would be received to sell an asset or paid to transfer a liability (an exit price) in the principal or most advantageous market for the asset or liability in an orderly transaction between market participants at the measurement date. Fair value is best determined based upon quoted market prices. However, in many instances, there are no quoted market prices for the Company's various financial instruments. In cases where quoted market prices are not available, fair values are based on estimates using present value or other valuation techniques. Those techniques are significantly affected by the assumptions used, including the discount rate and estimates of future cash flows. Accordingly, the fair value estimates may not be realized in an immediate settlement of the instrument. The fair value guidance provides a consistent definition of fair value, which focuses on exit price in the principal or most advantageous market for the asset or liability in an orderly transaction (that is, not a forced liquidation or distressed sale) between market participants at the measurement date under current market conditions. If there has been a significant decrease in the volume and level of activity for the asset or liability, a change in valuation technique or the use of multiple valuation techniques may be appropriate. In such instances, determining the price at which willing market participants would transact at the measurement date under current market conditions depends on the facts and circumstances and requires the use of significant judgment. The fair value is a reasonable point within the range that is most representative of fair value under current market conditions.
Fair Value Hierarchy
In accordance with this guidance, the Company groups its financial assets and financial liabilities generally measured at fair value in three levels, based on the markets in which the assets and liabilities are traded and the reliability of the assumptions used to determine fair value.
Level 1 – | Valuation is based on quoted prices in active markets for identical assets and liabilities. |
Level 2 – | Valuation is based on observable inputs including quoted prices in active markets for similar assets and liabilities, quoted prices for identical or similar assets and liabilities in less active markets, and model-based valuation techniques for which significant assumptions can be derived primarily from or corroborated by observable data in the market. |
Level 3 – | Valuation is based on model-based techniques that use one or more significant inputs or assumptions that are unobservable in the market. |
The following describes the valuation techniques used by the Company to measure certain financial assets and liabilities recorded at fair value on a recurring basis in the financial statements:
Securities available for sale and equity securities: Securities available for sale are recorded at fair value on a recurring basis. Fair value measurement is based upon quoted market prices, when available (Level 1). If quoted market prices are not available, fair values are measured utilizing independent valuation techniques of identical or similar securities for which significant assumptions are derived primarily from or corroborated by observable market data. Third party vendors compile prices from various sources and may determine the fair value of identical or similar securities by using pricing models that consider observable market data (Level 2).
Derivative asset (liability) - cash flow hedges: Cash flow hedges are recorded at fair value on a recurring basis. Cash flow hedges are valued by a third party using significant assumptions that are observable in the market and can be corroborated by market data. All of the Company's cash flow hedges are classified as Level 2.
97
The following table presents the balances of financial assets and liabilities measured at fair value on a recurring basis during the period (dollars in thousands):
Fair Value Measurements at December 31, 2019 Using | |||||||||||||||
Balance as of December 31, | Quoted Prices in Active Markets for Identical Assets | Significant Other Observable Inputs | Significant Unobservable Inputs | ||||||||||||
Description | 2019 | Level 1 | Level 2 | Level 3 | |||||||||||
Assets: | |||||||||||||||
Securities available for sale: | |||||||||||||||
U.S. Treasury | $ | 14,987 | $ | — | $ | 14,987 | $ | — | |||||||
Federal agencies and GSEs | 128,114 | — | 128,114 | — | |||||||||||
Mortgage-backed and CMOs | 184,240 | — | 184,240 | — | |||||||||||
State and municipal | 42,154 | — | 42,154 | — | |||||||||||
Corporate | 9,700 | — | 9,700 | — | |||||||||||
Total securities available for sale | $ | 379,195 | $ | — | $ | 379,195 | $ | — | |||||||
Liabilities: | |||||||||||||||
Derivative - cash flow hedges | $ | 2,658 | $ | — | $ | 2,658 | $ | — | |||||||
Fair Value Measurements at December 31, 2018 Using | |||||||||||||||
Balance as of December 31, | Quoted Prices in Active Markets for Identical Assets | Significant Other Observable Inputs | Significant Unobservable Inputs | ||||||||||||
Description | 2018 | Level 1 | Level 2 | Level 3 | |||||||||||
Assets: | |||||||||||||||
Securities available for sale: | |||||||||||||||
Federal agencies and GSEs | $ | 134,039 | $ | — | $ | 134,039 | $ | — | |||||||
Mortgage-backed and CMOs | 111,867 | — | 111,867 | — | |||||||||||
State and municipal | 79,902 | — | 79,902 | — | |||||||||||
Corporate | 6,845 | — | 6,845 | — | |||||||||||
Total securities available for sale | $ | 332,653 | $ | — | $ | 332,653 | $ | — | |||||||
Equity securities | $ | 1,830 | $ | — | $ | 1,830 | $ | — | |||||||
Liabilities: | |||||||||||||||
Derivative - cash flow hedges | $ | 804 | $ | — | $ | 804 | $ | — | |||||||
Certain assets are measured at fair value on a nonrecurring basis in accordance with GAAP. Adjustments to the fair value of these assets usually result from the application of lower-of-cost-or-market accounting or write-downs of individual assets.
The following describes the valuation techniques used by the Company to measure certain assets recorded at fair value on a nonrecurring basis in the financial statements:
Loans held for sale: Loans held for sale are carried at fair value. These loans currently consist of one-to-four family residential loans originated for sale in the secondary market. Fair value is based on the price secondary markets are currently offering for similar loans using observable market data which is not materially different than cost due to the short duration between origination and sale (Level 2). As such, the Company records any fair value adjustments on a nonrecurring basis. No nonrecurring fair value adjustments were recorded on loans held for sale during the years ended December 31, 2019 and 2018. Gains and losses on the sale of loans are recorded within mortgage banking income on the consolidated statements of income.
Impaired loans: Loans are designated as impaired when, in the judgment of management based on current information and events, it is probable that all amounts due according to the contractual terms of the loan agreements will not be collected when due. The measurement of loss associated with impaired loans can be based on either the observable market price of the loan or the fair value of the collateral. Collateral may be in the form of real estate or business assets including equipment, inventory, and accounts receivable. The vast majority of the Company's collateral is real estate. The value of real estate collateral is determined utilizing a market valuation approach based on an appraisal, of one year or less, conducted by an independent,
98
licensed appraiser using observable market data (Level 2). However, if the collateral is a house or building in the process of construction or if an appraisal of the property is more than one year old and not solely based on observable market comparables or management determines the fair value of the collateral is further impaired below the appraised value, then a Level 3 valuation is considered to measure the fair value. The value of business equipment is based upon an outside appraisal, of one year or less, if deemed significant, or the net book value on the applicable business's financial statements if not considered significant using observable market data. Likewise, values for inventory and accounts receivables collateral are based on financial statement balances or aging reports (Level 3). Impaired loans allocated to the allowance for loan losses are measured at fair value on a nonrecurring basis. Any fair value adjustments are recorded in the period incurred as provision for loan losses on the consolidated statements of income.
Other real estate owned: Measurement for fair values for other real estate owned are the same as impaired loans. Any fair value adjustments are recorded in the period incurred as a valuation allowance against OREO with the associated expense included in OREO expense, net on the consolidated statements of income.
The following table summarizes the Company's assets that were measured at fair value on a nonrecurring basis during the period (dollars in thousands):
Fair Value Measurements at December 31, 2019 Using | |||||||||||||||
Balance as of December 31, | Quoted Prices in Active Markets for Identical Assets | Significant Other Observable Inputs | Significant Unobservable Inputs | ||||||||||||
Description | 2019 | Level 1 | Level 2 | Level 3 | |||||||||||
Assets: | |||||||||||||||
Loans held for sale | $ | 2,027 | $ | — | $ | 2,027 | $ | — | |||||||
Impaired loans, net of valuation allowance | 759 | — | — | 759 | |||||||||||
Other real estate owned, net | 1,308 | — | — | 1,308 | |||||||||||
Fair Value Measurements at December 31, 2018 Using | |||||||||||||||
Balance as of December 31, | Quoted Prices in Active Markets for Identical Assets | Significant Other Observable Inputs | Significant Unobservable Inputs | ||||||||||||
Description | 2018 | Level 1 | Level 2 | Level 3 | |||||||||||
Assets: | |||||||||||||||
Loans held for sale | $ | 640 | $ | — | $ | 640 | $ | — | |||||||
Impaired loans, net of valuation allowance | 171 | — | — | 171 | |||||||||||
Other real estate owned, net | 869 | — | — | 869 | |||||||||||
Quantitative Information About Level 3 Fair Value Measurements as of December 31, 2019 and 2018:
Assets | Valuation Technique | Unobservable Input | Rate | ||||
Impaired loans | Discounted appraised value | Selling cost | 8.00 | % | |||
Impaired loans | Discounted cash flow analysis | Market rate for borrower (discount rate) | 3.25% - 9.80% | ||||
Other real estate owned | Discounted appraised value | Selling cost | 8.00 | % | |||
FASB ASC 825, Financial Instruments, requires disclosure about fair value of financial instruments, including those financial assets and financial liabilities that are not required to be measured and reported at fair value on a recurring or nonrecurring basis. ASC 825 excludes certain financial instruments and all nonfinancial instruments from its disclosure requirements. Accordingly, the aggregate fair value amounts presented may not necessarily represent the underlying fair value of the Company. Additionally, in accordance with ASU 2016-01, which the Company adopted January 1, 2018 on a prospective basis, the Company uses the exit price notion, rather than the entry price notion, in calculating the fair values of financial instruments not measured at fair value on a recurring basis.
99
The carrying values and estimated fair values of the Company's financial instruments at December 31, 2019 are as follows (dollars in thousands):
Fair Value Measurements at December 31, 2019 Using | |||||||||||||||||||
Carrying Value | Quoted Prices in Active Markets for Identical Assets | Significant Other Observable Inputs | Significant Unobservable Inputs | Fair Value Balance | |||||||||||||||
Level 1 | Level 2 | Level 3 | |||||||||||||||||
Financial Assets: | |||||||||||||||||||
Cash and cash equivalents | $ | 79,582 | $ | 79,582 | $ | — | $ | — | $ | 79,582 | |||||||||
Securities available for sale | 379,195 | — | 379,195 | — | 379,195 | ||||||||||||||
Restricted stock | 8,630 | — | 8,630 | — | 8,630 | ||||||||||||||
Loans held for sale | 2,027 | — | 2,027 | — | 2,027 | ||||||||||||||
Loans, net of allowance | 1,817,663 | — | — | 1,818,655 | 1,818,655 | ||||||||||||||
Bank owned life insurance | 27,817 | — | 27,817 | — | 27,817 | ||||||||||||||
Accrued interest receivable | 6,625 | — | 6,625 | — | 6,625 | ||||||||||||||
Financial Liabilities: | |||||||||||||||||||
Deposits | $ | 2,060,547 | $ | — | $ | 2,062,823 | $ | — | $ | 2,062,823 | |||||||||
Repurchase agreements | 40,475 | — | 40,475 | — | 40,475 | ||||||||||||||
Subordinated debt | 7,517 | — | 8,525 | — | 8,525 | ||||||||||||||
Junior subordinated debt | 28,029 | — | — | 22,697 | 22,697 | ||||||||||||||
Accrued interest payable | 1,213 | — | 1,213 | — | 1,213 | ||||||||||||||
Derivative - cash flow hedges | 2,658 | — | 2,658 | — | 2,658 | ||||||||||||||
The carrying values and estimated fair values of the Company's financial instruments at December 31, 2018 are as follows (dollars in thousands):
Fair Value Measurements at December 31, 2018 Using | |||||||||||||||||||
Carrying Value | Quoted Prices in Active Markets for Identical Assets | Significant Other Observable Inputs | Significant Unobservable Inputs | Fair Value Balance | |||||||||||||||
Level 1 | Level 2 | Level 3 | |||||||||||||||||
Financial Assets: | |||||||||||||||||||
Cash and cash equivalents | $ | 64,255 | $ | 64,255 | $ | — | $ | — | $ | 64,255 | |||||||||
Equity securities | 1,830 | — | 1,830 | — | 1,830 | ||||||||||||||
Securities available for sale | 332,653 | — | 332,653 | — | 332,653 | ||||||||||||||
Restricted stock | 5,247 | — | 5,247 | — | 5,247 | ||||||||||||||
Loans held for sale | 640 | — | 640 | — | 640 | ||||||||||||||
Loans, net of allowance | 1,344,671 | — | — | 1,334,236 | 1,334,236 | ||||||||||||||
Bank owned life insurance | 18,941 | — | 18,941 | — | 18,941 | ||||||||||||||
Accrued interest receivable | 5,449 | — | 5,449 | — | 5,449 | ||||||||||||||
Financial Liabilities: | |||||||||||||||||||
Deposits | $ | 1,566,227 | $ | — | $ | 1,570,721 | $ | — | $ | 1,570,721 | |||||||||
Repurchase agreements | 35,243 | — | 35,243 | — | 35,243 | ||||||||||||||
Junior subordinated debt | 27,927 | — | — | 22,577 | 22,577 | ||||||||||||||
Accrued interest payable | 795 | — | 795 | — | 795 | ||||||||||||||
Derivative - cash flow hedges | 804 | — | 804 | — | 804 | ||||||||||||||
100
Note 23 – Dividend Restrictions and Regulatory Capital
The approval of the Office of the Comptroller of the Currency is required if the total of all dividends declared by a national bank in any calendar year exceeds the bank's retained net income, as defined, for that year combined with its retained net income for the preceding two calendar years. Under this formula, the Bank can distribute as dividends to the Company, without the approval of the Office of the Comptroller of the Currency, up to $21,768,000 as of December 31, 2019. Dividends paid by the Bank to the Company are the only significant source of funding for dividends paid by the Company to its shareholders.
Federal bank regulators have issued substantially similar guidelines requiring banks and bank holding companies to maintain capital at certain levels. In addition, regulators may from time to time require that a banking organization maintain capital above the minimum levels because of its financial condition or actual or anticipated growth. Failure to meet minimum capital requirements can trigger certain mandatory and discretionary actions by regulators that could have a direct material effect on the Company’s financial condition and results of operations.
The Federal Reserve and Office of the Comptroller of the Currency have adopted rules to implement the Basel III capital framework as outlined by the Basel Committee on Banking Supervision and certain provisions of the Dodd-Frank Wall Street Reform and Consumer Protection Act (the "Basel III Capital Rules"). The Basel III Capital Rules require banks and bank holding companies to comply with certain minimum capital ratios, plus a "capital conservation buffer," as set forth in the table below. The capital conservation buffer requirement was phased in beginning on January 1, 2016, at 0.625% of risk-weighted assets, and increased by the same amount each year until it was fully implemented at 2.5% on January 1, 2019. The capital conservation buffer is designed to absorb losses during periods of economic stress and is applicable to all ratios except the leverage capital ratio.
The Company meets the eligibility criteria of a small bank holding company in accordance with the Federal Reserve’s Small Bank Holding Company Policy Statement (the "SBHC Policy Statement"). Under the SBHC Policy Statement, qualifying bank holding companies, such as the Company, have additional flexibility in the amount of debt they can issue and are also exempt from the Basel III Capital Rules. However, the Company does not currently intend to issue a material amount of debt or take any other action that would cause its capital ratios to fall below the minimum ratios required by the Basel III Capital Rules. The SBHC Policy Statement does not apply to the Bank, and the Bank must comply with the Basel III Capital Rules. The Bank must also comply with the capital requirements set forth in the "prompt corrective action" regulations pursuant to Section 38 of the Federal Deposit Insurance Act. The minimum capital ratios for the Bank to be considered "well capitalized" are set forth in the table below.
Management believes that as of December 31, 2019, the Company and Bank meet all capital adequacy requirements to which they are subject. At year-end 2019 and 2018, the most recent regulatory notifications categorized the Bank as "well capitalized" under the regulatory framework for prompt corrective action. There are no conditions or events since that notification that management believes have changed the Bank's category.
101
Actual and required capital amounts (in thousands) and ratios are presented below at year-end:
Actual | Required for Capital Adequacy Purposes* | To Be Well Capitalized Under Prompt Corrective Action Provisions | ||||||||||||||||||
Amount | Ratio | Amount | Ratio | Amount | Ratio | |||||||||||||||
December 31, 2019 | ||||||||||||||||||||
Common Equity Tier 1 | ||||||||||||||||||||
Company | $ | 228,554 | 11.56 | % | $ | 88,968 | >7.00 | % | ||||||||||||
Bank | 243,449 | 12.38 | 137,698 | >7.00 | $ | 127,862 | >6.50 | % | ||||||||||||
Tier 1 Capital | ||||||||||||||||||||
Company | 256,583 | 12.98 | 118,624 | >8.50 | ||||||||||||||||
Bank | 243,449 | 12.38 | 167,205 | >8.50 | 157,369 | >8.00 | ||||||||||||||
Total Capital | ||||||||||||||||||||
Company | 277,581 | 14.04 | 158,166 | >10.50 | ||||||||||||||||
Bank | 256,930 | 13.06 | 206,547 | >10.50 | 196,712 | >10.00 | ||||||||||||||
Leverage Capital | ||||||||||||||||||||
Company | 256,583 | 10.75 | 95,514 | >4.00 | ||||||||||||||||
Bank | 243,449 | 10.25 | 94,972 | >4.00 | 118,715 | >5.00 | ||||||||||||||
December 31, 2018 | ||||||||||||||||||||
Common Equity Tier 1 | ||||||||||||||||||||
Company | $ | 183,579 | 12.55 | % | $ | 65,843 | >6.375 | % | ||||||||||||
Bank | 198,991 | 13.68 | 92,740 | >6.375 | $ | 94,559 | >6.50 | % | ||||||||||||
Tier 1 Capital | ||||||||||||||||||||
Company | 211,506 | 14.46 | 87,791 | >7.875 | ||||||||||||||||
Bank | 198,991 | 13.68 | 114,561 | >7.875 | 116,380 | >8.00 | ||||||||||||||
Total Capital | ||||||||||||||||||||
Company | 224,528 | 15.35 | 117,054 | >9.875 | ||||||||||||||||
Bank | 212,013 | 14.57 | 143,656 | >9.875 | 145,475 | >10.00 | ||||||||||||||
Leverage Capital | ||||||||||||||||||||
Company | 211,506 | 11.62 | 72,817 | >4.00 | ||||||||||||||||
Bank | 198,991 | 10.99 | 72,422 | >4.00 | 90,528 | >5.00 | ||||||||||||||
______________________
* | Except with regard to the Company's and the Bank's leverage capital ratio, includes the phased-in portion of the Basel III Capital Rule's capital conservation buffer. |
Note 24 – Segment and Related Information
The Company has two reportable segments, community banking and trust and investment services.
Community banking involves making loans to and generating deposits from individuals and businesses. All assets and liabilities of the Company are allocated to community banking. Investment income from securities is also allocated to the community banking segment. Loan fee income, service charges from deposit accounts, and non-deposit fees such as automated teller machine fees and insurance commissions generate additional income for the community banking segment.
Trust and investment services include estate planning, trust account administration, investment management, and retail brokerage. Investment management services include purchasing equity, fixed income, and mutual fund investments for customer accounts. The trust and investment services segment receives fees for investment and administrative services.
102
Amounts shown in the "Other" column include activities of the Company which are primarily debt service on Trust Preferred Securities and corporate items.
Segment information as of and for the years ended December 31, 2019, 2018, and 2017, is shown in the following table (dollars in thousands):
2019 | |||||||||||||||||||
Community Banking | Trust and Investment Services | Other | Intersegment Eliminations | Total | |||||||||||||||
Interest income | $ | 92,404 | $ | — | $ | 451 | $ | — | $ | 92,855 | |||||||||
Interest expense | 13,803 | — | 1,925 | — | 15,728 | ||||||||||||||
Noninterest income | 10,230 | 4,568 | 372 | — | 15,170 | ||||||||||||||
Income (loss) before income taxes | 26,888 | 2,288 | (3,409 | ) | — | 25,767 | |||||||||||||
Net income (loss) | 21,858 | 1,856 | (2,808 | ) | — | 20,906 | |||||||||||||
Depreciation and amortization | 3,454 | 8 | — | — | 3,462 | ||||||||||||||
Total assets | 2,464,860 | — | 358,601 | (344,911 | ) | 2,478,550 | |||||||||||||
Goodwill | 84,002 | — | — | — | 84,002 | ||||||||||||||
Capital expenditures | 3,534 | 21 | — | — | 3,555 | ||||||||||||||
2018 | |||||||||||||||||||
Community Banking | Trust and Investment Services | Other | Intersegment Eliminations | Total | |||||||||||||||
Interest income | $ | 68,388 | $ | — | $ | 380 | $ | — | $ | 68,768 | |||||||||
Interest expense | 8,272 | — | 1,402 | — | 9,674 | ||||||||||||||
Noninterest income | 8,619 | 4,579 | 76 | — | 13,274 | ||||||||||||||
Income (loss) before income taxes | 28,000 | 2,165 | (1,940 | ) | — | 28,225 | |||||||||||||
Net income (loss) | 22,381 | 1,731 | (1,533 | ) | — | 22,579 | |||||||||||||
Depreciation and amortization | 2,030 | 10 | — | — | 2,040 | ||||||||||||||
Total assets | 1,853,057 | — | 251,434 | (241,625 | ) | 1,862,866 | |||||||||||||
Goodwill | 43,872 | — | — | — | 43,872 | ||||||||||||||
Capital expenditures | 2,723 | — | — | — | 2,723 | ||||||||||||||
2017 | |||||||||||||||||||
Community Banking | Trust and Investment Services | Other | Intersegment Eliminations | Total | |||||||||||||||
Interest income | $ | 62,697 | $ | — | $ | 341 | $ | — | $ | 63,038 | |||||||||
Interest expense | 6,263 | — | 1,028 | — | 7,291 | ||||||||||||||
Noninterest income | 9,224 | 4,756 | 247 | — | 14,227 | ||||||||||||||
Income (loss) before income taxes | 24,828 | 2,521 | (1,274 | ) | — | 26,075 | |||||||||||||
Net income (loss) | 14,456 | 1,486 | (693 | ) | — | 15,249 | |||||||||||||
Depreciation and amortization | 2,393 | 12 | — | — | 2,405 | ||||||||||||||
Total assets | 1,806,647 | — | 236,644 | (227,213 | ) | 1,816,078 | |||||||||||||
Goodwill | 43,872 | — | — | — | 43,872 | ||||||||||||||
Capital expenditures | 2,637 | 11 | — | — | 2,648 | ||||||||||||||
103
Note 25 – Parent Company Financial Information
Condensed Parent Company financial information is as follows (dollars in thousands):
December 31, | |||||||
Condensed Balance Sheets | 2019 | 2018 | |||||
Cash | $ | 11,127 | $ | 3,596 | |||
Equity securities, at fair value | — | 1,830 | |||||
Securities available for sale, at fair value | 8,683 | 6,361 | |||||
Investment in subsidiaries | 337,983 | 239,413 | |||||
Due from subsidiaries | 134 | 170 | |||||
Other assets | 674 | 64 | |||||
Total Assets | $ | 358,601 | $ | 251,434 | |||
Subordinated debt | $ | 7,517 | $ | — | |||
Junior subordinated debt | 28,029 | 27,927 | |||||
Other liabilities | 2,797 | 965 | |||||
Shareholders' equity | 320,258 | 222,542 | |||||
Total Liabilities and Shareholders' Equity | $ | 358,601 | $ | 251,434 | |||
Years Ended December 31, | |||||||||||
Condensed Statements of Income | 2019 | 2018 | 2017 | ||||||||
Dividends from subsidiary | $ | 25,000 | $ | 11,000 | $ | 6,000 | |||||
Other income | 823 | 456 | 588 | ||||||||
Expenses | 4,232 | 2,396 | 1,862 | ||||||||
Income tax benefit | (601 | ) | (407 | ) | (581 | ) | |||||
Income before equity in undistributed earnings of subsidiary | 22,192 | 9,467 | 5,307 | ||||||||
Equity in undistributed earnings of subsidiary | (1,286 | ) | 13,112 | 9,942 | |||||||
Net Income | $ | 20,906 | $ | 22,579 | $ | 15,249 | |||||
104
Years Ended December 31, | |||||||||||
Condensed Statements of Cash Flows | 2019 | 2018 | 2017 | ||||||||
Cash Flows from Operating Activities: | |||||||||||
Net income | $ | 20,906 | $ | 22,579 | $ | 15,249 | |||||
Adjustments to reconcile net income to net cash provided by operating activities: | |||||||||||
Gain on sale of securities | — | — | (221 | ) | |||||||
Equity in (undistributed) distributions of subsidiary | 1,286 | (13,112 | ) | (9,942 | ) | ||||||
Net change in other assets | (382 | ) | (194 | ) | 83 | ||||||
Net change in other liabilities | (35 | ) | 136 | (82 | ) | ||||||
Net cash provided by operating activities | 21,775 | 9,409 | 5,087 | ||||||||
Cash Flows from Investing Activities: | |||||||||||
Purchases of securities available for sale | (2,220 | ) | — | (373 | ) | ||||||
Sales of equity securities | 445 | 431 | — | ||||||||
Sales of securities available for sale | — | — | 500 | ||||||||
Cash paid in bank acquisition | (27 | ) | — | — | |||||||
Cash acquired in bank acquisition | 981 | — | — | ||||||||
Net cash provided by (used in) investing activities | (821 | ) | 431 | 127 | |||||||
Cash Flows from Financing Activities: | |||||||||||
Common stock dividends paid | (10,965 | ) | (8,702 | ) | (8,384 | ) | |||||
Repurchase of common stock | (3,146 | ) | — | — | |||||||
Proceeds from exercise of stock options | 688 | 861 | 113 | ||||||||
Net cash used in financing activities | (13,423 | ) | (7,841 | ) | (8,271 | ) | |||||
Net increase (decrease) in cash and cash equivalents | 7,531 | 1,999 | (3,057 | ) | |||||||
Cash and cash equivalents at beginning of period | 3,596 | 1,597 | 4,654 | ||||||||
Cash and cash equivalents at end of period | $ | 11,127 | $ | 3,596 | $ | 1,597 | |||||
Note 26 – Concentrations of Credit Risk
Substantially all of the Company's loans are made within its market area, which includes Southern and Central Virginia and the northern portion of Central North Carolina. The ultimate collectibility of the Company's loan portfolio and the ability to realize the value of any underlying collateral, if necessary, are impacted by the economic conditions and real estate values of the market area.
Loans secured by real estate were $1,480,857,000, or 80.9% of the loan portfolio at December 31, 2019, and $1,066,411,000, or 78.6% of the loan portfolio at December 31, 2018. Loans secured by commercial real estate represented the largest portion of loans at $899,199,000 at December 31, 2019 and $655,800,000 at December 31, 2018, 49.1% and 48.3%, respectively, of total loans. There were no concentrations of loans to any individual, group of individuals, business, or industry that exceeded 10% of total loans at December 31, 2019 or 2018.
105
Note 27 – Supplemental Cash Flow Information
(dollars in thousands) | For the Years Ended December 31, | ||||||||||
2019 | 2018 | 2017 | |||||||||
Supplemental Schedule of Cash and Cash Equivalents: | |||||||||||
Cash and due from banks | $ | 32,505 | $ | 29,587 | $ | 28,594 | |||||
Interest-bearing deposits in other banks | 47,077 | 34,668 | 23,883 | ||||||||
$ | 79,582 | $ | 64,255 | $ | 52,477 | ||||||
Supplemental Disclosure of Cash Flow Information: | |||||||||||
Cash paid for: | |||||||||||
Interest on deposits and borrowed funds | $ | 15,310 | $ | 9,553 | $ | 7,240 | |||||
Income taxes | 4,698 | 5,056 | 7,653 | ||||||||
Noncash investing and financing activities: | |||||||||||
Transfer of loans to other real estate owned | 234 | 599 | 1,233 | ||||||||
Transfer from premises and equipment to other assets | 445 | — | — | ||||||||
Increase in operating lease right-of-use asset | 4,453 | — | — | ||||||||
Increase in operating lease liability | 4,453 | — | — | ||||||||
Unrealized gains (losses) on securities available for sale | 8,821 | (3,290 | ) | (777 | ) | ||||||
Unrealized losses on cash flow hedges | (1,854 | ) | (804 | ) | — | ||||||
Change in unfunded pension liability | (64 | ) | 1,291 | (234 | ) | ||||||
Non-cash transactions related to acquisitions: | |||||||||||
Assets acquired: | |||||||||||
Investment securities | 34,876 | — | — | ||||||||
Restricted stock | 2,588 | — | — | ||||||||
Loans | 444,324 | — | — | ||||||||
Premises and equipment | 12,554 | — | — | ||||||||
Deferred income taxes | 2,960 | — | — | ||||||||
Core deposit intangible | 8,200 | — | — | ||||||||
Other real estate owned | 1,442 | — | — | ||||||||
Bank owned life insurance | 8,246 | — | — | ||||||||
Other assets | 14,244 | — | — | ||||||||
Liabilities assumed: | |||||||||||
Deposits | 483,626 | — | — | ||||||||
Short-term FHLB advances | 14,883 | — | — | ||||||||
Long-term FHLB advances | 778 | — | — | ||||||||
Subordinated debt | 7,530 | — | — | ||||||||
Other liabilities | 5,780 | — | — | ||||||||
Consideration: | |||||||||||
Issuance of common stock | 82,470 | — | — | ||||||||
Fair value of replacement stock options/restricted stock | 753 | — | — | ||||||||
106
Note 28 – Accumulated Other Comprehensive Income (Loss)
Changes in each component of accumulated other comprehensive income (loss) were as follows (dollars in thousands):
Net Unrealized Gains (Losses) on Securities | Unrealized Losses on Cash Flow Hedges | Adjustments Related to Pension Benefits | Accumulated Other Comprehensive Income (Loss) | ||||||||||||
Balance at Balance at December 31, 2016 | $ | (150 | ) | $ | — | $ | (1,724 | ) | $ | (1,874 | ) | ||||
Net unrealized gains on securities available for sale, net of tax, $12 | 23 | — | — | 23 | |||||||||||
Reclassification adjustment for realized gains on securities, net of tax, $(284) | (528 | ) | — | — | (528 | ) | |||||||||
Change in unfunded pension liability, net of tax, $(82) | — | — | (152 | ) | (152 | ) | |||||||||
Reclassification of "stranded" tax effects from tax rate change | (141 | ) | — | (404 | ) | (545 | ) | ||||||||
Balance at December 31, 2017 | (796 | ) | — | (2,280 | ) | (3,076 | ) | ||||||||
Net unrealized losses on securities available for sale, net of tax, $(745) | (2,464 | ) | — | — | (2,464 | ) | |||||||||
Reclassification adjustment for realized gains on securities, net of tax, $(18) | (63 | ) | — | — | (63 | ) | |||||||||
Net unrealized losses on cash flow hedges, net of tax, $(180) | — | (624 | ) | — | (624 | ) | |||||||||
Change in unfunded pension liability, net of tax, $249 | — | — | 1,042 | 1,042 | |||||||||||
Reclassification for ASU 2016-01 adoption | (650 | ) | — | — | (650 | ) | |||||||||
Balance at December 31, 2018 | (3,973 | ) | (624 | ) | (1,238 | ) | (5,835 | ) | |||||||
Net unrealized gains on securities available for sale, net of tax, $2,005 | 7,090 | — | — | 7,090 | |||||||||||
Reclassification adjustment for realized gains on securities, net of tax, $(59) | (215 | ) | — | — | (215 | ) | |||||||||
Net unrealized losses on cash flow hedges, net of tax, $(394) | — | (1,460 | ) | — | (1,460 | ) | |||||||||
Change in unfunded pension liability, net of tax, $(1) | — | — | (63 | ) | (63 | ) | |||||||||
Balance at December 31, 2019 | $ | 2,902 | $ | (2,084 | ) | $ | (1,301 | ) | $ | (483 | ) | ||||
107
The following table provides information regarding reclassifications out of accumulated other comprehensive income (loss) (dollars in thousands):
Reclassifications Out of Accumulated Other Comprehensive Income (Loss)
For the Three Years Ending December 31, 2019
Details about AOCI Components | Amount Reclassified from AOCI | Affected Line Item in the Statement of Where Net Income is Presented | |||||||||||
Years Ended December 31, | |||||||||||||
2019 | 2018 | 2017 | |||||||||||
Available for sale securities: | |||||||||||||
Realized gain on sale of securities | $ | 274 | $ | 81 | $ | 812 | Securities gains, net | ||||||
(59 | ) | (18 | ) | (284 | ) | Income taxes | |||||||
$ | 215 | $ | 63 | $ | 528 | Net of tax | |||||||
Reclassification of "stranded" tax effects from tax rate change | — | — | 141 | (1) | |||||||||
Reclassification for ASU-2016-01 adoption | — | 650 | — | (2) | |||||||||
Employee benefit plans: | |||||||||||||
Reclassification of "stranded" tax effects from tax rate change | — | — | 404 | (1) | |||||||||
Total reclassifications | $ | 215 | $ | 713 | $ | 1,073 | |||||||
______________________
(1) Reclassification from AOCI to retained earnings for "stranded" tax effects resulting from the impact of the newly enacted federal corporate income tax rate on items included in AOCI.
(2) Reclassification from AOCI to retained earnings for unrealized holding gains on equity securities due to adoption of ASU 2016-01.
ITEM 9A – CONTROLS AND PROCEDURES
Disclosure Controls and Procedures
The Company's management, including the Chief Executive Officer and Chief Financial Officer, evaluated the Company's disclosure controls and procedures (as defined in Rule 13a-15(e) under the Exchange Act), as of December 31, 2019. Based on this evaluation, the Chief Executive Officer and Chief Financial Officer concluded that the Company's disclosure controls and procedures are effective to ensure that the information required to be disclosed by the Company in the reports that it files or submits under the Exchange Act is recorded, processed, summarized, and reported within the time periods specified in SEC rules and forms. There were no significant changes in the Company's internal controls over financial reporting that occurred during the quarter ended December 31, 2019 that have materially affected or are reasonably likely to materially affect the Company's internal control over financial reporting.
Management's Annual Report on Internal Control over Financial Reporting
Management of the Company is responsible for establishing and maintaining adequate internal control over financial reporting. Internal control is designed to provide reasonable assurance regarding the reliability of financial reporting and the preparation of financial statements for external purposes in accordance with accounting principles generally accepted in the United States of America. Management regularly monitors its internal control over financial reporting, and actions are taken to correct deficiencies as they are identified.
Under the supervision and with the participation of management, including the principal executive officer and principal financial officer, the Company conducted an evaluation of the effectiveness of internal control over financial reporting. This assessment was based on the framework in Internal Control – Integrated Framework issued by the Committee of Sponsoring Organizations of the Treadway Commission in 2013. Based on this evaluation under the framework in Internal Control – Integrated Framework, management concluded that the Company maintained effective internal control over financial reporting as of December 31, 2019, as such term is defined in Exchange Act Rule 13a-15(f).
Because of its inherent limitations, internal control over financial reporting may not prevent or detect misstatements. Further, because of changes in conditions, internal control effectiveness may vary over time.
108
The Company's independent registered public accounting firm, Yount, Hyde and Barbour, P.C., has audited the Company's internal control over financial reporting as of December 31, 2019, as stated in their report included herein. Yount, Hyde and Barbour, P.C. also audited the Company's consolidated financial statements as of and for the year ended December 31, 2019.
/s/ Jeffrey V. Haley | |
Jeffrey V. Haley | |
President and Chief Executive Officer | |
/s/ Jeffrey W. Farrar | |
Jeffrey W. Farrar | |
Executive Vice President, | |
Chief Operating Officer and Chief Financial Officer | |
March 9, 2020 | |
109
PART IV
ITEM 15 – EXHIBITS, FINANCIAL STATEMENT SCHEDULES
(a)(1) | Financial Statements. See Item 8 for reference. |
(a)(2) | Financial Statement Schedules. All applicable financial statement schedules required under Regulation S-X have been included in the Notes to the Consolidated Financial Statements. |
(a)(3) | Exhibits. The exhibits required by Item 601 of Regulation S-K are listed below. |
EXHIBIT INDEX | ||
Exhibit No. | Description | Location |
2.1 | Exhibit 2.1 on Form 8-K filed October 5, 2018 | |
3.1 | Exhibit 3.1 on Form 10-Q filed July 5, 2011 | |
3.2 | Exhibit 3.2 on Form 8-K filed April 4, 2019 | |
4.1 | Filed herewith | |
10.1 | Exhibit 10.1 on Form 10-K filed March 16, 2009 | |
10.2 | Exhibit 10.1 on Form 8-K filed March 4, 2015 | |
10.3 | Exhibit 10.1 on Form 8-K filed August 5, 2019 | |
10.4 | Exhibit 10.2 on Form 8-K filed March 4, 2015 | |
10.5 | Exhibit 10.3 on Form 10-Q filed May 11, 2015 | |
10.6 | Exhibit 10.9 on Amendment No. 1 to Form S-4 filed March 29, 2011 | |
10.7 | Exhibit 10.1 on Form 8-K filed December 29, 2016 | |
10.8 | Exhibit 10.10 on Amendment No. 1 to Form S-4 filed March 29, 2011 | |
10.9 | Exhibit 10.8 on Form 10-K filed March 8, 2019 | |
110
EXHIBIT INDEX | ||
Exhibit No. | Description | Location |
10.10 | Exhibit 10.1 on Pre-Effective Amendment No. 1 to Form S‑4 filed February 6, 2019 | |
10.11 | Appendix A of the Proxy Statement for the Annual Meeting of Shareholders held on April 22, 2008, filed on March 14, 2008 | |
10.12 | Appendix A of the Proxy Statement for the Annual Meeting of Shareholders held on May 15, 2018, filed on April 12, 2018 | |
10.13 | Exhibit 4.0 on Post-Effective Amendment No. 1 on Form S-8 to Form S-4 filed April 1, 2019 | |
10.14 | Exhibit 10.11 on Form 10-K filed March 15, 2016 | |
21.1 | Filed herewith | |
23.1 | Filed herewith | |
31.1 | Filed herewith | |
31.2 | Filed herewith | |
32.1 | Filed herewith | |
32.2 | Filed herewith | |
101.INS | XBRL Instance Document | |
101.SCH | XBRL Taxonomy Extension Schema Document | |
101.CAL | XBRL Taxonomy Extension Calculation Linkbase Document | |
101.DEF | XBRL Taxonomy Extension Definition Linkbase Document | |
101.LAB | XBRL Taxonomy Extension Label Linkbase Document | |
101.PRE | SBRL Taxonomy Presentation Linkbase Document | |
111
SIGNATURES
Pursuant to the requirements of Section 13 or 15(d) of the Securities Exchange Act of 1934, the registrant has duly caused this report to be signed on its behalf by the undersigned, thereunto duly authorized.
Date: March 9, 2020 | AMERICAN NATIONAL BANKSHARES INC. | ||
By: | /s/ Jeffrey V. Haley | ||
President and Chief Executive Officer | |||
Pursuant to the requirements of the Securities Exchange Act of 1934, this report has been signed below by the following persons on behalf of the registrant and in the capacities indicated on March 9, 2020.
/s/ Jeffrey V. Haley | Director, President and Chief Executive Officer (principal executive officer) | |||||
Jeffrey V. Haley | ||||||
/s/ Charles H. Majors | Director and Chairman | |||||
Charles H. Majors | ||||||
/s/ Nancy H. Agee | Director | /s/ F. D. Hornaday, III | Director | |||
Nancy H. Agee | F. D. Hornaday, III | |||||
/s/ Fred A. Blair | Director | /s/ John H. Love | Director | |||
Fred A. Blair | John H. Love | |||||
/s/ Kenneth S. Bowling | Director | /s/ Claude B. Owen, Jr. | Director | |||
Kenneth S. Bowling | Claude B. Owen, Jr. | |||||
/s/ Frank C. Crist, Jr. | Director | /s/ Ronda M. Penn | Director | |||
Frank C. Crist, Jr. | Ronda M. Penn | |||||
/s/ Tammy M. Finley | Director | /s/ Dan M. Pleasant | Director | |||
Tammy M. Finley | Dan M. Pleasant | |||||
/s/ Michael P. Haley | Director | /s/ Joel R. Shepherd | Director | |||
Michael P. Haley | Joel R. Shepherd | |||||
/s/ Charles S. Harris | Director | /s/ Susan K. Still | Director | |||
Charles S. Harris | Susan K. Still | |||||
/s/ Cathy W. Liles | Senior Vice President and Chief Accounting Officer (principal accounting officer) | /s/ Jeffrey W. Farrar | Executive Vice President, Chief Operating Officer and Chief Financial Officer (principal financial officer) | |||
Cathy W. Liles | Jeffrey W. Farrar | |||||
112