Attached files
| file | filename |
|---|---|
| EX-32.1 - EXHIBIT 32.1 - Anika Therapeutics, Inc. | exh_321.htm |
| EX-31.2 - EXHIBIT31.2 - Anika Therapeutics, Inc. | exh_312.htm |
| EX-31.1 - EXHIBIT 31.1 - Anika Therapeutics, Inc. | exh_311.htm |
| EX-23.1 - EXHIBIT 23.1 - Anika Therapeutics, Inc. | exh_231.htm |
| EX-21.1 - EXHIBIT 21.1 - Anika Therapeutics, Inc. | exh_211.htm |
| EX-10.13(G) - EXHIBIT 10.13(G) - Anika Therapeutics, Inc. | exh_1013g.htm |
UNITED STATES
SECURITIES AND EXCHANGE COMMISSION
Washington, D.C. 20549
FORM 10-K
| (Mark One) | |
| x | ANNUAL REPORT PURSUANT TO SECTION 13 OR 15(d) OF THE SECURITIES EXCHANGE ACT OF 1934 |
|
For the fiscal year ended December 31, 2019
| |
| o | TRANSITION REPORT PURSUANT TO SECTION 13 OR 15 (d) OF THE SECURITIES EXCHANGE ACT OF 1934 |
|
For the transition period from to | |
Commission File Number 000-21326
Anika Therapeutics, Inc.
(Exact Name of Registrant as Specified in Its Charter)
Delaware (State or Other Jurisdiction of Incorporation or Organization) |
04-3145961 (IRS Employer Identification No.) |
32 Wiggins Avenue, Bedford, Massachusetts 01730
(Address of Principal Executive Offices) (Zip Code)
(781) 457-9000
(Registrant’s Telephone Number, Including Area Code)
Securities registered pursuant to Section 12(b) of the Act:
| Title of Each Class | Trading Symbol | Name of Each Exchange on Which Registered |
| Common Stock, par value $0.01 per share | ANIK | NASDAQ Global Select Market |
Indicate by check mark if the registrant is a well-known seasoned issuer, as defined in Rule 405 of the Securities Act. Yes o No x
Indicate by check mark if the registrant is not required to file reports pursuant to Section 13 or Section 15(d) of the Act. Yes o No x
Indicate by check mark whether the registrant (1) has filed all reports required to be filed by Section 13 or 15 (d) of the Securities Exchange Act of 1934 during the preceding 12 months (or for such shorter period that the registrant was required to file such reports), and (2) has been subject to such filing requirements for the past 90 days. Yes ☒ No ☐
Indicate by check mark whether the registrant has submitted electronically every Interactive Data File required to be submitted to Rule 405 of Regulation S-T (§232.405 of this chapter) during the preceding 12 months (or for such shorter period that the registrant was required to submit such files). Yes ☒ No ☐
Indicate by check mark whether the registrant is a large accelerated filer, an accelerated filer, a non-accelerated filer, a smaller reporting company, or an emerging growth company. See the definitions of “large accelerated filer,” “accelerated filer,” “smaller reporting company,” and “emerging growth company” in Rule 12b-2 of the Exchange Act.
| Large accelerated filer o | Accelerated filer x | Non-accelerated filer o | Smaller reporting company o | Emerging growth company o |
If an emerging growth company, indicate by check mark if the registrant has elected not to use the extended transition period for complying with any new or revised financial accounting standards provided pursuant to Section 13(a) of the Exchange Act. ¨
Indicate by check mark whether the registrant is a shell company (as defined in Rule 12b-2 of the Exchange Act). Yes o No x
The aggregate market value of voting common stock held by non-affiliates of the registrant as of June 30, 2019, the last day of the registrant’s most recently completed second fiscal quarter, was $570,291,558 computed by reference to the closing price of common stock on such date. The registrant does not have any non-voting stock outstanding.
At February 24, 2020, there were 14,168,080 shares of the registrant’s common stock outstanding.
Documents Incorporated By Reference
Portions of the registrant’s proxy statement for its 2020 annual meeting of stockholders are incorporated by reference in Part III of this Annual Report on Form 10-K.
| 2 |
ANIKA THERAPEUTICS, INC.
TABLE OF CONTENTS
References in this Annual Report on Form 10-K to “we,” “us,” “our,” “our company,” and other similar references refer to Anika Therapeutics, Inc. and its subsidiaries unless the context otherwise indicates.
ANIKA, ANIKA THERAPEUTICS, ANIKAVISC, CINGAL, HYAFF, HYDRELLE, HYVISC, MONOVISC, and ORTHOVISC are our registered trademarks, and ELEVESS, HYALOSS and TACTOSET, are our trademarks. For convenience, these trademarks appear in this Annual Report on Form 10-K without ® and ™ symbols, but that practice does not mean that we will not assert, to the fullest extent under applicable law, our rights to the trademarks. This Annual Report on Form 10-K also contains trademarks and trade names that are the property of other companies.
| 3 |
FORM 10-K
ANIKA THERAPEUTICS, INC.
For Fiscal Year Ended December 31, 2019
CAUTIONARY NOTE REGARDING FORWARD-LOOKING STATEMENTS
This Annual Report on Form 10-K contains "forward-looking statements" within the meaning of Section 27A of the Securities Act of 1933 and Section 21E of the Securities Exchange Act of 1934 concerning our business, consolidated financial condition, and results of operations. The Securities and Exchange Commission, or SEC, encourages companies to disclose forward-looking statements so that investors can better understand a company’s future prospects and make informed investment decisions. Forward-looking statements are subject to risks and uncertainties, many of which are outside our control, which could cause actual results to differ materially from these statements. Therefore, you should not rely on any of these forward-looking statements. Forward-looking statements can be identified by such words as "will," "likely," "may," "believe," "expect," "anticipate," "intend," "seek," "designed," "develop," "would," "future," "can," "could," and other expressions that are predictions of or indicate future events and trends and that do not relate to historical matters. All statements other than statements of historical facts included in this Annual Report regarding our strategies, prospects, financial condition, operations, costs, plans, and objectives are forward-looking statements. Examples of forward-looking statements include, among others, statements regarding expected future operating results, expectations regarding the timing and receipt of regulatory results, anticipated levels of capital expenditures, and expectations of the effect on our financial condition of claims, litigation, and governmental and regulatory proceedings.
Please refer to "Risk Factors" for important factors that we believe could cause actual results to differ materially from those in our forward-looking statements. Any forward-looking statement made by us in this Annual Report on Form 10-K is based only on information currently available to us and speaks only as of the date on which it is made. We undertake no obligation to publicly update any forward-looking statement, whether written or oral, that may be made from time to time, whether as a result of new information, future developments, or otherwise.
| 4 |
Overview
Founded in 1992, Anika Therapeutics, Inc. is a global, integrated joint preservation and regenerative therapies company based in Bedford, Massachusetts. Our mission is to be the global leader in orthopedic joint therapies and sports medicine with innovative technologies that exceed our customers’ expectations. We are committed to delivering solutions to improve the lives of patients across a continuum of care from joint pain management and regenerative therapies to sports medicine and orthopedic joint preservation and restoration. We have nearly thirty years of global expertise commercializing more than twenty products based on our hyaluronic acid, or HA, technology platform, and we are focused on adding innovative and differentiated offerings to our consolidated portfolio. Our proprietary technologies for modifying the HA molecule allow product properties to be tailored specifically to multiple therapeutic uses. Certain of our technology chemically modifies HA to allow for longer residence time in the body. We have two forms of cross-linked HA gel technologies, and a solid form of HA technology – HYAFF which is the platform for our regenerative medicine. These proprietary technologies are protected by an extensive portfolio of owned and licensed patents.
As we look towards the future, our business is uniquely positioned to capture value within the sports and regenerative medicine market. Our success is driven by our focus on our talent and culture, investment in innovative research and development programs to feed our product pipeline, expanding our commercial footprint domestically and internationally, and pursuing strategic inorganic growth opportunities. We intend to continue to accelerate our commercial capabilities as we transform into a customer-centric company dedicated to advancing the joint preservation and restoration continuum of care. We believe that this commitment, along with our financial resources and operating history, have positioned us well to deliver sustained value to our shareholders.
In early 2020, we expanded our overall technology platform through our strategic acquisitions of Parcus Medical, LLC, or Parcus Medical, a sports medicine implant and instrumentation solutions provider focused on surgical repair and reconstruction of ligaments and tendons, and Arthrosurface, Incorporated, or Arthrosurface, a joint preservation technology company specializing in less invasive, bone preserving partial and total joint replacement solutions. The Company expects the Parcus Medical and Arthrosurface acquisitions to drive growth by:
· Broadening Anika's product portfolio further into the sports medicine joint preservation and restoration space;
· Adding high-growth revenue streams;
· Expanding our commercial capabilities;
· Diversifying our revenue base; and
· Expanding our product pipeline and research and development expertise.
In addition, we believe that our historical HA and regenerative medicine expertise will be highly complementary to the sports medicine implants and instrumentation expertise of Parcus Medical and the partial and total joint replacement expertise of Arthrosurface. We believe that the combination of these three businesses positions Anika to provide innovative solutions along the orthopedic continuum of care and build significant value for patients, physicians, and key healthcare system stakeholders.
| 5 |
Industry
Historically, our outward-looking industry focus has been on viscosupplement and regenerative orthopedic products that utilize HA as their major component. These products are used in a range of treatments, from providing pain relief from osteoarthritis to regenerating damaged tissue such as cartilage. Osteoarthritis is a debilitating disease that causes pain, swelling, and restricted movement in joints. Treating the pain associated with osteoarthritis with viscosupplement products has been our predominant focus and our main source of historic revenue over the past five years. In addition to the treatment of osteoarthritis, our HA-based portfolio has products targeted to orthopedic regenerative medicine, advanced wound care, products used to prevent post-surgical adhesions after a variety of surgical procedures, as well as ophthalmic products and veterinary products targeted to treat equine osteoarthritis.
With the recent additions of the Arthrosurface and Parcus Medical businesses, we have effectively broadened our industry focus and increased our addressable market. Arthrosurface focuses on less invasive, bone preserving partial and total joint replacement implants and instruments that may be utilized by physicians when more conservative solutions have been exhausted, but before the need for invasive total joint replacement procedures is necessary. Parcus Medical has a full portfolio of implants, materials and instrumentation used for soft tissue fixation in sports medicine procedures designed with surgeon input to ensure usability for our physician customers.
With this expansion along a broader continuum of care ranging from joint pain management, a market opportunity we estimate to be approximately $1.0 billion, to sports and regenerative medicine and less invasive implants, a market opportunity we estimate to be approximately $7.0 billion, we are positioning the company for future growth, especially within the sports medicine industry. We intend to leverage our technology portfolios and our burgeoning commercial infrastructure to provide sustained revenue growth and become a leader in the areas in which we do business.
Products
Joint Pain Management Therapies
Our Joint Pain Management Therapies product family consists of injectable viscosupplement products that provide pain relief from osteoarthritis conditions. These products include MONOVISC, ORTHOVISC, CINGAL, and HYVISC, HA-based intraarticular injectable products indicated for the treatment of osteoarthritis pain. Our Joint Pain Management Therapy products are administered to patients in an office setting. We distribute the products in this category using a distributor model, as more fully described in the section titled “Sales Channel.”
In the United States, MONOVISC and ORTHOVISC are marketed by DePuy Synthes Mitek Sports Medicine, a division of DePuy Orthopaedics, Inc., or Mitek, under the terms of a pair of licensing, distribution, supply, and marketing agreements, or the Mitek MONOVISC Agreement and Mitek ORTHOVISC Agreement. In the United States, MONOVISC and ORTHOVISC have maintained the combined overall viscosupplement market leadership position since the first quarter of 2018 on a revenue generation basis. Internationally, we market our Joint Pain Management Therapy products using a growing network of commercial distributors in Canada, Europe, the Middle East, Latin America, and Asia.
HYVISC is a high molecular weight injectable HA product for the treatment of joint dysfunction in horses due to non-infectious synovitis associated with equine osteoarthritis. HYVISC is distributed by Boehringer Ingelheim Vetmedica, Inc., or Boehringer, in the United States.
Orthopedic Joint Preservation and Restoration Care
Our Orthopedic Joint Preservation and Restoration Care family consists of the following key products:
| · | Several orthopedic regenerative medicine products based on our proprietary HYAFF technology, which is a solid form of HA. They include HYALOFAST, a biodegradable support for human bone marrow mesenchymal stem cells used for cartilage regeneration and as an adjunct for microfracture surgery. These products are currently available in Europe, South America, Asia, and certain other international markets. |
| · | TACTOSET, an HA-enhanced bone repair therapy designed to treat insufficiency fractures. TACTOSET is available in the United States, and we expect to leverage the commercial infrastructure of our recent acquisitions to increase market access to sell TACTOSET. |
| 6 |
| · | Arthrosurface’s catalogue of over 150 partial and total joint surface implants and preservation solutions for the knee, shoulder, hip, ankle, wrist and toe that are designed to treat upper and lower extremity orthopedic conditions caused by trauma, injury and arthritic disease. These products are designed to be less invasive and more bone preserving than conventional joint replacements. These products are available in the United States and over 25 international markets. |
| · | Parcus Medical’s line of surgical implant and instrumentation solutions that are used by surgeons to repair and reconstruct damaged ligaments and tendons due to sports injuries, trauma and disease. These solutions include screws, sutures, anchors, and other surgical systems that facilitate surgical procedures on the shoulder, knee, hip, distal extremities, and tissue. They are typically utilized by surgeons in ambulatory surgical center, or ASC, and hospital environments. These products are commercialized in the United States and over 60 international markets. |
Other
Our Other product family consists of legacy HA-based products that do not fit into one of our other primary product categories. These products include:
| · | Advanced wound care products based on our HYAFF technology are used for the treatment of skin wounds, ranging from burns to diabetic ulcers. The products cover a variety of wound treatment solutions, including debridement agents, advanced therapies to aid healing, and scaffolds used as skin substitutes. Leading products include HYALOMATRIX and HYALOFILL, which are used for the treatment of complex wounds such as burns and ulcers. |
| · | Products used in connection with the treatment of ENT (ears, nose and throat) disorders. The lead product is MEROGEL, a HYAFF-based woven fleece nasal packing. We have partnered with Medtronic XoMed, Inc., or Medtronic, for worldwide distribution of these ENT products. |
| · | Ophthalmic products, including injectable, high molecular weight HA products used as viscoelastic agents in ophthalmic surgical procedures such as cataract extraction and intraocular lens implantation. |
Sales Channels
Since our inception in 1992, we historically utilized a commercial partnership model for the distribution of our products to end-users. Our strong, worldwide network of distributors has historically provided, and continues to provide, a solid foundation for our revenue growth and territorial expansion. In 2019, we implemented a hybrid commercial approach that balances a small direct model with a network of distributor partners in the U.S. market, and we utilized this hybrid approach for the launch of TACTOSET. The acquisitions of Arthrosurface and Parcus Medical each added to our commercial infrastructure, especially in the United States. Arthrosurface has approximately 35 sales representatives and 100 distributors in the U.S., while Parcus Medical employs a similar, though more mature, model as Anika and has over 50 U.S. distributors in place.
For products in our Orthopedic Joint Preservation and Restoration Care family, including those currently in research and development or those not yet developed, we intend to leverage the expanded hybrid-direct sales infrastructure of the consolidated entity. This framework pairs an internal direct sales team with external sales agent partners to maximize territorial coverage and sales generation. Generally, products within this family are sold into surgical environments, such as hospitals or ambulatory surgery centers, and we believe that we have a strong infrastructure now in place to service these customers. We intend to cross-train the sales staffs to create a consolidated sales structure selling all of the products within our portfolio. We also intend to assess each selling territory to maximize our coverage and reach as many customers and patients as possible.
For longer-term future products in the U.S. market within our Joint Pain Management Therapies or Other families, we intend to evaluate our commercial model and possible alternatives or augmentations in each instance on a case-by-case basis, based on market dynamics and other factors. These models could include direct sales, distribution partnerships, or a hybrid of those forms. For current products in the U.S. market, we intend to retain our current distribution relationships, including with Mitek, as they continue to provide meaningful revenue and growth opportunities.
| 7 |
Internationally, we expect to maintain our current distribution model for the foreseeable future. Notwithstanding that general expectation, we will evaluate modifications or possible alternatives to that model on a case-by-case basis based upon market dynamics and resource allocation. We also intend to evaluate and synergize our international distributor base to ensure that we maximize our partnerships and grow revenue from our entire product portfolio.
Manufacturing
We manufacture the majority of our products ourselves at our facilities in Bedford, Massachusetts, where we make the totality of the products associated with the historic Anika business, and, following our acquisition of Parcus Medical, in Sarasota, Florida, where we make the vast majority of the historic Parcus Medical finished products. For the manufacture of the partial and total joint surface implants and preservation products produced for Arthrosurface, we engage a single third-party organization as a contract manufacturer. The raw materials necessary to manufacture our products are generally available from multiple sources. However, we rely on a small number of suppliers for certain key raw materials and a small number of suppliers for certain other materials required for the manufacturing and delivery of these products.
Research and Development
Our research and development efforts primarily consist of the development of new medical applications for our technology platform, the development of intellectual property with respect to our technology platform, the management of clinical trials for certain product candidates, the preparation and processing of applications for regulatory approvals, and process development and scale-up manufacturing activities for new and existing products. Our development is focused on orthopedic and regenerative medicine, including products for tissue protection, repair, and regeneration. For the years ended December 31, 2019, 2018, and 2017, research and development expenses were $16.7 million, $18.2 million, and $18.8 million respectively. The decrease in 2019 was mainly due to timing and decision-making regarding our clinical activities. We anticipate that we will continue to commit significant resources to, and increase our aggregate spending on, research and development efforts including new product development, preclinical activities and clinical trials in the future.
Current research and development activities include clinical trials for CINGAL, a joint pain management therapy composed of our proprietary cross-linked HA material combined with an approved steroid, and HYALOFAST, an innovative product for cartilage tissue repair, meant to support eventual regulatory approval for these products in the United States. In pursuing a U.S. regulatory pathway for CINGAL, we have conducted two Phase III clinical trials and two follow-up studies, and the United States Food and Drug Administration, or FDA, has indicated an additional Phase III trial is necessary to support U.S. approval. We are currently working to initiate a pilot study to confirm our trial design, increase our probability of success in a Phase III trial and generate data that ultimately will be needed to support FDA approval. We remain on track to commence the CINGAL pilot study in the first half of 2020. We are also conducting a Phase III trial to support the U.S. regulatory approval of HYALOFAST. We expect to complete patient enrollment in the HYALOFAST study by the end of 2020.
In addition, we are working to expand our regenerative medicine pipeline with a new product candidate in the form of an implant for rotator cuff repair utilizing our proprietary solid HA technology, which could be employed to repair partial and full-thickness rotator cuff tears. We finalized an initial product prototype, and we are currently performing preclinical testing on the product and developing the surgical instrumentation for the potential product.
Intellectual Property
We seek patent and trademark protection for our key technology, products and product improvements, both in the U.S. and in select foreign countries. When determined appropriate, we enforce and plan to enforce and defend our patent and trademark rights. While we rely on our patent and trademark estate to provide us with competitive advantages as it relates to our existing and future product lines, it is not our sole source of protection. We also rely upon trade secrets and continuing technological innovations to develop and maintain our competitive position. In an effort to protect our trade secrets, we have a policy of requiring our employees, consultants and advisors to execute proprietary information and invention assignment agreements upon commencement of employment or consulting relationships with us. These agreements also provide that all confidential information developed or made known to the individual during the course of their relationship with us must be kept confidential, except in specified circumstances.
| 8 |
Governmental Regulation
The clinical development, manufacturing, and marketing of our products are subject to governmental regulation in the United States, the European Union, and other territories worldwide. Various statutes, regulations and interpretations thereof, directives, and guidelines, including the Food, Drug, and Cosmetic Act in the United States, govern the development, design, non-clinical and clinical research, testing, manufacture, safety, efficacy, labeling, packaging, storage, record keeping, premarket clearance or approval, adverse event reporting, advertising, and promotion of our products. Product development and approval within these various regulatory frameworks takes a number of years and involves the expenditure of substantial resources. Pharmaceutical and medical device manufacturers are also inspected regularly by the FDA and other applicable regulatory bodies.
Medical products regulated by the FDA are generally classified as drugs, biologics, or medical devices, and the current classification standards for our current or future may be altered over time. Drugs and biologic products undergo rigorous preclinical testing prior to beginning clinical trials. Clinical trials for new drugs or biologic products include Phase I trials in healthy volunteers to understand safety, dosage tolerance, and pharmacokinetics, Phase II trials in a limited patient population to identify initial efficacy and side effects, and Phase III pivotal trials to statistically evaluate the safety and efficacy of the product. Medical devices intended for human use are classified into three categories (Class I, II or III) on the basis of the controls deemed reasonably necessary by the FDA to assure their safety and effectiveness. Class II devices are cleared for marketing under the premarket notification 510(k) regulatory pathway, which may include clinical testing. Class III devices require pre-market approval based on valid scientific evidence of safety and effectiveness, including evidence elicited through appropriate clinical testing. The failure to adequately demonstrate the quality, safety, and efficacy of a product under development can delay or prevent regulatory approval of the product. In order to gain marketing approval, we must submit to the relevant regulatory authority for review information on the quality aspects of the product as well as the non-clinical and clinical data. The FDA undertakes this review in the United States.
In the European Union, medical devices must be CE Marked in order to be marketed. CE marking a device involves working with a Notified Body, and in some cases a Competent Authority, to demonstrate that the device meets all applicable requirements of the Medical Devices Directive and that our Quality Management System is compliant. Drug approval in the European Union follows one of several possible processes: (i) a centralized procedure involving members of the European Medicines Agency’s Committee for Medicinal Products for Human Use; (ii) a “mutual recognition procedure” in which an individual country's regulatory agency approves the product followed by “mutual recognition” of this approval by regulatory agencies of other countries; or (iii) a decentralized procedure in which the approval is sought through the regulatory agencies of multiple countries at the same time.
Approval timelines can range from several months to several years, or applications can be denied entirely. Product or product component classifications as drugs, biologics, or medical devices may change over time due to new regulations or augmented interpretation of data or current regulations. The approval process can be affected by a number of factors. For example, additional studies or clinical trials may be requested during the review, which may delay marketing approval and involve unbudgeted costs. As a condition of approval, the regulatory agency may require post-marketing surveillance to monitor for adverse effects, and may require other additional studies, as it deems appropriate. After approval for an initial indication, further clinical studies are generally necessary to gain approval for any additional indications. The terms of any approval, including labeling content, may be more restrictive than expected and could affect the marketability of a product.
The FDA has broad regulatory compliance and enforcement powers. If the FDA determines that we failed to comply with applicable regulatory requirements, it can take a variety of compliance or enforcement actions, including, without limitation, issuing an FDA Form 483 notice of inspectional observations or a warning letter, imposing civil money penalties, suspending or delaying issuance of approvals, requiring product recall, imposing a total or partial shutdown of production, withdrawal of approvals or clearances already granted, pursuing product seizures, consent decrees or other injunctive relief, or criminal prosecution through the Department of Justice. The FDA can also require us to repair, replace, or refund the cost of products that we manufactured or distributed. Outside the United States, regulatory agencies may exert a range of similar powers.
We are subject to various U.S. federal and state laws pertaining to healthcare fraud and abuse, including anti-kickback and false claims laws. Similar review and regulation of advertising and marketing practices exists in the other geographic areas where we operate.
| 9 |
We are also subject to various laws and regulations concerning data privacy in the United States, Europe, and elsewhere, including the European Union of the General Data Protection Regulation (“GDPR”). These regulations impose several requirements on the processing, administration, security, and confidentiality of personal data. These regulations empower enforcement agencies to impose large penalties for noncompliance.
Environmental Laws
We believe that we are in compliance with all foreign, federal, state, and local environmental regulations with respect to our manufacturing facilities. The cost of ongoing compliance with such regulations does not have a material effect on our operations.
Competition
We compete with many companies including large pharmaceutical firms and specialized medical device companies across all of our product lines. For our Joint Pain Management Therapies products, our principal competitors are Sanofi Genzyme, Zimmer Biomet, Inc., Bioventus LLC, and Ferring Pharmaceuticals. Following our acquisitions of Arthrosurface and Parcus Medical, our key competitors for our Orthopedic Joint Preservation and Restoration Care products include Arthrex, Inc., Smith & Nephew P.l.c., Integra LifeSciences, Inc., Stryker Corporation, Wright Medical Group N.V., Zimmer Biomet, Inc., and CONMED Corporation. Many of these companies have substantially greater financial resources, larger research and development staffs, more extensive marketing and manufacturing organizations, and more experience in the regulatory processes than we have. We also compete with academic institutions, government agencies, and other research organizations, which may be involved in the research and development and commercialization of products. Many of our competitors also compete against us in securing relationships with collaborators for their research and development and commercialization programs.
We compete with other market participants primarily on the efficacy of our products, our products’ reputation for safety, and the breadth of our sports and regenerative medicine product portfolio. Other factors that impact competition in our industry are the timing and scope of regulatory approvals, the availability of raw material and finished product supply, marketing and sales capability, reimbursement coverage, product pricing, and patent protection. Some of the principal factors that may affect our ability to compete in the sports and regenerative medicine development and commercialization markets include:
| · | The quality and breadth of our continued development of our product portfolio; |
| · | Our ability to complete successful clinical studies and obtain FDA marketing and foreign regulatory approvals prior to our competitors; |
| · | Our ability to build our commercial infrastructure, integrate our sales channels and execute our sales strategies; | ||
| · | The execution by our key partners of their commercial strategies for our products and our ability to manage our relationships with those key partners; |
| · | Our ability to recruit and retain skilled employees; and |
| · | The availability of capital resources to fund strategic activities related to the significant expansion of our business or product portfolio, including through acquisitions of third parties or certain assets. |
| 10 |
We are aware of a number of companies that are developing and/or marketing competitive products. In some cases, competitors have already obtained product approvals, submitted applications for approval, or commenced human clinical studies, either in the United States or in certain foreign countries. All products face substantial competition. There exist major worldwide competing products for use in joint pain management, orthopedic joint preservation and restoration, surgical adhesion prevention, advanced wound care, ENT, cosmetic dermatology, ophthalmic surgery, and the treatment of equine osteoarthritis. There is a risk that we will be unable to compete effectively against our current or future competitors. Additionally, legislation and regulation aimed at curbing rising healthcare costs has resulted in a consolidation trend in the healthcare industry to create larger companies, including hospitals, with greater market power. In turn, this has led to greater and more intense competition in the provision of products and services to market participants. Important market makers, like group purchasing organizations and integrated delivery networks, have increased their negotiating leverage, and if these market makers demand significant price concessions or if we are excluded as a supplier by these market makers, our product revenue could be adversely impacted.
Employees
As of December 31, 2019, we had 154 employees, 128 of whom were located in the United States, 22 of whom were located in Italy, and 4 of whom were located in the United Kingdom. We consider our relations with our employees to be good. None of our U.S. employees are represented by labor unions, but certain employees based in Italy are represented by unions, adding complexity and additional risks to the wage and employment decision processes.
Product Liability
The testing, marketing, and sale of human health care products entails an inherent risk of allegations of product liability, and we cannot assure that substantial product liability claims will not be asserted against us. Although we have not received any material product liability claims to date and generally have coverage under our insurance policy of $5.0 million per occurrence and $5.0 million in the aggregate, we cannot assure that if material claims arise in the future, our insurance will be adequate to cover all situations. Moreover, we cannot assure that such insurance, or additional insurance, if required, will be available in the future or, if available, will be available on commercially reasonable terms. Any product liability claim, if successful, could have a material adverse effect on our business, financial condition, and results of operations.
Available Information
We are required to file annual, quarterly and current reports, proxy statements and other information with the SEC. The SEC maintains a website at www.sec.gov that contains reports, proxy and information statements, and other information regarding issuers that file electronically with the SEC.
Our Annual Reports on Form 10-K, Quarterly Reports on Form 10-Q, Current Reports on Form 8-K, proxy statements, and other information, including amendments and exhibits to such reports, filed or furnished pursuant to the Securities Exchange Act of 1934 are available free of charge in the “SEC Filings” section of our website located at http://www.anikatherapeutics.com, as soon as reasonably practicable after the reports are electronically filed with or furnished to the SEC. The information on our website is not part of this Annual Report on Form 10-K.
| 11 |
Our operating results and financial condition have varied in the past and could vary significantly in the future depending on a number of factors. You should consider carefully the risks and uncertainties described below, in addition to the other information contained in this Annual Report on Form 10-K, before deciding whether to purchase our common stock. If any of the following risks actually occurs, our business, financial condition, results of operations, and future prospects could be materially and adversely affected. In that event, the trading price of our common stock could decline, and you could lose part or all of your investment.
Risks Related to Our Business and Competitive Position
Our financial performance depends on the continued sales growth and increasing demand for our products and we may not be able to successfully manage the expansion of our operations.
Our future success depends on substantial growth in product sales. There can be no assurance that such growth can be achieved or, if achieved, sustained. There can be no assurance that, even if substantial growth in product sales and the demand for our products is achieved, we will be able to:
| · | Maintain and develop the necessary manufacturing capabilities; |
| · | Develop, successfully implement and/or integrate appropriate commercial models to generate increased sales or obtain the assistance of additional marketing partners; |
| · | Attract, retain, and integrate required key personnel; and |
| · | Implement the financial, accounting, and management systems needed to manage our overall business and growing demand for our products. |
Our failure to successfully manage future growth could have a material adverse effect on our business, financial condition, and results of operations.
Substantial competition could materially affect our financial performance.
We compete with many companies, including large pharmaceutical companies, specialized medical devices companies, and healthcare companies. Many of these companies have substantially greater financial resources, larger research and development staffs, more extensive intellectual technology portfolios, more extensive marketing and manufacturing organizations, and more experience in the regulatory process than us. We also compete with academic institutions, government agencies, and other research organizations that may be involved in research, development, and commercialization of products similar to our own. Because a number of companies are developing or have developed products for similar applications as our products and have received FDA approval, the successful commercialization of a particular product will depend in part upon our ability to complete clinical studies and/or obtain FDA marketing and foreign regulatory approvals prior to our competitors, or, if regulatory approval is not obtained prior to our competitors, to identify markets for our products that may be sufficient to permit meaningful sales of our products. For example, we are aware of several companies that are developing and/or marketing products similar to ours for a variety of human applications. In some cases, competitors have already obtained product approvals, submitted applications for approval, or have commenced human clinical studies, either in the United States or in certain foreign countries. For example, certain products made by our competitors for the treatment of osteoarthritis in the knee received FDA approval before ours and have been marketed in the United States since 1997, as well as select markets in Canada, Europe, and other countries. In addition, the market for our current or future products could be adversely impacted if disruptive technologies or modalities are developed by third parties. There can be no assurance that we will be able to compete against current or future competitors or that competition will not have a material adverse effect on our business, financial condition, and results of operations.
| 12 |
A significant portion of our revenues are derived from a small number of customers, the loss of which could materially adversely affect our business, financial condition and results of operations.
We have historically derived the majority of our revenues from a small number of customers who resell our products to end-users, and most of these customers are significantly larger companies than us. For the year ended December 31, 2019, five customers accounted for 82% of product revenue, with Mitek alone accounting for 71% of product revenue. We expect to continue to be dependent on a small number of large customers for the majority of our revenues in the near-term future, though the significance will be diluted with the implementation of our hybrid commercial model and our recent acquisitions of Arthrosurface, which utilizes a hybrid model with a direct sales team in the United States, and Parcus Medical, which utilizes a similar model to us in the United States. The failure of key customers to purchase our products in the amounts they historically have or in amounts that we expect would seriously harm our business.
In addition, if present and future customers terminate their purchasing arrangements with us, significantly reduce or delay their orders, or seek to renegotiate their agreements on terms less favorable to us, our business, financial condition, and results of operations will be adversely affected. If we accept terms less favorable than the terms of the current agreements, such renegotiations may have a material adverse effect on our business, financial condition, and/or results of operations. Furthermore, in any future negotiations we may be subject to the perceived or actual leverage that these customers may have given their relative size and importance to us. Any termination, change, reduction, or delay in orders could seriously harm our business, financial condition, and results of operations. Accordingly, unless and until we diversify and expand our customer base, or develop alternative commercial strategies, our future success will significantly depend upon the timing and size of future purchases by our largest customers, and the financial and operational success of these customers. The loss of any one of our major customers or the delay of significant orders from such customers, even if only temporary, could reduce or delay our recognition of revenues, harm our reputation in the industry, and reduce our ability to accurately predict cash flow, and, as a consequence, it could seriously harm our business, financial condition, and results of operations.
Our license agreements with Mitek provide substantial control of MONOVISC and ORTHOVISC in the U.S. to Mitek, and Mitek’s actions could have a material impact on our business, financial condition and results of operations.
The Mitek MONOVISC Agreement and Mitek ORTHOVISC Agreement provide Mitek with, among other things, the exclusive right to market and sell MONOVISC and ORTHOVISC in the United States, unilateral decision-making authority over the sale, price, and promotion of MONOVISC and ORTHOVISC, substantial control over the future development of MONOVISC and ORTHOVISC related to the treatment of pain associated with osteoarthritis, a license to manufacture and have manufactured such products in the event that we are unable to supply Mitek with MONOVISC or ORTHOVISC in accordance with the terms of the relevant agreement, and certain rights of first refusal with respect to future products we develop for the treatment of pain associated with osteoarthritis. In exchange, Mitek pays us a transfer price calculated with reference to historical end-user prices in the market and a fixed royalty rate per product on their net product sales. As Mitek accounts for a large percentage of our yearly revenue and has unilateral decision-making authority over in-market activities, including end-user pricing and discounts, reimbursement strategy, and overall promotion strategy, actions taken by Mitek could impact our ability to predict and generate revenue and have a material impact on our business, financial condition, and results of operations.
We are dependent upon marketing and distribution partners and the failure to maintain strategic alliances on acceptable terms will have a material adverse effect on our business, financial condition, and results of operations.
Though we have implemented a hybrid commercial approach in the United States and added substantial commercial infrastructure through our acquisitions of Arthrosurface and Parcus Medical, our success will remain dependent, in part, upon the efforts of our marketing and distribution partners, including our sales agent partners in the U.S. under our hybrid commercial model, and the terms and conditions of our relationships with such partners. One partner, Mitek accounted for 71% of our product revenue in fiscal year 2019. We cannot assure you that our partners, including Mitek, will not seek to renegotiate their current agreements on terms less favorable to us or terminate such agreements. A failure to renew these partnerships on terms satisfactory to us, or at all, could result in a material adverse effect on our operating results.
| 13 |
We continue to seek to establish long-term partnerships in regions and countries not covered by existing agreements, and we may need to obtain the assistance of additional marketing partners to bring new and existing products to market and to replace certain marketing partners. There can be no assurance that we will be able to identify or engage appropriate distribution or collaboration partners or effectively transition to any such new partnerships. The failure to establish strategic partnerships for the marketing and distribution of our products on acceptable terms and within our planned timeframes could have a material adverse effect on our business, financial condition, and results of operations.
As our international sales and operations grow, we could become increasingly subject to additional economic, political, and other risks that could harm our business.
Since we manufacture our products for sale worldwide, our business is subject to risks associated with doing business internationally. During the years ended December 31, 2019, 2018, and 2017, 21%, 19%, and 20%, respectively, of our product sales were to international distributors. We continue to be subject to a variety of risks, which could cause fluctuations in the results of our international and domestic operations. These risks include:
| · | The impact of recessions and other economic conditions in economies, including Europe in particular, outside the United States; |
| · | Instability of foreign economic, political, and labor conditions; |
| · | Unfavorable labor regulations applicable to our European operations, such as severance and the unenforceability of non-competition agreements in the European Union; |
| · | The impact of strikes, work stoppages, work slowdowns, grievances, complaints, claims of unfair labor practices, or other collective bargaining disputes; |
| · | Difficulties in complying with restrictions imposed by regulatory or market requirements, tariffs, or other trade barriers or by U.S. export laws; |
| · | Imposition of government controls limiting the volume of international sales; |
| · | Longer accounts receivable payment cycles; |
| · | Potentially adverse tax consequences, including, if required or applicable, difficulties transferring funds generated in non-U.S. jurisdictions to the United States in a tax efficient manner; |
| · | Difficulties in protecting intellectual property, especially in international jurisdictions; |
| · | Difficulties in managing international operations; and |
| · | Burdens of complying with a wide variety of foreign laws. |
Our success depends, in part, on our ability to anticipate and address these and any new risks. We cannot guarantee that these or other factors will not adversely affect our business or operating results.
Risks Related to Our Commercialization Activities
We may not succeed in our commercialization efforts for TACTOSET and certain other products in the United States, and our failure to do so could negatively impact our business and financial results.
| 14 |
For near-term opportunities in the U.S. market, especially for our Joint Preservation and Restoration Care products, we intend to utilize our hybrid commercial model and the commercial infrastructure of our recent acquisitions, Arthrosurface and Parcus Medical. This approach is a departure from our historical distribution model in the United States, and we cannot be certain that we will be successful in implementing and executing on this commercial approach or that, even if we are able to implement it, the approach will be successful at scale. The commercialization of TACTOSET, other current products, and any future products commercialized or launched under this model is subject to many risks, including that we have not previously commercialized a product on our own and cannot guarantee that we will be able to do so successfully or profitably. We may not be able to attract or retain the sophisticated personnel required for our approach, to identify or negotiate favorable or acceptable terms with distribution agents, to achieve in-market pricing at the levels we have targeted, to timely execute on our strategies for market penetration generally, or to generate meaningful sales of TACTOSET or other products as a result of other market dynamics. Among other factors, our competitors often offer a broader range of products than we do, which could make their aggregate offerings more attractive to end-users, distributor agents, group purchasing organizations, hospitals, and surgeons. Our failure to successfully implement and execute on this commercial approach could have a material adverse effect on our business, financial condition, and results of operations.
We must achieve market acceptance of our products in order to be successful in the future.
Our success will depend in part upon the acceptance of our existing and future products by the medical community, hospitals, physicians, other health care providers, third-party payers, and end-users. Such acceptance may depend upon the extent to which the medical community and end-users perceive our products as safer, more effective, or more cost-competitive than other similar products. Ultimately, for our new products to gain general market acceptance, it may also be necessary for us to develop marketing partners or viable commercial strategies for the distribution of our products. There can be no assurance that our new products will achieve significant market acceptance on a timely basis, or at all. Failure of some or all of our future products to achieve significant market acceptance could have a material adverse effect on our business, financial condition, and results of operations.
Sales of our products are largely dependent upon third party reimbursement and our performance may be harmed by health care cost containment initiatives or decisions of individual third party payers.
In the United States and other foreign markets, health care providers, such as hospitals and physicians, that purchase health care products, such as our products, generally rely on third party payers, including Medicare, Medicaid, and other health insurance and managed care plans, to reimburse all or part of the cost of the health care product. We have generally depended upon the distributors of our products to secure reimbursement and reimbursement approvals. Reimbursement by third party payers, both in the United States and internationally, may depend on a number of factors, including the individual payer’s determination that the use of our products is clinically useful and cost-effective, medically necessary, and not experimental or investigational. Since reimbursement approval is required from each payer individually, seeking such approvals can be a time consuming and costly process which, in the future, could require us or our marketing partners to provide supporting scientific, clinical, and cost-effectiveness data for the use of our products to each payer separately. Significant uncertainty exists as to the reimbursement status of newly approved health care products, and any failure or delay in obtaining reimbursement approvals can negatively impact sales of our new products. In addition, we cannot be certain that payers who currently provide reimbursement for our products will continue to provide such reimbursement in the future, and such payer decisions could negatively impact the sales of our current or future products.
In addition, third party payers are increasingly attempting to contain the costs of health care products and services by limiting both coverage and the level of reimbursement for new therapeutic products and by refusing, in some cases, to provide coverage for uses of approved products for disease indications for which the FDA, or the applicable foreign regulatory agency, has granted marketing approval. Also, the U.S. Congress, certain state legislatures, and certain foreign governments and regulatory agencies have considered reforms, including, among other items, the potential repeal of the Affordable Care Act in the United States, which may affect current reimbursement practices and create additional uncertainty about the pricing of our products, including the potential implementation of controls on health care spending through limitations on the growth of Medicare and Medicaid spending. There can be no assurance that third party reimbursement coverage will be available or adequate for any products or services developed by us. Outside the United States, the success of our products is also dependent in part upon the availability of reimbursement and health care payment systems. Domestic and international reimbursement laws and regulations may change from time to time. Lack of adequate coverage and reimbursement provided by governments and other third party payers for our products and services, including continuing coverage for MONOVISC and ORTHOVISC in the United States, and any change of classification by the Centers for Medicare and Medicaid Services for ORTHOVISC and MONOVISC, could have a material adverse effect on our business, financial condition, and results of operations.
| 15 |
Our business may be adversely affected if consolidation in the healthcare industry leads to demand for price concessions or if we are excluded from being a supplier by a group purchasing organization or similar entity.
Because healthcare costs have risen significantly over the past decade, numerous initiatives and reforms have been launched by legislators, regulators, and third-party payers to curb these costs. As a result, there has been a consolidation trend in the healthcare industry to create larger companies, including hospitals, with greater market power. As the healthcare industry consolidates, competition to provide products and services to industry participants has become and may continue to become more intense. This may result in greater pricing pressures and the exclusion of certain suppliers from important markets as group purchasing organizations, independent delivery networks, and large single accounts continue to use their market power to consolidate purchasing decisions. If a group purchasing organization excludes us from being one of their suppliers, our net sales could be adversely impacted. We expect that market demand, government regulation, third-party reimbursement policies, and societal pressures will continue to change the worldwide healthcare industry, which may exert further downward pressure on the prices of our products.
We experience quarterly sales volume variation, which makes our future results difficult to predict and makes period-to-period comparisons potentially not meaningful.
We experience quarterly fluctuations in our products sales as a result of multiple factors, many of which are outside of our control. These quarterly fluctuations create uncertainty as to the volume of sales that we may achieve in a given period. As a result, comparing our operating results on a period-to-period basis might not be meaningful. You should not rely on our past results as an indication of our future performance. Our operating results could be disproportionately affected by a reduction in revenue because a proportionately smaller amount of our expenses varies with our revenue. As a result, our quarterly operating results are difficult to predict, even in the near term.
Risks Related to Our Product Development and Regulatory Compliance
We are facing a longer than expected pathway to commercialize our CINGAL product in the United States, and we may face other unforeseen difficulties in achieving regulatory approval for CINGAL, which could affect our business and financial results.
In the second quarter of 2018, we received and analyzed the results of our second Phase III clinical trial for CINGAL and found that, while substantial pain reduction associated with CINGAL was evident at each measurement point, the data did not meet the primary study endpoint of demonstrating a statistically significant difference in pain reduction between CINGAL and the approved steroid component of CINGAL at the six-month time point. After completing the analysis of the data related to the totality of our studies for CINGAL and discussing the same with FDA, FDA indicated that an additional Phase III clinical trial would be necessary to support U.S. marketing approval for CINGAL. We decided during the second quarter of 2019 to conduct a pilot study to enable us to evaluate our full-scale Phase III clinical trial design, including patient and site selection criteria, and increase the probability of success for the Phase III trial. We expect to begin enrolling patients in the pilot study in the first half of 2020, but we may experience significant delays in patient enrollment or the pilot study may otherwise not be successful. If the pilot study is successful, we expect to commence an additional Phase III trial, but we cannot guarantee the success of any additional Phase III trial. Because the results of the pilot study or any additional Phase III trial, or other unforeseen future developments, could have a substantial negative impact on the timeline for and the cost associated with a potential CINGAL regulatory approval, our overall business condition, financial results, and competitive position could be affected.
Failure to obtain, or any delay in obtaining, FDA or other U.S. and foreign governmental approvals for our products may have a material adverse effect on our business, financial condition and results of operations.
Several of our current products, and certain future products we may develop, will require clinical trials to determine their safety and efficacy for United States and international marketing approval by regulatory bodies, including the FDA. Product development and approval within the FDA framework takes a number of years and involves the expenditure of substantial resources. There can be no assurance that the FDA will accept submissions related to our new products or the expansion of the indications of our current products, and, even if submissions are accepted, there can be no guarantee that the FDA will grant approval for our new products, including CINGAL, HYALOFAST, or other line extensions of our current products, or for the expansion of indications of our current products on a timely basis, if at all. In addition to regulations enforced by the FDA, we are subject to other existing and future federal, state, local, and foreign regulations applicable to product approval, which may vary significantly across jurisdictions. Additional approval of existing products may be required when changes to such products may affect the safety and effectiveness, including for new indications for use, labeling changes, process or manufacturing changes, the use of a different facility to manufacture, process or package the device, and changes in performance or design specifications. Failure to obtain regulatory approvals of our products, including any changes to existing products, could have an adverse material impact on our business, financial condition, and results of operations.
| 16 |
Even if ultimately granted, FDA and international regulatory approvals may be subject to significant, unanticipated delays throughout the regulatory approval process. Internally, we make assumptions regarding product approval timelines, both in the United States and internationally, in our business planning, and any delay in approval could materially affect our competitive position in the relevant product market and our projections related to future business results.
We cannot be certain that product approvals, both in the United States and internationally, will not include significant limitations on the product indications, and other claims sought for use, under which the products may be marketed. The relevant approval or clearance may also include other significant conditions of approval such as post-market testing, tracking, or surveillance requirements. Any of these factors could significantly impact our competitive position in relation to such products and could have a negative impact on the sales of such products.
Once obtained, we cannot guarantee that FDA or international product approvals will not be withdrawn or that relevant agencies will not require other corrective action, and any withdrawal or corrective action could materially affect our business and financial results.
Once obtained, marketing approval can be withdrawn by the FDA or comparable foreign regulatory agencies for a number of reasons, including the failure to comply with ongoing regulatory requirements or the occurrence of unforeseen problems following initial approval. Regulatory authorities could also limit or prevent the manufacture or distribution of our products. Any regulatory limitations on the use of our products or any withdrawal or suspension of approval or rescission of approval by the FDA or a comparable foreign regulatory agency could have a material adverse effect on our business, financial condition, and results of operations.
Our operations and products are subject to extensive regulation, compliance with which is costly and time consuming, and our failure to comply may result in substantial penalties, including recalls of our products.
The FDA and foreign regulatory bodies impose extensive regulations applicable to our operations and products, including regulations governing product standards, packing requirements, labeling requirements, quality system and manufacturing requirements, import restrictions, tariff regulations, duties, and tax requirements. We cannot assure you that we will be able to achieve and maintain compliance required for FDA, CE marking, or other foreign regulatory approvals for any or all of our operations and products or that we will be able to produce our products in a timely and profitable manner while complying with applicable requirements.
Failure to comply with applicable regulatory requirements could result in substantial penalties, including warning letters, fines, injunctions, civil penalties, seizure of products, total or partial suspension of production, refusal to grant pre-market clearance or pre-market approval for devices or drugs, withdrawal of approvals, and criminal prosecution. Additionally, regulatory authorities have the power to require the recall of our products. It also might be necessary for us, in applicable circumstances, to initiate a voluntary recall per regulatory requirements of one or several of our products. The imposition of any of the foregoing penalties, whether voluntarily or involuntary, could have a material negative impact on our business, financial condition, and results of operations.
Any changes in FDA or international regulations related to product approval or approval renewal, including those currently under consideration by FDA or those that apply retroactively, could adversely affect our competitive position and materially affect our business and financial results.
FDA and foreign regulations depend heavily on administrative interpretation, and we cannot assure you that future interpretations made by the FDA or other regulatory bodies, with possible retroactive effect, will not adversely affect us. Additionally, any changes, whether in interpretation or substance, in existing regulations or policies, or any future adoption of new regulations or policies by relevant regulatory bodies, could prevent or delay approval of our products. In the event our future, or current, products, including HA generally, are classified, or re-classified, as human drugs, combination products, or biologics by the FDA or an applicable international regulatory body, the applicable review process related to such products is typically substantially longer and substantially more expensive than the review process to which they are currently subject as medical devices. In 2018, FDA publicly indicated its intent to consider HA products for certain indications for regulation as a drug and has indicated that industry should submit new products or indication expansions to the OCP to designate the appropriate FDA office for review. There exists uncertainty with respect to the final interpretation, implementation, and consequences of this development, and this or any other potential regulatory changes in approach or interpretation similar in substance to those mentioned in this paragraph and affecting our products could materially impact our competitive position, business, and financial results.
| 17 |
Additionally, the implementation of the new European Medical Device Regulation, or EU MDR, set to take full effect in 2020, is expected to change several aspects of the existing regulatory framework in Europe. Specifically, the EU MDR will require changes in the clinical evidence required for medical devices, post-market clinical follow-up evidence, annual reporting of safety information for Class III products, and bi-annual reporting for Class II products, Unique Device Identification, or UDI, for all products, submission of core data elements to a European UDI database prior to placement of a device on the market, reclassification of medical devices, and multiple other labeling changes. Approvals for certain of our currently-marketed products could be curtailed or withdrawn as a result of the implementation of the EU MDR, and acquiring approvals for new products could be more challenging and costly. For example, the CE Mark indication for MONOVISC of the treatment of pain associated with osteoarthritis in all synovial joints was limited to the knee joint by our notified body as a result of the EU MDR, pending our generation of adequate data to support the broader indication previously granted. We do not expect this limitation to have a material impact on MONOVISC’s revenue generation, but compliance with this and any other requirements could be time consuming and costly, and our failure to comply may subject us to significant liabilities, which could have a material adverse effect on our business, financial condition, and results of operations.
We may rely on third parties to support certain aspects of our clinical trials. If these third parties do not successfully carry out their contractual duties or meet expected deadlines, we may not be able to obtain regulatory approval or commercialize our products, and our business could be substantially harmed.
We have hired experienced clinical development and regulatory staff, and we have also retained the services of knowledgeable external service providers, including consultants and clinical research organizations, to develop and supervise our clinical trials and regulatory processes. Despite our internal investment in staffing, we will remain dependent upon these third-party contract research organizations to carry out portions of our clinical and preclinical research studies for the foreseeable future. As a result, we have had and will have less control over the conduct of the clinical trials, the timing and completion of the trials, the required reporting of adverse events, and the management of data developed through the trials than would be the case if we were relying entirely on our own staff. Outside parties may have staffing difficulties, may undergo changes in priorities or may become financially distressed, adversely affecting their willingness or ability to conduct our trials. Failure by these third parties to comply with regulatory requirements or to meet timing expectations may require us to repeat clinical or preclinical trials, which would delay the regulatory approval process, or require substantial unexpected expenditures.
We are subject to various healthcare laws and regulations, and any failure to comply with applicable laws could subject us to significant liability and harm our business.
Our business involves substantial interaction and collaboration with healthcare professionals, including physician consultants, clinical investigators, and actual and potential customers. These relationships are subject to federal and state healthcare laws, as well as equivalent foreign regulations. These statutes and regulations include, without limitation, false claims laws, anti-kickback regulations, the Foreign Corrupt Practices Act, and the Physician Payments Sunshine Act. Any failure to comply with these laws could subject us to significant liabilities, which could have a material adverse effect on our business, financial condition, and results of operations.
| 18 |
We are subject to environmental regulations and any failure to comply with applicable laws could subject us to significant liabilities and harm our business.
We are subject to a variety of local, state, federal, and foreign government regulations relating to the storage, discharge, handling, emission, generation, manufacture, and disposal of toxic or other hazardous substances used in the manufacture of our products. Any failure by us to control the use, disposal, removal, or storage of hazardous chemicals or toxic substances could subject us to significant liabilities, which could have a material adverse effect on our business, financial condition, and results of operations.
Risks Related to Our Business and Industry
We may not generate the expected benefits of our recent acquisitions, and the integration of those acquisitions could disrupt our ongoing business, distract our management and increase our expenses.
Through our recent acquisitions of Parcus Medical and Arthrosurface, we expanded our product portfolio and pipeline, diversified our business, entered new markets, and increased the scope of our operations and the number of our employees. The continued successful integration of these other companies into our operations is critical to our future financial performance. This will require that we integrate more closely the companies’ product offerings and research and development capabilities, retain key employees, assimilate diverse corporate cultures, further integrate management information systems, consolidate the acquired operations and manage geographically dispersed operations, among other things, each of which could pose significant challenges. The difficulty of combining the acquired companies with our company may be increased by the need to integrate personnel, and changes effected in the combination may cause key employees to leave. To succeed in the market for joint preservation and restoration, we must also invest additional resources, primarily in the areas of sales and marketing, to extend name recognition and increase market share.
It is possible that the integration process could take longer than anticipated and could result in the loss of valuable employees, additional and unforeseen expenses, the disruption of our ongoing business, processes and systems, or inconsistencies in standards, controls, procedures, practices, policies and compensation arrangements, any of which could adversely affect our ability to achieve the anticipated benefits of the acquisitions. There may be increased risk due to integrating financial reporting and internal control systems. The diversion of the attention of management created by the integration process, any disruptions or other difficulties encountered in the integration process, and unforeseen liabilities or unanticipated problems with the acquired businesses could have a material adverse effect on our business, operating results and financial condition. There can be no assurance that these acquisitions will provide the benefits we expect or that we will be able to integrate and develop the operations of Parcus Medical and Arthrosurface successfully. Any failure to do so could have a material adverse effect on our business, operating results and financial condition.
We may have difficulty managing our growth.
Through our recent acquisitions of Parcus Medical and Arthrosurface, we have experienced substantial growth in the number of our employees, the scope of our product portfolio and pipeline, the size of our operating and financial systems, and the geographic area of our operations. Our operations have expanded significantly through these acquisitions. This growth has resulted in increased responsibilities for our management. To manage our growth effectively, we must continue to expand our management team, attract, motivate and retain employees, and improve our operating and financial systems. There can be no assurance that our current management systems will be adequate or that we will be able to manage our recent or future growth successfully. Any failure to do so could have a material adverse effect on our business, operating results and financial condition.
| 19 |
We expect to continue to actively explore acquisitions as a part of our future growth strategy, which exposes us to a variety of risks that could adversely affect our business operations.
Our business and future growth strategy includes as an important component the acquisition of businesses, technologies, services, or products that we believe are a strategic fit with or otherwise provide value to our business. We may fund these acquisitions by utilizing our cash, incurring debt, issuing additional shares of our common stock, or by other means. Completed acquisitions may expose us to a number of risks and expenses, including unanticipated liabilities, amortization expenses related to intangible assets with definite lives, or risks associated with entering new markets with which we have limited experience or where commercial alliances with experienced partners or existing sales channels are not available. Whether or not completed, acquisitions may result in diversion of management resources otherwise available for ongoing development of our business and significant expenditures.
The acquisitions we have made or may make in the future may make us the subject of lawsuits from either an acquired company’s stockholders, an acquired company’s previous stockholders, or our current stockholders.
We may be the subject of lawsuits from either an acquired company’s stockholders, an acquired company’s previous stockholders, or our current stockholders. These lawsuits could result from the actions of the acquisition target prior to the date of the acquisition, from the acquisition transaction itself, or from actions after the acquisition. Defending potential lawsuits could cost us significant expense and distract management’s attention from the operation of the business. Additionally, these lawsuits could result in the cancellation of, or the inability to renew, certain insurance coverage that would be necessary to protect our assets.
Customer and employee uncertainty about the effects of any acquisitions could harm us.
Customers of any companies we acquire may, in response to the consummation of the acquisitions, delay or defer purchasing decisions, which could adversely affect the success of our acquired businesses. Similarly, employees of acquired companies may experience uncertainty about their future roles, which may adversely affect our ability to attract and retain key management, sales, marketing, and technical personnel following an acquisition.
Attractive acquisition opportunities may not be available to us.
We routinely consider the acquisition of other businesses or assets. However, we may not locate suitable acquisition targets or have the opportunity to make acquisitions of such targets on favorable terms, which could negatively impact the growth of our business. In order to pursue such opportunities, we may require significant additional financing, which may not be available to us on favorable terms, if at all. Our current or potential competitors, many of which have significantly greater resources than we do, may compete with us to acquire compatible businesses, which would increase the acquisition prices and could cause us to expend significant time and funds on acquisitions we are unable to complete.
We may require capital in the future. We cannot give any assurance that such capital will be available at all or on terms acceptable to us, and if it is available, additional capital raised by us could dilute your ownership interest or the value of your shares.
We may need to raise capital in the future depending on numerous factors, including:
| · | Market acceptance of our existing and future products; |
| · | The success and sales of our products under various distributor agreements and other appropriate commercial strategies, including the ability of our partners to achieve third party reimbursement for our products; |
| · | The successful commercialization of products in development through appropriate commercial models and marketing channels; |
| · | Progress in our product development efforts; |
| · | The magnitude and scope of such product development efforts; |
| · | Any potential acquisitions of products, technologies, or businesses; |
| 20 |
| · | Progress with preclinical studies, clinical trials, and product approvals and clearances by the FDA and other agencies; |
| · | The cost and timing of our efforts to manage our manufacturing capabilities and related costs; |
| · | The cost of filing, prosecuting, defending, and enforcing patent claims and other intellectual property rights and the cost of defending any other legal proceeding; |
| · | Competing technological and market developments; |
| · | The development of strategic alliances for the marketing of certain of our products; |
| · | The terms of such strategic alliances, including provisions (and our ability to satisfy such provisions) that provide upfront and/or milestone payments to us; |
| · |
The cost of maintaining adequate inventory levels to meet current and future product demand; and |
| · | Further expanding our business in international markets. |
To the extent funds generated from our operations, together with our existing capital resources, are insufficient to meet future requirements, we will be required to obtain additional funds through equity or debt financings, through strategic alliances with corporate partners and others, or through other sources. The terms of any future equity financings may be dilutive to our investors and the terms of any debt financings may contain restrictive covenants, which limit our ability to pursue certain courses of action. Our ability to obtain financing is dependent on the status of our future business prospects as well as conditions prevailing in the relevant capital markets at the time we seek financing. No assurance can be given that any additional financing will be made available to us or will be available on acceptable terms should such a need arise.
If we succeed in raising additional funds through the issuance of equity or convertible securities, then the issuance could result in substantial dilution to existing stockholders. Furthermore, the holders of these new securities or debt may have rights, preferences and privileges senior to those of the holders of common stock. In addition, any preferred equity issuance or debt financing that we may obtain in the future could have restrictive covenants relating to our capital raising activities and other financial and operational matters, which may make it more difficult for us to obtain additional capital and to pursue business opportunities, including potential acquisitions.
Our global operations, particularly in Italy, may be adversely affected by the coronavirus outbreak and face risks that could impact our business.
A novel strain of coronavirus, COVID-19, originated in Wuhan, China, in December 2019. The virus has spread to Italy, which as of March 2020 reportedly had the highest number of coronavirus infections outside Asia. Though it represents a relatively small percentage of our consolidated business, we conduct commercial activity, product development, sales and inventory management and other services in our Padova, Italy location, and those business operations are subject to potential business interruptions arising from protective measures that may be taken by the Italian government or other agencies or governing bodies. Business disruptions elsewhere in the world could also negatively affect the sources and availability of components and materials that are essential to the operation of our business in both Italy and the United States. Extended periods of interruption to our Italian or U.S. operations due to the coronavirus outbreak could adversely impact the growth of our business, could cause us to cease or delay operations, and could prevent our customers from receiving shipments or processing payments.
The extent to which the coronavirus impacts our global business, sales and results of operations will depend on future developments, which are highly uncertain and cannot be predicted. This includes new information that may emerge concerning the severity of the coronavirus, the spread and proliferation of the coronavirus around the world, and the actions taken to contain the coronavirus or treat its impact, among others.
21
Our manufacturing processes involve inherent risks, and disruption could materially adversely affect our business, financial condition, and results of operations.
The operation of biomedical manufacturing plants involves many risks, including the risks of breakdown, failure, or substandard performance of equipment, the need to comply with the requirements of directives of government agencies, including the FDA, and the occurrence of natural and other disasters. Such occurrences could have a material adverse effect on our business, financial condition, and results of operations during the period of such operational difficulties and beyond.
We rely on a small number of suppliers for certain key raw materials and a small number of suppliers for a number of other materials required for the manufacturing and delivery of our products, and disruption could materially adversely affect our business, financial condition, and results of operations.
Although we believe that alternative sources for many of these and other components and raw materials that we use in our manufacturing processes are available, we cannot be certain that the supply of key raw materials will continue to be available at current levels or will be sufficient to meet our future needs. For the manufacture of the surgical joint implant and instrumentation products produced by our subsidiary Arthrosurface, we engage a single third-party organization as a contract manufacturer. Any supply interruption could harm our ability to manufacture our products until a new source of supply is identified and qualified. We may not be able to find sufficient alternative suppliers in a reasonable time period, or on commercially reasonable terms, if at all, and our ability to produce and supply our products could be impaired.
We use raw materials derived from animal sources to produce certain of our products, and there is no guarantee that we will be able to continue to utilize this source of material in the future.
Our manufacturing processes and research and development efforts for some of our ophthalmic and veterinary products involve products derived from animals. We procure our animal-derived raw materials from a qualified vendor, who controls for contamination and has processes that effectively inactivate infectious agents; however, we cannot assure you that we can completely eliminate the risk of transmission of infectious agents. Furthermore, regulatory authorities could in the future impose restrictions on the use of animal-derived raw materials that could impact our business.
The utilization of animals in research and development and product commercialization is subject to increasing focus by animal rights activists. The activities of animal rights groups and other organizations that have protested animal based research and development programs or boycotted the products resulting from such programs could cause an interruption in our manufacturing processes and research and development efforts. The occurrence of material operational problems, including but not limited to the events described above, could have a material adverse effect on our business, financial condition, and results of operations during the period of such operational difficulties and beyond.
We lease properties in the United States and Italy, and there is no guarantee that these leaseholds will be without issue or sufficient to support future growth.
We lease approximately 134,000 square feet of administrative, research and development, and manufacturing space in Bedford, Massachusetts, approximately 10,000 square feet of administrative, research and development, and warehouse facility in Franklin, Massachusetts, approximately 40,000 square feet of administrative, research and development, and manufacturing space in Sarasota, Florida, and approximately 33,000 square feet of office, research and development, training, and warehousing space in Padova, Italy. The current term of the Bedford lease extends to 2022, and the current term of the Padova lease extends to 2032, each with several options for renewal. Please see Item 2 – Properties for additional information on our current leases. The nature of these leaseholds presents certain risks. We must maintain a positive working relationship with the respective owners as a dispute with either owner over payment, maintenance, or any other matter could be disruptive to our business. Additionally, there is a possibility that changes to our business or the geographic location of the facilities could make either location less suitable to our operations. Any renegotiation or termination of either lease could result in substantial cost or business interruption to our operations. Additionally, there is no guarantee that our current space will be sufficient to support our future growth or that any future relocation or expansion of our operations would be completed smoothly or in a timely manner due to, among other things, unexpected construction delays or unexpected difficulties related to the achievement of necessary permitting. Any business disruption as a result of any of these factors could have a material impact on our business, financial condition, and results of operations.
22
We may face circumstances in the future that will result in impairment charges, including, but not limited to, goodwill impairment and In-Process Research and Development (“IPR&D”) charges.
As of December 31, 2019, we had long-lived assets, including goodwill and IPR&D, of $96.4 million. If the fair value of any of our long-lived assets, including those that we recently acquired in the acquisitions of Arthrosurface and Parcus Medical for which purchase accounting is not yet complete, decreases as a result of an economic slowdown, a downturn in the markets where we sell products and services, a downturn in our financial performance or future outlook or for other reasons, we may be required to record an impairment charge on such assets.
We are required to test intangible assets with indefinite life periods for potential impairment annually and on an interim basis if there are indicators of a potential impairment. We also are required to evaluate amortizable intangible assets and fixed assets for impairment if there are indicators of a possible impairment. Impairment charges could have a negative impact on our results of operations and financial position, as well as on the market price of our common stock.
We could become subject to product liability claims, which, if successful, could materially adversely affect our business, financial condition, and results of operations.
The testing, marketing, and sale of human health care products entail an inherent risk of allegations of product liability, and there can be no assurance that substantial product liability claims will not be asserted against us. Although we have not received any material product liability claims to date and have an insurance policy of $5.0 million per occurrence and $5.0 million in the aggregate to cover such product liability claims should they arise, there can be no assurance that material claims will not arise in the future or that our insurance will be adequate to cover all situations. Moreover, there can be no assurance that such insurance, or additional insurance, if required, will be available in the future or, if available, will be available on commercially reasonable terms. Any product liability claim, if successful, could have a material adverse effect on our business, financial condition, and results of operations.
Our business is dependent upon hiring and retaining qualified management and technical personnel, including our hiring of a permanent chief executive officer.
We are highly dependent on the members of our management and technical staff, the loss of one or more of whom could have a material adverse effect on us. We have experienced a number of management changes in recent years, and there can be no assurances that any future management changes will not adversely affect our business. We believe that our future success will depend in large part upon our ability to attract and retain technical and highly skilled executive, managerial, professional, and technical personnel. We face significant competition for such personnel from competitive companies, research and academic institutions, government entities, and other organizations. There can be no assurance that we will be successful in hiring or retaining the personnel we require. The failure to hire and retain such personnel could have a material adverse effect on our business, financial condition, and results of operations.
On January 29, 2020, Joseph Darling, our former President and Chief Executive Officer, passed away unexpectedly. Dr. Cheryl Blanchard, a member of the Board of Directors, has been named Interim Chief Executive Officer. The Board of Directors has undertaken a search process to identify and hire a permanent chief executive officer. A failure to hire a highly qualified successor chief executive officer, or an extended delay in the hiring process, could materially limit or restrict our ability to execute our long-term strategy and to operate our business.
23
Currency exchange rate fluctuations may have a negative impact on our reported earnings.
Approximately 4% of our business during 2019 was conducted in functional currencies other than the U.S. dollar, which is our reporting currency. Thus, currency fluctuations among the U.S. dollar and the other currencies in which we do business have caused and will continue to cause foreign currency transaction gains and losses. Currently, we attempt to manage foreign currency risk through the matching of assets and liabilities. In the future, we may undertake to manage foreign currency risk through additional hedging methods. We recognize foreign currency gains or losses arising from our operations in the period incurred. We cannot guarantee that we will be successful in managing foreign currency risk or in predicting the effects of exchange rate fluctuations upon our future operating results because of the variability of currency exposure and the potential volatility of currency exchange rates.
Information security breaches or business system disruptions may adversely affect our business.
We rely on our information technology infrastructure and management information systems to effectively run our business. While we have not previously experienced a material information security breach caused by illegal hacking, computer viruses, or acts of vandalism or terrorism, we may in the future be subject to such a breach. Our security measures or those of our third-party service providers may not detect or prevent such breaches. Any such compromise to our information security could result in an interruption in our operations, the unauthorized publication of our confidential business or proprietary information, the unauthorized release of customer, vendor, or employee data, the violation of privacy, including under the GDPR recently promulgated in the European Union, or other laws and exposure to litigation, any of which could harm our business and operating results.
Risks Related to Our Intellectual Property
We may be unable to adequately protect our intellectual property rights, which could have a material impact on our business and future financial results.
Our efforts to enforce our intellectual property rights may not be successful. We rely on a combination of copyright, trademark, patent, and trade secret laws, confidentiality procedures, and contractual provisions to protect our proprietary rights. Our success will depend, in part, on our ability to obtain and enforce patents and trademarks, to protect trade secrets, to obtain licenses to technology owned by third parties when necessary, and to conduct our business without infringing on the proprietary rights of others. The patent positions of pharmaceutical, medical product, and biotechnology firms, including ours, can be uncertain and involve complex legal and factual questions. There can be no assurance that any patent applications will result in the issuance of patents or, if any patents are issued, that they will provide significant proprietary protection or commercial advantage or will not be circumvented by others. Filing and prosecution of patent applications, litigation to establish the validity and scope of patents, assertion of patent infringement claims against others, and the defense of patent infringement claims by others can be expensive and time consuming. There can be no assurance that, in the event that any claims with respect to any of our patents, if issued, are challenged by one or more third parties, any court or patent authority ruling on such challenge will determine that such patent claims are valid and enforceable. An adverse outcome in such litigation or patent review process could cause us to lose exclusivity covered by the disputed rights. If a third party is found to have rights covering products or processes used by us, we could be forced to cease using the technologies or marketing the products covered by such rights, we could be subject to significant liabilities to such third party, and we could be required to license technologies from such third party in order to continue production of the products. Furthermore, even if our patents are determined to be valid, enforceable, and broad in scope, there can be no assurance that competitors will not be able to design around such patents and compete with us using the resulting alternative technology. We have a policy of seeking patent protection for patentable aspects of our proprietary technology. We intend to seek patent protection with respect to products and processes developed in the course of our activities when we believe such protection is in our best interest and when the cost of seeking such protection is not inordinate. However, no assurance can be given that any patent application will be filed, that any filed applications will result in issued patents, or that any issued patents will provide us with a competitive advantage or will not be successfully challenged by third parties. The protections afforded by patents will depend upon their scope and validity, and others may be able to design around our patents.
24
We also rely upon trade secrets and proprietary know-how for certain non-patented aspects of our technology. To protect such information, we require all employees, consultants, and licensees to enter into confidentiality agreements limiting the disclosure and use of such information. There can be no assurance that these agreements provide meaningful protection or that they will not be breached, that we would have adequate remedies for any such breach, or that our trade secrets, proprietary know-how, and our technological advances will not otherwise become known to others. In addition, there can be no assurance that, despite precautions taken by us, others have not and will not obtain access to our proprietary technology. Further, there can be no assurance that third parties will not independently develop substantially equivalent or better technology.
There can be no assurance that we will not infringe upon the intellectual property rights of others, which could have a significant impact on our business and financial results.
Other entities have filed patent applications for, or have been issued patents concerning, various aspects of HA-related products or processes, including in the segments in which we do business. There can be no assurance that the products or processes developed by us will not infringe on the patent rights of others in the future. The cost of defending infringement suits is typically large, and there is no guarantee that any future defense would be successful. In addition, infringement could lead to substantial damages payouts or our inability to produce or market certain of our current or future products. As a result, any such infringement may have a material adverse effect on our business, financial condition, and results of operations.
Risks Related to Ownership of Our Common Stock
Our stock price may be highly volatile, and we cannot assure you that market making in our common stock will continue.
The market price of shares of our common stock may be highly volatile. Factors such as announcements of new commercial products or technological innovations by us or our competitors, disclosure of results of clinical testing or regulatory proceedings, government regulation and approvals, developments in patent or other proprietary rights, public concern as to the safety of products developed by us, and general market conditions may have a significant effect on the market price of our common stock. The trading price of our common stock could be subject to wide fluctuations in response to quarter-to-quarter variations in our operating results, material announcements by us or our competitors, governmental regulatory action, conditions in the health care industry generally or in the medical products industry specifically, or other events or factors, many of which are beyond our control. In addition, the stock market has experienced extreme price and volume fluctuations, which have particularly affected the market prices of many medical products companies and which often have been unrelated to the operating performance of such companies. Our operating results in future quarters may be below the expectations of equity research analysts and investors. In such an event, the price of our common stock would likely decline, perhaps substantially.
If securities or industry analysts do not publish or cease publishing research or reports about us, our business, or our market, or if they adversely change their recommendations regarding our stock, our stock price and trading volume could decline.
The trading market for our common stock is influenced by the research and reports that securities or industry analysts may publish about us, our business, our market, or our competitors. No person is under any obligation to publish research or reports on us, and any person publishing research or reports on us may discontinue doing so at any time without notice. If adequate research coverage is not maintained on our company or if any of the analysts who cover us downgrade our stock or publish inaccurate or unfavorable research about our business or provide relatively more favorable recommendations about our competitors, our stock price would likely decline. If any analysts who cover us were to cease coverage of our company or fail to regularly publish reports on us, we could lose visibility in the financial markets, which in turn could cause our stock price or trading volume to decline.
25
Our charter documents contain anti-takeover provisions that may prevent or delay an acquisition of our company.
Our charter documents continue to contain anti-takeover provisions that could prevent or delay an acquisition of our company. The provisions include, among others, a classified board of directors, advance notice to the board of stockholder proposals, limitations on the ability of stockholders to remove directors and to call stockholder meetings, and a provision that allows vacancies on the Board of Directors to be filled by vote of a majority of the remaining directors. We are also subject to Section 203 of the Delaware General Corporate Law which, subject to certain exceptions, prohibits a Delaware corporation from engaging in any of a broad range of business combinations with any “interested stockholder” for a period of three years following the date that such stockholder becomes an interested stockholder. Those provisions could have the effect of discouraging a third party from pursuing a non-negotiated takeover of our company at a price considered attractive by many stockholders and could have the effect of preventing or delaying a potential acquirer from acquiring control of our company.
Our corporate headquarters is located in Bedford, Massachusetts, where we lease approximately 134,000 square feet of administrative, research and development, and manufacturing space. We entered into this lease in January 2007, and the lease commenced in May 2007 for an initial term of ten and a half years. In October 2016, we exercised the first option under the lease to extend its term for five years. There are three additional renewal periods, each of which is subject to the condition that we notify the landlord of our exercise of such option at least one year prior to the expiration of the then current term. Two additional renewal options each extend the term an additional five years, and the final renewal option extends the term an additional six years.
In October 2015, Anika S.r.l. entered into a build-to-suit lease agreement for a new European headquarters facility consisting of approximately 33,000 square feet of general office, research and development, training, and warehousing space located in Padova, Italy. This lease, which has an initial term of fifteen years, commenced in February 2017 in accordance with the lease agreement, as amended in February 2017. The lease will automatically renew for up to three additional six-year terms, subject to certain terms and conditions. Anika S.r.l. may elect to early withdraw from this lease subject to certain financial penalties after six years and with no penalties after the ninth year.
In the first quarter of 2020 we added approximately 10,000 square feet of administrative, research and development, and warehouse facility in Franklin, Massachusetts and approximately 40,000 square feet of administrative, research and development, and manufacturing space in Sarasota, Florida through our respective acquisitions of Arthrosurface, Incorporated and Parcus Medical, LLC.
In 2019, we had aggregate facility lease expenses of approximately $1.9 million. We believe that the capacity of our Bedford, Franklin, Sarasota, and Padova facilities will be sufficient to satisfy our needs for the foreseeable future.
We are involved from time-to-time in various legal proceedings arising in the normal course of business. Although the outcomes of these legal proceedings are inherently difficult to predict, we do not expect the resolution of these proceedings to have a material adverse effect on our financial position, results of operations, or cash flow.
26
ITEM 5. MARKET FOR REGISTRANT’S COMMON EQUITY, RELATED STOCKHOLDER MATTERS AND ISSUER PURCHASES OF EQUITY SECURITIES
Common Stock Information
Our common stock has traded on the NASDAQ Global Select Market since November 25, 1997, under the symbol “ANIK.” At December 31, 2019, the closing price per share of our common stock was $51.85 as reported on the NASDAQ Global Select Market, and there were 116 holders of record. We believe that the number of beneficial owners of our common stock at that date was substantially greater, due to shares being held by intermediaries.
We have never declared or paid any cash dividends on our common stock. We currently intend to retain earnings, if any, for use in our business and do not anticipate paying cash dividends on our common stock in the foreseeable future. Payment of future dividends, if any, on our common stock will be at the discretion of our Board of Directors after taking into account various factors, including our financial condition, operating results, anticipated cash needs, and plans for expansion.
27
Performance Graph
Set forth below is a graph comparing the total returns of our company, the NASDAQ Composite Index, and the NASDAQ Biotechnology Index. The graph assumes $100 is invested on December 31, 2014 in our common stock and each of the indices. Past performance is not indicative of future results.
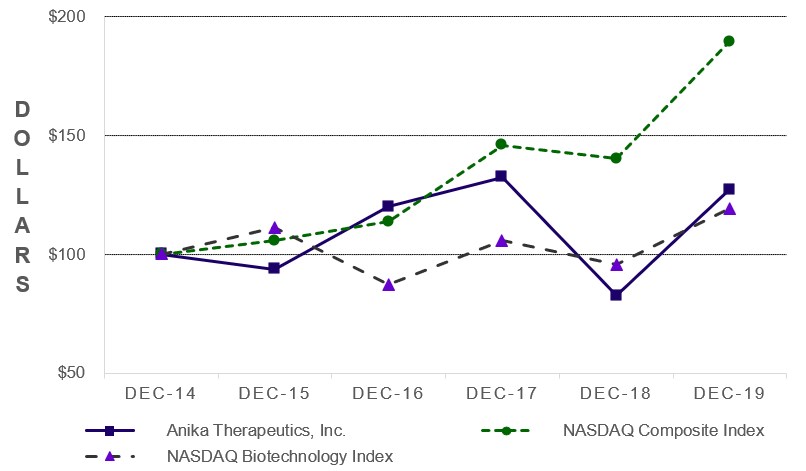
| Dec-14 | Dec-15 | Dec-16 | Dec-17 | Dec-18 | Dec-19 | |||||||||||||||||||
| Anika Therapeutics, Inc. | $ | 100.00 | $ | 93.67 | $ | 120.18 | $ | 132.33 | $ | 82.50 | $ | 127.27 | ||||||||||||
| NASDAQ Composite Index | $ | 100.00 | $ | 105.73 | $ | 113.66 | $ | 145.76 | $ | 140.10 | $ | 189.45 | ||||||||||||
| NASDAQ Biotechnology Index | $ | 100.00 | $ | 111.42 | $ | 87.26 | $ | 105.64 | $ | 95.79 | $ | 119.17 | ||||||||||||
Issuer Purchases and Withholding of Equity Securities
Under our equity compensation plans, and subject to the specific approval of the Compensation Committee of our Board of Directors, grantees have the option of electing to satisfy tax withholding obligations at the time of vesting or exercise by allowing us to withhold shares of stock otherwise issuable to the grantee. During the three-month period ended December 31, 2019, we withheld 672 shares to satisfy grantee tax withholding obligations on restricted stock award vesting events.
Following is a summary of stock repurchases for the three-month period ended December 31, 2019 (in thousands, except share data):
| Period | Total Number of Shares Withheld | Average Price per Share | Total Number of Shares Purchased as Part of Publicly Announced Plans or Programs | Maximum Number (or Approximate Dollar Value) of Shares that May Yet be Purchased Under the Plans or Programs(1) | ||||||||||||
| October 1 to 31, 2019 | 672 | $ | 69.67 | – | $ | 32,000 | ||||||||||
| November 1 to 30, 2019 | – | – | – | $ | 32,000 | |||||||||||
| December 1 to 31, 2019 | – | – | – | $ | 32,000 | |||||||||||
| Total | 672 | – | ||||||||||||||
| (1) | On May 2, 2019, we announced that our Board of Directors approved a $50.0 million share repurchase program with $30.0 million to be utilized for an accelerated share repurchase program and $20.0 million reserved for open market repurchases. Through December 31, 2019, we have made no open market repurchases. On May 7, 2019, we entered into a previously-announced accelerated share repurchase agreement (the “ASR Agreement”) to repurchase an aggregate of $30.0 million of common stock. During the second quarter of 2019, 451,694 shares were delivered to us, constituting the initial delivery of shares and representing 60% of the then estimated total number of shares expected to be repurchased under the ASR Agreement. On January 14, 2020, pursuant to the terms of the ASR Agreement, Morgan Stanley accelerated the final settlement date from February 2020, and the final number of shares and the average purchase price was determined. Based on the volume-weighted average price from the effective date of the ASR Agreement through January 14, 2020, less the applicable contractual discount, Morgan Stanley delivered 139,057 additional shares to us on January 17, 2020. In total, 590,751 shares were repurchased under the ASR Agreement at an average repurchase price of approximately $50.78. All shares were repurchased in accordance with the publicly announced program. |
Securities Authorized for Issuance Under Equity Compensation Plans
For information regarding securities authorized for issuance under our employee stock-based compensation plans, see Part III, Item 12, Security Ownership of Certain Beneficial Owners and Management and Related Stockholder Matters, included elsewhere in this Annual Report on Form 10-K.
ITEM 6. SELECTED FINANCIAL DATA
The following selected consolidated financial data should be read in conjunction with the Consolidated Financial Statements and the Notes thereto and the section captioned “Management’s Discussion and Analysis of Financial Condition and Results of Operations” included elsewhere in this Annual Report on Form 10-K. The Balance Sheet Data at December 31, 2019 and 2018 and the Statement of Operations Data for each of the three years ended December 31, 2019, 2018, and 2017 have been derived from the audited Consolidated Financial Statements for such years, included elsewhere in this Annual Report on Form 10-K. The Balance Sheet Data at December 31, 2017, 2016, and 2015, and the Statement of Operations Data for each of the two years in the period ended December 31, 2016 and 2015 have been derived from audited consolidated financial statements for such years not included in this Annual Report on Form 10-K.
28
ITEM 7. MANAGEMENT’S DISCUSSION AND ANALYSIS OF FINANCIAL CONDITION AND RESULTS OF OPERATIONS
| Years ended December 31, | ||||||||||||||||||||
| 2019 | 2018 | 2017 | 2016 | 2015 | ||||||||||||||||
| Statements of Operations Data*: | (in thousands, except per share data) | |||||||||||||||||||
| Product revenue | $ | 114,512 | $ | 105,531 | $ | 107,783 | $ | 102,932 | $ | 87,696 | ||||||||||
| Licensing, milestone and contract revenue | 98 | 24 | 5,637 | 447 | 5,303 | |||||||||||||||
| Total revenue | 114,610 | 105,555 | 113,420 | 103,379 | 92,999 | |||||||||||||||
| Cost of product revenue | 28,747 | 31,280 | 27,364 | 24,027 | 21,053 | |||||||||||||||
| Product gross profit | 85,765 | 74,251 | 80,419 | 78,905 | 66,643 | |||||||||||||||
| Product gross margin | 75 | % | 70 | % | 75 | % | 77 | % | 76 | % | ||||||||||
| Total operating expenses | 80,362 | 83,806 | 67,691 | 52,772 | 44,865 | |||||||||||||||
| Net income | 27,193 | 18,722 | 31,816 | 32,547 | 30,758 | |||||||||||||||
| Diluted net income per common share | $ | 1.89 | $ | 1.27 | $ | 2.11 | $ | 2.15 | $ | 2.01 | ||||||||||
| Diluted common shares outstanding | 14,374 | 14,689 | 15,068 | 15,116 | 15,321 | |||||||||||||||
| Years ended December 31, | ||||||||||||||||||||
| 2019 | 2018 | 2017 | 2016 | 2015 | ||||||||||||||||
| Balance Sheet Data*: | (in thousands) | |||||||||||||||||||
| Cash, cash equivalents and investments | $ | 184,943 | $ | 159,014 | $ | 157,256 | $ | 124,761 | $ | 138,458 | ||||||||||
| Working capital | 218,029 | 191,654 | 193,254 | 161,641 | 159,155 | |||||||||||||||
| Total assets | 330,710 | 278,993 | 282,617 | 240,246 | 235,748 | |||||||||||||||
| Long-term liabilities | 26,055 | 4,092 | 6,054 | 8,674 | 7,622 | |||||||||||||||
| Retained earnings | 245,426 | 218,233 | 199,511 | 168,209 | 135,662 | |||||||||||||||
| Stockholders' equity | 288,378 | 263,612 | 263,491 | 222,773 | 210,848 | |||||||||||||||
* Effective January 1, 2018 we adopted the guidance in the FASB’s Accounting Standards Codification (“ASC”) Revenue from Contracts with Customers (ASC 606) using the modified retrospective method. Revenues for all periods prior to January 1, 2018 were recognized under ASC 605, Revenue Recognition. Effective January 1, 2019 the we adopted the guidance in the FASB’s ASC Leases (ASC 842) using the modified retrospective method. Lease accounting for all periods prior to January 1, 2019 were recognized under ASC 840, Leases. | ||||||||||||||||||||
The following section contains statements that are not statements of historical fact and are forward-looking statements within the meaning of the federal securities laws. These statements involve known and unknown risks, uncertainties, and other factors that may cause our actual results, performance, or achievement to differ materially from anticipated results, performance, or achievement, expressed or implied in such forward-looking statements. These statements reflect our current views with respect to future events, are based on assumptions, and are subject to risks and uncertainties. We discuss many of these risks and uncertainties at the beginning of this Annual Report on Form 10-K and under the sections captioned “Business” and “Risk Factors.” The following discussion should also be read in conjunction with the consolidated financial statements and the Notes thereto appearing elsewhere in this Annual Report on Form 10-K.
Management Overview
Founded in 1992, Anika Therapeutics, Inc. is a global, integrated joint preservation and regenerative therapies company based in Bedford, Massachusetts. Our mission is to be the global leader in orthopedic joint therapies and sports medicine with innovative technologies that exceed our customers’ expectations. We are committed to delivering solutions to improve the lives of patients across a continuum of care from joint pain management and regenerative therapies to sports medicine and orthopedic joint preservation and restoration. We have nearly thirty years of global expertise commercializing more than twenty products based on our hyaluronic acid, or HA, technology platform, and we are focused on adding innovative and differentiated offerings to our consolidated portfolio. Our proprietary technologies for modifying the HA molecule allow product properties to be tailored specifically to multiple therapeutic uses. Certain of our technology chemically modifies HA to allow for longer residence time in the body. We have two forms of cross-linked HA gel technologies, and a solid form of HA technology – HYAFF which is the platform for our regenerative medicine. These proprietary technologies are protected by an extensive portfolio of owned and licensed patents.
As we look towards the future, our business is uniquely positioned to capture value within the sports and regenerative medicine market. Our success is driven by our focus on our talent and culture, investment in innovative research and development programs to feed our product pipeline, expanding our commercial footprint domestically and internationally, and pursuing strategic inorganic growth opportunities. We intend to continue to accelerate our commercial capabilities as we transform into a customer-centric company dedicated to advancing the joint preservation and restoration continuum of care. We believe that this commitment, along with our financial resources and operating history, have positioned us well to deliver sustained value to our shareholders.
29
In early 2020, we expanded our overall technology platform through our strategic acquisitions of Parcus Medical, LLC, or Parcus Medical, a sports medicine implant and instrumentation solutions provider focused on surgical repair and reconstruction of ligaments and tendons, and Arthrosurface, Incorporated, or Arthrosurface, a joint preservation technology company specializing in less invasive, bone preserving partial and total joint replacement solutions. The Company expects the Parcus Medical and Arthrosurface acquisitions to drive growth by:
· Broadening Anika's product portfolio further into the sports medicine joint preservation and restoration space;
· Adding high-growth revenue streams;
· Expanding our commercial capabilities;
· Diversifying our revenue base; and
· Expanding our product pipeline and research and development expertise.
In addition, we believe that our historical HA and regenerative medicine expertise will be highly complementary to the sports medicine implants and instrumentation expertise of Parcus Medical and the partial and total joint replacement expertise of Arthrosurface. We believe that the combination of these three businesses positions Anika to provide innovative solutions along the orthopedic continuum of care and build significant value for patients, physicians, and key healthcare system stakeholders.
Key Developments
On January 4, 2020, we signed agreements to acquire Parcus Medical and Arthrosurface. The Parcus Medical transaction closed on January 24, 2020. Under the terms of the Parcus Medical agreement, Anika acquired all outstanding membership interests of Parcus Medical in exchange for an upfront payment of approximately $35.0 million in cash from our then-existing balance sheet. In addition, Parcus Medical unitholders will be eligible to receive an additional $60.0 million contingent upon the achievement of certain commercial milestones. The Arthrosurface transaction closed on February 3, 2020. Under the terms of the Arthrosurface agreement, Anika acquired all outstanding shares of Arthrosurface in exchange for an upfront payment of approximately $60.0 million in cash from our then-existing balance sheet. In addition, Arthrosurface shareholders will be eligible to receive an additional $40.0 million contingent upon achievement of certain regulatory and commercial milestones.
On January 29, 2020, we announced that our board of directors had appointed an Office of the President, comprised of three of our executive officers, to provide ongoing leadership and oversight of day-to-day operations following the unexpected death of Joseph Darling, our former President and Chief Executive Officer, earlier on that date. On February 12, 2020, we announced that the board appointed Dr. Cheryl R. Blanchard, one of our directors, to serve as our Interim Chief Executive Officer, in lieu of the continuation of the Office of the President, effective February 10, 2020. The previously appointed Office of the President was dissolved as of that date.
Products
Historically, we have categorized our product offerings into four segments: Orthobiologics, Dermal, Surgical, and Other, which included our ophthalmic and veterinary products. Moving forward, we will divide our product portfolio into three categories: Joint Pain Management Therapy, Orthopedic Joint Preservation and Restoration Care, and Other. The table below demonstrates the categorization of key products based on the products commercialized as of December 31, 2019:
| Prior Product Categorization | ||
Product Family |
Subcategories | Key Products |
| Viscosupplements | ORTHOVISC | |
| MONOVISC | ||
| Orthobiologics | CINGAL | |
| Bone repair | TACTOSET | |
| Dermal | Dermal filler | ELEVESS |
| Surgical | Surgical anti-adhesion | HYALOBARRIER |
| MEROGEL | ||
| Other | Veterinary | HYVISC |
| Ophthalmic | ||
30
The table below demonstrates the recategorization of key products based on the current product portfolio being commercialized, including those from the recent acquisitions of Arthrosurface and Parcus Medical.
| New Product Categorization | ||
| Product Family | Subcategories | Key Products |
| Human Viscosupplements | ORTHOVISC | |
| Joint Pain Management | MONOVISC | |
| Therapy | CINGAL | |
| Veterinary Viscosupplements | HYVISC | |
| Joint implant and instrumentation devices, | * | |
| and partial and total joint replacement solutions | ||
| Orthopedic Joint Preservation | Bone repair therapy | TACTOSET |
| and Restoration Care | Regenerative and orthopedic surgical therapies | HYALOFAST |
| Advanced Wound Care | HYALOMATRIX | |
| HYALOFILL | ||
| Other | ||
| Dermal filler | ||
Surgical anti-adhesion |
HYALOBARRIER | |
| MEROGEL | ||
| Ophthalmic | ANIKAVISC | |
*Through the acquisition of Parcus Medical, we added a line of implant and instrumentation products used by surgeons to repair and reconstruct damaged ligaments and tendons due to sports injuries, trauma and disease. These solutions include screws, sutures, anchors, and other surgical systems that facilitate surgical procedures on the shoulder, knee, hip, distal extremities, and tissue. Through the acquisition of Arthrosurface, we added a portfolio of partial and total joint surface and preservation solutions including a catalogue of over 150 different surface implant curvatures for the knee, shoulder, hip, ankle, wrist and toe that are designed to treat upper and lower extremity orthopedic conditions caused by trauma, injury and arthritic disease. Moving forward, these products will be included in the Orthopedic Joint Preservation and Restoration Care category.
The following sections provide more information about our products:
Joint Pain Management Therapies
Our Joint Pain Management Therapies product family consists of injectable viscosupplement products that provide pain relief from osteoarthritis conditions. These products include MONOVISC, ORTHOVISC, CINGAL, and HYVISC, HA-based intraarticular injectable products indicated for the treatment of osteoarthritis pain. Our Joint Pain Management Therapy products are administered to patients in an office setting. We distribute the products in this category using a distributor model, as more fully described in the section titled “Sales Channel.”
In the United States, MONOVISC and ORTHOVISC are marketed by DePuy Synthes Mitek Sports Medicine, a division of DePuy Orthopaedics, Inc., or Mitek, under the terms of a pair of licensing, distribution, supply, and marketing agreements, or the Mitek MONOVISC Agreement and Mitek ORTHOVISC Agreement. In the United States, MONOVISC and ORTHOVISC have maintained the combined overall viscosupplement market leadership position since the first quarter of 2018 on a revenue generation basis. Internationally, we market our Joint Pain Management Therapy products using a growing network of commercial distributors in Canada, Europe, the Middle East, Latin America, and Asia.
31
HYVISC is a high molecular weight injectable HA product for the treatment of joint dysfunction in horses due to non-infectious synovitis associated with equine osteoarthritis. HYVISC is distributed by Boehringer Ingelheim Vetmedica, Inc., Boehringer, in the United States.
Orthopedic Joint Preservation and Restoration Care
Our Orthopedic Joint Preservation and Restoration Care family consists of the following key products:
| · | Several orthopedic regenerative medicine products based on our proprietary HYAFF technology, which is a solid form of HA. They include HYALOFAST, a biodegradable support for human bone marrow mesenchymal stem cells used for cartilage regeneration and as an adjunct for microfracture surgery. These products are currently available in Europe, South America, Asia, and certain other international markets. |
| · | TACTOSET, an HA-enhanced bone repair therapy designed to treat insufficiency fractures. TACTOSET is available in the United States, and we expect to leverage the commercial infrastructure of our recent acquisitions to increase market access to sell TACTOSET. |
| · | Arthrosurface’s catalogue of over 150 partial and total joint surface implants and preservation solutions for the knee, shoulder, hip, ankle, wrist and toe that are designed to treat upper and lower extremity orthopedic conditions caused by trauma, injury and arthritic disease. These products are designed to be less invasive and more bone preserving than conventional joint replacements. These products are available in the United States and over 25 international markets. |
| · | Parcus Medical’s line of surgical implant and instrumentation solutions that are used by surgeons to repair and reconstruct damaged ligaments and tendons due to sports injuries, trauma and disease. These solutions include screws, sutures, anchors, and other surgical systems that facilitate surgical procedures on the shoulder, knee, hip, distal extremities, and tissue. They are typically utilized by surgeons in ambulatory surgical center, or ASC, and hospital environments. These products are commercialized in the United States and over 60 international markets. |
Other
Our Other product family consists of legacy HA-based products that do not fit into one of our other primary product categories. These products include:
| · | Advanced wound care products based on our HYAFF technology are used for the treatment of skin wounds, ranging from burns to diabetic ulcers. The products cover a variety of wound treatment solutions, including debridement agents, advanced therapies to aid healing, and scaffolds used as skin substitutes. Leading products include HYALOMATRIX and HYALOFILL, which are used for the treatment of complex wounds such as burns and ulcers. |
| · | Products used in connection with the treatment of ENT (ears, nose and throat) disorders. The lead product is MEROGEL, a HYAFF-based woven fleece nasal packing. We have partnered with Medtronic XoMed, Inc., Medtronic, for worldwide distribution of these ENT products. |
32
| · | Ophthalmic products, including injectable, high molecular weight HA products used as viscoelastic agents in ophthalmic surgical procedures such as cataract extraction and intraocular lens implantation. |
Sales Channels
Since our inception in 1992, we historically utilized a commercial partnership model for the distribution of our products to end-users. Our strong, worldwide network of distributors has historically provided, and continues to provide, a solid foundation for our revenue growth and territorial expansion. In 2019, we implemented a hybrid commercial approach that balances a small direct model with a network of distributor partners in the U.S. market, and we utilized this hybrid approach for the launch of TACTOSET. The acquisitions of Arthrosurface and Parcus Medical each added to our commercial infrastructure, especially in the United States. Arthrosurface has approximately 35 sales representatives and 100 distributors in the U.S., while Parcus Medical employs a similar, though more mature, model as Anika and has over 50 U.S. distributors in place.
For products in our Orthopedic Joint Preservation and Restoration Care family, including those currently in research and development or those not yet developed, we intend to leverage the expanded hybrid-direct sales infrastructure of the consolidated entity. This framework pairs an internal direct sales team with external sales agent partners to maximize territorial coverage and sales generation. Generally, products within this family are sold into surgical environments, such as hospitals or ambulatory surgery centers, and we believe that we have a strong infrastructure now in place to service these customers. We intend to cross-train the sales staffs to create a consolidated sales structure selling all of the products within our portfolio. We also intend to assess each selling territory to maximize our coverage and reach as many customers and patients as possible.
For longer-term future products in the U.S. market within our Joint Pain Management Therapies or Other families, we intend to evaluate our commercial model and possible alternatives or augmentations in each instance on a case-by-case basis, based on market dynamics and other factors. These models could include direct sales, distribution partnerships, or a hybrid of those forms. For current products in the U.S. market, we intend to retain our current distribution relationships, including with Mitek, as they continue to provide meaningful revenue and growth opportunities.
Internationally, we expect to maintain our current distribution model for the foreseeable future. Notwithstanding that general expectation, we will evaluate modifications or possible alternatives to that model on a case-by-case basis based upon market dynamics and resource allocation. We also intend to evaluate and synergize our international distributor base to ensure that we maximize our partnerships and grow revenue from our entire product portfolio.
Manufacturing
We manufacture the majority of our products ourselves at our facilities in Bedford, Massachusetts, where we make the totality of the products associated with the historic Anika business, and, following our acquisition of Parcus Medical, in Sarasota, Florida, where we make the vast majority of the historic Parcus Medical finished products. For the manufacture of the partial and total joint surface implants and preservation products produced Arthrosurface, we engage a single third-party organization as a contract manufacturer. The raw materials necessary to manufacture our products are generally available from multiple sources. However, we rely on a small number of suppliers for certain key raw materials and a small number of suppliers for certain other materials required for the manufacturing and delivery of these products.
Research and Development
Our research and development efforts primarily consist of the development of new medical applications for our technology platform, the development of intellectual property with respect to our technology platform, the management of clinical trials for certain product candidates, the preparation and processing of applications for regulatory approvals, and process development and scale-up manufacturing activities for new and existing products. Our development is focused on orthopedic and regenerative medicine, including products for tissue protection, repair, and regeneration. For the years ended December 31, 2019, 2018, and 2017, research and development expenses were $16.7 million, $18.2 million, and $18.8 million respectively. The decrease in 2019 was mainly due to timing and decision-making regarding our clinical activities. We anticipate that we will continue to commit significant resources to, and increase our aggregate spending on, research and development efforts including new product development, preclinical activities and clinical trials in the future.
33
Current research and development activities include clinical trials for CINGAL, a joint pain management therapy composed of our proprietary cross-linked HA material combined with an approved steroid, and HYALOFAST, an innovative product for cartilage tissue repair, meant to support eventual regulatory approval for these products in the United States. In pursuing a U.S. regulatory pathway for CINGAL, we have conducted two Phase III clinical trials and two follow-up studies, and the United States Food and Drug Administration, or FDA, has indicated an additional Phase III trial is necessary to support U.S. approval. We are currently working to initiate a pilot study to confirm our trial design, increase our probability of success in a Phase III trial and generate data that ultimately will be needed to support FDA approval. We remain on track to commence the CINGAL pilot study in the first half of 2020. We are also conducting a Phase III trial to support the U.S. regulatory approval of HYALOFAST. We expect to complete patient enrollment in the HYALOFAST study by the end of 2020.
In addition, we are working to expand our regenerative medicine pipeline with a new product candidate in the form of an implant for rotator cuff repair utilizing our proprietary solid HA technology, which could be employed to repair partial and full-thickness rotator cuff tears. We finalized an initial product prototype, and we are currently performing preclinical testing on the product and developing the surgical instrumentation for the potential product.
Summary of Critical Accounting Policies; Significant Judgments and Estimates
Our discussion and analysis of our financial condition and results of operations are based upon our consolidated financial statements included elsewhere in this Annual Report on Form 10-K, which consolidated financial statements have been prepared in accordance with accounting principles generally accepted in the United States. The preparation of these consolidated financial statements requires us to make estimates and judgments that affect the reported amounts of assets, liabilities, revenues and expenses, and the related disclosure of contingent assets and liabilities. We monitor our estimates on an ongoing basis for changes in facts and circumstances, and material changes in these estimates could occur in the future. Changes in estimates are recorded in the period in which they become known. We base our estimates on historical experience and other assumptions that we believe to be reasonable under the circumstances. Actual results may differ from our estimates if past experience or other assumptions do not turn out to be substantially accurate.
We have identified the policies below as critical to our business operations and the understanding of our results of operations. The impact and any associated risks related to these policies on our business operations are discussed throughout this section captioned “Management’s Discussion and Analysis of Financial Condition and Results of Operations” where such policies affect our reported and expected financial results. For a detailed discussion on the application of these and other accounting policies, see Note 2 to the consolidated financial statements included elsewhere in this Annual Report on Form 10-K.
Revenue Recognition – General
We adopted the guidance in the ASC 606 using the modified retrospective method effective January 1, 2018. The adoption of ASC 606 was applied to all contracts not completed as of the date of adoption. The adoption did not have a material impact on the amount and timing of revenue recognized in the consolidated financial statements. We made no adjustments to our previously reported product and total revenue, as those periods continue to be presented in accordance with our historical accounting practices under Topic 605, Revenue Recognition.
Pursuant to ASC 606, we recognize revenue when a customer obtains control of promised goods or services. The amount of revenue that is recorded reflects the consideration that we expect to receive in exchange for those goods or services. We apply the following five-step model in order to determine this amount: (i) identification of the promised goods or services in the contract; (ii) determination of whether the promised goods or services are performance obligations, including whether they are capable of being distinct or distinct in the context of the contract; (iii) measurement of the transaction price, including the constraint on variable consideration; (iv) allocation of the transaction price to the performance obligations; and (v) recognition of revenue when (or as) we satisfy each performance obligation.
34
We have agreements with Mitek that include the grant of certain licenses, performance of development services, and the supply of product at Mitek’s option. Revenues from the agreements with Mitek represent 71% of total revenues for the year-ended December 31, 2019. We completed the performance obligations related to granted licenses and development services under these agreements prior to 2016. We have no remaining material performance obligations under the Mitek agreements.
We have agreements with other customers that may include the delivery of a license and supply of product. The upfront payments under such agreements upon the delivery of the license have not been material.
Our typical distributor supply agreements represent a promise to deliver product at the customer’s discretion that are considered options. We assess if these options provide a material right to the licensee and if so, they are accounted for as separate performance obligations. The majority of our supply agreements do not provide options that are considered material rights.
Certain of our agreements include sales-based royalties and milestones. As we consider the license to be the predominant item to which the royalties relate for these agreements, sales-based royalties and milestones are only recognized when the later of the underlying sale occurs or the performance obligation to which some or all of the sales-based royalty has been satisfied (or partially satisfied). This is generally in the same period that our licensees complete their product sales in their territory, for which we are contractually entitled to a percentage-based royalty. Revenue from sales-based royalties is included in product revenues.
Product Revenue
We sell our products principally to a number of distributors (i.e., our customers) under legally-enforceable, executed contracts. Our distributors subsequently resell the products to sub-distributors and health care providers, among others. We recognize revenue from product sales when the distributor obtains control of our product, which typically occurs upon shipment to the distributor, in return for agreed-upon, fixed-price consideration. Performance obligations are generally settled quickly after purchase order acceptance; therefore, the value of unsatisfied performance obligations at the end of any reporting period is generally insignificant.
Our payment terms are consistent with prevailing practice in the respective markets in which we do business. Most of our distributors make payments based on fixed-price contract terms, which are not affected by contingent events that could impact the transaction price. Payment terms fall within the one-year guidance for the practical expedient, which allows us to forgo adjustment of the contractual payment amount of consideration for the effects of a significant financing component. Our contracts with customers do not customarily provide a right of return, unless certain product quality standards are not met.
Some of our distributor agreements have volume based discounts with tiered pricing which are generally prospective in nature. These prospective discounts together with any free-of-charge sample units offered are evaluated as potential material rights. If the prospective discounts or free-of-charge sample units are considered material rights, these would be separate performance obligations and a portion of the sales transaction price is allocated to the material right. Revenue allocated to the material right is recognized when the additional goods are transferred to the customer or when the option expires. During 2019, the consideration allocated to material rights was not significant.
We receive payments from our customers based on billing schedules established in each contract. Up-front payments and fees are recorded as deferred revenue upon receipt or when due, and may require deferral of revenue recognition to a future period until we perform our obligations under these arrangements. Amounts are recorded as accounts receivable when our right to consideration is unconditional.
Generally, distributor contracts contain Free on Board (FOB) or Ex-Works (EXW) shipping point terms where the customer pays the shipping company directly for all shipping and handling costs. In those contracts in which we pay for the shipping and handling, the associated costs are generally recorded along with the product sale at the time of shipment in cost of product revenue when control over the products has transferred to the customer. We do not collect sales tax on product sales as it is not applicable. Value-add and other taxes collected by us concurrently with revenue-producing activities are excluded from revenue. Our general product warranty does not extend beyond an assurance that the product or services delivered will be consistent with stated contractual specifications, which does not create a separate performance obligation. We recognize the incremental costs of obtaining contracts as an expense when incurred as the amortization period of the assets that we otherwise would have recognized is one year or less in accordance with the practical expedient in paragraph ASC 340-40-25-4. These costs are included in selling, general & administrative expenses.
35
Included as a component of product revenue is sales-based royalty revenue, which represents the utilization of our intellectual property licensed by our commercial partners. We record royalty revenues based on estimated net sales of licensed products as reported to us by our commercial partners. Differences between actual and estimated royalty revenues have not been material and are typically adjusted in the following quarter when the actual amounts are known. Under our distribution model, we sell to a diversified base of customers and, therefore, believes there is no material concentration of credit risk.
Inventories
Inventories are primarily stated at the lower of standard cost and net realizable value, with approximate cost determined using the first-in, first-out method. Work-in-process and finished goods inventories include materials, labor, and manufacturing overhead. Inventory costs associated with product candidates that have not yet received regulatory approval are capitalized if we believe there is probable future commercial use and future economic benefit.
Our policy is to write-down inventory when conditions exist that suggest inventory may be in excess of anticipated demand or is obsolete based upon assumptions about future demand for our products and market conditions. We regularly evaluate the ability to realize the value of inventory based on a combination of factors including, but not limited to, historical usage rates, forecasted sales or usage, product end of life dates, and estimated current or future market values. Purchasing requirements and alternative usage avenues are explored within these processes to mitigate inventory exposure.
When recorded, inventory write-downs are intended to reduce the carrying value of inventory to its net realizable value. If actual demand for our products deteriorates, or if market conditions are less favorable than those projected, additional inventory write-downs may be required. Other long-term assets include inventory expected to remain on hand beyond one year.
Goodwill and Acquired In-Process Research and Development
Goodwill is the amount by which the purchase price of acquired net assets in a business combination exceeded the fair values of net identifiable assets on the date of acquisition. Acquired In-Process Research and Development (“IPR&D”) represents the fair value assigned to research and development assets that we acquire that have not been completed at the date of acquisition or are pending regulatory approval in certain jurisdictions. The value assigned to the acquired IPR&D is determined by estimating the costs to develop the acquired technology into commercially viable products, estimating the resulting revenue from the projects, and discounting the net cash flows to present value.
36
Goodwill and IPR&D are evaluated for impairment annually, or more frequently if events or changes in circumstances indicate that the asset might be impaired. Factors we consider important, on an overall company basis, that could trigger an impairment review include significant underperformance relative to historical or projected future operating results, significant changes in our use of the acquired assets or the strategy for our overall business, significant negative industry or economic trends, a significant decline in our stock price for a sustained period, or a reduction of our market capitalization relative to net book value.
To conduct impairment tests of goodwill, the fair value of the reporting unit is compared to its carrying value. If the reporting unit’s carrying value exceeds its fair value, we record an impairment loss to the extent that the carrying value of goodwill exceeds its implied fair value. Our annual assessment for impairment of goodwill as of November 30, 2019 indicated that the fair value of our reporting unit exceeded the carrying value of the reporting unit.
To conduct impairment tests of IPR&D, the fair value of the IPR&D project is compared to its carrying value. If the carrying value exceeds its fair value, we record an impairment loss to the extent that the carrying value of the IPR&D project exceeds its fair value. We estimate the fair value for IPR&D projects using discounted cash flow valuation models, which require the use of significant estimates and assumptions, including, but not limited to, estimating the timing of and expected costs to complete the in-process projects, projecting regulatory approvals, estimating future cash flows from product sales resulting from completed projects and in-process projects, and developing appropriate discount rates. Our annual assessment for impairment of IPR&D indicated that the fair value of our other IPR&D assets as of November 30, 2019 exceeded their respective carrying values.
Through December 31, 2019, there have not been any events or changes in circumstances that indicate that the carrying value of goodwill or acquired intangible assets may not be recoverable. We continue to monitor and evaluate the financial performance of our business, including the impact of general economic conditions, to assess the potential for the fair value of the reporting unit to decline below its book value. There can be no assurance that, at the time future impairment tests are completed, a material impairment charge will not be recorded.
Stock-Based Compensation
We measure the compensation cost of award recipients’ services received in exchange for an award of equity instruments based on the grant-date fair value of the underlying award. That cost is recognized over the period during which an employee is required to provide service in exchange for the award. For performance-based options with financial and business milestone achievement targets, we recognize expense using the graded vesting methodology over the service period. For performance restricted stock units with financial and business milestone achievement targets, we recognize expense based on the grant-date price of our shares with corresponding compensation cost recognized over the requisite service period. For all performance-based equity awards, compensation cost is based on the probable outcome of the performance conditions. Changes to the probability assessment and the estimated shares expected to vest will result in adjustments to the related stock-based compensation expense that will be recorded in the period of the change. If the performance targets are not achieved, no compensation cost is recognized, and any previously recognized compensation cost is reversed. See Note 13, Equity Incentive Plan, to the consolidated financial statements included elsewhere in this Annual Report on Form 10-K for a description of the types of stock-based awards granted, the compensation expense related to such awards, and detail of equity-based awards outstanding. See Note 16, Income Taxes, to the consolidated financial statements included elsewhere in this Annual Report on Form 10-K for details related to the tax benefit recognized in the consolidated statement of operations for stock-based compensation.
37
Results of Operations
Year ended December 31, 2019 compared to year ended December 31, 2018
Statement of Operations Detail
| Years Ended December 31, | ||||||||||||||||
| 2019 | 2018 | $ Inc/(Dec) | % Inc/(Dec) | |||||||||||||
| (in thousands, except percentages) | ||||||||||||||||
| Product revenue | $ | 114,512 | $ | 105,531 | $ | 8,981 | 9 | % | ||||||||
| Licensing, milestone and contract revenue | 98 | 24 | 74 | 308 | % | |||||||||||
| Total revenue | 114,610 | 105,555 | 9,055 | 9 | % | |||||||||||
| Operating expenses: | ||||||||||||||||
| Cost of product revenue | 28,747 | 31,280 | (2,533 | ) | (8 | %) | ||||||||||
| Research & development | 16,665 | 18,190 | (1,525 | ) | (8 | %) | ||||||||||
| Selling, general & administrative | 34,950 | 34,336 | 614 | 2 | % | |||||||||||
| Total operating expenses | 80,362 | 83,806 | (3,444 | ) | (4 | %) | ||||||||||
| Income from operations | 34,248 | 21,749 | 12,499 | 57 | % | |||||||||||
| Interest income, net | 1,873 | 1,458 | 415 | 28 | % | |||||||||||
| Income before income taxes | 36,121 | 23,207 | 12,914 | 56 | % | |||||||||||
| Provision for income taxes | 8,928 | 4,485 | 4,443 | 99 | % | |||||||||||
| Net income | $ | 27,193 | $ | 18,722 | $ | 8,471 | 45 | % | ||||||||
| Product gross profit | $ | 85,765 | $ | 74,251 | $ | 11,514 | 16 | % | ||||||||
| Product gross margin | 75 | % | 70 | % | ||||||||||||
Total revenue
Total revenue for the year ended December 31, 2019 increased by $9.1 million, as compared to the prior year, to $114.6 million. This increase was primarily due to increase in global viscosupplement revenue and the recovery from the 2018 voluntary recall of certain production lots of certain of our HYAFF-based products previously-described.
Product revenue
Product revenue for the year ended December 31, 2019 was $114.5 million, an increase of $9.0 million, or 9%, compared to prior year. This increase was primarily due to increase in global viscosupplement revenue and the recovery from the 2018 voluntary recall of certain production lots of certain of our HYAFF-based products previously-described. The following table presents comparative product revenue analysis by product franchise:
| Years Ended December 31, | ||||||||||||||||
| 2019 | 2018 | $ Inc/(Dec) | % Inc/(Dec) | |||||||||||||
| Joint Pain Management Therapy | $ | 103,466 | $ | 96,719 | $ | 6,747 | 7 | % | ||||||||
| Orthopedic Joint Preservation and Restoration Care | 2,070 | 1,127 | 943 | 84 | % | |||||||||||
| Other | 8,976 | 7,685 | 1,291 | 17 | % | |||||||||||
| $ | 114,512 | $ | 105,531 | $ | 8,981 | 9 | % | |||||||||
38
| Comparative Note Regarding Product Revenue | ||||||||||||||||||
| As reflected in the preceding table, we now divide our product portfolio into three categories: Joint Pain Management Therapy, Orthopedic Joint Preservation and Restoration Care, and Other. See “—Management Overview—Products.” | ||||||||||||||||||
| We previously categorized our product offerings into four segments: Orthobiologics, Dermal, Surgical, and Other, which included our ophthalmic and veterinary products. In the following table, we present product revenue for the years ended December 31, 2019 and 2018 based on our prior product categorization. We are presenting this information in this report for comparative purposes, because we believe the information may help investors understand and evaluate the effects of our newly revised product categorization. The information is intended only to assist investors in connection with the change in presentation, and our future periodic reports will not include product revenue on the basis of the prior categorization. | ||||||||||||||||||
| Years Ended December 31, | ||||||||||||||||||
| 2019 | 2018 | $ Inc/(Dec) | % Inc/(Dec) | |||||||||||||||
| Orthobiologics | $ | 101,002 | $ | 93,556 | $ | 7,446 | 8 | % | ||||||||||
| Surgical | 5,183 | 5,514 | (331 | ) | (6 | %) | ||||||||||||
| Dermal | 2,244 | 396 | 1,848 | 467 | % | |||||||||||||
| Other | 6,083 | 6,065 | 18 | 0 | % | |||||||||||||
| $ | 114,512 | $ | 105,531 | $ | 8,981 | 9 | % | |||||||||||
Joint Pain Management Therapy
Our Joint Pain Management Therapy category consists of our injectable viscosupplement products. Overall, revenue from our Joint Pain Management Therapy franchise increased by $6.7 million in 2019 as compared to 2018 is primarily driven by increased revenue from MONOVISC domestically and internationally, as well as increased revenue from CINGAL in international markets. We expect the Joint Pain Management Therapy product revenue in 2020 to increase as compared to 2019, primarily due to domestic MONOVISC and international CINGAL revenue.
Orthopedic Joint Preservation and Restoration Care
Our Orthopedic Joint Preservation and Restoration Care products consist of regenerative products based on our proprietary HYAFF technology which is a solid form of HA; TACTOSET, an HA-enhanced bone repair therapy designed to treat insufficiency fractures; and starting in 2020, a line of surgical implant and instrumentation solutions; and a catalogue of joint surface implants and preservation solutions for shoulder, wrist, hip, ankle, and toe joints. Overall, revenue from our Orthopedic Joint Preservation and Restoration Care franchise increased by $0.9 million in 2019 as compared to 2018 primarily due to recovery from the previously discussed 2018 voluntary product recall and the U.S. commercial launch of TACTOSET, formally launched in the U.S. in December 2019. We expect a significant increase in the Orthopedic Joint Preservation and Restoration Care franchise in 2020, as a result of the acquisitions of Parcus Medical and Arthrosurface along with the increased sales of TACTOSET through our hybrid commercial model.
Other
Our other products include advanced wound care products, based on the HYAFF technology, an aesthetic dermal filler, based on our proprietary chemically modified, cross-linked HA technology, products used in connection with the treatment of ENT disorders, a post-surgical anti-adhesion product, and our ophthalmic and veterinary products. Overall, revenue from our other franchise increased by $1.3 million primarily due to our previously described voluntary recall of certain production lots of our HYAFF-based dermal products. We expect our other franchise to remain flat in 2020 to be in line with 2019.
39
Product gross profit and margin
Product gross profit for the year ended December 31, 2019 was $85.8 million, or 75% of product revenue, as compared with $74.3 million, or 70% of product revenue, for the year ended December 31, 2018. The increase in product gross margin for the year ended December 31, 2019 was primarily driven by more favorable changes in revenue mix, including an increase in domestic royalty revenue from the viscosupplement business and the recovery from the 2018 voluntary product recall previously described.
Research and development
Research and development expenses for the year ended December 31, 2019 decreased by $1.5 million, or 8%, as compared to the prior year, primarily due to a decrease in clinical trial expenses related to the CINGAL phase III clinical trials partially offset by higher pre-clinical product development activities associated with the development of product candidates in our research and development pipeline, including our rotator cuff therapy. Research and development expense as a percentage of total revenue was 15% in 2019 compared to 17% in 2018. Research and development expenses are expected to increase in 2020 as we further develop new products and clinical trial activities, including preparation for the CINGAL pilot study, expanded patient enrollment in the HYALOFAST Phase III study, continued product development activities including the rotator cuff repair therapy, and performance of required post-market clinical follow-ups for our MONOVISC and ORTHOVISC-T products in the European Union related to the European Union Medical Device Regulation.
Selling, general and administrative
Selling, general and administrative expenses for the year ended December 31, 2019 increased by $0.6 million, or 2%, as compared to 2018. The increase was primarily due to costs related to the acquisitions of Parcus Medical and Arthrosurface, which totaled $2.9 million in 2019, the U.S. hybrid commercial model, and the launch of TACTOSET, as well as increased personnel-related costs and external professional fees. We expect selling, general and administrative expenses for 2020 to increase from 2019 as a result of the continued TACTOSET U.S. commercialization and the expanded commercial infrastructure through the acquisitions of Arthrosurface and Parcus Medical.
Income taxes
Provisions for income taxes were $8.9 million and $4.5 million for the years ended December 31, 2019 and 2018, respectively. The increase in the effective tax rate in 2019 of 5.4%, as compared to 2018, is primarily due to a windfall tax benefit in 2018 related to exercises of employee equity awards resulting in an income tax benefit of $1.5 million compared to an insignificant amount in 2019.
40
As of December 31, 2019, we had gross net operating loss (“NOL”) carry-forwards for income tax purposes in Italy of $7.5 million with no expiration date. In connection with the preparation of the financial statements, we performed an analysis to ascertain if it was more likely than not that we would be able to utilize, in future periods, the net deferred tax assets associated with our NOL carry-forward. We have concluded that the positive evidence outweighs the negative evidence and, thus, that the deferred tax assets are realizable on a “more likely than not” basis. As such, we have not recorded a valuation allowance at December 31, 2019 or 2018.
In the normal course of business, Anika and its subsidiaries may be periodically examined by various taxing authorities. We file income tax returns in the U.S. federal jurisdiction, in certain U.S. states, and in Italy. The associated tax filings remain subject to examination by applicable tax authorities for a certain length of time following the tax year to which those filings relate. The 2016 through 2018 tax years remain subject to examination by the IRS and other taxing authorities for U.S. federal and state tax purposes. The 2013 through 2018 tax years remain subject to examination by the appropriate governmental authorities for Italy.
Net income
For the year ended December 31, 2019, net income was $27.2 million, or $1.89 per diluted share, compared to $18.7 million, or $1.27 per diluted share, for the same period in the prior year. The increase in net income and diluted earnings per share was primarily a result of increased total revenue, increased product gross profit and a decrease in one-time expenses associated with the retirement of a former CEO and the 2018 voluntary product recall previously-described.
Non-GAAP Financial Measures
Adjusted EBITDA
We present information below with respect to adjusted EBITDA, which we define as our net income excluding interest and other income, net, income tax benefit (expense), depreciation and amortization, stock-based compensation and acquisition related expenses. This financial measure is not based on any standardized methodology prescribed by accounting principles generally accepted in the United States (“GAAP”) and are not necessarily comparable to similarly titled measures presented by other companies.
We have presented adjusted EBITDA because it is a key measure used by our management and Board of Directors to understand and evaluate our operating performance and to develop operational goals for managing our business. We believe this financial measure helps identify underlying trends in our business that could otherwise be masked by the effect of the expenses that we exclude. In particular, we believe that the exclusion of the expenses eliminated in calculating adjusted EBITDA can provide a useful measure for period-to-period comparisons of our core operating performance. Accordingly, we believe that adjusted EBITDA provides useful information to investors and others in understanding and evaluating our operating results, enhancing the overall understanding of our past performance and future prospects, and allowing for greater transparency with respect to key financial metrics used by our management in its financial and operational decision-making.
41
Adjusted EBITDA is not prepared in accordance with GAAP, and should not be considered in isolation of, or as an alternative to, measures prepared in accordance with GAAP. There are a number of limitations related to the use of adjusted EBITDA rather than net income (loss), which is the nearest GAAP equivalent. Some of these limitations are:
| • | adjusted EBITDA excludes depreciation and amortization and, although these are non-cash expenses, the assets being depreciated or amortized may have to be replaced in the future, the cash requirements for which are not reflected in adjusted EBITDA; | |
| • | we exclude stock-based compensation expense from adjusted EBITDA although (a) it has been, and will continue to be for the foreseeable future, a significant recurring expense for our business and an important part of our compensation strategy and (b) if we did not pay out a portion of our compensation in the form of stock-based compensation, the cash salary expense included in operating expenses would be higher, which would affect our cash position; | |
| • | Adjusted EBITDA does not reflect acquisition related expenses to provide a more useful measure for period-to-period comparisons of our core operating performance; | |
| • | the expenses and other items that we exclude in our calculation of adjusted EBITDA may differ from the expenses and other items, if any, that other companies may exclude from adjusted EBITDA when they report their operating results; | |
| • | adjusted EBITDA does not reflect changes in, or cash requirements for, working capital needs; | |
| • | adjusted EBITDA does not reflect provision for (benefit from) income taxes or the cash requirements to pay taxes; and | |
| • | adjusted EBITDA does not reflect historical cash expenditures or future requirements for capital expenditures or contractual commitments. |
The following is a reconciliation of net income to adjusted EBITDA for the years ended December 31, 2019 and 2018, respectively:
| Years Ended December 31, | ||||||||
| 2019 | 2018 | |||||||
| Net income | $ | 27,193 | $ | 18,722 | ||||
| Interest and other income, net | (1,873 | ) | (1,458 | ) | ||||
| Provision for income taxes | 8,928 | 4,485 | ||||||
| Depreciation and amortization | 5,991 | 5,910 | ||||||
| Stock-based compensation | 6,087 | 11,046 | ||||||
| Acquisition related expenses | 2,859 | – | ||||||
| Adjusted EBITDA | $ | 49,185 | $ | 38,705 | ||||
Adjusted EBITDA in the year ended December 31, 2019 increased $10.5 million as compared with the comparable period in 2018. The increase in adjusted EBITDA for the periods was primarily due to an increase in total revenue, product gross profit and operating income as a result of a more favorable revenue mix. In addition, the product gross margin for the year ended December 31, 2018 was also adversely impacted by the previously-described voluntary product recall.
42
Adjusted Net Income and Adjusted EPS
We present information below with respect to adjusted net income and adjusted diluted earnings per share (“adjusted EPS”), which we define as our net income excluding acquisition related expenses on a tax effected basis. Acquisition related expenses are those that the Company would not have incurred except as a direct result of acquisition transactions. Acquisition related expenses consist of investment banking, legal, accounting, and other professional and related expenses and the impact of purchase accounting, including inventory step-up, associated with acquisition transactions. In the context of adjusted net income, acquisition related expenses include inventory step up and the amortization of intangible assets recorded as part of purchase accounting for acquisition transactions. The amortized assets contribute to revenue generation, and the amortization of such assets will recur in future periods until such assets are fully amortized. These assets include the estimated fair value of certain identified assets acquired in acquisitions in 2020 and beyond, including in-process research and development, developed technology, customer relationships and acquired tradenames. Adjusted EPS is defined by the Company as GAAP EPS excluding acquisition related costs on a tax-adjusted per share basis. This financial measure is not based on any standardized methodology prescribed by GAAP and is not necessarily comparable to similarly titled measures presented by other companies.
We have presented adjusted net income and adjusted EPS because they are key measures used by our management and board of directors to understand and evaluate our operating performance and to develop operational goals for managing our business. We believe these financial measures help identify underlying trends in our business that could otherwise be masked by the effect of the expenses that we exclude. In particular, we believe that the exclusion of the expenses eliminated in calculating adjusted net income and adjusted EPS can provide useful measures for period-to-period comparisons of our core operating performance. Accordingly, we believe that adjusted net income and adjusted EPS provide useful information to investors and others in understanding and evaluating our operating results, enhancing the overall understanding of our past performance and future prospects, and allowing for greater transparency with respect to key financial metrics used by our management in its financial and operational decision-making.
The following is a reconciliation of adjusted net income to net income for the years ended December 31, 2019 and 2018, respectively:
| For the Twelve Months Ended December 31, | ||||||||
| 2019 | 2018 | |||||||
| Net income | $ | 27,193 | $ | 18,722 | ||||
| Acquisition related expenses, tax effected | 2,256 | - | ||||||
| Adjusted net income | $ | 29,449 | $ | 18,722 | ||||
The following is a reconciliation of adjusted diluted EPS to diluted EPS for the years ended December 31, 2019 and 2018, respectively (in thousands, expect per share data):
| For the Twelve Months Ended December 31, | ||||||||
| 2019 | 2018 | |||||||
| Diluted earnings per share (EPS) | $ | 1.89 | $ | 1.27 | ||||
| Acquisition related expenses per share, tax effected | 0.16 | - | ||||||
| Adjusted diluted EPS | $ | 2.05 | $ | 1.27 | ||||
Adjusted net income and adjusted diluted EPS in the year ended December 31, 2019 increased $10.7 million and $0.78 as compared with the comparable period in 2018. The increase for the period was primarily due to an increase in total revenue, product gross profit and operating income as a result of a more favorable revenue mix. In addition, the product gross margin for the year ended December 31, 2018 was also adversely impacted by the previously-described voluntary product recall.
43
Year ended December 31, 2018 compared to year ended December 31, 2017
Statement of Operations Detail
| Years Ended December 31, | ||||||||||||||||
| 2018 | 2017 | $ Inc/(Dec) | %Inc/(Dec) | |||||||||||||
| (in thousands, except percentages) | ||||||||||||||||
| Product revenue | $ | 105,531 | $ | 107,783 | $ | (2,252 | ) | (2 | %) | |||||||
| Licensing, milestone and contract revenue | 24 | 5,637 | (5,613 | ) | (100 | %) | ||||||||||
| Total revenue | 105,555 | 113,420 | (7,865 | ) | (7 | %) | ||||||||||
| Operating expenses: | ||||||||||||||||
| Cost of product revenue | 31,280 | 27,364 | 3,916 | 14 | % | |||||||||||
| Research & development | 18,190 | 18,787 | (597 | ) | (3 | %) | ||||||||||
| Selling, general & administrative | 34,336 | 21,540 | 12,796 | 59 | % | |||||||||||
| Total operating expenses | 83,806 | 67,691 | 16,115 | 24 | % | |||||||||||
| Income from operations | 21,749 | 45,729 | (23,980 | ) | (52 | %) | ||||||||||
| Interest income, net | 1,458 | 473 | 985 | 208 | % | |||||||||||
| Income before income taxes | 23,207 | 46,202 | (22,995 | ) | (50 | %) | ||||||||||
| Provision for income taxes | 4,485 | 14,386 | (9,901 | ) | (69 | %) | ||||||||||
| Net income | $ | 18,722 | $ | 31,816 | $ | (13,094 | ) | (41 | %) | |||||||
| Product gross profit | $ | 74,251 | $ | 80,419 | $ | (6,168 | ) | (8 | %) | |||||||
| Product gross margin | 70 | % | 75 | % | ||||||||||||
Total revenue
Total revenue for the year ended December 31, 2018 decreased by $7.9 million, as compared to the prior year, to $105.6 million. This decrease was primarily due to the achievement of a one-time $5.0 million milestone in 2017 for reaching a target MONOVISC U.S. end-user sales threshold set forth in the Mitek MONOVISC Agreement and the absence of an equivalent milestone payment in 2018, as well as the impact of pricing declines in the U.S. viscosupplement market and the previously-described voluntary recall of certain production lots of certain of our HYAFF-based products.
Product revenue
Product revenue for the year ended December 31, 2018 was $105.6 million, a decrease of $2.3 million, or 2.0%, compared to prior year. A moderate decrease in our dermal and orthobiologics product revenue was partially offset by a product revenue increase in our surgical and other franchises. The following table presents comparative product revenue analysis by product franchise:
| Years Ended December 31, | ||||||||||||||||
| 2018 | 2017 | $ Inc/(Dec) | % Inc/(Dec) | |||||||||||||
| Orthobiologics | $ | 93,556 | $ | 93,816 | $ | (260 | ) | (0 | %) | |||||||
| Dermal | 396 | 2,755 | (2,359 | ) | (86 | %) | ||||||||||
| Surgical | 5,514 | 5,262 | 252 | 5 | % | |||||||||||
| Other | 6,065 | 5,950 | 115 | 2 | % | |||||||||||
| $ | 105,531 | $ | 107,783 | $ | (2,252 | ) | (2 | %) | ||||||||
Orthobiologics
Our orthobiologics franchise consists of our joint health and orthopedic products. Overall, revenue from our orthobiologics franchises decreased by $0.3 million in 2018 as compared to 2017 primarily as a result of the voluntary recall of certain production lots of our HYAFF-based products and a decline in worldwide ORTHOVISC revenue offset in part by strong growth in domestic MONOVISC and international CINGAL revenue.
44
Dermal
Our dermal franchise consists of advanced wound care products, which are based on our HYAFF technology, and aesthetic dermal fillers. Our advanced wound care products treat complex skin wounds ranging from burns to diabetic ulcers, with HYALOMATRIX and HYALOFILL as the lead products. Dermal revenue had a significant decline in 2018 as compared to 2017 due to the previously-described voluntary recall of certain production lots of our HYAFF-based products. We resolved the matter and resumed shipment of these products in November 2018.
Surgical
Our surgical franchise consists primarily of our anti-adhesion products, HYALOBARRIER and our ENT offerings, of which MEROGEL is the leading product. We are partnered with Medtronic for the worldwide distribution of our ENT products. Revenue from our surgical products increased $0.3 million, or 5%, in 2018 as compared to 2017. The increase of surgical product revenue was primarily due to an increase in sales of our ENT products.
Other
Other product revenue was derived from sales of our ophthalmic and veterinary products. Other product revenue increased modestly in 2018 as compared to 2017 primarily as a result of increased sales of ophthalmic products.
Licensing, milestone and contract revenue
Licensing, milestone and contract revenue for the year ended December 31, 2018 was insignificant, compared to $5.6 million for 2017. This decrease was primarily due to the achievement of a one-time $5.0 million milestone in 2017 for reaching a target MONOVISC U.S. end-user sales threshold set forth in the Mitek MONOVISC Agreement and the absence of an equivalent milestone payment in 2018.
Product gross profit and margin
Product gross profit for the year ended December 31, 2018 was $74.3 million, or 70% of product revenue, as compared with $80.4 million, or 75% of product revenue, for the year ended December 31, 2017. The decrease in product gross margin for the twelve-month period ended December 31, 2018 was primarily caused by an increase in inventory reserves related to certain raw materials, inventory write-offs and charges associated with the previously described voluntary-recall of certain production lots of our HYAFF-based products, higher production costs, and revenue mix and pricing dynamics.
Research and development
Research and development expenses for the year ended December 31, 2018 decreased by $0.6 million, or 3%, as compared to the prior year, mainly due to a decrease in expenses for our HYALOFAST and CINGAL phase III clinical trials, partially offset by increases in our product development activities, including those related to the development of a product for rotator cuff therapy and pre-commercial development of TACTOSET. Research and development expense as a percentage of total revenue was 17% in 2018 and 2017.
Selling, general and administrative
Selling, general and administrative expenses for the year ended December 31, 2018 increased by $12.8 million, or 59%, as compared to 2017. The increase was primarily due to non-cash stock-based compensation expense related to the retirement of our former Chief Executive Officer, Charles H. Sherwood, Ph.D., non-recurring CINGAL U.S. pre-launch market research activities, and increased personnel and external professional fees.
45
Income taxes
Provisions for income taxes were $4.5 million and $14.4 million for the years ended December 31, 2018 and 2017, respectively. The decrease in the effective tax rate in 2018 of 11.8%, as compared to 2017, is primarily due to the reduction of the corporate tax rate as a result of the Tax Cuts and Jobs Act of 2017 (“Tax Act”) tax reform legislation. This legislation makes significant changes to the U.S. tax law, including a reduction in the corporate tax rate from 35% to 21% starting in 2018. In addition, the Company realized a windfall tax benefit in 2018 related to exercises of employee equity awards resulting in a discrete period income tax benefit of $1.5 million compared to $0.4 million in 2017.
As of December 31, 2018, we had gross net operating losses (“NOL”) for income tax purposes in Italy of $5.8 million with no expiration date. In connection with the preparation of the financial statements, we performed an analysis to ascertain if it was more likely than not that we would be able to utilize, in future periods, the net deferred tax assets associated with our NOL carry-forward. We have concluded that the positive evidence outweighs the negative evidence and, thus, that the deferred tax assets are realizable on a “more likely than not” basis. As such, we have not recorded a valuation allowance at December 31, 2018 or 2017.
Net income
For the year ended December 31, 2018, net income was $18.7 million, or $1.27 per diluted share, compared to $31.8 million, or $2.11 per diluted share, for the same period in the prior year. The decrease in net income and diluted earnings per share was primarily a result of decreased total revenue, decreased product gross margin, the impact of the previously-described voluntary recall of certain production lots of certain of our HYAFF-based products, and one-time expenses associated with the retirement of a former CEO, Charles H. Sherwood, Ph.D., and the 2018 voluntary product recall previously-described. The decreased revenue and increased expenses are offset by a decreased effective federal income tax rate as a result of the 2017 Income Tax Reform Legislation.
Concentration of Risk
We have historically derived the majority of our revenues from a small number of customers, most of whom resell our products to end-users and most of whom are significantly larger companies than us. For the year ended December 31, 2019, five customers accounted for 82% of product revenue, with Mitek alone accounting for 71% of product revenue. We expect to continue to be dependent on a small number of large customers, especially Mitek, for the majority of our revenues for the foreseeable future. The failure of these customers to purchase our products in the amounts they historically have or in amounts that we expect would seriously harm our business.
46
In addition, if present and future customers terminate their purchasing arrangements with us, significantly reduce or delay their orders, or seek to renegotiate their agreements on terms less favorable to us, our business, financial condition, and results of operations will be adversely affected. If we accept terms less favorable than the terms of the current agreements, such renegotiations may have a material adverse effect on our business, financial condition, and/or results of operations. Furthermore, in any future negotiations we may be subject to the perceived or actual leverage that these customers may have given their relative size and importance to us. Any termination, change, reduction, or delay in orders could seriously harm our business, financial condition, and results of operations. Accordingly, unless and until we diversify and expand our customer base, our future success will significantly depend upon the timing and size of future purchases by our largest customers and the financial and operational success of these customers. The loss of any one of our major customers or the delay of significant orders from such customers, even if only temporary, could reduce or delay our recognition of revenues, harm our reputation in the industry, and reduce our ability to accurately predict cash flow, and, as a consequence, it could seriously harm our business, financial condition, and results of operations.
See Note 12, Revenue by Product Group, by Significant Customer and by Geographic Location; Geographic Information, to the consolidated financial statements included elsewhere in this Annual Report on Form 10-K for information regarding significant customers.
Liquidity and Capital Resources
We require cash to fund our operating expenses and to make capital expenditures. Historically we have generated positive cash flow from operations, which, together with our available cash, investments, and debt, have met our cash requirements. Cash, cash equivalents, and investments totaled $184.9 million and $159.0 million, and working capital totaled $218.0 million and $191.7 million, at December 31, 2019 and December 31, 2018, respectively. As of December 31, 2019, we have $50.0 million of available credit under our senior revolving credit facility with Bank of America, N.A., and we were in compliance with the terms of said credit agreement. We believe that we have adequate financial resources to support our business for at least the next twelve months.
Cash provided by operating activities was $37.0 million, $34.9 million, and $40.8 million for 2019, 2018, and 2017, respectively. The increase was primarily related to an increase in accrued expenses offset by a decrease in collections of our accounts receivable due to timing of receipts and an increase in payments for income taxes.
Cash provided by (used in) investing activities was $39.7 million, ($50.3) million, and ($12.5) million for 2019, 2018, and 2017, respectively. The change was due to increased maturities in investments and lower capital expenditures as compared to the same period in 2018 and 2017.
Cash provided by (used in) financing activities was ($8.1) million, ($28.9) million, and $0.3 million for 2019, 2018, and 2017, respectively. For the years ended December 31, 2019 and 2018 we executed $30.0 million accelerated share repurchase programs each year. The decrease in cash used in financing activities for the year ended December 31, 2019, was primarily the result of an increase in proceeds from the exercise of employee equity awards as compared to the corresponding period in 2018 and 2017, respectively.
47
Contractual Obligations and Other Commercial Commitments
The table below summarizes our non-cancelable operating leases, purchase commitments, and contractual obligations related to future periods which are not reflected in our consolidated balance sheet at December 31, 2019. Purchase commitments relate primarily to non-cancellable inventory commitments and capital expenditures entered in the normal course of business:
| Payments due by period (in thousands) | ||||||||||||||||||||
| Less than | More than | |||||||||||||||||||
| Total | 1 year | 1 - 3 years | 3 - 5 years | 5 years | ||||||||||||||||
| Operating Leases (1) | $ | 31,293 | $ | 2,025 | $ | 4,005 | $ | 3,889 | $ | 21,374 | ||||||||||
| Purchase Commitments (2) | 8,684 | 3,926 | 2,785 | 1,805 | 168 | |||||||||||||||
| Year Ended December 31, 2019 | $ | 39,977 | $ | 5,951 | $ | 6,790 | $ | 5,694 | $ | 21,542 | ||||||||||
| (1) | Includes a lease we entered into in January 2007, pursuant to which we lease our corporate headquarters facility, which consists of approximately 134,000 square feet of general office, research and development, and manufacturing space located in Bedford, Massachusetts. The lease has an initial term of ten and one-half years, and commenced in May 2007. In February 2017, we finalized the exercise of its first option under the lease to extend the terms from November 1, 2017 through October 31, 2022, including the determination of a new annual base rent of $1.5 million which is included in the disclosure above. No other terms of this lease were altered. We have an option under this lease to extend its lease-term for up to three additional periods subject to the condition that the Company notify the landlord that we are exercising each option at least one year prior to the expiration of the original or then-current term. The next two renewal options each extend the term an additional five years, while the final renewal option extends the term by six years. Includes a lease entered into pursuant to which Anika S.r.l. leases its Italian facility. In October 2015, Anika S.r.l, entered into a build-to-suit lease agreement for a new European headquarters facility consisting of approximately 33,000 square feet of general office, research and development, training, and warehousing space located in Padova, Italy. This lease has an initial term of fifteen years which commenced in February 2017. The lease will automatically renew for up to three additional six-year terms, subject to certain terms and conditions. We have the ability to withdraw from this lease subject to certain financial penalties after six years and with no penalties after the ninth year. As such, lease commitments through the ninth year are included in the table above. The lease provides for an initial yearly rent of approximately $0.3 million. See the section captioned “Item 2—Properties” in this Annual Report on Form 10-K for additional discussion regarding these leases. Also includes leases for vehicles, manufacturing equipment and office equipment. |
| (2) | Includes purchase commitments for materials, clinical trials, and other day to day business requirements. |
Accounting for Off-Balance Sheet Arrangements
We do not use special purpose entities or other off-balance sheet financing techniques, except for operating leases as disclosed in the contractual obligations table above, that we believe have or are reasonably likely to have a current or future material effect on our financial condition, changes in financial condition, revenues or expenses, results of operations, liquidity, or capital resources.
Recent Accounting Pronouncements
A discussion of recent accounting pronouncements is included in Note 2 to the consolidated financial statements in this Annual Report on Form 10-K.
48
ITEM 7A. QUANTITATIVE AND QUALITATIVE DISCLOSURES ABOUT MARKET RISK
Primary Market Risk Exposures
We manage our investment portfolio in accordance with our investment policy. The primary objectives of our investment policy are to preserve principal, maintain a high degree of liquidity to meet operating and other needs, and obtain competitive returns subject to prevailing market conditions without significantly increasing risk. To achieve this objective, we maintain our portfolio of cash equivalents and investments in a variety of high quality securities, including money market funds and U.S. treasury bills. The investments are classified as available-for-sale and consequently are recorded at fair value with unrealized gains or losses reported as a separate component of accumulated other comprehensive income (loss). Our portfolio of cash equivalents and investments is subject to interest rate fluctuations, changes in credit quality of the issuer, and other factors.
Foreign Exchange Risk
Our primary market risk exposures are in the area of currency exchange rate risk. A significant portion of Anika S.r.l.’s revenue and operating expenses are denominated in Euros. We are utilizing clinical vendors which are located in various countries outside of the United States and invoice us in their local currency. We do not engage in foreign currency hedging arrangements for our accounts payable, and, consequently, foreign currency fluctuations may adversely affect our earnings. In addition, we have one major supplier contract denominated in a foreign currency. Gains and losses arising from transactions denominated in foreign currencies are primarily related to intercompany accounts that have been determined to be temporary in nature and cash, accounts payable, and accounts receivable denominated in non-functional currencies. Unfavorable fluctuations in exchange rates would have a negative impact on our financial statements. The impact of currency exchange rate fluctuations for the contract on our financial statements were insignificant in 2019. In the future, we may undertake to manage foreign currency risk through additional hedging methods. We recognize foreign currency gains or losses arising from our operations in the period incurred.
49
ITEM 8. FINANCIAL STATEMENTS AND SUPPLEMENTARY DATA
ANIKA THERAPEUTICS, INC. AND SUBSIDIARIES
INDEX TO CONSOLIDATED FINANCIAL STATEMENTS
50
REPORT OF INDEPENDENT REGISTERED PUBLIC ACCOUNTING FIRM
To the Board of Directors and Stockholders of Anika Therapeutics, Inc.
Opinion on the Financial Statements
We have audited the accompanying consolidated balance sheets of Anika Therapeutics, Inc. and subsidiaries (the "Company") as of December 31, 2019 and 2018, the related consolidated statements of operations and comprehensive income, cash flows, and stockholders’ equity for each of the three years in the period ended December 31, 2019, and the related notes (collectively referred to as the “financial statements”). In our opinion, the financial statements present fairly, in all material respects, the financial position of the Company as of December 31, 2019 and 2018, and the results of its operations and its cash flows for each of the three years in the period ended December 31, 2019, in conformity with the accounting principles generally accepted in the United States of America (GAAP).
We have also audited, in accordance with the standards of the Public Company Accounting Oversight Board (United States) (PCAOB), the Company's internal control over financial reporting as of December 31, 2019, based on criteria established in Internal Control — Integrated Framework (2013) issued by the Committee of Sponsoring Organizations of the Treadway Commission and our report dated March 5, 2020, expressed an unqualified opinion on the Company's internal control over financial reporting.
Change in Accounting Principle
As discussed in Note 2 to the financial statements, the Company has changed its method of accounting for leases in fiscal year 2019 due to the adoption of Accounting Standards Update No. 2016-02, Leases (ASC 842), using the modified retrospective approach.
Basis for Opinion
These financial statements are the responsibility of the Company's management. Our responsibility is to express an opinion on the Company's financial statements based on our audits. We are a public accounting firm registered with the PCAOB and are required to be independent with respect to the Company in accordance with the U.S. federal securities laws and the applicable rules and regulations of the Securities and Exchange Commission and the PCAOB.
We conducted our audits in accordance with the standards of the PCAOB. Those standards require that we plan and perform the audit to obtain reasonable assurance about whether the financial statements are free of material misstatement, whether due to error or fraud. Our audits included performing procedures to assess the risks of material misstatement of the financial statements, whether due to error or fraud, and performing procedures that respond to those risks. Such procedures included examining, on a test basis, evidence regarding the amounts and disclosures in the financial statements. Our audits also included evaluating the accounting principles used and significant estimates made by management, as well as evaluating the overall presentation of the financial statements. We believe that our audits provide a reasonable basis for our opinion.
/s/ Deloitte & Touche LLP
Boston, Massachusetts
March 5, 2020
We have served as the Company's auditor since 2017.
51
Anika Therapeutics, Inc. and Subsidiaries
(in thousands, except per share data)
| December 31, | ||||||||
| ASSETS | 2019 | 2018 | ||||||
| Current assets: | ||||||||
| Cash and cash equivalents | $ | 157,463 | $ | 89,042 | ||||
| Investments | 27,480 | 69,972 | ||||||
| Accounts receivable, net of reserves of $962 and $1,525 at December 31, 2019 and December 31, 2018, respectively | 23,079 | 20,775 | ||||||
| Inventories, net | 21,995 | 21,300 | ||||||
| Prepaid expenses and other current assets | 4,289 | 1,854 | ||||||
| Total current assets | 234,306 | 202,943 | ||||||
| Property and equipment, net | 50,783 | 54,111 | ||||||
| Right-of-use assets | 22,864 | – | ||||||
| Other long-term assets | 7,478 | 4,897 | ||||||
| Intangible assets, net | 7,585 | 9,191 | ||||||
| Goodwill | 7,694 | 7,851 | ||||||
| Total assets | $ | 330,710 | $ | 278,993 | ||||
| LIABILITIES AND STOCKHOLDERS’ EQUITY | ||||||||
| Current liabilities: | ||||||||
| Accounts payable | $ | 3,832 | $ | 3,143 | ||||
| Accrued expenses and other current liabilities | 12,445 | 8,146 | ||||||
| Total current liabilities | 16,277 | 11,289 | ||||||
| Other long-term liabilities | 357 | 550 | ||||||
| Deferred tax liability | 4,331 | 3,542 | ||||||
| Lease liabilities | 21,367 | – | ||||||
| Commitments and contingencies (Note 11) | ||||||||
| Stockholders’ equity: | ||||||||
| Preferred stock, $0.01 par value; 1,250 shares authorized, no shares issued and outstanding at December 31, 2019 and December 31, 2018, respectively | – | – | ||||||
| Common stock, $.01 par value; 90,000 shares authorized, 14,308 and 14,210 shares issued and outstanding at December 31, 2019 and December 31, 2018, respectively | 143 | 142 | ||||||
| Additional paid-in-capital | 48,707 | 50,763 | ||||||
| Accumulated other comprehensive loss | (5,898 | ) | (5,526 | ) | ||||
| Retained earnings | 245,426 | 218,233 | ||||||
| Total stockholders’ equity | 288,378 | 263,612 | ||||||
| Total liabilities and stockholders’ equity | $ | 330,710 | $ | 278,993 | ||||
The accompanying notes are an integral part of these consolidated financial statements.
52
Anika Therapeutics, Inc. and Subsidiaries
Consolidated Statements of Operations and Comprehensive Income
(in thousands, except per share data)
| For the Years Ended December 31, | ||||||||||||
| 2019 | 2018 | 2017 | ||||||||||
| Product Revenue | $ | 114,512 | $ | 105,531 | $ | 107,783 | ||||||
| Licensing, milestone and contract revenue | 98 | 24 | 5,637 | |||||||||
| Total revenue | 114,610 | 105,555 | 113,420 | |||||||||
| Operating expenses: | ||||||||||||
| Cost of product revenue | 28,747 | 31,280 | 27,364 | |||||||||
| Research & development | 16,665 | 18,190 | 18,787 | |||||||||
| Selling, general & administrative | 34,950 | 34,336 | 21,540 | |||||||||
| Total operating expenses | 80,362 | 83,806 | 67,691 | |||||||||
| Income from operations | 34,248 | 21,749 | 45,729 | |||||||||
| Interest and other income, net | 1,873 | 1,458 | 473 | |||||||||
| Income before income taxes | 36,121 | 23,207 | 46,202 | |||||||||
| Provision for income taxes | 8,928 | 4,485 | 14,386 | |||||||||
| Net income | $ | 27,193 | $ | 18,722 | $ | 31,816 | ||||||
| Basic net income per share: | ||||||||||||
| Net income | $ | 1.93 | $ | 1.30 | $ | 2.18 | ||||||
| Basic weighted average common shares outstanding | 14,121 | 14,442 | 14,575 | |||||||||
| Diluted net income per share: | ||||||||||||
| Net income | $ | 1.89 | $ | 1.27 | $ | 2.11 | ||||||
| Diluted weighted average common shares outstanding | 14,374 | 14,689 | 15,068 | |||||||||
| Net income | $ | 27,193 | $ | 18,722 | $ | 31,816 | ||||||
| Foreign currency translation adjustment | (372 | ) | (742 | ) | 2,533 | |||||||
| Comprehensive income | $ | 26,821 | $ | 17,980 | $ | 34,349 | ||||||
The accompanying notes are an integral part of these consolidated financial statements.
53
Anika Therapeutics, Inc. and Subsidiaries
Consolidated Statements of Stockholders' Equity
(in thousands)
| Accumulated | ||||||||||||||||||||||||
| Common Stock | Other | Total | ||||||||||||||||||||||
| Number of | $.01 Par | Additional Paid | Retained | Comprehensive | Stockholders' | |||||||||||||||||||
| Shares | Value | in Capital | Earnings | Loss | Equity | |||||||||||||||||||
| Balance, December 31, 2016 | 14,627 | $ | 146 | $ | 61,735 | $ | 168,209 | $ | (7,317 | ) | $ | 222,773 | ||||||||||||
| Issuance of common stock for equity awards | 61 | 1 | 313 | – | – | 314 | ||||||||||||||||||
| Stock-based compensation expense | – | – | 5,807 | – | – | 5,807 | ||||||||||||||||||
| Cumulative effect of change in accounting for stock-based compensation | – | – | 762 | (514 | ) | – | 248 | |||||||||||||||||
| Net income | – | – | – | 31,816 | – | 31,816 | ||||||||||||||||||
| Other comprehensive income | – | – | – | – | 2,533 | 2,533 | ||||||||||||||||||
| Balance, December 31, 2017 | 14,688 | $ | 147 | $ | 68,617 | $ | 199,511 | $ | (4,784 | ) | $ | 263,491 | ||||||||||||
| Issuance of common stock for equity awards | 362 | 4 | 2,882 | – | – | 2,886 | ||||||||||||||||||
| Retirement of common stock for minimum tax withholdings | (34 | ) | (1 | ) | (1,790 | ) | – | – | (1,791 | ) | ||||||||||||||
| Stock-based compensation expense | – | – | 11,046 | – | – | 11,046 | ||||||||||||||||||
| Repurchase of common stock | (806 | ) | (8 | ) | (29,992 | ) | – | – | (30,000 | ) | ||||||||||||||
| Net income | – | – | – | 18,722 | – | 18,722 | ||||||||||||||||||
| Other comprehensive income | – | – | – | – | (742 | ) | (742 | ) | ||||||||||||||||
| Balance, December 31, 2018 | 14,210 | $ | 142 | $ | 50,763 | $ | 218,233 | $ | (5,526 | ) | $ | 263,612 | ||||||||||||
| Issuance of common stock for equity awards | 551 | 6 | 22,145 | – | – | 22,151 | ||||||||||||||||||
| Vesting of restricted stock units | 17 | – | – | – | – | – | ||||||||||||||||||
| Forfeiture of restricted stock awards | (13 | ) | – | – | – | – | – | |||||||||||||||||
| Stock-based compensation expense | – | – | 6,087 | – | – | 6,087 | ||||||||||||||||||
| Retirement of common stock for minimum tax withholdings | (5 | ) | – | (293 | ) | – | – | (293 | ) | |||||||||||||||
| Repurchase of common stock | (452 | ) | (5 | ) | (29,995 | ) | – | – | (30,000 | ) | ||||||||||||||
| Net Income | – | – | – | 27,193 | – | 27,193 | ||||||||||||||||||
| Other comprehensive income | – | – | – | – | (372 | ) | (372 | ) | ||||||||||||||||
| Balance, December 31, 2019 | 14,308 | $ | 143 | $ | 48,707 | $ | 245,426 | $ | (5,898 | ) | $ | 288,378 | ||||||||||||
The accompanying notes are an integral part of these consolidated financial statements.
54
Anika Therapeutics, Inc. and Subsidiaries
Consolidated Statements of Cash Flows
(in thousands)
| For the years ended December 31, | ||||||||||||
| 2019 | 2018 | 2017 | ||||||||||
| Cash flows from operating activities: | ||||||||||||
| Net income | $ | 27,193 | $ | 18,722 | $ | 31,816 | ||||||
| Adjustments to reconcile net income to net cash provided by operating activities: | ||||||||||||
| Depreciation and amortization | 5,991 | 5,910 | 4,290 | |||||||||
| Non-cash operating lease cost | 1,179 | - | - | |||||||||
| Loss on disposal of fixed assets | 927 | 152 | 150 | |||||||||
| Loss on impairment of intangible asset | 389 | - | - | |||||||||
| Stock-based compensation expense | 6,087 | 11,046 | 5,807 | |||||||||
| Deferred income taxes | 794 | (1,817 | ) | (1,198 | ) | |||||||
| Provision (recovery) for doubtful accounts | (499 | ) | 57 | 1,609 | ||||||||
| Provision for inventory | 1,612 | 4,419 | 695 | |||||||||
| Amortization of premium and accretion of discount on investments and cash equivalents | (25 | ) | (371 | ) | - | |||||||
| Changes in operating assets and liabilities: | ||||||||||||
| Accounts receivable | (1,839 | ) | 2,914 | 2,674 | ||||||||
| Inventories | (5,585 | ) | (7,577 | ) | (6,521 | ) | ||||||
| Prepaid expenses, other current and long-term assets | (1,641 | ) | 899 | (1,454 | ) | |||||||
| Accounts payable | 767 | (1,671 | ) | 3,890 | ||||||||
| Operating lease liabilities | (1,065 | ) | - | - | ||||||||
| Accrued expenses, other current and long-term liabilities | 3,805 | 1,313 | (1,313 | ) | ||||||||
| Income taxes | (1,085 | ) | 922 | 367 | ||||||||
| Net cash provided by operating activities | 37,005 | 34,918 | 40,812 | |||||||||
| Cash flows from investing activities: | ||||||||||||
| Proceeds from maturities of investments | 146,366 | 46,000 | 41,500 | |||||||||
| Purchases of investments | (103,848 | ) | (91,601 | ) | (45,000 | ) | ||||||
| Purchases of property and equipment | (2,827 | ) | (4,656 | ) | (8,980 | ) | ||||||
| Net cash provided by (used in) investing activities | 39,691 | (50,257 | ) | (12,480 | ) | |||||||
| Cash flows from financing activities: | ||||||||||||
| Repurchases of common stock | (30,000 | ) | (30,000 | ) | - | |||||||
| Cash paid for tax withheld on vested restricted stock awards | (293 | ) | (1,790 | ) | - | |||||||
| Proceeds from exercises of equity awards | 22,151 | 2,886 | 314 | |||||||||
| Net cash provided by (used in) provided by financing activities | (8,142 | ) | (28,904 | ) | 314 | |||||||
| Exchange rate impact on cash | (133 | ) | 29 | 349 | ||||||||
| Increase (Decrease) in cash and cash equivalents | 68,421 | (44,214 | ) | 28,995 | ||||||||
| Cash and cash equivalents at beginning of period | 89,042 | 133,256 | 104,261 | |||||||||
| Cash and cash equivalents at end of period | $ | 157,463 | $ | 89,042 | $ | 133,256 | ||||||
| Supplemental disclosure of cash flow information: | ||||||||||||
| Cash paid for income taxes | $ | 9,257 | $ | 5,560 | $ | 15,088 | ||||||
| Right-of-use assets obtained in exchange for operating lease liabilities as of January 1, 2019 | $ | 24,110 | $ | - | $ | - | ||||||
| Non-cash Investing Activities: | ||||||||||||
| Purchases of property and equipment included in accounts payable and accrued expenses | $ | 137 | $ | 351 | $ | 1,891 | ||||||
The accompanying notes are an integral part of these consolidated financial statements.
55
Anika Therapeutics, Inc. and Subsidiaries
Notes to Consolidated Financial Statements
(amounts in thousands, except share and per share amounts or as otherwise noted)
1. Nature of Business
Anika Therapeutics, Inc. (the “Company”) is a global, integrated joint preservation and regenerative therapies company based in Bedford, Massachusetts. The Company aims to be the global leader in its space with innovative technologies that exceed its customers’ expectations. The Company is committed to delivering therapies to improve the lives of patients across a continuum of care from joint pain management therapies to orthopedic joint preservation and restoration. The Company has nearly thirty years of global expertise commercializing more than twenty products based on its hyaluronic acid, or HA, technology platform, and the Company is focused on adding innovative and differentiated offerings to its portfolio. The Company’s proprietary technologies for modifying the HA molecule allow product properties to be tailored specifically to therapeutic use. The Company’s patented technology chemically modifies HA to allow for longer residence time in the body. The Company has two forms of cross-linked HA gel technologies, and a solid form of HA technology – HYAFF which is the platform for our regenerative medicine. These proprietary technologies are protected by an extensive portfolio of owned and licensed patents.
In early 2020, the Company expanded its overall technology platform through its strategic acquisitions of Parcus Medical, LLC (“Parcus Medical”), a sports medicine implant and instrumentation solutions provider focused on surgical repair and reconstruction of ligaments and tendons and Arthrosurface, Incorporated (“Arthrosurface”) a joint preservation technology company specializing in less invasive joint replacement solutions. The Company expects the Parcus Medical and Arthrosurface acquisitions to drive growth by broadening Anika's product portfolio into joint preservation and restoration, adding high-growth revenue streams, expanding its commercial capabilities, diversifying its revenue base, and expanding its product pipeline and research and development expertise.
The Company is subject to risks common to companies in the biotechnology and medical device industries including, but not limited to, development by the Company or its competitors of new technological innovations, dependence on key personnel, protection of proprietary technology, commercialization of existing and new products, and compliance with U.S. Food and Drug Administration (“FDA”) and foreign regulations and approval requirements, as well as the ability to grow the Company’s business through appropriate commercial strategies.
2. Summary of Significant Accounting Policies
Use of Estimates
The preparation of financial statements in conformity with generally accepted accounting principles in the United States of America requires management to make estimates and assumptions that affect the reported amounts of assets and liabilities and disclosure of contingent assets and liabilities at the date of the financial statements and the reported amounts of revenues and expenses during the reporting period. Actual results could differ from those estimates.
Principles of Consolidation
The accompanying consolidated financial statements include the accounts of Anika Therapeutics, Inc. and its wholly owned subsidiaries, Anika Securities, Inc. (a Massachusetts Securities Corporation), Anika Therapeutics S.r.l. (“Anika S.r.l.”) and Anika Therapeutics Limited. All intercompany balances and transactions have been eliminated in consolidation.
56
Foreign Currency Translation
The functional currency of Anika S.r.l. is the Euro, and the functional currency of Anika Therapeutics Limited is the British Pound Sterling. Assets and liabilities of the foreign subsidiaries are translated using the exchange rate existing on each respective balance sheet date. Revenues and expenses are translated using the average exchange rates for the period. The translation adjustments resulting from this process are included in stockholders’ equity as a component of accumulated other comprehensive income (loss) which resulted in a gain (loss) from foreign currency translation of ($0.4) million, ($0.7) million, and $2.5 million for the years ended December 31, 2019, 2018, and 2017, respectively.
Gains and losses resulting from foreign currency transactions are recognized in the consolidated statements of operations. Recorded balances that are denominated in a currency other than the functional currency are remeasured to the functional currency using the exchange rate at the balance sheet date and gains or losses are recorded in the statements of operations. The Company recognized a gain (loss) from foreign currency transactions of ($0.3) million, ($0.4) million, and $0.7 million during the years ended December 31, 2019, 2018, and 2017, respectively.
Allowance for Doubtful Accounts
The Company maintains an allowance for doubtful accounts for estimated losses resulting from the inability of its customers to make required payments, which is included in selling, general and administrative expenses in the accompanying consolidated statements of operations. In determining the adequacy of the allowance for doubtful accounts, management specifically analyzes individual accounts receivable, historical bad debts, customer concentrations, customer credit-worthiness, current economic conditions, accounts receivable aging trends, and changes in the Company’s customer payment terms. A summary of activity in the allowance for doubtful accounts is as follows:
| December 31, | ||||||||||||
| 2019 | 2018 | 2017 | ||||||||||
| Balance, beginning of the year | $ | 1,525 | $ | 1,914 | $ | 194 | ||||||
| Amounts provided | 6 | 57 | 1,609 | |||||||||
| Amounts recovered | (505 | ) | (360 | ) | – | |||||||
| Amounts written off | (33 | ) | – | (6 | ) | |||||||
| Translation adjustments | (31 | ) | (86 | ) | 117 | |||||||
| Balance, end of the year | $ | 962 | $ | 1,525 | $ | 1,914 | ||||||
Revenue Recognition - General
The Company adopted the guidance the FASB’s Accounting Standards Codification (“ASC”) Revenue from Contracts with Customers (ASC 606) using the modified retrospective method effective January 1, 2018. The adoption of ASC 606 was applied to all contracts not completed as of the date of adoption. The adoption did not have a material impact on the amount and timing of revenue recognized in the consolidated financial statements. The Company made no adjustments to previously reported product and total revenue, as those periods continue to be presented in accordance with historical accounting practices under Topic 605, Revenue Recognition.
Pursuant to ASC 606, the Company recognizes revenue when a customer obtains control of promised goods or services. The amount of revenue that is recorded reflects the consideration that the Company expects to receive in exchange for those goods or services. The Company applies the following five-step model in order to determine this amount: (i) identification of the promised goods or services in the contract; (ii) determination of whether the promised goods or services are performance obligations, including whether they are capable of being distinct or distinct in the context of the contract; (iii) measurement of the transaction price, including the constraint on variable consideration; (iv) allocation of the transaction price to the performance obligations; and (v) recognition of revenue when (or as) the Company satisfies each performance obligation.
The Company has agreements with DePuy Synthes Mitek Sports Medicine, a division of DePuy Orthopaedics, Inc. (“Mitek”) that include the grant of certain licenses, performance of development services, and the supply of product at Mitek’s option. Revenues from the agreements with Mitek represent 71% of total revenues for the year-ended December 31, 2019. The Company completed the performance obligations related to granted licenses and development services under these agreements prior to 2016. The Company has no remaining material performance obligations under the Mitek agreements.
57
The Company has agreements with other customers that may include the delivery of a license and supply of product. The upfront payments under such agreements upon the delivery of the license have not been material.
The Company’s typical supply agreements represent a promise to deliver product at the customer’s discretion that are considered distributor options. The Company assesses if these options provide a material right to the licensee, and if so, they are accounted for as separate performance obligations. Substantially all of the Company’s supply agreements do not provide options that are considered material rights.
Certain of the Company’s agreements include sales-based royalties and milestones. As the Company considered the license to be the predominant item to which the royalties relate for these agreements, sales-based royalties and milestones are only recognized when the later of the underlying sale occurs or the performance obligation to which some or all of the sales-based royalty has been satisfied (or partially satisfied). This is generally in the same period that the Company’s licensees complete their product sales in their territory, for which the Company is contractually entitled to a percentage-based royalty. Revenue from sales-based royalties is included in product revenues.
Product Revenue
In regard to the distribution model, the Company sells its products principally to a number of distributors (i.e., its customers) under legally-enforceable, executed contracts. The Company’s distributors subsequently resell the products to sub-distributors and health care providers, among others. The Company recognizes revenue from product sales when the distributor obtains control of the Company’s product, which typically occurs upon shipment to the distributor, in return for agreed-upon, fixed-price consideration. Performance obligations are generally settled quickly after purchase order acceptance; therefore, the value of unsatisfied performance obligations at the end of any reporting period is generally insignificant.
The Company’s payment terms are consistent with prevailing practice in the respective markets in which the Company does business. Most of the Company’s distributors make payments based on fixed-price contract terms, which are not affected by contingent events that could impact the transaction price. Payment terms fall within the one-year guidance for the practical expedient, which allows the Company to forgo adjustment of the contractual payment amount of consideration for the effects of a significant financing component. The Company’s contracts with customers do not customarily provide a right of return, unless certain product quality standards are not met.
Some of the Company’s distributor agreements have volume based discounts with tiered pricing which are generally prospective in nature. These prospective discounts together with any free-of-charge sample units offered are evaluated as potential material rights. If the prospective discounts or free-of-charge sample units are considered material rights, these would be separate performance obligations and a portion of the sales transaction price is allocated to the material right. Revenue allocated to the material right is recognized when the additional goods are transferred to the customer or when the option expires. During 2019, the consideration allocated to material rights was not significant.
The Company receives payments from its customers based on billing schedules established in each contract. Up-front payments and fees are recorded as deferred revenue upon receipt or when due, and may require deferral of revenue recognition to a future period until the Company performs its obligations under these arrangements. Amounts are recorded as accounts receivable when its right to consideration is unconditional. Deferred revenue is $0 as of December 31, 2019 and 2018.
Generally, distributor contracts contain Free on Board (FOB) or Ex-Works (EXW) shipping point terms where the customer pays the shipping company directly for all shipping and handling costs. In those contracts in which the Company pays for the shipping and handling, the associated costs are generally recorded along with the product sale at the time of shipment in cost of product revenue when control over the products has transferred to the customer. The Company does not collect sales tax on product sales as it is not applicable. Value-add and other taxes collected by the Company concurrently with revenue-producing activities are excluded from revenue. The Company’s general product warranty does not extend beyond an assurance that the product or services delivered will be consistent with stated contractual specifications, which does not create a separate performance obligation. The Company recognizes the incremental costs of obtaining contracts as an expense when incurred as the amortization period of the assets that the Company otherwise would have recognized is one year or less in accordance with the practical expedient in paragraph ASC 340-40-25-4. These costs are included in selling, general & administrative expenses.
58
Included as a component of product revenue is sales-based royalty revenue, which represents the utilization of the Company’s intellectual property licensed by its commercial partners. The Company records royalty revenues based on estimated net sales of licensed products as reported to us by the Company’s commercial partners. Differences between actual and estimated royalty revenues have not been material and are typically adjusted in the following quarter when the actual amounts are known. Under its distribution model, the Company sells to a diversified base of customers and, therefore, believes there is no material concentration of credit risk.
With respect to its U.S. hybrid commercial model which pairs a small, in-house team of regional sales directors with local or regional distributors, the Company completed its implementation in the second half of 2019 and utilized the framework to launch TACTOSET, it’s HA-enhanced bone repair therapy designed to treat insufficiency fractures, at that time.
The Company recognizes revenue from TACTOSET product sales when the customer obtains control or upon utilization of the Company’s product in return for agreed-upon, fixed-price consideration. Revenues were not significant for the period. Performance obligations are settled upon transfer of the Company’s product to the customer or utilization of the Company’s product by the customer. The Company’s payment terms are consistent with prevailing practice in the respective markets in which the Company does business. The Company’s customers make payments based on fixed-price terms, which are not affected by contingent events that could impact the transaction price. Payment terms align with the one-year guidance for the practical expedient, which allows the Company to forgo adjustment of the contractual payment amount of consideration for the effects of a significant financing component. Product returns are only accepted at the discretion of the Company and are not expected to be significant. The Company accrues for sales returns and allowances on TACTOSET based upon research performed and current market conditions. The Company sells to a diversified base of customers and, therefore, believes there is no material concentration of credit risk.
Licensing, Milestone and Contract Revenue
The agreements with Mitek include variable consideration such as contingent development and regulatory milestones. As of the date of adoption of ASC 606, there is one remaining regulatory milestone related to the Mitek agreements and the Company has no performance obligation related to this milestone. In general, variable consideration is included in the transaction price only to the extent a significant reversal in the amount of cumulative revenue recognized is not probable to occur.
Cash and Cash Equivalents
The Company considers only those investments which are highly liquid, readily convertible to cash, and that mature within 90 days from date of purchase to be cash equivalents. The Company’s cash equivalents consist of money market funds.
Investments
All of the Company’s investments are classified as available-for-sale which consist of U.S. treasury bills and are carried at fair value with unrealized gains and losses recorded as a component of accumulated other comprehensive income (loss), net of related income taxes. For securities sold prior to maturity, the cost of securities sold is based on the specific identification method. Realized gains and losses on the sale of investments are recorded in interest and other income, net. Interest is recorded when earned. Investments with original maturities greater than approximately three months and remaining maturities less than one year are classified as short-term investments. Investments with remaining maturities greater than one year are classified as long-term investments. Long-term investments is $0 as of December 31, 2019 and 2018.
59
All of the Company’s investments are subject to a periodic impairment review. The Company recognizes an impairment charge when a decline in the fair value of its investments below the cost basis is judged to be other-than-temporary. Factors considered in determining whether a loss is temporary include the extent and length of time the investment's fair value has been lower than its cost basis, the financial condition and near-term prospects of the investee, extent of the loss related to credit of the issuer, the expected cash flows from the security, the Company’s intent to sell the security, and whether or not the Company will be required to sell the security prior to the expected recovery of the investment's amortized cost basis. During the years ended December 31, 2019 and 2018, the Company did not record any other-than-temporary impairment charges on its available-for-sale securities because it is not more likely than not that the Company will be required to sell these securities before the recovery of their cost basis.
Concentration of Credit Risk and Significant Customers
The Company has no significant off-balance sheet risks related to foreign exchange contracts, option contracts, or other foreign hedging arrangements. The Company’s cash equivalents and investments are held with two major international financial institutions.
The Company, by policy, routinely assesses the financial strength of its customers. As a result, the Company believes that its accounts receivable credit risk exposure is limited.
As of December 31, 2019 and 2018, Mitek represented 70% and 75%, respectively, of the Company’s accounts receivable balance, no other single customer accounted for more than 10% of accounts receivable in either period.
Inventories
Inventories are primarily stated at the lower of standard cost and net realizable value, with approximate cost determined using the first-in, first-out method. Work-in-process and finished goods inventories include materials, labor, and manufacturing overhead. Inventory costs associated with product candidates that have not yet received regulatory approval are capitalized if the Company believes there is probable future commercial use and future economic benefit.
The Company’s policy is to write-down inventory when conditions exist that suggest inventory may be in excess of anticipated demand or is obsolete based upon assumptions about future demand for the Company’s products and market conditions. The Company regularly evaluates the ability to realize the value of inventory based on a combination of factors including, but not limited to, historical usage rates, forecasted sales or usage, product end of life dates, and estimated current or future market values. Purchasing requirements and alternative usage avenues are explored within these processes to mitigate inventory exposure.
When recorded, inventory write-downs are intended to reduce the carrying value of inventory to its net realizable value. If actual demand for the Company’s products deteriorates, or if market conditions are less favorable than those projected, additional inventory write-downs may be required. Other long-term assets include inventory expected to remain on hand beyond one year.
Operating Leases
The Company adopted Leases (ASC 842) as of January 1, 2019 using the modified retrospective method which did not require it to restate prior periods, and did not have an impact on retained earnings. The transition guidance associated with ASC 842 also permits certain practical expedients. The Company has elected the “package of 3” practical expedients permitted under the transition guidance which eliminates the requirements to reassess prior conclusions about lease identification, lease classification, and initial direct costs. The Company also adopted the practical expedient to use hindsight to determine the lease term. The Company adopted an accounting policy which provides that leases with an initial term of 12 months or less and no purchase option the Company is reasonably certain of exercising will not be included within the lease right-of-use assets and lease liabilities on its consolidated balance sheet. The Company elected an accounting policy to combine the non-lease components (which include common area maintenance, taxes and insurance) with the related lease component. The Company elected this practical expedient to all asset classes upon the adoption of ASC 842.
60
At the inception of an arrangement, the Company determines whether the arrangement is or contains a lease based on the circumstances present. Leases with a term greater than one year are recognized on the consolidated balance sheet as right-of-use assets, lease liabilities, and, if applicable, long-term lease liabilities. The Company includes renewal options to extend the lease in the lease term where it is reasonably certain that it will exercise these options. Lease liabilities and the corresponding right-of-use assets are recorded based on the present values of lease payments over the lease terms. The interest rate implicit in lease contracts is typically not readily determinable. As such, the Company utilizes the appropriate incremental borrowing rates, which are the rates that would be incurred to borrow on a collateralized basis, over similar terms, amounts equal to the lease payments in a similar economic environment. Variable payments that do not depend on a rate or index are not included in the lease liability and are recognized as incurred. Lease contracts do not include residual value guarantees nor do they include restrictions or other covenants. Certain adjustments to the right-of-use assets may be required for items such as initial direct costs paid, incentives received or lease prepayments. If significant events, changes in circumstances, or other events indicate that the lease term or other inputs have changed, the Company would reassess lease classification, remeasure the lease liability by using revised inputs as of the reassessment date, and adjust the right-of-use asset.
Property and Equipment
Property and equipment are recorded at cost and depreciated using the straight-line method over their estimated useful lives, which are typically:
| Asset | Estimated useful life (in years) | |||
| Computer equipment and software | 3 | - | 10 | |
| Furniture and fixtures | 5 | - | 7 | |
| Equipment | 5 | - | 20 | |
| Leasehold improvements | Shorter of useful life or term of lease | |||
Maintenance and repairs are charged to expense when incurred; additions and improvements are capitalized. Fully depreciated assets are retained in the accounts until they are no longer used and no further charge for depreciation is made in respect of these assets. When an item is sold, retired or removed from service, the cost and related accumulated depreciation is relieved, and the resulting gain or loss, if any, is recognized in income.
Construction-in-process is stated at cost, which includes the cost of construction and other direct costs attributable to the construction. Construction-in-process is not depreciated until such time as the relevant assets are completed and put into use.
Goodwill and Acquired Intangible Assets
Goodwill is the amount by which the purchase price of acquired net assets in a business combination exceeded the fair values of net identifiable assets on the date of acquisition. Acquired In-Process Research and Development (“IPR&D”) represents the fair value assigned to research and development assets that the Company acquires that have not been completed at the date of acquisition or are pending regulatory approval in certain jurisdictions. The value assigned to the acquired IPR&D is determined by estimating the costs to develop the acquired technology into commercially viable products, estimating the resulting revenue from the projects, and discounting the net cash flows to present value.
Goodwill and IPR&D are evaluated for impairment annually or more frequently if events or changes in circumstances indicate that the asset might be impaired. Factors the Company considers important, on an overall company basis, that could trigger an impairment review include significant underperformance relative to historical or projected future operating results, significant changes in the Company’s use of the acquired assets or the strategy for its overall business, significant negative industry or economic trends, a significant decline in the Company’s stock price for a sustained period, or a reduction of its market capitalization relative to net book value.
61
To conduct impairment tests of goodwill, the fair value of the reporting unit is compared to its carrying value. If the reporting unit’s carrying value exceeds its fair value, the Company records an impairment loss to the extent that the carrying value of goodwill exceeds its implied fair value. The Company’s annual assessment for impairment of goodwill as of November 30, 2019 indicated that the fair value of its reporting unit exceeded the carrying value of the reporting unit.
To conduct impairment tests of IPR&D, the fair value of the IPR&D project is compared to its carrying value. If the carrying value exceeds its fair value, the Company records an impairment loss to the extent that the carrying value of the IPR&D project exceeds its fair value. The Company estimates the fair value for IPR&D using discounted cash flow valuation models, which require the use of significant estimates and assumptions, including but not limited to, estimating the timing of and expected costs to complete the in-process projects, projecting regulatory approvals, estimating future cash flows from product sales resulting from completed projects and in-process projects, and developing appropriate discount rates. The Company’s annual assessment for impairment of IPR&D indicated that the fair value of its other IPR&D assets as of November 30, 2019 and 2018 exceeded the respective carrying values.
Long-Lived Assets
Long-lived assets primarily include property and equipment and intangible assets with finite lives. The Company’s intangible assets are comprised of purchased developed technologies, patents, and trade names. These intangible assets are carried at cost, net of accumulated amortization. Amortization is recorded on a straight-line basis over the intangible assets' useful lives, which range from approximately five to sixteen years. The Company reviews long-lived assets for impairment when events or changes in business circumstances indicate that the carrying amount of the assets may not be fully recoverable or that the useful lives of those assets are no longer appropriate. Each impairment test is based on a comparison of the undiscounted cash flows to the recorded value of the asset. If impairment is indicated, the asset is written down to its estimated fair value based on a discounted cash flow analysis.
Fair Value Measurements
Fair value is defined as the price that would be received from selling an asset, or paid to transfer a liability, in an orderly transaction between market participants at the measurement date. When determining the fair value measurements for assets and liabilities required to be recorded at fair value, the Company considers the principal or most advantageous market in which it would transact and considers assumptions that market participants would use when pricing the asset or liability, such as inherent risk, transfer restrictions, and risk of non-performance. The accounting standard establishes a fair value hierarchy that requires an entity to maximize the use of observable inputs and minimize the use of unobservable inputs when measuring fair value.
A financial instrument’s categorization within the fair value hierarchy is based upon the lowest level of input that is significant to the fair value measurement. Three levels of inputs that may be used to measure fair value are:
| • | Level 1 – Valuation is based upon quoted prices for identical instruments traded in active markets. Level 1 instruments include securities traded on active exchange markets, such as the New York Stock Exchange. |
| • | Level 2 – Valuation is based upon quoted prices for similar instruments in active markets, quoted prices for identical or similar instruments in markets that are not active and model-based valuation techniques for which all significant assumptions are directly observable in the market. |
| • | Level 3 – Valuation is generated from model-based techniques that use significant assumptions not observable in the market. These unobservable assumptions reflect the Company’s own estimates of assumptions market participants would use in pricing the instrument. |
62
The Company’s financial assets have been classified as Level 1. The Company’s financial assets (which include cash equivalents and investments) have been initially valued at the transaction price and subsequently valued, at the end of each reporting period, utilizing third party pricing services.
Research and Development
Research and development costs consist primarily of clinical trials, salaries and related expenses for personnel, and fees paid to outside consultants and outside service providers, including costs associated with licensing, milestone and contract revenue. Research and development costs are expensed as incurred.
Stock-Based Compensation
The Company has stock-based compensation plans under which it grants various types of equity-based awards, including restricted stock units (“RSUs”), performance restricted stock units (“PSUs”), restricted stock awards (“RSAs”), performance options, and stock options. The Company measures the compensation cost of award recipients’ services received in exchange for an award of equity instruments based on the grant-date fair value of the underlying award. That cost is recognized over the period during which an employee is required to provide service in exchange for the award.
For performance-based options with financial and business milestone achievement targets, the Company recognizes expense using the graded vesting methodology over the service period. For PSUs with financial and business milestone achievement targets, the Company recognizes expense based on the grant-date price of the Company’s shares with corresponding compensation cost recognized over the requisite service period. For performance-based equity awards, compensation cost is based on the probable outcome of the performance conditions. Changes to the probability assessment and the estimated shares expected to vest will result in adjustments to the related stock-based compensation expense that will be recorded in the period of the change. If the performance targets are not achieved, no compensation cost is recognized, and any previously recognized compensation cost is reversed.
See Note 13, Equity Incentive Plan, for a description of the types of stock-based awards granted, the compensation expense related to such awards, and detail of equity-based awards outstanding.
Income Taxes
The Company’s income tax expense includes U.S. and international income taxes. Certain items of income and expense are not reported in tax returns and financial statements in the same year. The tax effects of these timing differences are reported as deferred tax assets and liabilities. Deferred tax assets are recognized for the estimated future tax effects of deductible temporary differences, tax operating losses, and tax credit carry-forwards (including investment tax credits). Changes in deferred tax assets and liabilities are recorded in the provision for income taxes. The Company assesses the likelihood that its deferred tax assets will be recovered from future taxable income and, to the extent it believes that it is more likely than not that all or a portion of deferred tax assets will not be realized, the Company establishes a valuation allowance to reduce the deferred tax assets to the appropriate valuation. To the extent the Company establishes a valuation allowance or increases or decreases this allowance in a given period, it includes the related tax expense or tax benefit within the tax provision in the consolidated statement of operations in that period.
Comprehensive Income
Comprehensive income consists of net income and other comprehensive income (loss), which includes foreign currency translation adjustments. For the purposes of comprehensive income disclosures, the Company does not record tax provisions or benefits for the net changes in the foreign currency translation adjustment, as it intends to indefinitely reinvest undistributed earnings of its foreign subsidiary. Accumulated other comprehensive income (loss) is reported as a component of stockholders' equity.
63
Segment Information
Operating segments are components of an enterprise about which separate financial information is available that is evaluated regularly by the chief operating decision maker, or decision-making group, in deciding how to allocate resources and in assessing performance. The Company’s chief operating decision maker is its President and Chief Executive Officer. Based on the criteria established by ASC 280, Segment Reporting, the Company has one operating and reportable segment.
Contingencies
In the normal course of business, the Company is involved from time-to-time in various legal proceedings and other matters such as contractual disputes, which are complex in nature and have outcomes that are difficult to predict. The Company records accruals for loss contingencies to the extent that it concludes that it is probable that a liability has been incurred and the amount of the related loss can be reasonably estimated. The Company considers all relevant factors when making assessments regarding these contingencies. Although the outcomes of any potential legal proceedings are inherently difficult to predict, the Company does not expect the resolution of any potential legal proceedings to have a material adverse effect on its financial position, results of operations, or cash flow.
Recent Accounting Pronouncements
In August 2018, the FASB issued ASU No. 2018-15, Intangibles – Goodwill and Other – Internal-Use Software (Subtopic 350-40), which amends ASU No. 2015-05, Customers Accounting for Fees in a Cloud Computing Agreement, to help entities evaluate the accounting for fees paid by a customer in a cloud computing arrangement (hosting arrangement) by providing guidance for determining when the arrangement includes a software license. The most significant change will align the requirements for capitalizing implementation costs incurred in a hosting arrangement that is a service contract with the requirements for capitalizing implementation costs incurred to develop or obtain internal-use software and hosting arrangements that include an internal-use software license. Accordingly, the amendments in ASU 2018-15 require an entity in a hosting arrangement that is a service contract to follow the guidance in Subtopic 350-40 to determine which implementation costs to capitalize as assets related to the service contract and which costs to expense. ASU 2018-15 is effective for fiscal years and interim periods beginning after December 15, 2019. The adoption of this standard is not expected to have a significant impact on the Company’s consolidated financial statements and related disclosures.
In June 2016, the FASB issued ASU No. 2016-13, Financial Instruments - Credit Losses. The standard, including subsequently issued amendments, requires a financial asset measured at amortized cost basis, such as accounts receivable and certain other financial assets, to be presented at the net amount expected to be collected based on relevant information about past events, including historical experience, current conditions, and reasonable and supportable forecasts that affect the collectability of the reported amount. ASU 2016-13 is effective for fiscal years and interim periods beginning after December 15, 2019, and requires the modified retrospective approach. Early adoption is permitted. Based on the composition of the Company’s trade receivables and other financial assets, current market conditions, and historical credit loss activity, the adoption of this standard will not have a material impact on the Company’s consolidated financial statements and related disclosures.
3. Fair Value Measurements
The Company held U.S. treasury bills of $27.5 million at December 31, 2019. The Company held U.S. Treasury Bills of $70.0 million at December 31, 2018. Unrealized losses and the associated tax impact on the Company’s available-for-sale securities were insignificant as of December 31, 2019 and December 31, 2018, respectively.
The Company’s investments are all classified within Levels 1 of the fair value hierarchy. The Company’s investments classified within Level 1 of the fair value hierarchy are valued based quoted prices in active markets. For cash, current receivables, accounts payable, and interest accrual, the carrying amounts approximate fair value, because of the short maturity of these instruments, and therefore fair value information is not included in the table below.
64
The classification of the Company’s cash equivalents and investments within the fair value hierarchy is as follows:
| Active Markets | Significant Other | Significant | ||||||||||||||||||
| for Identical Assets | Observable Inputs | Unobservable Inputs | ||||||||||||||||||
| December 31, 2019 | (Level 1) | (Level 2) | (Level 3) | Amortized Cost | ||||||||||||||||
| Cash equivalents: | ||||||||||||||||||||
| Money Market Funds | $ | 48,971 | $ | 48,971 | $ | – | $ | – | $ | 48,971 | ||||||||||
| Investments: | ||||||||||||||||||||
| U.S. Treasury Bills | $ | 27,480 | $ | 27,480 | $ | – | $ | – | $ | 27,479 | ||||||||||
| Fair Value Measurements at Reporting Date Using | ||||||||||||||||||||
| Quoted Prices in | ||||||||||||||||||||
| Active Markets | Significant Other | Significant | ||||||||||||||||||
| for Identical Assets | Observable Inputs | Unobservable Inputs | ||||||||||||||||||
| December 31, 2018 | (Level 1) | (Level 2) | (Level 3) | Amortized Cost | ||||||||||||||||
| Cash equivalents: | ||||||||||||||||||||
| Money Market Funds | $ | 4,984 | $ | 4,984 | $ | – | $ | – | $ | 4,984 | ||||||||||
| Investments: | ||||||||||||||||||||
| U.S. Treasury Bills | $ | 69,972 | $ | 69,972 | $ | – | $ | – | $ | 69,972 | ||||||||||
4. Inventories
Inventories consist of the following:
| December 31, | ||||||||
| 2019 | 2018 | |||||||
| Raw materials | $ | 12,058 | $ | 13,688 | ||||
| Work-in-process | 8,330 | 4,626 | ||||||
| Finished goods | 8,777 | 6,819 | ||||||
| Total | $ | 29,165 | $ | 25,133 | ||||
| Inventories | $ | 21,995 | $ | 21,300 | ||||
| Other long-term assets | 7,170 | 3,833 | ||||||
Inventory is stated net of inventory reserves of approximately $3.0 million and $3.5 million, as of December 31, 2019 and 2018, respectively.
As a result of the voluntary recall of certain production lots of the Company’s HYAFF-based products, more fully described in Note 12, the Company recorded an inventory reserve of $0.8 million for non-saleable inventory. In addition, the Company recorded a net inventory reserve of $1.3 million for certain HA raw materials, and it recorded a lower of cost or net realizable value adjustment of $1.2 million for certain HYAFF-based products during the year ended December 31, 2018.
65
5. Property and Equipment
Property and equipment is stated at cost and consists of the following:
| December 31, | ||||||||
| 2019 | 2018 | |||||||
| Equipment and software | $ | 42,733 | $ | 39,646 | ||||
| Furniture and fixtures | 2,204 | 2,014 | ||||||
| Leasehold improvements | 33,797 | 33,801 | ||||||
| Construction in progress | 559 | 2,720 | ||||||
| Subtotal | 79,293 | 78,181 | ||||||
| Less accumulated depreciation | (28,510 | ) | (24,070 | ) | ||||
| Total | $ | 50,783 | $ | 54,111 | ||||
Construction-in-progress at December 31, 2018 primarily represents the costs incurred related to the assets used in the manufacturing of an injectable, HA-based surgical bone repair product launched in September 2019.
Depreciation expense was $5.0 million, $4.9 million, and $3.3 million for the years ended December 31, 2019, 2018, and 2017, respectively.
6. Acquired Intangible Assets, Net
Intangible assets consist of the following:
| December 31, 2019 | December 31, 2018 | |||||||||||||||||||||||||||||||||
| Gross Value | Accumulated Currency Translation Adjustment | Impairment | Accumulated Amortization | Net Book Value | Accumulated Currency Translation Adjustment | Accumulated Amortization | Net Book Value | Useful Life | ||||||||||||||||||||||||||
| Developed technology | $ | 17,100 | $ | (2,934 | ) | $ | (389 | ) | $ | (9,657 | ) | $ | 4,120 | $ | (2,824 | ) | $ | (8,672 | ) | $ | 5,604 | 15 | ||||||||||||
| In-process research & development | 4,406 | (1,234 | ) | – | – | 3,172 | (1,168 | ) | – | 3,238 | Indefinite | |||||||||||||||||||||||
| Distributor relationships | 4,700 | (415 | ) | – | (4,285 | ) | – | (415 | ) | (4,285 | ) | – | 5 | |||||||||||||||||||||
| Patents | 1,000 | (176 | ) | – | (531 | ) | 293 | (169 | ) | (482 | ) | 349 | 16 | |||||||||||||||||||||
| Elevess trade name | 1,000 | – | – | (1,000 | ) | – | – | (1,000 | ) | – | 9 | |||||||||||||||||||||||
| Total | $ | 28,206 | $ | (4,759 | ) | $ | (389 | ) | $ | (15,473 | ) | $ | 7,585 | $ | (4,576 | ) | $ | (14,439 | ) | $ | 9,191 | |||||||||||||
The Company performed an annual assessment of IPR&D intangible assets as of November 30, 2019. Based upon that assessment, for the fiscal year 2019 there were no events or changes in circumstances that would result in a change in the carrying value of IPR&D.
Total amortization expense was $1.0 million for each of the years ended December 31, 2019, 2018, and 2017. Amortization expense on intangible assets is expected to be approximately $0.9 million in 2020, $0.9 million annually through 2023, and approximately $1.0 million in aggregate thereafter.
The Company recorded a $0.4 million of impairments during 2019 including a $0.3 million impairment charge for the HYALOSPINE developed technology asset as the Company made the decision not to renew its CE Mark as the product was not aligned with the Company’s core strategic focus. The impairment charge was recorded in selling, general & administrative expenses on the Company’s consolidated statements of operations.
66
7. Goodwill
The Company completed its annual impairment review as of November 30, 2019 and concluded that no impairment in the carrying value exists as of that date with respect to goodwill. Through December 31, 2019, there have not been any events or changes in circumstances that indicate that the carrying value of goodwill may not be recoverable. Changes in the carrying value of goodwill were as follows:
| December 31, | ||||||||
| 2019 | 2018 | |||||||
| Balance, beginning | $ | 7,851 | $ | 8,218 | ||||
| Effect of foreign currency adjustments | (157 | ) | (367 | ) | ||||
| Balance, ending | $ | 7,694 | $ | 7,851 | ||||
8. Operating Leases
As of December 31, 2019, the Company had two primary leases, its real estate leases in Bedford, Massachusetts and Padova, Italy. The Company leases approximately 134,000 square feet of administrative, research and development, and manufacturing space in Bedford, Massachusetts (the “Bedford lease”), and approximately 33,000 square feet of office, research and development, training, and warehousing space in Padova, Italy (the “Padova lease”). The current term of the Bedford lease extends to 2022 with several lease renewal options into 2038, and the current term of the Padova lease extends to 2032, with a right to terminate at the Company’s option in 2026 without penalty.
The Company identified and assessed significant assumptions in recognizing the right-of-use asset and lease liability on January 1, 2019 as follows:
Incremental borrowing rate. The Company derives its incremental borrowing rate from information available at the lease commencement date in determining the present value of lease payments. The incremental borrowing rate represents a collateralized rate of interest the Company would have to pay to borrow over a similar term an amount equal to the lease payments in a similar economic environment. The Company’s lease agreements do not provide implicit rates. As the Company did not have any external borrowings at the transition date with comparable terms to its lease agreements, the Company estimated its incremental borrowing rate based on its credit quality, line of credit agreement and by comparing interest rates available in the market for similar borrowings, and adjusting this amount based on the impact of collateral over the term of the lease. The weighted average discount rate at December 31, 2019 is 4.1%.
Lease term. The Company applied the hindsight practical expedient and as a result the lease term for the Bedford lease was determined to include all lease renewal options. There were no changes to the lease terms for its other leases. For the Padova lease, the Company considered the termination option when determining the lease term. The weighted average lease term at December 31, 2019 is 16.8 years.
The components of lease expense and other information are as follows:
| For the twelve months ended December 31, 2019 | ||||
| Lease cost | ||||
| Operating lease cost | $ | 2,087 | ||
| Short-term lease cost | 6 | |||
| Variable lease cost | 216 | |||
| Total lease cost | $ | 2,309 | ||
| Other information | ||||
| Operating cash flows from operating leases | $ | 1,980 | ||
67
Future commitments due under these lease operating agreements as of December 31, 2019 are as follows:
| Years ended December 31, | ||||
| 2020 | $ | 2,025 | ||
| 2021 | 2,024 | |||
| 2022 | 1,981 | |||
| 2023 | 1,965 | |||
| 2024 | 1,924 | |||
| Thereafter | 21,374 | |||
| Present value adjustment | (8,785 | ) | ||
| Present value of lease payments | 22,508 | |||
| Less current portion included in Accrued expenses and other current liabilities | (1,141 | ) | ||
| Operating lease liabilities | $ | 21,367 | ||
The following table summarizes the future minimum payments due for the Company’s operating leases under the prior lease guidance without the hindsight practical expedient for each of the next five years and the total thereafter as of December 31, 2018:
| Years ended December 31, | ||||
| 2019 | $ | 1,879 | ||
| 2020 | 1,917 | |||
| 2021 | 1,924 | |||
| 2022 | 1,672 | |||
| 2023 | 414 | |||
| 2024 and thereafter | 897 | |||
| Total | $ | 8,703 | ||
9. Accrued Expenses
Accrued expenses consist of the following:
| December 31, | ||||||||
| 2019 | 2018 | |||||||
| Compensation and related expenses | $ | 5,830 | $ | 4,446 | ||||
| Professional fees | 3,850 | 1,989 | ||||||
| Lease liability - current | 1,141 | – | ||||||
| Income taxes payable | – | 385 | ||||||
| Research grants | 393 | 400 | ||||||
| Clinical trial costs | 788 | 577 | ||||||
| Other | 443 | 349 | ||||||
| Total | $ | 12,445 | $ | 8,146 | ||||
Included in Professional fees as of December 31, 2019 are $2.8 million of accrued and unpaid costs related to the acquisitions of Parcus Medical and Arthrosurface which were closed in the first quarter of 2020. The lease liability as of December 31, 2019 is the result of the Company adopting ASC 842 as of January 1, 2019 as more fully described in Note 2 and 8.
Included in Compensation and related expenses as of December 31, 2018 are the accrued and unpaid costs related to the retirement of the Company’s former Chief Executive Officer, Charles H. Sherwood, Ph.D., as of March 9, 2018. All costs were paid prior to December 31, 2019.
68
10. Revolving Credit Agreement
On October 24, 2017, the Company, as borrower, entered into a new five-year agreement with Bank of America, N.A., as administrative agent, swingline lender and issuer of letters of credit, for a $50.0 million senior revolving line of credit (the “Credit Agreement”). Subject to certain conditions, the Company may request up to an additional $50.0 million in commitments for a maximum aggregate commitment of $100.0 million, which requests must be approved by the Revolving Lenders (as defined in the Credit Agreement). Loans under the Credit Agreement generally bear interest equal to, at the Company’s option, either: (i) LIBOR plus the Applicable Margin, as defined below, or the (ii) Base Rate, defined as the highest of: (a) the Federal Funds Rate plus 0.50%, (b) Bank of America, N.A.’s prime rate and (c) the one month LIBOR adjusted daily plus 1.0%, plus the Applicable Margin. The Applicable Margin ranges from 0.25% to 1.75% based on the Company’s consolidated leverage ratios at the time of the borrowings under the Credit Agreement. The Company has agreed to pay a commitment fee in an amount that is equal to 0.25% per annum on the actual daily unused amount of the credit facility and that is due and payable quarterly in arrears. Loan origination costs are included in Other long-term assets and are being amortized over the five-year term of the Credit Agreement. As of December 31, 2019 and 2018, there are no outstanding borrowings under the Credit Agreement and the Company is in compliance with the terms of the Credit Agreement.
The Credit Agreement contains customary representations, warranties, affirmative and negative covenants, including financial covenants, events of default and indemnification provisions in favor of the Lenders (as defined in the Credit Agreement). The covenants include restrictions governing the Company’s leverage ratio and interest coverage ratio, its incurrence of liens and indebtedness, and its entry into certain merger and acquisition transactions or dispositions and other matters, all subject to certain exceptions. The financial covenants require the Company not to exceed certain maximum leverage and interest coverage ratios. The Lenders have been granted a first priority lien and security interest in substantially all of the Company’s assets, except for certain intangible assets.
11. Commitments and Contingencies
Warranty and Guarantor Arrangements
In certain of its contracts, the Company warrants to its customers that the products it manufactures conform to the product specifications as in effect at the time of delivery of the specific product. The Company may also warrant that the products it manufactures do not infringe, violate or breach any U.S. patent or intellectual property rights, trade secret, or other proprietary information of any third party. On occasion, the Company contractually indemnifies its customers against any and all losses arising out of, or in any way connected with, any claim or claims of breach of its warranties or any actual or alleged defect in any product caused by the negligence or acts or omissions of the Company. The Company maintains a products liability insurance policy that limits its exposure to these risks. Based on the Company’s historical activity, in combination with its liability insurance coverage, the Company believes the estimated fair value of these indemnification agreements is immaterial. The Company has no accrued warranties at December 31, 2019 or 2018, respectively, and has no history of claims paid.
Legal Proceedings
The Company is involved from time-to-time in various legal proceedings arising in the normal course of business. Although the outcomes of potential legal proceedings are inherently difficult to predict, the Company does not expect the resolution of potential legal proceedings to have a material adverse effect on its financial position, results of operations, or cash flow.
12. Revenue by Product Group, by Significant Customer and by Geographic Location; Geographic Information
Historically, we have categorized our product offerings into four segments: Orthobiologics, Dermal, Surgical, and Other, which included our ophthalmic and veterinary products. Moving forward, we will divide our product portfolio into three categories: Joint Pain Management Therapy, Orthopedic Joint Preservation and Restoration Care, and Other as a result of the Company’s acquisitions of Parcus Medical and Arthrosurface.
69
Product revenue by product group is as follows:
| Years Ended December 31, | |||||||||||||||||||||||||
| 2019 | 2018 | 2017 | |||||||||||||||||||||||
| Revenue | Percentage of Product Revenue | Revenue | Percentage of Product Revenue | Revenue | Percentage of Product Revenue | ||||||||||||||||||||
| Orthobiologics | $ | 101,002 | 88 | % | $ | 93,556 | 89 | % | $ | 93,816 | 87 | % | |||||||||||||
| Surgical | 5,183 | 5 | % | 5,514 | 5 | % | 5,262 | 5 | % | ||||||||||||||||
| Dermal | 2,244 | 2 | % | 396 | 0 | % | 2,755 | 3 | % | ||||||||||||||||
| Other | 6,083 | 5 | % | 6,065 | 6 | % | 5,950 | 5 | % | ||||||||||||||||
| $ | 114,512 | 100 | % | $ | 105,531 | 100 | % | $ | 107,783 | 100 | % | ||||||||||||||
Product revenue from the Company’s sole significant customer, Mitek, as a percentage of the Company’s total product revenue was 71%, 73%, and 73% for the years ended December 31, 2019, 2018, and 2017, respectively.
Total revenue by geographic location based on the location of the customer in total and as a percentage of total revenue are as follows:
| Years Ended December 31, | ||||||||||||||||||||||||
| 2019 | 2018 | 2017 | ||||||||||||||||||||||
| Total | Percentage of | Total | Percentage of | Total | Percentage of | |||||||||||||||||||
| Revenue | Revenue | Revenue | Revenue | Revenue | Revenue | |||||||||||||||||||
| Geographic Location: | ||||||||||||||||||||||||
| United States | $ | 90,302 | 79 | % | $ | 85,351 | 81 | % | $ | 92,905 | 82 | % | ||||||||||||
| Europe | 14,744 | 13 | % | 11,730 | 11 | % | 12,435 | 11 | % | |||||||||||||||
| Other | 9,564 | 8 | % | 8,474 | 8 | % | 8,080 | 7 | % | |||||||||||||||
| Total | $ | 114,610 | 100 | % | $ | 105,555 | 100 | % | $ | 113,420 | 100 | % | ||||||||||||
On May 2, 2018, the Company publicly disclosed a voluntary recall of certain production lots of its HYAFF-based products, HYALOFAST, HYALOGRAFT C, and HYALOMATRIX. The Company initiated the voluntary recall after internal quality testing, which indicated that the products were at risk of not maintaining certain measures throughout their entire shelf life. While there was no indication of any safety or efficacy issue related to the products at the time, the Company removed the products from the field as a precautionary measure. During the three-month period ended March 31, 2018 the Company recorded a revenue reserve for this voluntary recall of $1.1 million of which $0.9 million was related to revenue recorded in prior periods. The revenue reserves impacted Orthopedic Joint Preservation and Restoration Care and Other product groups and all geographic locations. There was no remaining revenue reserve as of December 31, 2019 and 2018.
Net long-lived assets, consisting of net property and equipment, are subject to geographic risks because they are generally difficult to move and to effectively utilize in another geographic area in a reasonable time period and because they are relatively illiquid. Net tangible long-lived assets by principal geographic areas are as follows:
| Years Ended December 31, | ||||||||
| 2019 | 2018 | |||||||
| United States | $ | 48,635 | $ | 51,385 | ||||
| Italy | 2,148 | 2,726 | ||||||
| Total | $ | 50,783 | $ | 54,111 | ||||
13. Equity Incentive Plan
Equity Incentive Plan
The Anika Therapeutics, Inc. 2017 Omnibus Incentive Plan (the “2017 Plan”) was approved by the Company’s stockholders on June 13, 2017 and provides for the grant of incentive stock options, nonqualified stock options, stock appreciation rights (“SARs”), restricted stock awards (“RSAs”), performance restricted stock units (“PSUs”), restricted stock units (“RSUs”), and performance options that may be settled in cash, stock, or other property. In accordance with the 2017 Plan approved by the Company’s stockholders, each share award other than stock options or SAR’s will reduce the number of total shares available for grant by 2.0 shares. Subject to adjustment for specified types of changes in the Company’s capitalization, no more than 1.2 million shares of common stock may be issued under the 2017 Plan. On June 18, 2019, the Company’s stockholders approved an amendment to the Anika Therapeutics, Inc. 2017 Omnibus Incentive Plan (the “2017 Plan”). The amendment increased the number of shares of common stock reserved under the 2017 Plan by 1,500,000 from 1,200,000 to 2,700,000. Additionally, the amendment provided greater clarity with respect to the sections governing minimum vesting and tax withholding to facilitate plan administration. No other provisions of the 2017 Plan were amended. There are 1.7 million shares available for future grant at December 31, 2019.
70
The 2017 Plan replaced the Anika Therapeutics, Inc. Stock Option and Incentive Plan, as amended, (the “2003 Plan”), as the plan under which future grants to employees, directors, officers, and consultants will be made. The terms of the 2003 Plan provide for grants of nonqualified and incentive stock options, common stock, RSAs, RSUs, and SARs to employees, directors, officers, and consultants. The 2003 Plan was approved by the Company’s stockholders on June 4, 2003 and subsequently amended by the Board of Directors on May 29, 2009 and by the Company’s stockholders on June 7, 2011 and June 18, 2013 to increase the number of shares reserved for issuance. Pursuant to the 2011 amendment, each share award issued after June 7, 2011, other than stock options or SARs, reduced the number of total shares available for grant by 1.9 shares. Pursuant to the 2013 amendment, each share award issued after June 18, 2013, other than stock options or SARs, reduced the number of total shares available for grant by 1.5 shares.
The Company may satisfy the awards upon exercise, or upon fulfillment of the vesting requirements for other equity-based awards, with either newly-issued shares or shares reacquired by the Company. Stock-based awards are granted with an exercise price equal to the market price of the Company’s stock on the date of grant. Awards contain service conditions or service and performance conditions, and they generally become exercisable ratably over one to four years with a maximum contractual term of ten years.
The following table sets forth share information for stock-based compensation awards granted and exercised during the periods ended December 31, 2019 and 2018:
| December 31, | ||||||||
| 2019 | 2018 | |||||||
| Grants: | ||||||||
| Stock options | 254,517 | 199,970 | ||||||
| RSAs | - | 64,578 | ||||||
| RSUs | 189,507 | 15,457 | ||||||
| PSUs | 123,500 | - | ||||||
| Exercises: | ||||||||
| Stock options | 518,991 | 284,548 | ||||||
| SARs | 35,250 | - | ||||||
71
Stock Options
The combined stock options and SARs activity for the year ended December 31, 2019 is as follows:
| 2019 | ||||||||
| Weighted | ||||||||
| Average | ||||||||
| Exercise | ||||||||
| Number of | Price Per | |||||||
| Shares | Share | |||||||
| Options and SARs outstanding at beginning of year | 1,136,914 | $ | 42.06 | |||||
| Granted | 254,517 | $ | 41.92 | |||||
| Cancelled | (97,575 | ) | $ | 48.40 | ||||
| Expired | (48,647 | ) | $ | 51.18 | ||||
| Exercised | (554,241 | ) | $ | 40.37 | ||||
| Options and SARs outstanding at end of year | 690,968 | $ | 41.65 | |||||
All the 690,968 stock options outstanding at December 31, 2019 are vested or are expected to vest, with a weighted-average exercise price of $41.65 and as an aggregate intrinsic value of $8.6 million. The weighted average remaining contractual term of the vested and expected to vest stock options is 5.0 years as of December 31, 2019.
As of December 31, 2019, total unrecognized compensation costs related to non-vested stock options was approximately $4.7 million and is expected to be recognized over a weighted average period of 2.3 years.
The options exercisable at December 31, 2019 are as follows:
| Number Outstanding | Weighted Avg Exercise Price | Weighted Average Remaining Term (in years) | ||||||||||
| Incentive stock options | 115,871 | $ | 22.90 | 3.7 | ||||||||
| Non-qualified stock options | 158,601 | $ | 38.82 | 5.8 | ||||||||
| Performance awards | 23,269 | $ | 46.51 | 6.6 | ||||||||
The total intrinsic value of stock options and SARs exercised was $8.5 million, $8.5 million and $0.5 million for the years ended December 31, 2019, 2018 and 2017, respectively. The 35,250 SARs exercised in 2019 resulted in the issuance of 31,541 shares of common stock. There are no remaining SARs outstanding as of December 31, 2019.
The total grant-date fair value of stock options and SARs vested during the years ended December 31, 2019, 2018 and 2017 was approximately $2.7 million, $6.7 million and $2.1 million, respectively.
Restricted Stock
The RSA, RSU and PSU activity for the year ended December 31, 2019 is as follows:
| 2019 | ||||||||
| Weighted | ||||||||
| Average | ||||||||
| Number of | Grant Date | |||||||
| Shares | Fair Value | |||||||
| Unvested at Beginning of year | 59,083 | $ | 47.26 | |||||
| Granted | 313,007 | $ | 33.64 | |||||
| Cancelled | (49,258 | ) | $ | 34.65 | ||||
| Vested/Released | (33,734 | ) | $ | 48.39 | ||||
| Unvested at end of year | 289,098 | $ | 34.53 | |||||
72
The total fair value of RSAs, RSUs, and PSUs vested during the years ended December 31, 2019, 2018 and 2017 was $1.4 million, $6.8 million and $2.3 million, respectively. The weighted-average grant-date fair value of PSUs, RSAs and RSUs granted during the years ended December 31, 2019, 2018 and 2017 was $33.64, $58.84 and $52.03, respectively.
Stock Compensation Expense
The Company estimates the fair value of stock options and SARs using the Black-Scholes valuation model. Fair value of restricted stock is measured by the grant-date price of the Company’s shares. The PSUs granted to employees contained performance conditions with business and financial targets. The business target, amounting to 30% of the total performance condition awards, was measured and achieved in the 2019 fiscal year, while the financial targets, amounting to 70% of the total performance condition awards, will ultimately vest depending on the financial operating results in with respect to the Company’s operating results in the 2021 fiscal year. The Company recorded $1.2 million, $0.7 million, and $0.8 million related to performance-based units and options in the years ending 2019, 2018, and 2017, respectively.
Key input assumptions used to estimate the fair value of stock options and SARs include the exercise price of the award, the expected award term, the expected volatility of the Company’s stock over the option’s expected term, the risk-free interest rate over the award’s expected term, and the Company’s expected annual dividend yield.
The expected volatility assumption is evaluated against the historical volatility of the Company’s common stock over a 3.5 year average, and it is adjusted if there are material changes in historical volatility. The risk-free interest rate assumption is based on U.S. Treasury interest rates at the time of grant.
The weighted-average grant-date fair value per share of stock options granted in 2019, 2018 and 2017 was $14.73, $20.01 and $16.87, respectively. The fair value of each stock option during 2019, 2018, and 2017 was estimated on the grant-date using the Black-Scholes option-pricing model with the following assumptions:
| 2019 | 2018 | 2017 | ||||||||||
| Risk free interest rate | 1.41% | - | 2.54% | 2.15% | - | 2.82% | 1.60% | - | 1.86% | |||
| Expected volatility | 44.27% | - | 48.52% | 37.12% | - | 45.61% | 38.74% | - | 44.31% | |||
| Expected life (years) | 3.5 | 4.0 | - | 4.5 | 4.0 | |||||||
| Expected dividend yield | 0.00% | 0.00% | 0.00% | |||||||||
The Company presents the expenses related to stock-based compensation awards in the same expense line items as cash compensation paid to each of its employees as follows:
| 2019 | 2018 | 2017 | ||||||||||
| Cost of product revenue | $ | 412 | $ | (160 | ) | $ | 439 | |||||
| Research & development | 424 | 851 | 564 | |||||||||
| Selling, general & administrative | 5,251 | 10,355 | 4,804 | |||||||||
| Total stock-based compensation expense | $ | 6,087 | $ | 11,046 | $ | 5,807 | ||||||
Tax benefits of $0.1 million, $1.5 million and $0.4 million, respectively, are associated with the annual stock compensation expense above. The decrease in stock-based compensation expense within the cost of product revenue line item for the year ended December 31, 2018 is due to forfeitures associated with unvested stock option awards from the resignation of a former executive. Upon the retirement of the Company’s former Chief Executive Officer, Charles H. Sherwood, Ph.D., on March 9, 2018, all of his outstanding stock-based compensation awards vested in full and became exercisable in accordance with their terms, resulting in a one-time expense of $6.2 million that was fully recognized during the three-month period ended March 31, 2018.
73
14. Employee Benefit Plan
The Company’s U.S. employees are eligible to participate in the Company’s 401(k) savings plan. Employees may elect to contribute a percentage of their compensation to the plan, and the Company will make 140% matching contributions up to a limit of 5% of an employee’s eligible compensation. In addition, the Company may make annual discretionary contributions. The Company made matching contributions of $0.8 million, $0.8 million, and $0.6 million for the years ended December 31, 2019, 2018, and 2017, respectively.
15. Accelerated Share Repurchases
On May 2, 2019, the Company announced that its Board of Directors had authorized the repurchase of up to $50.0 million shares of the Company’s common stock with $30.0 million to be repurchased through an accelerated share repurchase program and up to $20.0 million to be potentially repurchased on the open market from time-to-time. Through December 31, 2019, no open market repurchases had been executed. On May 7, 2019, the Company entered into an accelerated share repurchase agreement with Morgan Stanley & Co. LLC (“Morgan Stanley”) pursuant to a Fixed Dollar Accelerated Share Repurchase Transaction (“ASR Agreement") to purchase $30.0 million of shares of its common stock. Pursuant to the terms of the ASR Agreement, the Company delivered $30.0 million cash to Morgan Stanley and received an initial delivery of 0.5 million shares of the Company’s common stock on May 8, 2019 based on a closing market price of $39.85 and the applicable contractual discount. This was approximately 60% of the then estimated total number of shares expected to be repurchased under the ASR Agreement.
On January 14, 2020, the Company settled the approximately $12.0 million remaining under the ASR Agreement, which was recorded as an equity forward sale contract and was included in additional paid-in-capital in stockholders' equity in the consolidated balance sheet as it met the criteria for equity accounting. Pursuant to the terms of the ASR Agreement, the final number of shares and the average purchase price was determined at the end of the applicable purchase period, which was January 14, 2020. Based on the volume-weighted average price since the effective date of the ASR Agreement less the applicable contractual discount, Morgan Stanley delivered 0.1 million additional shares to the Company on January 17, 2020. In total, 0.6 million shares were repurchased under the ASR Agreement at an average repurchase price of $50.78 per share. These shares are held by the Company as authorized but unissued shares. All shares were repurchased in accordance with the publicly announced program, and the Company will not make any further purchases under the program. The initial delivery of shares resulted in an immediate reduction of the number of outstanding shares used to calculate the weighted-average common shares outstanding for basic and diluted net income per share on the effective date of the ASR Agreement.
On May 24, 2018, the Company entered into an accelerated stock repurchase agreement with Morgan Stanley pursuant to an ASR Agreement to purchase $30.0 million of shares of its common stock. Pursuant to the terms of the ASR Agreement, the Company delivered $30.0 million cash to Morgan Stanley and received an initial delivery of 0.4 million shares of the Company’s common stock on May 24, 2018 based on a closing market price of $41.41 and the applicable contractual discount.
On July 16, 2018, the Company settled the approximately $12.0 million remaining under the ASR Agreement, which was recorded as an equity forward sale contract and was included in additional paid-in-capital in stockholders' equity in the consolidated balance sheet as it met the criteria for equity accounting. Pursuant to the terms of the ASR Agreement, the final number of shares and the average purchase price was determined at the end of the applicable purchase period, which was July 16, 2018. Based on the volume-weighted average price since the effective date of the ASR Agreement less the applicable contractual discount, Morgan Stanley delivered 0.4 million additional shares to the Company on July 19, 2018. In total, 0.8 million shares were repurchased under the ASR Agreement at an average repurchase price of $37.18 per share. These shares are held by the Company as authorized but unissued shares. All shares were repurchased in accordance with the publicly announced program, and the Company will not make any further purchases under the program. The initial and final delivery of shares resulted in an immediate reduction of the number of outstanding shares used to calculate the weighted-average common shares outstanding for basic and diluted net income per share on the effective date of the ASR Agreement.
74
16. Income Taxes
On December 22, 2017, the Tax Cuts and Jobs Act (the “2017 Tax Act”) was enacted. This legislation made significant changes to the U.S. tax law, including a reduction in the corporate tax rate from 35% to 21% starting in 2018.
In accordance with Staff Accounting Bulletin No. 118, which provides guidance on accounting for the tax effects of the 2017 Tax Act, the Company has recorded the impact on the consolidated financial statements. There were no significant changes in the provisional amount recorded in 2017 related to the finalization of the Company’s analysis. The other provisions of the Tax Act did not have a material impact on the 2017 consolidated financial statements.
Income Tax Expense
The components of the Company’s income before income taxes and its provision for (benefit from) income taxes consist of the following:
| Years ended December 31, | ||||||||||||
| 2019 | 2018 | 2017 | ||||||||||
| Income before income taxes | ||||||||||||
| Domestic | $ | 38,299 | $ | 26,227 | $ | 48,446 | ||||||
| Foreign | (2,178 | ) | (3,020 | ) | (2,244 | ) | ||||||
| $ | 36,121 | $ | 23,207 | $ | 46,202 | |||||||
| Years ended December 31, | ||||||||||||
| 2019 | 2018 | 2017 | ||||||||||
| Provision for (benefit from) income taxes: | ||||||||||||
| Current: | ||||||||||||
| Federal | $ | 6,245 | $ | 4,783 | $ | 12,608 | ||||||
| State | 1,884 | 1,644 | 2,737 | |||||||||
| Foreign | 202 | 405 | 31 | |||||||||
| Total current | 8,331 | 6,832 | 15,376 | |||||||||
| Deferred: | ||||||||||||
| Federal | 1,086 | (992 | ) | (426 | ) | |||||||
| State | 324 | (152 | ) | (68 | ) | |||||||
| Foreign | (813 | ) | (1,203 | ) | (496 | ) | ||||||
| Total deferred | 597 | (2,347 | ) | (990 | ) | |||||||
| Total provision | $ | 8,928 | $ | 4,485 | $ | 14,386 | ||||||
75
Deferred Tax Assets and Liabilities
Significant components of the Company’s deferred tax assets and liabilities consist of the following:
| December 31, | ||||||||
| 2019 | 2018 | |||||||
| Deferred tax assets: | ||||||||
| Net operating loss carry forward, foreign | $ | 1,812 | $ | 1,382 | ||||
| Stock-based compensation expense | 1,901 | 3,148 | ||||||
| Foreign currency exchange | 346 | 363 | ||||||
| Accrued expenses and other | 1,076 | 818 | ||||||
| Inventory reserve | 1,187 | 1,500 | ||||||
| Lease liability | 5,206 | – | ||||||
| Deferred tax assets | $ | 11,528 | $ | 7,211 | ||||
| December 31, | ||||||||
| 2019 | 2018 | |||||||
| Deferred tax liabilities: | ||||||||
| Acquisition-related Intangibles | $ | (2,023 | ) | $ | (2,405 | ) | ||
| Depreciation | (8,665 | ) | (8,348 | ) | ||||
| Right of use asset | (5,171 | ) | – | |||||
| Deferred tax liabilities | $ | (15,859 | ) | $ | (10,753 | ) | ||
| Net deferred tax liabilities | $ | (4,331 | ) | $ | (3,542 | ) | ||
Tax Rate
The reconciliation between the U.S. federal statutory rate and the Company’s effective rate is summarized as follows:
| Years ended December 31, | ||||||||||||
| 2019 | 2018 | 2017 | ||||||||||
| Statutory federal income tax rate | 21.0 | % | 21.0 | % | 35.0 | % | ||||||
| State tax expense, net of federal benefit | 5.5 | % | 5.5 | % | 4.8 | % | ||||||
| Impact of rate change on deferred taxes | 0.0 | % | 0.0 | % | (4.9 | %) | ||||||
| Permanent items, including nondeductible expenses | (0.1 | %) | (1.4 | %) | 0.1 | % | ||||||
| State investment tax credit | (0.1 | %) | (0.2 | %) | (0.7 | %) | ||||||
| Federal, state and foreign research and development credits | (1.4 | %) | (3.4 | %) | (1.4 | %) | ||||||
| Foreign rate differential | (0.2 | %) | (0.4 | %) | 0.5 | % | ||||||
| Domestic production deduction | 0.0 | % | 0.0 | % | (2.8 | %) | ||||||
| Stock compensation | 0.6 | % | (4.8 | %) | (0.2 | %) | ||||||
| Non-deductible Section 162(m) compensation limitation | 0.3 | % | 4.3 | % | 0.7 | % | ||||||
| Foreign derived intangible income deduction | (0.9 | %) | (1.3 | %) | 0.0 | % | ||||||
| Effective income tax rate | 24.7 | % | 19.3 | % | 31.1 | % | ||||||
As of December 31, 2019, the Company had net operating loss carryforwards for income tax purposes in Italy of $7.5 million that do not expire.
Accounting for Uncertainty in Income Taxes
The Company had no unrecognized tax benefits for the years ended December 31, 2019 and 2018, respectively. The Company does not anticipate experiencing any significant increases or decreases in its unrecognized tax benefits within the twelve months following December 31, 2019.
In the normal course of business, Anika and its subsidiaries may be periodically examined by various taxing authorities. The Company files income tax returns in the U.S. federal jurisdiction, in certain U.S. states, and in Italy. The associated tax filings remain subject to examination by applicable tax authorities for a certain length of time following the tax year to which those filings relate. The 2016 through 2018 tax years remain subject to examination by the IRS and other taxing authorities for U.S. federal and state tax purposes. The 2013 through 2018 tax years remain subject to examination by the appropriate governmental authorities for Italy.
76
Upon the settlement of certain stock-based awards (i.e., exercise, vesting, forfeiture, or cancellation), the actual tax deduction is compared with cumulative financial reporting compensation cost, and any excess tax deduction related to these awards is considered a windfall tax benefit. With the adoption of ASU 2016-09 in 2017, the Company records windfall tax benefits to income tax expense. The Company follows the with-and-without approach for the direct effects of windfall/shortfall items and to determine the timing of the recognition of any related benefits. The Company recorded an immaterial windfall tax benefit in income tax expense in 2019 compared to $1.5 million and $0.4 million in 2018 and 2017, respectively.
17. Earnings per Share (“EPS”)
Basic EPS is calculated by dividing net income by the weighted average number of shares outstanding during the period. Unvested RSAs, although legally issued and outstanding, are not considered outstanding for purposes of calculating basic earnings per share. Diluted EPS is calculated by dividing net income by the weighted average number of shares outstanding plus the dilutive effect, if any, of outstanding stock options, stock appreciation rights (“SARs”), RSAs, PSUs and RSUs using the treasury stock method.
The following table provides share information used in the calculation of the Company's basic and diluted earnings per share:
| Years Ended December 31, | ||||||||||||
| 2019 | 2018 | 2017 | ||||||||||
| Shares used in the calculation of basic earnings per share | 14,121 | 14,442 | 14,575 | |||||||||
| Effect of dilutive securities: | ||||||||||||
| Stock options, SARs, RSAs and RSUs | 253 | 247 | 493 | |||||||||
| Diluted shares used in the calculation of earnings per share | 14,374 | 14,689 | 15,068 | |||||||||
Stock options to purchase 0.5 million shares, 0.7 million shares, and 0.5 million shares for the years ended December 31, 2019, 2018, and 2017, respectively, were excluded from the computation of diluted EPS as their effect would have been anti-dilutive. The anti-dilutive restricted shares for the years, 2019, 2018 and 2017 were insignificant.
At December 31, 2019, 2018, and 2017 a total of 13 thousand, 42 thousand and 0.1 million shares of issued and outstanding unvested RSAs were excluded from the basic earnings per share.
77
18. Quarterly Financial Data (Unaudited)
| Quarter ended | Quarter ended | Quarter ended | Quarter ended | |||||||||||||
| Year 2019 | December 31 | September 30 | June 30 | March 31 | ||||||||||||
| Product revenue | $ | 29,767 | $ | 29,615 | $ | 30,413 | $ | 24,717 | ||||||||
| Total revenue | 29,772 | 29,697 | 30,418 | 24,723 | ||||||||||||
| Cost of product revenue | 8,649 | 5,951 | 6,836 | 7,311 | ||||||||||||
| Gross profit on product revenue | 21,118 | 23,664 | 23,577 | 17,406 | ||||||||||||
| Net income | $ | 4,051 | $ | 9,200 | $ | 9,435 | $ | 4,507 | ||||||||
| Per common share information: | ||||||||||||||||
| Basic net income per share | $ | 0.28 | $ | 0.65 | $ | 0.68 | $ | 0.32 | ||||||||
| Basic common shares outstanding | 14,280 | 14,070 | 13,916 | 14,185 | ||||||||||||
| Diluted net income per share | $ | 0.28 | $ | 0.66 | $ | 0.67 | $ | 0.31 | ||||||||
| Diluted common shares outstanding | 14,621 | 14,387 | 14,088 | 14,314 | ||||||||||||
| Quarter ended | Quarter ended | Quarter ended | Quarter ended | |||||||||||||
| Year 2018 | December 31 | September 30 | June 30 | March 31 | ||||||||||||
| Product revenue | $ | 26,950 | $ | 26,781 | $ | 30,542 | $ | 21,258 | ||||||||
| Total revenue | 26,956 | 26,787 | 30,548 | 21,264 | ||||||||||||
| Cost of product revenue | 7,001 | 8,282 | 8,152 | 7,845 | ||||||||||||
| Gross profit on product revenue | 19,949 | 18,499 | 22,390 | 13,413 | ||||||||||||
| Net income | $ | 7,717 | $ | 7,599 | $ | 10,092 | $ | (6,686 | ) | |||||||
| Per common share information: | ||||||||||||||||
| Basic net income per share | $ | 0.54 | $ | 0.53 | $ | 0.69 | $ | (0.46 | ) | |||||||
| Basic common shares outstanding | 14,168 | 14,237 | 14,652 | 14,679 | ||||||||||||
| Diluted net income per share | $ | 0.54 | $ | 0.53 | $ | 0.68 | $ | (0.46 | ) | |||||||
| Diluted common shares outstanding | 14,299 | 14,377 | 14,915 | 14,679 | ||||||||||||
19. Subsequent Events - Business Combinations
Parcus Medical Acquisition
On January 4, 2020, Anika entered into an agreement to acquire all outstanding equity of Parcus Medical, a sports medicine implant and instrumentation solutions provider focused on surgical repair and reconstruction of ligaments and tendons. On January 24, 2020, the acquisition was completed and Parcus Medical became a wholly-owned subsidiary of the Company.
The preliminary estimated total purchase consideration is approximately $76.2 million, which consists of $32.6 million of cash paid at closing, deferred consideration of $1.9 million, and $41.7 million for the acquisition date estimated fair value of future cash payment of contingent consideration. The estimated purchase consideration and allocation is preliminary as the acquisition was recently completed. Based on information available at this date, the Company expects to recognize approximately $49.0 million in intangible assets and approximately $15.0 million in goodwill.
78
Arthrosurface Acquisition
On January 4, 2020, Anika entered into an agreement to acquire all outstanding equity of Arthrosurface, a joint preservation technology company specializing in less invasive, bone preserving partial and total joint replacement solutions. On February 3, 2020, the acquisition was completed and Arthrosurface became a wholly-owned subsidiary of the Company.
The preliminary estimated total purchase consideration is approximately $89.6 million, which consists of $61.2 million of cash paid at closing and $28.4 million for the acquisition date estimated fair value of future cash payment of contingent consideration. The estimated purchase consideration and allocation is preliminary as the acquisition was recently completed. Based on information available at this date, the Company expects to recognize approximately $52.0 million in intangible assets and approximately $21.0 million in goodwill.
79
20. Subsequent Events - Other
On January 29, 2020, the Company announced the unexpected death of its former President and Chief Executive Officer, Joseph Darling. According to the terms of Mr. Darling’s equity award grants and the 2017 Plan, an unvested portion of his stock-based compensation was forfeited upon his death, which was accounted for in the first quarter of 2020. Dr. Cheryl Blanchard, a member of the Board of Directors, has been named Interim Chief Executive Officer.
80
ITEM 9A. CONTROLS AND PROCEDURES
| (a) | Evaluation of disclosure controls and procedures. |
As required by Rule 13a-15 under the Securities Exchange Act of 1934 (“Exchange Act”), we carried out an evaluation under the supervision and with the participation of our management, including our chief executive officer and chief financial officer, of the effectiveness of the design and operation of our disclosure controls and procedures as of the end of the period covered by this report. Based upon that evaluation, the chief executive officer and chief financial officer have concluded that our disclosure controls and procedures are effective as of December 31, 2019 to ensure that information required to be disclosed by us in reports we file or submit under the Exchange Act is recorded, processed, summarized, and reported within the time periods specified in SEC rules and forms. Disclosure controls and procedures include, without limitation, controls and procedures designed to ensure that information required to be disclosed by our company in the reports we file or submit under the Exchange Act is accumulated and communicated to our management, including our chief executive officer and chief financial officer, or persons performing similar functions, as appropriate to allow timely decisions regarding required disclosure. On an on-going basis, we review and document our disclosure controls and procedures, and our internal control over financial reporting, and we may from time to time make changes aimed at enhancing their effectiveness and ensuring that our systems evolve with our business.
| (b) | Changes in internal controls over financial reporting. |
There were no changes in our internal control over financial reporting during the quarter ended December 31, 2019 that have materially affected, or that are reasonably likely to materially affect, our internal controls over financial reporting.
Management’s Report on Internal Control over Financial Reporting
Our management is responsible for establishing and maintaining adequate internal control over financial reporting as defined in Rules 13a-15(f) and 15d-15(f) under the Exchange Act. Our internal control over financial reporting is a process designed to provide reasonable assurance regarding the reliability of financial reporting and the preparation of financial statements for external purposes in accordance with generally accepted accounting principles in the United States.
Because of its inherent limitations, internal control over financial reporting can provide only reasonable assurance, and it may not prevent or detect misstatements. Also, projections of any evaluation of effectiveness to future periods are subject to the risk that controls may become inadequate because of changes in conditions or that the degree of compliance with the policies or procedures may deteriorate.
Our management assessed the effectiveness of our internal control over financial reporting as of December 31, 2019. In making this assessment, management used the criteria set forth by the Committee of Sponsoring Organizations of the Treadway Commission in its 2013 Internal Control—Integrated Framework.
Based on its assessment and those criteria, our management believes that our company maintained effective internal control over financial reporting as of December 31, 2019.
The effectiveness of our internal control over financial reporting as of December 31, 2019 has been audited by Deloitte & Touche LLP an independent registered public accounting firm, as stated in their report which is included below in this Item 9A of this annual report on Form 10-K.
81
REPORT OF INDEPENDENT REGISTERED PUBLIC ACCOUNTING FIRM
To the Board of Directors and Stockholders of Anika Therapeutics, Inc.
Opinion on Internal Control over Financial Reporting
We have audited the internal control over financial reporting of Anika Therapeutics, Inc. and subsidiaries (the “Company”) as of December 31, 2019, based on criteria established in Internal Control — Integrated Framework (2013) issued by the Committee of Sponsoring Organizations of the Treadway Commission (COSO). In our opinion, the Company maintained, in all material respects, effective internal control over financial reporting as of December 31, 2019, based on criteria established in Internal Control — Integrated Framework (2013) issued by COSO.
We have also audited, in accordance with the standards of the Public Company Accounting Oversight Board (United States) (PCAOB), the consolidated financial statements as of and for the year ended December 31, 2019, of the Company and our report dated March 5, 2020, expressed an unqualified opinion on those financial statements and included an explanatory paragraph related to the Company’s change in method of accounting for leases in fiscal year 2019 due to the adoption of the new lease standard.
Basis for Opinion
The Company’s management is responsible for maintaining effective internal control over financial reporting and for its assessment of the effectiveness of internal control over financial reporting, included in the accompanying Management's Annual Report on Internal Control over Financial Reporting. Our responsibility is to express an opinion on the Company’s internal control over financial reporting based on our audit. We are a public accounting firm registered with the PCAOB and are required to be independent with respect to the Company in accordance with the U.S. federal securities laws and the applicable rules and regulations of the Securities and Exchange Commission and the PCAOB.
We conducted our audit in accordance with the standards of the PCAOB. Those standards require that we plan and perform the audit to obtain reasonable assurance about whether effective internal control over financial reporting was maintained in all material respects. Our audit included obtaining an understanding of internal control over financial reporting, assessing the risk that a material weakness exists, testing and evaluating the design and operating effectiveness of internal control based on the assessed risk, and performing such other procedures as we considered necessary in the circumstances. We believe that our audit provides a reasonable basis for our opinion.
Definition and Limitations of Internal Control over Financial Reporting
A company’s internal control over financial reporting is a process designed to provide reasonable assurance regarding the reliability of financial reporting and the preparation of financial statements for external purposes in accordance with generally accepted accounting principles. A company’s internal control over financial reporting includes those policies and procedures that (1) pertain to the maintenance of records that, in reasonable detail, accurately and fairly reflect the transactions and dispositions of the assets of the company; (2) provide reasonable assurance that transactions are recorded as necessary to permit preparation of financial statements in accordance with generally accepted accounting principles, and that receipts and expenditures of the company are being made only in accordance with authorizations of management and directors of the company; and (3) provide reasonable assurance regarding prevention or timely detection of unauthorized acquisition, use, or disposition of the company’s assets that could have a material effect on the financial statements.
Because of its inherent limitations, internal control over financial reporting may not prevent or detect misstatements. Also, projections of any evaluation of effectiveness to future periods are subject to the risk that controls may become inadequate because of changes in conditions, or that the degree of compliance with the policies or procedures may deteriorate.
/s/ Deloitte & Touche LLP
Boston, Massachusetts
March 5, 2020
82
ITEM 10. DIRECTORS, EXECUTIVE OFFICERS AND CORPORATE GOVERNANCE
The information required under this item is incorporated herein by reference to our definitive proxy statement pursuant to Regulation 14A, which proxy statement will be filed with the SEC not later than 120 days after the close of our fiscal year ended December 31, 2019.
ITEM 11. EXECUTIVE COMPENSATION
The information required under this item is incorporated herein by reference to our definitive proxy statement pursuant to Regulation 14A, which proxy statement will be filed with the SEC not later than 120 days after the close of our fiscal year ended December 31, 2019.
ITEM 12. SECURITY OWNERSHIP OF CERTAIN BENEFICIAL OWNERS AND MANAGEMENT AND RELATED STOCKHOLDER MATTERS
The information required under this item and Item 5 of this Annual Report on Form 10-K under the heading “Equity Compensation Plan Information” is incorporated herein by reference to our definitive proxy statement pursuant to Regulation 14A, which proxy statement will be filed with the SEC not later than 120 days after the close of our fiscal year ended December 31, 2019.
ITEM 13. CERTAIN RELATIONSHIPS AND RELATED TRANSACTIONS, AND DIRECTOR INDEPENDENCE
The information required under this item is incorporated herein by reference to our definitive proxy statement pursuant to Regulation 14A, which proxy statement will be filed with the SEC not later than 120 days after the close of our fiscal year ended December 31, 2019.
ITEM 14. PRINCIPAL ACCOUNTING FEES AND SERVICES
The information required under this item is incorporated herein by reference to our definitive proxy statement pursuant to Regulation 14A, which proxy statement will be filed with the SEC not later than 120 days after the close of our fiscal year ended December 31, 2019.
83
ITEM 15. EXHIBITS AND FINANCIAL STATEMENT SCHEDULES
| (a) | Documents filed as part of Form 10-K. | |
| (1) Financial Statements | ||
| Report of Independent Registered Public Accounting Firm | 51 | |
| Consolidated Balance Sheets | 52 | |
| Consolidated Statements of Operations and Comprehensive Income | 53 | |
| Consolidated Statements of Stockholders’ Equity | 54 | |
| Consolidated Statements of Cash Flows | 55 | |
| Notes to Consolidated Financial Statements | 56-80 | |
| (2) Schedules |
Schedules have been omitted as all required information has been disclosed in the financial statements and related footnotes.
84
| (3) Exhibits |
85
86
| Exhibit
Number |
Description | ||
| 21.1 | List of Subsidiaries of Anika Therapeutics, Inc. | ||
| 23.1 | Consent of Deloitte & Touche LLP | ||
| 31.1 | Certification of Principal Executive Officer pursuant to Section 302 of the Sarbanes-Oxley Act of 2002 | ||
| 31.2 | Certification of Principal Financial Officer pursuant to Section 302 of the Sarbanes-Oxley Act of 2002 | ||
| **32.1 | Certification pursuant to 18 U.S.C. Section 1350, as adopted pursuant to Section 906 of the Sarbanes-Oxley Act of 2002 | ||
| ***101 | The following materials from the Annual Report on Form 10-K of Anika Therapeutics, Inc. for the fiscal year ended December 31, 2019, formatted in XBRL: (i) Consolidated Balance Sheets as of December 31, 2019 and December 31, 2018; (ii) Consolidated Statements of Operations and Comprehensive Income for the Years Ended December 31, 2019, December 31, 2018, and December 31, 2017; (iii) Consolidated Statements of Stockholders’ Equity for the Years Ended December 31, 2019, December 31, 2018, and December 31, 2017; (iv) Consolidated Statements of Cash Flows for the Years Ended December 31, 2019, December 31, 2018, and December 31, 2017; and (v) Notes to Consolidated Financial Statements |
| + | Portions of this exhibit have been redacted in compliance with Regulation S-K Item 601(b)(2). The omitted information is not material and would likely cause competitive harm to the Company if publicly disclosed. |
| † | Management contract or compensatory plan or arrangement. |
| * | Certain portions of this document have been omitted pursuant to a confidential treatment request filed with the Securities and Exchange Commission. The omitted portions have been filed separately with the Commission. |
| ** | The certification attached as Exhibit 32.1 that accompanies this Form 10-K is not deemed filed with the SEC and is not to be incorporated by reference into any filing of Anika Therapeutics, Inc. under the Securities Act of 1933 or the Securities Exchange Act of 1934, whether made before or after the date of this Form 10-K, irrespective of any general incorporation language contained in such filing. |
| *** | Pursuant to Rule 406T of Regulation S-T, XBRL (Extensible Business Reporting Language) information is deemed not filed or a part of a registration statement or prospectus for purposes of sections 11 or 12 of the Securities Act of 1933, is deemed not filed for purposes of section 18 of the Securities Exchange Act of 1934 and otherwise is not subject to liability under these sections. |
87
Pursuant to the requirements of Section 13 or 15(d) of the Securities Exchange Act of 1934, as amended, the registrant has duly caused this report to be signed on its behalf by the undersigned, thereunto duly authorized.
| ANIKA THERAPEUTICS, INC. | |||
| Date: March 5, 2020 | By: | /s/ CHERYL BLANCHARD | |
| Cheryl Blanchard | |||
| Interim Chief Executive Officer | |||
SIGNATURES
Pursuant to the requirements of the Securities Exchange Act of 1934, this report has been signed below by the following persons on behalf of the registrant and in the capacities and on the dates indicated.
| Signature | Title | Date | ||
| /s/ CHERYL BLANCHARD | Interim Chief Executive Officer | |||
| Cheryl Blanchard | (Principle Executive Officer) | March 5, 2020 | ||
| /s/ SYLVIA CHEUNG | Chief Financial Officer | |||
| Sylvia Cheung | (Principal Accounting Officer and Principal Financial Officer) | March 5, 2020 | ||
| /s/ JOSEPH L. BOWER | Director, Chairman of the Board | |||
| Joseph L. Bower | March 5, 2020 | |||
| /s/ RAYMOND J. LAND | Director | |||
| Raymond J. Land | March 5, 2020 | |||
| /s/ GLENN R. LARSEN, PH.D. | Director | |||
| Glenn R. Larsen, Ph.D. | March 5, 2020 | |||
| /s/ JEFFERY S. THOMPSON | Director | |||
| Jeffery S. Thompson | March 5, 2020 | |||
| /s/ SUSAN VOGT | Director | |||
| Susan Vogt | March 5, 2020 | |||
88