Attached files
| file | filename |
|---|---|
| EX-32.2 - EXHIBIT 32.2 - PPD, Inc. | ppdex322cfo.htm |
| EX-32.1 - EXHIBIT 32.1 - PPD, Inc. | ppdex321ceo.htm |
| EX-31.2 - EXHIBIT 31.2 - PPD, Inc. | ppdext312cfo.htm |
| EX-31.1 - EXHIBIT 31.1 - PPD, Inc. | ppdex311ceo.htm |
| EX-23.1 - EXHIBIT 23.1 - PPD, Inc. | ppdex231consent.htm |
| EX-4.5 - EXHIBIT 4.5 - PPD, Inc. | ppdex45.htm |
UNITED STATES
SECURITIES AND EXCHANGE COMMISSION
Washington, D.C. 20549
FORM 10-K
(Mark One)
x | ANNUAL REPORT PURSUANT TO SECTION 13 OR 15(d) OF THE SECURITIES EXCHANGE ACT OF 1934 |
For the fiscal year ended December 31, 2019
OR
o | TRANSITION REPORT PURSUANT TO SECTION 13 OR 15(d) OF THE SECURITIES EXCHANGE ACT OF 1934 |
For the transition period from to .
Commission file number: 001-39212
PPD, Inc.
(Exact name of registrant as specified in its charter)
Delaware | 45-3806427 | ||
(State or other jurisdiction of incorporation or organization) | (I.R.S. Employer Identification No.) | ||
929 North Front Street, Wilmington, North Carolina 28401 | |||
(Address of Principal Executive Offices) (Zip Code) | |||
910-251-0081
Registrant's telephone number, including area code
Securities registered pursuant to Section 12(b) of the Act:
Title of each class | Trading Symbol(s) | Name of each exchange on which registered |
Common Stock, par value $0.01 per share | PPD | The NASDAQ Stock Market LLC (Nasdaq Global Select Market) |
Securities registered pursuant to section 12(g) of the Act: None
Indicate by check mark if the registrant is a well-known seasoned issuer, as defined in Rule 405 of the Securities Act. Yes o No x
Indicate by check mark if the registrant is not required to file reports pursuant to Section 13 or Section 15(d) of the Act.Yes o No x
Indicate by check mark whether the registrant: (1) has filed all reports required to be filed by Section 13 or 15(d) of the Securities Exchange Act of 1934 during the preceding 12 months (or for such shorter period that the registrant was required to file such reports); and (2) has been subject to such filing requirements for the past 90 days. Yes o No x
Indicate by check mark whether the registrant has submitted electronically every Interactive Data File required to be submitted pursuant to Rule 405 of Regulation S-T (§232.405 of this chapter) during the preceding 12 months (or for such shorter period that the registrant was required to submit and post such files). Yes o No x
Indicate by check mark whether the registrant is a large accelerated filer, an accelerated filer, a non-accelerated filer, a smaller reporting company, or an emerging growth company. See the definitions of “large accelerated filer,” “accelerated filer,” “smaller reporting company” and “emerging growth company” in Rule 12b-2 of the Exchange Act.
Large accelerated filer | o | Accelerated filer | o |
Non-accelerated filer | x | Smaller reporting company | o |
Emerging growth company | o | ||
If an emerging growth company, indicate by check mark if the registrant has elected not to use the extended transition period for complying with any new or revised financial accounting standards provided pursuant to Section 13(a) of the Exchange Act. o
Indicate by check mark whether the registrant is a shell company (as defined in Rule 12b-2 of the Act). Yes o No x
As of June 28, 2019, the last business day of the registrant’s most recently completed second quarter, the registrant’s common stock was not publicly traded. The registrant's common stock, $0.01 par value per share, began trading on The Nasdaq Global Select Market (“Nasdaq”) on February 6, 2020. As of February 27, 2020, the aggregate market value of the registrant’s common stock held by non-affiliates was approximately $2,001.7 million (based upon the closing sale price of the common stock on that date on Nasdaq). For purposes of this computation, shares of the registrant’s common stock held by affiliates, including executive officers, directors and certain holders known to the registrant, have been excluded.
As of February 27, 2020, the registrant had outstanding 348,580,422 shares of common stock.
DOCUMENTS INCORPORATED BY REFERENCE
No items are incorporated by reference into this Annual Report on Form 10-K.
PPD, INC.
ANNUAL REPORT ON FORM 10-K
FOR FISCAL YEAR ENDED DECEMBER 31, 2019
TABLE OF CONTENTS
Item | Page | |
PART I | ||
1. | Business | |
1A. | Risk Factors | |
1B. | Unresolved Staff Comments | |
2. | Properties | |
3. | Legal Proceedings | |
4. | Mine Safety Disclosures | |
PART II | ||
5. | Market for Registrant’s Common Equity, Related Stockholder Matters and Issuer Purchases of Equity Securities | |
6. | Selected Financial Data | |
7. | Management’s Discussion and Analysis of Financial Condition and Results of Operations | |
7A. | Quantitative and Qualitative Disclosures About Market Risk | |
8. | Financial Statements and Supplementary Data | |
9. | Changes in and Disagreements With Accountants on Accounting and Financial Disclosure | |
9A. | Controls and Procedures | |
9B. | Other Information | |
PART III | ||
10. | Directors and Executive Officers of the Registrant and Corporate Governance | |
11. | Executive Compensation | |
12. | Security Ownership of Certain Beneficial Owners and Management and Related Stockholder Matters | |
13. | Certain Relationships and Related Transactions, and Director Independence | |
14. | Principal Accountant Fees and Services | |
PART IV | ||
15. | Exhibits and Financial Statement Schedules | |
Exhibit Index | ||
16. | Form 10-K Summary | |
Signatures | ||
2
FORWARD-LOOKING STATEMENTS
This Annual Report on Form 10-K contains forward-looking statements within the meaning of Section 27A of the Securities Act of 1933, as amended (the “Securities Act”), and Section 21E of the Securities Exchange Act of 1934, as amended (the “Exchange Act”). Such forward-looking statements reflect, among other things, our current expectations and anticipated results of operations, all of which are subject to known and unknown risks, uncertainties and other factors that may cause our actual results, performance or achievements, market trends, or industry results to differ materially from those expressed or implied by such forward-looking statements. Therefore, any statements contained herein that are not statements of historical fact may be forward-looking statements and should be evaluated as such. Without limiting the foregoing, the words “anticipate,” “expect,” “suggest,” “plan,” “believe,” “intend,” “project,” “forecast,” “estimates,” “targets,” “projections,” “should,” “could,” “would,” “may,” “might,” “will,” and the negative thereof and similar words and expressions are intended to identify forward-looking statements. These forward-looking statements are subject to a number of risks, uncertainties and assumptions, including those described in “Risk Factors” in Part I, Item 1A of this report. Unless legally required, we assume no obligation to update any such forward-looking information to reflect actual results or changes in the factors affecting such forward-looking information.
When we use the terms “PPD,” the “Company,” “we,” “us” or “our” in this Annual Report on Form 10-K, we mean PPD, Inc. and its subsidiaries on a consolidated basis, unless the context indicates otherwise.
WEBSITE AND SOCIAL MEDIA DISCLOSURE
We use our website (www.ppdi.com) and our corporate Facebook, LinkedIn, and Twitter accounts as channels of distribution of Company information. The information we post through these channels may be deemed material. Accordingly, investors should monitor these channels, in addition to following our press releases, Securities and Exchange Commission (the “SEC”) filings and public conference calls and webcasts. The contents of our website and social media channels are not, however, a part of this Annual Report on Form 10-K.
TRADEMARKS AND SERVICE MARKS
All trademarks, trade names, product names, graphics and logos of PPD contained herein are trademarks or registered trademarks of PPD, Inc. or its subsidiaries, as applicable, in the United States and/or other countries. All other party trademarks, trade names, product names, graphics and logos contained herein are the property of their respective owners. The use or display of other parties’ trademarks, trade names, product names, graphics or logos is not intended to imply, and should not be construed to imply, a relationship with, or endorsement or sponsorship of PPD, Inc. or its subsidiaries by such other party. Solely for convenience, we may refer to trademarks in this Annual Report on Form 10-K without the TM and ® symbols. Such references are not intended to indicate, in any way, that we will not assert, to the fullest extent permitted by law, our rights to our trademarks. Other trademarks appearing in this Annual Report on Form 10-K are the property of their respective owners.
INDUSTRY AND MARKET DATA
Market data used throughout this Annual Report on Form 10-K is based on management’s knowledge of the industry and the good faith estimates of management. All of management’s estimates presented herein are based on industry sources, including analyst reports and management’s knowledge. We also relied, to the extent available, upon management’s review of independent industry surveys and publications prepared by a number of sources and other publicly available information. We are responsible for all of the disclosure in this Annual Report on Form 10-K and while we believe that each of the publications, studies and surveys used throughout this Annual Report on Form 10-K are prepared by reputable sources and are generally reliable, we have not independently verified market and industry data from third-party sources. All of the market data used in this Annual Report on Form 10-K involves a number of assumptions and limitations and therefore is inherently uncertain and imprecise, and you are cautioned not to give undue weight to such estimates. Projections, assumptions and estimates of our future performance and the future performance of the industry in which we operate are necessarily subject to a high degree of uncertainty and risk due to a variety of factors, including those described in “Risk Factors” in Part I, Item 1A of this Annual Report on Form 10-K and elsewhere in this Annual Report on Form 10-K. These and other factors could cause results to differ materially from those expressed in our estimates and beliefs and in the estimates prepared by independent parties.
3
Part I
Item 1. Business
Our Company
We are a leading provider of drug development services to the biopharmaceutical industry, focused on helping our customers bring their new medicines to patients around the world. We have been in the drug development services business for more than 30 years, providing a comprehensive suite of clinical development and laboratory services to pharmaceutical, biotechnology, medical device and government organizations, as well as other industry participants. Over that time, we have developed a track record of consistent quality, delivery and continuous innovation that has enabled us to grow faster than our underlying market over the past five years and deliver strong financial results. In 2019, we served all of the top 50 biopharmaceutical companies in the world, as ranked by 2018 research and development (“R&D”) spending, and, in 2018, were involved in 66 drug approvals. We also participated in the development of all of 2018’s top ten selling drugs, as ranked by 2018 revenue. Since 2014, we have also worked with over 300 companies in the growing biotechnology sector through our PPD Biotech model, which was built specifically to serve the unique needs of this customer segment. We have two reportable segments, Clinical Development Services and Laboratory Services.
Our purpose and mission are to improve health by helping our customers deliver life-changing therapies to patients. We pursue our purpose and mission through our clinical development and laboratory services and our strategy to bend the cost and time curve of drug development and optimize value for our customers.
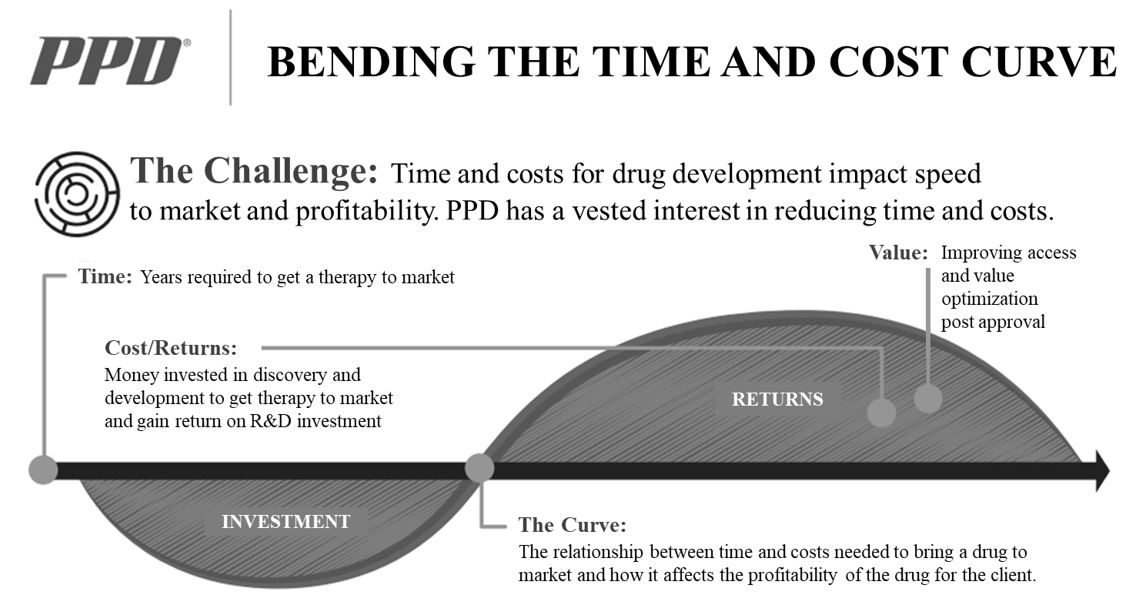
Our customers benefit from accelerated time to market because it results in lengthened periods of market exclusivity, and our real-world evidence solutions support the superior efficacy and health economics of their novel therapies. We believe our medical, scientific and drug development expertise, along with our innovative technologies and knowledge of global regulatory requirements help our customers accelerate the development of safe and effective therapeutics and maximize returns on their R&D investments.
Our service offerings include both clinical development and laboratory services. Our clinical development services include all phases of development (i.e., Phase I-IV), peri- and post-approval and site and patient access services. Our laboratory services offer a range of high-value, advanced testing services, including bioanalytical, biomarker, vaccine, good manufacturing practice (“GMP”) and central laboratory services. We have deep experience across a broad range of rapidly growing areas of drug development and engage with customers through a variety of commercial models, including both full-service and functional service partnerships and other offerings tailored to address the specific needs of our customers.
We have developed significant expertise in the design and execution of complex global clinical trials, a result of conducting studies on global, national, regional and local levels across a wide spectrum of therapeutic areas for more than 30 years and in over 100 countries. Our customers entrust us to design, execute and deliver results on some of the most critical aspects of the drug development process for the key assets in their pipelines.
4
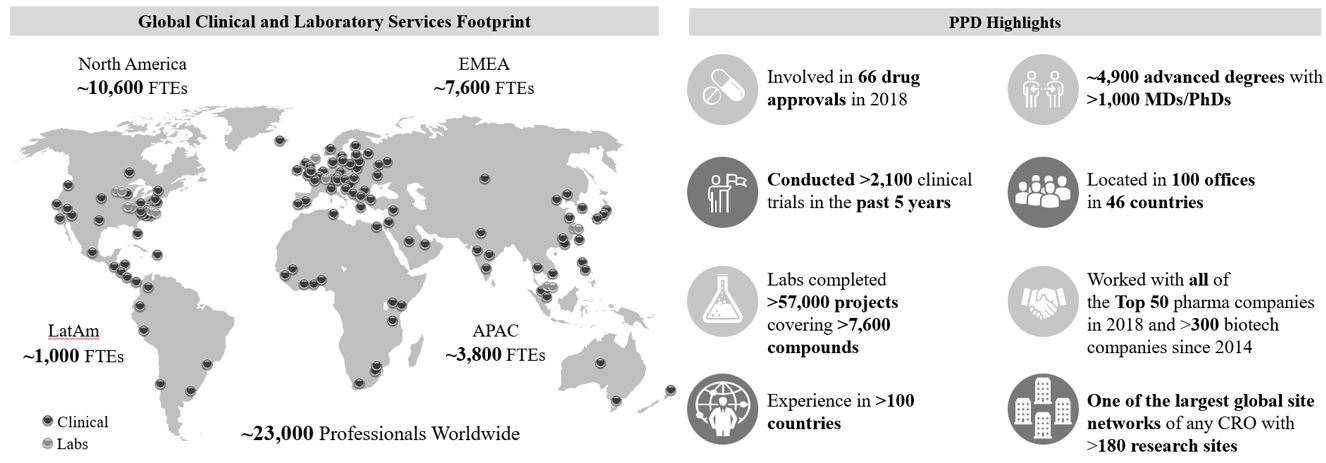
As of December 31, 2019, we had more than 23,000 employees worldwide, approximately 5,100 of whom hold advanced degrees, and we had 100 offices in 46 countries. Over the last five years, we have conducted more than 2,100 clinical trials, and our laboratory scientists have completed more than 57,000 pharmaceutical development projects and worked with more than 7,600 compounds. Among other elements, our ability to successfully assess feasibility in the context of study design, recruit for increasingly specialized patient populations and devise optimal regulatory strategies is essential to our competitive advantage in winning new studies.
Our deep understanding of the drug development process has allowed us to effectively invest in and evolve our service offerings to meet the needs of our customers. We have developed a differentiated site and patient access capability, built a delivery model for biotechnology companies, invested in advanced laboratory testing, broadened the scope of our peri- and post-approval services and expanded our global presence. Specific examples of some of our recent initiatives and investments include:
• | Innovative site and patient access. We have developed differentiated capabilities that meaningfully address two of the biggest challenges that our customers face: patient enrollment and site performance. Through our Accelerated Enrollment Solutions (“AES”) delivery model, we focus on meeting the unique feasibility, site start-up and patient recruitment needs of each study. We address these complex needs by leveraging (i) large data sets, including identified and consented personal data on 100 million U.S. households and health information on approximately 20 million previously screened study candidates and (ii) our global site network of over 180 research sites across five continents and 17 countries. |
• | Purpose-built PPD Biotech. Over the past five years, we pioneered the development, implementation and scaling of a purpose-built, customer-facing delivery model to address the specific needs of the increasingly relevant biotechnology sector. Our model is founded on (i) dedicating commercial, medical, operational and functional leaders to our biotechnology customers and (ii) allocating the right mix of experienced resources to drive their drug development programs. |
• | Advanced laboratory services. Over the last five years, in response to strong customer demand for our services (over $1 billion of laboratory services in our backlog as of December 31, 2019), we have invested over $200 million to significantly increase the size and operating capacity of our laboratory facilities, acquire innovative laboratory equipment, expand our test menus and build out differentiated IT systems and laboratory automation. |
• | Innovative peri-and post-approval studies. Our customers increasingly require evidence-based solutions to help them demonstrate the real-world effectiveness, safety and value of newly approved therapies, which are essential to optimize the commercial potential of their products. We have significantly expanded our capabilities in this growing area, providing our customers with service offerings in areas such as (i) market access, (ii) health economics modeling and (iii) patient-centered research. |
• | Targeted geographic expansion. We maintain a strong presence of experienced professionals in all key regions and countries necessary to support our customers’ global drug development programs. In response to the growing importance of conducting global studies that include cohorts in Japan and China and the opportunity to serve local customers in those geographies with their global drug development needs, we have significantly increased the size and scale of our operations in those countries while maintaining the quality and operating standards demanded by our customers and regulatory authorities alike. |
We believe these investments in our businesses and our innovative solutions have enhanced the strength of our clinical development and laboratory services and further differentiated our offerings from other clinical development organizations, providing us with meaningful competitive advantages and growth opportunities.
Our Industry
The drug development process involves the testing of drug candidates to demonstrate safety and efficacy in order to meet regulatory requirements. Developing new drugs for the treatment of human disease is an extremely expensive, complex, high-risk and time-consuming process. It is estimated that bringing a new drug or medical device to market can take up to 15 years and cost $2.5 billion or more.
5
The Drug Development Process
The drug development process consists of two stages: pre-clinical and clinical. In the pre-clinical stage, the new drug candidate is tested in vitro and in vivo in animals, generally over a one- to three-year period, to assess and optimize potential use in humans. After successful pre-clinical testing and receipt of required regulatory authorizations, the new drug candidate can be advanced to the clinical development stage, which involves testing in humans. As we do not participate in the pre-clinical market, the following discussion describes the clinical drug development process in the context of the U.S. regulatory framework. The clinical drug development process and regulatory frameworks in other countries can vary from the United States framework, but in many ways are substantially similar.
Prior to commencing human clinical trials in the United States, a company must file with the U.S. Food and Drug Administration (“FDA”) an investigational new drug application (“IND”) containing information about animal toxicity and distribution studies, manufacturing and control data, stability data, a clinical development plan and a study protocol for the initial proposed clinical trial. The design of these trials, described in the study protocols, is essential to the success of the drug development effort. The studies are designed to generate the type of clinical data that will support the development of the drug candidate and, ultimately, potentially support regulatory approval. An IND must become effective in order for human clinical trials to begin. If the FDA does not place the IND on clinical hold within 30 days after an IND filing, human clinical trials may begin upon expiration of the 30-day period or upon earlier notification by the FDA that the clinical investigations may begin.
The clinical stage is the most time-consuming and expensive part of the drug development process. During the clinical stage, the drug candidate undergoes a series of tests in humans, including healthy volunteers, as well as participants with the targeted disease or condition. Human trials usually start on a small scale to assess safety, efficacy and dosage (Phase I-II) and then expand to larger trials (Phase III) to test efficacy and safety in the target population. These trials are generally conducted in the following sequential phases, which may overlap or be combined:
• | Phase I trials involve testing the drug candidate on a limited number of healthy individuals, typically 20 to 80 people, to determine the drug candidate’s basic safety data, including tolerance, absorption, metabolism and excretion. This phase lasts an average of six months to one year. In some therapeutic areas such as oncology, where cytotoxic compounds are being investigated, it is sometimes necessary to run Phase I trials in diagnosed patients instead of healthy individuals. |
• | Phase II trials involve testing a small number of volunteer participants, typically 100 to 200 people, who suffer from the targeted disease or condition, to assess the drug candidate’s effectiveness and how different doses work. This phase lasts an average of one to two years. |
• | Phase III trials involve testing large numbers of participants, typically several hundred to several thousand people, to evaluate efficacy on a large scale, as well as long-term safety. These trials involve numerous sites and generally last two to three years, but can be shorter or longer. |
• | Phase IV or post-approval clinical trials involve monitoring or verifying the risks and benefits of a drug product. |
• | Real-world data and evidence studies, meaning data and evidence gathered outside of the context of clinical trials, are often used to assess usage, potential benefits or risks, safety, effectiveness and health economics to achieve successful market access and product uptake. |
Our Markets
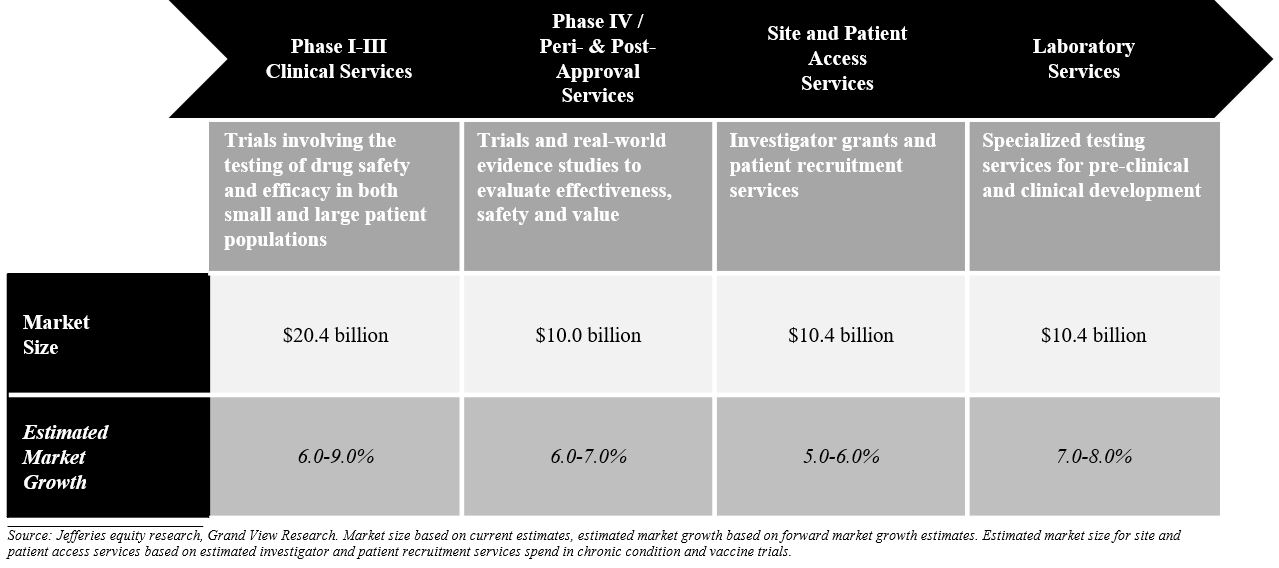
As of December 31, 2019, our total addressable market was greater than $51 billion, consisting of clinical development services, including peri- and post-approval services and site and patient enrollment services, and laboratory services. We believe the clinical development services (Phase I–III), or clinical research organization (“CRO”), market to be an approximately $20.4 billion market as of December 31, 2019 and expect this market to continue to grow at an average annual growth rate of approximately 6-9%. We have expanded our capabilities in the $10.0 billion Phase IV and peri- and post-approval services market, which we anticipate will grow at an annual growth rate of approximately 6-7%. Our AES delivery model has allowed us to participate in the economics and growth of the investigator and patient recruitment market that otherwise would represent pass-through revenues, as it does for most other CROs. We expect this to be an approximately $10.4 billion market and anticipate it to grow at an annual growth rate of approximately 5-6%. In addition to competing in the CRO market, through our strategic investments we have strengthened our position in the laboratory services market and expanded our addressable market to include the markets for investigator and patient recruitment and peri- and post-approval services. In laboratory services, in addition to the $4.3 billion central laboratory market, we compete in the $6.0 billion market for advanced laboratory testing, which we anticipate will grow at an annual growth rate of 7-8%.
6
We believe there are five key trends affecting our end markets that will create increasing demand for our offering of services:
• | Growth in R&D spending. Biopharmaceutical companies must continually invest in drug development in order to create innovative new therapies or use existing drugs to treat new indications, to address unmet medical needs and to replace lost revenues when their currently marketed drugs lose patent protection. From 2008 to 2018, R&D spending increased approximately 3.3% annually, driven by long-term secular fundamentals including a 30% increase in active INDs and an approximately 80% increase in average annual FDA approvals from 2008 to 2018. |
• | Increased levels of outsourcing by biopharmaceutical companies. As biopharmaceutical companies continue to seek ways to reduce clinical development costs and focus resources on core competencies, we believe they will continue to increase the amount of clinical development work they outsource to CROs. Outsourcing penetration as a percentage of total development spending by biopharmaceutical companies increased from approximately 36% in 2007 to approximately 49% in 2018. Drivers of increased outsourcing include: |
• | biopharmaceutical companies’ desire for flexible cost structures and focus on core competencies; |
• | experience, expertise, capability and value provided by CROs; |
• | difficulty conducting large, global and complex clinical trials required by the current regulatory environment; |
• | ability to generate real-world data and evidence; and |
• | desire to address declining R&D productivity by utilizing more efficient means of conducting clinical trials. |
• | Increased complexity in clinical development. Clinical trials continue to increase in complexity due to a confluence of factors including, but not limited to, (i) new therapeutic modalities, (ii) the collection of more clinical trial endpoints, (iii) more specific patient inclusion/exclusion criteria, (iv) ever-changing regulatory requirements and (v) an expansion of evidence generation methods, such as electronic patient-reported outcomes and virtual clinical trials. All of these factors result in more complex trial design, challenges in enrolling protocol-eligible patients, longer duration of clinical trials and greater overall clinical trial cost. As a result, we expect biopharmaceutical companies to increasingly seek partners that have the experience and expertise to conduct cost-effective clinical studies. In particular, we believe large CROs who possess scale, geographic reach and differentiated capabilities to manage the complexity of clinical trials will continue to grow at a higher rate and take market share versus the overall industry. |
7
• | Biotechnology sector growth. The U.S. biotechnology sector has grown rapidly over the last decade and has emerged as a key customer segment for the drug development services industry. The rate of biotechnology companies’ R&D spending growth has been higher than that of traditional pharmaceutical companies in recent years, and we believe that over the last five years, innovative biotechnology companies have accounted for approximately 40% of new drug approvals (“NDAs”). This has largely been fueled by a robust funding environment, both public and private, with over $150 billion of capital raised for biotechnology companies in the last three years. Today, we believe the majority of biotechnology companies have enough cash on hand to fund R&D expenditures for two to three years. Many biotechnology companies are smaller, discovery research-focused organizations that do not find it economically attractive to invest in the infrastructure and personnel necessary to conduct their clinical development programs on their own, and we believe they will continue to rely on CROs, like us, for their global drug development needs. |
• | Increasing importance to prove value of new therapies. As participants in the healthcare industry are increasingly focused on managing costs, biopharmaceutical companies need to find alternatives to align market constituents on the value of their treatments. The ability to perform peri- and post-approval studies to transform real-world data (such as medical claims data or electronic medical records) into real-world evidence provides biopharmaceutical companies a solution to quantify the value of new therapies to market constituents. Real-world data and evidence enable biopharmaceutical companies to develop better therapies and optimize the commercial potential of their new therapies. With increased R&D activity and competition among newly approved therapies in similar indications, we anticipate the continued adoption of real-world data and evidence to demonstrate the value of new medicines. |
Our Competitive Strengths
We believe we are well-positioned to serve the global biopharmaceutical industry in obtaining the approval for, and maximizing the market access and value of, their new medicines. We differentiate ourselves from others in our industry through our competitive strengths, which include:
Leading Drug Development Expertise with Scale and a Long Track Record of Excellence
We are one of the world’s largest providers of clinical development services, with the scale to leverage investments in capabilities and innovative solutions to serve the increasingly complex and diverse needs across our extensive customer base. As of December 31, 2019, we had more than 23,000 employees worldwide and 100 offices in 46 countries, allowing us to offer our customers global infrastructure and deep expertise across a broad range of therapeutic areas and all stages of clinical development.
Through our integrated global platform and workforce, we provide our customers with consistent quality and operating standards worldwide, thereby minimizing risks in, and maintaining the integrity of, the evidence generation process without the need to rely on local sub-contractors or vendors. We have developed our scale, capabilities and track record of quality and innovation over a more than 30-year history, earning us a reputation as a leading global partner to the most sophisticated biopharmaceutical companies. In 2019, for the eighth consecutive year, we were recognized by Life Science Leader magazine for excellence in clinical research. We believe the combination of our scale, expertise, track record and innovative offerings positions us to continue to grow and take market share within the industry.
8
Differentiated Clinical Development Services
Building on our solid foundation, we have invested heavily in recent years to further strengthen our competitive position through differentiated clinical development solutions designed to address our customers’ needs and bend the time and cost curve of their clinical trials. Our key clinical development investments include:
• | Study start-up. We have acquired and embedded leading technologies and tools in our global start-up processes to (i) improve feasibility by helping our customers assess trial viability quickly and effectively and (ii) reduce study start-up timelines. Due to the substantial costs and investments associated with clinical trial starts, our ability to reduce key cycle times to below-industry averages addresses a critical need of our customers. For example, our median cycle time from final protocol received (“FPR”) to first site activated is more than 10% faster than industry benchmark cycle times. Similarly, our median time from FPR to the milestone of 50% of sites activated is more than 10% faster than industry benchmarks. This accelerated site activation, coupled with our clinical operations, has also resulted in significantly improved patient enrollment timelines: FPR to first patient, first visit is more than 10% faster and FPR to 50% patients enrolled is more than 30% faster than benchmarks. |
• | Accelerated Enrollment Solutions: Our AES delivery model aligns the fundamental components of the clinical trial execution process and extends across five continents, 17 countries and over 180 research sites. In the past five years, AES has participated in over 750 studies, including trials conducted by us, our customers and other CROs. Since 2013, we have deployed over $600 million making strategic acquisitions and bringing together complementary capabilities to create a delivery model which would be difficult to replicate. We believe our AES delivery model represents the industry’s largest aggregation of fully identified data on individuals who have provided their consent and indicated an interest in participating, or have participated, in clinical trials. With our AES delivery model, we are able to provide significant flexibility to our customers, giving them the ability to engage us for (i) discrete components of our AES service offerings, (ii) the full suite of AES capabilities or (iii) wholly integrated constructs which combine our AES offerings with our clinical development services. Through this model, we have been able to deliver compelling value propositions to our customers, including: |
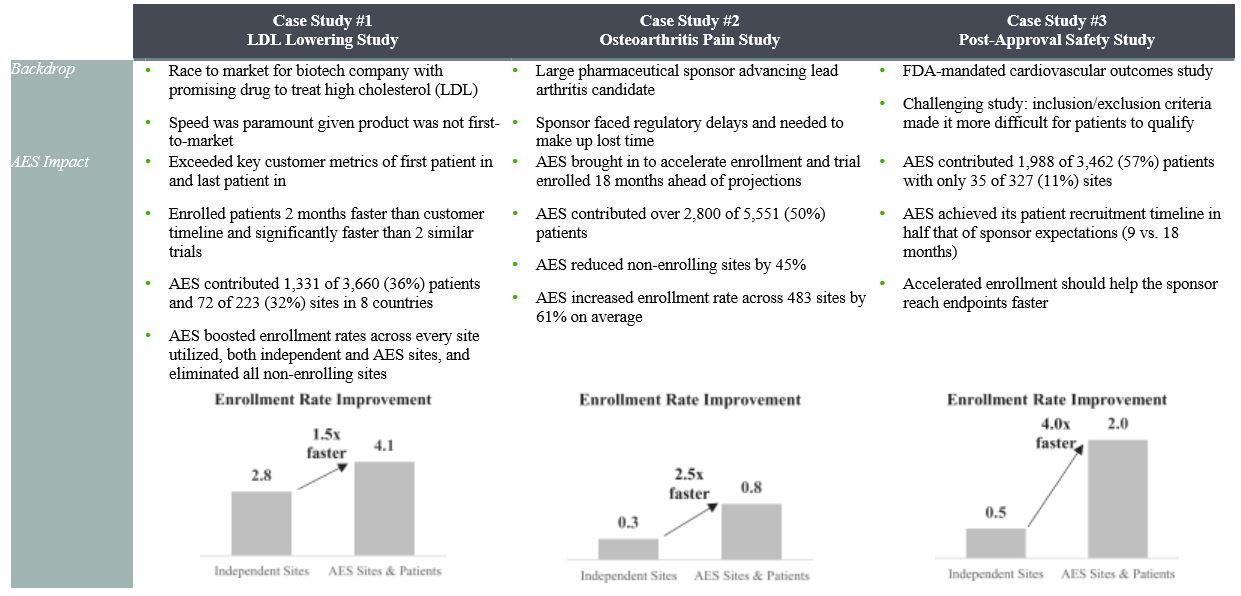
◦ | significant percentages (e.g., 30% - 80%) of their trial enrollment with fewer sites, in less time and under one contract and uniform procedures and quality standards; and |
◦ | significantly faster start-up times and higher enrollment rates than the independent site model. |
9
• | Site monitoring. We have built and implemented a global risk-based monitoring model designed to efficiently focus site monitoring resources on key risks. Driven by an adaptive and intelligent monitoring model powered by real-time data analytics and remote site monitoring, we are able to provide an efficient and cost-effective study monitoring solution focused on the prevention and mitigation of protocol compliance risks in our customers’ clinical development programs. By focusing our on-site monitors on key risks, our differentiated site monitoring solution enables us to reduce our monitors’ time on site, translating to faster and lower-cost clinical trials with better quality oversight. |
• | Peri- and post-approval services. We are a leading provider of real-world research and evidence-based solutions designed to help sponsors support the real-world effectiveness, safety and value of biopharmaceutical and biotechnology products with capabilities in 35 countries. Through this offering, we provide our customers with critical scientific expertise and global operational capabilities to help generate the evidence needed to optimize the market access and commercial potential of their products. As of December 31, 2019, we had over 450 scientists and consultants conducting real-world, patient-centered, health economics, epidemiological and market access research. We specialize in engaging with key market constituents early in the drug development process to create an evidence strategy that will meet the needs of all relevant stakeholders. We develop evidence to demonstrate the safety, effectiveness and value of over 150 drugs and therapies per year across more than 20 countries. We have also contributed to a number of payer submissions, including the reversal of multiple decisions by the U.K.’s National Institute for Health and Care Excellence. |
Comprehensive and Growing Laboratory Services
We own and operate an integrated and scaled suite of laboratory services. We offer a range of high-value, advanced testing services, including bioanalytical, biomarker, vaccines, GMP and central laboratory infrastructure to support R&D. We believe our scientific employee base with advanced degrees provides us with a competitive advantage – of our approximately 480 laboratory services scientists with advanced degrees, approximately 180 have PhDs and approximately 300 have MSs. Since 2015, we have invested an aggregate of over $200 million in capital expenditures to expand and enhance our global laboratory services capabilities and capacity. We believe we are differentiated from other laboratory providers by our global scale and the comprehensiveness of our service offering and focus on servicing the research needs of the biopharmaceutical industry. The breadth of our test menus, efficient technology and instrumentation platforms and global facility footprint allow us to offer a comprehensive set of scientific laboratory services. The ability to integrate patient data from the clinical trial and associated laboratory results has also contributed to increased customer wallet share. Our laboratory facilities have been successfully audited by customers and regulatory authorities over 1,100 times since 2014, and our track record of quality has significant reputational value. We believe we are one of the leading providers in each of the GMP, bioanalytical and central laboratory services sectors as well as in the growing vaccines market. In 2019, for the second time in three years, we were named Best CRO Provider at the World ADC Awards, a recognition of our efforts to help customers advance their antibody drug conjugates (“ADC”) research to develop new anticancer therapies.
Large and Growing Diversified Customer Base
Our leading capabilities are evidenced by the quality, scale and diversity of our customers. Over the past five years, we have provided services to all of the top 50 biopharmaceutical companies in the world, as ranked by 2018 R&D spending, small and mid-size pharmaceutical companies and over 300 biotechnology customers as well as government, academic and non-profit organizations. We have long-standing relationships with our customers as demonstrated by having provided services for a decade or more to each of our top ten customers by revenue for the year ended December 31, 2019. These relationships tend to have larger and longer-term contracts, which provide stability and visibility to our revenues. In addition, our customer base continues to grow and is very diverse, spanning key geographies, therapeutic areas and clinical stages of development. This diversity enables us to continuously develop and refine our expertise and enhance our ability to bend the cost and time curve of drug development and optimize value for our customers. We have also strategically positioned ourselves to benefit from the rapid growth of the biotechnology market through the formation and build-out of PPD Biotech where nearly 80% of our biotechnology awards are for Phase IIb-IV, post proof of concept drug development. As a result of our diversified customer base, no one customer accounted for more than 10% of our 2019 revenue.
10
Experienced, Highly Technical Organization with a Culture of Excellence and Industry-Leading Retention
We are led by an experienced and talented team of individuals who collectively have extensive experience in the CRO and biopharmaceutical industries. Many of our senior leaders previously worked for our biopharmaceutical customers, and as such have first-hand knowledge of the challenges our customers face in today’s clinical development environment. To achieve our goal of delivering best-in-class services to our customers, our management team has built a culture of excellence based on a set of defining principles by which we hire, develop and compensate our talent. The result is a company-wide culture focused on the pursuit of industry leadership, innovation and excellence aimed at our purpose and mission. We believe the technical and therapeutic expertise of our dedicated employees provides us with a competitive advantage—of our more than 23,000 employees as of December 31, 2019, approximately 5,100 hold advanced, masters or equivalent degrees, including over 1,100 MDs and PhDs. As a result, we have industry-shaping domain expertise and thought leadership, including in key areas such as product development strategy, protocol design, outcomes and patient-centered research and health economics. In recent years, we have made significant investments to build capabilities to effectively recruit, train, develop and retain talented individuals and teams. Our consistent focus on talent and culture has contributed to both overall retention and retention in key operational roles, such as project managers, that is significantly ahead of industry averages. Our low turnover rates in key operational roles provides our customers consistency in their study teams and is an important differentiator for us. For example, our project manager turnover rates have ranged from 8.9% in 2017 to 8.0% in 2019, which we believe is lower than industry averages. Our investment in these areas has been recognized by industry publications. In 2018, for the eighth consecutive year, we received honors from Training magazine for our employee training and development programs while Forbes magazine named us to their list of America’s Best Employers in the large company category in 2018 and 2019.
Disciplined Operational and Financial Approach
We have strategically oriented our business towards the largest and highest growth areas of the drug development services market, including key therapeutic areas, the biotechnology end market and peri- and post-approval services, in order to position ourselves to win high value-add business. Our operating model is focused on providing our customers with a mix of full-service contracts and select functional service provider (“FSP”) commercial arrangements in differentiated value-add areas. We have also leveraged our track record of operational discipline and expertise around contract pricing and backlog policy to create a highly visible and stable revenue base. Furthermore, we have focused our operations on key initiatives, including optimal utilization of billable staff and prudent cost management. Our positive historical operating results have allowed us to deploy significant capital into our business through strategic investments and acquisitions while also returning capital to our stockholders. We believe our strong financial profile demonstrates the quality and efficiency of our operating model and positions us for continued growth.
Our Growth Strategy
The key elements of our growth strategy to help our customers bend the cost and time curve of drug development include:
Further Strengthen Our Offerings in Existing and New Markets
Our global footprint, scale, integrated systems and deep scientific expertise enable us to conduct complex, multi-center clinical trials simultaneously throughout the world. We have a well-established presence in all of the major biopharmaceutical markets, including the United States, Europe and Asia, with nearly 3,800 professionals in the latter region and scale and differentiation in Japan and China, two countries of increasingly strategic importance for drug development programs. As a result, we continue to gain share within the CRO market as biopharmaceutical customers continue to look for strategic partners with global scale and service offerings to conduct complex global trials. We plan to further strengthen our leadership position by investing in geographies that are critical to address the needs of our customers and their drug development pipelines.
Expand Leading Therapeutic Expertise in Existing and Novel Areas
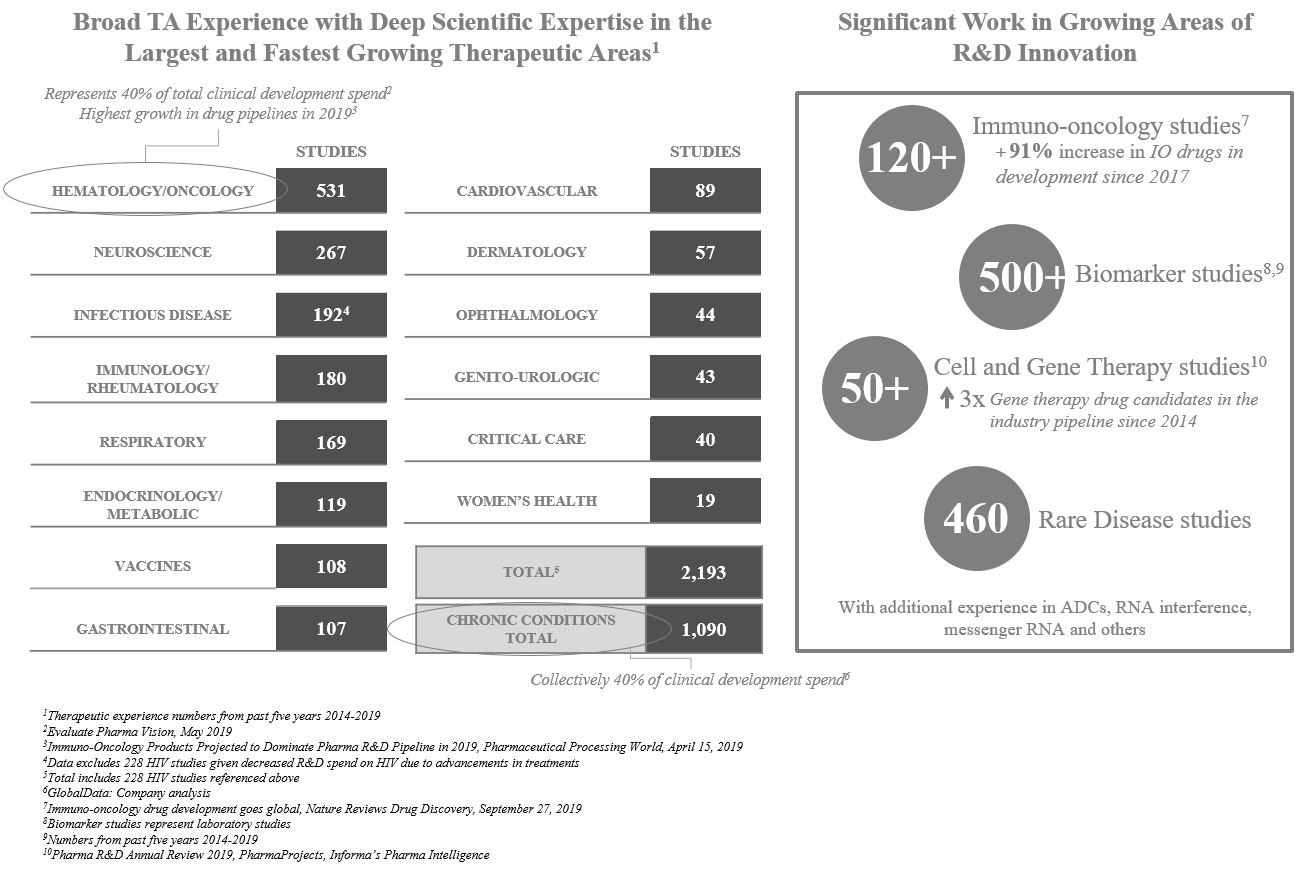
We have amassed deep scientific expertise in the largest and fastest growing therapeutic areas. In addition, we have developed specific capabilities in disciplines that cross therapeutic areas, such as rare diseases, vaccines and a broad array of chronic conditions. Over 75% of total R&D spend on late stage clinical trials conducted from 2015 through 2018 related to hematology/oncology and chronic conditions. Over the last five years, we have performed a significant amount of work in both of these areas, having provided services in over 500 hematology/oncology studies and over 1,000 chronic condition studies in the last five years.
11
We are also conducting significant work in growing areas of R&D innovation, such as immuno-oncology, which has experienced a 91% increase in the number of drugs in development since 2017, and cell and gene therapy, for which the industry pipeline of drugs has more than tripled since 2014. In addition, customers are hiring us to run their programs in other areas of innovative R&D, such as ADC’s, ribonucleic acid (“RNA”) interference, messenger RNA and others. We intend to continue investing in our scientific and operational capabilities to further strengthen our leadership position in key therapeutic areas and position ourselves to take advantage of the evolving trends in the biopharmaceutical industry.
Build Upon Our Existing Dedicated Biotech Offering
Over the last five years, innovative biotechnology companies focused on new and complex therapies have accounted for approximately 40% of NDAs and have driven significant growth in related R&D spending. Large biopharmaceutical companies have had to fill gaps in their pipelines through strategic collaborations with, and acquisitions of, biotechnology companies, further increasing growth in the number of innovative, complex and global clinical trials. We were at the forefront of realizing these trends and formed our dedicated PPD Biotech model in 2014. Since that time, we have more than doubled PPD Biotech annual authorizations and grown revenue by over 80%. We continue to leverage our sophisticated customer development activities within PPD Biotech, which include early identification of novel molecules and extensive pre-trial consultative advisory engagement with customers, to optimally position ourselves to win new business. PPD Biotech’s success is evidenced by the increase in our win rates from biotechnology companies whereby we have increased our average win rate from approximately 26% in 2016 to over 40% in 2019. We believe that our track record of serving biotechnology companies through our PPD Biotech model has earned us a reputation as the strategic partner of choice. Since the beginning of 2014, we have worked with some of the most innovative companies to help bring disease-modifying therapies to the market for patients. We believe our differentiated offering will enable us to continue to capture share within the biotechnology market.
12
Increase Use of Our Innovative Site Network and Patient Enrollment Platform
Through our AES delivery model, we have developed an approach to directly serve our customers’ needs by addressing patient enrollment and site performance challenges, which are two of the biggest challenges our customers face in clinical development. We believe our integrated strategy of using technology and identified and consented data, our global site network and support for leading independent sites, is the ideal approach to serving our customers. To date, AES has played a critical role in completing some of the most important and complex clinical trials for our customers. We plan to continue to build out our AES capabilities and further strengthen the value propositions we offer and deliver to our customers through this differentiated model.
In addition to providing us with a competitively advantaged asset, our AES delivery model is financially attractive as it allows us to participate in the economics and growth of the market for investigator and patient recruitment services that otherwise would represent pass-through revenues, as is the case for most other CROs.
Capitalize on our Growing Laboratory Segment
Our laboratory services offering is focused on the high-growth, innovative segment of laboratory services through its diverse range of high-value, advanced testing services. As an example, we have developed a significant and growing number of assays to address the testing needs of gene therapy. Our Laboratory Services segment represents approximately 19.0% of our 2019 total direct revenues and increased approximately 19.3% for the year ended December 31, 2019 as compared to the same period in 2018. It also affords us significant operating leverage and diversification, and provides higher backlog visibility and related conversion rates. Our Laboratory Services segment allows us to provide integrated offerings to customers that need both clinical development and laboratory services.
Continue to Invest in Innovation
We have consistently been and are committed to spending our time and resources on adding to and improving on our capabilities and service offerings. We assess the need to add new and innovative capabilities to reduce the cost and time required to generate evidence for our customers’ product candidates. We believe that the biopharmaceutical industry is constantly evolving and we are focused on evaluating opportunities in a disciplined manner that is both capital efficient and flexible in approach. We are adept at successfully identifying and executing on acquisitions, joint ventures and strategic venture investments to pursue and amplify nascent technologies and capabilities for our customers’ benefit, as evidenced by our investments in Science 37, Inc. and Medable, Inc.
Our Services
We are a leading provider of drug development services to the biopharmaceutical industry, offering comprehensive, integrated clinical development and laboratory services to our customers. We provide our services through our Clinical Development Services and Laboratory Services segments. Within each segment, we offer numerous services and solutions for our customers, and across segments our offerings are complementary so that customers may optimize their development programs and maximize value and outcomes by accessing our full suite of offerings.
Clinical Development Services
Our Clinical Development Services offerings span the lifecycle of clinical product development and include:
Product development and consulting services. We specialize in developing integrated product development strategies that provide biopharmaceutical companies with interdisciplinary preclinical, chemistry, manufacturing and controls, clinical and regulatory road maps for the development and marketing of their products and product candidates through the global product life cycle. Our services are designed to speed our customers’ product candidates to market with reduced operational risk and increased commercial potential. Our team of physicians, scientists, regulatory professionals and biostatisticians with pharmaceutical expertise offers specialized guidance across all major therapeutic areas, including oncology, cardiovascular disease and critical care, neurology and psychiatry, infectious diseases, rheumatology and metabolic diseases and across a range of specialized disciplines, including advanced therapies, biosimilars, pediatrics and rare diseases.
Early development services. We provide comprehensive support to early clinical development programs, including Phase I trials. We conduct early-phase studies at our 185-bed clinic in Austin, Texas for healthy volunteer studies, our 24-bed hospital-adjacent facility in Las Vegas, Nevada for both healthy and patient volunteer studies and our 52-bed hospital-adjacent facility in Orlando, Florida for healthy volunteer studies. Our Orlando facility also has two ten-bed intensive treatment rooms. We complement these Phase I units with a global network of affiliated clinical trial sites which provide access to numerous special populations and disease indications and a fully integrated early development services team providing streamlined program management, clinical monitoring, data management, biostatistics, clinical pharmacology, medical writing, regulatory and pharmacovigilance support. We have particular experience in the conduct of first in human studies and have specialized capabilities for flow cytometry measurement, allowing rapid measurement of cell surface biomarkers and conducting glucose clamp and other endocrinology and metabolic studies.
13
Phases II-IV clinical trial management. We provide full service protocol management for Phase II-IV clinical research studies for investigational new drugs, biologics and medical devices. The core of our Clinical Development Services offering is a comprehensive global suite of services for Phase II-IV clinical trials. These services include:
• | Protocol design; |
• | Clinical trial strategic feasibility and investigator site selection; |
• | Project management; |
• | Site study startup activities; |
• | Clinical monitoring and data capture; |
• | Data management; |
• | Biostatistics; |
• | Safety medical monitoring/pharmacovigilance; |
• | Regulatory affairs; |
• | Medical writing; |
• | Global clinical supplies – including depots in Kiev, Ukraine; Moscow, Russia; Johannesburg, South Africa; and Athlone, Ireland; |
• | eClinical services; |
• | Quality assurance; and |
• | Virtual and digitally-enabled solutions. |
We provide these services under a variety of outsourcing models, including the traditional full-service model in which we provide all or substantially all of these services to our customers by trial or asset. We also offer our services through a FSP model in which we provide specific services by function ranging from staff augmentation to functional services across trials, globally or by region. We are able to provide custom-built offerings with tailored services that are flexible and innovative to meet the specific needs of our customers.
In addition to managing trials for biopharmaceutical and biotechnology customers, we also provide clinical trial services to the U.S. government, including the National Institute of Allergy and Infectious Diseases (“NIAID”) under the National Institute of Health. We provide support to the NIAID Division of AIDS, including monitoring services at domestic and international sites, laboratory audits, Good Laboratory Practice (“GLP”) training and quality management, biostatistics and data management. We also support other U.S. government research priorities, such as developing a vaccine for the Zika virus, through subcontracts with other U.S. government contractors.
We have extensive expertise and experience in numerous therapeutic areas, including oncology/hematology, metabolic/endocrine, neuroscience, pediatric, cardiovascular, analgesia, gastroenterology, rare diseases, chronic diseases, urology and vaccines.
Accelerated Enrollment Solutions. We believe our AES delivery model provides the largest global dedicated site network, extending across five continents, 17 countries and over 180 research sites combined with the industry’s largest aggregation of fully identified and consented data on individuals interested or having participated in clinical trials. Through AES, we offer services to replace or complement the traditional site selection model, focusing on maximizing patient delivery through efficient and predictive centralized recruitment, having the ability to provide patient enrollment at significantly higher rates than the independent site model. Our SynexusPlus offering is an adaptable solution that allows us to meet customers’ needs, including more patients per site, faster startup and reduction in the number of sites or enrollment completion within a specific timeframe, all under a results-based single-price-per-patient model. SynexusPlus may be combined with our core global clinical trial management services to create PatientAdvantage, a fully outsourced trial solution that is designed to offer patient enrollment and budget certainty, as well as speed and cost savings, through streamlined contracting terms, capitated budget constructs, fewer sites and reduced recruiting time.
14
Peri- and post-approval services. We are a leading provider of real-world research and evidence-based solutions to demonstrate the real-world effectiveness, safety and value of biopharmaceutical and biotechnology products with capabilities in 35 countries and, since 2015, have invested over $200 million to enhance our peri- and post-approval services. Through this offering, we provide our customers with critical scientific expertise and global operational capabilities to help generate the evidence needed to optimize the market access and commercial potential of their products. As of December 31, 2019, we had over 450 scientists and consultants conducting real-world, patient-centered, health economics, epidemiological and market access research. We provide our customers with critical scientific expertise and insight across the development continuum of a product, from early development through loss of exclusivity, with a primary focus on demonstrating the real-world effectiveness, safety and value of treatments. We specialize in engaging with key market constituents early in the development process to create an evidence strategy that will meet the needs of all relevant stakeholders. We develop evidence to demonstrate the safety, effectiveness and value of over 150 drug therapies per year across more than 20 countries. We have also contributed to a number of payer submissions, including the reversal of multiple decisions by the U.K.’s National Institute for Health and Care Excellence.
Medical communications. We provide industry inbound and outbound peri- and post-approval contact center solutions focused on medical and clinical support to the biopharmaceutical industry. Our multidisciplinary team, consisting of over 800 highly trained health care professionals, including physicians, pharmacists, nurses and life science graduates, provides medical and technical information to our customers’ patients with a focus on compliance, quality and delivery of what we believe to be best-in-class customer experiences. We support full portfolios of marketed products, providing local language expertise as well as a global reach. Live customer question and answering services are provided in multiple languages covering the major markets in which our customers sell their pharmaceutical products from 11 locations in North America, Latin America, Europe and Asia-Pacific. Using dedicated teams, our programs are customized and flexible to meet each customer’s evolving needs.
Laboratory Services
We own and operate an integrated and scaled suite of laboratory services. We offer a range of high value, advanced testing services, including bioanalytical, biomarker, vaccines, GMP and central laboratory infrastructure to support R&D. Throughout the drug development cycle, our customers benefit from global, comprehensive laboratory services spanning bioanalytical, biomarker, vaccines, GMP and central laboratory. Our laboratory services accelerate drug development for small molecules, biologics and cell and gene therapies which we believe allows customers to make faster decisions about their products. We believe we are one of the leading providers in each of the GMP, bioanalytical and central laboratory services sectors, as well as in the growing vaccines market. In 2019, for the second time in three years, we were named Best CRO Provider at the World ADC Awards, a recognition of our efforts to help customers advance their ADC research to develop new anticancer therapies.
Bioanalytical laboratory services. We provide bioanalytical services through our highly automated locations in Richmond, Virginia and Middleton, Wisconsin that are designed to be compliant with GLPs. Our bioanalytical laboratories analyze drug and metabolite concentrations from biological fluid and tissue samples within preclinical and human clinical studies. Our bioanalytical methods include: liquid chromatography combined with mass spectrometry (“LC-MS”) and high-resolution mass spectrometry, high performance liquid chromatography, ligand-binding, enzyme-linked immunosorbent assay, radioimmunoassay, flow cytometry and cell-based assay support. Our bioanalytical laboratories support the complete service necessary for biologic, small molecule, oligonucleotide and cell and gene therapy development. This includes pharmacokinetic evaluation of the therapeutic agent, immunogenicity testing to determine the presence of antibodies, and cell-based assays to determine the neutralizing antibody effect of the antibodies. We have the proven ability to handle an increasingly diverse range of large molecules, which include therapeutic peptides, monoclonal antibodies and ADC’s, as well as new areas such as glycans and biotransformation.
Biomarker laboratory services. Our biomarker laboratory core facility is located in Richmond, Virginia. The laboratory is closely aligned with both the central laboratories and bioanalytical laboratories to provide customized solutions for biomarker projects. The capabilities include LC-MS, ligand binding, flow cytometry and molecular genomics. Our technologies and applications enable the biomarker laboratory to develop or transfer methods and either perform sample analysis within the biomarker laboratory or transfer validated methods to the central laboratory or Phase I clinic as needed.
Vaccine science services. We perform testing for vaccines in our dedicated facility located in Richmond, Virginia. Our scientists perform immunogenicity testing to evaluate the efficacy of vaccines in inducing cellular and humoral immune responses and employ molecular detection methods, such as polymerase chain reaction testing to detect the absence of pathogens or to characterize attenuated vaccine strains following administration of a vaccine. Our service offering also includes providing dedicated laboratory space to conduct complex proprietary assays in support of multiple vaccine programs.
15
GMP laboratory services. We provide early preclinical development through post-approval testing services and product analysis laboratory services through our locations in Middleton, Wisconsin and Athlone, Ireland that are designed to be compliant with GMPs. Our product analysis services include analytical method development and validation, stability and quality control testing of product and pharmaceutical ingredients and impurities characterization for small molecules and biologics for all dosage forms, as well as analytical testing of biopharmaceuticals, inhalation devices and cell and gene therapies. Our Athlone laboratory offers the advantage of proximity to our growing number of European customers and allows us to conduct release testing of products to be marketed in Europe for our global customers.
Central laboratory services. With facilities in Highland Heights, Kentucky, Brussels, Belgium, Singapore and Shanghai, China, our central laboratories provide highly standardized safety and biomarker testing services with customized results databases for our customers. We focus on providing long-term, large-scale studies where laboratory measurement of clinically relevant endpoints is critical. Our central laboratories utilize the same standard operating procedures and maintain identical instruments in every facility. All of our facilities are College of American Pathologists (“CAP”) accredited, and National Glycohemoglobin Standardization Program (“NGSP”) and Centers of Disease Control and Prevention (“CDC”) lipid standardization survey (“LSP”) certified. All our facilities run the same CAP proficiency tests on a quarterly basis. In addition to these industry quality standards, we run our own unique global laboratory assay standardization survey program monthly on our most common analyses, ensuring continuity and consistency of data at all stages of a clinical project. We also standardize data collection and reporting on a global basis utilizing the same software platform, our Preclarus central laboratory database. This platform provides real-time data and eliminates the need to merge data sets from different regions. Our laboratories provide on-site biorepository services that enable storage and archiving of samples for future testing, including specialized biomarker testing of specific patient populations to speed drug discovery and development efforts. In 2018, we formed a global strategic alliance for pathology and molecular testing solutions with NeoGenomics to provide a fully integrated global pathology and molecular testing solution to our customers, further expanding our central laboratory services related to oncology clinical trial activities.
Customers
Our customers consist predominantly of large biopharmaceutical companies and small to mid-size biotechnology and pharmaceutical companies. We also serve governmental organizations, medical device companies and other industry participants. We participated in the development of all of 2018’s top ten selling drugs, as ranked by 2018 revenue, and, in 2019, we served all of the top 50 biopharmaceutical companies in the world, as ranked by 2018 R&D spending. Since 2014, we have also worked with over 300 companies in the growing biotechnology sector, with no one customer accounting for more than 10% of our revenue in 2019. We seek to meet the individual needs of each of our customers by tailoring our services to address their specific objectives and offering a competitive commercial structure. We customize our offerings based on numerous factors, including the particular therapeutic area, trial type, trial size, study complexity, competitive landscape and unique customer needs. We believe that we are recognized among our customers as a leading provider of drug development services to the biopharmaceutical industry, differentiated on the basis of our expertise, global scale, track record, differentiated service offerings, comprehensive laboratory services and dedicated workforce.
Sales and Marketing
Our approach to sales and marketing to both biopharmaceutical and biotechnology companies involves the coordinated approach of a team of internal scientific, operational and other technical experts as well as our business development team members, building multi-faceted relationships and designing solutions tailored to the specific customer’s pipeline and other particular needs, and often includes members of our senior leadership team. For those large biopharmaceutical customers with which we have, or seek to have, a strategic partnership arrangement, a dedicated strategic account management team supports all aspects of the relationship. For small and mid-size biotechnology and pharmaceutical companies, we developed our PPD Biotech business model which is built specifically to serve the unique needs of this customer segment and is comprised of business development personnel and leaders from our commercial operational, medical and functional groups dedicated to working with customers in this customer segment.
Our Laboratory Services segment has a dedicated business development group that is organized into three separate teams focused on (i) central laboratory services, (ii) bioanalytical, biomarker and vaccines testing and (iii) GMP testing. The group has representatives in North America, Europe and Asia and is further supplemented by a laboratory partnerships group that ensures operational delivery. In addition to calling on biopharmaceutical and biotechnology companies directly, the Laboratory Services segment business development teams coordinate efforts with our other business development teams for customers that are interested in buying services across our segments.
16
Our corporate marketing team supports the activities of our business development staff. Our global marketing initiatives include integrated, multi-channel campaigns designed to help differentiate and promote our expertise and services and strengthen our corporate brand. We provide our perspective on current industry challenges and developments to create an ongoing dialogue with our customers and prospective customers and to promote our scientific expertise, differentiated service offerings, quality, technology and innovation. In support of these efforts, we exhibit, provide speakers, present papers and host customer meetings at key industry events, and publish scientific articles in industry, trade, medical and pharmaceutical journals.
Backlog and Authorizations
Our backlog represents anticipated direct revenue for work not yet completed or performed (i) under signed contracts, letters of intent and, in some cases, awards that are supported by other forms of written communication and (ii) where there is sufficient or reasonable certainty about the customer’s ability and intent to fund and commence the services within six months. Our backlog excludes anticipated third-party pass-through and out-of-pocket revenue.
Backlog and backlog conversion to direct revenue vary from period to period depending upon new authorizations, contract modifications, cancellations and the amount of direct revenue recognized under existing contracts. The weighted-average duration of contracts in our backlog fluctuates from period to period based on the contracts constituting our backlog at any given time. We adjust backlog for foreign currency fluctuations and exclude direct revenue that has been recognized as revenue in our statements of operations.
Although an increase in backlog will generally result in an increase in future direct revenue to be recognized over time (depending on future contract modifications, contract cancellations and other adjustments), an increase in backlog at a particular point in time does not necessarily correspond to an increase in direct revenue during a particular period. The timing and extent to which backlog will result in direct revenue depends on many factors, including the timing of commencement of work, the rate at which we perform services, scope changes, cancellations, delays, receipt of regulatory approvals and the nature, duration, size, complexity and phase of the studies. Our contracts generally have terms ranging from several months to several years. In addition, delayed projects remain in backlog until they are canceled. As a result of these factors, our backlog might not be a reliable indicator of future direct revenue and we might not realize all or any part of the direct revenue from the authorizations in backlog as of any point in time. Our backlog was $7,066.3 million at December 31, 2019 and $6,313.7 million at December 31, 2018.
We add new authorizations to backlog based on the aforementioned criteria for backlog. New authorizations vary from period to period depending on numerous factors, including customer authorization volume, sales performance and overall health of the biopharmaceutical industry, among others. New authorizations have and will continue to vary significantly from quarter to quarter and from year to year. Once work begins, we recognize direct revenue over the life of the contract based on our performance of services under the contract. Our net authorizations were $3,827.3 million, $3,421.0 million, and $2,485.4 million, respectively, for the years ended December 31, 2019, 2018 and 2017.
Competition
The drug development services industry is highly competitive, consisting of hundreds of small, limited-scope service providers and a limited number of large full-service global development companies. While the industry has seen an increasing level of consolidation over the past several years, largely driven by the larger full-service providers, it remains highly fragmented.
Our Clinical Development Services segment competes primarily with a small number of other global, full-service CROs, although we also compete against small and medium-sized niche CROs, in-house R&D departments of biopharmaceutical companies, universities and teaching hospitals. We generally compete on the basis of scientific and therapeutic experience, project team expertise, qualifications and experience, ability to recruit patients, price, quality and the ability to innovate to achieve time and cost savings for our customers, amongst other factors. Our major competitors include IQVIA Holdings, Inc. (“IQVIA”), ICON plc (“ICON”), PAREXEL International Corporation, PRA Health Sciences, Inc. (“PRA Health Sciences”), the Covance Drug Development business of Laboratory Corporation of America Holdings (“Covance”), Syneos Health, Inc. (“Syneos Health”) and Medpace Holdings, Inc.
Our Laboratory Services segment competes primarily with the laboratory businesses of other large CROs, large global laboratory organizations, specialty laboratories and in-house laboratories of biopharmaceutical companies. We generally compete on the basis of testing capability, scientific and therapeutic experience, global footprint, price, quality and speed. Our major competitors include the advanced and central laboratory segments of Laboratory Corporation of America Holdings and Syneos Health, Q2 Solutions, ICON, Eurofins Scientific, WuXi AppTec, BioAgilytix and SGS.
We believe that our competitive position is generally strong and that we are able to effectively compete in both the clinical development and laboratory services markets.
17
Intellectual Property
In the course of conducting our business, we have developed, and continue to develop and use proprietary software, systems, processes, databases and other intellectual property. We seek to protect our proprietary and confidential information and trade secrets through confidentiality agreements with employees, customers and other third parties, as well as administrative and technical safeguards. We rely on patent, copyright and trademark laws, as may be appropriate and applicable, to protect our other intellectual property rights. For example, we have applied for and/or obtained and maintain registration in the United States and other countries for numerous trademarks, including PPD®, PPD® Biotech, PPD® Laboratories and Preclarus®. We also enter into agreements with third-parties for the license and use of their intellectual property, although no one such license is considered to be material to the business as a whole. We do not have any material patents.
Government Regulation
Regulation of Drugs and Biologics
The development, testing, manufacturing, labeling, storage, approval, promotion, marketing, distribution and post-approval monitoring and reporting of pharmaceutical, biological and medical device products are subject to rigorous regulation by numerous governmental authorities in the United States at the federal, state and local level, including the FDA, as well as those of other countries, such as the European Medicines Agency (the “EMA”) in the European Union and the Medicines and Healthcare products Regulatory Agency (the “MHRA”) in the United Kingdom. These regulations apply to our customers and are generally applicable to us when we are providing services to our customers, either as a result of their direct applicability, through a transfer of regulatory obligations from our customers, or as a consequence of acting as local legal representative on behalf of our customers in a particular country or countries. Consequently, we must comply with all relevant laws and regulations in the conduct of our Clinical Development Services and Laboratory Services segments. The following discussion describes the role of the FDA in the clinical drug development process in the United States. Clinical trials conducted outside the United States are subject to the laws and regulations of the country where the trials are conducted. These laws and regulations might not be similar to the laws and regulations administered by the FDA and other laws and regulations regarding the protections of patient safety and privacy and the control of study pharmaceuticals, medical devices or other materials. FDA laws and regulations may apply to clinical studies conducted outside the United States if, for example, such studies are conducted under an IND or offered as support for an IND.
Prior to commencing human clinical trials, a company developing a new drug must file an IND with the FDA. The IND must include information about pre-clinical tests, manufacturing and control data, and a study protocol for the proposed clinical trial of the drug in humans. If the FDA does not object in writing within 30 days after filing the IND becomes effective and the clinical trial may begin. A separate submission to an existing IND must also be made for each successive clinical trial conducted during product development. Each clinical trial must be conducted in accordance with an effective IND.
The study protocol must also be reviewed and approved by an institutional review board/independent ethics committee (“IRB/IEC”) for each institution in which a study is proposed to be conducted and each IRB/IEC may impose additional requirements on the conduct of the study in its institution. IRB/IECs have the authority to review, approve and monitor clinical trials, and clinical trials are subject to oversight by IRB/IECs. The industry standard for the conduct of clinical trials is embodied in the FDA’s regulations for IRB/IECs, investigators and sponsor/monitors, which regulations collectively are termed Good Clinical Practices (“GCP”) by industry, and the GCP guidelines issued by the International Council for Harmonisation of Technical Requirements for Pharmaceuticals for Human Use (“ICH”), which have been agreed upon by industry and regulatory representatives from the United States, the European Union and Japan. GCP requirements address, among other things, IRBs, qualified investigators, informed consent, recordkeeping and reporting. Regulatory authorities enforce GCP requirements through periodic inspections, and violations of GCP requirements could result in enforcement actions including the issuance of warning letters, civil penalties, product recalls, criminal prosecutions or debarment from involvement in the submission of NDAs. Our global standard operating procedures are written in accordance with all applicable FDA, EMA, MHRA, ICH and GCP requirements. This enables our work to be conducted locally, regionally and globally to standards that meet all currently applicable regulatory requirements. We must also maintain reports in compliance with applicable regulatory requirements for each study for auditing by the customer and regulatory authorities.
In order to comply with GCP and other regulations, sponsors of clinical trials must, among other things:
• | comply with specific requirements governing the selection of qualified investigators; |
• | obtain specific written commitments from the investigators; |
• | obtain IRB review and approval of the clinical trial; |
• | verify that appropriate patient informed consent is obtained before the patient participates in a clinical trial; |
• | ensure adverse drug reactions resulting from the administration of a drug or biologic during a clinical trial are medically evaluated and reported in a timely manner; |
18
• | monitor the validity and accuracy of data; |
• | maintain records regarding drug or biologic dispensing and disposition; |
• | instruct investigators and study staff to maintain records and reports; and |
• | permit appropriate governmental authorities access to data for review. |
If a clinical trial is not conducted in accordance with regulatory requirements, the applicable regulatory agency may require that a clinical trial be modified, suspended or terminated, and we or our customers may be subject to a variety of sanctions. For example, violations could result, depending on the nature of the violation and the type of product involved, in the issuance of a warning or untitled letter, suspension or termination of a clinical study, refusal of the FDA to approve clinical trial or marketing applications or withdrawal of such applications, injunction, seizure of investigational products, civil penalties, criminal prosecutions, or debarment from assisting in the submission of new drug applications. IRBs may also suspend or terminate research not conducted in accordance with IRB requirements or that has been associated with unexpected serious harm to subjects.
After receiving IRB/IEC approval, clinical trials usually start on a small scale to assess safety and then expand to larger trials to test both efficacy and safety in the target population. The trials are generally conducted in three phases (Phase I, II and III), which may overlap or be combined, although the FDA may require, or sponsors may voluntarily conduct, a fourth phase of clinical trials (Phase IV) as a condition of approval or to obtain additional data on the product under investigation, respectively. After the successful completion of the first three clinical phases, a company requests approval for marketing its product by submitting an NDA for a drug or a biologics license application (“BLA”) for a biologic product. NDAs/BLAs are a comprehensive, multivolume filings that include, among other things, the results of all preclinical and clinical studies, information about how the product will be manufactured, additional stability data and proposed labeling. The FDA’s review may last from several months to several years. Once the NDA/BLA is approved, the product may be marketed in the United States, subject to any conditions imposed by the FDA as part of its approval. The FDA may require a Risk Evaluation and Mitigation Strategy (“REMS”). REMS may be required by the FDA for certain products where serious safety concerns exist in order to help ensure the benefits of the product outweigh its risks.
Regulation of Testing Facilities
Laboratories such as ours that provide information included in INDs, NDAs, BLAs and other regulatory submissions must conform to regulatory requirements designed to ensure the quality and integrity of the testing process and data. For example, our bioanalytical laboratories follow the GLP requirements adopted by the FDA, the Ministry of Health in the United Kingdom and by similar regulatory authorities in other countries, as applicable. Our product analysis laboratories follow the GMP requirements adopted by the FDA and by similar regulatory authorities in other countries. Both GLPs and GMPs require standardized procedures for all equipment, processes and analytical tests, for recording and reporting data, and for retaining appropriate records. To help ensure compliance with GLPs and GMPs, we have established standard operating procedures, working practice documents and processes, and have quality assurance personnel at our laboratory facilities to audit test data and inspect testing procedures, laboratory equipment and facilities.
In addition, laboratories that analyze human blood or other biological samples for the diagnosis and treatment of study subjects must comply with the Clinical Laboratory Improvement Act (the “CLIA”). The CLIA requires laboratories to meet staffing, proficiency and quality standards, and governs laboratory accreditation, inspection and certification. Our testing facility in Austin, Texas and our central laboratory in Highland Heights, Kentucky are CLIA-certified. A failure to comply with CLIA requirements may expose laboratories to civil and criminal penalties, including fines, imprisonment, and exclusion from federal healthcare programs. Non-compliant laboratories may also have their CLIA certificate suspended, limited, or revoked. These laboratories are also subject to applicable U.S. state laboratory requirements and to accreditation bodies governing their testing and reporting functions, including the CAP, CDC LSP and NGSP. Our central laboratories in Highland Heights, Kentucky, Brussels, Belgium, Singapore and Shanghai, China are all accredited by CAP.
Regulation of Personal Information
We hold confidential personal health and other information relating to persons who have been, are and may in the future be involved in clinical trials or otherwise. The possession, retention, use and disclosure of such information is highly regulated, both in the United States and the other jurisdictions we are subject to, including but not limited to, applicable regulations arising from the Health Insurance Portability and Accountability Act of 1996 (“HIPAA”), as amended by the Health Information Technology for Economic and Clinical Health Act (“HITECH”), and the Privacy, Security and Breach Notification Rules, 45 C.F.R. Parts 160-164, that implement those laws; U.S. state privacy, security and breach notification and healthcare information laws; and the E.U. General Data Protection Directive (the “GDPR”). The GDPR places restrictions on the export of personal data outside the European Union.
19
These regulations govern the use, handling and disclosure of personally identifiable medical information and require the use of standard transactions, privacy and security standards and other administrative simplification provisions by covered entities, which include many healthcare providers, health plans, and healthcare clearinghouses. Although certain of our businesses are subject to HIPAA, we do not consider our service offerings generally to cause us to be subject to HIPAA as a directly covered entity; however, there are extremely limited circumstances where we enter into business associate agreements. However, we endeavor to embrace sound identity protection practices and have implemented standard contractual clauses with our customers, affiliates and vendors to satisfy data export requirements and safeguards regarding the creation, receipt, maintenance and transmission of protected health information. We maintain a global privacy policy and employ dedicated privacy professionals who work closely with our senior executive leadership as part of our efforts to address applicable privacy laws.
Other Regulations
We are also subject to numerous additional national laws, rules and regulations, including those enforced by the following U.S. agencies:
• | Occupational Safety and Health Administration; |
• | Nuclear Regulatory Commission; |
• | Environmental Protection Agency; |
• | Department of Transportation; |
• | International Civil Aviation Organization; |
• | Department of Health and Human Services; and |
• | U.S. Drug Enforcement Administration (the “DEA”). |
Our laboratories registered with the DEA may receive and manage controlled substances for research purposes. The DEA regulates controlled substances under the Controlled Substances Act, the Controlled Substances Import and Export Act and other laws and the regulations that implement such laws. The DEA requirements include obligations related to recordkeeping, security, handling, diversion and disposal of controlled substances. If we fail to comply with the DEA requirements regarding controlled substances, our registration may be suspended or revoked or renewal of our registration may be denied, and we may be subject to civil or criminal penalties, injunctions or other enforcement actions. Our laboratories listed below are registered with the DEA:
• | clinical pharmacology unit in Austin, Texas and Las Vegas, Nevada; |
• | bioanalytical laboratories in Middleton, Wisconsin and Richmond, Virginia; and |
• | GMP laboratory in Middleton, Wisconsin. |
Our laboratory in Athlone, Ireland is registered with the Irish Health Products Regulatory Authority and may receive and manage controlled substances.
We also must comply with other related international, federal, state and local regulations that govern the use, handling, disposal, packaging, shipment and receipt of certain drugs or unknown compounds, chemicals and chemical waste, toxic substances, biohazards and biohazard waste, and radioactive materials and radioactive waste. In order to comply with these regulations, we have established standard operating procedures, and provide appropriate equipment and training to our employees involved in these activities.
Any failure on our part to comply with applicable regulations could result in the termination of ongoing research, the disqualification of data for submission to regulatory authorities, fines and other sanctions, as well as liability to our customers. Furthermore, any issuance of a notice of finding by a governmental authority against either us or our customers, based upon a material violation by us of any applicable regulation, could materially and adversely affect our reputation and business.
Healthcare Reform
In the United States and certain foreign jurisdictions there have been, and we expect there will continue to be, a number of legislative and regulatory changes to the healthcare system that could affect the pharmaceutical industry, which, in turn, could affect our business. In March 2010, the Patient Protection and Affordable Care Act, as amended by the Health Care and Education Reconciliation Act (collectively, the “ACA”), was signed into law. The ACA contains a number of provisions of particular importance to the pharmaceutical industry, including those governing enrollment in federal healthcare programs, reimbursement adjustments and fraud and abuse changes. Additionally, the ACA creates a new Patient-Centered Outcomes Research Institute to oversee, identify priorities in and conduct comparative clinical effectiveness research and establishes a Center for Medicare Innovation at the Centers for Medicare and Medicaid Services to test innovative payment and service delivery models to lower Medicare and Medicaid spending, potentially including prescription drug spending.
20
Since its enactment, there have been judicial and Congressional challenges to certain aspects of the ACA, and we expect there will be additional challenges and amendments to the ACA in the future. For example, in December 2019, the U.S. Court of Appeals for the Fifth Circuit ruled that the ACA’s individual mandate is unconstitutional because the Tax Cuts and Jobs Act modified the individual mandate so that it could no longer constitute a tax and remanded the case to a U.S. district court in Texas to determine if the remainder of the ACA is severable from the individual mandate. Pending review, the ACA remains in effect, but it is unclear at this time what the effect of this decision and subsequent decisions and appeals will have on the ACA and our business. Litigation over the ACA is likely to continue, with unpredictable and uncertain results. Legislative changes have been proposed and adopted since the ACA was enacted, including aggregate reductions of Medicare payments to providers of 2% per fiscal year and reduced payments to several types of Medicare providers. Moreover, there has recently been heightened governmental scrutiny over the manner in which manufacturers set prices for their marketed products, which has resulted in several Congressional inquiries, and proposed and enacted legislation and regulations designed, among other things, to bring more transparency to product pricing, review the relationship between pricing and manufacturer patient programs, and reform government program reimbursement methodologies for drug products. Individual states in the United States have also become increasingly active in implementing regulations designed to control pharmaceutical product pricing, including price or patient reimbursement constraints, discounts, restrictions on certain product access, and marketing cost disclosure and transparency measures, and, in some cases, mechanisms to encourage importation from other countries and bulk purchasing. Furthermore, there has been increased interest by third-party payors and governmental authorities in reference-pricing systems and publication of discounts and list prices. Any of these judicial, legislative or regulatory developments could harm our customers’ businesses, which could cause them to reduce their spending on research and development, which, in turn, could negatively impact our business.
Employees
As of December 31, 2019, we employed more than 23,000 employees. Approximately 54% of our employees are located outside of the United States, primarily in Europe and Asia. Of our staff, approximately 5,100 hold advanced, masters or equivalent degrees. Some of our employees located outside the United States are represented by works councils or labor unions, and/or subject to collective bargaining agreements. We believe that our relations with our employees are generally good.
Indemnification and Insurance
Our business exposes us to potential liability including, but not limited to, potential liability for (i) breach of contract or negligence claims by our customers, (ii) non-compliance with applicable laws and regulations and (iii) third-party claims in connection with our performance of drug development services (for example, patient claims for personal injury). In certain circumstances, we may also be liable for the acts or omissions of others, such as suppliers of goods or services.
We attempt to manage our potential liability to third-parties through contractual protection (such as indemnification and limitation of liability provisions) in our contracts with customers and others, and through insurance. The contractual indemnification provisions vary in scope and generally do not protect us against all potential liabilities, such as liability arising out of our gross negligence or willful misconduct. In addition, in the event that we seek to enforce such an indemnification provision, the indemnifying party may not have sufficient resources to fully satisfy its indemnification obligations or may otherwise not comply with its contractual obligations.
We generally require our customers and other counterparties to maintain adequate insurance, and we currently maintain errors, omissions and professional liability insurance coverage with limits we believe to be appropriate. This insurance provides coverage for vicarious liability due to the negligence of the investigators who contract with us, as well as claims by our customers that a clinical trial was compromised due to an error or omission from us. The coverage provided by such insurance may not be adequate for all claims made and such claims may be contested by applicable insurance carriers.
Available Information
Our website address is www.ppdi.com, and our investor relations website is located at investors.ppdi.com. Information on our website is not incorporated by reference herein. We will make available on our website, free of charge, our Annual Report on Form 10-K, Quarterly Reports on Form 10-Q, Current Reports on Form 8-K and any amendments to those reports filed or furnished pursuant to Section 13(a) or 15(d) of the Exchange Act, as soon as reasonably practicable after we electronically file such material with, or furnish it to, the SEC. The SEC maintains an Internet site (http://www.sec.gov) containing reports, proxy and information statements, and other information regarding issuers that file electronically with the SEC.
21
Item 1A. Risk Factors
We operate in a rapidly changing environment that involves a number of risks, some of which are beyond our control. You should consider carefully the risks and uncertainties described below together with the other information included in this Annual Report on Form 10-K, including our audited consolidated financial statements and related notes included elsewhere in this Annual Report on Form 10-K, in evaluating our company. The occurrence of any of the following risks may materially and adversely affect our business, financial condition, results of operations and future prospects.
Risks Related to Our Business
Our backlog might not accurately predict our future revenue, and we might not realize all or any part of the anticipated revenue reflected in our backlog.
Our backlog represents anticipated direct revenue for work not yet completed or performed (i) under signed contracts, letters of intent and, in some cases, awards that are supported by other forms of written communication and (ii) where there is sufficient or reasonable certainty about the customer’s ability and intent to fund and commence the services within six months. Our backlog excludes anticipated third-party pass-through and out-of-pocket revenue. Once work begins, we recognize direct revenue over the life of the contract based on our performance of services under the contract. Contracts may be terminated or delayed by our customers or regulatory authorities for reasons beyond our control. To the extent projects are delayed, the anticipated timing of our direct revenue could be materially affected.
In the event a customer terminates a contract, we are generally entitled to be paid for services rendered through the termination date and for services provided in winding down the project. However, we are generally not entitled to receive the full amount of direct revenue reflected in our backlog in the event of a contract termination. The duration of the projects in our backlog, and the related revenue recognition, ranges from several months to many years. A number of factors may affect backlog and the direct revenue generated from our backlog, including:
• | the size, complexity and duration of projects; |
• | the cancellation or delay of projects; and |
• | changes in the scope of work during the course of a project. |
Our backlog at December 31, 2019 was $7,066.3 million compared to a backlog of $6,313.7 million at December 31, 2018. Although an increase in backlog will generally result in an increase in future direct revenue to be recognized over time (depending on future contract modifications, contract cancellations and other adjustments), an increase in backlog at a particular point in time does not necessarily correspond to an increase in direct revenues during a particular period. The timing and extent to which backlog will result in direct revenue depends on many factors, including the timing of commencement of work, the rate at which we perform services, scope changes, cancellations, delays, receipt of regulatory approvals and the nature, duration, size, complexity and phase of the studies. In addition, delayed projects remain in backlog until they are canceled. As a result of these factors, our backlog is not necessarily a reliable indicator of future direct revenue and we might not realize all or any part of the direct revenue from the authorizations in backlog as of any point in time.
The majority of our customers’ contracts can be terminated, delayed or reduced in scope upon short notice or no notice.
Most of our contracts may be terminated by the customer upon 30 to 90 days’ notice. Customers terminate, delay or reduce the scope of their contracts for a variety of reasons, including but not limited to:
• | lack of available funding or financing; |
• | mergers or acquisitions involving the customer; |
• | a change in customer priorities; |
• | products being tested fail to satisfy safety requirements or efficacy criteria; |
• | products have undesirable preclinical or clinical results; |
• | the customer decides to forgo a particular study; |
• | inability to enroll enough patients in a particular study; |
• | inability to recruit enough investigators for a particular study; |
• | the customer decides to shift business to a competitor or to use internal resources; |
• | manufacturing problems that cause shortages of the study drug; |
• | actions by regulatory authorities; and |
22
• | performance failures. |
As a result, contract terminations, delays and reductions in scope occur regularly in the normal course of our business. However, the delay, loss or reduction in scope of a large contract or multiple smaller contracts could result in under-utilization of our personnel, a decline in revenue and profitability and adjustments to our backlog, any or all of which could have a material adverse effect on our business, results of operations, financial condition and/or cash flows. Further, we believe the risk of termination or delay of multiple contracts may be higher where we have strategic partnership arrangements with biopharmaceutical companies and a large backlog of work for those companies.
We may be adversely affected by industry, customer or therapeutic concentration.
We provide services to biopharmaceutical, biotechnology, medical device and government organizations, as well as other industry participants that sponsor clinical trials, and our revenue is dependent upon expenditures by these customers. Accordingly, our business could be materially adversely affected by mergers, consolidations, business failures, distress in the financial markets or other factors resulting in a decrease in the number of potential customers or therapeutic products being developed through the drug development process. In the last few years, biopharmaceutical consolidation has been accelerating. If the number of our potential customers were to decline in the future, they might be able to negotiate price discounts or other terms for services that are less favorable to us than they have historically. Although we did not have any one customer that represented more than 10% of our total revenue for the years ended December 31, 2019, 2018 and 2017, we have experienced customer concentration in the past and could again in the future. For example, our top 10 customers accounted for approximately 47.9% of our total revenue for the year ended December 31, 2019. The loss of business from a significant customer could have a material adverse effect on our business, results of operations, financial condition and/or cash flows.
At times, we conduct multiple clinical studies for different customers in a single therapeutic area involving drugs with similar effects or to treat the same specific condition. As a result, our business could be adversely affected if some or all of the clinical studies are canceled due to newly discovered scientific information or regulatory decisions that affect the drugs within a particular class or for the treatment of a specific condition.
Our financial results may be adversely impacted if we underprice our contracts, overrun our cost estimates or fail to receive approval for or experience delays in documenting change orders.
The majority of our service contracts are based on fixed prices or fixed unit prices for those services, and therefore have set limits on the amounts we can charge for our direct and indirect services. As a result, variations in the timing and progress of large contracts may materially adversely affect our results of operations. In addition, we bear the risk of cost overruns unless the scope of activity is revised from the contract specifications and we are able to negotiate a contract modification with the customer shifting the additional cost to the customer. If we fail to adequately price our contracts for direct and indirect services in total or at the unit level or if we experience significant cost overruns (including direct and indirect costs such as pass-through costs), or are delayed in, or fail to, execute contract modifications with customers increasing the scope of activity, our results of operations could be materially adversely affected. From time to time, we have had to commit unanticipated resources to complete projects, resulting in lower margins and profitability on those projects. We might experience similar situations in the future, which could have a material adverse impact on our results of operations and cash flows.
Our business depends on the efficient and uninterrupted operation of our information and communication systems, including systems we use to deliver services to our customers, and failures in, breach of, or unauthorized access to or use of these systems or data contained therein may materially limit our operations and result in significant harm to our business.
Our success depends on the security and efficient and uninterrupted operation of our information and communication systems, including information and communication systems maintained by third parties on our behalf, and we expect to increase our reliance on these and similar systems over time. As the breadth, complexity and reliance on information systems grows, we will be increasingly exposed to the risks inherent in the development, deployment, operation, use and reliance on these systems, including:
• | disruption, impairment or failure of data centers, telecommunications facilities or other key infrastructure platforms; |
• | security breaches of, cyber-attacks on and other failures or malfunctions in our critical application systems or their associated hardware; and |
• | excessive costs, delays or other deficiencies in systems development and deployment. |
23
The occurrence of these risks could impede the processing of data, the delivery of services to our customers and the day-to-day management and operation of our business and could result in the corruption, loss, disclosure or unauthorized access to proprietary, confidential or other data, which in turn could result in diminished internal and external reporting capabilities, impaired ability to process transactions, harm to our control environment, diminished employee productivity and unanticipated increases in costs.
While we maintain disaster recovery plans, they might not adequately protect us. Despite any precautions we take, damage from cybersecurity attacks, computer viruses, fire, floods, hurricanes, power loss, telecommunications failures, break-ins and similar events at our facilities or those of our suppliers could result in interruptions in the flow of data to our servers and from our servers to our customers. Corruption or loss of data could result in the need to repeat a trial at no cost to our customer, but at significant cost to us, and may result in the termination of a contract and/or damage to our reputation. Additionally, significant delays in system enhancements and improvements, or inadequate performance of the systems once they are completed, could damage our reputation and harm our business. Although we carry insurance, our coverage might not respond or be adequate to compensate us for all losses that may occur.
Unauthorized disclosure of or access to sensitive or confidential data, including confidential information of our customers, whether through third-party attack, system failure, employee negligence, fraud or misappropriation, could significantly damage our business. We have been, and expect we will continue to be, subject to attempts to gain unauthorized access to or through our information systems, whether by our employees or third parties, including by cyber-attack from computer programmers or hackers who deploy viruses, worms or other malicious software programs. To date, these attacks have not had a material impact on our operations or financial results. However, attacks in the future could result in fines, negative publicity, significant remediation costs, liability and/or damage to our reputation, and could have a material adverse effect on our business, results of operations, financial condition and/or cash flows. In addition, any insurance coverage we have might not respond or be sufficient to cover us against claims or penalties imposed by the federal government or state governments related to security breaches, cyber-attacks and other related breaches.
We are in the process of upgrading our existing human capital management, financial management and general ledger systems to an integrated enterprise resource planning system. We expect this upgrade to be substantially complete in 2020. Our ability to serve customers effectively depends on the reliability of our technology network. We depend on information systems to perform many critical business needs. Any disruption to these information systems could adversely impact our business. Despite extensive planning, we could experience disruptions in our business operations because of the project’s complexity. The potential consequences could include project and other delays, loss of information, diminished internal and external reporting capabilities, impaired ability to process transactions, harm to our control environment, diminished employee productivity and unanticipated increases in costs, all of which could result in material adverse effects on our business, results of operations, financial condition and/or cash flows.
If we fail to perform our services in accordance with contractual requirements, regulatory standards and ethical considerations, we could be liable for significant costs or penalties and our reputation could be harmed.
The clinical development and laboratory services we provide to biopharmaceutical companies and other entities are complex and subject to contractual requirements, regulatory standards and ethical considerations. For example, we must adhere to regulatory requirements from the FDA governing our activities relating to preclinical studies and clinical trials, including GCP, GLP and GMP requirements. We are accredited by certain professional bodies, such as the CAP. We are also subject to regulation by the DEA which regulates the distribution, recordkeeping, handling, security and disposal of controlled substances. If we fail to perform our services in accordance with these requirements, regulatory agencies have in the past and may in the future take action against us or our customers for failure to comply with applicable regulations governing clinical trials and the development and testing of therapeutic products. Such actions may include sanctions, such as warning or untitled letters, injunctions or failure of such regulatory authorities to grant marketing approval of products, delay, suspension or withdrawal of approvals, license revocation, loss of accreditation, product seizures or recalls, operational restrictions, civil or criminal penalties or prosecutions, damages or fines. Customers may also bring claims against us for breach of our contractual obligations in clinical trials, may terminate their contracts with us and/or may choose not to award further work to us, and patients involved in the clinical trials or taking drugs approved on the basis of those trials may bring personal injury claims against us. Any such action could have a material adverse effect on our reputation, business, results of operations, financial condition and/or cash flows.
24
Such consequences could arise if, among other things, the following occur:
Failure or inadequate performance of our services. The performance of clinical development and laboratory services is complex and time-consuming. For example, we might make mistakes in conducting a clinical trial or providing laboratory services that could negatively impact or obviate the usefulness of the trial or the data generated from it or cause the results of the trial to be reported improperly. If the trial results are compromised, we could be subject to significant costs or liability, which could have a material adverse impact on our business, reputation and ability to perform our services. Examples include:
• | non-compliance generally could result in the termination of ongoing clinical trials or the disqualification of data for submission to regulatory authorities, or enforcement action from regulators; |
• | compromise of data from a particular trial, such as our failure to verify that informed consents were obtained from patients, could require us to repeat the trial under the terms of our contract at no further cost to our customer, but at a substantial cost to us; |
• | improperly conducting or reporting laboratory results could affect medical decisions for the patient in the trial as well as the clinical trial data and create liability for personal injury and breach of contract for us; and |
• | breach of a contractual term could result in liability for damages and/or termination of the contract. |
Large clinical trials can cost hundreds of millions of dollars and, while we endeavor to contractually limit our exposure to such risks and maintain insurance coverage, improper performance of our services could have a material adverse effect on our financial condition, damage our reputation and result in the cancellation of current contracts by or failure to obtain future contracts from the affected customer and other customers.
Interactive Response Technology (“IRT”) malfunction. Our IRT is critical because it enables the randomization of patients in a given clinical trial to different treatment arms and regulates the supply of an investigational drug, all by means of interactive voice response and interactive web response systems. If these systems malfunction or our personnel make mistakes in the provision of these services and, as a result, patients are incorrectly randomized or misdosed during the course of the clinical trial, then we could be subject to claims for significant damages for any resulting personal injury or death and/or breach of contract claims by our customers, as well as face potential regulatory enforcement. Furthermore, we could suffer from negative publicity associated with any such malfunctions or failures that could have a material adverse effect on our business and reputation. Additionally, errors in randomization may require us to repeat the trial at no further cost to our customer, but a substantial cost to us.
Inspections/Investigations of customers. From time to time, our customers are inspected or investigated by regulatory authorities or enforcement agencies with respect to regulatory compliance of their clinical trials. In these situations, we have often provided services to our customers with respect to the clinical trials being inspected or investigated, and we are called upon to respond to requests for information by the authorities and agencies. There is a risk that either our customers or regulatory authorities could claim that we performed our services improperly or that we were responsible for clinical trial non-compliance. If our customers or regulatory authorities make such claims against us, we could be subject to material damages, fines, penalties or other liabilities. In addition, negative publicity regarding compliance of our customers’ clinical trials, programs or drugs could have an adverse effect on our business and reputation.
If we encounter difficulties or delays in attracting suitable investigators and enrolling a sufficient number of patients for our customers’ clinical trials, our Clinical Development Services segment may be adversely affected.
The recruitment of investigators and patients is essential for the clinical research studies we run for our customers. Investigators are typically located at hospitals, clinics or other sites, including sites we own, and supervise administration of the study drug to patients during the course of a clinical trial. Patients generally are people from the communities in which clinical trials are conducted and may be difficult to locate and enroll in trials, particularly for rare or acute indications, or if the trial protocol requires patients who have not taken other treatments or have failed other treatments for the relevant condition. If we are unable to attract suitable and willing investigators or recruit, enroll and retain patients for clinical trials, our Clinical Development Services segment could be materially adversely affected. For example, if we are unable to recruit sufficient investigators to conduct clinical trials as planned or enroll the required number of patients, we may need to incur additional costs to meet the recruitment or enrollment targets or cause a delay or modification to the clinical trial plans. Delays in patient enrollment may result in increased costs or may affect the timing or outcome of the planned clinical trials, which could prevent completion of these trials and adversely affect our ability to fulfill our obligations to our customers. Any such difficulties or delays could result in additional costs to us and materially adversely affect our business, results of operations, financial condition and/or cash flows and reputation in the industry.
25
We are subject to numerous privacy and data security laws and our failure to comply with those laws could cause us significant harm.
In the normal course of our business, we collect, process, use and disclose individual personal data, including patient-specific medical and other clinical trial data, as well as personal data relating to health professionals and our employees. The collection, processing, use, disclosure, disposal and protection of this information and personal data is highly regulated both in the United States and other jurisdictions we are subject to, including but not limited to, applicable regulations arising from HIPAA, as amended by HITECH, and the Privacy, Security and Breach Notification Rules, 45 C.F.R. Parts 160-164, that implement those laws; U.S. state privacy, security and breach notification and healthcare information laws; the E.U. GDPR; other European privacy laws and other privacy laws that are increasingly being adopted in other regions globally. These laws and regulations include varied and sometimes inconsistent requirements, increasing legal risk and the costs and risks of compliance.
These regulations often govern the use, handling and disclosure of personally identifiable medical information and require the use of standard transactions, privacy and security standards and other administrative simplification provisions by covered entities, which include many healthcare providers, health plans, and healthcare clearinghouses. Although certain aspects of our businesses are subject to HIPAA, we do not consider our service offerings generally to cause us to be subject to HIPAA as a directly covered entity; however, there are extremely limited circumstances where we enter into business associate agreements. However, we endeavor to embrace sound identity protection practices and have implemented processes and systems in order to comply with these laws and continue to monitor and enhance them. If we improperly process personal information, fail to protect the confidentiality and security of this information or otherwise breach applicable privacy laws, regulations or duties relating to the use, privacy or security of personal data, we could be subject to civil liability or criminal prosecution, be forced to alter our business practices and we could suffer significant financial, reputational and other harm and our business, results of operations, financial condition and/or cash flows could be materially adversely affected.
The GDPR became enforceable on May 25, 2018. The GDPR includes sanctions for violations up to the greater of €20 million or 4.0% of worldwide gross annual revenue and applies to services providers such as us. Other privacy laws, including HIPAA and HITECH, provide for potentially large fines for violations. Were we to be subject to any such sanction, it could result in a material adverse effect on our reputation, business, results of operations, financial condition and/or cash flows.
In connection with some clinical trials that we conduct in the European Union on behalf of our customers, we serve as the customer’s E.U. data privacy representative under the GDPR. As the customer’s representative, we could in certain circumstances be liable for the customer’s failure to comply with the GDPR. We believe we maintain adequate processes and systems to ensure our and our customers’ compliance with the requirements of the GDPR, but it is possible that we could fail to comply or that we could incur liability due to the acts or omissions of our customers. Our contracts for these services include indemnification provisions intended to protect us from a customers’ failure to comply with the GDPR, but it might not cover all our losses in the event of a failure to comply. In the event we are not able to secure indemnification or the indemnification and any insurance coverage is inadequate to cover our losses, we could suffer significant financial, operational, reputational and other harm and our business, results of operations, financial condition and/or cash flows could be materially adversely affected.
The United States, the European Union, and other jurisdictions where we operate continue to issue new, and enhance existing, privacy and data security protection regulations related to the collection, use, disclosure, disposal and protection of personal data and medical information, such as the recently enacted California Consumer Protection Act. Privacy and data security laws are rapidly evolving both in the United States and internationally, and the future interpretation of those laws is somewhat uncertain. For example, we do not know how E.U. regulators will interpret or enforce many aspects of the GDPR and some regulators may do so in an inconsistent manner. In the United States, privacy and data security is an area of emphasis for some but not all state regulators, and new legislation has been and likely will continue to be introduced at the state and/or federal level. Additional legislation or regulation might, among other things, require us to implement new security measures and processes or bring within the legislation or regulation de-identified health or other personal data, each of which may require substantial expenditures or limit our ability to offer some of our services.
26
Our business could be harmed if we are unable to effectively manage our growth.
We believe that sustained growth places a strain on human, operational and financial resources. To manage our organic and inorganic growth and increasing complexity of our business, we must continue to attract and retain qualified management, professional, scientific, technical and business development personnel and improve our operating and administrative systems. We believe that maintaining and enhancing both personnel and our systems at reasonable cost are instrumental to our success. We cannot assure you that we will be able to enhance our current technology or obtain new technology that will enable our systems to keep pace with industry developments and the sophisticated needs of our customers. The nature and pace of our organic and inorganic growth introduces risks associated with quality control and customer dissatisfaction due to delays in performance or other problems. In addition, non-U.S. operations involve the additional risks of assimilating differences in non-U.S. business practices, hiring and retaining qualified personnel and overcoming language barriers. If we are unable to manage our growth effectively, we could incur losses.
If we are unable to recruit, retain and motivate key personnel, our business could be adversely affected.
Our success depends on the collective performance, contribution and expertise of our senior management team and other key personnel throughout our businesses, including qualified management, professional, operational, scientific, technical and business development personnel. There is significant competition for qualified personnel in the biopharmaceutical and related services industries, particularly personnel with advanced degrees and those with significant experience and expertise. The loss of any key executive, or our inability to continue to recruit, retain and motivate key personnel and replace departed personnel in a timely fashion, may adversely impact our ability to compete effectively and grow our business and negatively affect our ability to meet our short and long-term financial and operational objectives.
Changes in accounting standards issued by the Financial Accounting Standards Board (“FASB”), including Accounting Standards Codification (“ASC”) Topic 606, or other standard-setting bodies may adversely affect trends and comparability of our financial results.
We are required to prepare our financial statements in accordance with U.S. generally accepted accounting principles (“GAAP”), which is periodically revised and/or expanded. From time to time, we are required to adopt new or revised accounting standards issued by recognized authoritative bodies, including the FASB and the SEC. It is possible that future accounting standards we are required to adopt may require additional changes to the current accounting treatment that we apply to our financial statements and may result in significant changes to our results, disclosures and supporting reporting systems. Such changes could result in a material adverse impact on our results of operations and financial condition.
For example, effective January 1, 2018, we were required to adopt ASC Topic 606, Revenue from Contracts with Customers (“ASC 606”), which outlines a single comprehensive model for entities to use in accounting for revenue from contracts with customers. Under ASC 606, third-party pass-through costs and reimbursed costs are included in our measurement of progress. This change in revenue recognition requires significant estimates of project costs that are updated and adjusted on a regular basis. These updates and adjustments may result in variability in our revenue recognition from period to period that may cause unexpected variability in our operating results. Additionally, effective January 1, 2019, we were required to adopt ASC Topic 842, Leases (“ASC 842”), which required us to recognize certain operating leases in our consolidated balance sheet. See Note 1, Note 3 and Note 11 to our audited consolidated financial statements included elsewhere in this Annual Report on Form 10-K for more information regarding ASC 606 and ASC 842.
We depend on third parties for critical goods and support services.
We depend on third parties for a variety of goods and support services that are critical to us. These third-party service providers include, but are not limited to, software and other technology providers, third-party transportation and travel providers, suppliers of study drugs for clinical trials, couriers, customs brokers, drug depots and distributors, suppliers of licensing agreements, investigator meeting planners, suppliers of kits, reagents, contractors and other supplies used by our laboratory segments and equipment maintenance providers. The failure of any of these third parties to adequately provide goods or services to us or to comply with relevant laws and regulations could have a material adverse effect on our reputation, business, results of operations, financial condition and/or cash flows.
27
We operate in many different countries and are subject to the U.S. Foreign Corrupt Practices Act (the “FCPA”), the Bribery Act and anti-corruption laws and regulations in other countries, as well as laws and regulations relating to trade compliance and economic sanctions. Violations of these laws and regulations could harm our reputation and business, or materially adversely affect our business, results of operations, financial condition and/or cash flows.
We are subject to various U.S. and non-U.S. anti-corruption laws, including the FCPA and the U.K. Bribery Act 2010 (the “Bribery Act”). The FCPA and the Bribery Act prohibit us and our officers, directors, employees and third parties acting on our behalf, including agents, from corruptly offering, promising, authorizing or providing anything of value to a “foreign official” for the purposes of influencing official decisions or obtaining or retaining business or otherwise obtaining favorable treatment. The FCPA further requires us to make and keep books, records and accounts that accurately reflect transactions and dispositions of assets and to maintain a system of adequate internal accounting controls. The Bribery Act also prohibits “commercial” bribery and accepting bribes.
Our global business operations also must be conducted in compliance with applicable export controls and economic sanctions laws and regulations, including those administered by the U.S. Department of the Treasury’s (the “U.S. Treasury”) Office of Foreign Assets Control, the U.S. Department of State, the U.S. Department of Commerce, the United Nations Security Council, the European Union, Her Majesty’s Treasury and other relevant sanctions authorities.
Our internal policies and procedures require strict compliance with these anti-corruption and economic sanctions laws. Despite our training and compliance efforts, we cannot assure that our policies and procedures will protect us from liability for violations of anti-corruption or economic sanctions laws committed by persons associated with us, including our employees or third parties acting on our behalf. Our continued expansion outside the United States, including in countries that are known to have an increased prevalence of corruption, could increase such risks in the future. Violations of these anti-corruption laws or economic sanctions, or even allegations of such violations, could disrupt our business and result in a material adverse effect on our reputation, business, results of operations, financial condition and/or cash flows. For example, violations may result in criminal or civil penalties, disgorgement of profits, related stockholder lawsuits and other remedial measures, and companies that violate these laws can be debarred by the U.S. government and lose U.S. export privileges. Future changes in anti-corruption or economic sanctions laws and enforcement could also result in increased compliance requirements and related costs which could have a material adverse effect on our business, results of operations, financial condition and/or cash flows.
The competition between our existing and potential customers may adversely impact the extent to which those customers use our services, which may materially adversely affect our business, results of operations, financial condition and/or cash flows.
We regularly provide services to biopharmaceutical companies that compete against each other and we sometimes provide services to customers that are developing competing drugs. Therefore, the existing or future business we receive from a customer might discourage a competing customer or potential customer from requesting our services. Also, in connection with the negotiation of a contract, a customer might require that we agree to limit the scope of services we provide to other customers or other restrictive covenants that might limit our ability to provide services to others. The loss of, or reduction in, business we receive from a customer or limits on our ability to service other customers may have a material adverse effect on our business, results of operations, financial condition and/or cash flows.
We face risks associated with business restructurings and the integration of new businesses, which, if not properly managed, could materially affect our business.
In the past few years, we have adopted and implemented restructuring plans and cost-saving initiatives designed to, among other things, improve our operating efficiencies, match our capacity with market demand and reduce costs. At the same time, we have made strategic investments by acquiring businesses that we believe complement our existing portfolio of services. Restructurings and the integration of new businesses present potential risks that could materially adversely affect our business. Restructurings could result in a decline in employee morale, an increase in employment claims, the failure to achieve the stated operational objectives and/or targeted costs savings and the failure to meet customer requirements. Conversely, the success of any acquisition will depend upon, among other things, our ability to effectively integrate the acquired business operations, personnel, services and technologies into our organization, retain and motivate personnel key to the future success of the acquired business and retain customers. If we fail to identify and effectively manage these potential risks, our reputation, business, results of operations, financial condition and/or cash flows could be materially adversely affected.
28
Our business exposes us to potential liability that could affect our reputation, business, results of operations, financial condition and/or cash flows.
Our business involves the testing of new drugs on humans participating in clinical trials and, if marketing approval is received, the availability of these drugs to be prescribed to patients. Our provision of clinical trial services and involvement in the drug development process exposes us to the risk of liability for personal injury or death from, among other things, improper administration of a drug during testing and adverse reactions to the drug administered during testing and after the drug has been approved for sale by regulatory authorities. For example, we have in the past been sued by individuals alleging personal injury due to their participation in a clinical trial. In addition, we have also been sued by individuals alleging personal injury and death caused by the ingestion of drugs approved for sale by regulatory authorities due to our participation in a clinical trial of the drug prior to its approval. In each of these suits, the individuals were seeking monetary damages under a variety of legal theories. If we are required to pay damages or incur defense costs in connection with any personal injury claim that is outside the scope of indemnification agreements we have with customers, if any indemnification agreement is not performed in accordance with its terms or if our liability exceeds the amount of any applicable indemnification limits or available insurance coverage, our reputation, business, results of operations, financial condition and/or cash flows could be materially adversely impacted. We also might not be able to procure adequate insurance for these risks in the future upon terms acceptable to us, if at all.
In the normal course of providing clinical trial services for our customers, we contract with physicians who serve as investigators to administer the protocols and conduct the trials. In addition, we currently own and operate a global site network and employ physicians who serve as investigators on clinical trials. In either case, if an investigator errs during a clinical trial resulting in harm to a patient, claims for personal injury or product liability damages may result. Additionally, trial data may be compromised and our customer may seek damages from us or require us to repeat the trial at our cost. If we were liable for claims related to a physician’s conduct, such liability could have a material adverse impact on our business, results of operations, financial condition and/or cash flows.
From time to time we act as legal representative, importer of record or in a similar capacity on behalf of our customers in certain countries or regions, either as a result of being directly engaged to do so or being deemed to take on such role by virtue of providing associated services. Acting in this capacity exposes us to increased risk, including potential liability to patients and regulatory authorities for the action and/or inaction of the customer. As a condition to providing such services, we generally require specific indemnification and insurance from the customer, however any such insurance coverage might not respond or be sufficient to cover us against claims or penalties imposed, and in the event that we seek to enforce an indemnification provision, the indemnifying party may not have sufficient resources to fully satisfy its indemnification obligations or may otherwise not comply with its contractual obligations. In these circumstances, we could suffer significant financial, operational, reputational and other harm and our business, results of operations, financial condition and/or cash flows could be materially adversely affected.
The operation of our early development Phase I clinics and our AES offering involves direct interaction with clinical trial volunteers, and exposes us to potential liability for personal injury or death that could materially adversely affect our reputation and business.
We operate early development clinics, which involve direct interaction by us with clinical trial volunteers, and we also have strategic alliances with other early development clinics that serve as subcontractors for us. We also own and operate a global site network, which involves direct interaction with clinical trial volunteers. As a part of our early development and our AES operations, we employ and contract with physicians, nurses and other trained health care professionals who conduct the protocol and testing directly on individuals, which may involve administration of the investigational drug, drawing of blood and other medical procedures required under the protocol. Any personal injury to, or death of, a person participating in a clinical trial caused by the medical malpractice or negligence of our physicians, nurses or other staff, or those of our subcontractors, may result in liability to us and have a material adverse effect on our reputation, business, results of operations, financial condition and/or cash flows.
Our insurance might not cover all of our liabilities, including indemnification obligations, associated with the operation of our business and provision of services.
We procure and maintain insurance for ordinary risks associated with the operation of our business, including our indemnification obligations. This insurance coverage under the policies we procure might not be sufficient to cover all of our liabilities or may be contested by our carriers. If our insurance is not adequate or available to cover our liabilities, including our indemnification obligations, or if insurance is not available in the future upon terms acceptable to us, if at all, or if the cost of our insurance is far in excess of historical amounts, our business, results of operations, financial condition and/or cash flows may be materially adversely harmed.
29
Our business uses biological and hazardous materials, which are regulated by various laws. As such, we are exposed to liabilities for violations of those laws and claims for personal injury or death that could materially adversely affect our business.
Our drug development activities involve the use of biological materials, hazardous materials, chemicals and various radioactive compounds. We are subject to various laws and regulations governing the use, storage, handling and disposal of these materials. In the event we violate these laws, we could be liable for costs and expenses for cleanup and remediation, statutory fines and penalties and other civil and criminal penalties. In addition, if there are changes in these laws or regulations or new laws or regulations are enacted, we might be required to incur significant costs to bring our operations into compliance with any new requirements. Furthermore, in the event of an incident involving these materials, we may be subject to claims for personal injury, death or property damage, all of which could materially adversely impact our business, results of operations, financial condition and/or cash flows.
Our business is subject to international and U.S. economic, currency, political and other risks that could negatively affect our business, results of operations, financial condition and/or cash flows.
We provide services globally and have business operations in numerous countries throughout the world. Because we provide our services worldwide, our business is subject to risks associated with doing business internationally. Our revenue from our non-U.S. operations represented approximately 47.1% of our total revenue for the year ended December 31, 2019. We anticipate that we will continue to perform a significant portion of our services through our international operations. Our U.S. and international operations are subject to risk and uncertainties inherent in operating in these regions, including:
• | conducting a clinical trial in multiple countries is complex, and issues in one country can affect the progress of the trial in other countries and result in delays or cancellation of contracts; |
• | the United States or foreign countries could enact legislation or impose regulations, including unfavorable labor regulations, tax policies or economic sanctions, that could have an adverse effect on our ability to conduct business in or expatriate profits from the countries in which we operate; |
• | the complexities of operating within multiple tax jurisdictions, including potentially negative consequences from changes in tax laws or from current and future tax examinations; |
• | foreign countries are expanding or might expand their regulatory framework with respect to patient informed consent or other aspects of the conduct of clinical trials, which could delay or inhibit our ability to conduct trials in such countries; |
• | the regulatory or judicial authorities of foreign countries might not enforce legal rights and recognize business procedures in a manner to which we are accustomed or would reasonably expect; |
• | changes in political and economic conditions might lead to changes in the business environment in which we operate; |
• | changes in foreign currency exchange rates, including the impact of contractual provisions that shift the risk of unfavorable movement in certain exchange rates to us; |
• | potential violations of existing or newly enacted laws may cause difficulties in staffing and managing international operations; |
• | customers in foreign countries may have longer payment cycles, and it may be more difficult to collect receivables in those countries; |
• | political unrest could interrupt our services, endanger our personnel or cause project delays or loss of clinical trial material or results; and |
• | any failure by us to comply with foreign regulations or restrictions or become aware of and acknowledge changes in foreign regulations or restrictions, which could result in the delay of a clinical trial. |
These risks and uncertainties could negatively impact our ability to, among other things, perform large, global projects for our customers. Furthermore, our ability to manage these risks and uncertainties could be affected by U.S. laws and could have an adverse impact on our business, results of operations, financial condition and/or cash flows. For further information regarding foreign currency exchange rate risk, see Part II, Item 7, “Management’s Discussion and Analysis of Financial Condition and Results of Operations—Quantitative and Qualitative Disclosures About Market Risk—Foreign Currency Exchange Rate Risk.”
30
Our operations might be affected by the occurrence of a natural disaster or other catastrophic event.
We depend on our customers, investigators, laboratories and other facilities for the continued operation of our business. While we maintain disaster recovery plans, they might not adequately protect us. Despite any precautions we take for natural disasters or other catastrophic events, these events, including terrorist attack, pandemic disease, such as the novel coronavirus, hurricanes, fire, floods and ice and snow storms, result in interruptions in the flow of data to our servers and from our servers to our customers. Corruption or loss of data could result in the need to repeat a trial at no cost to our customer, but at significant cost to us, and may result in the termination of a contract and/or damage to our reputation. Finally, long-term disruptions in the infrastructure caused by events such as natural disasters, the outbreak of war, the escalation of hostilities and acts of terrorism or other “acts of God,” particularly involving cities in which we have offices, could adversely affect our businesses. Although we carry business interruption insurance policies and typically have provisions in our contracts that protect us in certain events, our coverage might not respond or be adequate to compensate us for all losses that may occur. Any natural disaster or catastrophic event affecting us or our customers, investigators or payers could have a significant negative impact on our operations and financial performance.
As of the date of the filing of our Annual Report on Form 10-K, the novel coronavirus has impacted our ability to fully conduct our business in China and other impacted areas, including in relation to the ability of our employees to visit hospitals and other clinical trial sites to conduct monitoring visits. While the financial impact of the novel coronavirus as of the filing date of this Annual Report on From 10-K has not been material, partly due to the geographical diversification of our business activities and the ability of our employees to perform certain services remotely, there is significant uncertainty as to the extent, speed and duration of the global spread of the novel coronavirus and resulting travel and other restrictions. As such, if the situation regarding novel coronavirus was to worsen and/or governments’ actions to contain its spread were to become more onerous, it could result in a material negative impact on our business, financial condition and results of operations.
Tax reform in the United States could materially affect our business, results of operations, financial condition and/or cash flows.
On December 22, 2017, the U.S. government enacted comprehensive tax legislation commonly referred to as the Tax Cuts and Jobs Act of 2017 (the “Tax Act”). The Tax Act made broad and complex changes to the U.S. tax code including, but not limited to, (i) reducing the corporate statutory income tax rate from 35% to 21%, effective for 2018 and thereafter, (ii) amending the limitations on deductions for interest and (iii) transitioning U.S. international taxation from a worldwide system to a territorial system, inclusive of a one-time mandatory transition tax on accumulated unremitted foreign earnings as of December 31, 2017. Although we have adopted the applicable portions of the Tax Act as required, certain amounts recorded represent our best estimate based on regulatory guidance and information available at the time of recording. The ultimate impact from applying the Tax Act may differ materially from amounts recognized, due to, among other things, additional regulatory guidance that may be issued and actions we take because of the Tax Act. Much of the applicable regulatory guidance issued to date by the Internal Revenue Service (the “IRS”) and the U.S. Treasury has been in the form of proposed regulations, with varying effective dates that would be triggered when final regulations are published. The content of these final regulations and their effective dates remain uncertain. We continue to assess the impact of the Tax Act, and are awaiting further guidance from the IRS and the U.S. Treasury relating to interpretation and application of the Tax Act. Our accounting for the Tax Act could have a material effect on our business, results of operations, financial condition and/or cash flows.
Our cash taxes paid and effective tax rate have and will continue to fluctuate from time to time, and increases in either may adversely affect our business, results of operations, financial condition and/or cash flows.
Our cash taxes paid and effective income tax rate are influenced by our projected and actual profitability in the taxing jurisdictions in which we operate as well as changes in income tax rates. Additionally, changes in the distribution of profits and losses among taxing jurisdictions may have a significant impact on our cash taxes paid and effective income tax rate. Factors that may affect our cash taxes paid and/or effective income tax rate include, but are not limited to:
• | the requirement to exclude from our quarterly worldwide effective income tax calculations losses in jurisdictions where no income tax benefit can be recognized; |
• | actual and projected full year pre-tax income; |
• | changes in existing tax laws and rates in various taxing jurisdictions; |
• | examinations or audits by taxing authorities; |
• | the use of foreign tax credits, and restrictions therein; |
• | changes in our capital structure; |
• | the establishment of valuation allowances against deferred income tax assets if we determine that it is more likely than not that future income tax benefits will not be realized; and |
31
• | other provisions of the Tax Act, including (i) base erosion and anti-abuse tax, if applicable, (ii) taxation of foreign-derived intangible income and global intangible low-taxed income and (iii) limitations on deductions for interest, among others. |
These factors could have a material adverse effect on our business, results of operations, financial condition and/or cash flows.
Additionally, we rely upon generally accepted interpretations of tax laws and regulations in the countries in which we operate and cannot be certain that these interpretations are accurate or that the responsible taxing authority is in agreement with our views. We currently have open examinations with various tax authorities. If a satisfactory resolution cannot be achieved with the tax authorities, the ultimate tax outcome may have a material adverse effect on our results of operations, financial condition and/or cash flows.
Economic conditions and regulatory changes relating to the United Kingdom’s exit from the European Union could negatively affect our business, results of operations, financial condition and/or cash flows.
We have operations in multiple countries, including the United Kingdom, and have transactions in multiple currencies, including the Pound Sterling. We also employ nationals of E.U. countries in the United Kingdom and U.K. nationals in our E.U. businesses. During the second quarter of 2016, the United Kingdom voted by referendum to exit the European Union, commonly referred to as “Brexit.” On January 31, 2020, the U.K. ceased to be part of the European Union. The impact of the United Kingdom’s departure from, and future relationship with, the European Union are uncertain. Brexit has and continues to create general economic uncertainty in the United Kingdom and European Union. The effects of Brexit could have an adverse impact on our business, results of operations, financial condition, and/or cash flows.
Our inability to adequately protect our intellectual property rights could adversely affect our business.
Our success is dependent, in part, on our ability to develop, use and protect our proprietary methodologies, software, compositions, processes, procedures, systems, technologies and other intellectual property. To protect our intellectual property rights, we primarily rely upon trade secret law, confidentiality agreements and policies, invention assignments and other contractual arrangements, along with patent, copyright and trademark laws. Existing laws of the countries outside of the United States in which we provide services offer only limited protection, and these are subject to change at any time. In addition, the agreements upon which we rely to protect our intellectual property might be breached, or might not be fully enforceable. Our intellectual property rights might not prevent our competitors from independently developing intellectual property that is similar to or duplicative of ours. Also, enforcing our intellectual property rights might also require substantial time, money and oversight, and we might not be successful in enforcing our rights.
Any patents that we own or license might not provide adequate protection in the future for the covered technology or inventions. Any patent applications we file might not result in the issuance of valid patents or the scope of our issued patents might not provide meaningful competitive advantages. Also, any patent protection might not prevent others from developing competitive products using related or other technology that does not infringe our patent rights. The scope and enforceability of patents can be highly uncertain and often involves complex legal and factual questions and proceedings, which could be expensive, last several years and either prevent issuance of additional patents to us or result in a significant reduction in the scope or invalidation of our patents. Moreover, the issuance of a patent in one country does not assure the issuance of a patent with similar claim scope in another country, and claim interpretation and infringement laws vary among countries, so we are unable to predict the extent of patent protection in any country.
We cannot be certain that the conduct of our business does not and will not infringe the intellectual property or other proprietary rights of others. Any claim of infringement by a third party, even one without merit, could cause us to incur substantial costs to defend against such claim, could distract our management and employees, and generally interfere with our business.
32
Our investments in third parties are illiquid and subject to loss which could materially adversely affect our financial condition.
We have made investments and commitments to invest in other companies and investment vehicles. Most of our investments are as a limited partner in investment partnerships and are not directly in individual companies. In many cases, there is no public market for these investments and we might not be able to sell them on terms acceptable to us, if at all. In addition, if these funds or companies encounter financial difficulties, we might lose all or part of our investment. We account for the majority of these equity method investments at fair value, utilizing the fair value option, in accordance with GAAP. These investments could have a significant impact on our operating results due to changes in fair market value of their respective investment portfolios or changes in the valuation assumptions by management. We have recorded a liability for additional consideration estimated to be payable related to the recapitalization of the Company in 2017. The contingent additional consideration is based primarily on changes in the fair value of Auven Therapeutic Holdings, L.P. (“Auven”) and venBio Global Strategic Fund, L.P. (“venBio”), net of taxes and other expenses related to such investments. For more information see Note 7, “Investments,” to our audited consolidated financial statements included elsewhere in this Annual Report on Form 10-K.
We may need to recognize impairment charges related to goodwill, definite-lived intangible assets and/or fixed assets.
We have substantial balances of goodwill and definite-lived intangible assets as a result of being taken private by certain investment funds of The Carlyle Group Inc. and its affiliates (“Carlyle”) and Hellman & Friedman LLC and its affiliates (“Hellman & Friedman” and, together with Carlyle, the “Majority Sponsors”) in 2011 as well as our other acquisitions. As of December 31, 2019, our goodwill and intangible assets totaled $1,764.1 million and $892.1 million, respectively. We are required to test goodwill for possible impairment on the same date each year and on an interim basis if there are indicators of a possible impairment. We are also required to evaluate amortizable intangible assets for impairment if there are indicators of a possible impairment.
There is significant judgment required in the analysis of a potential impairment of goodwill and intangible assets. As a result of a general economic slowdown, deterioration in one or more of the markets in which we operate or in our financial performance and/or future outlook of reporting units with assigned goodwill or intangible assets, we may determine that impairment of our goodwill or intangible assets exists. An impairment charge would be determined based on the estimated fair value of the reporting unit’s assigned goodwill and estimated fair value of intangible assets and any such impairment charge could have a material adverse effect on our results of operations and financial condition. For example, for the years ended December 31, 2018 and 2017, we recognized goodwill impairment charges of $29.6 million and $38.4 million, respectively. For the year ended December 31, 2019 we did not recognize any goodwill impairment charges. See Part II, Item 7, “Management’s Discussion and Analysis of Financial Condition and Results of Operations—Critical Accounting Policies and Estimates” for additional information on the goodwill impairment recognized.
Difficult and volatile conditions in the capital and credit markets and in the overall economy could materially adversely affect our business, financial position, results of operations and/or cash flows.
Our business, financial position, results of operations and/or cash flows could be materially adversely affected by difficult conditions and volatility in the capital and credit markets and in the overall economy. Difficult conditions in these markets and the overall economy affect our business in a number of ways. For example:
• | under difficult market conditions there can be no assurance that borrowings under our senior secured credit facilities would be available or sufficient, and in such a case, we might not be able to successfully obtain additional financing on reasonable terms, or at all; |
• | in order to respond to market conditions, we may need to seek waivers of various provisions in the credit agreement governing our senior secured credit facilities, and we might not be able to obtain such waivers on reasonable terms, if at all; and |
• | market conditions could result in our key customers experiencing financial difficulties and/or electing to limit spending or cause non-payment of invoices due, which in turn could result in decreased sales, cash flows and earnings for us. |
33
Risks Related to Our Industry
The CRO industry is fragmented and highly competitive and, if we fail to compete effectively, our business could suffer.
The CRO industry is fragmented and we face intense competition from numerous competitors. We primarily compete against other global, full service CROs similar to us, mid-size and small specialty CROs, in-house departments of biopharmaceutical companies and, to a lesser extent, universities, teaching hospitals and other organizations. The larger CROs against which we compete include Covance, ICON, IQVIA, PAREXEL International Corporation, PRA Health Sciences and Syneos Health, among others. Some of these competitors, including the in-house departments of biopharmaceutical companies, may have greater capital, deeper expertise in selected areas and more resources than us. In recent years, IQVIA and Syneos Health have engaged in mergers to add new or ancillary services, which might be attractive to consumers. In addition, our competitors that are smaller specialized CROs might compete effectively against us based on price and other commercial terms, as well as on their concentrated size and focus.
As a result of the level of competition we face in our industry, we might not be successful in retaining our existing customers and relationships or in winning new business. For example, in recent years a number of the large biopharmaceutical companies have established strategic or preferred partnerships or other alliances with one or more CROs relating to the provision of services over extended time periods. These partnerships and alliances differ in purpose, scope and term, but they have generally resulted in fewer CROs being selected to perform work for the biopharmaceutical companies. If we are unable to continue to effectively compete in the future, we might not be able to maintain current strategic or preferred partnerships or win new ones. In addition, the level of competition among CROs has led to firms competing aggressively on price, payment terms and other commercial terms, and has and may continue to result in us agreeing to terms that are less favorable to us than we have historically agreed to. Our future success depends on our ability to compete and, if we are unable to do so effectively, our business, results of operations, financial condition and/or cash flows could be materially adversely affected.
Trends in R&D spending and the rate of outsourcing by biopharmaceutical companies could materially adversely affect our growth potential, business, results of operations, financial condition and/or cash flows.
We provide clinical development and laboratory services to companies and other participants in the biopharmaceutical industry that sponsor clinical research, and our direct revenues, growth prospects and backlog are highly dependent on R&D spending levels and outsourcing rates. As such, industry trends, economic factors, regulatory developments, patent protection and political and other events and circumstances that affect the biopharmaceutical industry, such as volatility or declines in securities markets limiting capital and liquidity, also affect us. For example, in recent years there has been significant public and private capital inflows to biotechnology companies and, while the level of fundraising in recent years has been strong, the ability of small and mid-sized biotechnology companies to attract the funding needed to sustain operations and advance clinical candidates to subsequent stages in the development process remains dependent on the overall health of the financial markets.
Thus, if for these reasons or any other reason biopharmaceutical firms reduce their R&D spending or the extent to which they outsource their work to CROs, our ability to grow our business and our results of operations, financial condition and/or cash flows could be materially adversely affected. In addition, in the past, mergers, consolidations, product withdrawals, lawsuits and other events in the biopharmaceutical industry appear to have slowed decision-making by pharmaceutical companies and resulted in delays and cancellations of drug development projects. Continuation or increases in these trends, as well as their effect on R&D spending and outsourcing penetration, could also have a material adverse effect on our business.
Our future success depends on our ability to keep pace with rapid technological changes that could make our services less competitive or obsolete.
The biopharmaceutical industry generally, and drug development services industry more specifically, is subject to increasingly rapid technological changes. Our customers, competitors and other businesses might acquire or develop technologies or services that are more effective or commercially attractive than our current or future technologies or services or that render our technologies or services less competitive or potentially obsolete. If competitors acquire or introduce superior technologies or services and we cannot procure or develop these technologies or services or enhance ours in a timely manner to remain competitive, our competitive position, and in turn our business, results of operations, financial condition and/or cash flows may be materially adversely affected.
The U.S. and international healthcare industry is subject to political, economic and/or regulatory influences and changes, such as healthcare reform, all of which could adversely affect both our customers’ business and our business.
The U.S. and international healthcare industry is subject to changing political, economic and regulatory influences that could significantly affect the drug development process, R&D costs and the pricing and reimbursement for pharmaceutical products.
34
Governments worldwide have increased efforts to expand healthcare coverage while at the same time curtailing and better controlling the increasing costs of healthcare. In recent years, the U.S. Congress enacted healthcare reform legislation that expanded health insurance coverage and imposed healthcare industry cost containment measures. More recently, there has been considerable discussion in the United States about repeal of or changes to current healthcare laws. At this point, it is uncertain as to what changes, new legislation or regulations will be adopted or how any such changes, new legislation or regulations would impact our business. If cost-containment efforts limit our customers’ profitability, they may decrease R&D spending, which could decrease the demand for our services and materially adversely affect our growth prospects. Likewise, if a simplified or more relaxed drug approval process is adopted, the demand for our services may decrease.
The U.S. Congress has also considered and might adopt other legislation that could put downward pressure on the prices that biopharmaceutical companies can charge for prescription drugs. In addition, government bodies may have adopted or are considering the adoption of healthcare reform to control the increasing cost of healthcare. Cost-containment measures, whether instituted by healthcare providers or imposed by governments or through new government regulations, could result in greater selectivity in the number of pharmaceutical products available for purchase, resulting in third-party payers potentially challenging the price and cost-effectiveness of certain pharmaceutical products. In addition, in many major markets outside the United States, pricing approval is required before sales may commence. As a result, significant uncertainty exists as to the reimbursement status of approved healthcare products. Any of these factors could harm our customers’ businesses, which, in turn, could materially adversely hurt our business.
In addition to healthcare reform proposals, the expansion of managed care organizations, which focus on reducing healthcare costs by limiting expenditures on pharmaceutical products and medical devices, could result in biopharmaceutical and medical device companies spending less on R&D, which could decrease the demand for our services. If this were to occur, we would have fewer business opportunities and our revenues could decrease, potentially materially.
Government bodies may also adopt healthcare legislation or regulations that are more burdensome than existing regulations. For example, product safety concerns and recommendations from the FDA’s Drug Safety Oversight Board could change the regulatory environment for drug products, including the process for conducting clinical trials of drug and biologic product candidates, FDA product approval and post-approval safety surveillance. These and other changes in regulation could increase our expenses or limit our ability to offer some of our services. Additionally, new or heightened regulatory requirements may have a negative impact on the ability of our customers to conduct and fund clinical trials for new medicines, which could reduce the demand for our services.
We cannot predict the likelihood, nature or extent of government regulation that may arise from future legislation or administrative action, either in the United States or abroad. For example, certain policies of the Trump administration may impact our business and industry. Namely, the Trump administration has taken several executive actions, including the issuance of a number of Executive Orders, that could impose significant burdens on, or otherwise materially delay, the FDA’s ability to engage in routine oversight activities such as implementing statutes through rulemaking, issuance of guidance, and review and approval of marketing applications. It is difficult to predict how these executive actions will be implemented, and the extent to which they will impact the FDA’s ability to exercise its regulatory authority. If these executive actions impose restrictions on the FDA’s ability to engage in oversight and implementation activities in the normal course, our business may be negatively impacted. If we are slow or unable to adapt to changes in existing requirements or the adoption of new requirements or policies, or if we are not able to maintain regulatory compliance, our business may be harmed.
The biopharmaceutical industry has a history of patent and other intellectual property litigation, and we might be involved in costly intellectual property lawsuits.
The biopharmaceutical industry has a history of intellectual property litigation, and these lawsuits will likely continue in the future. Accordingly, we may face patent infringement suits by companies that hold patents for similar business processes or other claims alleging infringement of their intellectual property rights. As the industry employs new technologies, the risk of intellectual property litigation could rise. Legal proceedings relating to intellectual property are costly, take significant time and resources and divert management’s attention from other business concerns, regardless of the merits or the outcome of such claims. If we do not prevail in an infringement lawsuit brought against us, we might have to pay substantial damages, and we could be required to stop the infringing activity or obtain a license to continue such activity, which might not be available on favorable terms or at all, all of which could materially adversely affect our ability to provide services to our customers and our business, results of operations, financial condition and/or cash flows.
35
Risks Associated with Our Indebtedness
Our substantial indebtedness could materially adversely affect our financial condition and our ability to operate our business, react to changes in the economy or industry or pay our debts and meet our obligations under our debt and could divert our cash flow from operations for debt payments.
We have a significant amount of indebtedness. As of December 31, 2019, our total borrowings under our senior secured credit facilities was $3,096.4 million, and we had $1,125.0 million outstanding of 6.375% Senior Notes due 2023 issued by Jaguar Holding Company II and Pharmaceutical Product Development, LLC (the “OpCo Notes”) and $1,450.0 million of 7.625%/8.375% Senior PIK Toggle Notes (the “Initial HoldCo Notes”) and 7.75%/8.50% Senior PIK Toggle Notes due 2022 (the “Additional HoldCo Notes” and together with the Initial HoldCo Notes, the “HoldCo Notes”), which HoldCo Notes were redeemed in full on February 18, 2020. In addition, as of December 31, 2019, we had a $300.0 million revolving credit facility under which we had $298.4 million of availability after giving effect to outstanding letters of credit. See Part II, Item 7 “Management’s Discussion and Analysis of Financial Condition and Results of Operations—Liquidity and Capital Resources” for additional information on our indebtedness. In addition, subject to restrictions in the agreements governing our senior secured credit facilities and the indenture for our OpCo Notes, we may incur additional debt.
Our substantial debt could have important consequences to you, including the following:
• | it may be difficult for us to satisfy our obligations, including debt service requirements under our outstanding debt, resulting in possible defaults on and acceleration of such indebtedness; |
• | our ability to obtain additional financing for working capital, capital expenditures, debt service requirements or other general corporate purposes may be impaired; |
• | a substantial portion of cash flow from operations may be dedicated to the payment of principal and interest on our debt, therefore reducing our ability to use our cash flow to fund our operations, capital expenditures, future business opportunities, acquisitions and other purposes; |
• | we are more vulnerable to economic downturns and adverse industry conditions and our flexibility to plan for, or react to, changes in our business or industry is more limited; |
• | our ability to capitalize on business opportunities and to react to competitive pressures, as compared to our competitors, may be compromised due to our high level of debt; and |
• | our ability to borrow additional funds or to refinance debt may be limited. |
Furthermore, all of our debt under our senior secured credit facilities bears interest at variable rates based on LIBOR. If these rates were to increase significantly, whether because of an increase in market interest rates or a decrease in our creditworthiness, our ability to borrow additional funds may be reduced and the risks related to our substantial debt would intensify. Each quarter-point increase in the LIBOR would have increased the interest expense on our current variable rate debt by approximately $7.8 million during 2019.
In addition, on July 27, 2017, the Chief Executive of the U.K. Financial Conduct Authority, which regulates LIBOR, announced that it intends to stop persuading or compelling banks to submit rates for the calibration of LIBOR to the administrator of LIBOR after 2021.
If LIBOR ceases to exist, the method and rate used to calculate our interest rates and/or payments on our senior secured credit facilities in the future may result in interest rates and/or payments that are higher than, lower than or that do not otherwise correlate over time with the interest rates and/or payments that would have been applicable to our obligations if LIBOR was available in its current form. There is currently no definitive information regarding the future utilization of LIBOR or of any particular replacement rate. As such, the potential effect of any such event is uncertain, but were it to occur, our cost of capital, financial results, cash flows and results of operations may be adversely affected.
Servicing our debt requires a significant amount of cash. Our ability to generate sufficient cash depends on numerous factors beyond our control, and we may be unable to generate sufficient cash flow to service our debt obligations.
Our business may not generate sufficient cash flow from operating activities to service our debt obligations. Our ability to make payments on and to refinance our debt and to fund planned capital expenditures depends on our ability to generate cash in the future. To some extent, this is subject to general economic, financial, competitive, legislative, regulatory and other factors that are beyond our control.
36
If we are unable to generate sufficient cash flow from operations to service our debt and meet our other commitments, we may need to refinance all or a portion of our debt, sell material assets or operations, delay capital expenditures or raise additional debt or equity capital. We may not be able to effect any of these actions on a timely basis, on commercially reasonable terms or at all, and these actions may not be sufficient to meet our capital requirements. In addition, the terms of our existing or future debt agreements may restrict us from pursuing any of these alternatives.
Restrictive covenants in the credit agreement governing our senior secured credit facilities and the indenture governing our OpCo Notes may restrict our ability to pursue our business strategies, and failure to comply with any of these restrictions could result in acceleration of our debt.
The operating and financial restrictions and covenants in the credit agreement governing our senior secured credit facilities and the indenture governing our OpCo Notes may materially adversely affect our ability to distribute monies to our stockholders, finance future operations or capital needs or engage in other business activities. Such agreements limit our ability, among other things, to:
• | incur additional indebtedness and guarantee indebtedness; |
• | pay dividends on or make distributions in respect of our common stock or make other restricted payments; |
• | make loans and investments; |
• | sell or otherwise dispose of assets; |
• | incur liens; |
• | consolidate, merge, sell or otherwise dispose of all or substantially all of our assets; |
• | enter into agreements restructuring our subsidiaries’ ability to pay dividends; |
• | enter into certain transactions with our affiliates; and |
• | designate our subsidiaries as unrestricted subsidiaries. |
In addition, the restrictive covenants in the credit agreement governing our senior secured credit facilities require us to maintain a specified first lien net leverage ratio when a certain percentage of our revolving credit facility commitments are borrowed and outstanding as of the end of each fiscal quarter. In certain circumstances, our ability to meet this financial covenant may be affected by events beyond our control.
A breach of the covenants under the credit agreement governing our senior secured credit facilities or the indenture governing our OpCo Notes could result in an event of default under the applicable indebtedness. Such a default might allow the creditors to accelerate the related debt and might result in the acceleration of any other debt to which a cross-acceleration or cross-default provision applies. In addition, an event of default under the credit agreement governing our senior secured credit facilities would permit the lenders under our senior secured credit facilities to terminate all commitments to extend further credit under our senior secured credit facilities. Furthermore, if we were unable to repay the amounts due and payable under our senior secured credit facilities, those lenders could proceed against the collateral granted to them to secure that indebtedness. In the event our lenders or noteholders accelerate the repayment of our borrowings, we and our subsidiaries may not have sufficient assets to repay that indebtedness.
As a result of all of these restrictions, we and/or our subsidiaries, as applicable, may be:
• | limited in how we conduct our business; |
• | unable to raise additional debt or equity financing to operate during general economic or business downturns; or |
• | unable to compete effectively or to take advantage of new business opportunities. |
These restrictions might hinder our ability to service our indebtedness or grow in accordance with our business strategy.
Furthermore, the terms of any future indebtedness we may incur could have further additional restrictive covenants. We may not be able to maintain compliance with these covenants in the future, and in the event that we are not able to maintain compliance, we cannot assure you that we will be able to obtain waivers from the lenders or amend the covenants.
37
Despite current debt levels, we and our subsidiaries may still be able to incur substantially more debt. This could further exacerbate the risks associated with our substantial leverage.
We and our subsidiaries may be able to incur substantial additional debt in the future. Although the credit agreement governing our senior secured credit facilities and the indenture governing our OpCo Notes contain restrictions on the incurrence of additional debt, these restrictions are subject to a number of qualifications and exceptions, and the debt incurred in compliance with these restrictions could be substantial. Additionally, we may successfully obtain waivers of these restrictions. If we incur additional debt above the levels currently in effect, the risks associated with our leverage, including those described above, would increase. In addition, we had a $300.0 million revolving credit facility under which we had $298.4 million of availability as of December 31, 2019 after giving effect to outstanding letters of credit.
Risks Related to Ownership of Our Common Stock
Our stock price may change significantly, and you may not be able to resell shares of our common stock at or above the price you paid or at all, and you could lose all or part of your investment as a result.
The trading price of our common stock may be volatile and could be subject to fluctuations in response to various factors, some of which are beyond our control. Factors that could cause fluctuations in the trading price of our common stock include the following:
• | results of operations that vary from the expectations of securities analysts and investors; |
• | results of operations that vary from those of our competitors; |
• | changes in expectations as to our future financial performance, including financial estimates and investment recommendations by securities analysts and investors; |
• | declines in the market prices of stocks generally; |
• | strategic actions by us or our competitors; |
• | announcements by us or our competitors of significant contracts, new products, acquisitions, joint marketing relationships, joint ventures, other strategic relationships or capital commitments; |
• | changes in general economic or market conditions or trends in our industry or markets; |
• | changes in business or regulatory conditions; |
• | additions or departures of key management personnel; |
• | future sales of our common stock or other securities by us or our existing stockholders, or the perception of such future sales; |
• | investor perceptions of the investment opportunity associated with our common stock relative to other investment alternatives; |
• | the public’s response to press releases or other public announcements by us or third parties, including our filings with the SEC; |
• | announcements relating to litigation; |
• | guidance, if any, that we provide to the public, any changes in this guidance or our failure to meet this guidance; |
• | the development and sustainability of an active trading market for our stock; |
• | changes in accounting principles; and |
• | other events or factors, including those resulting from natural disasters, war, acts of terrorism or responses to these events. |
These broad market and industry fluctuations may materially adversely affect the market price of our common stock, regardless of our actual operating performance. In addition, price volatility may be greater if the public float and trading volume of our common stock are low.
In the past, following periods of market volatility, stockholders have instituted securities class action litigation. If we were involved in securities litigation, it could have a substantial cost and divert resources and the attention of executive management from our business regardless of the outcome of such litigation.
38
Our quarterly operating results fluctuate and may fall short of prior periods, our projections or the expectations of securities analysts or investors, which could materially adversely affect our stock price.
Our operating results have fluctuated from quarter to quarter at points in the past, and they may do so in the future. Therefore, results of any one fiscal quarter are not a reliable indication of results to be expected for any other fiscal quarter or for any year. If we fail to increase our results over prior periods, to achieve our projected results or to meet the expectations of securities analysts or investors, our stock price may decline, and the decrease in the stock price may be disproportionate to the shortfall in our financial performance. Results may be affected by various factors, including those described in these risk factors. We maintain a forecasting process that seeks to align expenses to backlog conversion. If we do not control costs or appropriately adjust costs to actual results, or if actual results differ significantly from our forecast, our financial performance could be materially adversely affected.
We currently do not intend to declare dividends on our common stock in the foreseeable future and, as a result, your only opportunity to achieve a return on your investment is if the price of our common stock appreciates.
We currently do not expect to declare any dividends on our common stock in the foreseeable future. Instead, we anticipate that all of our earnings in the foreseeable future will be used to provide working capital, to support our operations and to finance the growth and development of our business. Any determination to declare or pay dividends in the future will be at the discretion of our board of directors, subject to applicable laws and dependent upon a number of factors, including our earnings, capital requirements and overall financial conditions. In addition, our ability to pay dividends on our common stock is currently limited by the covenants of our senior secured credit facilities and our indenture governing our OpCo Notes and may be further restricted by the terms of any future debt or preferred securities. Accordingly, your only opportunity to achieve a return on your investment in our company may be if the market price of our common stock appreciates and you sell your shares at a profit. The market price for our common stock may never exceed, and may fall below, the price that you pay for such common stock.
If securities analysts do not publish research or reports about our business or if they downgrade our stock or our sector, our stock price and trading volume could decline.
The trading market for our common stock will rely in part on the research and reports that industry or financial analysts publish about us or our business or industry. We do not control these analysts. Furthermore, if one or more of the analysts who do cover us downgrade our stock or our industry, or the stock of any of our competitors, or publish inaccurate or unfavorable research about our business or industry, the price of our stock could decline. If one or more of these analysts ceases coverage of us or fails to publish reports on us regularly, we could lose visibility in the market, which in turn could cause our stock price or trading volume to decline.
Future sales, or the perception of future sales, by us or our existing stockholders in the public market following this offering could cause the market price for our common stock to decline.
The sale of additional shares of our common stock in the public market, or the perception that such sales could occur, could harm the prevailing market price of shares of our common stock. These sales, or the possibility that these sales may occur, also might make it more difficult for us to sell equity securities in the future at a time and at a price that we deem appropriate.
Shares held by affiliates of Hellman & Friedman, Carlyle, the Abu Dhabi Investment Authority (“ADIA”), Clocktower Investment Pte Ltd. (“GIC”) (collectively, the “Sponsors”) and certain of our directors, officers and employees are “restricted securities” as defined by Rule 144 of the Securities Act (“Rule 144”) and subject to certain restrictions on resale. Restricted securities may be sold in the public market only if they are registered under the Securities Act or are sold pursuant to an exemption from registration such as Rule 144.
Shares covered by registration rights represented approximately 79% of our common stock as of February 27, 2020. Registration of any of these outstanding shares of common stock would result in such shares becoming freely tradable without compliance with Rule 144 upon effectiveness of the registration statement.
As restrictions on resale end or if these stockholders exercise their registration rights, the market price of our shares of common stock could drop significantly if the holders of these shares sell them or are perceived by the market as intending to sell them. These factors could also make it more difficult for us to raise additional funds through future offerings of our shares of common stock or other securities.
In addition, the shares of our common stock reserved for future issuance under the 2020 Incentive Plan will become eligible for sale in the public market once those shares are issued, subject to provisions relating to various vesting agreements, lock-up agreements and Rule 144, as applicable. A total of 39,053,663 shares of common stock have been reserved for future issuance under the 2020 Incentive Plan.
39
In the future, we may also issue our securities in connection with investments or acquisitions. The amount of shares of our common stock issued in connection with an investment or acquisition could constitute a material portion of our then-outstanding shares of our common stock. Any issuance of additional securities in connection with investments or acquisitions may result in dilution to you.
Provisions in our organizational documents could delay or prevent a change of control.
Certain provisions of our amended and restated certificate of incorporation, amended and restated bylaws and second amended and restated stockholders agreement may have the effect of delaying or preventing a merger, acquisition, tender offer, takeover attempt or other change of control transaction that a stockholder might consider to be in its best interest, including attempts that might result in a premium over the market price of our common stock.
These provisions provide for, among other things:
• | the division of our board of directors into three classes, as nearly equal in size as possible, with directors in each class serving three-year terms and with terms of the directors of only one class expiring in any given year; |
• | that at any time when the Majority Sponsors and certain of their respective affiliates beneficially own, in the aggregate, less than 40% in voting power of the stock of our company entitled to vote generally in the election of directors, directors may only be removed for cause, and only by the affirmative vote of the holders of at least two-thirds in voting power of all the then-outstanding shares of stock entitled to vote thereon, voting together as a single class; |
• | the ability of our board of directors to issue one or more series of preferred stock with voting or other rights or preferences that could have the effect of impeding the success of an attempt to acquire us or otherwise effect a change of control; |
• | advance notice for nominations of directors by stockholders and for stockholders to include matters to be considered at stockholder meetings; |
• | the right of the Majority Sponsors and certain of their respective affiliates to nominate the majority of the members of our board of directors and the obligation of certain of our other pre-IPO stockholders to support such nominees; |
• | certain limitations on convening special stockholder meetings; and |
• | that certain provisions of our amended and restated certificate of incorporation and amended and restated bylaws may be amended only by the affirmative vote of the holders of at least two-thirds in voting power of all the then-outstanding shares of our stock entitled to vote thereon, voting together as a single class, if the Majority Sponsors and certain of their respective affiliates beneficially own, in the aggregate, less than 40% in voting power of our stock entitled to vote generally in the election of directors. |
These provisions could make it more difficult for a third-party to acquire us, even if the third-party’s offer may be considered beneficial by many of our stockholders. As a result, our stockholders may be limited in their ability to obtain a premium for their shares.
We are controlled by the Majority Sponsors, whose interests may be different than the interests of other holders of our securities.
The Majority Sponsors are able to control actions to be taken by us, including future issuances of our common stock or other securities, the payment of dividends, if any, on our common stock, amendments to our organizational documents and the approval of significant corporate transactions, including mergers, sales of substantially all of our assets, distributions of our assets, the incurrence of indebtedness and any incurrence of liens on our assets.
40
The interests of the Majority Sponsors may be materially different than the interests of our other stakeholders. In addition, the Majority Sponsors may have an interest in pursuing acquisitions, divestitures and other transactions that, in their judgment, could enhance their investment, even though such transactions might involve risks to you. For example, the Majority Sponsors may cause us to take actions or pursue strategies that could impact our ability to make payments under our senior secured credit facilities and OpCo Notes or cause a change of control. In addition, to the extent permitted by agreements governing our senior secured credit facilities, the Majority Sponsors may cause us to pay dividends rather than make capital expenditures or repay debt. The Majority Sponsors are in the business of making investments in companies and may from time to time acquire and hold interests in businesses that compete directly or indirectly with us. Our amended and restated certificate of incorporation provides that none of the Majority Sponsors, any of their respective affiliates or any director who is not employed by us (including any non-employee director who serves as one of our officers in both his director and officer capacities) or his or her affiliates will have any duty to refrain from engaging, directly or indirectly, in the same business activities or similar business activities or lines of business in which we operate. The Majority Sponsors also may pursue acquisition opportunities that may be complementary to our business, and, as a result, those acquisition opportunities may not be available to us.
So long as the Majority Sponsors continue to own a significant amount of our outstanding common stock, even if such amount is less than 50%, they will continue to be able to strongly influence or effectively control our decisions and, so long as each of the Majority Sponsors continues to own shares of our outstanding common stock, they will have the ability to nominate individuals to our board of directors pursuant to a stockholders agreement to be entered into in connection with this offering. See Part III, Item 13, “Certain Relationships and Related Transactions, Director Independence—Second Amended and Restated, Stockholders Agreement.” In addition, the Majority Sponsors, acting together, will be able to determine the outcome of all matters requiring stockholder approval and will be able to cause or prevent a change of control of our company or a change in the composition of our board of directors and could preclude any unsolicited acquisition of our company. The concentration of ownership could deprive you of an opportunity to receive a premium for your shares of common stock as part of a sale of our company and ultimately might affect the market price of our common stock.
Failure to comply with requirements to design, implement and maintain effective internal controls could have a material adverse effect on our business and stock price.
As a public company, we have significant requirements for enhanced financial reporting and internal controls. The process of designing and implementing effective internal controls is a continuous effort that requires us to anticipate and react to changes in our business and the economic and regulatory environments and to expend significant resources to maintain a system of internal controls that is adequate to satisfy our reporting obligations as a public company. If we are unable to establish or maintain appropriate internal financial reporting controls and procedures, it could cause us to fail to meet our reporting obligations on a timely basis, result in material misstatements in our consolidated financial statements and harm our results of operations. In addition, we are required, pursuant to Section 404, to furnish a report by management on, among other things, the effectiveness of our internal controls over financial reporting in the second annual report following the completion of this offering. This assessment includes disclosure of any material weaknesses identified by our management in our internal controls over financial reporting. The rules governing the standards that must be met for our management to assess our internal controls over financial reporting are complex and require significant documentation, testing and possible remediation. Testing internal controls may divert our management’s attention from other matters that are important to our business.
In connection with the implementation of the necessary procedures and practices related to internal controls over financial reporting, we may identify deficiencies that we may not be able to remediate in time to meet the deadline imposed by the Sarbanes-Oxley Act for compliance with the requirements of Section 404. In addition, we may encounter problems or delays in completing the remediation of any deficiencies identified by our independent registered public accounting firm in connection with the issuance of their attestation report.
Our testing, or the subsequent testing by our independent registered public accounting firm, may reveal deficiencies in our internal controls over financial reporting that are deemed to be material weaknesses. A material weakness in internal controls could result in our failure to detect a material misstatement of our annual or quarterly consolidated financial statements or disclosures. We may not be able to conclude on an ongoing basis that we have effective internal controls over financial reporting in accordance with Section 404. If we are unable to conclude that we have effective internal controls over financial reporting, investors could lose confidence in our reported financial information, which could have a material adverse effect on the trading price of our common stock.
41
Our amended and restated bylaws provide, subject to limited exceptions, that the Court of Chancery of the State of Delaware and, to the extent enforceable, the federal district courts of the United States of America are the sole and exclusive forums for certain stockholder litigation matters, which could limit our stockholders’ ability to obtain a favorable judicial forum for disputes with us or our directors, officers or employees.
Our amended and restated bylaws provide, subject to limited exceptions, that unless we consent in writing to the selection of an alternative forum, the Court of Chancery of the State of Delaware shall, to the fullest extent permitted by law, be the sole and exclusive forum for any (i) derivative action or proceeding brought on behalf of our company, (ii) action asserting a claim of breach of a fiduciary duty owed by any director, officer or other employee of our company to the Company or our stockholders, (iii) action asserting a claim against the Company or any director, officer or other employee of the Company arising pursuant to any provision of the Delaware General Corporation Law, (the “DGCL”), or our amended and restated certificate of incorporation or our amended and restated bylaws or as to which the DGCL confers jurisdiction on the Court of Chancery of the State of Delaware or (iv) action asserting a claim against the Company or any director, officer or other employee of the Company governed by the internal affairs doctrine. These provisions shall not apply to suits brought to enforce a duty or liability created by the Exchange Act or any other claim for which the federal courts have exclusive jurisdiction and our stockholders cannot waive compliance with federal securities laws and the rules and regulations thereunder. Unless we consent in writing to the selection of an alternative forum, the federal district courts of the United States of America shall be the exclusive forum for the resolution of any complaint asserting a cause of action arising under the Securities Act, subject to and contingent upon a final adjudication in the State of Delaware of the enforceability of such exclusive forum provision. Any person or entity purchasing or otherwise acquiring any interest in shares of our capital stock shall be deemed to have notice of and consented to the forum provisions in our amended and restated bylaws.
These choice of forum provisions may limit a stockholder’s ability to bring a claim in a different judicial forum, including one that it may find favorable or convenient for disputes with us or any of our directors, officers or other employees which may discourage lawsuits with respect to such claims. Alternatively, if a court were to find the choice of forum provisions that will be contained in our amended and restated bylaws to be inapplicable or unenforceable with respect to one or more of the specified types of actions or proceedings, we may incur additional costs associated with resolving such action in other jurisdictions, which could harm our business, operating results and financial condition. For example, the Court of Chancery of the State of Delaware recently determined that a provision stating that U.S. federal district courts are the exclusive forum for resolving any complaint asserting a cause of action arising under the Securities Act is not enforceable. However, this decision may be reviewed and ultimately overturned by the Supreme Court of the State of Delaware.
Our board of directors is authorized to issue and designate shares of our preferred stock in additional series without stockholder approval.
Our amended and restated certificate of incorporation authorizes our board of directors, without the approval of our stockholders, to issue 100,000,000 shares of our preferred stock, subject to limitations prescribed by applicable law, rules and regulations and the provisions of our amended and restated certificate of incorporation, as shares of preferred stock in series, to establish from time to time the number of shares to be included in each such series and to fix the designation, powers, preferences and rights of the shares of each such series and the qualifications, limitations or restrictions thereof. The powers, preferences and rights of these additional series of preferred stock may be senior to or on parity with our common stock, which may reduce its value.
We will incur increased costs as a result of operating as a newly publicly traded company, and our management will be required to devote substantial time to new compliance initiatives.
As a newly publicly traded company, we will incur additional legal, accounting, and other expenses that we did not previously incur. Although we are currently unable to estimate these costs with any degree of certainty, they may be material in amount. In addition, the Sarbanes-Oxley Act, the Dodd-Frank Wall Street Reform and Consumer Protection Act, and the rules of the SEC, and the stock exchange on which our common shares are listed, have imposed various requirements on public companies. Our management and other personnel devotes a substantial amount of time to these compliance initiatives as well as investor relations. Moreover, these rules and regulations increase our legal and financial compliance costs and make some activities more time-consuming and costly.
Item 1B. Unresolved Staff Comments
None.
42
Item 2. Properties
As of December 31, 2019, we had 186 office, laboratory and other real estate facilities in 46 countries. We own six of these locations and lease the remaining 180. Our headquarters is located in Wilmington, North Carolina. Our properties are geographically distributed to meet our worldwide operating requirements, and none of our properties are individually material to our business operations. Many of our leases have an option to renew, and we believe that we will be able to successfully renew expiring leases on terms satisfactory to us. We believe that our facilities are adequate for our operations and that suitable additional space will be available when needed.
As of December 31, 2019, our significant operating locations, which we define as the facilities we lease with more than 70,000 square feet, plus all the facilities we own with more than 25,000 square feet, were as follows:
Leased
Location | Approximate square footage | ||
Middleton, Wisconsin (2 properties) | 273,000 | ||
Richmond, Virginia (2 properties) | 251,000 | ||
Austin, Texas (2 properties) | 225,000 | ||
Morrisville, North Carolina (3 properties) | 220,000 | ||
Sofia, Bulgaria | 153,000 | ||
Bangalore, India | 111,000 | ||
Manila, Philippines | 88,000 | ||
Highland Heights, Kentucky | 72,000 | ||
Owned
Location | Approximate square footage | ||
Wilmington, North Carolina | 395,000 | ||
Bellshill, United Kingdom | 70,000 | ||
Brussels, Belgium | 43,000 | ||
Beijing, China | 26,000 | ||
As of December 31, 2019, our total laboratory square footage was more than 860,000 square feet.
Item 3. Legal Proceedings
We are party to legal proceedings incidental to our business. While our management currently believes the ultimate outcome of these proceedings, individually and in the aggregate, will not have a material adverse effect on our consolidated financial statements, all litigation is subject to inherent uncertainties. Were an unfavorable ruling to occur, there exists the possibility of a material adverse impact on our financial condition and results of operations.
Item 4. Mine Safety Disclosures
Not applicable.
43
Part II
Item 5. Market for Registrant’s Common Equity, Related Stockholder Matters and Issuer Purchases of Equity Securities
Market Information for Common Stock
On February 6, 2020, our common stock began trading on Nasdaq under the symbol “PPD.” Prior to that time, there was no public market for our common stock.
Holders of Record
On February 27, 2020, we had approximately 165 common stockholders of record as reported by our transfer agent. Holders of record are defined as those stockholders whose shares are registered in their names in our stock records and do not include beneficial owners of common stock whose shares are held in the names of brokers, dealers or clearing agencies.
Dividend Policy
We currently do not expect to declare any dividends on our common stock in the foreseeable future. Instead, we anticipate that all of our earnings in the foreseeable future will be used to provide working capital, to support our operations, to finance the growth and development of our business and to reduce our net debt. Any determination to declare dividends in the future will be at the discretion of our board of directors, subject to applicable laws, and will be dependent on a number of factors, including our earnings, capital requirements and overall financial condition. We are controlled by the Majority Sponsors, who have the ability to nominate a majority of the members of our board of directors and therefore control the payment of dividends. See Part I, Item 1A, “Risk Factors—Risks Related to Ownership of Our Common Stock—We are controlled by the Majority Sponsors, whose interests may be different than the interests of other holders of our securities.” In addition, because we are a holding company, our ability to pay dividends on our common stock may be limited by restrictions on our ability to obtain sufficient funds through dividends from subsidiaries, including restrictions under the covenants of the credit agreement governing our senior secured credit facilities and the indenture governing our OpCo Notes, and may be further restricted by the terms of any future debt or preferred securities. See Part II, Item 7, “Management’s Discussion and Analysis of Financial Condition and Results of Operations—Liquidity and Capital Resources—Indebtedness” for more information about our senior secured credit facilities and our OpCo Notes.
In May 2019, we paid our stockholders a special cash dividend of $1,086.0 million, or $3.89 per share. In addition, in November 2019, we paid our stockholders a special cash dividend of $160.0 million, or $0.57 per share. The May 2019 special cash dividend was funded with the issuance of long-term debt and cash on hand, and the November 2019 dividend was funded with cash on hand. These special cash dividends were considered a return of capital to our stockholders.
Recent Sales of Unregistered Securities
Since January 1, 2019, we have granted under our equity incentive plans (1) stock options to purchase an aggregate of 2,366,888 shares of our common stock, which options had exercise prices per share ranging between $17.00 and $22.00 when issued and (2) an aggregate of 12,060 shares of restricted common stock to our directors. On July 1, 2019, we issued an aggregate of 268,054 shares of our non-voting common stock to a seller of Medimix International in connection with our acquisition of such company.
The issuances of these stock options and shares of common stock were deemed to be exempt from registration under the Securities Act in reliance upon Section 4(a)(2) of the Securities Act or Regulation D promulgated thereunder, or Rule 701 promulgated under Section 3(b) of the Securities Act, as transactions by an issuer not involving any public offering or pursuant to benefit plans and contracts relating to compensation as provided under Rule 701. None of the foregoing transactions involved any underwriters, underwriting discounts or commissions or any public offering.
Purchases of Equity Securities by the Issuer
None.
44
Use of Proceeds from Public Offering of Common Stock
On February 10, 2020, we completed the initial public offering (“IPO”) of our common stock at a price to the public of $27.00 per share. We issued and sold 69.0 million shares of common stock in the IPO, including 9.0 million common shares issued pursuant to the full exercise of the underwriters option to purchase additional shares as previously disclosed in the IPO prospectus. The shares sold in the IPO were registered under the Securities Act pursuant to a Registration Statement on Form S-1 (the “IPO Registration Statement”), which was declared effective by the SEC on February 5, 2020. Our common stock is listed on Nasdaq under the symbol “PPD.” Shares of common stock were sold at an initial offering price of $27.00 per share. The offering generated net proceeds to us of approximately $1,765.7 million after deducting underwriting discounts and commissions and estimated offering expenses.
We used a portion of the net proceeds received by us from the IPO to redeem $550.0 million in aggregate principal amount of the Initial HoldCo Notes, plus accrued and unpaid interest thereon and $5.5 million of redemption premium and to redeem $900.0 million in aggregate principal amount of the Additional HoldCo notes, plus accrued and unpaid interest thereon and $9.0 million of redemption premium. Any excess net proceeds from the offering will be used for general corporate purposes, which may include, among other things, further repayment of indebtedness.
Item 6. Selected Financial Data
The following tables set forth, for the periods and at the dates indicated, our selected consolidated financial data. We have derived the following balance sheet data as of December 31, 2019 and 2018 and the statements of operations and cash flow data for the years ended December 31, 2019, 2018 and 2017 from our audited consolidated financial statements included elsewhere in this Annual Report on Form 10-K. We have derived the following balance sheet data as of December 31, 2017, 2016 and 2015 and the statements of operations and cash flow data for the years ended December 31, 2016 and 2015 from our audited consolidated financial statements not included in this Annual Report on Form 10-K. You should read the consolidated financial data set forth below together with our audited consolidated financial statements and the related notes thereto included in Part II, Item 8, “Financial Statements and Supplementary Data,” and Part II, Item 7, “Management’s Discussion and Analysis of Financial Condition and Results of Operations,” in this Annual Report on Form 10-K. Our historical results are not necessarily indicative of future results of operations.
On January 1, 2018 we adopted ASC 606, which outlines a single comprehensive model for entities to use in accounting for revenue from contracts with customers.We adopted ASC 606 using the modified retrospective method for all contracts not completed as of the date of adoption. Our consolidated financial data for the periods beginning January 1, 2018 and thereafter are presented in accordance with ASC 606. Prior to January 1, 2018, we applied the accounting guidance from the application of ASC Topic 605, Revenue (“ASC 605”).
Additionally, on January 1, 2019 we adopted ASC 842, which required us to recognize certain operating leases in our consolidated balance sheet. We adopted ASC 842 using the modified retrospective method for all operating leases and capital leases under ASC Topic 840, Leases (“ASC 840”). Our consolidated financial data for the periods beginning January 1, 2019 are presented in accordance with ASC 842. Prior to January 1, 2019, we applied the accounting guidance from the application of ASC 840.
On January 15, 2020, we filed our amended and restated certificate of incorporation which, among other things, effected a 1.8-for-1 stock split of our common stock and increased the authorized number of shares of common stock to 2.08 billion. All references to share and per share amounts in the consolidated financial data set forth below have been retrospectively revised to reflect the stock split and the increase in authorized shares.
45
Year Ended December 31,(1) | |||||||||||||||||||
2019(2) | 2018 | 2017(2) | 2016(2) | 2015(2) | |||||||||||||||
(in thousands) | |||||||||||||||||||
Statement of operations data: | |||||||||||||||||||
Revenue: | |||||||||||||||||||
Revenue | $ | 4,031,017 | $ | 3,748,971 | $ | 2,767,476 | $ | 2,467,941 | $ | 2,073,484 | |||||||||
Reimbursed revenue(3) | — | — | 233,574 | 211,624 | 178,350 | ||||||||||||||
Total revenue | 4,031,017 | 3,748,971 | 3,001,050 | 2,679,565 | 2,251,834 | ||||||||||||||
Operating costs and expenses: | |||||||||||||||||||
Direct costs, exclusive of depreciation and amortization | 1,484,258 | 1,333,812 | 1,302,983 | 1,175,051 | 965,098 | ||||||||||||||
Reimbursed costs | 924,634 | 940,913 | 233,574 | 211,624 | 178,350 | ||||||||||||||
Selling, general and administrative expenses | 938,806 | 813,035 | 809,333 | 718,139 | 652,900 | ||||||||||||||
Recapitalization costs | — | — | 114,766 | — | — | ||||||||||||||
Depreciation and amortization | 264,830 | 258,974 | 279,066 | 260,487 | 262,871 | ||||||||||||||
Goodwill and long-lived asset impairments | 1,284 | 29,626 | 43,459 | 28,101 | 13,686 | ||||||||||||||
Total operating costs and expenses | 3,613,812 | 3,376,360 | 2,783,181 | 2,393,402 | 2,072,905 | ||||||||||||||
Income from operations | 417,205 | 372,611 | 217,869 | 286,163 | 178,929 | ||||||||||||||
Interest expense, net | (311,744 | ) | (263,618 | ) | (253,891 | ) | (203,294 | ) | (228,084 | ) | |||||||||
(Loss) gain on investments(4) | (19,043 | ) | 15,936 | 92,750 | 61,576 | 19,525 | |||||||||||||
Loss on extinguishment of debt | — | — | — | — | (131,755 | ) | |||||||||||||
Other (expense) income, net | (27,143 | ) | 21,701 | (40,259 | ) | 22,448 | 19,462 | ||||||||||||
Income (loss) before provision for (benefit from) income taxes | 59,275 | 146,630 | 16,469 | 166,893 | (141,923 | ) | |||||||||||||
Provision for (benefit from) income taxes | 2,957 | 39,579 | (284,360 | ) | (15,961 | ) | 2,173 | ||||||||||||
Income (loss) before equity in losses of unconsolidated affiliates | 56,318 | 107,051 | 300,829 | 182,854 | (144,096 | ) | |||||||||||||
Equity in losses of unconsolidated affiliates, net of income taxes | (3,563 | ) | (186 | ) | — | — | — | ||||||||||||
Net income (loss) | 52,755 | 106,865 | 300,829 | 182,854 | (144,096 | ) | |||||||||||||
Loss from discontinued operations, net of taxes | — | — | — | — | (4,139 | ) | |||||||||||||
Net (income) loss attributable to noncontrolling interests | (4,934 | ) | (2,679 | ) | (4,802 | ) | 241 | 1,678 | |||||||||||
Net income (loss) attributable to PPD, Inc. | 47,821 | 104,186 | 296,027 | 183,095 | (146,557 | ) | |||||||||||||
Recapitalization investment portfolio consideration | 6,846 | (7,849 | ) | (97,136 | ) | — | — | ||||||||||||
Net income (loss) attributable to common stockholders of PPD, Inc. | $ | 54,667 | $ | 96,337 | $ | 198,891 | $ | 183,095 | $ | (146,557 | ) | ||||||||
Year Ended December 31,(1) | |||||||||||||||||||
2019(2) | 2018 | 2017(2) | 2016(2) | 2015(2) | |||||||||||||||
(in thousands, except per share data) | |||||||||||||||||||
Per share data: | |||||||||||||||||||
Earnings/(loss) per share attributable to common stockholders: | |||||||||||||||||||
Basic | $ | 0.20 | $ | 0.34 | $ | 0.68 | $ | 0.59 | $ | (0.46 | ) | ||||||||
Diluted | $ | 0.19 | $ | 0.34 | $ | 0.68 | $ | 0.58 | $ | (0.46 | ) | ||||||||
Weighted-average common shares outstanding: | |||||||||||||||||||
Basic | 279,285 | 279,238 | 291,027 | 312,065 | 311,874 | ||||||||||||||
Diluted | 280,693 | 279,317 | 293,826 | 316,553 | 311,874 | ||||||||||||||
46
Year Ended December 31,(1) | |||||||||||||||||||
2019(2) | 2018 | 2017(2) | 2016(2) | 2015(2) | |||||||||||||||
(in thousands) | |||||||||||||||||||
Cash flow data: | |||||||||||||||||||
Net cash provided by (used in): | |||||||||||||||||||
Operating activities | $ | 432,946 | $ | 423,406 | $ | 359,079 | $ | 407,995 | $ | 416,288 | |||||||||
Investing activities | (233,228 | ) | (90,525 | ) | (92,743 | ) | (519,746 | ) | (253,542 | ) | |||||||||
Financing activities | (422,039 | ) | (166,942 | ) | (249,393 | ) | 130,465 | (44,629 | ) | ||||||||||
Other financial data: | |||||||||||||||||||
Net authorizations(5) | 3,827,291 | 3,420,954 | 2,485,419 | 3,051,596 | 2,491,584 | ||||||||||||||
Backlog (at end of period)(5) | 7,066,254 | 6,313,710 | 5,730,568 | 6,006,644 | 5,192,054 | ||||||||||||||
Backlog conversion(5) | 11.9 | % | 11.9 | % | 11.7 | % | 11.4 | % | 10.6 | % | |||||||||
Net book-to-bill(5) | 1.2x | 1.2x | 0.9x | 1.2x | 1.2x | ||||||||||||||
As of December 31,(1) | |||||||||||||||||||
2019(2) | 2018 | 2017(2) | 2016(2) | 2015(2) | |||||||||||||||
(in thousands) | |||||||||||||||||||
Balance sheet data: | |||||||||||||||||||
Cash and cash equivalents | $ | 345,187 | $ | 553,066 | $ | 418,960 | $ | 361,741 | $ | 365,846 | |||||||||
Property and equipment, net | 458,845 | 399,103 | 384,187 | 382,946 | 333,737 | ||||||||||||||
Working capital | (288,059 | ) | 137,456 | 30,352 | 150,452 | 252,699 | |||||||||||||
Total assets | 5,556,246 | 5,489,361 | 5,444,873 | 5,310,304 | 4,849,447 | ||||||||||||||
Total debt | 5,643,928 | 4,795,684 | 4,822,234 | 4,309,112 | 3,655,200 | ||||||||||||||
Total stockholders’ deficit | (2,698,148 | ) | (1,522,421 | ) | (1,491,680 | ) | (964,241 | ) | (444,369 | ) | |||||||||
__________
(1) | Financial data as of and for the years ended December 31, 2019 and 2018 is reported in accordance with ASC 606. Financial data as of and for the years ended December 31, 2017, 2016 and 2015 is reported in accordance with ASC 605. |
(2) | We acquired Synarc Inc. on September 3, 2019, Medimix International on July 1, 2019, Optimal Research, LLC on September 1, 2017, Evidera Holdings, Inc. on September 1, 2016, Synexus Clinical Research Topco Limited on May 31, 2016, CRA Intermediate Holdings, Inc. on May 12, 2015 and the clinical research division of SNBL, subsequently renamed PPD-SNBL, on April 1, 2015. We own 60% of PPD-SNBL. The financial results of these entities have been included as of and since the dates of each acquisition. |
(3) | Represents out-of-pocket revenues and related costs reimbursed by our customers at cost when we are the principal (and not the agent) in the relationship in accordance with ASC 605 for the years ended December 31, 2017, 2016 and 2015. |
(4) | Represents the fair value accounting gains or losses primarily from our investments in Auven and venBio. The gains or losses from our investments in Auven and venBio will likely continue to fluctuate from period to period based on the changes in fair values of the net asset values of the limited partnerships and changes in the discounts applied to such investments for our lack of control and lack of marketability. A contingent liability for additional consideration estimated to be payable to certain owners prior to the 2017 recapitalization was recorded, primarily based on changes in the fair value of such investments, net of taxes and other related expenses. For more information, see Note 2, “Recapitalization Transaction” and Note 7, “Investments” to our audited consolidated financial statements included elsewhere in this Annual Report on Form 10-K. |
(5) | Net authorizations represent new business awards, net of award or contract modifications, contract cancellations, foreign currency fluctuations and other adjustments. Backlog for all periods represents anticipated direct revenue for work not yet completed or performed (i) under signed contracts, letters of intent and, in some cases, awards that are supported by other forms of written communication and (ii) where there is sufficient or reasonable certainty about the customer’s ability and intent to fund and commence the services within six months. Backlog and net authorizations exclude the impact of net authorizations from anticipated third-party pass-through and out-of-pocket revenue. Backlog conversion represents the quarterly average of direct revenue for the period divided by opening backlog for that period. Net book-to-bill represents the amount of net authorizations for the period divided by direct revenue recognized in that period. |
47
Item 7. Management’s Discussion and Analysis of Financial Condition and Results of Operations
The following discussion summarizes the significant factors affecting the operating results, financial condition, liquidity and cash flows of our company as of and for the periods presented below. The following discussion and analysis should be read in conjunction with the audited consolidated financial statements and the related notes thereto included elsewhere in this Annual Report on Form 10-K. Some of the discussion includes forward-looking statements related to future events and our future operating performance that are based on current expectations and are subject to risk and uncertainties. Actual results could differ materially from those discussed in or implied by forward-looking statements as a result of various factors, including those discussed below and in Part I, Item 1A,“Risk Factors” of this Annual Report on Form 10-K.
Company Overview
We are a leading provider of drug development services to the biopharmaceutical industry, focused on helping our customers bring their new medicines to patients around the world. We have been in the drug development services business for more than 30 years, providing a comprehensive suite of clinical development and laboratory services to pharmaceutical, biotechnology, medical device and government organizations, as well as other industry participants. Over that time, we have developed a track record of consistent quality, delivery and continuous innovation that has enabled us to grow faster than our underlying market over the past five years and deliver strong financial results. In 2019, we served all of the top 50 biopharmaceutical companies in the world, as ranked by 2018 R&D spending, and, in 2018, were involved in 66 drug approvals. We also participated in the development of all of 2018’s top ten selling drugs, as ranked by 2018 revenue. Since 2014, we have also worked with over 300 companies in the growing biotechnology sector through our PPD Biotech model, which was built specifically to serve the unique needs of this customer segment.
Our purpose and mission are to improve health by helping our customers deliver life-changing therapies to patients. We pursue our purpose and mission through our clinical development and laboratory services and our strategy to bend the cost and time curve of drug development and optimize value for our customers. Our customers benefit from accelerated time to market because it results in lengthened periods of market exclusivity, and our real-world evidence solutions support the superior efficacy and value of their novel therapies. We believe our medical, scientific and drug development expertise, along with our innovative technologies and knowledge of global regulatory requirements, help our customers accelerate the development of safe and effective therapeutics and maximize returns on their R&D investments. We have two reportable segments, Clinical Development Services and Laboratory Services.
For a description of our service offerings within our segments, see Part I, Item 1, “Business” of this Annual Report on Form 10-K.
Effective January 1, 2018, we adopted ASC 606, using the modified retrospective method for all contracts not completed as of the date of adoption. The audited consolidated financial statements as of and for the years ended December 31, 2019 and 2018 included elsewhere in this Annual Report on Form 10-K, reflect the application of the accounting guidance of ASC 606, while the consolidated financial statements and other financial information (as applicable) for the period commencing prior to January 1, 2018, reflect previous accounting guidance from the application of ASC 605.
Industry Outlook
For information about the industry outlook and markets that we operate in, refer to “Our Markets” within Part I, Item I of this Annual Report on Form 10-K.
Sources of Revenue
Under ASC 606, revenue is comprised of direct, third-party pass-through and out-of-pocket revenue from providing services to our customers. Direct revenue represents revenue associated with the direct services provided under our contracts. Third-party pass-through and out-of-pocket revenue represents the reimbursement by customers of third-party pass-through and out-of-pocket costs incurred by us under our contracts. Revenue typically fluctuates and may fluctuate significantly period to period based on the timing and types of services performed, staff utilization and hours worked, actual and estimated third-party pass-through and out-of-pocket costs and the volume of our net authorizations driving growth in backlog, among other factors.
48
With the adoption of ASC 606, we record the reimbursement of third-party pass-through and out-of-pocket revenue and the related costs incurred as revenue and reimbursed costs on the consolidated statements of operations. We record these reimbursed costs as revenue when we are the principal in the relationship, are primarily responsible for the services provided by third parties and significantly integrate the services of the third parties with our own services in delivering a combined output to the customer.
Previously under ASC 605, revenue only included direct revenue from providing services to our customers. Third-party pass-through revenue and costs were presented on a net basis and out-of-pocket revenue and costs were presented on a gross basis as reimbursed revenue and reimbursed costs on the consolidated statements of operations. Additionally, third-party pass-through and out-of-pocket costs were excluded from the costs used in the measure of progress for full-service clinical trial management contracts that utilized the proportional performance method to recognize revenue, and the related revenue was recognized for these reimbursed costs when the costs were incurred. Third-party pass-through and out-of-pocket revenue and costs did not have a significant impact on our financial performance, because they were ancillary to the clinical development and laboratory services provided by us, generally provided by us without profit or mark-up and variable from period to period without being important to our underlying business performance. Therefore, prior to January 1, 2018, we did not analyze third-party pass-through and out-of-pocket revenue and related costs from period to period.
Our Clinical Development Services segment represented 81.0%, 82.3% and 83.8% of direct revenue for the years ended December 31, 2019, 2018 and 2017, respectively, with the remainder generated from Laboratory Services. These segment results are based on management segment reporting.
We have a diverse customer mix, with no one customer accounting for more than 10% of our revenue for the years ended December 31, 2019, 2018 and 2017. Our top 10 customers accounted for approximately 47.9%, 47.5% and 50.5% of our revenue for the years ended December 31, 2019, 2018 and 2017, respectively. Based on the diversity of our customer base, we do not believe we have significant customer concentration risk. We do not have any significant product revenues.
Operating Costs and Expenses
Our operating costs and expenses primarily consist of direct costs, reimbursed costs, selling, general and administrative (“SG&A”) expenses and depreciation and amortization.
Direct Costs
Direct costs represent costs for providing services to customers. Direct costs primarily include labor-related costs, such as compensation and benefits for employees providing services, an allocation of facility and information technology costs, supply costs, costs for certain media-related services for patient recruitment, other overhead costs and offsetting R&D incentive credits. Direct costs typically increase or decrease with changes in revenue and may fluctuate significantly from period to period as a percentage of revenue due to staff labor utilization, project labor mix, the type of services, changes to the timing of work performed and project inefficiencies, among other factors.
Reimbursed Costs
Reimbursed costs include third-party pass-through and out-of-pocket costs which are generally reimbursable by our customers at cost. Third-party pass-through and out-of-pocket costs include, but are not limited to, payments to investigators, payments for the use of third-party technology, shipping costs and travel costs related to the performance of services, among others. Third-party pass-through and out-of-pocket costs are incurred across both of our reportable segments.
Because services associated with reimbursed costs are generally provided by us without profit or mark-up and fluctuate from period to period without being important to our underlying performance over the full term of a contract, these costs do not have a significant impact on our income from operations. While fluctuations from period to period are not meaningful over the full term of a contract, actual and estimated reimbursed costs can impact revenue recognized and income from operations throughout the duration of a contract.
Selling, General and Administrative Expenses
SG&A expenses represent costs of business development, administrative and support functions. SG&A expenses primarily include compensation and benefits for employees, costs related to employees performing administrative tasks, stock-based compensation expense, sales, marketing and promotional expenses, employee recruiting and relocation expenses, employee training costs, travel costs, an allocation of facility and information technology costs and other overhead costs.
49
Depreciation and Amortization
Depreciation and amortization represents the costs charged for our property and equipment and intangible assets. We record depreciation and amortization using the straight-line method, based on the estimated useful lives of the respective assets. We depreciate leasehold improvements over the shorter of the lease term or the estimated useful lives of the improvements. We amortize software developed or obtained for internal use, including software licenses obtained through a cloud computing arrangement, over the estimated useful life of the software or term of the licensing or service agreement. Amortization expense primarily comes from acquired definite-lived intangible assets. We amortize definite-lived intangible assets using either the straight-line method or sum-of-the-years digits method over the estimated useful lives of the assets.
How We Assess the Performance of Our Business
We manage and assess our business based on segment performance and allocate resources utilizing segment revenues and segment operating income. We also assess the performance of our consolidated business using a number of metrics including backlog and net authorizations. Our financial information for all periods presented below for backlog and net authorizations exclude the impact of net authorizations from anticipated third-party pass-through and out-of-pocket revenue.
Our backlog represents anticipated direct revenue for work not yet completed or performed (i) under signed contracts, letters of intent and, in some cases, awards that are supported by other forms of written communication and (ii) where there is sufficient or reasonable certainty about the customer’s ability and intent to fund and commence the services within six months.
Backlog and backlog conversion to direct revenue (defined as the quarterly average of segment direct revenue for the period divided by opening backlog for that period) vary from period to period depending upon new authorizations, contract modifications, cancellations and the amount of direct revenue recognized under existing contracts. We adjust backlog for foreign currency fluctuations and exclude direct revenue that has been recognized as revenue in our consolidated statements of operations.
Although an increase in backlog will generally result in an increase in future direct revenue to be recognized over time (depending on future contract modifications, contract cancellations and other adjustments), an increase in backlog at a particular point in time does not necessarily correspond to an increase in direct revenue during a particular period. The timing and extent to which backlog will result in direct revenue depends on many factors, including the timing of commencement of work, the rate at which we perform services, scope changes, cancellations, delays, receipt of regulatory approvals and the nature, duration, size, complexity and phase of the studies. Our contracts generally have terms ranging from several months to several years. In addition, delayed projects remain in backlog until they are canceled. As a result of these factors, our backlog might not be a reliable indicator of future direct revenue and we might not realize all or any part of the direct revenue from the authorizations in backlog as of any point in time.
We add new authorizations to backlog based on the aforementioned criteria for backlog. Net authorizations represent new business awards, net of award or contract modifications, contract cancellations, foreign currency fluctuations and other adjustments. New authorizations vary from period to period depending on numerous factors, including customer authorization volume, sales performance and overall health of the biopharmaceutical industry, among others. New authorizations have varied and will continue to vary significantly from quarter to quarter and from year to year. In addition to net authorizations, we also assess net book-to-bill which represents the amount of net authorizations for the period divided by the direct revenue recognized in that period.
50
Backlog and Net Authorizations
Change | ||||||||||||||||||||||||||
2019 vs. 2018 | 2018 vs. 2017 | |||||||||||||||||||||||||
(dollars in millions) | 2019 | 2018 | 2017 | $ | % | $ | % | |||||||||||||||||||
Net authorizations (for the years ended December 31) | $ | 3,827.3 | $ | 3,421.0 | $ | 2,485.4 | $ | 406.3 | 11.9 | % | $ | 935.6 | 37.6 | % | ||||||||||||
Backlog (as of December 31) | 7,066.3 | 6,313.7 | 5,730.6 | 752.6 | 11.9 | 583.1 | 10.2 | |||||||||||||||||||
Backlog conversion (quarterly average for the years ended December 31) | 11.9 | % | 11.9 | % | 11.7 | % | — | 0.2 | ||||||||||||||||||
Net book-to-bill | 1.2x | 1.2x | 0.9x | |||||||||||||||||||||||
Our net authorizations for the years ended December 31, 2019, 2018 and 2017 were $3,827.3 million, $3,421.0 million and $2,485.4 million, respectively. Our backlog as of December 31, 2019, 2018 and 2017 was $7,066.3 million, $6,313.7 million and $5,730.6 million, respectively. The increase in net authorizations and backlog in 2019 as compared to the same period in the prior year was primarily due to a higher win rate on competitive decisions (which represents the total dollar amount of new business on which we bid) and favorable net foreign currency fluctuations, partially offset by cancellations. The increase in net authorizations and backlog in 2018 as compared to the same period in the prior year was primarily due to a higher number of competitive decisions and lower cancellations, partially offset by unfavorable foreign currency fluctuations.
Acquisitions
September 2019 Acquisition
On September 3, 2019, we acquired 100% of the issued and outstanding equity of Synarc, Inc. (“Synarc”), the global site network of Bioclinica, Inc., expanding its global footprint into China and Latin America and expanding its central nervous system offering in the United States. As of December 31, 2019, the preliminary purchase price was $45.2 million. The initial accounting for the acquisition is not yet complete. See Note 6, “Business Combinations,” of our audited consolidated financial statements included elsewhere in this Annual Report on Form 10-K for additional information.
July 2019 Acquisition
On July 1, 2019, we acquired 100% of the issued and outstanding equity of Medimix International (“Medimix”), a global technology company that provides real-world evidence insights and information to the pharmaceutical, diagnostic and medical device industries. As of December 31, 2019, the preliminary purchase price was $36.8 million, including $5.0 million of common stock of the Company. The initial accounting for the acquisition is not yet complete. See Note 6, “Business Combinations,” of our audited consolidated financial statements included elsewhere in this Annual Report on Form 10-K for additional information.
September 2017 Acquisition
On September 1, 2017, we acquired 100% of Optimal Research, LLC (“Optimal Research”), a dedicated clinical research site network with enhanced oncology enrollment capabilities. The purchase price was $24.0 million. See Note 6, “Business Combinations,” of our audited consolidated financial statements included elsewhere in this Annual Report on Form 10-K for additional information.
Incremental Public Company Expenses
As a new public company, we will incur additional expenses on an ongoing basis that we did not incur as a private company. Those costs include additional director and officer liability insurance expenses, as well as third-party and internal resources related to accounting, auditing, Sarbanes-Oxley Act compliance, legal, investor and public relations expenses and additional stock-based compensation expense as we align our long-term incentive plan with other public company plans. These costs will generally be SG&A expenses.
51
We also expect to replace our existing cash-based long-term incentive plan with annual equity awards in 2020. We recorded compensation expense of $14.1 million, $12.0 million and $11.1 million for each of the years ended December 31, 2019, 2018 and 2017, respectively, in connection with awards issued under our cash-based long-term incentive plan.
Results of Operations
We have included the results of operations of acquired companies in our consolidated results of operations from the date of their respective acquisitions, which impacts the comparability of our results of operations when comparing results for the year ended December 31, 2019 to the year ended December 31, 2018 and the year ended December 31, 2018 to the year ended December 31, 2017. We have noted in the discussion below, to the extent meaningful and quantifiable, the impact on the comparability of our consolidated results of operations to prior year results due to the inclusion of acquired companies as well as the impact of ASC 606 when comparing the year ended December 31, 2018 to the year ended December 31, 2017.
Year Ended December 31, 2019 versus Year Ended December 31, 2018 and Year Ended December 31, 2018 versus Year Ended December 31, 2017
Consolidated Results of Operations
Revenue
Change | ||||||||||||||||||||||||||
Years Ended December 31, | 2019 vs. 2018 | 2018 vs. 2017 | ||||||||||||||||||||||||
(dollars in thousands) | 2019 | 2018 | 2017 | $ | % | $ | % | |||||||||||||||||||
Revenue | $ | 4,031,017 | $ | 3,748,971 | $ | 2,767,476 | $ | 282,046 | 7.5 | % | $ | 981,495 | 35.5 | % | ||||||||||||
Reimbursed revenue | — | — | 233,574 | — | n.m. | (233,574 | ) | n.m. | ||||||||||||||||||
Total revenue | $ | 4,031,017 | $ | 3,748,971 | $ | 3,001,050 | $ | 282,046 | 7.5 | $ | 747,921 | 24.9 | ||||||||||||||
Revenue increased $282.0 million, or 7.5%, to $4,031.0 million for the year ended December 31, 2019 as compared to the same period in 2018. Revenue increased 7.6% from organic volume growth due to increased net authorizations and backlog growth in 2019 and 2018 and 0.7% from inorganic growth primarily due to our current year acquisitions of Synarc and Medimix (the “2019 Acquisitions”). The increase in revenue was partially offset by a 0.8% decrease from the unfavorable impact from foreign currency exchange rates.
Total revenue increased $747.9 million, or 24.9%, to $3,749.0 million for the year ended December 31, 2018 as compared to the same period in 2017. Total revenue increased primarily due to the adoption of ASC 606, which requires third-party pass-through revenue and out-of-pocket reimbursed revenue to be reported on a gross presentation basis as part of revenue. Previously, under ASC 605, third-party pass-through revenue was presented net of third-party pass-through costs in our consolidated statements of operations. Excluding the impact of the adoption of ASC 606, revenue increased $70.3 million, or 2.5%. Total revenue increased 1.5% primarily due to organic volume growth and higher backlog conversion, 0.7% due to the effect of favorable foreign currency exchange rates, and 0.3% due to inorganic growth from the 2017 acquisition of Optimal Research (the “2017 Acquisition”).
Direct Costs
Change | ||||||||||||||||||||||||||
Years Ended December 31, | 2019 vs. 2018 | 2018 vs. 2017 | ||||||||||||||||||||||||
(dollars in thousands) | 2019 | 2018 | 2017 | $ | % | $ | % | |||||||||||||||||||
Direct costs | $ | 1,484,258 | $ | 1,333,812 | $ | 1,302,983 | $ | 150,446 | 11.3 | % | $ | 30,829 | 2.4 | % | ||||||||||||
% of total revenue | 36.8 | % | 35.6 | % | 43.4 | % | ||||||||||||||||||||
52
Direct costs increased $150.4 million to $1,484.3 million for the year ended December 31, 2019 as compared to the same period in 2018. The increase in direct costs was due to (i) a $97.9 million increase from growth in employee headcount and contract labor to support current and anticipated growth in future revenue as well as compensation increases, (ii) a $16.5 million increase from the impact of the 2019 Acquisitions and (iii) an increase in project delivery costs, including media-related costs for patient recruitment services and laboratory supply costs. The increase in direct costs was partially offset by a 1.6% decrease from the favorable impact from foreign currency exchange rates. As a percentage of revenue, direct costs increased to 36.8% for the year ended December 31, 2019 as compared to 35.6% in the same period in 2018 primarily due to the factors identified above.
Direct costs increased $30.8 million to $1,333.8 million for the year ended December 31, 2018 as compared to the same period in 2017. The increase in direct costs was primarily due to (i) a $30.9 million increase from growth in employee headcount to support current and anticipated growth in future revenue as well as compensation increases, (ii) an increase in project delivery costs, including media-related costs for patient recruitment services and (iii) an inorganic increase of $5.2 million for the 2017 Acquisition, partially offset by increased R&D incentive credits. The increase in direct costs included a 0.8% increase from the unfavorable impact from foreign currency exchange rates. As a percentage of revenue, direct costs decreased to 35.6% for the year ended December 31, 2018 as compared to 43.4% in the same period in 2017. Excluding the impact from the adoption of ASC 606, direct costs were 43.4%, as a percentage of revenue, for the year ended December 31, 2018.
Reimbursed Costs
Change | ||||||||||||||||||||||||||
Years Ended December 31, | 2019 vs. 2018 | 2018 vs. 2017 | ||||||||||||||||||||||||
(dollars in thousands) | 2019 | 2018 | 2017 | $ | % | $ | % | |||||||||||||||||||
Reimbursed costs | $ | 924,634 | $ | 940,913 | $ | 233,574 | $ | (16,279 | ) | (1.7 | )% | $ | 707,339 | 302.8 | % | |||||||||||
% of total revenue | 22.9 | % | 25.1 | % | 7.8 | % | ||||||||||||||||||||
Reimbursed costs decreased $16.3 million to $924.6 million for the year ended December 31, 2019 as compared to the same period in 2018. Reimbursed costs decreased due to lower pass-through costs for certain larger clinical trials within our Clinical Development Services segment as a result of fluctuations in enrollment and patient activity, as well as the general timing of costs incurred across the remainder of the portfolio, which will vary over the course of clinical trials due to the timing of the work performed, scope changes and the complexity and phase of the study, among other factors.
Reimbursed costs increased $707.3 million to $940.9 million for the year ended December 31, 2018 as compared to the same period in 2017. Reimbursed costs increased primarily due to the adoption of ASC 606, which requires third-party pass-through costs to be recorded on a gross presentation basis instead of being presented net of pass-through revenue. Previously, under ASC 605, third-party pass-through costs were presented net of third-party pass-through revenue in our consolidated statements of operations for periods that commenced prior to January 1, 2018. Excluding the impact from the adoption of ASC 606, reimbursed costs would have been $222.2 million for the year ended December 31, 2018. See discussion above on the impact from the adoption of ASC 606 on our revenues.
Selling, General and Administrative Expenses
Change | ||||||||||||||||||||||||||
Years Ended December 31, | 2019 vs. 2018 | 2018 vs. 2017 | ||||||||||||||||||||||||
(dollars in thousands) | 2019 | 2018 | 2017 | $ | % | $ | % | |||||||||||||||||||
Selling, general and administrative expenses | $ | 938,806 | $ | 813,035 | $ | 809,333 | $ | 125,771 | 15.5 | % | $ | 3,702 | 0.5 | % | ||||||||||||
% of total revenue | 23.3 | % | 21.7 | % | 27.0 | % | ||||||||||||||||||||
53
SG&A expenses increased $125.8 million to $938.8 million for the year ended December 31, 2019 as compared to the same period in 2018. The increase in SG&A expenses was primarily due to (i) a $43.7 million increase from growth in employee headcount to support current and anticipated growth in future revenue as well as compensation increases, (ii) $18.4 million in compensation costs related to a stock option modification and special cash bonus to option holders, (iii) an increase in professional fees, including acquisition and IPO transaction costs of $15.3 million and (iv) a $12.2 million increase in technology costs related to both licensing and cloud services and the implementation of a new enterprise resource planning system. The increase in SG&A expenses was partially offset by a 1.4% decrease from the favorable impact from foreign currency exchange rates. As a percentage of revenue, SG&A expenses increased to 23.3% for the year ended December 31, 2019 as compared to 21.7% in the same period in 2018 primarily due to the factors identified above.
SG&A expenses increased $3.7 million to $813.0 million for the year ended December 31, 2018 as compared to the same period in 2017. The increase in SG&A expenses was primarily due to (i) a $9.5 million increase from growth in employee headcount to support current and anticipated growth in future revenue as well as compensation increases and (ii) an inorganic increase of $3.3 million from the 2017 Acquisition, partially offset by $10.4 million of lower stock-based compensation, severance and other related costs. The increase in SG&A expenses included a 0.4% increase from the unfavorable impact from foreign currency exchange rates. As a percentage of revenue, SG&A expenses decreased to 21.7% for the year ended December 31, 2018 as compared to 27.0% in the same period in 2017. Excluding the impact from the adoption of ASC 606, as a percentage of revenue, SG&A expenses decreased to 26.7% for the year ended December 31, 2018.
Recapitalization Costs
Years Ended December 31, | ||||||||||||
(in thousands) | 2019 | 2018 | 2017 | |||||||||
Recapitalization costs | $ | — | $ | — | $ | 114,766 | ||||||
Recapitalization costs associated with the recapitalization of the Company were $114.8 million for the year ended December 31, 2017 and consisted of (i) $51.2 million of transaction costs, (ii) $52.2 million of stock-based compensation expense for the vesting and cash settlement of stock options, (iii) $4.3 million of accelerated other compensation expense for special cash bonuses to option holders and (iv) $7.1 million of other compensation expense for payroll taxes related to the cash and share settlement of stock options and special cash bonuses to option holders. There were no recapitalization costs for the years ended December 31, 2019 or 2018.
Depreciation and Amortization
Years Ended December 31, | ||||||||||||
(in thousands) | 2019 | 2018 | 2017 | |||||||||
Depreciation and amortization | $ | 264,830 | $ | 258,974 | $ | 279,066 | ||||||
Depreciation and amortization was $264.8 million for the year ended December 31, 2019 as compared to $259.0 million in the same period in 2018. The increase in depreciation and amortization expense primarily relates to the impact from (i) our laboratory facilities expansion, (ii) new purchased and internally developed software and (iii) the definite-lived intangibles amortization impact from the 2019 Acquisitions, partially offset by a decrease due to the timing of amortization of certain definite-lived intangible assets and a favorable impact from foreign currency exchange rates.
Depreciation and amortization was $259.0 million for the year ended December 31, 2018 as compared to $279.1 million in the same period in 2017. Depreciation and amortization expense decreased primarily due to certain definite-lived intangible assets and internally developed software becoming fully amortized in 2017, partially offset by an unfavorable impact from foreign currency exchange rates.
Goodwill and Long-Lived Asset Impairments
Years Ended December 31, | ||||||||||||
(in thousands) | 2019 | 2018 | 2017 | |||||||||
Goodwill and long-lived asset impairments | $ | 1,284 | $ | 29,626 | $ | 43,459 | ||||||
54
Goodwill impairment was $29.6 million for the year ended December 31, 2018 as compared to $38.4 million in the same period in 2017. Our 2018 and 2017 annual goodwill impairment tests each indicated that one reporting unit in our Clinical Development Services segment had an estimated fair value below carrying value as a result of decreases in future cash flows. The goodwill impairments in 2018 and 2017 were recorded on different reporting units. There was no goodwill impairment in 2019.
In 2018, the expected future cash flows of the reporting unit decreased due to lower forecasted long-term revenue growth and higher forecasted operating expenses, resulting in reduced margins. In 2017, the expected future cash flows of the reporting unit decreased due to lower forecasted long-term revenue growth and reduced margins, primarily as a result of the loss of certain key customers.
Interest Expense, Net
Years Ended December 31, | ||||||||||||
(in thousands) | 2019 | 2018 | 2017 | |||||||||
Interest expense, net | $ | 311,744 | $ | 263,618 | $ | 253,891 | ||||||
Interest expense, net, was $311.7 million for the year ended December 31, 2019 as compared to $263.6 million in the same period in 2018. The increase in interest expense is due to $49.1 million of interest expense related to the issuance of the Additional HoldCo Notes and an increase in the interest rate on our term loan under our senior secured credit facilities for a portion of the year, partially offset by favorable amortization from our terminated interest rate swaps.
Interest expense, net, was $263.6 million for the year ended December 31, 2018 as compared to $253.9 million in the same period in 2017. The overall increase in interest expense is due to $16.0 million of interest expense from the issuance of the Initial HoldCo Notes in connection with the May 2017 recapitalization of the Company and an increase in the interest rate on our term loan under our senior secured credit facilities from 4.38% to 5.02%. These increases were partially offset by favorable interest rate swaps and the impact of a repricing of our term loan in March 2018 resulting in a lower margin on our term loan.
(Loss) Gain on Investments
Years Ended December 31, | ||||||||||||
(in thousands) | 2019 | 2018 | 2017 | |||||||||
(Loss) gain on investments | $ | (19,043 | ) | $ | 15,936 | $ | 92,750 | |||||
Loss on investments was $19.0 million for the year ended December 31, 2019 as compared to a gain of $15.9 million in the same period in 2018. The loss for 2019 and gain for 2018, respectively, was primarily a result of changes in the fair values of the net asset values of our investments, partially offset by changes to the discounts on certain investments.
Gain on investments was $15.9 million for the year ended December 31, 2018 as compared to a gain of $92.8 million in the same period in 2017. The gain in 2018 and 2017 was primarily a result of increases in the fair value of the net asset values of our investments, partially offset by changes to the discount on certain investments.
The gains or losses from our investments will likely continue to fluctuate from period to period primarily based on the changes in fair value of the underlying holdings of the limited partnerships and changes in the discounts applied to such investments for our lack of control and lack of marketability, where applicable.
Other (Expense) Income, Net
Years Ended December 31, | ||||||||||||
(in thousands) | 2019 | 2018 | 2017 | |||||||||
Other (expense) income, net | $ | (27,143 | ) | $ | 21,701 | $ | (40,259 | ) | ||||
Other expense, net, was $27.1 million for the year ended December 31, 2019 as compared to other income, net of $21.7 million in the same period in 2018. Foreign exchange rate movement resulted in transaction and re-measurement losses of $24.7 million for the year ended December 31, 2019 and transaction and re-measurement gains of $16.7 million in the same period in 2018.
55
Other income, net, was $21.7 million for the year ended December 31, 2018 as compared to other expense, net, of $40.3 million in the same period in 2017. The change in other income (expense), net, was primarily due to foreign exchange rate movement that resulted in transaction and re-measurement gains of $16.7 million for the year ended December 31, 2018 as compared to transaction and re-measurement losses of $40.1 million in the same period in 2017.
Provision for (Benefit from) Income Taxes
Years Ended December 31, | ||||||||||||
(dollars in thousands) | 2019 | 2018 | 2017 | |||||||||
Provision for (benefit from) income taxes | $ | 2,957 | $ | 39,579 | $ | (284,360 | ) | |||||
Effective income tax rate | 5.0 | % | 27.0 | % | (1,726.6 | )% | ||||||
Our provision for income taxes was $3.0 million, resulting in an effective income tax rate of 5.0%, for the year ended December 31, 2019 as compared to $39.6 million, or an effective income tax rate of 27.0%, in the same period in 2018. Our provision for income taxes for the year ended December 31, 2019 was primarily due to the estimated tax effect on our income before provision for income taxes offset by the impact from the benefit related to state taxes, net of federal benefit, related to the Tax Act, as well as the realization of carryforward foreign tax attributes and an increase in foreign R&D credits. Our provision for income taxes for the year ended December 31, 2018 was primarily due to the estimated tax effect on our income before provision for income taxes, which included a decrease in the corporate statutory tax rate and other tax impacts as a result of the Tax Act.
Our provision for income taxes was $39.6 million, resulting in an effective income tax rate of 27.0%, for the year ended December 31, 2018, as compared to a benefit from income taxes of $284.4 million, or an effective income tax rate of (1,726.6)%, in the same period in 2017. Our provision for income taxes for the year ended December 31, 2018 was primarily due to the estimated tax effect on our income before provision for income taxes, which included a decrease in the corporate statutory tax rate and other tax impacts as a result of the Tax Act. Our benefit from income taxes for the year ended December 31, 2017 was primarily due to (i) the net impacts of the Tax Act, including the benefit on our deferred tax liabilities from the decrease in the corporate statutory tax rate, the generation of foreign tax credits and the release of a deferred tax liability for accumulated unremitted foreign earnings, offset by the inclusion of the one-time mandatory transition tax and (ii) the estimated tax effect of certain stock-based and other compensation costs, offset by certain non-deductible transaction costs, all related to the recapitalization of the Company in May 2017.
Segment Results of Operations
We assess our segment revenue on a direct revenue basis, excluding third-party pass-through and out-of-pocket revenue. Clinical Development Services and Laboratory Services segment revenue, segment direct costs, segment SG&A expenses and segment operating income for the years ended December 31, 2019, 2018 and 2017 are detailed below.
Clinical Development Services
Change | ||||||||||||||||||||||||||
Years Ended December 31, | 2019 vs. 2018 | 2018 vs. 2017 | ||||||||||||||||||||||||
(dollars in thousands) | 2019 | 2018 | 2017 | $ | % | $ | % | |||||||||||||||||||
Segment revenue | $ | 2,545,046 | $ | 2,336,005 | $ | 2,319,103 | $ | 209,041 | 8.9 | % | $ | 16,902 | 0.7 | % | ||||||||||||
Segment direct costs | 1,164,906 | 1,058,245 | 1,053,557 | 106,661 | 10.1 | 4,688 | 0.4 | |||||||||||||||||||
Segment SG&A expenses | 530,311 | 476,408 | 464,794 | 53,903 | 11.3 | 11,614 | 2.5 | |||||||||||||||||||
Segment operating income | 849,829 | 801,352 | 800,752 | 48,477 | 6.0 | 600 | 0.1 | |||||||||||||||||||
56
Segment Revenue
Clinical Development Services’ segment revenue was $2,545.0 million for the year ended December 31, 2019, an increase of $209.0 million as compared to the same period in 2018. Segment revenue increased (i) 8.7% from organic volume growth in our Phase II-IV clinical trial management services, site and patient access services and medical communications services, as well as higher opening backlog at the beginning of the year and (ii) 1.1% from inorganic growth due to the 2019 Acquisitions. The increase in segment revenue was partially offset by a 0.8% decrease from the unfavorable impact from foreign currency exchange rates. The higher opening backlog was primarily due to increased net authorizations for our Phase II-IV clinical trial management services in 2018.
Clinical Development Services’ segment revenue was $2,336.0 million in 2018, an increase of $16.9 million as compared to the same period in 2017. Segment revenue increased 0.4% due to inorganic growth from the 2017 Acquisition and 0.7% due to favorable foreign currency exchange rates, partially offset by a 0.4% decrease in organic volume. The decrease in organic growth was primarily the result of a lower opening backlog and a decrease in net authorizations in 2017 in our Phase II-IV clinical trial management services.
Segment Direct Costs
Clinical Development Services’ segment direct costs were $1,164.9 million for the year ended December 31, 2019, an increase of $106.7 million as compared to the same period in 2018. The increase in segment direct costs was primarily due to (i) a $66.9 million increase from growth in employee headcount and contract labor to support current and anticipated growth in future revenue as well as compensation increases, (ii) a $16.5 million increase from the impact of the 2019 Acquisitions and (iii) an increase in project delivery costs including media-related costs for patient recruitment services. The increase in segment direct costs was partially offset by a 1.8% decrease from the favorable impact from foreign currency exchange rates.
Clinical Development Services’ segment direct costs were $1,058.2 million in 2018, an increase of $4.6 million as compared to the same period in 2017. The increase in segment direct costs was primarily due to (i) a $20.2 million increase from growth in employee headcount to support current and anticipated growth in future revenue as well as compensation increases, (ii) an increase in media-related costs for patient recruitment services and (iii) an inorganic increase of $5.2 million for the 2017 Acquisition, partially offset by increased R&D incentive credits and a $23.1 million decrease in temporary labor and certain other project delivery costs. The increase in segment direct costs included a 0.9% increase from the unfavorable impact from foreign currency exchange rates.
Segment SG&A Expenses
Clinical Development Services’ segment SG&A expenses were $530.3 million for the year ended December 31, 2019, an increase of $53.9 million as compared to the same period in 2018. The increase in segment SG&A expenses was primarily due to (i) a $32.2 million increase from growth in employee headcount to support current and anticipated growth in future revenue as well as compensation increases and (ii) a $7.1 million increase from the impact of the 2019 Acquisitions. The increase in segment SG&A expenses was partially offset by a 1.7% decrease from the favorable impact from foreign currency exchange rates.
Clinical Development Services’ segment SG&A expenses were $476.4 million in 2018, an increase of $11.6 million as compared to the same period in 2017. The increase in segment SG&A expenses was primarily due to (i) a $13.4 million increase from growth in employee headcount to support current and anticipated growth in future revenue as well as compensation increases and (ii) an increase of $3.3 million from the impact of the 2017 Acquisition, partially offset by a decrease in bad debt expense. The increase in segment SG&A expenses included a 0.7% increase from the unfavorable impact from foreign currency exchange rates.
57
Laboratory Services
Change | ||||||||||||||||||||||||||
Years Ended December 31, | 2019 vs. 2018 | 2018 vs. 2017 | ||||||||||||||||||||||||
(dollars in thousands) | 2019 | 2018 | 2017 | $ | % | $ | % | |||||||||||||||||||
Segment revenue | $ | 598,691 | $ | 501,805 | $ | 448,373 | $ | 96,886 | 19.3 | % | $ | 53,432 | 11.9 | % | ||||||||||||
Segment direct costs | 307,346 | 258,473 | 235,137 | 48,873 | 18.9 | 23,336 | 9.9 | |||||||||||||||||||
Segment SG&A expenses | 83,130 | 70,673 | 60,097 | 12,457 | 17.6 | 10,576 | 17.6 | |||||||||||||||||||
Segment operating income | 208,215 | 172,659 | 153,139 | 35,556 | 20.6 | 19,520 | 12.7 | |||||||||||||||||||
Segment Revenue
Laboratory Services’ segment revenue was $598.7 million for the year ended December 31, 2019, an increase of $96.9 million as compared to the same period in 2018. Segment revenue increased from organic volume growth across all our laboratory services, including increased net authorizations in 2019, as well as higher opening backlog at the beginning of the year. The higher opening backlog was primarily due to increased net authorizations in 2018.
Laboratory Services’ segment revenue was $501.8 million in 2018, an increase of $53.4 million as compared to the same period in 2017. Segment revenue increased primarily from organic volume growth from our bioanalytical and GMP laboratory services as well as higher opening backlog at the beginning of the year. The higher opening backlog was primarily due to increased net authorizations in 2017.
Segment Direct Costs
Laboratory Services’ segment direct costs were $307.3 million for the year ended December 31, 2019, an increase of $48.9 million as compared to the same period in 2018. The increase in segment direct costs was primarily due to (i) a $27.9 million increase from growth in employee headcount to support current and anticipated growth in future revenue as well as compensation increases and (ii) an increase in laboratory supply costs associated with the growth in revenue.
Laboratory Services’ segment direct costs were $258.5 million in 2018, an increase of $23.3 million as compared to the same period in 2017. The increase in segment direct costs was primarily due to (i) a $19.1 million increase from growth in employee headcount to support current and anticipated growth in future revenue as well as compensation increases and (ii) an increase in laboratory supplies costs associated with the growth in revenue.
Segment SG&A Expenses
Laboratory Services’ segment SG&A expenses were $83.1 million for the year ended December 31, 2019, an increase of $12.5 million as compared to the same period in 2018. The increase in segment SG&A expenses was primarily due to a $9.1 million increase from growth in employee headcount to support current and anticipated growth in future revenue as well as compensation increases.
Laboratory Services’ segment SG&A expenses were $70.7 million in 2018, an increase of $10.6 million as compared to the same period in 2017. The increase in segment SG&A expenses was primarily due to an $8.3 million increase from growth in employee headcount to support current and anticipated growth in future revenue as well as compensation increases.
58
Liquidity and Capital Resources
Overview
We assess our liquidity in terms of our ability to generate adequate amounts of cash to meet current and future needs. Our expected primary cash uses on a short-term and long-term basis are for repayment of debt, interest payments, working capital, capital expenditures, geographic or service offering expansion, acquisitions, investments and other general corporate purposes. We have historically funded our operations with cash flows from operations. We have historically used long-term debt and cash on hand to fund acquisitions and make special cash dividends or distributions to our stockholders. We hold our cash balances in the United States and numerous locations in the rest of the world.
The following table presents key measures of our liquidity on the dates set forth below:
(in thousands) | December 31, | |||||||
2019 | 2018 | |||||||
Cash and cash equivalents: | ||||||||
Cash held in the United States | $ | 135,917 | $ | 371,495 | ||||
Cash held in foreign locations | 209,270 | 181,571 | ||||||
Total | $ | 345,187 | $ | 553,066 | ||||
Revolving Credit Facility (net of letters of credit) | $ | 298,370 | $ | 298,370 | ||||
During May 2019, we amended the Initial HoldCo Notes indenture to permit us to make special cash dividends and distributions to our stockholders. Expenses of $11.0 million for consent fees were deferred in connection with this debt modification. Additionally, during May 2019, we issued $900.0 million of Additional HoldCo Notes at 99% of face value, or a discount of 1.0%. We used the net proceeds from the Additional HoldCo Notes, together with cash on hand, to pay a special cash dividend of $1,086.0 million to our stockholders, as well as pay for fees and expenses associated with the debt issuance. Debt issuance costs of $18.2 million, consisting primarily of underwriters’ and professional fees, were deferred in connection with this debt issuance. During November 2019, we declared, and subsequently paid, a special cash dividend to our stockholders of $160.0 million with cash on hand.
As a result of the recapitalization of the Company in 2017, we incurred certain future obligations associated with potential additional recapitalization consideration. During 2018, we finalized the amount of the recapitalization tax benefit liability and distributed $108.3 million from our cash and cash equivalents on-hand to the pre-closing holders. We do not expect the payment of the recapitalization investment portfolio liability (as defined in our audited consolidated financial statements included elsewhere on this Annual Report on Form 10-K) to impact our future liquidity or capital resources as the right for the pre-closing holders to receive any such payment depends upon receipt of future cash proceeds from the applicable portion of the investment portfolio. We have classified in long-term liabilities the portion of the investment portfolio we estimate to be payable, net of taxes and other expenses, to the pre-closing holders. Future payments will be required to be made, if and when, cash proceeds are received and are payable under the recapitalization transaction merger agreement. For example, as required under the recapitalization transaction merger agreement, during 2018 and 2017, we made cash distributions of $16.0 million and $10.5 million, respectively, for the payment of a portion of the recapitalization investment portfolio liability from the cash proceeds received from the investment portfolio. No distributions for the recapitalization investment portfolio liability were made in 2019.
As of December 31, 2019, we had total long-term debt and finance lease obligations outstanding of approximately $5.7 billion. See “Indebtedness” and Note 10, “Long-term Debt and Finance Lease Obligations,” to our audited consolidated financial statements included elsewhere in this Annual Report on Form 10-K for further discussion and additional information regarding our debt instruments and other obligations, including the redemption of the HoldCo Notes from the use of proceeds from the IPO.
59
We expect to continue funding our operations from existing cash, cash flows from operations and, if necessary or appropriate, borrowings under our revolving credit facility, which remains undrawn. We believe that these sources of liquidity will be sufficient to fund our operations and service our debt and interest for the foreseeable future. From time to time, we evaluate potential acquisitions, investments and other growth and strategic opportunities that might require use of existing cash, borrowings under our revolving credit facility or additional long-term financing. We may also use existing cash and cash flows from operations to pay down additional long-term debt from time to time.
While we believe we have sufficient liquidity to fund our operations for the foreseeable future, our sources of liquidity could be affected by factors described under “Indemnification and Insurance” within Part I, Item 1, “Business,”; Part I, Item 1A, “Risk Factors,”; “Contractual Obligations and Commercial Commitments,” and “Critical Accounting Policies and Estimates,” within Part II, Item 7 “Management’s Discussion and Analysis of Financial Condition and Results of Operations,”; and Part II, Item 7A, “Quantitative and Qualitative Disclosures about Market Risk,” included elsewhere in this Annual Report on Form 10-K.
Cash Flows
Year Ended December 31, 2019 versus Year Ended December 31, 2018 and Year Ended December 31, 2018 versus Year Ended December 31, 2017
Cash flows from operating activities
Years Ended December 31, | ||||||||||||
(in thousands) | 2019 | 2018 | 2017 | |||||||||
Net cash provided by operating activities | $ | 432,946 | $ | 423,406 | $ | 359,079 | ||||||
2019 compared to 2018
The increase in operating cash flows of $9.5 million was due to a $41.1 million increase in cash from the changes in operating assets and liabilities, partially offset by a $31.6 million decrease in net income and non-cash reconciling items. The change in operating assets and liabilities was primarily due to period over period fluctuations in the timing of collections and payments, with the source of cash from (i) net accounts receivable (defined as the sum of period-end balances of accounts receivable and unbilled services net of unearned revenue), (ii) accounts payable, accrued expenses and other liabilities and (iii) income taxes being favorable and the use of cash for (i) operating lease liabilities, (ii) prepaid expenses and other current assets and (iii) other assets being unfavorable.
The decrease in net income and non-cash reconciling items was primarily due to (i) a decrease in net income, (ii) an increase in the deferred income tax benefit and (iii) goodwill impairment recorded in the prior year but not in the current year, partially offset by (i) non-cash operating lease expense and (ii) an unrealized loss on investments recorded in the current year, compared to an unrealized gain on investments in the prior year. The change in operating lease liabilities and the non-cash operating lease expense was the result of the adoption of ASC 842.
The change in the source of cash for net accounts receivable of $76.8 million for the year ended December 31, 2019 was largely due to a decrease in days sales outstanding, which represents the number of days revenue is outstanding in net accounts receivable, as well as the timing in the receipt of collections and contractual billings under our contracts. Other changes to cash flows from operating activities include a $37.6 million increase in cash paid for interest and a $7.8 million net increase in cash paid for income taxes during the year ended December 31, 2019 as compared to the same period in 2018. Cash paid for interest increased primarily due to the issuance of the Additional HoldCo Notes in May 2019. Additionally, cash paid for interest increased due to higher interest rates on our term loan for a portion of the year ended December 31, 2019. Cash paid for income taxes increased as a result of increased tax payments in certain foreign jurisdictions due to increases in pre-tax income from foreign subsidiaries, partially offset by foreign income tax refunds recognized during the year ended December 31, 2019. Additionally, for the year ended December, 31 2019, we paid special cash bonuses of $21.1 million to option holders in connection with the special cash dividends to our stockholders that we declared in May 2019 and November 2019, and subsequently paid.
60
2018 compared to 2017
The increase in operating cash flows of $64.3 million was due to a $74.2 million increase in net income and non-cash reconciling items, partially offset by a $9.9 million decrease in cash from the changes in operating assets and liabilities. The change in operating assets and liabilities was primarily due to period over period fluctuations in the timing of collections and payments, with the use of cash for (i) accounts payable, accrued expenses and other liabilities and (ii) prepaid expenses and other current assets being unfavorable and the source of cash for (i) net accounts receivable (defined as the sum of period-end balances of accounts receivable and unbilled services net of unearned revenue), (ii) income taxes and (iii) certain assets being favorable. The increase in net income and non-cash reconciling items was primarily due to an increase in income from operations and a decrease in the cash used as a result of the costs related to the 2017 recapitalization of the Company, which did not reoccur during 2018, and growth in the business.
The change in source of cash for net accounts receivable of $94.6 million for the year ended December 31, 2018 was largely a result of a decrease in days sales outstanding. Other changes to cash flows from operating activities included a $24.1 million increase in cash paid for interest and a $21.3 million increase in cash paid for income taxes during 2018 as compared to 2017. Cash paid for interest increased primarily as a result of the issuance of the Initial HoldCo Notes in May 2017 as part of the recapitalization. Cash paid for income taxes increased during 2018 as compared to 2017 as a result of increased tax payments in certain foreign jurisdictions due to increases in pre-tax income from foreign subsidiaries.
Cash flows from investing activities
Years Ended December 31, | ||||||||||||
(in thousands) | 2019 | 2018 | 2017 | |||||||||
Net cash used in investing activities | $ | (233,228 | ) | $ | (90,525 | ) | $ | (92,743 | ) | |||
2019 compared to 2018
The increase in cash used during 2019 was primarily due to (i) the net cash paid for the 2019 Acquisitions of $74.2 million, (ii) new and incremental investments in unconsolidated affiliates, (iii) a decrease in distributions received from investments and (iv) an increase in purchases of property and equipment. Additionally, the increase in cash used resulted from $8.0 million of net cash proceeds received from the sale of a business in the prior year and no proceeds from the sale of a business in the current year.
Cash paid for investments in unconsolidated affiliates in 2019 and 2018 was $30.0 million and $9.0 million, respectively. Cash paid for property and equipment was $125.9 million and $116.1 million for 2019 and 2018, respectively. The increase in cash paid for property and equipment was primarily due to the timing of payments and year over year growth in the business. The decrease in cash received from investments resulted from distributions received from investments in 2019 that were $27.3 million lower than the prior year. The distributions received from investments will vary from period to period based on the timing and amount of distributions received, if any.
2018 compared to 2017
The decrease in cash used during 2018 was primarily due to the net cash paid for the acquisition of Optimal Research of $24.2 million in 2017 and an increase in net cash proceeds from the sale of business of $8.0 million in 2018. The decrease in cash used was partially offset by (i) an increase in net cash used for property and equipment, (ii) cash used for a new investment in an unconsolidated affiliate and (iii) a decrease in cash received from investments.
Cash paid for property and equipment was $116.1 million and $105.1 million for 2018 and 2017, respectively. The increase in cash paid for property and equipment was primarily due to the timing of payments. Cash paid for a new investment in an unconsolidated affiliate was $9.0 million in 2018. The decrease in cash received from investments resulted from distributions received from investments in 2018 that were $8.6 million lower than the prior year. The distributions received from investments will vary from period to period based on the timing and amount of distributions received, if any.
61
Cash flows from financing activities
Years Ended December 31, | ||||||||||||
(in thousands) | 2019 | 2018 | 2017 | |||||||||
Net cash used in financing activities | $ | (422,039 | ) | $ | (166,942 | ) | $ | (249,393 | ) | |||
2019
During 2019, the use of cash was primarily due to special cash dividends paid to our stockholders, partially offset by the cash proceeds received from additional long-term borrowings. During the second quarter of 2019, we borrowed $891.0 million net cash under the Additional HoldCo Notes to fund, along with cash on hand, a special cash dividend of $1,086.0 million to our stockholders. Additionally, in the fourth quarter of 2019, we paid a special cash dividend of $160.0 million to our stockholders with the use of cash on hand. The use of cash also included $30.1 million in payments for debt issuance and debt modification costs associated with the issuance of the Additional HoldCo Notes and modification of the Initial HoldCo Notes. During 2019, payments on long-term debt and finance leases was $37.4 million, which includes quarterly principal payments on the term loan. The cash used for financing activities was partially offset by cash proceeds of $4.5 million from the exercise of stock options.
2018
During 2018, the use of cash was primarily due to the distribution of $108.3 million for the recapitalization tax benefit liability, quarterly principal payments on the term loan of $32.4 million, a recapitalization investment portfolio liability distribution of $16.0 million and the use of $8.6 million for the purchase of treasury stock.
2017
During 2017, the use of cash was primarily due to the effects of the recapitalization of the Company. The use of cash for the recapitalization of the Company included $3.3 billion in payments for redemption of shares of common stock, $194.5 million for the cash settlement of options and $7.3 million in payments for transaction costs. The use of cash also included $11.9 million in payments for debt issuance costs associated with the issuance of the Initial HoldCo Notes, a recapitalization investment portfolio liability distribution of $10.5 million and the purchase of a portion of the noncontrolling interest held in our majority-owned consolidated subsidiary, PPD-SNBL K.K., for $7.1 million. The source of cash included $550.0 million in proceeds from the issuance of the Initial HoldCo Notes and $2.8 billion in proceeds from the issuance of shares of common stock in connection with the recapitalization of the Company. Additionally, the source of cash included $7.5 million from employee purchases of shares of common stock. Cash used for quarterly principal payments on our term loan was $32.4 million in 2017.
Indebtedness
The following table details our borrowings outstanding as of December 31, 2019 and the associated interest expense, including amortization of debt issuance and modification costs and debt discounts and the average effective interest rates for such borrowings for the year ended December 31, 2019:
Principal Balance | Interest Expense | |||||||||
(dollars in thousands) | December 31, 2019 | Average Effective Interest Rate | For Year Ended December 31, 2019 | |||||||
Term Loan | $ | 3,096,429 | 4.51% | $ | 156,257 | |||||
Revolving Credit Facility | — | — | 1,715 | |||||||
OpCo Notes | 1,125,000 | 6.61% | 73,761 | |||||||
Initial HoldCo Notes | 550,000 | 8.92% | 46,294 | |||||||
Additional HoldCo Notes | 900,000 | 8.90% | 49,116 | |||||||
Other debt | 5,707 | 1.13% | 86 | |||||||
Finance lease obligations | 28,726 | Various | 2,075 | |||||||
Total | $ | 5,705,862 | $ | 329,304 | ||||||
62
Senior Secured Credit Facilities
On August 18, 2015, Jaguar Holding Company II and Pharmaceutical Product Development, LLC (the “Borrowers”) entered into the senior secured credit facilities (the “Credit Agreement”) consisting of a $2.575 billion senior secured term loan (the “Term Loan”) issued at 99.5% of face value, or a discount of 0.5%, and a $300.0 million senior secured revolving credit facility (the “Revolving Credit Facility”). The Term Loan matures on August 18, 2022 and the Revolving Credit Facility matures on May 15, 2022.
In May and November of 2016, the Borrowers amended the Credit Agreement to borrow $200.0 million issued at 99.0% of face value, or a discount of 1.0% and $460.0 million issued at 99.75% of face value, or a discount of 0.25%, respectively. The incremental Term Loan borrowings had the same terms, including in respect of interest rate and maturity with the existing Term Loan. Additionally, in May of 2017 and March of 2018, the Borrowers amended the Credit Agreement for a reduction of 50 basis points and 25 basis points, respectively, in the margin under the Term Loan. Further, in April 2019, the Company amended the Credit Agreement to extend the maturity date of the Revolving Credit Facility from August 18, 2020 to May 15, 2022. There were no other significant changes to the terms and conditions of the Credit Agreement, Term Loan or the Revolving Credit Facility as a result of each amendment. As of December 31, 2019, we had approximately $3.1 billion of long-term debt outstanding related to our Term Loan. Additionally, we had available $298.4 million of unused credit capacity on our Revolving Credit Facility.
The Term Loan amortizes in equal quarterly installments in an amount equal to 1.0% per annum of the original principal amount thereof, with the balance due at maturity. We may voluntarily prepay loans or reduce commitments under the Credit Agreement, in whole or in part, subject to minimum amounts, with prior notice but without premium or penalty.
As of December 31, 2019, the Borrowers are obligated to pay the following fees under the Revolving Credit Facility: (i) an unused line fee of 0.375% per annum of the unused amount of the Revolving Credit Facility, (ii) a letter of credit participation fee of 3.25% per annum on the aggregate stated maximum amount of each letter of credit available to be drawn, (iii) a fronting fee of 0.125% per annum on the maximum daily amount of each letter of credit available to be drawn and (iv) other customary fees and expenses of the letter of credit issuers.
Borrowings under the Term Loan bear interest at a variable rate, at the Company’s option, of either (i) a Eurocurrency rate based on LIBOR for a specific interest period plus an applicable margin, subject to a Eurocurrency rate floor of 1.00%, or (ii) an alternate base rate plus an applicable margin, subject to a base rate floor of 2.00%. The margins for the Term Loan are fixed at 2.50% per annum for Eurocurrency rate loans and 1.50% per annum for base rate loans. As of December 31, 2019, the interest rate on the Term Loan was based on the Eurocurrency loan rate. The Borrowers were in compliance with all covenants under the Credit Agreement as of December 31, 2019.
In February 2020, we entered into three new interest rate swaps with a notional value of $3.5 billion to hedge the exposure to the variability in interest payments on our Term Loan, including any potential refinancing of our Term Loan that may occur in the future. See Note 22, “Subsequent Events,” to our audited consolidated financial statements included elsewhere in this Annual Report on Form 10-K for additional information.
OpCo Notes
On August 18, 2015, Jaguar Holding Company II and Pharmaceutical Product Development, LLC (the “Issuers”) issued in a private placement $1.125 billion of senior unsecured notes at par bearing interest at 6.375% per annum. The OpCo Notes mature on August 1, 2023 and interest is payable semi-annually on February 1 and August 1 of each year. The OpCo Notes do not have registration rights.
The Issuers can redeem the OpCo Notes, at their option, in whole at any time or in part from time to time, upon notice, at the various redemption prices (expressed as a percentage of principal amount), plus accrued and unpaid interest and additional interest, if any, to the redemption date (subject to the right of holders of record on the relevant record date to receive interest due on the relevant interest payment date). As of December 31, 2019, no redemptions have been made.
Additionally, upon the occurrence of specific change of control events, the Issuers are required to offer
to repurchase all of the OpCo Notes then outstanding at 101% of their principal amount, plus accrued and unpaid interest. To
date, no OpCo Notes have been redeemed. The Issuers were in compliance with all covenants under the OpCo
Notes indenture at December 31, 2019.
63
Additional and Initial HoldCo Notes
On May 14, 2019, Eagle Holding Company II (“Eagle II”) issued in a private placement $900.0 million of aggregate principal amount of unsecured 7.75%/8.50% Senior PIK Toggle Notes at 99% of face value, or a discount of 1.0% (the “Offering”). The Additional HoldCo Notes were set to mature on May 15, 2022 and interest was payable semi-annually on May 15 and November 15 of each year. We used the net proceeds from the Offering, together with cash on hand, to pay our stockholders a special cash dividend of $1,086.0 million, as well as pay for fees and expenses associated with the Offering.
In connection with the recapitalization of the Company, on May 11, 2017, Eagle II issued in a private placement $550.0 million aggregate principal amount of unsecured 7.625%/8.375% Senior PIK Toggle Notes at par. The Initial HoldCo Notes were set to mature on May 15, 2022 and interest was payable semi-annually on May 15 and November 15 of each year. In May 2019, we amended the Initial HoldCo Notes indenture to permit Eagle II to make special dividends and distributions to its stockholders.
On February 18, 2020, we redeemed the HoldCo Notes at a redemption price of 101% of the aggregate principal amount with the proceeds received from our IPO of our common stock. See Note 22, “Subsequent Events,” to our audited consolidated financial statements included elsewhere in this Annual Report on Form 10-K for additional information on the IPO and our redemption of the HoldCo Notes.
See Note 10, “Long-term Debt and Finance Lease Obligations,” to our audited consolidated financial statements included elsewhere in this Annual Report on Form 10-K for additional information regarding the senior secured credit facilities, OpCo Notes and HoldCo Notes.
Contractual Obligations and Commercial Commitments
As of December 31, 2019, future minimum payments on all our contractual obligations and commercial commitments for years subsequent to December 31, 2019 were as follows:
(in thousands) | 2020 | 2021-2022 | 2023-2024 | 2025-Thereafter | Total | |||||||||||||||
Long-term debt, including interest (1) | $ | 278,622 | $ | 4,969,686 | $ | 1,196,905 | $ | 5,772 | $ | 6,450,985 | ||||||||||
Finance leases | 4,730 | 9,865 | 8,945 | 12,069 | 35,609 | |||||||||||||||
Operating leases | 55,907 | 84,671 | 44,061 | 58,479 | 243,118 | |||||||||||||||
Purchase obligations and commitments (2) | 91,484 | 24,417 | 9,650 | 1,954 | 127,505 | |||||||||||||||
Other liabilities (3) | 20,787 | 28,436 | — | — | 49,223 | |||||||||||||||
Total | $ | 451,530 | $ | 5,117,075 | $ | 1,259,561 | $ | 78,274 | $ | 6,906,440 | ||||||||||
(1) | We may be required to make mandatory prepayments of principal under the Term Loan in future years based on our cash flows in those years. Future interest expense on our indebtedness included in the above table is calculated assuming a blended rate of 5.6%. The above amounts do not include interest costs related to the Revolving Credit Facility, as it was undrawn as of December 31, 2019. The amounts above also assume that the amounts outstanding at December 31, 2019 will remain outstanding until maturity, with minimum payments occurring as currently scheduled and no assumed future borrowings. |
(2) Purchase obligations are defined as obligations under agreements to purchase goods or services that are enforceable and legally binding on us, and that specify all significant terms, including fixed or minimum quantities to be purchased, fixed, minimum or variable price provisions and the approximate timing of the transaction. Included in these amounts are $7.5 million of commitments for future capital calls on our investments.
(3) We have included the expected funding contributions to our pension plan of $7.4 million, which are discretionary and can change at any time based on (i) updated statutory funding position calculations, (ii) resulting changes to the funding recovery plan and (iii) other factors determined by us. We have excluded from the amounts above our unrecognized tax benefits of $39.7 million due to the uncertainty regarding the timing of future tax payments, if any, associated with our unrecognized tax benefits, and we have excluded from the amounts above the Recapitalization Investment Portfolio Liability of $191.7 million due to uncertainty regarding the timing of future payments, if any, and because the payments are not guaranteed.
64
Included below are the as adjusted future payments on our long-term debt, including interest, as of December 31, 2019. The as adjusted amounts below reflect the February 18, 2020 redemption of the HoldCo Notes in connection with the IPO. For years subsequent to December 31, 2019, the as adjusted projected payments on our long-term debt, including interest, were as follows:
(in thousands) | 2020 | 2021-2022 | 2023-2024 | 2025-Thereafter | Total | |||||||||||||||
Long-term debt, including interest (1) | $ | 236,713 | $ | 3,421,798 | $ | 1,196,905 | $ | 5,772 | $ | 4,861,188 | ||||||||||
(1) | We may be required to make mandatory prepayments of principal under the Term Loan in future years based on our cash flows in those years. Future interest expense on our indebtedness is calculated assuming a blended rate of 4.8%. The as adjusted above amounts do not include interest costs related to the Revolving Credit Facility, as it was undrawn as of December 31, 2019. The as adjusted amounts above also assume that the amounts will remain outstanding until maturity, with minimum payments occurring as currently scheduled and no future borrowings. |
Off-balance Sheet Arrangements
We have no off-balance sheet arrangements. Off-balance sheet arrangements represent any transaction, agreement or other contractual arrangement involving an unconsolidated entity under which we have guarantee contracts, retained or contingent interests in transferred assets, any obligation under derivative instruments classified as equity or any obligation arising out of material variable interests that serves as credit, liquidity or market risk support for such interest.
Critical Accounting Policies and Estimates
Our accounting policies are more fully described in Note 1, “Basis of Presentation and Summary of Significant Accounting Policies,” to our audited consolidated financial statements included elsewhere in this Annual Report on Form 10-K. The preparation of financial statements in conformity with generally accepted accounting principles requires management to make estimates and assumptions that affect the reported amounts of assets and liabilities and disclosure of contingent assets and liabilities at the date of the financial statements and the reported amounts of revenues and expenses during the reporting period. We monitor estimates on a continuous basis and update them as facts and circumstances change and new information is obtained. Actual results could differ from those estimates and assumptions. We believe the following accounting policies are most critical to the portrayal of our results of operations and financial condition and require management’s most difficult, subjective and complex judgments.
65
Revenue Recognition
Revenue recognition under ASC 606
In May 2014, the FASB issued an accounting standards update, as amended, on revenue from contracts with customers. The new guidance outlined a single comprehensive model for entities to use in accounting for revenue from contracts with customers. We adopted ASC 606 on January 1, 2018 using the modified retrospective method for all contracts not completed as of the date of adoption.
We enter into contracts with customers to provide services in which contract consideration is generally based on fixed-fee or variable pricing arrangements. In accordance with ASC 606, we recognize revenue arising from contracts with customers in an amount that reflects the consideration that we expect to receive in exchange for the services we provide. We determine our revenue recognition through the following five steps: (i) identification of the contract with a customer, (ii) identification of the performance obligations in the contract, (iii) determination of the transaction price, (iv) allocation of the transaction price to the performance obligations in the contract and (v) recognition of revenue when, or as, we satisfy performance obligations in the contract. Our contracts are service contracts that generally have a duration of a few months to several years with revenue being recognized primarily over time as services are provided to the customer in satisfaction of the performance obligations.
The majority of our contracts can be terminated by the customer either immediately or after a specified notice period. Upon early termination, the contracts generally require the customer to pay us for: (i) consideration earned through the termination date, which is consistent with the level of cost and effort expended through the termination date, (ii) consideration for services to complete the work still required to be performed and reimbursement for other related expenses, as applicable, (iii) reimbursement for certain non-cancelable expenditures and (iv) in certain cases, payment to cover a portion of the total consideration under the contract or a termination penalty.
Changes to the scope of our services are common, especially under long-term contracts, and a change in the scope of services generally results in a change in the transaction price. Changes in scope are reflected through contract modifications which are assessed on a contract-by-contract basis to determine if they should be accounted for as a new contract or part of the original contract. Generally, contract modifications are accounted for as part of the existing contract as the services to be provided for the modification are not distinct from the existing services provided under the contract. When contract modifications are accounted for as part of the existing contract, the effect of the contract modification on the transaction price and measure of progress under the contract is recognized as a cumulative adjustment to revenue as of the date of the modification.
In certain cases, our contracts include variable consideration that is contingent upon the occurrence of future events, such as volume rebates, performance incentives and performance penalties or other variable consideration such as third-party pass-through and out-of-pocket costs incurred, which may impact the transaction price. Variable consideration is estimated using the expected value or the most likely amount of consideration and is included in the transaction price to the extent that it is probable that a significant reversal in the amount of cumulative revenue recognized will not occur when the uncertainty associated with the variable consideration is subsequently resolved. The estimation of variable consideration is based on our expected performance under the contract and where applicable, available historical, current and forecasted information to support such estimate. Actual results could differ significantly from estimates.
We incur third-party pass-through and out-of-pocket costs in the performance of services under its contracts which are reimbursed by the customer. Third-party pass-through and out-of-pocket costs include, but are not limited to, payments to investigators, payments for the use of third-party technology, shipping costs and travel costs related to the performance of services, among others. We record third-party pass-through and out-of-pocket costs as revenue and the related costs incurred as reimbursed costs on the consolidated statements of operations. These reimbursed costs are included as revenue as we are the principal in the relationship, we are primarily responsible for the services provided by third parties and we significantly integrate the services of third parties with our own services in delivering a combined output to the customer. We exclude from revenue amounts collected and paid to governmental authorities, such as value-added taxes, that are associated with revenue transactions. All of our revenue is from contracts with customers.
66
Our clinical development services full-service clinical trial management contracts include multiple promised services such as trial feasibility, investigator recruitment, clinical trial monitoring, project management, database management and biostatistical services, among others. Our full-service clinical trial management services constitute a single performance obligation, which is the delivery of clinical trial data and related reports, as we provide a significant service of integrating all promises in the contract and the promises are highly interdependent and interrelated with one another. We use a cost-to-cost input method to recognize revenue for the satisfaction of the performance obligation for full-service contracts. Actual total costs incurred, which is inclusive of direct, third-party pass-through and out-of-pocket costs, is compared to the estimated total costs to satisfy the performance obligation under the contract. This ratio is then multiplied by the estimated total contract consideration to determine and recognize revenue. This methodology is consistent with the manner in which the customer receives the benefit of the work performed over time as services are rendered and is consistent with our contract termination provisions. Direct costs consist primarily of the amount of direct labor and certain overhead for the delivery of services. The inclusion of actual incurred and total estimated third-party pass-through and out-of-pocket costs in the measure of progress may create a timing difference between the amount of revenue recognized and the actual third-party pass-through and out-of-pocket costs incurred.
We recognize revenue for other clinical development services using a variety of input and output methods depending on the type of contract and/or the performance obligations in the contract. Methods utilized primarily include cost-to-cost, units delivered, such as patients recruited or tasks performed, and hours expended. The methods used align with the satisfaction of the performance obligations and benefits received by the customer over time, as the customer would not need to have the services re-performed if the remaining unfulfilled performance obligations were transferred to another party. When contracts for other clinical development services contain multiple performance obligations, the transaction price is allocated to each performance obligation based on a directly observable relative standalone selling price. When not directly observable, we utilize an expected cost plus a margin in order to estimate standalone selling price.
Our laboratory services contracts include multiple service promises such as research and development, sample testing, sample management, certain clinical trial management services and providing full-time equivalent resources, among others. Our laboratory contracts generally contain multiple performance obligations based on the types of services provided as we do not provide a significant integration service, nor are the services we provide highly interrelated or interdependent. We use a variety of output methods to recognize revenue depending on the type of contract and the performance obligations in the contract. Methods primarily utilized to recognize revenue include units delivered, milestones achieved and full-time equivalent resources provided. The methods used align with the satisfaction of the performance obligations and benefits received by the customer over time, as the customer would not need to have the services re-performed if the remaining unfulfilled performance obligations were transferred to another party. When contracts for other laboratory services contain multiple performance obligations, the transaction price is allocated to each performance obligation on a directly observable relative standalone selling price. When not directly observable, we utilize an expected cost plus a margin approach to estimate standalone selling price.
See Note 3, “Revenue,” to our audited consolidated financial statements included elsewhere in this Annual Report on Form 10-K for additional information.
Revenue recognition under ASC 605
Prior to the adoption of ASC 606 on January 1, 2018, we recognized revenue for services when all of the following criteria had been satisfied: (i) persuasive evidence of an arrangement existed, (ii) services had been rendered, (iii) the price to the customer was fixed or determinable and (iv) collectability was reasonably assured. We entered into contracts with customers to provide services in which contract consideration was generally based on fixed-fee or variable pricing arrangements and contracts generally had a duration of a few months to several years. Our contracts generally included multiple service deliverables including trial feasibility, investigator recruitment, clinical trial monitoring, project management, database management, biostatistical services and laboratory testing, among others. If each service deliverable within the contract had standalone value to the customer, each was treated as a separate unit of accounting. If each service deliverable did not have standalone value to the customer, the service deliverables were combined into a single unit of accounting.
67
For those contracts with multiple units of accounting, we allocated contract consideration based on the relative selling price of the separately identified units of accounting. The relative selling price method required a hierarchy of evidence to be followed when determining the best evidence of the selling price of a deliverable. The best evidence of selling price for a unit of accounting was vendor-specific objective evidence (“VSOE”), or the price charged when a deliverable was sold separately on a standalone basis. When VSOE was not available, relevant third-party evidence (“TPE”) of selling price was used, such as prices competitors charge for interchangeable services to similar customers. When neither VSOE nor TPE of selling price existed, we used our best estimate of selling price (“BESP”) considering all relevant information that was available without undue cost or effort. Generally, we were not able to establish VSOE or TPE of selling price for our service deliverables due to our service deliverables with multiple units of accounting being highly customized, the variability in prices charged to customers and the lack of available competitor information. Therefore, we generally allocated consideration at the inception of the contract using BESP. BESP was generally established based on market factors and conditions and Company-specific factors such as profit objectives, internal cost structure, market share and position and geographic region, among other factors.
The majority of our clinical development services contracts are fixed-fee, fee-for-service or time and materials contracts for clinical trial related services that represent a single unit of accounting. We primarily used the proportional performance method to recognize revenue for delivery of services for such contracts. Because of the service nature of our contracts, we believed that direct costs incurred reflected the hours incurred with hours representing the output of contracts. Thus, to measure performance under the proportional performance method, we compared direct costs incurred through a specified date to estimated total direct costs to complete the contract. Direct costs consisted primarily of the amount of direct labor and certain overhead costs for the delivery of services. We reviewed and revised the estimated total direct costs throughout the life of the contract, and recorded adjustments to revenue resulting from such revisions in the period in which the change in estimate was determined. This methodology was consistent with the manner in which the customer received the benefit of the work performed and was consistent with our contract termination provisions.
The majority of our laboratory services contracts are fixed-fee, fee-for-service or time and materials contracts that generally included multiple units of accounting. For those contracts with multiple service deliverables, we followed the relative selling price method to allocate contract consideration and recognized revenue as services were delivered once all other revenue recognition criteria were met.
We also incurred third-party pass-through and out-of-pocket costs which were generally reimbursable by its customers at cost. Prior to the adoption of ASC 606, third-party pass-through revenue and costs were presented on a net basis and out-of-pocket revenues and cost were presented on a gross basis as reimbursed revenue and reimbursed cost on the consolidated statements of operations. Additionally, third-party pass-through and out-of-pocket costs were excluded from the costs used in the measure of progress for contracts utilizing the proportional performance method to recognize revenue and revenue related to these reimbursed costs was recognized when the cost was incurred. We excluded from revenue amounts collected and paid to governmental authorities, such as value-added taxes, that were associated with revenue transactions.
Investments
We make investments in unconsolidated affiliates that are accounted for under the equity method if we exercise significant influence. Our other investments not accounted for under the equity method are accounted for at fair value. We have investments in two limited partnerships that we account for utilizing the fair value option, but for which fair values are not readily determinable. These limited partnerships invest in novel, innovative and potentially commercially viable biomedical products in clinical development and in early stage life sciences companies. It is inherently difficult to make accurate fair value estimates based on long-range projections of any pharmaceutical or biomedical product or early life sciences companies, especially with respect to products that have not completed clinical development and therefore have not received regulatory approval. Due to the lack of observable inputs, assumptions used can significantly impact the resulting fair value and therefore the partnerships’ results of operations. In addition, due to inherent uncertainty of valuation for these investments, estimates of fair value might differ materially from the value that would have been used had a ready market for these investments existed or from the value which would be realized upon disposition of these investments, and the differences could be material. The analysis of fair value for these investments requires significant judgments and can fluctuate from period to period. Changes in the fair value of these investments could have a material impact on our results of operations or financial condition.
68
The estimate of fair value involves an evaluation of the investment and its underlying assets, including the market for the investment, available information on historical and projected financial performance, the potential sale or initial public offering of the underlying assets, the stage of development of the underlying assets, recent private transactions, control over the investment partnership and the lack of marketability of the investments, as well as our expected holding period, among other considerations. We record the fair value of these investments at the net asset value determined by the investment partnership adjusted for the aforementioned factors, including a discount for our lack of control and the lack of marketability of the investments. We engaged an independent third-party valuation specialist to assist us in determining the discount for our lack of control and the lack of marketability of the investments. The discount for lack of marketability of the investments is based on (i) market data, including public studies that quantify market discounts; (ii) the discount implied by option pricing models; (iii) specific factors relative to the investment partnerships and (iv) the expected investment horizon. The lack of control discount is based on (i) observed control premiums paid for transactions in similar investments; (ii) observed control premiums for the industry and (iii) specific factors relative to the investment partnerships.
We adjust our discount based on updates to our expected holding period for the investments, changes in the volatilities of comparable investments impacting the lack of marketability of the investments and/or updated observed control premiums impacting the lack of control in the investments, as well as other qualitative factors discussed above.
See Note 7, “Investments,” and Note 15, “Fair Value Measurements,” to our audited consolidated financial statements included elsewhere in this Annual Report on Form 10-K for additional information.
Income Taxes
Changes in judgment as to recognition and/or measurement of tax positions may materially affect the estimate of our effective tax rate and, consequently, our results of operations. We consider many factors when evaluating and estimating our tax positions and tax benefits, which may require periodic adjustments and may not accurately anticipate actual outcomes.
We use estimates and judgments in calculating certain tax liabilities and determining the recoverability of certain deferred tax assets, which arise from net operating losses, tax credit carryforwards and temporary differences between the tax and financial statement recognition of revenue and expense. We are also required to reduce our deferred tax assets by a valuation allowance if, based on the weight of available evidence, it is more likely than not that all or some portion of the recorded deferred tax assets will not be realized in future periods.
In evaluating our ability to recover our deferred tax assets, in full or in part, we consider all available positive and negative evidence, including our past results of operations, the existence of cumulative losses in the most recent fiscal years, our forecast of future taxable income on a jurisdiction-by-jurisdiction basis and the potential impacts from tax legislation changes. In determining future taxable income, assumptions include the amount of federal, state and foreign pretax operating income, international transfer pricing policies, the reversal of temporary differences and the implementation of feasible and prudent tax planning strategies. These assumptions require significant judgment about the forecasts of future taxable income and are consistent with the plans and estimates we use to manage the underlying businesses. Changes in our assumptions could result in future increases or decreases to the valuation allowance, and ultimately income tax expense or benefit.
We have analyzed our filing positions in all significant federal, state and foreign jurisdictions where we are required to file income tax returns, as well as open tax years in these jurisdictions. The significant jurisdictions with periods subject to examination are the 2016 through 2018 tax years for the United States and the 2017 and 2018 tax years for the United Kingdom. Various foreign and state income tax returns are under examination by taxing authorities. We do not believe that the outcome of any examination will have a material impact on our results of operations, financial condition and/or cash flows.
See Note 12, “Income Taxes,” to our audited consolidated financial statements included elsewhere in this Annual Report on Form 10-K for additional information.
69
Goodwill
We allocate goodwill to each identified “reporting unit,” which is defined as an operating segment or one level below the operating segment (referred to as a component of the entity). We assign to goodwill the excess of the fair value of consideration conveyed for a business acquired over the fair value of identifiable net assets acquired. We review goodwill for impairment annually during the fourth quarter, and more frequently if impairment indicators arise, which requires significant judgment. Impairment indicators include events or changes in circumstances that would more likely than not reduce the fair value of a reporting unit with assigned goodwill below its carrying amount. We monitor events and changes in circumstances on a continuous basis between annual impairment testing dates to determine if any events or changes in circumstances indicate impairment.
The goodwill impairment test involves comparing the estimated fair value of each reporting unit, including goodwill, to its carrying value using a qualitative or quantitative analysis. If the qualitative analysis indicates that it is more likely than not that the estimated fair value is less than the carrying value for the reporting unit, we perform a quantitative analysis of the reporting unit. If based on the qualitative analysis it is more likely than not that the reporting unit’s estimated fair value exceeds its carrying value, no further analysis is required. If after performing the quantitative analysis it is more likely than not that the reporting unit’s carrying value exceeds estimated fair value, a goodwill impairment loss must be recognized in an amount equal to that excess for that reporting unit, not to exceed the total goodwill amount for that reporting unit. See Note 1, “Basis of Presentation and Summary of Significant Accounting Policies,” and Note 9, “Goodwill and Intangible Assets, Net,” to our audited consolidated financial statements included elsewhere in this Annual Report on Form 10-K for additional information.
The fair value of a reporting unit could be negatively impacted by future events and circumstances. Such events or circumstances include a future decline in our results of operations, a decline in the valuation of biopharmaceutical company stocks, a significant slowdown in the worldwide economy or the biopharmaceutical industry, failure to meet the performance projections included in our forecasts of future operating results, loss of key customers and a reduction in R&D spending or outsourcing by biopharmaceutical companies, among other events and circumstances.
When performing the quantitative analysis we estimate the fair value of each reporting unit using generally accepted valuation techniques, which include a weighted combination of income and market approaches. The income approach incorporates a discounted cash flow model in which the estimated future cash flows of the reporting unit are discounted using an appropriately risk-adjusted weighted-average cost of capital. The forecasts used in the discounted cash flow model for each reporting unit are based in part on strategic plans and represent our estimates based on current and forecasted business and market conditions. The market approach considers our results of operations and information about our publicly traded competitors, such as earnings multiples, making adjustments to the selected competitors based on size, strengths and weaknesses, as well as publicly announced acquisition transactions. The determination of fair value for each reporting unit requires significant judgments and estimates and actual results could be materially different than those judgments and estimates, resulting in goodwill impairment. As a result of these tests, we recognized goodwill impairment of $29.6 million and $38.4 million for the years ended December 31, 2018 and 2017 respectively, associated with one reporting unit each year in our Clinical Development Services segment, whose estimated fair value was below carrying value as a result of decreased expected future cash flows. We did not recognize any goodwill impairment for the year ended December 31, 2019.
During 2018, the reporting unit’s expected future cash flows decreased due to lower forecasted long-term revenue growth and higher forecasted operating expenses, resulting in reduced margins. During 2017, the separate reporting unit’s expected future cash flows decreased due to lower forecasted long-term revenue growth and reduced margins, primarily as a result of the loss of certain key customers.
In addition, as of the date of our 2019 annual goodwill impairment test, of our nine reporting units with goodwill allocated, one reporting unit’s estimate of the fair value did not exceed its respective carrying value by a substantial margin. This reporting unit had recorded goodwill of $30.0 million as of the goodwill impairment testing date. The percentage by which the reporting unit’s estimated fair value exceeded carrying value was 22.0%. Key assumptions that drive the estimated fair value for the reporting unit are our risk-adjusted discounted cash flows and market comparable information for our industry. Decreases in this reporting unit’s results of operations, changes in discount rates or other assumptions or a decline in our industry, could result in future goodwill impairment for this reporting unit. Future goodwill impairment, if any, could have a material impact on our results of operations or financial condition.
70
Intangible Assets
We have recorded identifiable definite-lived intangible assets as a result of the acquisition of the Company by our Majority Sponsors in 2011, as well as our acquisitions. Definite-lived intangible assets consist of trade names, investigator/payer networks, technology/intellectual property, know-how/processes, backlog and customer relationships. We amortize trade names, investigator/payer networks, technology/intellectual property, know-how/processes and backlog primarily using the straight-line method over their estimated useful lives. We amortize customer relationships using either a sum-of-the-years’ digits method or straight-line method over their estimated useful lives. The methods used reflect the expected pattern of benefit over the expected useful lives of each type of intangible asset. We do not have any indefinite-lived intangible assets.
We determine the fair value of our intangible assets identified as part of a business combination using generally accepted valuation techniques that are specific to the intangible asset for which fair value is being estimated. For example, fair value may be determined by estimating the costs to develop the acquired intangible assets into commercially viable services or revenues and income from continuing to provide contracted services, estimating the resulting net cash flows from future services to be provided and discounting the net cash flows to present value. We also consider the present value of the royalties saved because we own the intangible asset instead of paying a fee to use it. Additionally, our estimates take into account the relevant market size and growth factors, expected trends in technology and the nature and expected timing of new service introductions by us and our competitors. The resulting net cash flows are based on management’s estimates of revenues, direct costs, operating expenses, royalty rates for similar intangible assets and income taxes from the provision of services. The rates utilized to discount the net cash flows to their present value are commensurate with the uncertainties of the estimates of future revenues and costs used in the projections described above.
We review intangible assets for impairment when circumstances indicate that the carrying amount of intangible assets might not be recoverable. This evaluation involves various analyses that require the use of judgments and estimates, including undiscounted cash flow projections. In the event undiscounted cash flow projections or other analyses indicate that the carrying amount of the intangible asset is not likely to be recovered, we record an impairment to reduce the carrying value of the intangible asset to its estimated fair value. We estimate fair value based on generally accepted valuation techniques, including cost and income approaches. The approaches may include a discounted cash flow income model or other generally accepted approaches.
The value of our intangible assets could be impacted by future adverse changes such as changes in regulatory conditions, decisions by customers to discontinue research programs, the success of our customer relationships, introduction of competing services or new technologies, significant losses of customers, investigators or payers, significant slowdowns in the worldwide economy or the biopharmaceutical industry and the delay or abandonment of any of our in-process technology development, among other developments. Future intangible asset impairment, if any, could have a material impact on our results of operations or financial condition.
Stock-based Compensation
We recognize stock-based compensation expense for stock option awards provided to our employees and restricted stock awards provided to our non-employee directors. We measure stock-based compensation cost at the grant date, based on the fair value of the award.
71
We calculate the fair value of each stock option award on the grant date using the Black-Scholes option-pricing model. The model requires the use of subjective and objective assumptions, including the fair value of the underlying common stock on the date of grant, expected term of the award, expected stock price volatility, expected dividends and the risk-free interest rate. In developing our assumptions, we take into account the following:
Fair value of our common stock. Prior to the IPO, due to the absence of an active market for our common stock, the fair value of our common stock on the date of the grant was determined in good faith by our board of directors with the assistance of management and an independent third-party valuation specialist. Each quarter, when stock options are granted, a valuation of our common stock was performed by an independent third-party valuation specialist to assist us in determining the fair value of stock options granted. For all valuations performed, we used a weighted combination of income and market approaches. The income approach incorporated the use of a discounted cash flow model in which our estimated future cash flows were discounted using an appropriately risk-adjusted weighted-average cost of capital. Our forecasts used in the discounted cash flow model are based in part on strategic plans and represent our estimates based on current and forecasted business and market conditions. The market approaches considered our results of operations and information about our publicly traded competitors, such as earnings multiples making adjustments to the selected competitors based on size, strengths and weaknesses, as well as publicly announced acquisition transactions. The fair value of our common stock was discounted based on the lack of marketability in order to determine fair value of stock options on the grant date.
Expected Term. The expected term of the stock options represents the average period the stock options are expected to remain outstanding. As we do not have sufficient historical information to develop reasonable expectations about future exercise patterns and post-vesting employment termination behavior, the expected term of options granted is derived from the average midpoint between the weighted-average vesting and the contractual term, also known as the simplified method.
Expected Volatility. Prior to the IPO, we used the historical volatilities of a selected peer group as our stock was privately held and not traded on an exchange or over-the-counter market.
Risk-Free Interest Rate. We use the risk-free interest rate at the date of grant for a zero-coupon U.S. Treasury bond with a term that approximates the expected term of the option using the simplified method.
Expected Dividend Yield. We do not have a history of paying regular dividends and we do not expect to pay regular dividends on our common stock in the future. Therefore our expected dividend yield is assumed to be zero. The special cash dividends to our stockholders are considered a return of capital to our stockholders and not regular dividends.
We recognize stock-based compensation expense on a straight-line basis over the recipient’s requisite service period considering performance features, if any, that may impact vesting of such award. We recognize forfeitures, if any, as they occur. Stock-based compensation expense is primarily recorded within SG&A expenses in our consolidated statements of operations based on the services provided by the recipients granted stock-based compensation.
Recently Adopted and Issued Accounting Standards
Recently adopted and issued accounting standards relevant in our audited consolidated financial statements are described more fully in Note 1, “Basis of Presentation and Summary of Significant Accounting Policies,” in our audited consolidated financial statements included elsewhere in this Annual Report on Form 10-K. Recently adopted and issued accounting standards are as follows:
Recently Adopted Accounting Standard
Date | Title | Effective Date |
February 2016 | Leases | Adopted January 1, 2019 |
72
Recently Issued Accounting Standards
Date | Title | Effective Date |
August 2018 | Customer’s Accounting for Implementation Costs Incurred in a Cloud Computing Arrangement That Is a Service Contract | First annual period beginning on or after December 15, 2019 and interim periods therein |
Inflation
Our long-term service contracts, those in excess of one year, generally include an inflation or cost of living adjustment for the portion of the services to be performed beyond one year from the contract date. In the event that actual inflation rates are greater than our contractual inflation rates or cost of living adjustments, inflation could have a material adverse effect on our results of operations, financial condition and/or cash flows.
Item 7A. Quantitative and Qualitative Disclosures About Market Risk
Market risk is broadly defined as potential economic losses due to adverse changes in the fair value of a financial instrument. In the normal course of business, we are exposed to market risks, including foreign currency exchange rate risk and interest rate risk.
Foreign Currency Exchange Rate Risk
We are exposed to foreign currency exchange rate risk by virtue of our international operations. This risk arises because we enter into contracts with customers and pay operating expenses in currencies other than our reporting currency. We derived 47.1%, 47.7% and 44.9% of our revenue for the years ended December 31, 2019, 2018 and 2017 respectively, from operations outside of the United States. Our strategy for managing foreign currency risk relies on efforts to negotiate customer contracts to receive payment in the same currency used to pay expenses or, in some cases, we have historically entered into foreign currency exchange rate fluctuation provisions in our contracts with our customers. The exchange rate fluctuation provisions may result in increases or decreases in revenue or operating income in periods of significant exchange rate volatility when such exchange rates increase over a stated exchange rate or dollar threshold in the contract with a customer. During 2019, 2018 and 2017, exchange rate fluctuation provisions in our contracts decreased revenue and operating income by $7.4 million, $10.9 million and $23.5 million, respectively. From time to time, we have managed the remaining foreign currency risk by entering into foreign currency forward contract hedges for most or all of such risk potential. However, as of December 31, 2019 and 2018, we had no outstanding foreign currency forward contracts. Foreign currency exchange rate risk is evidenced in our financial statements through translation risk and transaction and re-measurement risk.
Translation Risk
We are exposed to movements in foreign currencies, predominately in the Pound sterling, Euro, Bulgarian lev and Brazilian real. The vast majority of our contracts are entered into by our U.S. and U.K. subsidiaries. The contracts entered into by the U.S. subsidiaries are almost always denominated in U.S. dollars. Contracts entered into by our U.K. subsidiaries are generally denominated in U.S. dollars, Pound sterling or Euros, with the majority in U.S. dollars. If the U.S. dollar had weakened 10% relative to the Pound sterling, Euro, Bulgarian lev and Brazilian real in 2019, 2018 and 2017, income from operations, including the impact of hedging in 2017, would have been lower by approximately $1.2 million, $0.8 million and $5.4 million, respectively, for the years then ended, based on revenues and costs related to our foreign operations.
Changes in exchange rates between the applicable foreign currency and the U.S. dollar will affect the translation of foreign subsidiaries’ financial results into U.S. dollars for purposes of reporting our consolidated financial results. The process by which we translate each foreign subsidiary’s financial results to U.S. dollars is as follows:
• | we translate statement of operations accounts at the exchange rates on the dates those elements are recognized or the average exchange rates for the relevant monthly period; |
• | we translate balance sheet asset and liability accounts at the end of period exchange rates; and |
• | we translate equity accounts at historical exchange rates. |
Translation of the balance sheet in this manner affects stockholders’ deficit through the foreign currency translation adjustment account. This account exists only in the foreign subsidiary’s U.S. dollar balance sheet and is necessary to keep the foreign balance sheet, stated in U.S. dollars, in balance.
73
We report translation adjustments within accumulated other comprehensive loss as a separate component of stockholders’ deficit on our consolidated balance sheets. Gains or losses from translating amounts in foreign currencies are recorded in other comprehensive income or other comprehensive loss on our consolidated statements of comprehensive income.
Transaction and Re-measurement Risk
We have currency risk resulting from the passage of time between the recognition of revenue, invoicing of customers under contracts and the collection of payment. If a contract is denominated in a currency other than the subsidiary’s functional currency, we recognize an unbilled services asset at the time of revenue recognition and a receivable at the time of invoicing for the local currency equivalent of the foreign currency invoice amount. Changes in exchange rates from the time we recognize revenue until the time the customer pays will result in our receiving either more or less in local currency than the amount that was originally invoiced. We recognize this difference as a foreign currency transaction gain or loss, as applicable.
We also have currency risk as a result of intercompany loans or other intercompany borrowings (collectively, “Intercompany Debt”) throughout our organization when such Intercompany Debt is denominated in a currency other than the subsidiary’s functional currency. Changes in exchange rates from the time a subsidiary records the intercompany debt until the time the subsidiary pays the intercompany debt will result in a foreign currency transaction gain or loss. We record all foreign currency transaction and re-measurement gains and losses as other (expense) income, net on the consolidated statement of operations. We do not have significant operations in countries considered highly inflationary.
Interest Rate Risk
We have borrowings under our Term Loan that bear interest at a variable rate, at our option, of either (i) a Eurocurrency rate based on LIBOR for a specific interest period plus an applicable margin, subject to a Eurocurrency rate floor of 1.00%, or (ii) an alternate base rate plus an applicable margin, subject to a base rate floor of 2.00%. The margins for the Term Loan are fixed at 2.50% per annum for Eurocurrency rate loans and 1.50% per annum for base rate loans. As of December 31, 2019, we had $3.1 billion of indebtedness under our Term Loan that was treated as a Eurocurrency rate loan with an interest rate of 4.30%. Each quarter-point increase in the LIBOR would increase interest expense on our current variable rate debt by approximately $7.8 million during 2019. While we had no interest rate swaps outstanding at December 31, 2019, we entered into three new interest rate swaps in February 2020 with a notional value of $3.5 billion to hedge the exposure to the variability in interest payments on our Term Loan, including any potential refinancing of our Term Loan that may occur in the future. See Note 10, “Long-term Debt and Finance Lease Obligations,” Note 13, “Derivative Instruments and Hedging Activities,” and Note 22, “Subsequent Events,” to our audited consolidated financial statements included elsewhere in this Annual Report on Form 10-K for additional information on impacts to our market risks.
Other Risk
Although we perform services for customers located in a number of jurisdictions, we have not experienced any material difficulties in receiving funds remitted from foreign countries. However, new or modified exchange control restrictions could have an adverse effect on our ability to repatriate cash to fund our operations and make principal and interest payments, when necessary.
74
PPD, INC. AND SUBSIDIARIES
INDEX TO THE CONSOLIDATED FINANCIAL STATEMENTS
Item 8. Financial Statements and Supplementary Data
Index to Consolidated Financial Statements | ||
Page | ||
Report of Independent Registered Public Accounting Firm | ||
Consolidated Statements of Operations for the years ended December 31, 2019, 2018 and 2017 | ||
Consolidated Statements of Comprehensive Income for the years ended December 31, 2019, 2018 and 2017 | ||
Consolidated Balance Sheets as of December 31, 2019 and 2018 | ||
Consolidated Statements of Stockholders’ Deficit and Redeemable Noncontrolling Interest for the years ended December 31, 2019, 2018 and 2017 | ||
Consolidated Statements of Cash Flows for the years ended December 31, 2019, 2018 and 2017 | ||
Notes to the Consolidated Financial Statements | ||
75
REPORT OF INDEPENDENT REGISTERED PUBLIC ACCOUNTING FIRM
To the stockholders and the Board of Directors of PPD, Inc.
Opinion on the Financial Statements
We have audited the accompanying consolidated balance sheets of PPD, Inc. and subsidiaries (the “Company”) as of December 31, 2019 and 2018, the related consolidated statements of operations, comprehensive income, stockholders’ deficit and redeemable noncontrolling interest, and cash flows for each of the three years in the period ended December 31, 2019, and the related notes and the schedule listed in the Index at Item 15 (collectively referred to as the “financial statements”). In our opinion, the financial statements present fairly, in all material respects, the financial position of the Company as of December 31, 2019 and 2018, and the results of its operations and its cash flows for each of the three years in the period ended December 31, 2019, in conformity with accounting principles generally accepted in the United States of America.
Change in Accounting Principle
As discussed in Note 1 to the financial statements, the Company has changed its method of accounting for leases in 2019 due to the adoption of Accounting Standard Codification Topic 842, Leases, and changed its method of accounting for revenue in 2018 due to the adoption of Accounting Standard Codification Topic 606, Revenue from Contracts with Customers.
Basis for Opinion
These financial statements are the responsibility of the Company's management. Our responsibility is to express an opinion on the Company's financial statements based on our audits. We are a public accounting firm registered with the Public Company Accounting Oversight Board (United States) (PCAOB) and are required to be independent with respect to the Company in accordance with the U.S. federal securities laws and the applicable rules and regulations of the Securities and Exchange Commission and the PCAOB.
We conducted our audits in accordance with the standards of the PCAOB. Those standards require that we plan and perform the audit to obtain reasonable assurance about whether the financial statements are free of material misstatement, whether due to error or fraud. The Company is not required to have, nor were we engaged to perform, an audit of its internal control over financial reporting. As part of our audits, we are required to obtain an understanding of internal control over financial reporting but not for the purpose of expressing an opinion on the effectiveness of the Company’s internal control over financial reporting. Accordingly, we express no such opinion.
Our audits included performing procedures to assess the risks of material misstatement of the financial statements, whether due to error or fraud, and performing procedures that respond to those risks. Such procedures included examining, on a test basis, evidence regarding the amounts and disclosures in the financial statements. Our audits also included evaluating the accounting principles used and significant estimates made by management, as well as evaluating the overall presentation of the financial statements. We believe that our audits provide a reasonable basis for our opinion.
/s/ Deloitte & Touche LLP
Raleigh, North Carolina
March 5, 2020
We have served as the Company’s auditor since 2002.
76
PPD, INC. AND SUBSIDIARIES
CONSOLIDATED STATEMENTS OF OPERATIONS
(in thousands, except per share data)
Years Ended December 31, | |||||||||||
2019 | 2018 | 2017 | |||||||||
Revenue: | |||||||||||
Revenue | $ | 4,031,017 | $ | 3,748,971 | $ | 2,767,476 | |||||
Reimbursed revenue | — | — | 233,574 | ||||||||
Total revenue | 4,031,017 | 3,748,971 | 3,001,050 | ||||||||
Operating costs and expenses: | |||||||||||
Direct costs, exclusive of depreciation and amortization | 1,484,258 | 1,333,812 | 1,302,983 | ||||||||
Reimbursed costs | 924,634 | 940,913 | 233,574 | ||||||||
Selling, general and administrative expenses | 938,806 | 813,035 | 809,333 | ||||||||
Recapitalization costs | — | — | 114,766 | ||||||||
Depreciation and amortization | 264,830 | 258,974 | 279,066 | ||||||||
Goodwill and long-lived asset impairments | 1,284 | 29,626 | 43,459 | ||||||||
Total operating costs and expenses | 3,613,812 | 3,376,360 | 2,783,181 | ||||||||
Income from operations | 417,205 | 372,611 | 217,869 | ||||||||
Interest expense, net of interest income of $5,233, $5,454 and $3,553 in | |||||||||||
2019, 2018 and 2017, respectively | (311,744 | ) | (263,618 | ) | (253,891 | ) | |||||
(Loss) gain on investments | (19,043 | ) | 15,936 | 92,750 | |||||||
Other (expense) income, net | (27,143 | ) | 21,701 | (40,259 | ) | ||||||
Income before provision for (benefit from) income taxes | 59,275 | 146,630 | 16,469 | ||||||||
Provision for (benefit from) income taxes | 2,957 | 39,579 | (284,360 | ) | |||||||
Income before equity in losses of unconsolidated affiliates | 56,318 | 107,051 | 300,829 | ||||||||
Equity in losses of unconsolidated affiliates, net of income taxes | (3,563 | ) | (186 | ) | — | ||||||
Net income | 52,755 | 106,865 | 300,829 | ||||||||
Net income attributable to noncontrolling interest | (4,934 | ) | (2,679 | ) | (4,802 | ) | |||||
Net income attributable to PPD, Inc. | 47,821 | 104,186 | 296,027 | ||||||||
Recapitalization investment portfolio consideration | 6,846 | (7,849 | ) | (97,136 | ) | ||||||
Net income attributable to common stockholders of PPD, Inc. | $ | 54,667 | $ | 96,337 | $ | 198,891 | |||||
Earnings per share attributable to common stockholders of PPD, Inc.: | |||||||||||
Basic | $ | 0.20 | $ | 0.34 | $ | 0.68 | |||||
Diluted | $ | 0.19 | $ | 0.34 | $ | 0.68 | |||||
Weighted-average common shares outstanding: | |||||||||||
Basic | 279,285 | 279,238 | 291,027 | ||||||||
Diluted | 280,693 | 279,317 | 293,826 | ||||||||
The accompanying notes are an integral part of these consolidated financial statements.
77
PPD, INC. AND SUBSIDIARIES
CONSOLIDATED STATEMENTS OF COMPREHENSIVE INCOME
(in thousands)
Years Ended December 31, | |||||||||||
2019 | 2018 | 2017 | |||||||||
Net income | $ | 52,755 | $ | 106,865 | $ | 300,829 | |||||
Other comprehensive income (loss): | |||||||||||
Foreign currency translation adjustments, net of income taxes of | |||||||||||
$0, $0 and $16,825 in 2019, 2018 and 2017, respectively | 24,824 | (91,177 | ) | 143,158 | |||||||
Defined benefit pension plan adjustments, net of income taxes of | |||||||||||
($259), $339 and $1,382 in 2019, 2018 and 2017, respectively | (1,314 | ) | 1,504 | 10,923 | |||||||
Derivative instruments adjustments, net of income taxes of | |||||||||||
($2,804), $2,183 and $4,785 in 2019, 2018 and 2017, respectively | (9,523 | ) | 11,159 | 9,219 | |||||||
Other comprehensive income (loss) | 13,987 | (78,514 | ) | 163,300 | |||||||
Comprehensive income | 66,742 | 28,351 | 464,129 | ||||||||
Comprehensive income attributable to noncontrolling interest | (5,144 | ) | (3,159 | ) | (5,315 | ) | |||||
Comprehensive income attributable to PPD, Inc. | 61,598 | 25,192 | 458,814 | ||||||||
Recapitalization investment portfolio consideration | 6,846 | (7,849 | ) | (97,136 | ) | ||||||
Comprehensive income attributable to common stockholders of PPD, Inc. | $ | 68,444 | $ | 17,343 | $ | 361,678 | |||||
The accompanying notes are an integral part of these consolidated financial statements.
78
PPD, INC. AND SUBSIDIARIES
CONSOLIDATED BALANCE SHEETS
(in thousands, except par value)
Assets | |||||||
December 31, | |||||||
2019 | 2018 | ||||||
Current assets: | |||||||
Cash and cash equivalents | $ | 345,187 | 553,066 | ||||
Accounts receivable and unbilled services, net | 1,326,614 | 1,260,724 | |||||
Income taxes receivable | 27,437 | 16,065 | |||||
Prepaid expenses and other current assets | 119,776 | 102,274 | |||||
Total current assets | 1,819,014 | 1,932,129 | |||||
Property and equipment, net | 458,845 | 399,103 | |||||
Investments in unconsolidated affiliates | 34,028 | 8,756 | |||||
Investments | 250,348 | 265,715 | |||||
Goodwill | 1,764,104 | 1,723,378 | |||||
Intangible assets, net | 892,091 | 1,028,973 | |||||
Other assets | 156,220 | 131,307 | |||||
Operating lease right-of-use assets | 181,596 | — | |||||
Total assets | $ | 5,556,246 | $ | 5,489,361 | |||
Liabilities, Redeemable Noncontrolling Interest and Stockholders’ Deficit | |||||||
Current liabilities: | |||||||
Accounts payable | $ | 130,060 | $ | 89,010 | |||
Accrued expenses: | |||||||
Payables to investigators | 322,231 | 355,144 | |||||
Accrued employee compensation | 263,834 | 240,679 | |||||
Accrued interest | 44,527 | 35,681 | |||||
Other accrued expenses | 138,632 | 108,335 | |||||
Income taxes payable | 15,161 | 8,953 | |||||
Unearned revenue | 1,110,872 | 921,964 | |||||
Current portion of operating lease liabilities | 45,962 | — | |||||
Current portion of long-term debt and finance lease obligations | 35,794 | 34,907 | |||||
Total current liabilities | 2,107,073 | 1,794,673 | |||||
Accrued income taxes | 38,465 | 26,597 | |||||
Deferred tax liabilities | 92,225 | 165,114 | |||||
Recapitalization investment portfolio liability | 191,678 | 198,524 | |||||
Long-term operating lease liabilities, less current portion | 153,766 | — | |||||
Long-term debt and finance lease obligations, less current portion | 5,608,134 | 4,760,777 | |||||
Other liabilities | 33,017 | 41,205 | |||||
Total liabilities | 8,224,358 | 6,986,890 | |||||
Commitments and contingencies (Note 1) | |||||||
Redeemable noncontrolling interest | 30,036 | 24,892 | |||||
Stockholders’ deficit: | |||||||
Common stock $0.01 par value, 2,080,000 shares authorized; | |||||||
280,127 shares issued and 279,426 shares outstanding as of | |||||||
December 31, 2019 and 2,080,000 shares authorized; | |||||||
279,545 shares issued and 279,030 shares outstanding as of | 2,801 | 2,795 | |||||
December 31, 2018 | |||||||
Treasury stock, at cost, 701 and 515 shares, respectively, at | (12,707 | ) | (8,933 | ) | |||
December 31, 2019 and December 31, 2018 | |||||||
Additional paid-in-capital | 1,983 | 41,685 | |||||
Accumulated deficit | (2,391,321 | ) | (1,245,077 | ) | |||
Accumulated other comprehensive loss | (298,904 | ) | (312,891 | ) | |||
Total stockholders’ deficit | (2,698,148 | ) | (1,522,421 | ) | |||
Total liabilities, redeemable noncontrolling interest and stockholders’ deficit | $ | 5,556,246 | $ | 5,489,361 | |||
The accompanying notes are an integral part of these consolidated financial statements.
79
PPD, INC. AND SUBSIDIARIES
CONSOLIDATED STATEMENTS OF STOCKHOLDERS’ DEFICIT AND REDEEMABLE NONCONTROLLING INTEREST
(in thousands)
PPD, Inc. Stockholders’ Deficit | |||||||||||||||||||||||||||||||||||
Common Stock | Treasury Stock | ||||||||||||||||||||||||||||||||||
Redeemable Noncontrolling Interest | Shares | Amount | Paid-in-Capital | Shares | Amount | Accumulated Other Comprehensive Loss | Accumulated Deficit | Total Stockholders’ Deficit | |||||||||||||||||||||||||||
Balance, December 31, 2016 | $ | 19,330 | 313,411 | $ | 3,134 | $ | 4,209 | 1,068 | $ | (9,790 | ) | $ | (397,677 | ) | $ | (564,117 | ) | $ | (964,241 | ) | |||||||||||||||
Net income | 4,802 | — | — | — | — | — | — | 296,027 | 296,027 | ||||||||||||||||||||||||||
Other comprehensive income | 513 | — | — | — | — | — | 163,300 | — | 163,300 | ||||||||||||||||||||||||||
Vesting of restricted stock | — | 19 | — | — | — | — | — | — | — | ||||||||||||||||||||||||||
Issuance of common stock for stock option exercises | — | 272 | 3 | 1,122 | — | — | — | — | 1,125 | ||||||||||||||||||||||||||
Repurchases of common stock | — | — | — | — | 201 | (1,808 | ) | — | — | (1,808 | ) | ||||||||||||||||||||||||
Stock-based compensation expense | — | — | — | 74,299 | — | — | — | — | 74,299 | ||||||||||||||||||||||||||
Recapitalization cancellation of treasury stock | — | (1,268 | ) | (12 | ) | 5 | (1,269 | ) | 11,598 | — | (11,591 | ) | — | ||||||||||||||||||||||
Recapitalization share issuances | — | 184,080 | 1,841 | 769,098 | — | — | — | 1,999,062 | 2,770,001 | ||||||||||||||||||||||||||
Recapitalization share redemptions | — | (219,958 | ) | (2,200 | ) | (778,100 | ) | — | — | — | (2,529,576 | ) | (3,309,876 | ) | |||||||||||||||||||||
Recapitalization cash option settlement | — | — | — | (52,207 | ) | — | — | — | (142,299 | ) | (194,506 | ) | |||||||||||||||||||||||
Recapitalization share option settlement | — | 2,391 | 23 | (10 | ) | — | — | — | (13 | ) | — | ||||||||||||||||||||||||
Recapitalization investment portfolio consideration | — | — | — | — | — | — | — | (217,170 | ) | (217,170 | ) | ||||||||||||||||||||||||
Recapitalization tax benefit consideration | — | — | — | — | — | — | — | (105,159 | ) | (105,159 | ) | ||||||||||||||||||||||||
Recapitalization transaction costs | — | — | — | — | — | — | — | (7,279 | ) | (7,279 | ) | ||||||||||||||||||||||||
Employee stock purchases | — | 496 | 5 | 7,462 | — | — | — | — | 7,467 | ||||||||||||||||||||||||||
Purchase of noncontrolling interest | (2,912 | ) | — | — | (3,888 | ) | — | — | — | — | (3,888 | ) | |||||||||||||||||||||||
Other | — | — | — | 28 | — | — | — | — | 28 | ||||||||||||||||||||||||||
Balance, December 31, 2017 | 21,733 | 279,443 | 2,794 | 22,018 | — | — | (234,377 | ) | (1,282,115 | ) | (1,491,680 | ) | |||||||||||||||||||||||
Impact from adoption of ASC 606, net of tax | — | — | — | — | — | — | — | (55,467 | ) | (55,467 | ) | ||||||||||||||||||||||||
Balance, January 1, 2018 | 21,733 | 279,443 | 2,794 | 22,018 | — | — | (234,377 | ) | (1,337,582 | ) | (1,547,147 | ) | |||||||||||||||||||||||
Net income | 2,679 | — | — | — | — | — | — | 104,186 | 104,186 | ||||||||||||||||||||||||||
Other comprehensive income (loss) | 480 | — | — | — | — | — | (78,514 | ) | — | (78,514 | ) | ||||||||||||||||||||||||
Vesting of restricted stock | — | 9 | — | — | — | — | — | — | — | ||||||||||||||||||||||||||
Issuance of common stock for stock option exercises | — | 61 | 1 | 922 | — | — | — | — | 923 | ||||||||||||||||||||||||||
Repurchases of common stock | — | — | — | — | 515 | (8,933 | ) | — | — | (8,933 | ) | ||||||||||||||||||||||||
Stock-based compensation expense | — | — | — | 18,265 | — | — | — | — | 18,265 | ||||||||||||||||||||||||||
Recapitalization investment portfolio consideration | — | — | — | — | — | — | — | (7,849 | ) | (7,849 | ) | ||||||||||||||||||||||||
Recapitalization tax benefit consideration | — | — | — | — | — | — | — | (3,161 | ) | (3,161 | ) | ||||||||||||||||||||||||
Employee stock purchases | — | 32 | — | 480 | — | — | — | — | 480 | ||||||||||||||||||||||||||
Other | — | — | — | — | — | — | — | (671 | ) | (671 | ) | ||||||||||||||||||||||||
Balance, December 31, 2018 | 24,892 | 279,545 | 2,795 | 41,685 | 515 | (8,933 | ) | (312,891 | ) | (1,245,077 | ) | (1,522,421 | ) | ||||||||||||||||||||||
Net income | 4,934 | — | — | — | — | — | — | 47,821 | 47,821 | ||||||||||||||||||||||||||
Other comprehensive income | 210 | — | — | — | — | — | 13,987 | — | 13,987 | ||||||||||||||||||||||||||
Vesting of restricted stock | — | 13 | — | — | — | — | — | — | — | ||||||||||||||||||||||||||
Issuance of common stock for stock option exercises | — | 301 | 3 | 4,521 | — | — | — | — | 4,524 | ||||||||||||||||||||||||||
Issuance of common stock for acquisition | — | 268 | 3 | 4,998 | — | — | — | — | 5,001 | ||||||||||||||||||||||||||
Repurchases of common stock | — | — | — | — | 186 | (3,774 | ) | — | — | (3,774 | ) | ||||||||||||||||||||||||
Stock-based compensation expense | — | — | — | 15,632 | — | — | — | — | 15,632 | ||||||||||||||||||||||||||
Modification of stock option awards to cash and liability awards | — | — | — | (19,669 | ) | — | — | — | — | (19,669 | ) | ||||||||||||||||||||||||
Return of capital and special dividend to stockholders | — | — | — | (45,184 | ) | — | — | — | (1,200,816 | ) | (1,246,000 | ) | |||||||||||||||||||||||
Recapitalization investment portfolio consideration | — | — | — | — | — | — | — | 6,846 | 6,846 | ||||||||||||||||||||||||||
Other | — | — | — | — | — | — | — | (95 | ) | (95 | ) | ||||||||||||||||||||||||
Balance, December 31, 2019 | $ | 30,036 | 280,127 | $ | 2,801 | $ | 1,983 | 701 | $ | (12,707 | ) | $ | (298,904 | ) | $ | (2,391,321 | ) | $ | (2,698,148 | ) | |||||||||||||||
The accompanying notes are an integral part of these consolidated financial statements.
80
PPD, INC. AND SUBSIDIARIES
CONSOLIDATED STATEMENTS OF CASH FLOWS
(in thousands)
Years Ended December 31, | |||||||||||
2019 | 2018 | 2017 | |||||||||
Cash flows from operating activities: | |||||||||||
Net income | $ | 52,755 | $ | 106,865 | $ | 300,829 | |||||
Adjustments to reconcile net income to net cash provided by operating activities: | |||||||||||
Depreciation and amortization | 264,830 | 258,974 | 279,066 | ||||||||
Goodwill and long-lived asset impairments | 1,284 | 29,626 | 43,459 | ||||||||
Stock-based compensation expense | 15,632 | 18,265 | 74,299 | ||||||||
Non-cash operating lease expense | 40,633 | — | — | ||||||||
Amortization of debt issuance and modification costs and debt discount | 17,768 | 10,082 | 9,001 | ||||||||
Amortization of accumulated other comprehensive income on terminated interest rate swaps | (9,523 | ) | (5,269 | ) | — | ||||||
Loss (gain) on investments | 19,043 | (15,936 | ) | (92,750 | ) | ||||||
Benefit from deferred income taxes | (84,795 | ) | (26,062 | ) | (317,385 | ) | |||||
Amortization of costs to obtain a contract | 11,432 | 8,693 | — | ||||||||
Other | 12,929 | (11,691 | ) | 2,834 | |||||||
Change in operating assets and liabilities, net of effect of businesses acquired or sold: | |||||||||||
Accounts receivable and unbilled services, net | (28,075 | ) | (144,822 | ) | (12,300 | ) | |||||
Prepaid expenses and other current assets | (11,465 | ) | 18,510 | 36,787 | |||||||
Other assets | (31,288 | ) | (26,819 | ) | (37,118 | ) | |||||
Income taxes, net | 7,712 | 606 | (10,278 | ) | |||||||
Accounts payable, accrued expenses and other liabilities | 26,283 | (4,443 | ) | 102,974 | |||||||
Operating lease liabilities | (39,065 | ) | — | — | |||||||
Unearned revenue | 166,856 | 206,827 | (20,339 | ) | |||||||
Net cash provided by operating activities | 432,946 | 423,406 | 359,079 | ||||||||
Cash flows from investing activities: | |||||||||||
Purchases of property and equipment | (125,928 | ) | (116,145 | ) | (105,135 | ) | |||||
Acquisitions of businesses, net of cash and cash equivalents acquired | (74,187 | ) | 224 | (24,219 | ) | ||||||
Capital contributions paid for investments | (4,069 | ) | (1,546 | ) | (1,844 | ) | |||||
Distributions received from investments | 452 | 27,778 | 36,397 | ||||||||
Investments in unconsolidated affiliates | (30,000 | ) | (9,000 | ) | — | ||||||
Proceeds from sale of business | — | 8,000 | — | ||||||||
Other | 504 | 164 | 2,058 | ||||||||
Net cash used in investing activities | (233,228 | ) | (90,525 | ) | (92,743 | ) | |||||
Cash flows from financing activities: | |||||||||||
Purchase of treasury stock | (4,012 | ) | (8,630 | ) | (1,808 | ) | |||||
Proceeds from exercise of stock options | 4,524 | 923 | 1,125 | ||||||||
Proceeds from issuance of HoldCo notes | 891,000 | — | 550,000 | ||||||||
Payments on long-term debt and finance leases | (37,409 | ) | (35,387 | ) | (35,012 | ) | |||||
Purchase of noncontrolling interest | — | — | (7,080 | ) | |||||||
Payment of debt issuance and debt modification costs | (30,142 | ) | — | (11,939 | ) | ||||||
Proceeds from recapitalization share issuance | — | — | 2,770,001 | ||||||||
Payout for recapitalization share redemptions | — | — | (3,309,876 | ) | |||||||
Recapitalization cash option settlement | — | — | (194,506 | ) | |||||||
Recapitalization transaction costs | — | — | (7,279 | ) | |||||||
Recapitalization tax benefit distribution | — | (108,320 | ) | — | |||||||
Recapitalization investment portfolio distribution | — | (16,008 | ) | (10,486 | ) | ||||||
Proceeds from employee stock purchases | — | 480 | 7,467 | ||||||||
Return of capital and special dividend to stockholders | (1,246,000 | ) | — | — | |||||||
Net cash used in financing activities | (422,039 | ) | (166,942 | ) | (249,393 | ) | |||||
Effect of exchange rate changes on cash and cash equivalents | 14,442 | (31,833 | ) | 40,276 | |||||||
Net (decrease) increase in cash and cash equivalents | (207,879 | ) | 134,106 | 57,219 | |||||||
Cash and cash equivalents, beginning of the period | 553,066 | 418,960 | 361,741 | ||||||||
Cash and cash equivalents, end of the period | $ | 345,187 | $ | 553,066 | $ | 418,960 | |||||
The accompanying notes are an integral part of these consolidated financial statements.
81
PPD, INC. AND SUBSIDIARIES
NOTES TO THE CONSOLIDATED FINANCIAL STATEMENTS
(amounts in tables in thousands, except per share data)
1. Basis of Presentation and Summary of Significant Accounting Policies
Basis of Presentation
Description of Business
PPD, Inc. (together with its subsidiaries “PPD” or the “Company”) is a holding company incorporated in Delaware. References to the “Company” throughout these consolidated financial statements refer to PPD, Inc. and its consolidated subsidiaries. The Company is a leading provider of drug development services to the biopharmaceutical industry, focused on helping the Company’s customers bring their new medicines to patients around the world. The Company has been in the drug development services business for more than 30 years, providing a comprehensive suite of clinical development and laboratory services to pharmaceutical, biotechnology, medical device, government organizations and other industry participants. The Company has deep experience across a broad range of rapidly growing areas of drug development and engages with customers through a variety of commercial models, including both full-service and functional service partnerships and other offerings tailored to address the specific needs of the Company’s customers. The Company has two reportable segments, Clinical Development Services (“Clinical Development Services”) and Laboratory Services (“Laboratory Services”).
Basis of Presentation
On May 11, 2017, pursuant to an Agreement and Plan of Merger (the “Merger Agreement”) dated as of April 26, 2017, by and among PPD, Eagle Holding Company II, LLC (“Eagle II”), Eagle Reorganization Merger Sub, Inc. (“Merger Sub”), Eagle Buyer, Inc. (“Buyer”) and Jaguar Holding Company I (“Jaguar I”), Merger Sub merged with and into Jaguar I with Jaguar I as the surviving corporation (the “Reorganization Merger”). As a result of the Reorganization Merger, Jaguar I became a direct, wholly-owned subsidiary of Eagle II, itself a direct wholly-owned subsidiary of PPD, and Jaguar I and Jaguar Holding Company II (“Jaguar II”) both became indirect, wholly-owned subsidiaries of PPD. Subsequent to the Reorganization Merger, Jaguar I was converted from a Delaware corporation into a Delaware limited liability company (the “Conversion”) and Buyer merged with and into PPD, with PPD as the surviving corporation (the “Recapitalization Merger”). A series of transactions associated with the Reorganization Merger and Recapitalization Merger took place to effect a recapitalization of Jaguar I (the Reorganization Merger and the Recapitalization Merger, collectively, the “Recapitalization”). PPD, Eagle II, Merger Sub and Buyer were incorporated or formed by affiliates of The Carlyle Group, Inc. (“Carlyle”) and affiliates of Hellman & Friedman LLC (“H&F”) (Carlyle and H&F, collectively, the “Majority Sponsors”) to effect the Recapitalization. Jaguar I and Jaguar II were incorporated or formed by affiliates of the Majority Sponsors to effect the acquisition of Pharmaceutical Product Development, Inc. on December 5, 2011. Subsequent to the acquisition on December 5, 2011, Pharmaceutical Product Development, Inc. was reorganized into a Delaware limited liability company and changed its name to Pharmaceutical Product Development, LLC (“PPD LLC”).
Prior to the Recapitalization, Jaguar I was majority owned and jointly controlled by affiliates of the Majority Sponsors. Subsequent to the Recapitalization, PPD, and indirectly, Jaguar I, continue to be majority owned and jointly controlled by affiliates of the Majority Sponsors, both having invested from new investment funds into PPD. Additionally, two investors, an affiliate of the Abu Dhabi Investment Authority (“ADIA”) and an affiliate of GIC Private Limited (“GIC”), one of Singapore’s sovereign wealth funds, both obtained direct minority ownership interests in PPD (H&F, Carlyle, ADIA and GIC, collectively, the “Sponsors”). See Note 2, “Recapitalization Transaction,” for additional information on the Recapitalization.
The Recapitalization was treated as a recapitalization for accounting purposes with the basis of the assets and liabilities of Jaguar I remaining unchanged. Prior to the Recapitalization, PPD had no assets, liabilities or operating results and it was incorporated on April 13, 2017, for the sole purpose of effectuating the Recapitalization. The Recapitalization resulted in PPD being the continuing reporting entity for Jaguar I with no changes in the underlying business or operations of the Company. Therefore, the historical information and financial results reported in the consolidated financial statements represent the historical information and financial results for Jaguar I and its subsidiaries prior to the Recapitalization. No changes have been made to the Jaguar I historical information and financial results. When references are made in the consolidated financial statements to prior financial statements of the Company for periods prior to the Recapitalization, such financial statements referenced represent the historical consolidated financial statements of Jaguar I.
82
PPD, INC. AND SUBSIDIARIES
NOTES TO THE CONSOLIDATED FINANCIAL STATEMENTS
(amounts in tables in thousands, except per share data)
On January 15, 2020, the Company filed its amended and restated certificate of incorporation, which, among other things, effected a 1.8-for-1 stock split of its common stock and increased the authorized number of shares of its common stock to 2.08 billion. All references to share and per share amounts in the Company’s consolidated financial statements have been retrospectively revised to reflect the stock split and increase in authorized shares. See Note 22, “Subsequent Events,” for additional information.
Initial Public Offering
On February 6, 2020, the Company’s common stock began trading on The Nasdaq Global Select Market (“Nasdaq”) under the symbol “PPD.” On February 10, 2020, the Company completed its initial public offering (“IPO”) of its common stock at a price to the public of $27.00 per share. The Company issued and sold 69.0 million shares of common stock in the IPO including 9.0 million common shares issued pursuant to the full exercise of the underwriters option to purchase additional shares. The IPO raised proceeds to the Company of approximately $1,765.7 million, after deducting underwriting discounts and other offering expenses. See Note 22, “Subsequent Events,” for additional information.
Summary of Significant Accounting Policies
Principles of Consolidation
The consolidated financial statements include the accounts and operations of the Company. All intercompany balances and transactions have been eliminated in consolidation. Amounts pertaining to the redeemable noncontrolling ownership interest held by a third party in the operating results and financial position of the Company’s indirect majority-owned subsidiary are included as a noncontrolling interest.
Use of Estimates
The consolidated financial statements have been prepared in accordance with U.S. generally accepted accounting principles (“U.S. GAAP”). The preparation of financial statements in conformity with U.S. GAAP requires management to make estimates and assumptions that affect the reported amounts of assets and liabilities and disclosure of contingent assets and liabilities at the date of the financial statements and the reported amounts of revenues and expenses during the reporting period. The Company monitors estimates and assumptions on a continuous basis and updates these estimates and assumptions as facts and circumstances change and new information is obtained. Actual results could differ from those estimates and assumptions.
Revenue Recognition
Revenue recognition under ASC 606
In May 2014, the Financial Accounting Standards Board (the “FASB”) issued, as amended, Accounting Standards Codification (“ASC”) Topic 606, Revenue from Contracts with Customers (“ASC 606”). The new guidance outlined a single comprehensive model for entities to use in accounting for revenue from contracts with customers. The Company adopted ASC 606 on January 1, 2018 using the modified retrospective method for all contracts not completed as of the date of adoption. The consolidated financial statements as of and for the years ended December 31, 2019 and 2018 reflect the application of ASC 606, while the consolidated financial statements for the year ended December 31, 2017 reflect accounting guidance from the application of ASC Topic 605, Revenue Recognition (“ASC 605”).
The Company enters into contracts with customers to provide services in which contract consideration is generally
based on fixed-fee or variable pricing arrangements. The Company recognizes revenue arising from contracts with customers in an amount that reflects the consideration that the Company expects to receive in exchange for the services it provides. The Company determines its revenue recognition through the following five steps: (i) identification of the contract with a customer, (ii) identification of the performance obligations in the contract, (iii) determination of the transaction price, (iv) allocation of the transaction price to the performance obligations in the contract and (v) recognition of revenue when, or as, the Company satisfies its performance obligations in the contract. The Company’s contracts are service contracts that generally have a duration of a few months to several years with revenue being recognized primarily over time as services are provided to the customer in satisfaction of its performance obligations.
83
PPD, INC. AND SUBSIDIARIES
NOTES TO THE CONSOLIDATED FINANCIAL STATEMENTS
(amounts in tables in thousands, except per share data)
The majority of the Company’s contracts can be terminated by the customer either immediately or after a specified notice period. Upon early termination, the contracts generally require the customer to pay the Company for: (i) consideration earned through the termination date, which is consistent with the level of cost and effort expended through the termination date, (ii) consideration for services to complete the work still required to be performed and reimbursement for other related expenses, as applicable, (iii) reimbursement for certain non-cancelable expenditures and (iv) in certain cases, payment to cover a portion of the total consideration under the contract or a termination penalty.
Changes to the scope of the Company’s services are common, especially under long-term contracts, and a change in the scope of services generally results in a change in the transaction price. Changes in scope are reflected through contract modifications which are assessed on a contract-by-contract basis to determine if they should be accounted for as a new contract or part of the original contract. Generally, contract modifications are accounted for as part of the existing contract as the services to be provided for the modification are not distinct from the existing services provided under the contract. When contract modifications are accounted for as part of the existing contract, the effect of the contract modification on the transaction price and measure of progress under the contract is recognized as a cumulative adjustment to revenue as of the date of the modification.
In many cases, the Company’s contracts include variable consideration that is contingent upon the occurrence of future events, such as volume rebates, performance incentives and performance penalties or other variable consideration such as third-party pass-through and out-of-pocket costs incurred, which may impact the transaction price. Variable consideration is estimated using the expected value or the most likely amount of consideration and is included in the transaction price to the extent that it is probable that a significant reversal in the amount of cumulative revenue recognized will not occur when the uncertainty associated with the variable consideration is subsequently resolved. The estimation of variable consideration is based on the Company’s expected performance under the contract and where applicable, available historical, current and forecasted information to support such estimate. Actual results could differ significantly from estimates.
The Company incurs third-party pass-through and out-of-pocket costs in the performance of services under its contracts which are reimbursed by the customer. Third-party pass-through and out-of-pocket costs include, but are not limited to, payments to investigators, payments for the use of third-party technology, shipping costs and travel costs related to the performance of services, among others. The Company records third-party pass-through and out-of-pocket costs as revenue and the related costs incurred as reimbursed costs on the consolidated statements of operations. These reimbursed costs are included as revenue as the Company is the principal in the relationship, is primarily responsible for the services provided by third parties and significantly integrates the services of third parties with its own services in delivering a combined output to the customer. The Company excludes from revenue amounts collected and paid to governmental authorities, such as value-added taxes, that are associated with revenue transactions. All of the Company’s revenue is from contracts with customers. See Note 3, “Revenue,” for additional information.
Revenue recognition under ASC 605
Prior to the adoption of ASC 606 on January 1, 2018, the Company recognized revenue for services when all of the following criteria had been satisfied: (i) persuasive evidence of an arrangement existed, (ii) services had been rendered, (iii) the price to the customer was fixed or determinable and (iv) collectability was reasonably assured. The Company entered into contracts with customers to provide services in which contract consideration was generally based on fixed-fee or variable pricing arrangements and contracts generally had a duration of a few months to several years. The Company’s contracts generally included multiple service deliverables including trial feasibility, investigator recruitment, clinical trial monitoring, project management, database management and biostatistical services and laboratory testing, among others. If each service deliverable within the contract had standalone value to the customer, each was treated as a separate unit of accounting. If each service deliverable did not have standalone value to the customer, the service deliverables were combined into a single unit of accounting.
84
PPD, INC. AND SUBSIDIARIES
NOTES TO THE CONSOLIDATED FINANCIAL STATEMENTS
(amounts in tables in thousands, except per share data)
For those contracts with multiple units of accounting, the Company allocated contract consideration based on the relative selling price of the separately identified units of accounting. The relative selling price method required a hierarchy of evidence to be followed when determining the best evidence of the selling price of a deliverable. The best evidence of selling price for a unit of accounting was vendor-specific objective evidence (“VSOE”), or the price charged when a deliverable was sold separately on a standalone basis. When VSOE was not available, relevant third-party evidence (“TPE”) of selling price was used, such as prices competitors charge for interchangeable services to similar customers. When neither VSOE nor TPE of selling price existed, the Company used its best estimate of selling price (“BESP”) considering all relevant information that was available without undue cost or effort. Generally, the Company was not able to establish VSOE or TPE of selling price for its service deliverables due to its service deliverables with multiple units of accounting being highly customized, the variability in prices charged to customers and the lack of available competitor information. Therefore, the Company generally allocated consideration at the inception of the contract using BESP. BESP was generally established based on market factors and conditions and Company specific factors such as profit objectives, internal cost structure, market share and position and geographic region, among other factors.
The majority of the Company’s clinical development services contracts are fixed-fee, fee-for-service or time and materials contracts for clinical trial related services that represent a single unit of accounting. The Company primarily used the proportional performance method to recognize revenue for delivery of services for such contracts. Because of the service nature of the Company’s contracts, the Company believed that direct costs incurred reflected the hours incurred with hours representing the output of contracts. Thus, to measure performance under the proportional performance method, the Company compared direct costs incurred through a specified date to estimated total direct costs to complete the contract. Direct costs consisted primarily of the amount of direct labor and certain overhead costs for the delivery of services. The Company reviewed and revised the estimated total direct costs throughout the life of the contract, and recorded adjustments to revenue resulting from such revisions in the period in which the change in estimate was determined. This methodology was consistent with the manner in which the customer received the benefit of the work performed and was consistent with the Company’s contract termination provisions.
The majority of the Company’s laboratory services contracts are fixed-fee, fee-for-service or time and materials contracts that generally include multiple units of accounting. For those contracts with multiple service deliverables, the Company followed the relative selling price method to allocate contract consideration and recognized revenue as services were delivered once all other revenue recognition criteria were met.
The Company also incurred third-party pass-through and out-of-pocket costs which were generally reimbursable by its customers at cost. Prior to the adoption of ASC 606, third-party pass-through revenue and costs were presented on a net basis and out-of-pocket revenues and cost were presented on a gross basis as reimbursed revenue and reimbursed cost on the consolidated statements of operations. Additionally, third-party pass-through and out-of-pocket costs were excluded from the costs used in the measure of progress for contracts utilizing the proportional performance method to recognize revenue and revenue related to these reimbursed costs was recognized when the cost was incurred. The Company excluded from revenue amounts collected and paid to governmental authorities, such as value-added taxes, that were associated with revenue transactions.
Operating Costs and Expenses
Direct costs represent costs for providing services to customers. Direct costs primarily include labor-related costs, such as compensation and benefits for employees providing services, an allocation of facility and information technology costs, supply costs, cost for certain media-related services, other related overhead costs and offsetting research and development incentive credits.
Reimbursed costs include third-party pass-through and out-of-pocket costs which are generally reimbursable by the Company’s customers at cost. Third-party pass-through and out-of-pocket costs include, but are not limited to, payments to investigators, payments for the use of third-party technology, shipping costs and travel costs related to the performance of services, among others. Third-party pass-through and out-of-pocket costs are incurred across both reportable segments.
Selling, general and administrative (“SG&A”) expenses represent costs of business development, administrative and support functions. SG&A expenses primarily include compensation and benefits for employees, costs related to employees performing administrative tasks, stock-based compensation expense, sales, marketing and promotional expenses, recruiting and relocation expenses, training costs, travel costs, an allocation of facility and information technology costs and other related overhead costs.
85
PPD, INC. AND SUBSIDIARIES
NOTES TO THE CONSOLIDATED FINANCIAL STATEMENTS
(amounts in tables in thousands, except per share data)
Leases
In February 2016, the FASB issued an accounting standards update, as amended, on leases, ASC Topic 842, Leases (“ASC 842”). The new guidance requires recognition of, at the lease commencement date, a liability for future lease payments and a corresponding right-of-use (“ROU”) asset on the balance sheet representing the lessee’s right to use the underlying asset for the lease term. The Company adopted ASC 842 on January 1, 2019 using the modified retrospective method for all operating leases and capital leases under ASC Topic 840, Leases (“ASC 840”). As a result of the adoption of ASC 842, all operating leases with an initial term of greater than one year are recorded on the consolidated balance sheets as a lease liability and a corresponding ROU asset. The Company elected certain practical expedients which allows the Company not to reassess: (i) whether any expired or existing contracts contain a lease, (ii) the lease classification for any expired or existing leases and (iii) whether any previously capitalized initial direct costs would qualify for capitalization. The Company also made an accounting policy election to not recognize lease liabilities and associated ROU assets for all existing short-term leases at the time of adoption.
The adoption of ASC 842 resulted in the initial recognition of lease liabilities of $196.3 million and ROU assets of $179.7 million related to operating leases. The operating lease liabilities included $39.7 million of current lease liabilities and $156.6 million in long-term lease liabilities. Previously, under ASC 840, the Company had deferred rent, prepaid rent and unearned lease incentives, net totaling $16.6 million, that were reclassified to ROU assets at the time of adoption. There were no changes to the assets and liabilities of finance leases as a result of the adoption of ASC 842, previously referred to as capital leases under ASC 840. See Note 11, “Leases” for the Company’s lease accounting policies under ASC 842. The consolidated financial statements as of, and for the year ended December 31, 2019, reflect the application of ASC 842, while the consolidated financial statements for the prior periods reflect previous accounting guidance from the application of ASC 840.
Stock-Based Compensation
The Company measures stock-based compensation cost at the grant date, based on the fair value of the award, and recognizes it as expense (net of actual forfeitures as they occur) over the recipient’s requisite service period considering performance features, if any, that may impact vesting of such award. The Company estimates the fair value of each stock option award on the grant date using the Black-Scholes option-pricing model. The model requires the use of subjective and objective assumptions, including the fair value of the Company’s common stock on the date of grant, expected term of the award, expected stock price volatility, expected dividends and risk-free interest rate. The Company recognizes all excess tax benefits or tax deficiencies associated with stock-based awards discretely in its provision for (benefit from) income taxes. See Note 4, “Stock-based Compensation,” for additional information.
Other (Expense) Income, Net
The components of other (expense) income, net, were as follows:
Years Ended December 31, | |||||||||||
2019 | 2018 | 2017 | |||||||||
Other (expense) income, net: | |||||||||||
Foreign currency (losses) gains, net | $ | (24,659 | ) | $ | 16,682 | $ | (40,132 | ) | |||
Other income | 3,778 | 8,728 | 706 | ||||||||
Other expense | (6,262 | ) | (3,709 | ) | (833 | ) | |||||
Total other (expense) income, net | $ | (27,143 | ) | $ | 21,701 | $ | (40,259 | ) | |||
Cash and Cash Equivalents
Cash and cash equivalents consist of unrestricted cash accounts that are not subject to withdrawal restrictions or penalties and all highly liquid investments that have a maturity of three months or less at the date of purchase.
86
PPD, INC. AND SUBSIDIARIES
NOTES TO THE CONSOLIDATED FINANCIAL STATEMENTS
(amounts in tables in thousands, except per share data)
Supplemental cash flow information consisted of the following:
2019 | 2018 | 2017 | |||||||||
Cash paid for interest (for the years ended December 31) | $ | 300,528 | $ | 262,921 | $ | 238,826 | |||||
Cash paid for income taxes, net (for the years ended December 31) | 72,510 | 64,714 | 43,438 | ||||||||
Purchases of property and equipment in current liabilities (as of December 31) | 29,924 | 17,461 | 22,725 | ||||||||
Accounts Receivable, Unbilled Services and Unearned Revenue
In the normal course of business, the Company generally establishes prerequisites for billings based on contractual
provisions, including payment schedules, the completion of milestones or the submission of appropriate billing detail based on the performance of services during a specified period. Payment for the Company’s services may or may not coincide with the recognition of revenue. The Company’s intent with its invoicing and payment terms is not to provide financing to the customer or receive financing from the customer. Payment terms with customers are short-term, as payment for services is typically due less than one year from the date of billing.
Accounts receivable represents amounts for which invoices have been provided to customers pursuant to contractual terms. Unbilled services represent revenue earned and recognized for services performed to date for which amounts have not yet been billed to the customer pursuant to contractual terms. Contract assets represent unbilled services where the Company's right to bill includes something other than the passage of time, such as the satisfaction of milestones related to a performance obligation for services. Contract assets are recorded as part of accounts receivable and unbilled services, net, on the consolidated balance sheets.
The Company records unearned revenue, also referred to as contract liabilities, for amounts collected from or billed to customers in excess of revenue recognized. The Company reduces unearned revenue and recognizes revenue as the related performance obligations for services are performed. Unearned revenue and contract assets are recorded net on a contract-by-contract basis at the end of each reporting period.
Allowance for Doubtful Accounts
The Company’s allowance for doubtful accounts is based on a variety of factors including an assessment of risk, historical experience, length of time the accounts receivable are past due and specific customer collection information. The Company performs periodic credit evaluations of customers’ financial condition and continually monitors collections and payments from its customers. The Company writes off uncollectible invoices when appropriate collection efforts have been exhausted. The allowance for doubtful accounts is included in accounts receivable and unbilled services, net on the consolidated balance sheets.
Property and Equipment
The Company records property and equipment at cost less accumulated depreciation and amortization. The Company records depreciation and amortization using the straight-line method, based on the following estimated useful lives:
Buildings | 20-40 years |
Furniture and equipment | 4-18 years |
Computer equipment and software | 1-5 years |
The Company depreciates leasehold improvements over the shorter of the remaining lease term or the estimated useful lives of the improvements. The Company capitalizes internal use software development costs incurred during the application development stage, while it expenses all other preliminary stage and post implementation-operation stage costs, including planning, training and maintenance costs as incurred. The Company amortizes software developed or obtained for internal use, including software licenses obtained through a cloud computing arrangement, over the estimated useful life of the software or the term of the licensing or service agreement.
87
PPD, INC. AND SUBSIDIARIES
NOTES TO THE CONSOLIDATED FINANCIAL STATEMENTS
(amounts in tables in thousands, except per share data)
The Company reviews property and equipment for impairment when events and circumstances indicate that the carrying amount of property and equipment might not be recoverable. This evaluation involves various analyses, including undiscounted cash flow projections. In the event undiscounted cash flow projections or other analysis indicate that the carrying amount of property and equipment is not recoverable, the Company records an impairment reducing the carrying value of the property or equipment to its estimated fair value. The Company estimates fair value based on generally accepted valuation techniques, including income and market approaches. These approaches may include a discounted cash flow income model, use of market information of fair value, such as recent sales or market comparables, and other generally accepted approaches. The Company depreciates or amortizes the revised fair value of the property and equipment over the remaining estimated useful life. The valuation of long-lived assets at estimated fair value, when required, is performed using Level 2 or Level 3 fair value inputs.
Goodwill
Goodwill is allocated to each identified reporting unit, which is defined as an operating segment or one level below the operating segment (referred to as a component of the entity). The Company assigns to goodwill the excess of the fair value of consideration conveyed for a business acquired over the fair value of identifiable net assets acquired. The Company reviews goodwill for impairment annually during the fourth quarter, and more frequently if impairment indicators arise. Impairment indicators include events or changes in circumstances that would more likely than not reduce the fair value of a reporting unit with assigned goodwill below its carrying amount. The Company monitors events and changes in circumstances on a continuous basis between annual impairment testing dates to determine if any events or changes in circumstances indicate potential impairment.
The Company performs a qualitative assessment to determine whether it is more likely than not that the estimated fair value of a reporting unit is greater than its carrying value. The qualitative analysis includes an assessment of macroeconomic conditions, industry and market specific considerations, internal cost factors, financial performance, fair value history and other Company specific events. If the qualitative analysis indicates that it is more likely than not that the estimated fair value is less than the carrying value for the reporting unit, the Company performs a quantitative analysis of the reporting unit. If based on the qualitative analysis it is more likely than not that the reporting unit’s estimated fair value exceeds its carrying value, no further analysis is required.
When the Company performs a quantitative analysis, the Company estimates the fair value of each reporting unit using generally accepted valuation techniques, which include a weighted combination of income and market approaches. The income approach incorporates a discounted cash flow model in which the estimated future cash flows of the reporting unit are discounted using an appropriately risk-adjusted weighted-average cost of capital. The forecasts used in the discounted cash flow model for each reporting unit are based in part on strategic plans and represent the Company’s estimates based on current and forecasted business and market conditions. The market approach considers the Company’s results of operations and information about the Company’s publicly traded competitors, such as earnings multiples, making adjustments to the selected competitors based on size, strengths and weaknesses, as well as publicly announced acquisition transactions. The determination of fair value for each reporting unit requires significant judgments and estimates and actual results could be materially different than those judgments and estimates resulting in goodwill impairment. If the reporting unit’s carrying value exceeds the estimated fair value, a goodwill impairment loss must be recognized in an amount equal to that excess for that reporting unit, not to exceed the total goodwill amount for that reporting unit. If based on the quantitative analysis the reporting unit’s estimated fair value exceeds its carrying value, no goodwill impairment is recorded. The valuation of goodwill at estimated fair value, when required, is performed using Level 2 or Level 3 fair value inputs.
During the year ended December 31, 2018, the Company recognized goodwill impairment for one reporting unit in its Clinical Development Services segment. During the year ended December 31, 2017, the Company recognized goodwill impairment for a different reporting unit in its Clinical Development Services segment. See Note 9, “Goodwill and Intangible Assets, Net,” for additional information on the goodwill impairments.
88
PPD, INC. AND SUBSIDIARIES
NOTES TO THE CONSOLIDATED FINANCIAL STATEMENTS
(amounts in tables in thousands, except per share data)
Intangible Assets
Definite-lived intangible assets consist of trade names, investigator/payer network, technology/intellectual property, know-how/processes, backlog and customer relationships. The Company amortizes customer relationships using either a sum-of-the-years’ digits method or straight-line method over their estimated useful lives. The Company amortizes all of its other definite-lived intangible assets using the straight-line method over their estimated useful lives. The methods used reflect the expected pattern of benefit over the expected useful lives of each type of intangible asset. As of December 31, 2019, the weighted-average remaining amortization period was 12 years for all intangible assets. The estimated useful lives are as follows:
Trade names | 10-23 years |
Investigator/payer network | 5-10 years |
Technology/intellectual property | 2-8 years |
Know-how/processes | 7-10 years |
Backlog | 1-6 years |
Customer relationships | 13-23 years |
The Company reviews definite-lived intangible assets for impairment when circumstances indicate that the carrying amount of assets might not be recoverable. This evaluation involves various analyses, including undiscounted cash flow projections. In the event undiscounted cash flow projections or other analyses indicate that the carrying amount of the intangible asset is not recoverable, the Company records an intangible asset impairment reducing the carrying value of the intangible asset to its estimated fair value. The Company estimates fair value based on generally accepted valuation techniques, including cost and income approaches. These approaches may include a discounted cash flow model and other generally accepted approaches. The new fair value of the intangible asset is amortized over the remaining estimated useful life. The valuation of intangible assets at estimated fair value, when required, is performed using Level 2 or Level 3 fair value inputs. The Company does not have any indefinite-lived intangible assets other than goodwill.
Investments
Equity Method
The Company has investments in unconsolidated affiliates that are accounted for under the equity method of accounting and are classified as investments in unconsolidated affiliates on the consolidated balance sheets as the Company exercises significant influence. The Company records its pro rata share of the earnings of its investments in equity in losses of unconsolidated affiliates, net of taxes on the consolidated statements of operations.
The Company periodically reviews its equity method investment for declines in value that may be other than temporary. If an impairment indicator suggests that the estimated fair value of the investment may be less than the carrying value of the investment, the Company performs an analysis to estimate the fair value for the equity method investment, as well as assessing if the decline in the fair value estimate is other than a temporary decline. The Company estimates fair value based on generally accepted valuation techniques, including income and market approaches. The approaches may include a discounted cash flow model, use of market information such as information on the Company’s publicly traded competitors and other generally accepted approaches. Because of the inherent uncertainty of valuations, estimated valuations may differ significantly from the values that would have been used had a ready market for the securities existed, and the differences could be material. The valuation of the equity method investment at estimated fair value, when required, is performed using Level 2 or Level 3 fair value inputs. See Note 7, “Investments,” for additional information on the Company’s investments recognized under the equity method.
89
PPD, INC. AND SUBSIDIARIES
NOTES TO THE CONSOLIDATED FINANCIAL STATEMENTS
(amounts in tables in thousands, except per share data)
Other Investments
The Company’s other investments primarily consist of equity method investments in limited partnerships measured at fair value utilizing the fair value option, but for which fair values are not readily determinable. The Company records changes in the fair value of the investments in limited partnerships, representing realized and unrealized gains or losses, as a component of (loss) gain on investments on the statements of operations. The nature of the underlying investments in these funds is such that distributions are received through the liquidation of the underlying assets of the fund. Distributions reduce the fair value of the investment and are considered a return of investment. The Company does not receive significant amounts of interest or dividends from these investments. The estimate of fair value involves an evaluation of the investment and its underlying assets, including the market for the investment, available information on historical and projected financial performance, the potential sale or initial public offering of the underlying assets, the stage of development of the underlying assets, recent private transactions, control over the investment partnership and the lack of marketability of the investments, as well as the Company’s expected holding period, among other considerations. See Note 7, “Investments” and Note 15, “Fair Value Measurements,” for additional information on the Company’s investments accounted for under the fair value option.
Pension Plan
The Company has a frozen defined benefit pension plan (the “Pension Plan”) that provides retirement benefits to certain qualifying current and former U.K. employees. The determination of the benefit obligation and expense is based on actuarial models. In order to measure the benefit cost and obligation using these models, critical assumptions are made with regard to the discount rate, expected return on plan assets and the assumed rate of compensation increases. The Company reviews these critical assumptions at least annually. Other assumptions involve demographic factors such as retirement and mortality rates. The Company reviews these assumptions periodically and updates them when its experience deems it appropriate to do so.
The discount rate represents the interest rate the Company would pay to purchase high quality investments to provide sufficient cash to settle its current projected benefit obligation. The discount rate is determined using a yield curve based on an index of GBP denominated AA corporate bonds in the U.K. for the appropriate maturity of the cash flow being discounted. The Company estimates interest cost components of net periodic benefit cost (credit) for the Company’s Pension Plan by utilizing a full yield curve approach in the estimation of these components by applying the specific spot rates along the yield curve used in the determination of the benefit obligation to each of the underlying projected cash flows based on time until payment. The expected long-term rate of return on assets assumption is based on expectations for future yields on investments. The long-term rate of return is developed by considering expected returns on U.K. government bonds, expected dividend yield and growth and the Pension Plan’s asset allocation.
The Company utilizes a corridor approach to amortizing unrecognized gains and losses on the Pension Plan. Amortization occurs when the accumulated unrecognized net gain or loss balance exceeds 10% of the larger of the beginning balances of the projected benefit obligation or the market-related value of the plan assets. The excess unrecognized gain or loss balance is then amortized using the average remaining working lives of the employees participating in the Pension Plan.
Debt Issuance and Modification Costs
Debt issuance costs and certain debt modification costs associated with the Company’s long-term debt arrangements are deferred and presented as a direct deduction from long-term debt and finance lease obligations on the consolidated balance sheets. Deferred debt issuance costs associated with the Company’s revolving credit facility are capitalized and presented as an other asset on the consolidated balance sheets. All deferred debt issuance and modification costs are amortized over the term of the related debt or agreement using the effective interest method.
Income Taxes
The Company accounts for income taxes under the asset and liability method, which requires the recognition of deferred tax assets and liabilities for the expected future tax consequences of events that have been included in the consolidated financial statements. Under this method, the Company determines deferred tax assets and liabilities based on the differences between amounts recorded in the consolidated financial statements and tax basis of assets and liabilities using enacted tax rates in effect for the year in which differences are expected to reverse. The effect of a change in tax rates on deferred tax assets and liabilities is recognized in income in the period that includes the enactment date.
90
PPD, INC. AND SUBSIDIARIES
NOTES TO THE CONSOLIDATED FINANCIAL STATEMENTS
(amounts in tables in thousands, except per share data)
The Company records deferred tax assets to the extent it believes these assets will more likely than not be realized. All available positive and negative evidence is reviewed in making a determination. The evidence includes future reversals of existing deferred tax liabilities, historical and projected future taxable income and tax planning strategies. The realization of the deferred income tax assets ultimately depends on the existence of sufficient taxable income in either the carryback or carryforward periods under tax law. If future events differ from the Company’s current forecasts, a valuation allowance may need to be established or released. The Company records deferred taxes as long-term assets or liabilities on the consolidated balance sheets.
The Company assesses its income tax positions and records tax benefits based upon management’s evaluation of the facts, circumstances and information available at the reporting date. For those tax positions where it is more likely than not that a tax benefit will be sustained, the Company records the largest amount of tax benefit with a greater than 50 percent likelihood of being realized upon ultimate settlement with a taxing authority having full knowledge of all relevant information. For those income tax positions where it is not more likely than not that a tax benefit will be sustained, no tax benefit is recognized in the consolidated financial statements. The Company classifies liabilities for unrecognized tax benefits as accrued income taxes on the consolidated balance sheets unless the uncertainty is expected to be resolved within one year. The Company’s policy for recording interest and penalties associated with unrecognized tax benefits is to record them as a component of provision for (benefit from) income taxes. See Note 12, “Income Taxes,” for additional information.
Commitments and Contingencies
The Company records and discloses a liability for pending and threatened litigation matters when an adverse outcome is probable and the amount of the potential liability is reasonably estimable. The Company reviews claims and legal proceedings on a continuous basis and records or adjusts liabilities recorded for such matters based on updated facts and circumstances including settlements or offers to settle, judicial rulings, advice of counsel or other pertinent matters. Legal costs associated with contingencies are charged to expense as incurred.
The Company is involved in a variety of pending and threatened legal and tax proceedings, claims and litigation that arise from time to time in the ordinary course of business. These actions may be threatened or commenced by various parties, including customers, current or former employees, vendors, government agencies or others. Based on the latest information available, the Company does not expect any pending or threatened legal or tax proceeding, claim or litigation, either individually or in the aggregate, will have a material adverse effect on the business, financial position, results of operations and/or cash flows of the Company.
Derivative Instruments and Hedging Activities
The Company may use derivatives to manage its exposure to foreign currency and interest rate risk. When the Company uses derivatives, the Company records the fair value of derivative instruments on the consolidated balance sheet as either an asset or liability. Changes in a derivative’s fair value are recorded each period in income from operations or other comprehensive income or loss (“OCI” or “OCL”), depending on the type of hedge transaction, whether the derivative is designated and whether the derivative is effective as a hedged transaction. Changes in the fair value of derivative instruments recorded to OCI or OCL are reclassified to income from operations in the period affected by the underlying hedged item. Any portion of the fair value of a derivative instrument determined to be ineffective is recognized in current earnings.
Concentration of Credit Risk
Financial instruments that subject the Company to concentrations of credit risk consist principally of cash and cash equivalents and accounts receivable and unbilled services, net. Based on the nature of the financial instruments and/or historical realization of these financial instruments as well as the financial institutions holding the deposits, the Company believes it bears minimal credit risk.
91
PPD, INC. AND SUBSIDIARIES
NOTES TO THE CONSOLIDATED FINANCIAL STATEMENTS
(amounts in tables in thousands, except per share data)
Foreign Currency
The Company translates assets and liabilities of foreign operations, where the functional currency is the local currency, into U.S. dollars at the rate of exchange at each reporting date and stockholders’ equity accounts at historical exchange rates. The Company translates income and expenses at the exchange rate on the date in which the transaction occurs or at the average exchange rate prevailing during the month in which a transaction occurs. Gains or losses from translating foreign currency amounts are recorded in OCI or OCL. As a result of foreign operations, the Company is exposed to foreign currency exchange risk due to the timing between the initiation of a transaction and the ultimate settlement of the transaction. Therefore, the Company incurs foreign currency transaction and re-measurement gains or losses. The Company includes foreign currency transaction and re-measurement gains and losses in other (expense) income, net on the consolidated statements of operations.
Business Combinations
The Company accounts for business combinations using the acquisition method of accounting, where the identifiable assets acquired, the liabilities assumed and any noncontrolling interest in the acquired entity are measured at their fair values and recognized on the date of acquisition. Initial estimates of fair value may be recorded as provisional, with measurement period adjustments to fair value recorded in subsequent periods. The measurement period is defined as the time period in which all information has been obtained to determine the fair value of the identifiable assets acquired, liabilities assumed and any noncontrolling interests. However, the measurement period is to not exceed one year from the date of acquisition. All adjustments made to provisional amounts are recognized in the period in which the adjustments are determined and disclosures are made when such adjustments are significant. Goodwill is the excess of the fair value of the consideration conveyed in the acquisition over the fair value of the identifiable net assets acquired. The fair values assigned to identifiable assets acquired, liabilities assumed and noncontrolling interests are based on management’s estimates and assumptions, as well as other information compiled by management, including available historical information, using generally accepted valuation techniques. Significant judgment may be required to determine these fair values. Actual results could materially differ from the estimates and assumptions used in the determination of fair value, which could result in an impairment of the intangible assets or goodwill, or require acceleration of amortization expense of definite-lived intangible assets.
The Company records assets and liabilities representing working capital at their historical costs, which approximate fair value given the short-term nature of the assets and liabilities. The Company may use the market, income or cost approaches to value significant property and equipment acquired. The Company generally uses the income approach method to estimate the fair value of definite-lived intangible assets consisting of customer relationships, backlog, and trade names. The Company generally uses the cost approach method to estimate the fair value of investigator/payer network, certain technology/intellectual property and know-how/processes. Significant estimates and assumptions in the estimates of fair value reflect the consideration of other marketplace participants, and include the amount and timing of future cash flows (including expected growth rates and profitability), economic barriers to entry, the brand’s relative market position, estimated royalty rates, estimated costs to replicate, opportunity costs and the discount rate applied to future cash flows. The valuation of property and equipment and definite-lived intangible assets at fair value is primarily performed using Level 2 or Level 3 fair value inputs.
Fair Value
The Company records certain assets and liabilities at fair value on a recurring and nonrecurring basis. Fair value is
defined as the price that would be received to sell an asset or paid to transfer a liability, or the exit price, in an orderly
transaction between market participants at the measurement date. U.S. GAAP establishes a fair value hierarchy that gives
highest priority to quoted prices (unadjusted) in active markets for identical assets or liabilities and the lowest level to
unobservable inputs. The inputs used to measure fair value are classified into the following fair value hierarchy:
• Level 1 - Quoted prices (unadjusted) for identical assets or liabilities in active markets that the Company can
access at the measurement date.
• Level 2 - Observable inputs other than quoted prices in Level 1, including (i) quoted prices for similar assets and
liabilities in active markets, (ii) quoted prices for identical or similar assets or liabilities in markets that are not
active and (iii) observable inputs for the assets or liabilities other than quoted market prices.
• Level 3 - Unobservable inputs that are supported by little or no market activity and are significant to the fair
value of the assets or liabilities. This includes assets and liabilities determined using pricing models, discounted cash flow methodologies or similar techniques reflecting the Company’s own assumptions.
92
PPD, INC. AND SUBSIDIARIES
NOTES TO THE CONSOLIDATED FINANCIAL STATEMENTS
(amounts in tables in thousands, except per share data)
The fair value measurement of a financial instrument and its classification within the hierarchy is determined based on the lowest level input that is significant to the fair value measurement in its entirety. In certain cases, the inputs used to measure fair value fall into different levels of the fair value hierarchy. In such cases, for disclosure purposes, the level in the fair value hierarchy within which the fair value measurement in its entirety falls is based on the lowest level input that is significant to the fair value measurement in its entirety. The Company reports transfers between valuation levels at their fair value as of the beginning of the month in which such changes in the fair value inputs occur.
Earnings per Share
The calculation of earnings per share (“EPS”) is based on the Company’s net income that is attributable to its common stockholders divided by the weighted-average number of common shares or common share equivalents outstanding during the applicable period. The Company’s net income that is attributable to common stockholders will generally not be the same as the Company’s consolidated net income due to the effects of redeemable noncontrolling interests recognized and deemed dividends related to recapitalization contingent consideration. See Note 5, “Stockholders’ Deficit and Redeemable Noncontrolling Interest” and Note 2, “Recapitalization Transaction,” for additional information.
The dilutive effect of common share equivalents is excluded from basic EPS and is included in the calculation of diluted EPS. Restricted stock and stock options granted by the Company are treated as potential common shares outstanding in computing diluted EPS. Diluted shares outstanding are calculated based on the average share price for each fiscal period using the treasury stock method.
Under the treasury stock method, the amount the employee must pay for exercising stock options and the amount of compensation cost for future service that the Company has not yet recognized are assumed to be used to repurchase shares. The Company does not include potentially dilutive shares in the calculation of diluted weighted-average number of common shares outstanding in cases where the inclusion of such additional shares would be anti-dilutive. See Note 18, “Earnings Per Share,” for additional information on the Company’s calculation of basic and diluted EPS.
Reportable Segments
The Company has two reportable segments, Clinical Development Services and Laboratory Services. The Clinical Development Services segment provides a wide range of services to its customers including early development/Phase I, patient recruitment and enrollment, investigator site management, Phase II-IV clinical trial management, medical communications and various peri- and post-approval services. The Laboratory Services segment provides comprehensive services to its customers including bioanalytical, vaccine sciences, good manufacturing practices (“GMP”), central lab and biomarker testing. Both segments provide services to pharmaceutical, biotechnology, medical device, government organizations and other industry participants. During the fourth quarter of 2019, the chief operating decision maker (the “CODM”) updated the manner in which financial information is reviewed for purposes of assessing performance and making operating decisions for the Company’s reportable segments. See Note 19, “Segments,” for additional information on this change and the Company’s identified reportable segments.
Recently Issued Accounting Standard
In August 2018, the FASB issued an accounting standards update to address a customer’s accounting for implementation costs incurred in a cloud computing arrangement that is a service contract. This new guidance was issued to align the accounting for costs incurred to implement a cloud computing arrangement that is a service contract with the guidance on capitalizing costs associated with developing or obtaining internal-use software. Upon the adoption of this standard, implementation costs incurred in a cloud computing arrangement that is a service contract will be capitalized and presented in the financial statements similar to prepaid expenses related to service contracts. Additionally, expenses associated with capitalized implementation costs will be recorded in the same financial statement line item as the fees associated with the hosting element of a cloud computing arrangement. The accounting standards update became effective for the Company for quarterly and annual reporting on January 1, 2020. Entities have the option of using either the retrospective or prospective method to adopt the standard and the Company expects to elect the prospective method. The Company is in the process of evaluating the impact of this new accounting guidance on its consolidated financial statements and plans to finalize this evaluation for quarterly reporting as of March 31, 2020.
93
PPD, INC. AND SUBSIDIARIES
NOTES TO THE CONSOLIDATED FINANCIAL STATEMENTS
(amounts in tables in thousands, except per share data)
2. Recapitalization Transaction
Overview
On May 11, 2017, the Majority Sponsors completed the Recapitalization. The Recapitalization was funded through (i) cash equity contributions (and deferred equity contributions) from investment funds affiliated with the Sponsors, (ii) equity contributions of PPD common stock from affiliates of one of the Sponsors and from certain members of management, (iii) the issuance of new long-term debt and (iv) cash on hand from the Company, as well as the assumption of the Company’s existing long-term debt.
In summary, the following transactions associated with the Reorganization Merger and Recapitalization Merger were effectuated to complete the Recapitalization:
At the effective time of the Reorganization Merger:
• | each issued and outstanding share of Jaguar I common stock was automatically canceled and converted into one share of initial PPD common stock; |
• | shares of Jaguar I common stock held in treasury were canceled and retired for no cash or other consideration; and |
• | PPD assumed the Jaguar I 2011 Equity Incentive Plan (the “Jaguar I Plan”) and each outstanding option to purchase Jaguar I common stock (a “Jaguar I Option”) was converted into an equivalent option to purchase the same number of shares of initial PPD common stock (a “PPD Option”), including the same terms, conditions and vesting requirements in place prior to the Reorganization Merger. |
Immediately prior to the Recapitalization Merger:
• | the Conversion occurred; |
• | Buyer was funded with cash equity contributions totaling $770.2 million from investment funds affiliated with the Sponsors in exchange for the issuance of 51.1 million shares; and |
• | a rollover of initial PPD common stock by one of the Sponsor affiliates and certain members of management occurred (collectively, the “Rollover Sellers”) for a total of $1.4 billion, whereby the Rollover Sellers contributed 92.5 million shares of initial PPD common stock (the “Rollover Shares”) in exchange for the same number of shares of Buyer common stock, plus the right to receive additional consideration as described below. |
At the effective time of the Recapitalization Merger:
• | 87.1 million shares of initial PPD common stock (including PPD restricted stock) issued and outstanding were canceled and converted into and became the right to receive from Buyer, without interest, $1.3 billion in cash consideration plus additional consideration as described below; |
• | shares common stock of Buyer were converted into shares of PPD common stock, respectively; |
• | outstanding initial PPD Options, whether or not vested or exercisable, became fully vested and were canceled and converted into the right to receive (i) the excess of the per share consideration over the applicable exercise price multiplied by the number of shares issuable upon exercise (the “PPD Option Consideration”), (ii) unpaid special cash bonuses (previously awarded, unvested and unpaid) with respect to such Jaguar I Options (“Special Cash Bonuses”) and (iii) additional consideration as described below. Certain members of management who held initial PPD Options received a portion of their PPD Option Consideration in the form of 2.4 million shares of PPD common stock. Refer below for more information on PPD Option Consideration and Special Cash Bonuses; |
• | 132.8 million shares of initial PPD common stock issued and outstanding were cancelled and converted into $2.0 billion of cash consideration payable to certain affiliates of the Majority Sponsors which was deferred (the “Deferred Recapitalization Payment”) until September 29, 2017 (the “Deferred Payment Date”). Refer below for more information on the Deferred Recapitalization Payment; and |
94
PPD, INC. AND SUBSIDIARIES
NOTES TO THE CONSOLIDATED FINANCIAL STATEMENTS
(amounts in tables in thousands, except per share data)
• | the owners of initial PPD common stock after the Reorganization Merger and prior to the Recapitalization Merger (including the Rollover Sellers) and holders of initial PPD Options (collectively, the “Pre-Closing Holders”) each became entitled to receive additional consideration (“Additional Recapitalization Consideration”) related to certain tax benefits anticipated to be received by PPD as a result of the Recapitalization (as specified in the Merger Agreement) and a portion of future cash distributions, if any, to be received by the Company from its investments held at the time of the Recapitalization (the “Investment Portfolio”). Refer below for more information on the Additional Recapitalization Consideration. |
In addition:
• | Eagle II issued $550.0 million of senior unsecured notes, the proceeds of which were used to pay, in part, the cash consideration for the Recapitalization, the PPD Option Consideration and fees and expenses related to the Recapitalization. See Note 10, “Long-term Debt and Finance Lease Obligations” for additional information on the senior unsecured notes; and |
• | the Company incurred $70.4 million of fees and expenses (“Transaction Costs”) related to the Recapitalization. |
PPD Option Consideration and Special Cash Bonuses
The Company paid $194.5 million of PPD Option Consideration for the cash settlement of initial PPD Options, all formerly Jaguar I Options. The change in expected vesting resulted in a modification of certain initial PPD Options prior to the cash settlement and therefore resulted in incremental stock-based compensation being incurred. For the year ended December 31, 2017, the Company recognized $52.2 million of stock-based compensation expense for the vesting and cash settlement of initial PPD Options. Stock-based compensation expense recognized for initial PPD Options included $12.5 million for the remaining unrecognized stock-based compensation expense for the vesting of all initial PPD Options that were considered probable of vesting and $39.7 million of incremental stock-based compensation expense for liquidity event-based and certain performance-based initial PPD Options, each of which had its expected vesting changed from improbable to probable. Other previously vested initial PPD Options, comprised of time-based and certain performance-based options, were treated as a cash settlement of initial PPD Options because the PPD Option Consideration paid was equal to the fair value of such options. The cash settlement of initial PPD Options resulted in a $142.3 million direct increase to the Company’s accumulated deficit. The Company also paid $28.1 million for the cash settlement of the Special Cash Bonuses. For the year ended December 31, 2017, the Company recognized $6.7 million of compensation expense for the Special Cash Bonuses.
The stock-based compensation expense and Special Cash Bonuses expense were recorded as a component of recapitalization costs on the consolidated statements of operations. Prior to the Recapitalization, the Company recognized $2.1 million and $2.5 million of stock-based compensation expense and compensation expense, respectively, in 2017 for the former Jaguar I Options and the Special Cash Bonuses and had not recognized any compensation expense for liquidity event-based options because a liquidity event, as defined in the Jaguar I Plan, had not occurred. Additionally, the Company recognized $7.1 million of compensation cost for payroll taxes related to the cash and share settlement of all initial PPD Options and the Special Cash Bonuses, which was also included as a component of recapitalization costs on the consolidated statements of operations.
There were no stock-based awards granted under the Jaguar I Plan during 2017 and the Jaguar I Plan had 25.0 million stock options outstanding prior to the transactions described above. As a result of the Recapitalization, all outstanding awards were vested and settled (as indicated above) and the Jaguar I Plan was terminated and replaced by the Eagle Holding Company I 2017 Equity Incentive Plan (the “Eagle I Plan”). For additional information on the Eagle I Plan see Note 4, “Stock-based Compensation.”
Deferred Recapitalization Payment
PPD recognized a $2.0 billion current liability on May 11, 2017, for the Deferred Recapitalization Payment. On the Deferred Payment Date, PPD extinguished the mandatorily redeemable liability with the $2.0 billion cash equity contribution received from affiliates of Carlyle and affiliates of H&F in exchange for the issuance of 132.8 million shares of PPD voting common stock. The Deferred Recapitalization Payment and the cash equity contribution on the Deferred Payment Date were recorded to the Company’s accumulated deficit in accordance with the accounting guidance for recapitalizations. The shares associated with the Deferred Recapitalization Payment were treated as outstanding shares for purposes of determining basic and diluted EPS during 2017. See Note 18, “Earnings Per Share,” for additional information.
95
PPD, INC. AND SUBSIDIARIES
NOTES TO THE CONSOLIDATED FINANCIAL STATEMENTS
(amounts in tables in thousands, except per share data)
Recapitalization Tax Benefit Liability
Pursuant to the terms and conditions of the Merger Agreement, the Pre-Closing Holders were entitled to receive Additional Recapitalization Consideration to the extent certain tax benefits were deemed realized by PPD by way of a reduction in cash income taxes payable or receipt of a cash tax refund based on certain anticipated tax attributes related to the Recapitalization. These transaction tax benefits represent contractually negotiated consideration as part of the Merger Agreement (the “Recapitalization Tax Benefit Liability”).
During the year ended December 31, 2018, in connection with the filing of the Company’s 2017 U.S. Corporate Income Tax Return, the Company finalized the amount of the Recapitalization Tax Benefit Liability and distributed $108.3 million from the Company’s cash and cash equivalents on hand and no liability remained as of December 31, 2018.
Recapitalization Investment Portfolio Liability
Pursuant to the terms and conditions of the Merger Agreement, the Pre-Closing Holders are also entitled to receive Additional Recapitalization Consideration based on future payments, if any, received by the Company in respect of the Investment Portfolio. The Additional Recapitalization Consideration represents the right to receive future payments from the Company determined by reference to the cash proceeds received by the Company from the Investment Portfolio, net of taxes and other expenses of the Company deemed attributable to the Investment Portfolio and capital contributions made by the Company in respect of the Investment Portfolio after the Recapitalization (the “Recapitalization Investment Portfolio Liability”). The Recapitalization Investment Portfolio Liability represents an obligation that is estimated and probable to become distributable by transferring assets (i.e., cash) to the Pre-Closing Holders. The Company recorded the Recapitalization Investment Portfolio Liability as a long-term liability. If and when the Company is obligated to make a distribution to the Pre-Closing Holders, a portion of the liability will be reclassified to a current liability. Payments in respect of the Recapitalization Investment Portfolio Liability may be deferred if such payments would violate any covenant under the Company’s debt facilities or limit the ability of the Company to pay interest in cash under such debt facilities.
As of December 31, 2019 and 2018, PPD had $191.7 million and $198.5 million, respectively, recognized for the Recapitalization Investment Portfolio Liability on the consolidated balance sheets. The initial recognition of the Recapitalization Investment Portfolio Liability of $120.0 million recognized on May 11, 2017, resulted in an increase to the Company’s accumulated deficit in accordance with the accounting guidance for contingent consideration for an equity transaction. Changes in the Recapitalization Investment Portfolio Liability (based on changes in the fair value of the investments underlying the Investment Portfolio, net of taxes and other expenses as required by the Merger Agreement) are recognized as an increase or decrease to the liability with a corresponding increase or decrease in the Company’s accumulated deficit, as well as a deemed dividend on the Company’s statements of operations.
During the year ended December 31, 2018 and 2017, the Company paid $16.0 million and $10.5 million, respectively, in distributions related to the Recapitalization Investment Portfolio Liability. No distributions were made in respect of the Recapitalization Investment Portfolio Liability during 2019. Any payments made to the Pre-Closing Holders in respect of the Recapitalization Investment Portfolio Liability reduce such liability. The initial Recapitalization Investment Portfolio Liability and subsequent changes to such liability from changes in the Investment Portfolio were recorded as a non-cash financing activity. See Note 7, “Investments,” for additional information on the Company’s Investment Portfolio.
Recapitalization Transaction Costs
During the year ended December 31, 2017, the Company recognized $51.2 million of Transaction Costs related to the Recapitalization, consisting primarily of deal-related fees such as advisory and other professional fees incurred by and for the benefit of the Company. These Transaction Costs were recorded as a component of recapitalization costs on the consolidated statements of operations. Additionally, the Company recognized $7.3 million of Transaction Costs, consisting primarily of professional fees, as a direct increase to the Company’s accumulated deficit because the costs were paid by the Company for the benefit of and on behalf of affiliates of the Sponsors. Finally, the Company capitalized $11.9 million of debt issuance costs for the issuance of $550.0 million of new senior notes. See Note 10, “Long-term Debt and Finance Lease Obligations,” for additional information on the debt issuance costs.
96
PPD, INC. AND SUBSIDIARIES
NOTES TO THE CONSOLIDATED FINANCIAL STATEMENTS
(amounts in tables in thousands, except per share data)
3. Revenue
Clinical Development Services
The Company’s Clinical Development Services segment provides a wide range of clinical development services to its customers including early development/Phase I, patient recruitment and enrollment, investigator site management, Phase II-IV clinical trial management, medical communications and various peri- and post-approval services. Clinical Development Service contracts are generally fixed-fee, fee-for-service or time and materials contracts and include full-service partnerships, functional service partnerships and other custom-built offerings and tailored services.
The Company’s full-service clinical trial management contracts include multiple promised services such as trial feasibility, investigator recruitment, clinical trial monitoring, project management, database management and biostatistical services, among others. The Company’s full-service clinical trial management services constitute a single performance obligation, which is the delivery of clinical trial data and related reports, as the Company provides a significant service of integrating all promises in the contract and the promises are highly interdependent and interrelated with one another. The Company uses a cost-to-cost input method to recognize revenue for the satisfaction of the performance obligation for full-service contracts. Actual total costs incurred, which is inclusive of direct, third-party pass-through and out-of-pocket costs, is compared to the estimated total costs to satisfy the performance obligation under the contract. This ratio is then multiplied by the estimated total contract consideration to calculate and recognize revenue. This methodology is consistent with the manner in which the customer receives the benefit of the work performed over time as services are rendered and is generally consistent with the Company’s contract termination provisions. Direct costs consist primarily of the amount of direct labor and certain overhead for the delivery of services. The inclusion of actual incurred and estimated total third-party pass-through and out-of-pocket costs in the measure of progress may create a timing difference between the amount of revenue recognized and the actual third-party pass-through and out-of-pocket costs incurred.
The Company reviews and revises estimated total costs to satisfy the performance obligation throughout the life of the contract, with adjustments to revenue resulting from such revisions being recorded in the period in which the change in estimate is determined. Estimated total costs are determined as part of the customer proposal and negotiation process, based on the scope of work, the complexity of the clinical trial services, the geographic locations involved, industry information and historical experience, among other factors. Monthly, accumulated actual total costs on each project are compared to the current estimated total costs to complete the performance obligation under the contract. This process includes, among other things:
• | a comparison of actual total costs incurred in the current month to the budgeted total costs for the month; |
• | detailed input from project teams relating to the status of the project, including the rate of enrollment, the ability to complete individual tasks in the time allotted, the anticipated total units to be achieved, an assessment of expected third-party pass-through and out-of-pocket costs and potential changes to the project scope; |
• | a comparison of third-party pass-through and out-of-pocket costs to direct costs and direct units to be achieved; |
• | a comparison of the fees invoiced and collected to revenue recognized; |
• | a review of experience on projects recently completed or currently running; and |
• | a review of specific customer and industry changes. |
As a result, the Company might determine that previous estimates of total costs need to be revised based upon the new information and such changes in estimates may have a material impact on revenue recognized. In addition, a change in the scope of work generally results in the negotiation of a contract modification to increase or decrease the estimated total contract consideration along with an associated increase or decrease in the estimated total costs to complete.
The Company recognizes revenue for other clinical development services using a variety of input and output methods depending on the type of contract and/or the performance obligations in the contract. Methods utilized primarily include cost-to-cost, units delivered, such as patients recruited or tasks performed, and hours expended. The methods used align with the satisfaction of the performance obligations and benefits received by the customer over time, as the customer would not need to have the services re-performed if the remaining unfulfilled performance obligations were transferred to another party. When contracts for other clinical development services contain multiple performance obligations, the transaction price is allocated to each performance obligation based on a directly observable relative standalone selling price. When not directly observable, the Company utilizes an expected cost plus a margin in order to estimate standalone selling price.
97
PPD, INC. AND SUBSIDIARIES
NOTES TO THE CONSOLIDATED FINANCIAL STATEMENTS
(amounts in tables in thousands, except per share data)
Laboratory Services
The Company’s Laboratory Services segment provides comprehensive laboratory services to its customers including bioanalytical, vaccine sciences, GMP, central lab and biomarker testing. Laboratory Services contracts are generally fixed-fee, fee-for-service or time and materials contracts.
The Company’s laboratory services contracts include multiple service promises such as research and development, sample testing, sample management, certain clinical trial management services and providing full-time equivalent resources, among others. The Company’s laboratory services contracts generally contain multiple performance obligations based on the types of services provided as the Company does not provide a significant integration service, nor are the services highly interrelated or interdependent. The Company uses a variety of output methods to recognize revenue depending on the type of contract and the performance obligations in the contract. Methods primarily utilized to recognize revenue include units delivered, milestones achieved and full-time equivalent resources provided. The methods used align with the satisfaction of the performance obligations and benefits received by the customer over time, as the customer would not need to have the services re-performed if the remaining unfulfilled performance obligations were transferred to another party. When contracts for other laboratory services contain multiple performance obligations, the transaction price is allocated to each performance obligation on a directly observable relative standalone selling price. When not directly observable, the Company utilizes an expected cost plus a margin approach to estimate standalone selling price.
Performance Obligations
Revenue recognized for the years ended December 31, 2019 and 2018 from performance obligations partially satisfied in prior periods was $131.4 million and $145.7 million, respectively. These cumulative catch-up adjustments primarily related to (1) contract modifications executed in the current period, which resulted in changes to the transaction price, (2) changes in transaction price related to variable consideration and (3) changes in estimates such as estimated total costs.
As of December 31, 2019, the aggregate amounts of transaction price allocated to unsatisfied performance obligations with an original contract term of greater than one year was $6.9 billion. The Company expects to recognize 35% to 41% of the transaction price allocated to unsatisfied performance obligations over the next 12 months as services are rendered, with the remainder recognized thereafter during the remaining contract term. The Company does not include the value of the transaction price allocated to unsatisfied performance obligations for contracts that have an original contract term of less than one year or for contracts which are determined to be short-term based on certain termination for convenience provisions.
Accounts Receivable and Unbilled Services, net and Unearned Revenue
The Company’s accounts receivable and unbilled services, net, consisted of the following amounts on the dates set forth below:
December 31, | |||||||
2019 | 2018 | ||||||
Accounts receivable | $ | 726,111 | $ | 700,280 | |||
Unbilled services | 609,674 | 565,473 | |||||
Total accounts receivable and unbilled services | 1,335,785 | 1,265,753 | |||||
Allowance for doubtful accounts | (9,171 | ) | (5,029 | ) | |||
Total accounts receivable and unbilled services, net | $ | 1,326,614 | $ | 1,260,724 | |||
The Company’s unearned revenue consisted of the following amounts on the dates set forth below:
December 31, | ||||||||
2019 | 2018 | |||||||
Unearned revenue | $ | 1,110,872 | $ | 921,964 | ||||
98
PPD, INC. AND SUBSIDIARIES
NOTES TO THE CONSOLIDATED FINANCIAL STATEMENTS
(amounts in tables in thousands, except per share data)
As of December 31, 2019 and 2018, contract assets of $178.8 million and $172.4 million, respectively, were included in unbilled services. The changes in the Company’s contract assets and unearned revenue resulted from the timing difference between the Company’s satisfaction of performance obligations under its contracts, achievement of billing milestones and customer payments. Additionally, during the years ended December 31, 2019 and 2018, the Company recognized revenue of $705.3 million and $513.6 million, respectively, from the balance of unearned revenue outstanding as of January 1, 2019 and January 1, 2018. Impairments of accounts receivable, unbilled services and contract assets were insignificant during the years ended December 31, 2019 and 2018.
Allowance for Doubtful Accounts
The Company’s changes in the allowance for doubtful accounts consisted of the following amounts on the dates set forth below:
Years Ended December 31, | |||||||||||
2019 | 2018 | 2017 | |||||||||
Balance at the beginning of the period | $ | (5,029 | ) | $ | (4,904 | ) | $ | (3,105 | ) | ||
Current year provision | (4,243 | ) | (618 | ) | (3,466 | ) | |||||
Write-offs | 101 | 493 | 1,667 | ||||||||
Balance at the end of the period | $ | (9,171 | ) | $ | (5,029 | ) | $ | (4,904 | ) | ||
Customer Concentration
Concentrations of credit risk with respect to accounts receivable and unbilled services, net, are limited due to the Company’s large number of customers. At December 31, 2019, two customers each accounted for approximately 11% of accounts receivable and unbilled services, net. At December 31, 2018, no customer accounted for greater than 10% of accounts receivable and unbilled services, net. Additionally, no one customer accounted for greater than 10% of revenue for the years ended December 31, 2019, 2018 or 2017.
Contract Costs
The Company often incurs direct and incremental contract costs to obtain a contract with a customer. Contract costs include certain bonuses, commissions and related fringe benefits paid to employees directly related to sales of services that result in a contract. The Company capitalizes the costs to obtain a contract when the expected period of benefit from the contract is greater than one year, and when capitalized, the costs are amortized on a straight-line basis over the expected period of benefit, which is generally the contract term. The Company expenses contract costs as incurred for contracts that have a contract term or estimated service period of one year or less. Capitalized contract costs are included as a component of other assets on the consolidated balance sheets and amortization of capitalized contract costs are included as a component of SG&A expenses on the consolidated statements of operations. No significant capitalized contract cost impairment was recognized during the years ended December 31, 2019 or 2018.
Capitalized contract costs and the related amortization for the period below were as follows:
December 31, | |||||||
2019 | 2018 | ||||||
Capitalized costs to obtain a contract, net | $ | 25,766 | $ | 23,062 | |||
Years Ended December 31, | |||||||
2019 | 2018 | ||||||
Amortization of costs to obtain a contract | $ | 11,432 | $ | 8,693 | |||
99
PPD, INC. AND SUBSIDIARIES
NOTES TO THE CONSOLIDATED FINANCIAL STATEMENTS
(amounts in tables in thousands, except per share data)
4. Stock-based Compensation
Stock Options and Restricted Stock Awards
Overview
In May 2017, the Company adopted the Eagle I Plan in conjunction with the Recapitalization. Under the Eagle I Plan, the Company can issue stock options, restricted stock and other stock-based awards to employees, directors and consultants of the Company. The Company reserved 23.5 million shares of PPD common stock for issuance of stock-based awards under the Eagle I Plan, which may be voting or non-voting common stock. The Eagle I Plan is administered by the board of directors of the Company or any committee or committees thereof to which the board of directors delegates authority (the “Administrator”). The Eagle I Plan provides that the Administrator has the authority to determine who receives awards, to grant awards and to set all terms and conditions of awards, including vesting, exercise and forfeiture provisions. Awards forfeited or expired remain available for future issuance under the Eagle I Plan. As of December 31, 2019, there were 3.2 million shares of PPD common stock available for issuance under the Eagle I Plan. With the completion of the Company’s IPO, no additional awards will be granted under the Eagle I Plan.
Stock options granted under the Eagle I Plan may not have a term that exceeds ten years from the date of grant. The exercise price of stock options issued under the Eagle I Plan may not be less than the fair market value of PPD’s common stock on the date of grant. For stock options that have time-based vesting, the fair value of such options is expensed on a straight-line basis over the requisite service period, which is equal to the vesting period. For stock options that also have performance-based vesting, the performance options are eligible to vest at a rate of up to 20% per year (a “Tranche”) subject to the actual or expected achievement of performance targets for such years. The Company recognizes stock-based compensation expense for the performance stock options on a straight-line basis over the period from the grant date through the end of the respective Tranche year, treating all Tranches as if they are each separate awards. Additionally, the performance stock options have a catch-up provision, which allows options that did not meet the performance targets in a prior year to vest in a subsequent year. The expense related to this catch-up is recorded in the period the catch-up occurs.
The Company determines stock-based compensation expense for restricted stock awards based on the fair value of the restricted stock on the grant date, and recognizes expense on a straight-line basis over the requisite service period, which is equal to the vesting period. The Company also has liquidity/realization event-based stock options, but has not recognized any stock-based compensation expense for such options because a liquidity/realization event, as defined in the Eagle I Plan, had not occurred as of December 31, 2019.
For the years ended December 31, 2019, 2018 and 2017, stock-based compensation under the Eagle I Plan totaled $15.6 million, $18.3 million and $20.0 million, respectively, which the Company has recorded primarily within SG&A expenses on the consolidated statements of operations based on the services provided by the recipients of such stock-based compensation. In 2017, $46.5 million of tax benefit from the cash settlement of the initial PPD Options was recorded in the Company’s benefit from income taxes. See Note 12, “Income Taxes,” for additional information.
Stock Options
Prior to the Company’s IPO, when stock options were granted, the Company obtained a valuation of PPD’s common stock from an independent third-party valuation firm to assist the Company’s board of directors in determining the fair value of stock options granted, unless more authoritative evidence of fair value existed. For all valuations performed, the Company used a weighted combination of income and market approaches. The income approach incorporated the use of a discounted cash flow model in which the estimated future cash flows of the Company were discounted using a risk-adjusted weighted-average cost of capital. The forecasts used in the discounted cash flow model for the Company were based in part on strategic plans and represented estimates based on current and forecasted business and market conditions. The market approaches considered the Company’s results of operations and information about the Company’s publicly traded competitors, such as earnings multiples, making adjustments to the selected competitors based on size, strengths and weaknesses, as well as competitors’ publicly announced acquisition transactions. The fair value of PPD’s common stock was discounted based on its lack of marketability in order to determine the fair value of the stock options on the grant date.
100
PPD, INC. AND SUBSIDIARIES
NOTES TO THE CONSOLIDATED FINANCIAL STATEMENTS
(amounts in tables in thousands, except per share data)
The following table indicates the weighted-average assumptions used in estimating the fair value of stock options granted under the Eagle I Plan as follows:
Years Ended December 31, | ||||||
2019 | 2018 | 2017 | ||||
Expected term (years) | 6.5 | 6.5 | 6.5 | |||
Risk-free interest rate (%) | 2.3 | 2.6 | 2.1 | |||
Expected volatility (%) | 26.4 | 25.0 | 26.0 | |||
Expected dividend (%) | — | — | — | |||
The expected term of the stock options represents the average period the stock options are expected to remain outstanding. As the Company does not have sufficient historical information to develop reasonable expectations about future exercise patterns and post-vesting employment termination behavior, the expected term of options granted is derived from the average midpoint between the weighted-average vesting and the contractual term, also known as the simplified method.
The risk-free interest rate was the rate at the date of grant for a zero-coupon U.S. Treasury bond with a term that approximated the expected term of the stock option. Expected volatility was based on the historical volatility of the Company’s peer group. The Company does not have a history of paying regular dividends, exclusive of the special cash dividends paid to stockholders that were accounted for as a return of capital. The Company does not expect to pay regular cash dividends for the foreseeable future.
A summary of 2019 stock option activity under the Eagle I Plan is presented below.
Stock Options | Weighted- Average Exercise Price | Weighted- Average Remaining Contractual Life | Aggregate Intrinsic Value as of December 31, 2019 | |||||||||
Outstanding at January 1, 2019 | 19,630 | $ | 15.28 | 8.6 years | ||||||||
Granted | 2,367 | 19.62 | ||||||||||
Exercised | (301 | ) | 15.06 | |||||||||
Forfeited | (1,108 | ) | 15.00 | |||||||||
Expired | (285 | ) | 15.23 | |||||||||
Outstanding at December 31, 2019 | 20,303 | $ | 14.10 | 7.8 years | $ | 154,203 | ||||||
Exercisable at December 31, 2019 | 7,162 | $ | 14.31 | 7.6 years | $ | 52,944 | ||||||
Vested or expected to vest at December 31, 2019 | 17,753 | $ | 14.57 | 7.9 years | $ | 126,662 | ||||||
The following table summarizes information about outstanding stock options under the Eagle I Plan as of December 31, 2019:
Stock Options Outstanding | Stock Options Exercisable | ||||||||||||||||
Exercise Price | Number Outstanding at December 31, 2019 | Weighted-Average Remaining Contractual Life | Weighted-Average Exercise Price | Number Exercisable at December 31, 2019 | Weighted-Average Exercise Price | ||||||||||||
Time-based | $ 14.35 - $ 21.70 | 8,870 | 7.9 years | $ | 15.89 | 2,725 | $ | 15.18 | |||||||||
Performance-based | 9.89 - 21.70 | 9,048 | 7.9 years | 13.20 | 4,437 | 13.77 | |||||||||||
Liquidity/realization event-based | 10.59 - 21.70 | 2,385 | 7.6 years | 10.88 | — | — | |||||||||||
101
PPD, INC. AND SUBSIDIARIES
NOTES TO THE CONSOLIDATED FINANCIAL STATEMENTS
(amounts in tables in thousands, except per share data)
All stock options granted during the year ended December 31, 2019 were granted with an exercise price equal to or above the estimated fair value of PPD’s common stock on the grant date. The weighted-average grant date fair value per stock option for stock options granted during the years ended December 31, 2019 and 2018 was $5.46 and $4.69, respectively. The aggregate fair value of stock options granted during the years ended December 31, 2019 and 2018 was $12.9 million and $16.6 million, respectively. The total intrinsic value of options exercised in 2019 and 2018 was approximately $1.4 million and $0.2 million, respectively. As of December 31, 2019, the total unrecognized stock-based compensation cost related to unvested stock options was $35.8 million and was expected to be recognized over a weighted-average period of 2.8 years. The total grant date fair value of stock options vested under the Eagle I Plan during the year ended December 31, 2019 was $16.0 million.
Restricted Stock
The Company has awarded PPD restricted stock under the Eagle I Plan to non-employee independent directors of the Company. The restricted stock vests over a two-year period, with 12.5% of the award vesting on the last day of each calendar quarter following the date of grant. The aggregate fair value of restricted stock granted during the years ended December 31, 2019 and 2018 was $0.2 million. As of December 31, 2019, the total unrecognized compensation cost related to unvested restricted stock was $0.2 million and was expected to be recognized over a weighted-average period of 1.1 years.
A summary of 2019 restricted stock activity under the Eagle I Plan is presented below.
Restricted Stock | Weighted-Average Grant Date Fair Value | |||||
Unvested at January 1, 2019 | 11 | $ | 15.39 | |||
Granted | 12 | 18.66 | ||||
Vested | (14 | ) | 16.48 | |||
Unvested at December 31, 2019 | 9 | $ | 18.05 | |||
Special Cash Bonuses and Option Modifications
In May 2019, in connection with the declaration and payment of a special cash dividend to the Company’s stockholders, the board of directors approved and committed the Company to pay a special cash bonus of $43.7 million to its option holders with respect to vested and unvested time-based and vested performance-based options, each as of May 2019. The special cash bonus is payable in three separate installments. The first installment of $14.6 million was paid in May 2019 and the next two installments are due in September 2020 and September 2021, subject to the optionee’s continued employment as of the payment date. The special cash bonus was considered a modification to the vested and unvested time-based options and vested performance-based options.
In November 2019, in connection with the declaration and payment of a special cash dividend to the Company’s stockholders, the board of directors approved and committed the Company to pay a special cash bonus of $6.5 million to its option holders with respect to vested and unvested time-based options and vested performance-based options as of November 2019. The cash bonus was paid in December 2019. The special cash bonus was considered a modification to the vested and unvested time-based options and vested performance-based options.
As a result of the May 2019 and November 2019 modifications and special cash bonuses, the Company recorded compensation expense, inclusive of incremental stock-based compensation expense, of $20.6 million during the year ended December 31, 2019. The compensation expense related to the modifications and special cash bonuses were primarily recorded as a component of SG&A expenses on the consolidated statements of operations. Additionally, the modifications resulted in a reclassification of $14.7 million from additional paid-in-capital due to the initial cash settlement and liability for the May 2019 special cash bonus and a reclassification of $5.0 million from additional paid-in capital due to the cash settlement for the November 2019 special cash bonus. Also, as a result of the May 2019 and November 2019 special cash dividends, the exercise price of unvested performance-based options was reduced by the dividend amounts of $3.89 and $0.57 per share, respectively. These adjustments were determined by the board of directors to be equitable and necessary to prevent the dilution or enlargement of benefits under the Eagle I Plan. The fair value adjustments for unvested performance-based options were equal to the amounts of the special cash dividends and therefore were not accounted for as modifications. See Note 5, “Stockholders’ Deficit and Redeemable Noncontrolling Interest,” for additional information.
102
PPD, INC. AND SUBSIDIARIES
NOTES TO THE CONSOLIDATED FINANCIAL STATEMENTS
(amounts in tables in thousands, except per share data)
5. Stockholders’ Deficit and Redeemable Noncontrolling Interest
Shares
The following is a summary of the Company’s authorized, issued and outstanding shares for the periods set forth below:
December 31, 2019 | December 31, 2018 | ||||
Shares authorized | 2,080,000 | 2,080,000 | |||
Shares issued | 280,127 | 279,545 | |||
Shares outstanding: | |||||
Voting | 276,052 | 276,052 | |||
Non-voting | 3,374 | 2,978 | |||
Total shares outstanding | 279,426 | 279,030 | |||
Voting, Dividend, and Liquidation Rights of Common Stock
Each share of voting stock is entitled to one vote on all matters to be voted on by the stockholders of the Company holding voting stock, including the election of directors. Each share of non-voting stock is not entitled to a vote. The holders of voting and non-voting stock are entitled to dividends on a pro rata basis at such time and in such amounts, if and when declared by the Company’s board of directors. The holders of voting and non-voting stock are entitled to participate on a pro rata basis in all distributions that may be legally made to the Company’s stockholders in connection with a voluntary or involuntary liquidation, dissolution or winding up of the Company. With the completion of the Company’s IPO, all non-voting shares of common stock were converted to voting shares of common stock. See Note 22, “Subsequent Events” for additional information.
2019 Special Cash Dividends
In May 2019 and November 2019, the Company declared, and subsequently paid, special cash dividends to its stockholders of $1,086.0 million, or $3.89 per share and $160.0 million, or $0.57 per share, respectively. The May 2019 special cash dividend was funded with the issuance of long-term debt and cash on hand, and the November 2019 special cash dividend was funded with cash on hand. The special cash dividends were considered a return of capital to the Company’s stockholders. See Note 10, “Long-term Debt and Finance Lease Obligations,” for additional information on the issuance of long-term debt.
Redeemable Noncontrolling Interest
The Company owns 60% of its consolidated subsidiary PPD-SNBL K.K. (“PPD-SNBL”). The 40% ownership interest held by Shin Nippon Biomedical Laboratories Ltd. (“SNBL”) is classified as a redeemable noncontrolling interest on the consolidated balance sheets due to certain put options under which SNBL may require the Company to purchase SNBL’s remaining ownership interest at fair value upon the occurrence of certain events described in the PPD-SNBL shareholders agreement. As of December 31, 2019 and 2018, no such events had occurred. See Note 17, “Related Party Transactions,” for additional information.
6. Business Combinations
The Company accounted for its business combinations below under the acquisition method of accounting and measured at fair value the identifiable assets acquired and liabilities assumed at the date of acquisition. For each business combination, the Company recorded assets and liabilities representing working capital at their historical costs, which approximate fair value given the short-term nature of the assets and liabilities. The methods used to estimate the fair value of definite-lived intangible assets are consistent with those described in Note 1, “Basis of Presentation and Summary of Significant Accounting Policies.”
103
PPD, INC. AND SUBSIDIARIES
NOTES TO THE CONSOLIDATED FINANCIAL STATEMENTS
(amounts in tables in thousands, except per share data)
Acquisition of Synarc
On September 3, 2019, the Company acquired 100% of the issued and outstanding equity of Synarc, Inc. (“Synarc”), the global site network business of Bioclinica, Inc., expanding its global footprint into China and Latin America and expanding its central nervous system offering in the United States. The preliminary purchase price was $45.2 million, which includes an adjustment to estimated net working capital acquired at the time of acquisition of $5.2 million recorded in the fourth quarter of 2019, and was paid with cash. The purchase price is subject to further post-closing adjustments for cash, debt and net working capital recorded at the time of the acquisition.
The initial accounting is not complete and amounts recorded as part of the acquisition are provisional, pending finalization of the valuation of certain assets. The preliminary goodwill recognized of $1.1 million was primarily the result of anticipated growth through the development of new customers, additional services to existing customers and the assembled workforce. The goodwill was assigned to a reporting unit within the Company’s Clinical Development Services segment. The Company is not able to deduct goodwill for U.S. income tax purposes.
The Company acquired the following provisional definite-lived intangible assets during 2019 with the acquisition of Synarc:
Acquired Intangible Assets | Weighted-Average Amortization Period (in years) | |||||
Customer relationships | $ | 2,000 | 15 | |||
Know-how/processes | 1,800 | 8 | ||||
Investigator network | 1,900 | 8 | ||||
Trade names | 1,400 | 10 | ||||
Total | $ | 7,100 | 10 | |||
The following table summarizes the provisional consideration and the fair values of identifiable assets acquired and liabilities assumed at the acquisition date:
Purchase price | $ | 45,187 | |
Identifiable assets acquired: | |||
Cash and cash equivalents | $ | 6,003 | |
Accounts receivable and unbilled services, net | 23,143 | ||
Prepaid expenses and other current assets | 3,817 | ||
Property and equipment | 19,273 | ||
Intangible assets | 7,100 | ||
Other assets | 5,403 | ||
Operating lease right-of-use assets | 1,609 | ||
Total identifiable assets acquired | 66,348 | ||
Liabilities assumed: | |||
Accounts payable | (5,565 | ) | |
Other accrued expenses | (4,026 | ) | |
Unearned revenue | (7,210 | ) | |
Long-term debt and finance lease obligations | (38 | ) | |
Deferred tax liabilities | (3,447 | ) | |
Other liabilities | (331 | ) | |
Operating lease liabilities | (1,609 | ) | |
Total liabilities assumed | (22,226 | ) | |
Separately identifiable net assets acquired | 44,122 | ||
Goodwill | 1,065 | ||
Total net assets | $ | 45,187 | |
104
PPD, INC. AND SUBSIDIARIES
NOTES TO THE CONSOLIDATED FINANCIAL STATEMENTS
(amounts in tables in thousands, except per share data)
Acquisition of Medimix
On July 1, 2019, the Company acquired 100% of the issued and outstanding equity of Medimix International (“Medimix”), a global technology company providing real-world evidence insights and information to the pharmaceutical, diagnostic and medical device industries. The acquisition is expected to enhance the Company’s ability to leverage data to provide real-world evidence and insights for customers. The preliminary purchase price was $36.8 million, which consisted of $27.5 million of cash, $5.0 million of common stock of the Company and $4.3 million of estimated contingent consideration. The purchase price is subject to post-closing adjustments for cash, debt and net working capital recorded at the time of the acquisition. There have been no material purchase price adjustments made subsequent to the initial recognition of assets and liabilities acquired.
Based on the provisional fair values of identifiable assets acquired and liabilities assumed at the acquisition date, the consideration paid was allocated as follows: (i) $13.5 million to definite-lived intangible assets, (ii) $20.5 million to goodwill and (iii) $2.8 million to other net assets primarily related to net working capital.
In connection with the acquisition of Medimix, contingent consideration in the form of a potential earn-out payment of up to $10.8 million is to be paid if Medimix achieves certain performance measures within the specified measurement period. As of December 31, 2019, the Company recorded an estimated earn-out liability of $9.5 million to be paid based on Medimix meeting certain performance targets through 2019. The change in the estimated earn-out liability for contingent consideration was recorded in SG&A expenses on the consolidated statements of operations, and the estimated liability is included in other accrued expenses on the consolidated balance sheets.
The initial accounting is not complete and amounts recorded as part of the acquisition are provisional, pending finalization of the valuation of certain assets and liabilities. The goodwill recognized was primarily the result of anticipated growth through the development of new customers, additional services to existing customers and the assembled workforce. The goodwill was assigned to a reporting unit within the Company’s Clinical Development Services segment. The majority of goodwill is tax deductible for U.S. income tax purposes.
The Company acquired the following provisional definite-lived intangible assets during 2019 with the acquisition of Medimix:
Acquired Intangible Assets | Weighted-Average Amortization Period (in years) | |||||
Customer relationships | $ | 7,500 | 13 | |||
Trade names | 900 | 10 | ||||
Technology/intellectual property | 5,100 | 8 | ||||
Total | $ | 13,500 | 11 | |||
Acquisition of Optimal Research
On September 1, 2017, the Company acquired 100% of the issued and outstanding membership interests of Optimal Research, LLC (“Optimal Research”), a dedicated research site network with enhanced oncology enrollment capabilities. The purchase price was $24.0 million and was funded with cash on hand. Based on the fair values of identifiable assets acquired and liabilities assumed at the acquisition date, the consideration paid of $24.0 million was allocated as follows: (i) $9.8 million to goodwill, (ii) $12.0 million to definite-lived intangible assets and (iii) $2.2 million to other net assets primarily related to net working capital. The goodwill recognized was primarily the result of anticipated growth through the development of new customers, additional services to existing customers, synergies through shared operations and the assembled workforce. The goodwill was assigned to a reporting unit within the Company’s Clinical Development Services segment. The goodwill is tax deductible of U.S. income tax purposes.
105
PPD, INC. AND SUBSIDIARIES
NOTES TO THE CONSOLIDATED FINANCIAL STATEMENTS
(amounts in tables in thousands, except per share data)
The Company acquired the following definite-lived intangible assets during 2017 with the acquisition of Optimal Research:
Acquired Intangible Assets | Weighted-Average Amortization Period (in years) | |||||
Customer relationships | $ | 5,300 | 15 | |||
Backlog | 120 | 2 | ||||
Investigator network | 1,800 | 8 | ||||
Know-how/processes | 4,800 | 10 | ||||
Total | $ | 12,020 | 12 | |||
Results from Acquisitions
The Company had the following results from its acquisitions for the periods subsequent to closing:
Business Combination | Time Period | Net Revenue | Net (Loss) Income | |||||
Synarc | September 3, 2019 to December 31, 2019 | $ | 17,170 | Insignificant | ||||
Medimix | July 1, 2019 to December 31, 2019 | 5,996 | Insignificant | |||||
Optimal | September 1, 2017 to December 31, 2017 | 3,339 | Insignificant | |||||
Acquisition Costs
Acquisition costs are expensed as incurred and for the years ended December 31, 2019, 2018 and 2017, acquisition costs were $7.9 million, $0.8 million and $8.5 million, respectively, and are included on the consolidated statements of operations as a component of SG&A expenses.
7. Investments
Equity Method Investments
The Company’s investments in unconsolidated affiliates consisted of the following amounts on the dates set forth below:
December 31, | |||||||
2019 | 2018 | ||||||
Medable, Inc. | $ | 15,684 | $ | 8,756 | |||
Science 37, Inc. | 18,344 | — | |||||
Total | $ | 34,028 | $ | 8,756 | |||
In 2018, the Company made an investment of $9.0 million in Medable, Inc. (“Medable”). Medable is a technology company that provides a platform to support data-driven and digitally enabled clinical trials. In 2019, the Company made an additional investment of $10.0 million. As of December 31, 2019, the Company had a 28.5% ownership interest in Medable. The Company accounts for its investment as an equity method investment as it is able to exercise significant influence. Additionally, the Company and Medable are parties to certain collaborative arrangements under which the parties may collaborate on various drug development technology or services.
In 2019, the Company made an investment of $20.0 million in Science 37, Inc. (“Science 37”), a clinical trial company whose virtual trial model focuses on improving patient access and enrollment and accelerating clinical development. As of December 31, 2019, the Company had a 17.1% ownership interest in Science 37. The Company accounts for its investment as an equity method investment as it is able to exercise significant influence.
106
PPD, INC. AND SUBSIDIARIES
NOTES TO THE CONSOLIDATED FINANCIAL STATEMENTS
(amounts in tables in thousands, except per share data)
Other Investments
The Company’s other investments consisted of the following amounts on the dates set forth below:
December 31, | |||||||
2019 | 2018 | ||||||
Auven Therapeutics Holdings, L.P. | $ | 228,959 | $ | 241,305 | |||
venBio Global Strategic Fund, L.P. | 14,108 | 12,690 | |||||
Venture capital funds and investment partnerships | 5,386 | 2,129 | |||||
Other investments | 1,895 | 9,591 | |||||
Total | $ | 250,348 | $ | 265,715 | |||
The Company is a limited partner in Auven Therapeutics Holdings, L.P. (“Auven”), an investment partnership organized for the purpose of identifying, acquiring and investing in a diversified portfolio of novel therapeutic product candidates. As of December 31, 2019, the Company owned 32.7% of the outstanding partnership interests of Auven and had no remaining capital commitments. Additionally, the Company is a limited partner in venBio Global Strategic Fund, L.P. (“venBio”), an investment partnership which invests in early stage life science companies. As of December 31, 2019, the Company owned 22.3% of venBio and had a remaining capital commitment of $1.7 million, which it expects to fund over the next year. The Company’s investments in Auven and venBio are recorded at fair value utilizing the fair value option. As part of the Recapitalization, the Pre-closing Holders are entitled to receive Additional Recapitalization Consideration. The Additional Recapitalization Consideration represents the right to receive future payments from the Company determined by reference to the cash proceeds received by the Company from the Investment Portfolio, net of taxes and other expenses of the Company deemed attributable to the Investment Portfolio. The cash proceeds received by the Company could include distributions received from, or the disposal of, the investments included in the Investment Portfolio. Auven and venBio also comprise the majority of the Company’s Investment Portfolio from the Recapitalization. See Note 2, “Recapitalization Transaction” for additional information on the Investment Portfolio.
The Company’s investments in Auven and venBio each represent a variable interest entity that could expose the Company to losses. The amount of losses the Company could be exposed to from either investment is limited to its capital amount invested and any appreciation from the initial amount invested. The general partners in both investments have all decision-making authority relating to investment, financial and operating decisions, and the Company is not able to remove either general partner. As such, the Company is deemed to lack the control of Auven and venBio required for consolidation.
In 2018, the Company became a limited partner in Abingworth Bioventures VII LLP (“Abingworth VII”). Abingworth VII is an investment partnership dedicated to making investments in the life sciences and healthcare sectors. As of December 31, 2019, the Company owned 3.2% of Abingworth VII and had a remaining capital commitment of $5.7 million, which will be funded as capital calls are received over the next four years.
The Company also holds an equity investment in a publicly traded late-stage clinical biopharmaceutical company focused on the development and commercialization of human therapeutics. In 2018, the investment became listed and traded on an active market with quoted prices.
See Note 15, “Fair Value Measurements,” for additional information on the investment activity for the years ended December 31, 2019 and 2018.
The summarized financial information presented below reflects the aggregated financial information of Auven and venBio as of and for periods ended December 31 of each year. The net investment (loss) income information presented below reflects the net realized and unrealized gains (losses), net of expenses and investment income, related to each investment. Auven and venBio have unclassified balance sheets. Therefore, the asset and liability information presented below are not split between current and non-current.
December 31, | |||||||||||
2019 | 2018 | 2017 | |||||||||
Net investment (loss) income (for the years ended December 31) | $ | (280,962 | ) | $ | (140,943 | ) | $ | 598,285 | |||
Total assets (as of December 31) | 1,396,040 | 1,645,063 | 2,005,154 | ||||||||
Total liabilities (as of December 31) | 30,812 | 2,105 | 126,407 | ||||||||
107
PPD, INC. AND SUBSIDIARIES
NOTES TO THE CONSOLIDATED FINANCIAL STATEMENTS
(amounts in tables in thousands, except per share data)
8. Property and Equipment, Net
Property and equipment, net consisted of the following amounts on the dates set forth below:
December 31, | |||||||
2019 | 2018 | ||||||
Land | $ | 6,795 | $ | 6,809 | |||
Buildings and leasehold improvements | 384,975 | 345,262 | |||||
Furniture and equipment | 264,233 | 245,522 | |||||
Computer equipment and software | 311,381 | 307,126 | |||||
Construction-in-progress, including information | |||||||
technology systems under development | 76,972 | 39,110 | |||||
Total property and equipment | 1,044,356 | 943,829 | |||||
Less: accumulated depreciation and amortization | (585,511 | ) | (544,726 | ) | |||
Property and equipment, net | $ | 458,845 | $ | 399,103 | |||
Depreciation and amortization expense for property and equipment for the years ended December 31, 2019, 2018 and 2017 was $102.9 million, $90.4 million and $95.7 million, respectively.
For the years ended December 31, 2019 and 2017, the Company reduced the book value of information technology systems under development by recording impairments of $1.3 million and $4.7 million, respectively, as a result of projects no longer probable of being developed, abandoned or delayed indefinitely. The Company recorded the impairments as a component of goodwill and long-lived asset impairments on the consolidated statements of operations. The Company did not record any impairments of property and equipment in 2018. See Note 1, “Basis of Presentation and Summary of Significant Accounting Policies,” for additional information on the fair value methodology used for nonrecurring fair value measurements.
108
PPD, INC. AND SUBSIDIARIES
NOTES TO THE CONSOLIDATED FINANCIAL STATEMENTS
(amounts in tables in thousands, except per share data)
9. Goodwill and Intangible Assets, Net
Goodwill
The changes in the carrying amount of goodwill by segment consisted of the following on the dates set forth below:
Total | Clinical Development Services | Laboratory Services | |||||||||
Balance at December 31, 2017: | |||||||||||
Goodwill | $ | 1,887,805 | $ | 1,661,191 | $ | 226,614 | |||||
Accumulated impairment losses | (97,085 | ) | (69,806 | ) | (27,279 | ) | |||||
Goodwill, net | 1,790,720 | 1,591,385 | 199,335 | ||||||||
2018 Activity: | |||||||||||
Translation adjustments | (38,707 | ) | (38,707 | ) | — | ||||||
Goodwill impairment | (29,626 | ) | (29,626 | ) | — | ||||||
Measurement period adjustments for prior acquisition | 991 | 991 | — | ||||||||
Balance at December 31, 2018: | |||||||||||
Goodwill | 1,850,089 | 1,623,475 | 226,614 | ||||||||
Accumulated impairment losses | (126,711 | ) | (99,432 | ) | (27,279 | ) | |||||
Goodwill, net | 1,723,378 | 1,524,043 | 199,335 | ||||||||
2019 Activity: | |||||||||||
Translation adjustments | 12,814 | 12,814 | — | ||||||||
Goodwill recorded from current year acquisitions | 27,912 | 27,912 | — | ||||||||
Balance at December 31, 2019: | |||||||||||
Goodwill | 1,890,815 | 1,664,201 | 226,614 | ||||||||
Accumulated impairment losses | (126,711 | ) | (99,432 | ) | (27,279 | ) | |||||
Goodwill, net | $ | 1,764,104 | $ | 1,564,769 | $ | 199,335 | |||||
The Company recognized goodwill impairment of $29.6 million and $38.4 million for the years ended December 31, 2018 and 2017, respectively, on the consolidated statements of operations. In 2018, a reporting unit’s expected future cash flows decreased due to lower forecasted long-term revenue growth and higher forecasted operating expenses, resulting in reduced margins. In 2017, a different reporting unit’s expected future cash flows decreased due to lower forecasted long-term revenue growth and reduced margins, primarily as a result of the loss of certain key customers. The reporting units impaired are included as part of the Company’s Clinical Development Services segment. The Company did not recognize any goodwill impairment for the year ended December 31, 2019.
Intangible Assets, Net
The Company’s definite-lived intangible assets were composed of the following on the dates set forth below:
December 31, | ||||||||||||||||||||||||
2019 | 2018 | |||||||||||||||||||||||
Carrying Amount | Accumulated Amortization | Net | Carrying Amount | Accumulated Amortization | Net | |||||||||||||||||||
Customer relationships | $ | 884,788 | $ | (415,427 | ) | $ | 469,361 | $ | 870,648 | $ | (356,099 | ) | $ | 514,549 | ||||||||||
Trade names | 372,210 | (139,141 | ) | 233,069 | 368,189 | (121,614 | ) | 246,575 | ||||||||||||||||
Backlog | 177,599 | (175,571 | ) | 2,028 | 176,610 | (172,884 | ) | 3,726 | ||||||||||||||||
Investigator/payer network | 236,082 | (185,478 | ) | 50,604 | 233,356 | (161,219 | ) | 72,137 | ||||||||||||||||
Technology/intellectual property | 8,600 | (3,319 | ) | 5,281 | 3,500 | (2,700 | ) | 800 | ||||||||||||||||
Know-how/processes | 586,971 | (455,223 | ) | 131,748 | 582,011 | (391,593 | ) | 190,418 | ||||||||||||||||
Favorable leases | — | — | — | 1,700 | (932 | ) | 768 | |||||||||||||||||
Total | $ | 2,266,250 | $ | (1,374,159 | ) | $ | 892,091 | $ | 2,236,014 | $ | (1,207,041 | ) | $ | 1,028,973 | ||||||||||
109
PPD, INC. AND SUBSIDIARIES
NOTES TO THE CONSOLIDATED FINANCIAL STATEMENTS
(amounts in tables in thousands, except per share data)
Amortization expense was $161.9 million, $168.6 million and $183.4 million for the years ended December 31, 2019, 2018 and 2017, respectively. Translation adjustments of approximately $5.2 million and $20.0 million were recorded during the years ended December 31, 2019 and 2018, respectively, resulting in an increase and decrease to the carrying amount of the Company’s definite-lived intangible assets, respectively. The Company does not have any indefinite-lived intangible assets other than goodwill.
During 2017, the Company accelerated the useful life of the trade name of one reporting unit with a net carrying amount of $8.2 million prior to acceleration, resulting in accelerated amortization expense of $8.2 million for the year ended December 31, 2017. The Company ceased use of the trade name and fully amortized this asset as of December 31, 2017. The Company did not accelerate the useful life of any intangible assets during the years ended December 31, 2019 or 2018.
As of December 31, 2019, estimated amortization expense for definite-lived intangible assets for each of the next five years and thereafter was as follows:
Year | Amortization Expense | |||
2020 | $ | 157,935 | ||
2021 | 145,842 | |||
2022 | 74,678 | |||
2023 | 67,652 | |||
2024 | 61,390 | |||
Thereafter | 384,594 | |||
Total future amortization expense | $ | 892,091 | ||
10. Long-term Debt and Finance Lease Obligations
Long-term debt and finance lease obligations consisted of the following as set forth on the dates below:
December 31, | |||||||||||||
Maturity Date | Effective Rate | Stated Rate | 2019 | 2018 | |||||||||
Term Loan | August 2022 | 4.51% | 4.30% | $ | 3,096,429 | $ | 3,128,852 | ||||||
OpCo Notes | August 2023 | 6.61% | 6.38% | 1,125,000 | 1,125,000 | ||||||||
Initial HoldCo Notes | May 2022 | 8.92% | 7.63% | 550,000 | 550,000 | ||||||||
Additional HoldCo Notes | May 2022 | 8.90% | 7.75% | 900,000 | — | ||||||||
Other debt | April 2025 | 1.13% | 1.13% | 5,707 | 8,950 | ||||||||
Finance lease obligations | Various | Various | Various | 28,726 | 23,815 | ||||||||
5,705,862 | 4,836,617 | ||||||||||||
Unamortized debt discount | (13,956 | ) | (9,008 | ) | |||||||||
Unamortized debt issuance costs | (47,978 | ) | (31,925 | ) | |||||||||
Current portion of long-term debt and finance lease obligations | (35,794 | ) | (34,907 | ) | |||||||||
Long-term debt and finance lease obligations, less current portion | $ | 5,608,134 | $ | 4,760,777 | |||||||||
Credit Agreement and Amendments
On August 18, 2015, Jaguar II and PPD LLC (the “Borrowers”) entered into a credit agreement (the “Credit Agreement”), as amended, consisting of a $2.575 billion senior secured term loan (the “Term Loan”) issued at 99.5% of face value, or a discount of 0.5%, and a $300.0 million senior secured revolving credit facility (the “Revolving Credit Facility”). The Term Loan matures on August 18, 2022 and the Revolving Credit Facility matures on May 15, 2022. Debt issuance costs of $16.3 million, consisting primarily of arrangement fees and professional fees, were capitalized in connection with the Term Loan. Additionally, deferred debt issuance costs of $2.7 million were capitalized in connection with the Revolving Credit Facility, consisting primarily of arrangement fees and discount.
110
PPD, INC. AND SUBSIDIARIES
NOTES TO THE CONSOLIDATED FINANCIAL STATEMENTS
(amounts in tables in thousands, except per share data)
In May and November of 2016, the Company amended its Credit Agreement to borrow an additional $200.0 million issued at 99.0% of face value, or a discount of 1.0% and $460.0 million issued at 99.75% of face value, or a discount of 0.25%, respectively, on the Term Loan. The incremental Term Loan borrowings had the same terms, including in respect of interest rate and maturity with the Company’s existing Term Loan. Additionally, in May of 2017 and March of 2018, the Company amended the Credit Agreement for a reduction of 50 basis points and 25 basis points, respectively, in the margin under the Term Loan. Further, in April 2019, the Company amended to its Credit Agreement to extend the maturity date of the Revolving Credit Facility from August 18, 2020 to May 15, 2022. There were no other significant changes to the terms and conditions of the Credit Agreement, Term Loan or the Revolving Credit Facility as a result of each amendment. Each of the amendments were treated as a modification for accounting purposes.
Borrowings under the Term Loan bear interest at a variable rate, at the Company’s option, of either (i) a Eurocurrency rate based on the London Inter-bank Offered Rate (“LIBOR”) for a specific interest period plus an applicable margin, subject to a Eurocurrency rate floor of 1.00%, or (ii) an alternate base rate plus an applicable margin, subject to a base rate floor of 2.00%. The margins for the Term Loan are fixed at 2.50% per annum for Eurocurrency rate loans and 1.50% per annum for base rate loans. As of December 31, 2019, the interest rate on the Term Loan was based on the Eurocurrency loan rate. Additionally, the Term Loan amortizes in equal quarterly installments in an amount equal to 1.0% per annum of the original principal amount thereof, with the balance due at maturity. The Company may voluntarily prepay loans or reduce commitments under the Credit Agreement, in whole or in part, subject to minimum amounts, with prior notice but without premium or penalty.
The Borrowers must prepay the Term Loan with the net cash proceeds of asset sales, the incurrence or issuance of indebtedness (other than indebtedness permitted to be incurred under the Credit Agreement unless specifically incurred to refinance a portion of the credit agreement) and 75% of excess cash flow commencing with the year ended December 31, 2019 (subject to reductions to 50%, 25% or 0%), as defined in the Credit Agreement, and in each case, subject to reinvestment rights and other exceptions. As of December 31, 2019, no prepayment amounts were required under the Credit Agreement. Any repayments for future years are determinable annually only after the fiscal years have concluded.
The Borrowers’ obligations under the Credit Agreement are guaranteed by Jaguar I and each of the Company’s current and future direct and indirect subsidiaries other than (i) foreign subsidiaries, (ii) unrestricted subsidiaries, (iii) non-wholly-owned subsidiaries and (iv) certain holding companies of foreign subsidiaries, and are secured by a first lien on substantially all of their assets, including the capital stock of subsidiaries (subject to certain exceptions).
As of December 31, 2019, the Company is obligated to pay the following fees under the Revolving Credit Facility: (i) an unused line fee of 0.375% per annum of the unused amount of the Revolving Credit Facility, (ii) a letter of credit participation fee of 3.25% per annum on the aggregate stated maximum amount of each letter of credit available to be drawn, (iii) a fronting fee of 0.125% per annum to the issuing bank on the maximum daily amount of each letter of credit available to be drawn and (iv) other customary fees and expenses of the letter of credit issuers.
Borrowings under the Revolving Credit Facility bear interest at a variable rate, at the Company’s option, of either (i) a Eurocurrency rate based on LIBOR for a specific interest period plus an applicable margin, subject to a Eurocurrency rate floor of 1.00%, or (ii) an alternate base rate plus an applicable margin, subject to a base rate floor of 2.00%. The margins for the Revolving Credit Facility are fixed at 3.25% per annum for Eurocurrency rate loans and 2.25% per annum for base rate loans, and each are subject to a further reduction to 3.00% per annum for Eurocurrency rate loans and 2.00% per annum for base rate loans if the Borrower’s first lien net leverage ratio is less than 3.50:1.00.
From time to time, the Company is required to have letters of credit issued on its behalf to provide credit support for guarantees, contractual commitments and insurance policies. As of December 31, 2019 and 2018, the Company had letters of credit outstanding with an aggregate value of $1.6 million, which reduced available borrowings under the Revolving Credit Facility by such amount. The Company did not have any borrowings outstanding under the Revolving Credit Facility as of December 31, 2019 and 2018, or at any time during 2019 or 2018. As of December 31, 2019 and 2018, the maturity date, interest rate, committed credit and available credit under the Revolving Credit Facility were as follows:
Maturity Date | Interest Rate | Committed Credit | Available Credit December 31, 2019 | Available Credit December 31, 2018 | |||||||||||
Revolving Credit Facility | May 15, 2022 | LIBOR + 3.25% | $ | 300,000 | $ | 298,370 | $ | 298,370 | |||||||
111
PPD, INC. AND SUBSIDIARIES
NOTES TO THE CONSOLIDATED FINANCIAL STATEMENTS
(amounts in tables in thousands, except per share data)
OpCo Notes
On August 18, 2015, Jaguar II and PPD LLC issued in a private placement $1.125 billion of senior unsecured notes at par bearing interest at 6.375% per annum (the “OpCo Notes”). The OpCo Notes mature on August 1, 2023 and interest is payable semi-annually on February 1 and August 1 of each year. The OpCo Notes do not have registration rights. Debt issuance costs of $16.5 million, consisting primarily of underwriters fees and professional fees, were capitalized in connection with the OpCo Notes.
Jaguar II and PPD LLC can redeem the OpCo Notes, at their option, in whole at any time or in part from time to time, upon notice, at the following redemption prices (expressed as a percentage of principal amount), plus accrued and unpaid interest and additional interest, if any, to the redemption date (subject to the right of holders of record on the relevant record date to receive interest due on the relevant interest payment date), if redeemed during the 12-month period commencing on August 1 of the years set forth below:
Period | Redemption Price | ||
2019 | 103.188 | % | |
2020 | 101.594 | % | |
2021 and thereafter | 100.000 | % | |
Additionally, upon the occurrence of specific change of control events, Jaguar II and PPD LLC are required to offer to repurchase all of the OpCo Notes then outstanding at 101% of their principal amount, plus accrued and unpaid interest. To date, no OpCo Notes have been redeemed.
The OpCo Notes are jointly and severally, irrevocably, fully and unconditionally guaranteed by Wildcat
Acquisition Holdings (UK) Limited, Jaguar (Barbados) Finance SRL and each of Jaguar II’s restricted subsidiaries. The
OpCo Notes are uncollateralized and rank senior in right of payment to existing and future indebtedness that is expressly
subordinated to the OpCo Notes, and are effectively junior to the borrowings under the Credit Agreement.
Initial and Additional HoldCo Notes
In connection with the Recapitalization, on May 11, 2017, Eagle II issued in a private placement $550.0 million aggregate principal amount of unsecured 7.625%/8.375% Senior PIK Toggle Notes (the “Initial HoldCo Notes”) at par. The Initial HoldCo Notes were set to mature on May 15, 2022 and interest was payable semi-annually on May 15 and November 15 of each year. Debt issuance costs of $11.9 million, consisting primarily of underwriters’ fees and professional fees, were capitalized in connection with the HoldCo Notes. In May 2019, the Company amended the Initial HoldCo Notes indenture to permit Eagle II to make special dividends and distributions to its stockholders. This transaction was treated as a debt modification for accounting purposes. Debt modification costs of $11.0 million for consent fees were capitalized in connection with this modification.
On May 14, 2019, Eagle II issued in a private placement $900.0 million of aggregate principal amount of unsecured 7.75%/8.50% Senior PIK Toggle Notes (the “Additional HoldCo Notes”) at 99% of face value, or a discount of 1.0% (the “Offering”). The Additional HoldCo Notes were set to mature on May 15, 2022 and interest was payable semi-annually on May 15 and November 15 of each year. The Company used the net proceeds from the Offering, together with cash on hand, to pay its stockholders a special cash dividend of $1,086.0 million, as well as pay for fees and expenses associated with the Offering. Debt issuance costs of $18.2 million, consisting primarily of underwriters’ and professional fees, were capitalized in connection with the Offering.
On February 18, 2020, the Company redeemed the Initial and Additional HoldCo Notes (collectively, the “HoldCo Notes”) at a redemption price of 101% of the aggregate principal amount with the proceeds received from the Company’s IPO of its common stock. See Note 22, “Subsequent Events,” for additional information.
112
PPD, INC. AND SUBSIDIARIES
NOTES TO THE CONSOLIDATED FINANCIAL STATEMENTS
(amounts in tables in thousands, except per share data)
Debt Covenants and Default Provisions
The Company’s long-term debt arrangements contain various customary affirmative and negative covenants, including, but not limited to, restrictions on the Company and its restricted subsidiaries’ ability to merge and consolidate with other companies; incur additional or guarantee indebtedness; grant or incur liens or security interests on assets; make acquisitions, loans, advances or investments; pay dividends or make other distributions in respect of, or repurchase or redeem capital stock; prepay, redeem or repurchase certain subordinated debt; consolidated, merge, sell or otherwise transfer all or substantially all assets; enter into certain transactions with affiliates; enter into agreements which would restrict certain subsidiaries’ abilities to pay dividends; and amend organizational documents or change the Company’s line of business or fiscal year. Substantially all of the Company’s net assets are restricted. The Company was in compliance with all covenants for all long-term debt arrangements as of December 31, 2019.
In addition, the Credit Agreement subjects the Borrowers to a maximum permitted total net leverage ratio on a quarterly basis, calculated with respect to Consolidated EBITDA (as defined in the Credit Agreement), where the Borrowers have outstanding letters of credit obligations and loans under the Revolving Credit Facility (excluding $25 million of non-cash collateralized letters of credit) exceeding 30% of the total revolving facility commitments. As of December 31, 2019, the Borrowers were not subject to this total net leverage ratio test.
The Credit Agreement provides that upon the occurrence of certain events of default, the Borrowers’ obligations thereunder may be accelerated and the lending commitments terminated. Such events of default include payment defaults to the lenders, material inaccuracies of representations and warranties, covenant defaults, defaults on other material indebtedness, voluntary and involuntary bankruptcy proceedings, material monetary judgments, material ERISA/pension plan events and other customary events of default. Additionally, a change of control (as defined in the Credit Agreement) constitutes an event of default that permits the lenders to accelerate the maturity of borrowings under the Credit Agreement and terminate their commitments to lend. No such events had occurred as of December 31, 2019.
The indenture for the OpCo Notes (and previously outstanding HoldCo Notes indenture) also provides that upon the occurrence of certain events of default, the obligations thereunder may be accelerated. Such events of default include payment defaults, covenant defaults, bankruptcy and other customary events of default. Under the indenture governing the OpCo Notes a default in the payment of any other indebtedness exceeding $75.0 million or an acceleration of any such indebtedness constitutes an event of default under the indenture. No such events had occurred as of December 31, 2019.
Other Debt
The Company has a related party loan denominated in Japanese Yen classified as long-term debt and finance leases on the consolidated balance sheets. The loan matures on April 1, 2025 and interest is payable quarterly at a rate of 1% above the Tokyo Inter-bank Offered Rate. The loan can be prepaid by the Company at any time without penalty. See Note 17, “Related Party Transactions,” for additional information.
Scheduled Maturities of Long-term Debt and Finance Lease Obligations
As of December 31, 2019, the scheduled maturities of long-term debt and settlement of finance lease obligations for each of the next five years and thereafter were as follows:
Year | Amount | |||
2020 | $ | 35,794 | ||
2021 | 36,014 | |||
2022 | 4,485,451 | |||
2023 | 1,128,587 | |||
2024 | 3,477 | |||
Thereafter | 16,539 | |||
Total | $ | 5,705,862 | ||
113
PPD, INC. AND SUBSIDIARIES
NOTES TO THE CONSOLIDATED FINANCIAL STATEMENTS
(amounts in tables in thousands, except per share data)
11. Leases
The Company’s operating and finance leases are primarily related to office, laboratory and other real estate facilities used in the delivery of clinical development services and laboratory services. Lease terms are determined at the commencement of the lease. The Company’s lease term may include options to extend the lease, when it is reasonably certain that the Company will exercise that option. As of December 31, 2019, the Company’s leases have remaining lease terms of less than one year to 17 years. At the inception of a contract, the Company determines whether the arrangement is or contains a lease in accordance with ASC 842. The requirements under ASC 842 include evaluating whether the contract includes an identifiable asset, the lessee has the right to obtain substantially all of the economic benefits from the use of the identified asset and the lessee has the right to direct the use of the identified asset.
Upon commencement of a lease, the Company recognizes a lease liability and a corresponding ROU asset. The lease liability is measured based upon the present value of future lease payments over the term of the lease using the appropriate discount rate at the date of lease commencement. The ROU asset is calculated as the lease liability plus any initial direct costs incurred and lease payments made at or before the commencement date of the lease, reduced by lease incentives, when applicable. Given that the rate implicit in a lease is not readily determinable, the Company generally uses its incremental borrowing rate as the discount rate. The incremental borrowing rate is the rate of interest that the Company would have to pay to borrow on a collateralized basis over a similar term for an amount equal to the lease payments in a similar economic environment. The Company determines its incremental borrowing rate by developing a baseline unsecured rate curve based upon its credit quality, among other factors, and separately makes an adjustment to reflect collateralization and any other specific lease adjustments, such as adjustments for the term of the lease and currency risks.
For leases with a term of one year or less (“short-term leases”), the Company has elected not to recognize lease liabilities and associated ROU assets. Lease payments on short-term leases are recognized as lease expense within direct costs or SG&A expenses on the consolidated statements of operations, depending on the nature of the lease, on a straight-line basis over the lease term. The Company has also elected to account for lease components and non-lease components in a contract as a single lease component for leases entered into or modified post-adoption.
The Company determines if its lease arrangements are operating or finance leases at the lease commencement date. This determination includes evaluating whether (i) the underlying asset transfers ownership at the end of the lease term; (ii) the lease term represents the major part of the remaining economic life of the underlying asset; (iii) the present value of lease payments represents substantially all of the fair value of the underlying asset; (iv) an option to purchase the underlying asset is reasonably certain to be exercised and (v) the underlying asset is of a specialized nature. Finance leases are included within the current portion of and long-term debt and finance lease obligations on the consolidated balance sheets.
The amount of finance lease ROU assets and liabilities and the associated financial statement line item they are included within on the consolidated balance sheets are as follows:
Classification | December 31, 2019 | |||
Property and equipment, net | $ | 23,084 | ||
Current portion of long-term debt and finance lease obligations | $ | 2,861 | ||
Long-term debt and finance lease obligations, less current portion | 24,510 | |||
Total finance lease liabilities | $ | 27,371 | ||
114
PPD, INC. AND SUBSIDIARIES
NOTES TO THE CONSOLIDATED FINANCIAL STATEMENTS
(amounts in tables in thousands, except per share data)
The Company records lease expense for operating leases, some of which have escalating rent over the remaining lease term, ratably over the lease term as lease expense within direct costs or SG&A expenses on the consolidated statements of operations, depending on the use of the underlying asset. The Company records lease expense for finance leases as a combination of the amortization of the ROU asset and the amount recognized as interest on the outstanding lease liability. The amortization of the ROU asset and the interest on the outstanding lease liability are recorded within depreciation and amortization expense and interest expense, net, respectively, on the consolidated statements of operations. Variable lease costs are lease payments that are not included in the measurement of the lease liability. Variable lease costs are either (1) payments that are entirely variable period to period such as common area maintenance, electricity and real estate taxes or (2) incremental changes in an index or rate on which lease payments are based. The Company initially measures leases that are based on an index or rate by using the applicable rate at the commencement of the lease. Any subsequent changes in an index or rate are recognized as variable lease costs. Variable lease costs are recorded in the period they are incurred. The Company had an insignificant amount of sublease income for the year ended December 31, 2019.
The components of total lease expense were as follows:
Lease expenses | Year Ended December 31, 2019 | |||
Finance lease cost: | ||||
Amortization of ROU assets | $ | 2,497 | ||
Interest on lease liabilities | 1,968 | |||
Operating lease expense | 54,179 | |||
Short-term lease expense | 1,301 | |||
Variable lease expense | 15,804 | |||
Total lease expense | $ | 75,749 | ||
Supplemental cash flow information related to operating and finance leases were as follows:
Year Ended December 31, 2019 | ||||
Cash paid for amounts included in the measurement of lease liabilities: | ||||
Operating cash flows for operating leases | $ | 52,502 | ||
Operating cash flows for finance leases | 1,968 | |||
Financing cash flows for finance leases | 1,948 | |||
ROU assets obtained in exchange for lease obligations: | ||||
Operating leases | 42,520 | |||
Finance leases | 3,736 | |||
Other information on operating and finance leases were as follows:
December 31, 2019 | |||
Weighted-average remaining lease term: | |||
Operating leases | 6.3 years | ||
Finance leases | 8.5 years | ||
Weighted-average discount rate: | |||
Operating leases | 5.8 | % | |
Finance leases | 7.2 | % | |
115
PPD, INC. AND SUBSIDIARIES
NOTES TO THE CONSOLIDATED FINANCIAL STATEMENTS
(amounts in tables in thousands, except per share data)
As of December 31, 2019, the undiscounted lease payments for operating and finance lease liabilities were as follows:
Year | Operating Leases | Finance Leases | Total | |||||||||
2020 | $ | 55,907 | $ | 4,730 | $ | 60,637 | ||||||
2021 | 49,195 | 4,865 | 54,060 | |||||||||
2022 | 35,476 | 5,000 | 40,476 | |||||||||
2023 | 25,822 | 4,610 | 30,432 | |||||||||
2024 | 18,239 | 4,335 | 22,574 | |||||||||
2025 and thereafter | 58,479 | 12,069 | 70,548 | |||||||||
Total lease payments | 243,118 | 35,609 | 278,727 | |||||||||
Less: imputed interest | (43,390 | ) | (8,238 | ) | (51,628 | ) | ||||||
Total | $ | 199,728 | $ | 27,371 | $ | 227,099 | ||||||
The future minimum payments for operating leases and capital leases as of December 31, 2018 on an ASC 840 basis were as follows:
Year | Operating Leases | Capital Leases | Total | |||||||||
2019 | $ | 55,120 | $ | 2,484 | $ | 57,604 | ||||||
2020 | 52,228 | 2,458 | 54,686 | |||||||||
2021 | 43,490 | 2,751 | 46,241 | |||||||||
2022 | 29,131 | 3,032 | 32,163 | |||||||||
2023 | 19,829 | 2,773 | 22,602 | |||||||||
2024 and thereafter | 71,895 | 10,317 | 82,212 | |||||||||
Total lease payments | $ | 271,693 | $ | 23,815 | $ | 295,508 | ||||||
12. Income Taxes
The components of income before provision for (benefit from) income taxes were as follows:
Years Ended December 31, | |||||||||||
2019 | 2018 | 2017 | |||||||||
Domestic | $ | 668,036 | $ | 118,393 | $ | (219,274 | ) | ||||
Foreign | (608,761 | ) | 28,237 | 235,743 | |||||||
Income before provision for (benefit from) income taxes | $ | 59,275 | $ | 146,630 | $ | 16,469 | |||||
The components of the provision for (benefit from) income taxes were as follows:
Years Ended December 31, | |||||||||||
2019 | 2018 | 2017 | |||||||||
U.S. federal income taxes: | |||||||||||
Current | $ | 32,051 | $ | 16,775 | $ | 7,252 | |||||
Deferred | (55,206 | ) | (24,426 | ) | (293,164 | ) | |||||
U.S. state income taxes: | |||||||||||
Current | 1,614 | 2,843 | 3,406 | ||||||||
Deferred | (18,658 | ) | (3,038 | ) | (15,074 | ) | |||||
Foreign income taxes: | |||||||||||
Current | 44,657 | 49,411 | 25,192 | ||||||||
Deferred | (1,501 | ) | (1,986 | ) | (11,972 | ) | |||||
Provision for (benefit from) income taxes | $ | 2,957 | $ | 39,579 | $ | (284,360 | ) | ||||
116
PPD, INC. AND SUBSIDIARIES
NOTES TO THE CONSOLIDATED FINANCIAL STATEMENTS
(amounts in tables in thousands, except per share data)
On December 22, 2017, the U.S. government enacted comprehensive tax legislation commonly referred to as the “Tax Cuts and Jobs Act of 2017” (the “Tax Act”). The Tax Act made broad and complex changes to the U.S. tax code including, but not limited to, (i) reducing the corporate statutory income tax rate from 35% to 21%, effective for 2018 and thereafter, (ii) amending the limitations on deductions for interest and (iii) transitioning U.S. international taxation from a worldwide system to a territorial system, inclusive of a one-time mandatory transition tax on accumulated unremitted foreign earnings as of December 31, 2017.
The corporate statutory U.S. federal income tax rate was 21% for the years ended December 31, 2019 and 2018 and 35% for the year ended December 31, 2017. Taxes are computed at the corporate statutory U.S. federal income tax rate are reconciled to the provision for (benefit from) income taxes from operations as follows:
Years Ended December 31, | |||||||||||
2019 | 2018 | 2017 | |||||||||
Effective tax rate | 5.0 | % | 27.0 | % | (1,726.6 | )% | |||||
Income tax expense at federal statutory rate | $ | 12,461 | $ | 30,792 | $ | 5,764 | |||||
State taxes, net of federal tax benefit | (13,437 | ) | (706 | ) | (4,577 | ) | |||||
Nondeductible interest | 7,781 | 9,749 | 7,643 | ||||||||
Residual tax impact on foreign earnings | — | — | (91,820 | ) | |||||||
Research and development credits | (11,206 | ) | (9,609 | ) | (9,321 | ) | |||||
Other nondeductible transaction costs | 1,226 | — | — | ||||||||
Recapitalization costs, net | — | — | (36,403 | ) | |||||||
Goodwill impairment | — | 6,221 | 13,431 | ||||||||
Rate change | — | — | (110,290 | ) | |||||||
Change in valuation allowance | (6,550 | ) | 8,532 | (6,318 | ) | ||||||
Foreign tax rate differential | 39,776 | (40,724 | ) | (50,222 | ) | ||||||
Foreign tax credit | (39,456 | ) | (24,999 | ) | — | ||||||
Global intangible low-taxed income | 65,918 | 46,269 | — | ||||||||
Foreign-derived intangible income | — | (6,225 | ) | — | |||||||
Provision to return adjustment | (2,948 | ) | (9,098 | ) | (1,116 | ) | |||||
Other taxes | 1,542 | 2,358 | 1,645 | ||||||||
Other permanent items | 3,623 | 2,417 | (1,571 | ) | |||||||
Intercompany financing | (67,607 | ) | 13,981 | (3,780 | ) | ||||||
Effect of double taxation, net of dividend received | 2,164 | 4,022 | 4,598 | ||||||||
Unrecognized tax benefits | 9,807 | 6,541 | (1,752 | ) | |||||||
Other, net | (137 | ) | 58 | (271 | ) | ||||||
Provision for (benefit from) income taxes | $ | 2,957 | $ | 39,579 | $ | (284,360 | ) | ||||
The year over year change in 2019 and 2018 for the benefit related to state taxes, net of federal tax benefit, is mainly due to limitations in the taxability of certain permanent adjustments related to the Tax Act. The year over year changes in 2019 and 2018 for the benefit related to the change in valuation allowance is attributable to the realization of carryforward interest in foreign jurisdictions. During 2019, the change in foreign tax rate differential and intercompany financing was due to non-taxable gains resulting from the dissolution of intercompany debt financing structures. The 2018 and 2017 benefit related to the foreign tax rate differential is attributable to an increase in the income from operations before taxes recorded in foreign jurisdictions which have tax rates lower than the U.S. statutory tax rate and also considers the year over year changes in local tax rates.
117
PPD, INC. AND SUBSIDIARIES
NOTES TO THE CONSOLIDATED FINANCIAL STATEMENTS
(amounts in tables in thousands, except per share data)
The Company recorded a net tax benefit of $209.0 million for the impact of the Tax Act, which included a $6.9 million increase to the 2017 provisional estimate which was recorded as a reduction to the Company’s provision for income taxes during 2018. The net tax benefit included a $92.0 million net benefit resulting from the one-time mandatory transition tax on accumulated unremitted foreign earnings, offset by corresponding foreign tax credits and the release of a previously established deferred tax liability for accumulated unremitted foreign earnings. Prior to the Tax Act, the Company accrued a deferred tax liability for U.S. taxes on the portion of unremitted foreign earnings considered not permanently reinvested. Such earnings and the related deferred tax liability were determined at the 35% tax rate prior to the Tax Act. Due to implementation of these provisions, the related deferred tax liability for accumulated unremitted foreign earnings was reduced to zero, resulting in a tax benefit. In addition, the remeasurement of certain deferred tax assets and liabilities, based on the rates at which they are expected to reverse, resulted in a net tax benefit of $117.0 million.
In addition to the impacts of the Tax Act above, during 2017, the Company recognized a $36.4 million net benefit for the cash settlement of the initial PPD Options, partially offset by nondeductible Transaction Costs related to the Recapitalization. See Note 2, “Recapitalization Transaction,” and Note 4, “Stock-based Compensation,” for additional information on the cash settlement of the initial PPD Options and the nondeductible Transaction Costs.
Deferred income taxes were as follows on the dates set forth below:
December 31, | |||||||||||||||
2019 | 2018 | ||||||||||||||
Assets | Liabilities | Assets | Liabilities | ||||||||||||
Property and equipment and intangible assets | $ | — | $ | 232,945 | $ | — | $ | 255,583 | |||||||
Operating lease obligations/ROU assets | 49,932 | 46,404 | — | — | |||||||||||
Accrued expenses | 26,412 | — | 15,611 | — | |||||||||||
Investment basis difference | — | 32,066 | — | 39,854 | |||||||||||
Stock options and restricted stock | 11,173 | — | 8,793 | — | |||||||||||
Future benefit of tax credits | 25,920 | — | 19,755 | — | |||||||||||
Future benefit of carryforward losses | 53,077 | — | 57,042 | — | |||||||||||
Uncertain tax benefits | 1,026 | — | 4,227 | — | |||||||||||
Unearned revenue | 32,230 | — | 49,044 | — | |||||||||||
Other | 21,410 | 25,800 | 34,584 | 34,099 | |||||||||||
Disallowed interest carryforward | 78,697 | — | 74,221 | — | |||||||||||
Valuation allowance | (38,178 | ) | — | (88,980 | ) | — | |||||||||
Total deferred income taxes | $ | 261,699 | $ | 337,215 | $ | 174,297 | $ | 329,536 | |||||||
As of December 31, 2019, the Company has federal, various state and foreign net operating losses in the amounts of $1.7 million, $410.0 million and $175.2 million, respectively, that are subject to various carryforward periods of 5 years to 20 years or an indefinite carryforward period and has also recorded deferred tax assets related to foreign tax credits in the amount of $24.3 million and other miscellaneous credits of $1.6 million, the majority of which expire in 2028. Additionally, the Company has recorded a deferred tax asset of $68.2 million as a result of the business interest expense limitations of the Tax Act and $10.5 million related to certain foreign tax carryforward attributes subject to an indefinite carryforward period. As a result of the HoldCo Notes issuance in 2019, the Company reassessed the deductibility of certain foreign tax carryforward attributes that resulted in a $32.7 million derecognition of a deferred tax asset and the corresponding valuation allowance as the Company does not expect to receive a tax deduction. In addition during 2019, in connection with the dissolution of intercompany debt financing structures and the liquidation of certain legal entities, the Company derecognized $12.7 million of loss carryforwards and the corresponding valuation allowance.
At December 31, 2019 and 2018, the Company recorded a valuation allowance against the carryforward attributes of $36.8 million and $87.6 million, respectively, which represents the portion of these amounts that the Company believes are not likely to be utilized. The Company also recorded a valuation allowance of $1.4 million for the year ended December 31, 2019 and 2018 against deferred tax assets for certain jurisdictions where no benefit is expected to be realized.
118
PPD, INC. AND SUBSIDIARIES
NOTES TO THE CONSOLIDATED FINANCIAL STATEMENTS
(amounts in tables in thousands, except per share data)
The changes in valuation allowance for deferred tax assets for the periods indicated below were as follows:
December 31, | |||||||||||
2019 | 2018 | 2017 | |||||||||
Balance at the beginning of the period | $ | (88,980 | ) | $ | (78,025 | ) | $ | (79,740 | ) | ||
Additions charged to costs and expenses | (2,463 | ) | (11,527 | ) | (5,375 | ) | |||||
Additions or reductions charged to other accounts (1) | 43,418 | — | (197 | ) | |||||||
Reductions charged to costs and expenses | 9,847 | 572 | 7,287 | ||||||||
Balance at end of the period | $ | (38,178 | ) | $ | (88,980 | ) | $ | (78,025 | ) | ||
(1) The balance includes the impact of deferred tax assets, purchase accounting and currency translation adjustments.
The following is a tabular reconciliation of the total unrecognized tax benefits for the periods indicated below:
December 31, | |||||||||||
2019 | 2018 | 2017 | |||||||||
Unrecognized tax benefit at beginning of period | $ | 28,442 | $ | 21,890 | $ | 20,102 | |||||
Gross increases - tax positions in prior period | 5,997 | 6,408 | 4,606 | ||||||||
Gross decreases - tax positions in prior period | (7,967 | ) | (277 | ) | (839 | ) | |||||
Gross increases - tax positions in current period | 13,908 | 7,970 | 1,488 | ||||||||
Foreign exchange rate movements | 49 | (275 | ) | 161 | |||||||
Lapse of statute | (696 | ) | (7,274 | ) | (3,628 | ) | |||||
Unrecognized tax benefit at end of period | $ | 39,733 | $ | 28,442 | $ | 21,890 | |||||
Included in the balance of unrecognized tax benefits as of December 31, 2019, 2018 and 2017 are $28.8 million, $20.4 million and $13.8 million, respectively, net of the federal benefit of state taxes that if recognized, would reduce the Company’s effective tax rate. Additionally, as of December 31, 2019 and 2018, the company has established an unrecognized tax benefit of $13.0 million and $3.8 million, respectively, related to the Tax Act. The Company believes that it is reasonably possible that the total amount of unrecognized tax benefits could decrease by up to $3.6 million within the next 12 months due to the filing of amended returns, settlement of audits and the expiration of the statutes of limitations.
Interest and penalties recognized during the years ended December 31, 2019, 2018 and 2017 were insignificant. As of December 31, 2019 and 2018, the Company had accrued $4.3 million and $3.7 million, respectively, of interest and penalties with respect to unrecognized tax benefits. To the extent interest and penalties are not assessed with respect to unrecognized tax benefits, the Company will reduce amounts reflected as a reduction of the overall income tax provision (benefit).
The Company has analyzed its filing positions in all significant federal, state and foreign jurisdictions where it is required to file income tax returns, as well as open tax years in these jurisdictions. The significant jurisdictions with periods subject to examination are the 2016 through 2018 tax years for the United States and the 2017 and 2018 tax years for the United Kingdom. Various foreign and state income tax returns are under examination by taxing authorities. The Company does not believe that the outcome of any examination will have a material impact on its results of operations, financial condition and/or cash flows.
119
PPD, INC. AND SUBSIDIARIES
NOTES TO THE CONSOLIDATED FINANCIAL STATEMENTS
(amounts in tables in thousands, except per share data)
13. Derivative Instruments and Hedging Activities
Interest Rate Hedging
The Company has variable rate borrowings under its Term Loan, and as a result, is exposed to interest rate fluctuations on these borrowings. From time to time, the Company enters into interest rate swaps to mitigate the risk in fluctuations in interest rates. The interest rate swaps effectively convert variable rate borrowings under the Term Loan to fixed rate borrowings based on the fixed interest rate for the interest rate swaps plus the applicable margin on the Term Loan. The terms of these interest rate swaps are substantially the same as those of the Term Loan, including interest settlements. The Company accounts for these interest rate swaps as cash flow hedges because their purpose is to hedge the Company’s exposure to increases in interest rates on its variable rate borrowings. The Company recognizes in accumulated other comprehensive loss (“AOCL”) or accumulated other comprehensive income (“AOCI”), each net of tax, any changes in the fair value, representing unrealized gains or losses, of the effective portion of its interest rate swaps.
In 2018, the Company terminated all of its outstanding interest rate swaps, resulting in cash proceeds of $29.6 million. These interest rate swaps were set to mature in November 2020. Unrealized gains previously recorded in AOCI through the date of termination will be reclassified into interest expense, net, through the original maturity date of the interest rate swaps. The Company expects to reclassify current unrealized gains of $8.6 million, net of tax, within the next 12 months from AOCI to interest expense, net, on the statements of operations as interest payments are made on the Term Loan.
In February 2020, the Company entered into three new interest rate swaps. See Note 22, “Subsequent Events,” for additional information related to the new interest rate swaps.
Foreign Currency Hedging
The Company has significant international revenues and expenses denominated in currencies other than its reporting currency. As a result, the Company’s operating results can be affected by changes in foreign currency exchange rates. In an effort to mitigate this risk, from time to time, the Company purchases foreign currency forward contracts as hedges against anticipated and recorded transactions denominated in foreign currencies. The Company’s foreign currency forward contracts expired in 2017, and the Company had no foreign currency forward contracts outstanding as of or during the years ended December 31, 2019 and 2018.
The Company does not use derivative financial instruments for speculative or trading purposes and does not offset the fair value amounts of its derivatives. The Company recognized the following amounts of pre-tax gain as a component of OCI or OCL during the years ended December 31, 2019, 2018 and 2017:
Pre-Tax Gain Recognized in OCI or OCL | |||||||||||||
Derivatives in Cash Flow Hedging Relationships | Years Ended December 31, | ||||||||||||
2019 | 2018 | 2017 | |||||||||||
Foreign currency forward contracts | $ | — | $ | — | $ | 4,708 | |||||||
Interest rate swaps | — | 18,960 | 2,269 | ||||||||||
The following table provides the location of the effective portion of the pre-tax gain (loss) reclassified from AOCL or AOCI into revenue, direct costs and interest expense, net, respectively, on the consolidated statements of operations during the years ended December 31, 2019, 2018 and 2017:
Pre-Tax Gain (Loss) Reclassified from AOCL or AOCI into Income | ||||||||||||||
Derivatives in Cash Flow Hedging Relationships | Location of Gain (Loss) Reclassified from AOCL or AOCI into Statements of Operations | Years Ended December 31, | ||||||||||||
2019 | 2018 | 2017 | ||||||||||||
Foreign currency forward contracts | Revenue | $ | — | $ | — | $ | 1,887 | |||||||
Foreign currency forward contracts | Direct costs | — | — | 3,000 | ||||||||||
Interest rate swaps | Interest expense, net | 12,327 | 5,618 | (11,914 | ) | |||||||||
120
PPD, INC. AND SUBSIDIARIES
NOTES TO THE CONSOLIDATED FINANCIAL STATEMENTS
(amounts in tables in thousands, except per share data)
14. Employee Savings and Pension Plan
Savings Plans
The Company provides 401(k) retirement savings plans or other defined contribution savings plans (“Savings Plans”) to its qualified U.S. and non-U.S. employees. Under the Company’s primary U.S. savings plan, the Company matches 50% of the employee’s pre-tax retirement savings contribution up to a maximum of 3% of eligible earnings. Vesting in the Company match is 25% per vesting year of service in the plan, subject to a minimum number of hours worked threshold and other events which may trigger immediate vesting of the Company match. Under the Company’s primary non-U.S. savings plan in the United Kingdom, employees can contribute a maximum of their annual compensation and the Company matches those contributions with 5% to 8% of the employee’s annual compensation. Company matching contributions, net of forfeitures, for the Savings Plans for the years ended December 31, 2019, 2018 and 2017 were $27.6 million, $25.5 million and $22.0 million, respectively.
Pension Plan
The Pension Plan was closed to new participants as of December 31, 2002. In December 2009, the Company closed the Pension Plan to additional contributions effective January 1, 2010. As amended, participants are entitled to receive benefits previously accrued, which are based on the expected amount of compensation at retirement and the number of years of service through January 1, 2010, but participants will receive no additional credit for future years of service. The Company will, however, continue to make contributions in respect of the funding plan. The expected funding contributions to the Pension Plan are discretionary and can change at any time based on updated statutory funding position calculations, resulting changes to the funding recovery plan and other factors determined by the Company.
Pre-tax pension costs and other amounts recognized in net income and OCL or (OCI) for the Pension Plan included the following components:
Years Ended December 31, | |||||||||||
2019 | 2018 | 2017 | |||||||||
Net periodic pension cost (credit): | |||||||||||
Interest cost | $ | 2,397 | $ | 2,370 | $ | 2,596 | |||||
Expected return on plan assets | (2,106 | ) | (3,195 | ) | (4,125 | ) | |||||
Amortization of actuarial loss | 605 | 784 | 1,693 | ||||||||
Net periodic pension cost (credit) | $ | 896 | $ | (41 | ) | $ | 164 | ||||
Other changes in plan assets and benefit obligations recognized in OCL or (OCI): | |||||||||||
Net actuarial loss (gain) arising during period | $ | 2,180 | $ | (1,169 | ) | $ | (11,881 | ) | |||
Amortization of actuarial loss | (605 | ) | (784 | ) | (1,693 | ) | |||||
Foreign currency translation adjustment | — | 110 | 1,269 | ||||||||
Total OCL or (OCI) | $ | 1,575 | $ | (1,843 | ) | $ | (12,305 | ) | |||
Total recognized in net periodic pension cost (credit) and OCL or (OCI) | $ | 2,471 | $ | (1,884 | ) | $ | (12,141 | ) | |||
The weighted-average assumptions used to determine net periodic pension cost for periods below were as follows:
Years Ended December 31, | |||||
2019 | 2018 | 2017 | |||
Discount rate | 3.0% | 2.6% | 2.7% | ||
Rate of compensation increase | 3.7% | 3.7% | 3.7% | ||
Long-term rate of return on plan assets | 2.5% | 3.7% | 5.6% | ||
121
PPD, INC. AND SUBSIDIARIES
NOTES TO THE CONSOLIDATED FINANCIAL STATEMENTS
(amounts in tables in thousands, except per share data)
The change in benefit obligation, change in plan assets, funded status and amounts recognized for the Pension Plan were as follows:
December 31, | |||||||
2019 | 2018 | ||||||
Change in benefit obligation: | |||||||
Projected benefit obligation, beginning of year | $ | 80,435 | $ | 91,356 | |||
Interest cost | 2,397 | 2,370 | |||||
Net actuarial loss (gain) | 11,287 | (6,400 | ) | ||||
Plan amendments | — | 135 | |||||
Benefits paid | (2,465 | ) | (2,168 | ) | |||
Foreign currency translation adjustment | 811 | (4,858 | ) | ||||
Projected benefit obligation, end of year | $ | 92,465 | $ | 80,435 | |||
Change in plan assets: | |||||||
Fair value of plan assets, beginning of year | $ | 84,894 | $ | 88,794 | |||
Actual return on plan assets | 11,254 | (1,716 | ) | ||||
Employer contributions | — | 5,077 | |||||
Benefits paid | (2,465 | ) | (2,168 | ) | |||
Foreign currency translation adjustment | 867 | (5,093 | ) | ||||
Fair value of plan assets, end of year | $ | 94,550 | $ | 84,894 | |||
Funded status recorded as other assets | $ | 2,085 | $ | 4,459 | |||
The projected benefit obligation, accumulated benefit obligation and fair value of plan assets were as follows:
December 31, | |||||||
2019 | 2018 | ||||||
Projected benefit obligation | $ | 92,465 | $ | 80,435 | |||
Accumulated benefit obligation | 89,637 | 76,676 | |||||
Fair value of plan assets | 94,550 | 84,894 | |||||
As of December 31, 2019, expected funding contributions to the Pension Plan were as follows:
Year | Amount | |||
2021 | $ | 3,639 | ||
2022 | 3,769 | |||
Total | $ | 7,408 | ||
The weighted-average assumptions used to determine benefit obligations at the end of the plan year were as follows:
December 31, | |||
2019 | 2018 | ||
Discount rate | 2.1% | 3.0% | |
Rate of compensation increase | 3.6% | 3.7% | |
122
PPD, INC. AND SUBSIDIARIES
NOTES TO THE CONSOLIDATED FINANCIAL STATEMENTS
(amounts in tables in thousands, except per share data)
The Pension Plan’s target allocations and weighted-average asset allocations by asset category were as follows:
Weighted-Average Asset Allocation | |||||||||
Target | December 31, | ||||||||
Asset Category | Allocation | 2019 | 2018 | ||||||
Equity securities | 38.5 | % | 39.0 | % | 38.9 | % | |||
Debt securities | 61.5 | % | 60.8 | % | 61.0 | % | |||
Cash | — | % | 0.2 | % | 0.1 | % | |||
Total | 100.0 | % | 100.0 | % | 100.0 | % | |||
The trustees’ investment objectives for the Pension Plan is to provide for growth of capital with a moderate level of volatility by investing in accordance with the target asset allocations above to meet the benefit obligations of the Pension Plan. The Pension Plan’s long-term strategy is to align the investment approach with the pension obligation as the value of the investments increases, with an objective of being fully funded, while managing the risk of the investment portfolio. The target allocations above were selected by the trustees with the advice of an independent third-party investment manager. The independent third-party investment manager manages the assets and tracks the return on a benchmark portfolio, matching the above strategic asset allocation. The trustees review the performance of the investment manager and Pension Plan assets on a continuous basis to ensure the trustees’ investment strategy is meeting the trustees’ investment objectives. The Pension Plan assets are valued using the net asset value that is reported by the investment manager. During 2018, the target allocations for investments changed from 70% to 40% for equity securities and from 30% to 60% for debt securities, to better align with the future expected liabilities of the Pension Plan. In 2019, the target allocation was further revised in line with this strategy to 38.5% equity securities and 61.5% debt securities. The Company considers the Pension Plan assets to be a Level 2 classification within the fair value hierarchy.
The allocation of Pension Plan assets is as follows on the dates set forth below:
December 31, | ||||||||
2019 | 2018 | |||||||
Equity securities | $ | 36,832 | $ | 32,973 | ||||
Debt securities | 57,531 | 51,819 | ||||||
Cash | 187 | 102 | ||||||
Total | $ | 94,550 | $ | 84,894 | ||||
As of December 31, 2019, expected benefit payments from the Pension Plan for each of the next five years, and the next five years in the aggregate, were as follows:
Year | Amount | |||
2020 | $ | 941 | ||
2021 | 955 | |||
2022 | 971 | |||
2023 | 986 | |||
2024 | 1,002 | |||
Next 5 years | 5,248 | |||
Total | $ | 10,103 | ||
123
PPD, INC. AND SUBSIDIARIES
NOTES TO THE CONSOLIDATED FINANCIAL STATEMENTS
(amounts in tables in thousands, except per share data)
15. Fair Value Measurements
Recurring Fair Value Measurements
The following table presents information about the Company’s assets and liability measured at fair value on a recurring basis:
As of December 31, 2019 | Level 1 | Level 2 | Level 3 | Total | |||||||||||
Assets | |||||||||||||||
Investments | $ | 1,895 | $ | — | $ | 248,453 | $ | 250,348 | |||||||
Total assets | $ | 1,895 | $ | — | $ | 248,453 | $ | 250,348 | |||||||
Liabilities | |||||||||||||||
Contingent consideration | $ | — | $ | — | $ | 9,489 | $ | 9,489 | |||||||
Recapitalization investment portfolio liability | — | — | 191,678 | 191,678 | |||||||||||
Total liabilities | $ | — | $ | — | $ | 201,167 | $ | 201,167 | |||||||
As of December 31, 2018 | Level 1 | Level 2 | Level 3 | Total | |||||||||||
Assets | |||||||||||||||
Investments | $ | 9,591 | $ | — | $ | 256,124 | $ | 265,715 | |||||||
Total assets | $ | 9,591 | $ | — | $ | 256,124 | $ | 265,715 | |||||||
Liability | |||||||||||||||
Recapitalization investment portfolio liability | $ | — | $ | — | $ | 198,524 | $ | 198,524 | |||||||
Total liability | $ | — | $ | — | $ | 198,524 | $ | 198,524 | |||||||
Investments - The Company records all of its investments (other than its equity method investments for which the fair value option has not been elected) at fair value. The Company’s Level 3 investments are in investment partnerships which invest in novel, innovative and potentially commercially viable biomedical products in clinical development as well as in early stage life sciences companies. It is inherently difficult to make accurate fair value estimates based on long-range projections of any pharmaceutical or biomedical product, especially with respect to products that have not completed clinical development and therefore have not received regulatory approval. Due to the lack of observable inputs, assumptions used can significantly impact the resulting fair value and therefore the partnerships’ result of operations. In addition, due to inherent uncertainty of valuation for these investments, estimates of fair value might differ from the value that would have been used had a ready market for these investments existed or from the value which would be realized upon disposition of these investments, and the differences could be material.
The Company has elected the fair value option of accounting for its investments in Auven and venBio. The estimate of fair value for these investments involves an evaluation of the investment and its underlying assets, including the market for the investment, available information on historical and projected financial performance, the potential sale or initial public offering of the underlying assets, the stage of development of the underlying assets, recent private transactions, control over the investment partnership and the lack of marketability of the investments, as well as the Company’s expected holding period, among other things. The Company records the fair value of these investments at the net asset value determined by the investment partnership adjusted for the aforementioned factors including the Company’s lack of control and the lack of marketability of the investments, where applicable. Due to the significant unobservable inputs and use of the Company’s own assumptions, the Company classifies such fair value investments within Level 3 of the fair value hierarchy.
124
PPD, INC. AND SUBSIDIARIES
NOTES TO THE CONSOLIDATED FINANCIAL STATEMENTS
(amounts in tables in thousands, except per share data)
The following table summarizes the Company’s quantitative information about the fair value measurements of Auven and venBio at the dates indicated:
Quantitative Information About Level 3 Fair Value Measurements for December 31, 2019 | ||||||||
Description | Fair Value | Valuation Technique | Unobservable Input | Range of Rates | ||||
Fair value option investments | $243,067 | Market evaluation/pricing models | Discount for lack of marketability | 10.0% - 30.0% | ||||
Recent acquisition transactions | Discount for lack of control | 20.0% - 35.0% | ||||||
Quantitative information about Level 3 Fair Value Measurements for December 31, 2018 | ||||||||
Description | Fair Value | Valuation Technique | Unobservable Input | Range of Rates | ||||
Fair value option investments | $253,995 | Market evaluation/pricing models | Discount for lack of marketability | 12.5% - 27.5% | ||||
Recent acquisition transactions | Discount for lack of control | 25.0% - 30.0% | ||||||
The Company also holds an equity investment in a publicly traded late-stage clinical biopharmaceutical company which it classifies within Level 1 of the fair value hierarchy due to the active market with quoted prices for this investment. See Note 7, “Investments,” for additional information on the Company’s investments.
Changes in fair value of the Company’s investments measured on a recurring basis using significant unobservable inputs (Level 3) were as follows:
2019 | 2018 | ||||||
Balance as of January 1, | $ | 256,124 | $ | 272,431 | |||
Reclassifications from cost method to fair value method | — | 3,610 | |||||
Recognized fair value (loss) gain | (11,288 | ) | 9,691 | ||||
Cash distributions received | (452 | ) | (27,778 | ) | |||
Capital contributions paid | 4,069 | 1,546 | |||||
Transfer out to Level 1 | — | (3,376 | ) | ||||
Balance as of December 31, | $ | 248,453 | $ | 256,124 | |||
Contingent consideration - The Company recorded a contingent consideration liability due to the seller in connection with its Medimix acquisition during the year ended December 31, 2019. The contingent consideration liability was $9.5 million as of December 31, 2019. No amounts were paid during the year ended December 31, 2019. Payment is contingent on specified operating results being achieved in periods subsequent to the acquisition and will only be made if certain earn-out thresholds are achieved. The fair value of contingent consideration was based on unobservable inputs (Level 3) including assumptions relating to future business results. Any adjustments to fair value are recognized in earnings in the period identified. See Note 6, “Business Combinations,” for additional information regarding the Medimix acquisition.
Recapitalization Investment Portfolio Liability - The Company’s Recapitalization Investment Portfolio Liability represents an obligation that is estimated and probable to become distributable by transferring assets (i.e., cash) to the Pre-Closing Holders as part of the 2017 Recapitalization. The liability is recognized based on changes in the fair value of the investments underlying the Investment Portfolio, net of taxes and other expenses and is classified within Level 3 of the fair value hierarchy. See Note 2, “Recapitalization Transaction,” for additional information.
Changes in fair value of the Recapitalization Investment Portfolio Liability measured on a recurring basis using significant unobservable inputs (Level 3) were as follows:
2019 | 2018 | ||||||
Balance as of January 1, | $ | 198,524 | $ | 206,507 | |||
Recapitalization investment portfolio consideration change in value | (6,846 | ) | 7,849 | ||||
Cash distributions paid | — | (15,832 | ) | ||||
Balance as of December 31, | $ | 191,678 | $ | 198,524 | |||
125
PPD, INC. AND SUBSIDIARIES
NOTES TO THE CONSOLIDATED FINANCIAL STATEMENTS
(amounts in tables in thousands, except per share data)
Nonrecurring Fair Value Measurements
See Note 1, “Basis of Presentation and Summary of Significant Accounting Policies,” for additional information on the Company’s assets and liabilities that are not remeasured to fair value on a recurring basis.
Fair Value of Financial Instruments
The Company estimated the fair value of its financial instruments using available market information as of December 31, 2019 and 2018. The estimate of fair value has been determined based on the fair value hierarchy for U.S. GAAP. The following table presents information about the carrying value and estimated fair value of the Company’s financial instruments on the dates set forth below:
December 31, 2019 | December 31, 2018 | ||||||||||||||
Carrying Amount | Estimated Fair Value | Carrying Amount | Estimated Fair Value | ||||||||||||
Assets: | |||||||||||||||
Cash and cash equivalents | $ | 345,187 | $ | 345,187 | $ | 553,066 | $ | 553,066 | |||||||
Liabilities: | |||||||||||||||
Term Loan | 3,096,429 | 3,111,911 | 3,128,552 | 2,933,299 | |||||||||||
OpCo Notes | 1,125,000 | 1,164,566 | 1,125,000 | 1,077,874 | |||||||||||
Initial HoldCo Notes | 550,000 | 559,873 | 550,000 | 531,878 | |||||||||||
Additional HoldCo Notes | 900,000 | 915,120 | — | — | |||||||||||
Other debt | 5,707 | 5,707 | 8,950 | 8,950 | |||||||||||
Cash and Cash Equivalents - The carrying amount approximates fair value due to the short-term maturity of these financial instruments (less than three months). The Company considers the fair value of cash and cash equivalents to be a Level 1 classification within the fair value hierarchy.
Term Loan - The estimated fair value of the Term Loan is based on recently reported market transactions and prices for identical or similar financial instruments obtained from a third-party pricing source. The Company considers the fair value of the Term Loan to be a Level 2 classification within the fair value hierarchy.
OpCo Notes and HoldCo Notes - The estimated fair value of the OpCo Notes and HoldCo Notes is based on recently reported market transactions and prices for identical or similar financial instruments obtained from a third-party pricing source. The Company considers the fair value of the OpCo Notes and HoldCo Notes to be a Level 2 classification within the fair value hierarchy.
Other Debt - The carrying amount of the other debt approximates fair value due to the nature of the obligation. The Company considers the fair value of other debt to be a Level 2 classification within the fair value hierarchy.
126
PPD, INC. AND SUBSIDIARIES
NOTES TO THE CONSOLIDATED FINANCIAL STATEMENTS
(amounts in tables in thousands, except per share data)
16. Accumulated Other Comprehensive Loss
The balances of AOCL or AOCI, each net of tax, were as follows on the dates set forth below:
Annual | Foreign Currency Translation | Derivative Instruments | Pension Plan | Accumulated Other Comprehensive Loss | |||||||||||
Balance as of December 31, 2016 | $ | (383,257 | ) | $ | (2,289 | ) | $ | (12,131 | ) | $ | (397,677 | ) | |||
OCI before reclassifications | 126,333 | 5,122 | 9,765 | 141,220 | |||||||||||
Amounts reclassified from AOCL | 16,825 | 4,097 | 1,158 | 22,080 | |||||||||||
Net OCI | 143,158 | 9,219 | 10,923 | 163,300 | |||||||||||
Balance as of December 31, 2017 | (240,099 | ) | 6,930 | (1,208 | ) | (234,377 | ) | ||||||||
(OCL) or OCI before reclassifications | (91,177 | ) | 14,498 | 861 | (75,818 | ) | |||||||||
Amounts reclassified from AOCI or AOCL | — | (4,261 | ) | 643 | (3,618 | ) | |||||||||
Other | — | 922 | — | 922 | |||||||||||
Net (OCL) or OCI | (91,177 | ) | 11,159 | 1,504 | (78,514 | ) | |||||||||
Balance as of December 31, 2018 | (331,276 | ) | 18,089 | 296 | (312,891 | ) | |||||||||
OCI or (OCL) before reclassifications | 24,824 | — | (1,803 | ) | 23,021 | ||||||||||
Amounts reclassified from AOCL or AOCI | — | (9,523 | ) | 489 | (9,034 | ) | |||||||||
Net OCI or (OCL) | 24,824 | (9,523 | ) | (1,314 | ) | 13,987 | |||||||||
Balance as of December 31, 2019 | $ | (306,452 | ) | $ | 8,566 | $ | (1,018 | ) | $ | (298,904 | ) | ||||
The following table presents the significant reclassifications to the statements of operations out of AOCI or AOCL and the line item affected on the consolidated statements of operations for the respective periods:
Years Ended December 31, | ||||||||||||||
Details about AOCI or AOCL Components | 2019 | 2018 | 2017 | Affected line item in statements of operations | ||||||||||
Gains (losses) on derivative instruments: | ||||||||||||||
Foreign currency forward contracts | $ | — | $ | — | $ | 1,887 | Revenue | |||||||
Foreign currency forward contracts | — | — | 3,000 | Direct costs | ||||||||||
Interest rate swaps | 12,327 | 5,618 | (11,914 | ) | Interest expense, net | |||||||||
Total before income tax (expense) benefit | 12,327 | 5,618 | (7,027 | ) | ||||||||||
Income tax (expense) benefit | (2,804 | ) | (1,357 | ) | 2,930 | Provision for (benefit from) income taxes | ||||||||
Total net of income tax | $ | 9,523 | $ | 4,261 | $ | (4,097 | ) | |||||||
Foreign currency translation: | ||||||||||||||
Income tax expense | $ | — | $ | — | $ | (16,825 | ) | Provision for (benefit from) income taxes | ||||||
Defined benefit pension plan: | ||||||||||||||
Amortization of actuarial loss | $ | (605 | ) | $ | (784 | ) | $ | (1,693 | ) | Net periodic pension costs (1) | ||||
Income tax benefit | 116 | 141 | 535 | Provision for (benefit from) income taxes | ||||||||||
Total net of income tax | $ | (489 | ) | $ | (643 | ) | $ | (1,158 | ) | |||||
(1) Net periodic pension costs are included as a component of other (expense) income, net, on the consolidated statements of operations for the year ended December 31, 2019 and 2018 and as a component of direct costs and SG&A expenses on the consolidated statements of operations for the year ended December 31, 2017.
127
PPD, INC. AND SUBSIDIARIES
NOTES TO THE CONSOLIDATED FINANCIAL STATEMENTS
(amounts in tables in thousands, except per share data)
17. Related Party Transactions
Majority Sponsor Transactions
The Company entered into a consulting agreement with affiliates of the Majority Sponsors under which the Company pays the Majority Sponsors a fee for consulting services provided to the Company as well as reimbursements for out-of-pocket expenses incurred in conjunction with such services. The Company incurred consulting and out-of-pocket expenses for services rendered under the consulting agreement of $3.8 million, $3.6 million and $3.3 million for the years ended December 31, 2019, 2018 and 2017, respectively. These expenses are recorded as a component of SG&A expenses on the consolidated statements of operations. The consulting services agreements terminated pursuant to their terms upon completion of the Company’s IPO on February 10, 2020. See Note 22, “Subsequent Events,” for additional information.
Affiliates of one of the Majority Sponsors had investments in the Term Loan totaling $78.0 million and $80.5 million, respectively, as of December 31, 2019 and 2018. The Company paid $3.9 million and $3.7 million of interest, respectively, and $0.8 million of principal to the relevant affiliates for the Term Loan for the years ended December 31, 2019 and 2018.
During the year ended December 31, 2017, the Company paid Transaction Costs, consisting mainly of professional fees, for the benefit of and on behalf of affiliates of the Sponsors, of $7.3 million to effect the Recapitalization. See Note 2, “Recapitalization Transaction,” for additional information.
SNBL Transactions
Both the Company and SNBL have service agreements to provide administrative and support services to PPD-SNBL, both of which will remain in effect as long as the PPD-SNBL shareholders agreement remains in effect. The Company and SNBL also have a collaboration agreement under which the parties may collaborate on various drug development services. This collaboration agreement will remain in effect as long as SNBL owns at least 20% of PPD-SNBL.
For the years ended December 31, 2019, 2018 and 2017, the Company incurred expenses for services rendered under the services agreement of $1.5 million, $1.3 million and $2.5 million, respectively. The expenses are recorded as a component of SG&A expenses on the consolidated statements of operations. As of December 31, 2019 and 2018, the Company owed SNBL $0.3 million for services rendered under the services agreement. Additionally, as of December 31, 2019 and 2018, PPD-SNBL owed SNBL $5.7 million and $9.0 million, respectively, related to a working capital loan. During the year ended December 31, 2019, the Company repaid $3.4 million of principal on this working capital loan. This loan is classified as long-term debt on the consolidated balance sheets and is included in Note 10, “Long-term Debt and Finance Lease Obligations,” as “other debt.”
128
PPD, INC. AND SUBSIDIARIES
NOTES TO THE CONSOLIDATED FINANCIAL STATEMENTS
(amounts in tables in thousands, except per share data)
18. Earnings Per Share
The following table provides a reconciliation of the numerator and denominator of the basic and diluted EPS computations for the periods set forth below:
Years Ended December 31, | |||||||||||
Numerator: | 2019 | 2018 | 2017 | ||||||||
Net income | $ | 52,755 | $ | 106,865 | $ | 300,829 | |||||
Net income attributable to noncontrolling interest | (4,934 | ) | (2,679 | ) | (4,802 | ) | |||||
Net income attributable to PPD, Inc. | 47,821 | 104,186 | 296,027 | ||||||||
Recapitalization investment portfolio consideration | 6,846 | (7,849 | ) | (97,136 | ) | ||||||
Net income attributable to common stockholders of PPD, Inc. | $ | 54,667 | $ | 96,337 | $ | 198,891 | |||||
Denominator: | |||||||||||
Basic weighted-average common shares outstanding | 279,285 | 279,238 | 291,027 | ||||||||
Effect of dilutive stock options and restricted stock | 1,408 | 79 | 2,799 | ||||||||
Diluted weighted-average common shares outstanding | 280,693 | 279,317 | 293,826 | ||||||||
Earnings per share: | |||||||||||
Basic | $ | 0.20 | $ | 0.34 | $ | 0.68 | |||||
Diluted | $ | 0.19 | $ | 0.34 | $ | 0.68 | |||||
See Note 2, “Recapitalization Transaction,” for additional information related to the Recapitalization and Note 5, “Stockholders’ Deficit and Redeemable Noncontrolling Interest,” for additional information related to shares.
Potential common shares outstanding that are considered anti-dilutive are excluded from the computation of diluted EPS. Potential common shares related to stock options and other awards under share-based compensation programs may be determined to be anti-dilutive based on the application of the treasury stock method and are also anti-dilutive in periods when the Company incurs a net loss.
The number of potential common shares outstanding that were considered anti-dilutive using the treasury stock method and therefore excluded from the computation of diluted EPS, weighted for the portion of the period they were outstanding, are as follows:
Years Ended December 31, | ||||||||
2019 | 2018 | 2017 | ||||||
Anti-dilutive stock options and restricted stock | 434 | 106 | 5,333 | |||||
19. Segments
The Company is managed through two reportable segments, Clinical Development Services and Laboratory Services. The Company determines reportable segments using the management approach. The management approach is based on how the CODM organizes the segments for purposes of assessing performance and making operating decisions. The Clinical Development Services segment provides a wide range of services to its customers including early development/Phase I, patient recruitment and enrollment, investigator site management, Phase II-IV clinical trial management, medical communications and various peri- and post-approval services. The Laboratory Services segment provides comprehensive services to its customers including bioanalytical, vaccine sciences, GMP, central lab and biomarker testing. Both segments provide services to pharmaceutical, biotechnology, medical device, government organizations and other industry participants.
The Company’s CODM assesses segment performance and makes resource allocation decisions based on segment revenues and segment operating income. During the fourth quarter of 2019, the CODM updated the manner in which financial information is reviewed for purposes of assessing performance and making operating decisions to include SG&A expenses attributable to each reportable segment as part of segment operating income. As a result, the Company has updated its segment presentation and all prior period information has been recast to reflect the change in segment presentation.
129
PPD, INC. AND SUBSIDIARIES
NOTES TO THE CONSOLIDATED FINANCIAL STATEMENTS
(amounts in tables in thousands, except per share data)
Segment operating income is segment revenue on a direct revenue basis, excluding third-party pass-through and out-of-pocket revenue, less segment direct costs and segment SG&A expenses. Segment operating income excludes certain unallocated direct costs and SG&A expenses, reimbursed costs, depreciation and amortization, goodwill and long-lived asset impairments and other nonrecurring expenses consistent with the information reviewed by the CODM. The CODM reviews the Company’s assets on a consolidated basis and does not assess performance or make operating decisions based on segment assets.
Information on reportable segment revenue and segment operating income, including a reconciliation of segment operating income to consolidated income from operations, for the respective periods were as follows:
Years Ended December 31, | |||||||||||
2019 | 2018 | 2017 | |||||||||
Segment revenue: | |||||||||||
Clinical Development Services | $ | 2,545,046 | $ | 2,336,005 | $ | 2,319,103 | |||||
Laboratory Services | 598,691 | 501,805 | 448,373 | ||||||||
Total segment revenue | 3,143,737 | 2,837,810 | 2,767,476 | ||||||||
Segment direct costs: | |||||||||||
Clinical Development Services | 1,164,906 | 1,058,245 | 1,053,557 | ||||||||
Laboratory Services | 307,346 | 258,473 | 235,137 | ||||||||
Total segment direct costs | 1,472,252 | 1,316,718 | 1,288,694 | ||||||||
Segment SG&A expenses: | |||||||||||
Clinical Development Services | 530,311 | 476,408 | 464,794 | ||||||||
Laboratory Services | 83,130 | 70,673 | 60,097 | ||||||||
Total segment SG&A expenses | 613,441 | 547,081 | 524,891 | ||||||||
Segment operating income: | |||||||||||
Clinical Development Services | 849,829 | 801,352 | 800,752 | ||||||||
Laboratory Services | 208,215 | 172,659 | 153,139 | ||||||||
Total segment operating income | $ | 1,058,044 | $ | 974,011 | $ | 953,891 | |||||
Total segment revenue | $ | 3,143,737 | $ | 2,837,810 | $ | 2,767,476 | |||||
Other revenue not allocated to segments(1) | 887,280 | 911,161 | 233,574 | ||||||||
Total revenue | 4,031,017 | 3,748,971 | 3,001,050 | ||||||||
Total segment direct costs | 1,472,252 | 1,316,718 | 1,288,694 | ||||||||
Total segment SG&A expenses | 613,441 | 547,081 | 524,891 | ||||||||
Operating costs and expenses not allocated to segments: | |||||||||||
Direct costs | 12,006 | 17,094 | 14,289 | ||||||||
Reimbursed costs | 924,634 | 940,913 | 233,574 | ||||||||
SG&A expenses | 325,365 | 265,954 | 284,442 | ||||||||
Recapitalization costs | — | — | 114,766 | ||||||||
Depreciation and amortization | 264,830 | 258,974 | 279,066 | ||||||||
Goodwill and long-lived asset impairments | 1,284 | 29,626 | 43,459 | ||||||||
Total operating costs and expenses | 3,613,812 | 3,376,360 | 2,783,181 | ||||||||
Income from operations | $ | 417,205 | $ | 372,611 | $ | 217,869 | |||||
(1) Other revenue not allocated to segments for the years ended December 31, 2019 and 2018 includes revenue from third-party pass-through and out-pocket-revenue as well as the impact of ASC 606 on direct revenue. Other revenue not allocated to segments for the year ended December 31, 2017 consists of reimbursed revenue.
130
PPD, INC. AND SUBSIDIARIES
NOTES TO THE CONSOLIDATED FINANCIAL STATEMENTS
(amounts in tables in thousands, except per share data)
20. Entity-wide Information by Geographic Location
The tables below present certain entity-wide information about the Company’s operations by geographic location. The Company allocates revenues to geographic locations based on where the services are performed. Total revenues by geographic location are as follows:
Years Ended December 31, | |||||||||||
2019 | 2018 | 2017 | |||||||||
Revenue: | |||||||||||
North America(1) | $ | 2,155,609 | $ | 1,981,814 | $ | 1,413,079 | |||||
Latin America | 147,375 | 129,644 | 117,665 | ||||||||
Europe, Middle East and Africa(2) | 1,310,573 | 1,280,861 | 979,921 | ||||||||
Asia-Pacific | 417,460 | 356,652 | 256,811 | ||||||||
Revenue | 4,031,017 | 3,748,971 | 2,767,476 | ||||||||
Reimbursed revenue | — | — | 233,574 | ||||||||
Total revenue | $ | 4,031,017 | $ | 3,748,971 | $ | 3,001,050 | |||||
(1) Revenue for the North America region includes revenue attributable to the United States of $2,132,275, $1,960,637 and $1,392,873, respectively, for the years ended December 31, 2019, 2018 and 2017.
(2) Revenue for the Europe, Middle East and Africa region includes service revenue attributable to the United Kingdom of $659,350, $655,314 and $518,174, respectively, for the years ended December 31, 2019, 2018 and 2017.
Total property and equipment, net by geographic location is as follows:
December 31, | |||||||
2019 | 2018 | ||||||
Property and equipment, net: | |||||||
North America(1) | $ | 372,163 | $ | 328,690 | |||
Latin America | 4,294 | 2,732 | |||||
Europe, Middle East and Africa | 51,780 | 53,434 | |||||
Asia-Pacific | 30,608 | 14,247 | |||||
Total property and equipment, net | $ | 458,845 | $ | 399,103 | |||
(1) Property and equipment, net for the North America region includes property and equipment, net attributable to the United States of $372,033 and $328,664, respectively, as of December 31, 2019 and 2018.
131
PPD, INC. AND SUBSIDIARIES
NOTES TO THE CONSOLIDATED FINANCIAL STATEMENTS
(amounts in tables in thousands, except per share data)
21. Quarterly Results of Operations (unaudited)
The following table summarizes the Company’s unaudited quarterly results of operations:
2019 | ||||||||||||||||
Fourth Quarter | Third Quarter | Second Quarter | First Quarter | |||||||||||||
Revenue | $ | 1,046,884 | $ | 1,023,864 | $ | 996,531 | $ | 963,738 | ||||||||
Income from operations | 113,276 | 118,699 | 97,511 | 87,719 | ||||||||||||
Net income attributable to noncontrolling interest | (1,544 | ) | (1,161 | ) | (1,368 | ) | (861 | ) | ||||||||
Recapitalization investment portfolio consideration | (9,984 | ) | 11,231 | (5,029 | ) | 10,628 | ||||||||||
Net income (loss) attributable to common stockholders of PPD, Inc. | $ | 6,766 | $ | 26,652 | $ | 25,716 | $ | (4,467 | ) | |||||||
Basic earnings (loss) per share(1) | $ | 0.02 | $ | 0.10 | $ | 0.09 | $ | (0.02 | ) | |||||||
Diluted earnings (loss) per share(1) | $ | 0.02 | $ | 0.09 | $ | 0.09 | $ | (0.02 | ) | |||||||
2018 | ||||||||||||||||
Fourth Quarter | Third Quarter | Second Quarter | First Quarter | |||||||||||||
Revenue | $ | 978,637 | $ | 907,404 | $ | 910,535 | $ | 952,395 | ||||||||
Income from operations | 101,646 | 77,888 | 99,791 | 93,286 | ||||||||||||
Net (income) loss attributable to noncontrolling interest | (1,366 | ) | (839 | ) | 56 | (530 | ) | |||||||||
Recapitalization investment portfolio consideration | 23,198 | (27,258 | ) | (1,329 | ) | (2,460 | ) | |||||||||
Net income (loss) attributable to common stockholders of PPD, Inc. | $ | 36,591 | $ | 4,100 | $ | 57,699 | $ | (2,053 | ) | |||||||
Basic earnings (loss) per share(1) | $ | 0.13 | $ | 0.01 | $ | 0.21 | $ | (0.01 | ) | |||||||
Diluted earnings (loss) per share(1) | $ | 0.13 | $ | 0.01 | $ | 0.21 | $ | (0.01 | ) | |||||||
(1) The sum of the quarterly per share amounts may not equal per share amounts reported for year-to-date periods. This is due to changes in the number of weighted-average shares outstanding and the effects of rounding for each period.
22. Subsequent Events
Stock Split
On January 15, 2020, the Company filed its amended and restated certificate of incorporation which, among other things, effected a 1.8-for-1 stock split of its common stock and increased the authorized number of shares of its common stock to 2.08 billion. All references to share and per share amounts in the Company’s consolidated financial statements herein have been retrospectively revised to reflect the stock split and increase in authorized shares for all periods presented.
Initial Public Offering
On February 6, 2020, the Company’s common stock began trading on Nasdaq under the symbol “PPD.” On February 10, 2020, the Company completed its IPO of its common stock at a price to the public of $27.00 per share. The Company issued and sold 69.0 million shares of common stock in the IPO, including 9.0 million common shares issued pursuant to the full exercise of the underwriters option to purchase additional shares. The IPO raised proceeds of approximately $1,765.7 million for the Company, after deducting underwriting discounts and commissions and estimated offering expenses.
The Company used the net proceeds from the IPO (1) to redeem $550.0 million in aggregate principal amount of Initial HoldCo Notes, plus accrued and unpaid interest thereon and $5.5 million of redemption premium and (2) to redeem $900.0 million in aggregate principal amount of Additional HoldCo Notes, plus accrued and unpaid interest thereon and $9.0 million of redemption premium. Any excess net proceeds from the IPO will be used for general corporate purposes, which may include, among other things, further repayment of indebtedness as further discussed below.
132
PPD, INC. AND SUBSIDIARIES
NOTES TO THE CONSOLIDATED FINANCIAL STATEMENTS
(amounts in tables in thousands, except per share data)
In addition, the consulting services agreements with the Majority Sponsors terminated pursuant to their terms upon completion of the IPO on February 10, 2020. See Note 17, “Related Party Transactions,” for additional information regarding these agreements.
In connection with the IPO, the Company’s board of directors adopted, and the Company’s stockholders approved, the PPD, Inc. 2020 Omnibus Incentive Plan (“2020 Incentive Plan”), which allows us to implement a new market-based long-term incentive program to align the Company’s executive compensation package with similarly situated public companies. Any awards previously granted under the Eagle I Plan remain subject to the terms of the Eagle I Plan and the applicable award agreements. There are 39,053,663 shares of common stock available for future issuance under the 2020 Incentive Plan. No additional awards will be granted under the Eagle I Plan. Additionally, in connection with the IPO, the Company’s Amended and Restated Certificate of Incorporation, among other things, provides that the Company’s authorized capital stock consists of 2.0 billion shares of common stock, par value $0.01 per share and 100.0 million shares of preferred stock, par value $0.01 per share. Further, all non-voting shares of common stock were converted to voting shares of common stock.
Interest Rate Hedging
In February 2020, the Company entered into three interest rate swaps to hedge the exposure to the variability in interest payments on its Term Loan, in order to convert the majority of the Term Loan’s variable rate to a fixed rate. The swaps have a notional value of $3.5 billion, with an effective date of March 31, 2020 and a termination date of March 31, 2025. The swaps will follow the same accounting as described in Note 13, “Derivative Instruments and Hedging Activities.” See Note 1, “Basis of Presentation and Summary of Significant Accounting Policies,” for additional information on the Company’s accounting policy for derivative instruments and hedging activities.
133
SCHEDULE I
Condensed Financial Information of the Registrant
PPD, Inc. (Parent Company Only) | ||||||||||||
STATEMENTS OF INCOME AND COMPREHENSIVE INCOME | ||||||||||||
(in thousands) | ||||||||||||
For the period from | ||||||||||||
Year Ended | Year Ended | May 11, 2017 to | ||||||||||
December 31, 2019 | December 31, 2018 | December 31, 2017 | ||||||||||
Equity in income of subsidiaries | $ | 53,159 | $ | 105,308 | $ | 244,936 | ||||||
General and administrative expenses | 6,452 | 1,345 | 221 | |||||||||
Income before income tax benefit | 46,707 | 103,963 | 244,715 | |||||||||
Income tax benefit | (1,114 | ) | (223 | ) | (69 | ) | ||||||
Net income | 47,821 | 104,186 | 244,784 | |||||||||
Equity in other comprehensive income (loss) of subsidiaries | 13,777 | (78,994 | ) | 79,300 | ||||||||
Total comprehensive income | $ | 61,598 | $ | 25,192 | $ | 324,084 | ||||||
The accompanying notes are an integral part of these condensed financial statements.
134
PPD, Inc. (Parent Company Only) | ||||||||
BALANCE SHEETS | ||||||||
(in thousands) | ||||||||
ASSETS | ||||||||
December 31, 2019 | December 31, 2018 | |||||||
Cash and cash equivalents | $ | 2,458 | $ | 2,757 | ||||
Deferred costs | 3,699 | — | ||||||
Total assets | $ | 6,157 | $ | 2,757 | ||||
LIABILITIES AND STOCKHOLDERS' DEFICIT | ||||||||
December 31, 2019 | December 31, 2018 | |||||||
Other liabilities | $ | 205,819 | $ | 217,513 | ||||
Recapitalization investment portfolio liability | 191,678 | 198,524 | ||||||
Investments in subsidiaries | 2,306,808 | 1,109,141 | ||||||
Total liabilities | 2,704,305 | 1,525,178 | ||||||
Common stock $0.01 par value, 2,080,000 shares authorized; 280,127 | ||||||||
shares issued and 279,426 shares outstanding as of December 31, 2019 | ||||||||
and 2,080,000 shares authorized; 279,545 shares issued | ||||||||
and 279,030 shares outstanding as of December 31, 2018 | 2,801 | 2,795 | ||||||
Other stockholders' deficit | (2,700,949 | ) | (1,525,216 | ) | ||||
Total stockholders' deficit | (2,698,148 | ) | (1,522,421 | ) | ||||
Total liabilities and stockholders' deficit | $ | 6,157 | $ | 2,757 | ||||
The accompanying notes are an integral part of these condensed financial statements.
135
PPD, Inc. (Parent Company Only) | ||||||||||||
STATEMENTS OF CASH FLOWS | ||||||||||||
(in thousands) | ||||||||||||
For the period from | ||||||||||||
Year Ended | Year Ended | May 11, 2017 to | ||||||||||
December 31, 2019 | December 31, 2018 | December 31, 2017 | ||||||||||
Net cash used in operating activities | $ | (15,492 | ) | $ | (2,105 | ) | $ | (94 | ) | |||
Cash flows from investing activities: | ||||||||||||
Return of capital from subsidiaries | 1,260,681 | 123,000 | 539,876 | |||||||||
Net cash provided by investing activities | 1,260,681 | 123,000 | 539,876 | |||||||||
Cash flows from financing activities: | ||||||||||||
Purchase of treasury stock | (4,012 | ) | (8,630 | ) | — | |||||||
Proceeds from exercise of stock options | 4,524 | 923 | — | |||||||||
Proceeds from recapitalization share issuance | — | — | 2,770,001 | |||||||||
Payout for recapitalization share redemptions | — | — | (3,309,876 | ) | ||||||||
Recapitalization tax benefit distribution | — | (99,745 | ) | — | ||||||||
Recapitalization investment portfolio distribution | — | (14,741 | ) | (3,798 | ) | |||||||
Proceeds from employee stock purchases | — | 480 | 7,466 | |||||||||
Return of capital and special dividend to stockholders | (1,246,000 | ) | — | — | ||||||||
Net cash used in financing activities | (1,245,488 | ) | (121,713 | ) | (536,207 | ) | ||||||
Net change in cash and cash equivalents | (299 | ) | (818 | ) | 3,575 | |||||||
Cash and cash equivalents at beginning of period | 2,757 | 3,575 | — | |||||||||
Cash and cash equivalents at end of period | $ | 2,458 | $ | 2,757 | $ | 3,575 | ||||||
The accompanying notes are an integral part of these condensed financial statements.
136
Notes to Registrant’s Condensed Financial Statements (Parent Company Only)
Basis of Presentation
These condensed PPD, Inc. (“PPD” or “Parent Company”) only financial statements have been prepared in accordance with Rule 12-04 of Regulation S-X, as the restricted net assets of the subsidiaries of the Parent Company exceed 25% of the consolidated net assets of the Parent Company as stipulated by Rule 5-04, Section I from Regulation S-X. The ability of the Parent Company’s operating subsidiaries to pay dividends is restricted due to the terms of the subsidiaries’ Credit Agreement and indentures as defined in Note 10, “Long-term Debt and Finance Lease Obligations,” to the audited consolidated financial statements included elsewhere in this Annual Report on Form 10-K.
PPD became the Parent Company as a result of a Recapitalization in 2017. As a result, these Parent Company only condensed financial statements reflect the periods following this Recapitalization event. See Note 1, “Basis of Presentation and Summary of Significant Accounting Policies” and Note 2, “Recapitalization Transaction,” in the audited consolidated financial statements included elsewhere in this Annual Report on Form 10-K for additional information on the Recapitalization.
These condensed Parent Company only financial statements have been prepared using the same accounting principles and policies described in the notes to the audited consolidated financial statements, with the only exception being that the Parent Company accounts for investments in its subsidiaries using the equity method. Other liabilities in the condensed balance sheets include related party transactions with subsidiaries. Cash payments made by subsidiaries on behalf of the Parent Company during the year ended December 31, 2019 include $2.6 million in professional fees related to the Parent Company’s initial public offering (“IPO”) and $19.7 million in cash settlements to stockholders related to the stock option modification. Cash payments made by subsidiaries on behalf of the Parent Company during the year ended December 31, 2018 include $1.3 million related to the recapitalization investment portfolio liability and $8.6 million related to the recapitalization tax benefit liability. These condensed financial statements should be read in conjunction with the audited consolidated financial statements and related notes thereto included elsewhere in this Annual Report on Form 10-K.
Dividends paid
The following summarizes the dividends paid to the Parent Company by subsidiaries in 2019 and 2018 (in thousands).
Dividends Paid | ||||
Paid in May 2019 | $ | 1,086,281 | ||
Paid in November 2019 | 174,400 | |||
Total paid in 2019 | $ | 1,260,681 | ||
Paid in June 2018 | $ | 107,000 | ||
Paid in November 2018 | 16,000 | |||
Total paid in 2018 | $ | 123,000 | ||
Subsequent Event
Initial Public Offering
On February 6, 2020, the Parent Company’s common stock began trading on Nasdaq under the symbol “PPD”. On February 10, 2020, the Parent Company completed its IPO of its common stock at a price to the public of $27.00 per share. The Parent Company issued and sold 69.0 million shares of common stock in the IPO, including 9.0 million common shares issued pursuant to the full exercise of the underwriters option to purchase additional shares. The IPO raised proceeds of approximately $1,765.7 million for the Parent Company, after deducting underwriting discounts and commissions and estimated offering expenses. The Parent Company used the proceeds to redeem the previously outstanding HoldCo Notes held by a subsidiary of the Parent Company. See Note 22, “Subsequent Events,” in the audited consolidated financial statements included elsewhere in this Annual Report on Form 10-K for additional information.
137
Item 9. Changes in and Disagreements with Accountants on Accounting and Financial Disclosure
None.
Item 9A. Controls and Procedures
Evaluation of Disclosure Controls and Procedures
As required by Rule 13a-15 under the Exchange Act, as amended, we carried out an evaluation under the supervision and with the participation of our management, including the Chief Executive Officer (“CEO”) and Chief Financial Officer (“CFO”), of the effectiveness of the design and operation of our disclosure controls and procedures. Regulations under the Exchange Act require public companies, including us, to maintain “disclosure controls and procedures,” as defined in Rule 13a-15(e) and 15d-15(e) under the Exchange Act to mean a company’s controls and other procedures that are designed to ensure that information required to be disclosed in reports that it files or submits under the Exchange Act is recorded, processed, summarized, and reported within the time periods specified in the SEC’s rules and forms and that such information is accumulated and communicated to management, including our CEO and CFO, or persons performing similar functions, as appropriate to allow timely decisions regarding required or necessary disclosures.
There are inherent limitations to the effectiveness of any system of disclosure controls and procedures, including the possibility of human error and the circumvention or overriding of the controls and procedures. Accordingly, even effective disclosure controls and procedures can only provide reasonable assurance of achieving their control objectives. Based upon our evaluation, our CEO and CFO concluded that our disclosure controls and procedures were effective at the reasonable assurance level.
Changes in Internal Control Over Financial Reporting
There has been no change in our internal control over financial reporting (as defined in Rules 13a-15(f) and 15d-15(f) under the Exchange Act) during the quarter ended December 31, 2019 that has materially affected, or is reasonably likely to materially affect, our internal control over financial reporting.
Management’s Annual Report on Internal Control Over Financial Reporting
This Annual Report on Form 10-K does not include a report of management’s assessment regarding internal control over financial reporting or an attestation report of our registered public accounting firm due to a transition period established by rules of the SEC for newly public companies.
Item 9B. Other Information
2019 Annual Cash Incentive Awards
As of the filing of the IPO Registration Statement and the IPO prospectus, the 2019 annual cash incentive awards for the Company’s Named Executive Officers had not been determined and, therefore, were omitted from the Summary Compensation Tables included in the IPO Registration Statement and the IPO prospectus. The 2019 annual cash incentive awards earned by each of our Named Executive Officers and the new total compensation amounts for the Named Executive Officers are reported in the Summary Compensation Table in Item 11 of this Annual Report on Form 10-K.
Redemption of HoldCo Notes
On February 18, 2020, Eagle II redeemed all of its outstanding Initial HoldCo Notes and Additional HoldCo Notes in accordance with the provisions of the HoldCo Notes and the indentures governing the HoldCo Notes. As such, the obligations of Eagle II under the HoldCo Notes and such indentures were discharged on that date. See Item 7, “Management’s Discussion and Analysis of Financial Condition and Results of Operations—Liquidity and Capital Resources— Indebtedness—Additional and Initial HoldCo Notes,” and Note 22, “Subsequent Events,” to our audited consolidated financial statements included elsewhere in this Annual Report on Form 10-K for additional information.
138
Part III
Item 10. Directors and Executive Officers of the Registrant and Corporate Governance
Directors and Executive Officers of the Registrant
The following table sets forth information about our directors and executive officers as of February 27, 2020:
Name | Age | Position | |||
David Simmons | 55 | Chairman and Chief Executive Officer | |||
William J. Sharbaugh | 57 | Chief Operating Officer | |||
Christopher G. Scully | 49 | Executive Vice President and Chief Financial Officer, Treasurer and Assistant Secretary | |||
Glen Donovan | 46 | Chief Accounting Officer | |||
Anshul Thakral | 42 | Executive Vice President, Chief Commercial Officer | |||
B. Judd Hartman | 56 | Executive Vice President, General Counsel and Chief Administrative Officer | |||
Christopher Fikry | 43 | Executive Vice President, Global Laboratory Services | |||
Ronald Garrow | 56 | Executive Vice President and Chief Human Resource Officer | |||
David Johnston | 51 | Executive Vice President of Global Clinical Development | |||
Karen Kaucic | 60 | Executive Vice President and President of Evidera, Chief Medical Officer | |||
Roger Smith | 47 | Senior Vice President and General Manager of AES | |||
Joe Bress | 37 | Director | |||
Stephen Ensley | 35 | Director | |||
Maria Teresa Hilado | 55 | Director | |||
Colin Hill | 47 | Director | |||
Jeffrey B. Kindler | 64 | Director | |||
P. Hunter Philbrick | 40 | Director | |||
Allen R. Thorpe | 49 | Director | |||
Stephen H. Wise | 47 | Director | |||
Set forth below is a brief description of the business experience of our directors and executive officers. All of our executive officers serve at the discretion of our board of directors.
David Simmons. David Simmons has served as Chairman and Chief Executive Officer of the Company or its predecessor, Jaguar Holding Company I, since May 2012. Prior to joining the Company, Mr. Simmons served in various roles at Pfizer Inc. (PFE), a multinational pharmaceutical corporation, from 1996 to 2012, most recently as their president of the emerging markets and established products business units. Mr. Simmons currently serves on the board of directors for Albany Molecular Research, Inc., a contract research and manufacturing organization, and Edelman Financial Engines LLC, a financial planning and investment management firm, and serves as a member of the board of advisors for Carnegie Mellon University’s Tepper School of Business. We believe Mr. Simmons brings to our board of directors extensive knowledge of the pharmaceutical industry, which together with his experience leading the Company as our Chief Executive Officer, makes him well qualified to serve as one of our directors.
William J. Sharbaugh. William J. Sharbaugh has served as Chief Operating Officer of the Company or its predecessor, Jaguar Holding Company I, since April 2007. Prior to joining the Company, Mr. Sharbaugh served in various roles at Bristol-Myers Squibb (BMY), a multinational pharmaceutical corporation, from 2000 to 2007, most recently as their vice president of global development operations. Prior to Bristol-Myers Squibb, Mr. Sharbaugh served in various roles in research and development, manufacturing, quality assurance and sales at Merck & Co. (MRK), a multinational pharmaceutical corporation, from 1997 to 2007.
139
Christopher G. Scully. Christopher G. Scully has served as our executive vice president and Chief Financial Officer, Treasurer and Assistant Secretary since May 2018. Prior to joining the Company, Mr. Scully served in various roles at Pfizer, Inc. (PFE) from 1997 to 2017, including as their chief commercial officer for the essential health business unit from January 2014 to August 2017 and regional president of Europe established products from October 2010 to January 2014.
Glen Donovan. Glen Donovan has served as Chief Accounting Officer of the Company or its predecessor, Jaguar Holding Company I, since June 2015. Prior to joining the Company, Mr. Donovan served in various roles at Deloitte & Touche, a multinational professional services network, from November 1996 to May 2015, including as audit and assurance partner from September 2011 to May 2015.
Anshul Thakral. Anshul Thakral has served as our executive vice president and Chief Commercial Officer of the Company since November 2019. Mr. Thakral previously served as executive vice president and global head of PPD Biotech of the Company from July 2016 to November 2019. Prior to joining the Company, Mr. Thakral served as general manager of the global life sciences business unit at Gerson Lehrman Group from March 2014 to June 2016.
B. Judd Hartman. Judd Hartman has served as General Counsel of the Company or its predecessor, Jaguar Holding Company I, since July 2001. In June 2017, he was also appointed as our Chief Administrative Officer in addition to continuing to serve as our General Counsel. Prior to joining the Company, Mr. Hartman served as vice president of legal affairs for Anker Coal Group, Inc., a coal mining company, from 1997 to 2001. Prior to Anker Coal Group, Mr. Hartman was a partner with Spilman Thomas & Battle, a law firm headquartered in Charleston, West Virginia.
Christopher Fikry. Christopher Fikry has served as our executive vice president of Global Laboratory Services since June 2017. Prior to joining the Company, Mr. Fikry served in various roles at Quest Diagnostics (DGX), from September 2012 to May 2017, including as vice president and general manager of oncology and companion diagnostics, and at Novartis AG (NUS) Vaccines and Diagnostics, from January 2007 to September 2012, including as director of strategic planning, head of the U.S. meningococcal and the U.S. influenza and travel vaccine franchises and vice president of U.S. marketing. He began his career in the healthcare practice of The Boston Consulting Group Inc.
Ronald Garrow. Ronald Garrow has served as our executive vice president and chief human resource officer since July 2018. Prior to joining the Company, Mr. Garrow served in various roles at Belk, from July 2016 to July 2018, including as chief human resource officer. Prior to joining Belk, Mr. Garrow worked at MasterCard Inc. (MA) from March 2010 to July 2016, including as its chief human resource officer.
David Johnston. David Johnston has served as our executive vice president of Global Clinical Development since October 2016. From July 2013 to September 2016, Mr. Johnston served as executive vice president and global head of PPD Laboratories. Prior to joining the Company, Mr. Johnston worked at Laboratory Corp of America (LH) from April 1998 to June 2013, where he served as senior vice president and global head of the clinical trials business.
Karen Kaucic. Karen Kaucic has served in various leadership positions at the Company or its predecessor, Jaguar Holding Company I, since December 2009 and currently serves as our executive vice president and president of Evidera, chief medical officer. Prior to joining the Company, Ms. Kaucic held positions in oncology clinical development at AstraZeneca PLC (AZN) from June 2006 to December 2009.
Roger Smith. Roger Smith has served as our senior vice president and general manager of AES since July 2017, the time when the business unit was formed. Previously, Mr. Smith served as senior vice president and general manager of Acurian, Inc., which was acquired by the Company in August 2013.
Joe Bress. Joe Bress has served as a director since April 2019. Mr. Bress currently serves as a Principal at The Carlyle Group, which he joined in July 2007. He currently serves on the board of directors of WellDyneRx, an independent pharmacy benefit manager, Albany Molecular Research, a contract research and drug manufacturing organization, Visionary RCM, a business service provider for healthcare companies, Millicent Pharma, a pharmaceutical company, and X-Co Holdings, the parent company of biotechnology companies X-Chem and X-Rx. Prior to Carlyle, Mr. Bress worked in the Mergers and Acquisitions group at UBS from 2005 to 2007. We believe Mr. Bress contributes to our board of directors his financial expertise and experience in the healthcare industry, as well as the experience gained from advising and serving as a director of multiple Carlyle portfolio companies.
140
Stephen Ensley. Stephen Ensley has served as a director since August 2017. Mr. Ensley currently serves as a Director of Hellman & Friedman. Prior to joining Hellman & Friedman in 2009, Mr. Ensley worked as an investment banker in the Mergers and Acquisitions group at J.P. Morgan from 2007 to 2009. He currently serves on the operating committee of Genesys Telecommunications Laboratories, Inc., a customer engagement software provider, and the board of directors of X-Co Holdings, the parent company of biotechnology companies X-Chem and X-Rx. Mr. Ensley was formerly a director of Sheridan Healthcare, Inc., a provider of physician services, and CarProof, an automotive data provider. We believe Mr. Ensley contributes to our board of directors his financial expertise and capital markets experience, as well as the experience gained from advising and serving as a director of multiple Hellman & Friedman portfolio companies.
Maria Teresa Hilado. Maria Teresa Hilado has served as a director since February 2018. Ms. Hilado served as the chief financial officer of Allergan plc (AGN), a global pharmaceutical company, from December 2014 to February 2018. Prior to joining Allergan plc, Ms. Hilado served as senior vice president, finance and treasurer of PepsiCo Inc. (PEP) from 2009 to 2014. Before joining PepsiCo, she served as vice president and treasurer for Schering-Plough Corp., a pharmaceutical company, from 2008 to 2009. Before joining Schering-Plough, Ms. Hilado served in various roles at General Motors Co. (GM), most recently as assistant treasurer from 2006 to 2008 and as chief financial officer of GMAC Commercial Finance LLC from 2001 to 2005. Ms. Hilado currently serves on the board of directors of H.B. Fuller Co (FUL), an adhesives manufacturing company, Campbell Soup Company (CPB), a food company, and Zimmer Biomet (ZBH), a medical device company. We believe Ms. Hilado contributes to our board of directors her significant financial experience and extensive knowledge of the pharmaceutical industry, derived from her senior finance positions within Allergan, PepsiCo and Schering-Plough.
Colin Hill. Colin Hill has served as a director since October 2017. He co-founded GNS Healthcare Inc., a data analytics company, in 2010 and has since served as its chairman and chief executive officer. Mr. Hill is also the chairman of Gene Network Sciences, Inc., the parent company of GNS Healthcare Inc. Mr. Hill currently serves on the board of directors of Biotelemetry Inc. (BEAT), a remote medical technology company. He is also a founding board member of TMed (Transforming Medicine: The Elizabeth Kauffman Institute), a non-profit foundation dedicated to the advancement of personalized medicine. We believe Mr. Hill contributes to our board of directors his substantial experience in healthcare technologies, in particular technologies related to the use of data and machine learning in the biopharmaceutical industry.
Jeffrey B. Kindler. Jeffrey B. Kindler has served as a director since May 2017. Mr. Kindler joined Centrexion Therapeutics (CNTX), a biopharmaceutical company, as the chief executive officer in 2013. Mr. Kindler also served as executive chairman of vTv Therapeutics Inc. (VTVT), a clinical stage biopharmaceutical company, from July 2015 to November 2019 and now serves as chairman of vTv Therapeutics as well as on the board of directors of Perrigo Company PLC (PRGO), a global healthcare supplier, Intrexon Corporation (XON), a biotechnology company, and SIGA Technologies Inc. (SIGA), a pharmaceutical company. Mr. Kindler also served in a variety of roles at Pfizer Inc. (PFE) from 2002 to 2010, most recently as chairman and chief executive officer. Prior to his appointment as chief executive officer and chairman in 2006, Mr. Kindler served as executive vice president and general counsel and vice chairman from 2002 to 2006. We believe Mr. Kindler contributes to our board of directors his knowledge of the pharmaceutical industry and corporate governance based on his experience as a senior executive in the pharmaceutical industry and serving as a director of several public companies.
P. Hunter Philbrick. P. Hunter Philbrick has served as a director of the Company or its predecessor, Jaguar Holding Company I, since December 5, 2011. Mr. Philbrick has served as a Partner at Hellman & Friedman since January 2013. Prior to joining Hellman & Friedman in 2003, Mr. Philbrick worked as an investment banker in the mergers, acquisitions and restructuring and general industrial departments of Morgan Stanley & Co (MS). He currently serves as a member of the board of directors of HUB International Limited, a global insurance brokerage, and MultiPlan, Inc., a healthcare cost management service provider. Mr. Philbrick was formerly a director of Change Healthcare Inc. (CHNG) (formerly Emdeon), an independent healthcare technology platform, GeoVera Insurance Holdings Ltd., a residential property insurance company, and Sedgwick Inc., a provider of technology-enabled risk, benefits and integrated business solutions. We believe Mr. Philbrick contributes to our board of directors his finance and capital markets experience as well as insight into the healthcare industry, gained from advising and serving as a director of multiple Hellman & Friedman portfolio companies.
141
Allen R. Thorpe. Allen R. Thorpe has served as a director of the Company or its predecessor, Jaguar Holding Company I, since October 11, 2011. Mr. Thorpe has served as a Partner of Hellman & Friedman since January 1, 2004 and leads the firm’s New York office. Prior to joining Hellman & Friedman in 1999, Mr. Thorpe was a vice president with Pacific Equity Partners in Australia, a private equity firm, and was a manager at Bain & Company, Inc., a management consulting firm. He currently serves on the board of directors of MultiPlan, Inc., a healthcare cost management service provider, and Edelman Financial Engines LLC, a financial planning and investment management firm. Mr. Thorpe also previously served as Chairman of Sheridan Healthcare, Inc., a provider of physician services, a director of Change Healthcare Inc. (CHNG) (formerly Emdeon), an independent healthcare technology platform, Mitchell International Inc., an enterprise software provider, Artisan Partners Asset Management Inc. (APAM), a global investment management firm, the lead independent director of LPL Financial Holdings Inc. (LPLA), an investment firm and a member of the advisory board of Grosvenor Capital Management, a provider of financial planning and advisory services. We believe Mr. Thorpe contributes to our board of directors his extensive knowledge of the healthcare industry as well as financial and corporate governance experience gained through years of serving as a director of multiple Hellman & Friedman portfolio companies.
Stephen H. Wise. Stephen H. Wise has served as a director of the Company or its predecessor, Jaguar Holding Company I, since December 2011. Mr. Wise has served as managing director of The Carlyle Group since January 2010 and head of the Global Health Care team at The Carlyle Group since January 2016. Prior to joining Carlyle in 2006, Mr. Wise worked with JLL Partners, a New York-based private equity firm. Prior to JLL Partners, he worked with J.W. Childs Associates, a Boston-based private equity firm, and prior to that, in the leveraged finance group of Credit Suisse (USOI). Mr. Wise currently serves as a member of the board of directors of Albany Molecular Research, Inc., a contract research and drug manufacturing organization, MedRisk Holdco, LLC, a physical therapy-focused workers’ compensation solutions company, Millicent Pharma Limited, a pharmaceutical company and Ortho-Clinical Diagnostics, a global provider of in vitro diagnostic solutions for screening, diagnosing, monitoring and confirming diseases, Rede D’Or São Luiz S.A., a hospital provider in Brazil, Sedgwick Inc., Visionary RCM, a business service provider for healthcare companies, and WellDyneRx, LLC, an independent pharmacy benefit manager. We believe Mr. Wise contributes to our board of directors his extensive knowledge of and experience in the healthcare industry as well as his financial and corporate governance experience, both gained through years of serving as head of Carlyle’s Global Health Care team and as a director of multiple Carlyle portfolio companies.
Board of Directors
Our business and affairs are managed under the direction of our board of directors. Our board of directors currently consists of nine directors.
Our amended and restated certificate of incorporation provides that, subject to the right of holders of any series of preferred stock, our board of directors will be divided into three classes of directors, with the classes to be as nearly equal in number as possible, and with the directors serving staggered three-year terms, with only one class of directors being elected at each annual meeting of stockholders. As a result, approximately one-third of our board of directors will be elected each year. Our initial Class I directors are Ms. Hilado and Messrs. Simmons and Ensley (with their terms expiring at the annual meeting of stockholders to be held in 2021), our initial Class II directors are Messrs. Bress, Hill and Philbrick (with their terms expiring at the annual meeting of stockholders to be held in 2022) and our initial Class III directors are Messrs. Kindler, Thorpe and Wise (with their terms expiring at the annual meeting of stockholders to be held in 2023).
Our amended and restated certificate of incorporation and amended and restated bylaws provide that, subject to any rights of holders of preferred stock to elect additional directors under specified circumstances, the number of directors will be fixed from time to time exclusively pursuant to a resolution adopted by the board of directors; however, if at any time the Majority Sponsors own at least 40% in voting power of the stock of our Company entitled to vote generally in the election of directors, the stockholders may also fix the number of directors pursuant to a resolution adopted by the stockholders. Subject to certain exceptions described below with respect to the second amended and restated stockholders agreement we entered into, newly created director positions resulting from an increase in size of the board of directors and vacancies may be filled by our board of directors or our stockholders; provided, however, that at any time with when the Majority Sponsors beneficially own less than 40% in voting power of the stock of our company entitled to vote generally in the election of directors, such vacancies shall be filled by our board of directors (and not by the stockholders).
142
Our second amended and restated stockholders agreement provides that, the Majority Sponsors have the right to nominate a certain number of directors to our board of directors (such persons, the “Majority Sponsor nominees”). Carlyle has the right to nominate two directors if it holds 15% or more of the Company’s outstanding shares, or one director if it holds 7.5% or more of the Company’s outstanding shares but less than 15%. Hellman & Friedman has the right to nominate three directors if it holds 30% or more of the Company’s outstanding shares, two directors if it holds 15% or more of the Company’s outstanding shares but less than 30%, or if one director if it holds 7.5% or more of the Company’s outstanding shares, but less than 15%. In addition, GIC and ADIA each have the right to designate one board observer (such persons, the “Financial Sponsor observers”) to our board of directors if such entity holds at least 5% of the Company’s outstanding shares. For so long as we have a classified board of directors, the Majority Sponsor nominees will be divided by the Majority Sponsors as evenly as possible among the classes of directors.
Pursuant to the second amended and restated stockholders agreement, for so long as Hellman & Friedman and Carlyle have the right to nominate any persons to our board of directors, (i) we will include the Majority Sponsor nominees on the slate that is included in our proxy statements relating to the election of directors of the class to which such persons belong and provide the highest level of support for the election of each such persons as we provide to any other individual standing for election as a director, and (ii) we will include on the slate that is included in our proxy statement relating to the election of directors only (x) the Hellman & Friedman nominees (as defined below), (y) the Carlyle nominees (as defined below) and (z) the other nominees (if any) nominated by our board of directors, provided that each such other nominee shall be (A) an independent director unanimously approved by Hellman & Friedman and Carlyle (in each case, only if such party then has the right to nominate any nominees) or (B) our chief executive officer. In addition, each of the Sponsors will agree with the Company to vote in favor of the Company slate that is included in our proxy.
In the event that a Majority Sponsor nominee ceases to serve as a director for any reason (other than the failure of our stockholders to elect such individual as a director), the persons entitled to designate such nominee director under the second amended and restated stockholders agreement will be entitled to appoint another nominee to fill the resulting vacancy.
Background and Experience of Directors
When considering whether directors and nominees have the experience, qualifications, attributes or skills, taken as a whole, to enable our board of directors to satisfy its oversight responsibilities effectively in light of our business and structure, the board of directors focused primarily on each person’s background and experience as reflected in the information discussed in each of the directors’ individual biographies set forth above. We believe that our directors provide an appropriate mix of experience and skills relevant to the size and nature of our business. Once appointed, directors serve until their term expires, they resign or they are removed by the stockholders.
Role of Board of Directors in Risk Oversight
The board of directors has extensive involvement in the oversight of risk management related to us and our business and accomplishes this oversight through the regular reporting by the Audit Committee of the board of directors (the “Audit Committee”). The purpose of the Audit Committee is to assist the board of directors in fulfilling its fiduciary oversight responsibilities relating to (1) the quality and integrity of our financial statements, including oversight of our accounting and financial reporting processes, internal controls and financial statement audits, (2) our compliance with legal and regulatory requirements, (3) our independent registered public accounting firm’s qualifications, performance and independence, (4) our corporate compliance program, including our code of conduct and anti-corruption compliance policy, and investigating possible violations thereunder, (5) our risk management policies and procedures and (6) the performance of our internal audit function. Through its regular meetings with management, including the finance, legal and internal audit functions, the Audit Committee reviews and discusses all significant areas of our business and summarizes for the board of directors all areas of risk and the appropriate mitigating factors. In addition, our board of directors receives periodic detailed operating performance reviews from management.
143
Controlled Company Exception
The Majority Sponsors beneficially own more than 50% of our common stock and voting power. As a result, (a) under certain provisions of our amended and restated bylaws, the Majority Sponsors and these other parties to our stockholders agreement will be entitled to nominate at least a majority of the total number of directors comprising our board of directors and (b) we qualify as a “controlled company” as that term is set forth in Section 5615(c)(1) of the Nasdaq Marketplace Rules. Under the Nasdaq corporate governance standards, a company of which more than 50% of the voting power is held by an individual, group or another company is a “controlled company” and may elect not to comply with certain corporate governance standards, including (1) the requirement that a majority of the board of directors consist of independent directors, (2) the requirement that we have a compensation committee that is composed entirely of independent directors with a written charter addressing the committee’s purpose and responsibilities and (3) the requirement that our director nominations be made, or recommended to our full board of directors, by our independent directors or by a nominations committee that consists entirely of independent directors and that we adopt a written charter or board of directors resolution addressing the nominations process. We do not utilize these exemptions. However, if we utilize any of these exemptions in the future, we will not have the same protections afforded to stockholders of companies that are subject to all of the Nasdaq corporate governance requirements. In the event that we cease to be a “controlled company,” we will be required to comply with these provisions within the transition periods specified in the Nasdaq corporate governance rules.
Committees of the Board of Directors
The standing committees of our board of directors consist of the Audit Committee, a Compensation Committee (the “Compensation Committee”) and a Nominating and Corporate Governance Committee (the “Nominating and Corporate Governance Committee”).
Our chief executive officer and other executive officers will regularly report to the non-executive directors and the Audit, the Compensation and the Nominating and Corporate Governance Committees to ensure effective and efficient oversight of our activities and to assist in proper risk management and the ongoing evaluation of management controls. The internal audit function will report functionally and administratively to our chief financial officer and directly to the Audit Committee. We believe that the leadership structure of our board of directors provides appropriate risk oversight of our activities given the controlling interests held by the Majority Sponsors.
Audit Committee
The members of our current Audit Committee are Ms. Hilado and Messrs. Kindler and Philbrick. Ms. Hilado and Mr. Kindler qualify as independent directors under the Nasdaq corporate governance standards and independence requirements of Rule 10A-3 of the Exchange Act. Our board of directors has determined that each of Ms. Hilado and Messrs. Kindler and Philbrick qualify as an “audit committee financial expert” as such term is defined in Item 407(d)(5) of Regulation S-K.
Our Audit Committee is responsible for, among other things: (1) overseeing and monitoring the quality and integrity of our financial statements, including oversight of our accounting and financial reporting processes, internal controls and financial statement audits, (2) overseeing and monitoring our compliance with legal and regulatory requirements, (3) engaging our independent registered public accounting firm and assessing our independent registered public accounting firm’s qualifications, performance and independence (including the rotation of partners of the independent registered public accounting firm on our engagement team) as required by law, (4) approving the plan and fees for the annual audit, quarterly reviews, tax and other audit-related services and approving in advance any non-audit services and fees to be provided by the independent registered public accounting firm, (5) providing oversight assistance in connection with our corporate compliance program, including our code of conduct and anti-corruption compliance policy, and investigating possible violations thereunder, and making recommendations to the board of directors regarding corporate governance issues and policy decisions, (6) overseeing and monitoring our risk management policies and procedures, (7) overseeing and monitoring the performance of our internal audit function, and (8) preparing the audit committee report that the rules and regulations of the SEC require to be included in our annual proxy statement.
The Audit Committee charter, which has been adopted by our board of directors, is available on our website.
144
Compensation Committee Interlocks and Insider Participation
Compensation decisions are made by our Compensation Committee. None of our current or former executive officers or employees currently serves, or has served during our last completed fiscal year, as a member of our Compensation Committee and, during that period, none of our executive officers served as a member of the compensation committee (or other committee serving an equivalent function) of any other entity whose executive officers served as a member of our board of directors.
We have entered into certain indemnification agreements with our directors and are party to certain transactions with the Sponsors as described in “Certain Relationships and Related Party Transactions, and Director Independence—Indemnification of Directors and Officers” and “—Second Amended and Restated Stockholders Agreement,” respectively.
Compensation Committee
The members of our current Compensation Committee are Ms. Hilado and Messrs. Philbrick, Kindler and Wise.
The purpose of the Compensation Committee is to assist our board of directors in discharging its responsibilities relating to, among other things: (1) setting our compensation program and compensation of our executive officers and directors, (2) administering our incentive and equity-based compensation plans and (3) preparing the compensation committee report required to be included in our proxy statement under the rules and regulations of the SEC.
The Compensation Committee charter, which has been adopted by our board of directors, is available on our website.
Nominating and Corporate Governance Committee
The members of our current Nominating and Corporate Governance Committee are Messrs. Thorpe, Hill and Wise. The purpose of our Nominating and Corporate Governance Committee is to assist our board of directors in discharging its responsibilities relating to, among other things: (1) identifying individuals qualified to become new board members, consistent with criteria approved by the board of directors, (2) reviewing the qualifications of incumbent directors to determine whether to recommend them for reelection and selecting, or recommending that the board of directors select, the director nominees for the next annual meeting of stockholders, (3) identifying board members qualified to fill vacancies on any committee of the board of directors and recommending that the board of directors appoint the identified member or members to the applicable committee, (4) reviewing and recommending to the board of directors corporate governance principles applicable to us, (5) overseeing the evaluation of the board of directors and management and (6) handling such other matters that are specifically delegated to the committee by the board of directors from time to time.
The Nominating and Corporate Governance Committee charter, which has been adopted by our board of directors, is available on our website.
Code of Conduct
We have adopted a Code of Conduct (the “Code of Conduct”) that constitutes a “code of ethics” as defined by applicable SEC rules and a “code of conduct” as defined by applicable Nasdaq rules. The Code of Conduct is applicable to all employees, executive officers and directors that addresses legal and ethical issues that may be encountered in carrying out their duties and responsibilities, including the requirement to report any conduct they believe to be a violation of the Code of Conduct. The Code of Conduct is available on our website, www.ppdi.com. The information available on or through our website is not part of Annual Report on Form 10-K. If we ever were to amend or waive any provision of our Code of Conduct that applies to our principal executive officer, principal financial officer, principal accounting officer or any person performing similar functions, we intend to satisfy our disclosure obligations with respect to any such waiver or amendment by posting such information on our website rather than by filing a Form 8-K.
145
Item 11. Executive Compensation
Compensation Discussion and Analysis
This Compensation Discussion and Analysis provides an overview of our executive compensation philosophy, the overall objectives of our executive compensation program, and each material element of compensation for the fiscal year ended December 31, 2019 that we provided to each person who served as our principal executive officer or principal financial officer during 2019 and our three other most highly compensated executive officers employed at the end of 2019, all of whom we refer to collectively as our “Named Executive Officers.”
Our Named Executive Officers for the fiscal year ended December 31, 2019 were as follows:
• | David Simmons, Chairman and Chief Executive Officer |
• | Christopher G. Scully, Executive Vice President and Chief Financial Officer |
• | William J. Sharbaugh, Chief Operating Officer |
• | Anshul Thakral, Executive Vice President, Chief Commercial Officer |
• | B. Judd Hartman, Executive Vice President, General Counsel and Chief Administrative Officer |
The Compensation Committee is responsible for establishing, implementing and evaluating our employee compensation and benefit programs. The Compensation Committee annually evaluates the performance of our executive officers, establishes the annual salaries and annual cash incentive awards for our executive officers and approves equity awards for all of our eligible employees and directors. The Compensation Committee’s objective is to ensure that the total compensation paid to the Named Executive Officers as well as our other senior officers is fair, reasonable, competitive and performance-based. Generally, the types of compensation and benefits provided to our Named Executive Officers are similar to those provided to other senior members of our management team. The Compensation Committee also periodically reviews and amends our cash-based incentive compensation plans for all employees, including our executive officers, and our long-term incentive compensation plans, including our equity incentive plan, for all employees, and evaluates, among other things, whether (i) the performance measures upon which awards under these plans are based are aligned with our stockholders’ interests and (ii) the relationship between the incentives associated with these plans and the level of risk-taking by executive officers or others in response to such incentives is reasonably likely to have a material adverse effect on the Company.
Executive Compensation Objectives and Philosophy
The goal of our executive compensation program is to create long-term value for our stockholders while at the same time rewarding our executives for superior financial and operating performance and encouraging them to remain with the Company for successful and productive careers. We believe the most effective way to achieve this objective is to design an executive compensation program that rewards the achievement of specific annual objectives as well as long-term and strategic goals that create stockholder value and align executives’ interests with those of our stockholders by further rewarding performance above established targets. This philosophy is the foundation for evaluating and improving the effectiveness of our executive pay program. The following are the core elements of our executive compensation philosophy:
• | Performance-Based: A significant portion of executive compensation should be “at-risk,” performance-based pay linked to specific, measurable short-term and long-term goals that reward both organizational and individual performance; |
• | Stockholder Aligned: Incentives should be structured to create a strong alignment between executives and stockholders on both a short-term and long-term basis; and |
• | Market Competitive: Compensation levels and programs for executives, including the Named Executive Officers, should be competitive relative to the markets in which we operate and compete for talent. It is important to leverage an understanding of what constitutes competitive pay in our markets and build strategies to attract, incentivize, reward and retain top talent. |
By incorporating these core design elements, we believe our executive compensation program is in line with and supportive of our stockholders’ objectives and effective in attracting, motivating and retaining the level of talent we need to successfully manage and grow our business.
146
Process for Determining Compensation
Each year, the Compensation Committee reviews the performance and compensation of our Named Executive Officers. The Compensation Committee assesses the Company’s performance against its annual enterprise priorities and evaluates the performance of the Named Executive Officers relative to those priorities and their individual objectives for the year in question. The Compensation Committee seeks to ensure that a substantial portion of our Named Executive Officers’ annual compensation is directly linked to the performance of our business. As discussed under “—Narrative Disclosure to Summary Compensation Table and Grants of Plan-Based Awards Table—Employment Agreements with Named Executive Officers,” we entered into employment agreements with each of our Named Executive Officers, which address certain elements of their compensation and benefit packages.
In evaluating the performance of the Chief Executive Officer, the Compensation Committee considers the Chief Executive Officer’s assessment of his own performance and conducts its own performance evaluation of his performance and compensation in closed session with Compensation Committee members only. With regard to the performance and compensation of each of our other Named Executive Officers, the Compensation Committee seeks the input of our Chief Executive Officer. The Chief Executive Officer provides his assessments and recommendations to the Compensation Committee regarding the performance and compensation of the other Named Executive Officers.
In determining the level of compensation for our Named Executive Officers, the Compensation Committee considers each Named Executive Officer’s position and responsibility, the Chief Executive Officer’s recommendations for the Named Executive Officers other than himself, compensation levels of other members of the Company’s senior leadership team, and the performance of the Company and each Named Executive Officer. The Compensation Committee has not historically retained a compensation consultant to assist it in designing our compensation program or setting compensation levels for our Named Executive Officers. The Compensation Committee has considered survey and other market data in evaluating compensation levels for our Named Executive Officers. Based on the considerations described above and the judgment and experience of its members, the Compensation Committee establishes the compensation levels for our Named Executive Officers and the allocation of total compensation among each of our three main components of compensation described below.
The Compensation Committee has engaged Korn Ferry (the “Consultant”) as an independent compensation consultant. The Consultant will perform a variety of work, including but not limited to: assisting in the development of a market-based director compensation program and stock ownership guidelines, conducting a review of the competitiveness of our executive compensation program, reevaluating our annual cash incentive plan design, and evaluating a post-IPO long-term equity incentive award program and strategy. In order to support the Compensation Committee in its review and evaluation of each of these areas, a peer group composed of the 14 companies set forth below (the “Peer Group”) was developed with the assistance of the Consultant.
Peer Group
Agilent Technologies, Inc. | Charles River Labs International, Inc. | Mettler-Toledo International Inc. | Quest Diagnostics Incorporated | |||
Avantor, Inc. | Illumina, Inc. | PerkinElmer, Inc. | Syneos Health, Inc. | |||
Bio-Rad Laboratories, Inc. | IQVIA Holdings Inc. | PRA Health Sciences, Inc. | ||||
Bruker Corporation | Laboratory Corporation of America Holdings | Perrigo Company plc | ||||
The Peer Group was selected based on weighted parameters, financial information and our competitive market for executive talent, and its construction is intended to ensure that the Company remains within a reasonable range of the peer median in terms of revenue, headcount and market value.
Relationship of Compensation Practices to Risk Management
Our compensation plans and practices are designed to mitigate the possibility of encouraging excessive risk-taking behavior and the potential impacts thereof. For example, the following features of our executive compensation program mitigate risk:
• | Challenging, but attainable goals that are well-defined and communicated; |
• | Balance of short- and long-term variable compensation tied to a mix of commercial, financial and individual performance metrics; and |
• | Establishment of controls in the administration of our plans to ensure performance against established company performance metrics is objectively and independently determined. |
147
Considerations in Setting 2019 Compensation
The 2019 compensation of our Named Executive Officers was based on the Company’s performance against enterprise priorities and specific performance metrics, each Named Executive Officer’s individual performance against their annual objectives and adjustments to cash compensation for selected Named Executive Officers intended to ensure their compensation is both competitive and internally fair. The Compensation Committee believes the total 2019 compensation of our Named Executive Officers was competitive while at the same time being responsible to our stockholders because a significant percentage of total compensation in 2019 was allocated to variable compensation which is paid only upon achievement of Company performance objectives and individual Named Executive Officer goals that contribute to the creation of stockholder value.
The following is a summary of key considerations that affected the development of 2019 compensation targets and 2019 compensation decisions for our Named Executive Officers (and which the Compensation Committee believes will continue to affect its compensation decisions in future years):
Emphasis on Performance. Our compensation program provides increased pay opportunity correlated with superior performance on an annual basis and over the long term. When evaluating base salary, the Compensation Committee reviews, among other factors, our overall financial and operating performance in the prior year, the outlook for the current year, our targets for base salary increases for all employees, inflation, changes in the scope of an individual’s job, individual performance and the performance of the divisions, business units or departments for which a Named Executive Officer is responsible. Under our Senior Executive Incentive Compensation Plan (the “SEICP”), which provides for an annual cash bonus for our Senior Vice Presidents and above, Company performance against specific performance measures and individual performance against annual goals are the drivers in determining the Named Executive Officer’s non-equity incentive award. For our equity incentives, of the options granted under our Eagle Holding Company I 2017 Equity Incentive Plan (the “2017 Plan”) to our Named Executive Officers, the vesting of a significant portion of these options is based on performance against specified financial and stockholder return metrics.
The Importance of Company Results. The SEICP uses the achievement of specific company performance metrics in determining 85% of the Named Executive Officers’ target annual cash incentive award. This weighting is intended to incentivize the Named Executive Officers to achieve these specified targets and to hold them accountable when we fail to do so. In addition, a significant portion of our long-term equity incentive awards to the Named Executive Officers vest based upon the attainment of certain pre-established performance conditions, including, for example, EBITDA targets in the case of the EBITDA Options (as defined below).
Use of Market Data. The Compensation Committee establishes target compensation levels that are consistent with external competitive market practices and internal equity considerations (including position, responsibility and contribution) relative to base salaries, annual cash bonuses and long-term equity compensation, as well as the appropriate pay mix for a particular position. Historically, in order to gauge the competitiveness of its compensation programs, the Compensation Committee has reviewed compensation practices and pay opportunities from relevant industry surveys as well as market data for life sciences and other relevant companies, including the following peer companies: ICON, IQVIA, Laboratory Corporation of America Holdings, PAREXEL International Corporation, PRA Health Sciences and Syneos Health. We strive to position ourselves to attract and retain qualified senior executives in the face of competitive pressures in our relevant labor markets.
Components of 2019 Compensation Program
There are three key components of our executive compensation program for our executives, including our Named Executive Officers:
• | base salary; |
• | annual incentive bonus; and |
• | long-term equity incentive compensation in the form of stock options. |
In addition to these key compensation elements, the Named Executive Officers are provided certain other compensation. See “—Other Compensation.”
We believe that offering each of the components of our executive compensation program is necessary to remain competitive in attracting, retaining and motivating talented executives. Furthermore, we structure the annual incentive bonus and long-term equity incentive compensation to ensure alignment of our executives’ interests with those of our stockholders. Collectively, these components are designed to motivate and reward our executives and drive our short- and long-term performance and increase stockholder value.
148
Our base salaries are designed to attract and retain individuals with superior talent, be market competitive and reward executives for their individual performance and our short-term performance. Our annual incentive bonus program is designed to motivate our executives to achieve the targets we set annually for selected performance metrics, to reward them for that achievement and to hold them accountable if they fail to deliver. Our long-term incentive compensation ensures that our executives have a continuing stake in our long-term success and have incentives to increase our equity value.
2019 Base Salaries
The Compensation Committee reviews base salaries of our Named Executive Officers in the first quarter of each year, which is the same cycle on which annual base salaries are reviewed for all of our other employees. In setting annual base salaries for our Named Executive Officers, the Compensation Committee takes into consideration our overall financial and operating performance in the prior year, the outlook for the current year, our targets for base salary increases for all employees, inflation, changes in the scope of a Named Executive Officer’s job, individual performance, performance of the segments, business units or functions for which a Named Executive Officer is responsible, other components of compensation and other relevant factors. No formulaic base salary increases are provided to the Named Executive Officers.
In 2019, the Compensation Committee reviewed and set the base salaries set forth in the table below:
Name | 2018 Base Salary ($) | 2019 Base Salary ($) | 2018 to 2019 Increase (%) | ||||||
David Simmons | 1,566,720 | 1,566,720 | — | ||||||
Christopher G. Scully | 495,000 | 495,000 | — | ||||||
William J. Sharbaugh | 507,291 | 526,365(1) | 3.8 | ||||||
Anshul Thakral | 345,000 | 450,000(2) | 30.4 | ||||||
B. Judd Hartman | 443,439 | 456,742(1) | 3.0 | ||||||
__________________
(1) | Effective April 1, 2019 |
(2) | Effective January 1, 2019, Mr. Thakral’s base salary was increased to $400,000 and effective November 1, 2019, his base salary was increased to $450,000. |
The Compensation Committee did not increase the base salary of Mr. Simmons. Although Mr. Simmons’ base salary has not been increased since 2016, the Committee believes his base salary remains competitive for our market. The Compensation Committee also did not increase the base salary for Mr. Scully as he joined the Company in 2018 and the Committee believes his base salary remains competitive based on our market and his performance. For Mr. Sharbaugh, the Compensation Committee increased his base salary to reflect his superior performance and leadership in recent years across the Company’s core operational business units and to ensure his cash compensation remains market competitive. The Compensation Committee increased Mr. Thakral’s base salary effective January 1, 2019 in connection with his promotion from Senior Vice President, Global Head of PPD Biotech, to Executive Vice President, Global Head of PPD Biotech. Effective November 1, 2019, the Compensation Committee increased Mr. Thakral’s base salary to $450,000 in connection with his promotion from Executive Vice President, Global Head of PPD Biotech, to Executive Vice President, Chief Commercial Officer. Mr. Thakral’s promotions reflect his performance, the substantial growth of the PPD Biotech customer segment for which he is and remains responsible, his expanded role with respect to the Company’s global commercial function and his contributions to key enterprise priorities. Mr. Hartman’s base salary was increased in 2019 based on his performance in 2018.
2019 Annual Cash Incentive Compensation
We have entered into employment agreements with our Named Executive Officers. Pursuant to their employment agreements with the Company, our Named Executive Officers are entitled to receive an annual cash incentive award targeted at a specified percentage of their annual base salary paid to them during each year. The annual cash bonus targets for our Named Executive Officers for 2019 were as follows: Mr. Simmons—100%; Mr. Sharbaugh—90%; Mr. Scully—75%; Mr. Thakral—75%; and Mr. Hartman—50%.
149
Each Named Executive Officer’s annual bonus is based upon a formula calculated by measuring achievement against annual performance measures and individual objectives. The annual cash bonuses for Messrs. Simmons, Sharbaugh, Scully and Hartman were determined solely under the SEICP, which provides for a Company Performance Award (as described below) component (based on EBITDA and Gross Authorizations, each as defined below) and an Individual Qualitative Performance Award (as described below) component. Mr. Thakral’s annual bonus is based on (i) the bonus plan set forth in his employment agreement, which is based on performance against a specified gross authorization target established each year by the Compensation Committee (the “Annual Authorization Bonus”) and (ii) the SEICP. Of Mr. Thakral’s bonus target, 70% is based on achievement under the Annual Authorization Bonus and 30% is based on the SEICP. The following table sets forth the overall weighting of each component of cash incentive compensation for the Named Executive Officers in 2019:
Name | SEICP | Annual Authorization Bonus (%) | |||||||||||
EBITDA Performance Award Weight (%) | Gross Authorization Performance Award Weight (%) | Individual Qualitative Performance Award Weight (%) | |||||||||||
David Simmons | 60 | 25 | 15 | — | |||||||||
Christopher G. Scully | 60 | 25 | 15 | — | |||||||||
William J. Sharbaugh | 60 | 25 | 15 | — | |||||||||
Anshul Thakral | 15 | — | 15 | 70 | |||||||||
B. Judd Hartman | 70 | 15 | 15 | — | |||||||||
More detailed descriptions of the terms and conditions of the SEICP and Mr. Thakral’s Annual Authorization Bonus are set forth below.
SEICP—Company Performance Awards
The “Company Performance Award” is based on EBITDA and Gross Authorizations and is defined as the sum of the EBITDA Performance Award (as described below) and the Gross Authorization Performance Award. The EBITDA Performance Award is defined as the product of: (a) the Named Executive Officer’s eligible earnings (the base salary paid to the Named Executive Officer in the applicable calendar year), (b) the Named Executive Officer’s target award percentage, (c) the EBITDA Performance Award Weight and (d) the EBITDA Payout Percentage. The “Gross Authorization Performance Award” is defined as the product of: (a) the Named Executive Officer’s eligible earnings, (b) the Named Executive Officer’s target award percentage, (c) the Gross Authorization Performance Award Weight and (d) the Gross Authorization Payout Percentage. For 2019, the EBITDA Performance Award Weight and the Gross Authorization Performance Award Weight for each of the Named Executive Officers were as set forth in the table above.
The EBITDA Payout Percentage and Gross Authorization Payout Percentage are determined under separate leverage curves set forth in the SEICP based on our actual achievement against an annual target. For each performance year, the Compensation Committee sets an EBITDA Target and Gross Authorization Target. The “EBITDA Target” is defined as the Company’s projected Adjusted EBITDA for a calendar year excluding the amount included in our budget for such calendar year for annual employee cash bonuses under any short-term cash bonus plan (other than cash bonus plans for our business development personnel), the impact of changes in accounting standards and foreign currency exchange. The “Gross Authorization Target” for the Named Executive Officers is defined as the aggregate projected Gross Authorizations for our business units for a calendar year. “Gross Authorization” is defined as (A) the U.S. dollar amount of authorizations (i) evidenced by an agreement or letter of intent signed by the Company or other written confirmation from the customer of intent to proceed with the services in question and (ii) added to the Company’s backlog in the applicable calendar year as determined by the Company’s Chief Financial Officer, acting in good faith after consultation with the Chief Executive Officer, and in accordance with the Company’s authorization policy in effect from time to time, plus (B) the U.S. dollar amount of positive contract modification and adjustments made to the Company’s backlog in the applicable calendar year, minus (C) the U.S. dollar amount of negative contract modifications and adjustments made to the Company’s backlog in the applicable calendar year. The Compensation Committee establishes the Gross Authorization Target so that the threshold performance level is reasonably likely to be achieved, while the target goal is more challenging, but achievable.
150
Under the SEICP leverage curves, achievement of 100% of our annual EBITDA Target yields a 100% EBITDA Payout Percentage and achievement of 100% of the applicable annual Gross Authorization Target yields a 100% Gross Authorization Payout Percentage. Achievement within a certain number of percentage points above or below the annual EBITDA Target and Gross Authorization Target also yields 100% payout percentages (the “Target EBITDA Range” and “Target Gross Authorization Range,” as applicable). The SEICP leverage curves set threshold and maximum percentages of achievement against our annual EBITDA Target and annual Gross Authorization Targets. The SEICP further determines the “Leverage Ratio,” that is, the number of percentage points that the applicable Payout Percentage increases for every one percentage point that achievement exceeds the Target EBITDA Range or Target Gross Authorization Range, as applicable, up to the applicable maximum Payout Percentage, and the number of percentage points that the Payout Percentage decreases for every one percentage point that the achievement falls below the applicable Target Range. The Leverage Ratio is zero within the applicable Target Range.
The following chart sets forth the SEICP leverage curve for the EBITDA Target for 2019:
Achievement Relative to Annual EBITDA Target (%) | Leverage Ratio (#) | Payout Percentage Range (%) | ||
<86 | — | — | ||
86 | Threshold | 8 | ||
87 to 97 | 8.0 | 16-96 | ||
97.5 to 102.5 | Target | 100 | ||
103 to 120+ | 5.75 | 102.9-200 | ||
The following chart sets forth the SEICP leverage curve for Gross Authorization for 2019:
Achievement Relative to Annual Gross Authorization Target (%) | Leverage Ratio (#) | Payout Percentage Range (%) | ||
<75 | — | — | ||
75 | Threshold | 50 | ||
76 to 94 | 2.5 | 52.5-97.5 | ||
95 to 105 | Target | 100 | ||
106 to 125+ | 1.25 | 101.25-125 | ||
For 2019, the Compensation Committee established an Annual EBITDA Target of $955.9 million. The Adjusted EBITDA achieved was $930.5 million, or 97.3% of the Annual EBITDA Target. Under the SEICP leverage curve, this level of Adjusted EBITDA achievement relative to the Annual EBITDA Target, as adjusted by the Leverage Ratio, would have yielded a Payout Percentage of 96.0%. However, management recommended that the SEICP funding percentage be reduced in order to allow for a higher funding percentage for the bonus plan that applies to employees outside of the senior executive leadership team. For 2019, the Gross Authorization achieved was 91.3% of the Annual Gross Authorization Target. Under the SEICP leverage curve, this level of Gross Authorization achievement relative to the Annual Gross Authorization Target, as adjusted by the Leverage Ratio, yielded a Payout Percentage of 90.0%.
SEICP—Individual Qualitative Performance Awards
Under the SEICP, the “Individual Qualitative Performance Award” is defined as the product of: (a) the Named Executive Officer’s eligible earnings, (b) the Named Executive Officer’s target award percentage, (c) the Individual Qualitative Performance Award Weight and (d) the Individual Performance Factor. The Individual Qualitative Performance Award Weight was 15% for each of the Named Executive Officers other than Mr. Thakral, whose Individual Performance Factor under the SEICP was 50% (with respect to the 30% of his bonus target tied to the SEICP, which equals 15% of his total annual bonus target). The Individual Performance Factor reflects the Compensation Committee’s subjective assessment of each Named Executive Officer’s performance against their individual goals and objectives for the year and overall contributions to the Company (and for our Named Executive Officers, other than the Chief Executive Officer, in conjunction with recommendations made by the Chief Executive Officer).
151
The 2019 individual performance objectives for the Chief Executive Officer were established to support the Company’s overall strategic and financial objectives, and the performance objectives for each of the other Named Executive Officers were established to support the Company’s strategic objectives as well as to support the leadership and specific goals of their respective segments, business units or functional areas. The 2019 Individual Performance Factor for each of our Named Executive Officers was assigned based on their performance against his pre-established individual performance goals as set forth below:
• | Mr. Simmons: The individual performance goals set for Mr. Simmons focused on his impact and leadership in driving the Company to meet its financial guidance and corporate and strategic objectives established for the year. Mr. Simmons’ goals included building supplemental commercial capabilities, continuing to improve authorizations and backlog growth, strengthening our core global clinical development capabilities, refining our laboratory services strategy and meeting key talent, culture, colleague engagement and organizational development objectives. |
• | Mr. Scully: The individual performance goals set for Mr. Scully focused on driving the Company’s financial and strategic performance through his leadership over the finance organization. Mr. Scully’s goals included improving authorization results, cost management, EBITDA and strengthening our core capabilities in financial operations. |
• | Mr. Sharbaugh: The individual performance goals set for Mr. Sharbaugh focused on driving the Company’s financial and strategic performance as well as the operational performance of the Clinical Development Services and Laboratory Services segments. Mr. Sharbaugh’s goals included maintaining quality and compliance standards, supporting the commercial selling effort for existing and new strategic partnerships, developing growth strategies for our core businesses and integrating the Company’s site and patient access delivery model. |
• | Mr. Thakral: The individual performance goals set for Mr. Thakral focused on driving the growth of our PPD Biotech model to support the Company’s financial and strategic performance. Mr. Thakral’s goals included achieving authorization goals and leading commercial selling efforts for existing and new PPD Biotech partnerships, developing business strategies and integrating the Company’s new service offerings into the commercial strategy. |
• | Mr. Hartman: The individual performance goals set for Mr. Hartman focused on various enterprise priorities, including optimizing our senior leadership governance structure, co-chairing the Talent and Culture Committee and overseeing the implementation of our leadership, talent and culture strategies. Mr. Hartman’s goals included driving efficiencies and cost savings in the corporate functions that report to him (Legal, Quality and Enterprise Learning, Human Resources, Corporate Communication and Privacy), including through the use of technology and automation. Mr. Hartman’s goals further included the continued oversight and implementation of the ongoing transformation of the Human Resources function. |
152
Annual Authorization Bonus for Executive Vice President, Global Head PPD Biotech
For 2019, in addition to his SEICP award, Mr. Thakral was entitled to the Annual Authorization Bonus pursuant to his employment agreement. The Annual Authorization Bonus for 2019 was equal to the product of (a) his annual base salary rate as of January 1, 2019 (which was $400,000), (b) his target award percentage of 52.5% and (c) the Annual Payout Percentage (as defined below). The Annual Payout Percentage for the Annual Authorization Bonus was determined under a predetermined authorization bonus leverage curve based on achievement against an “Annual Authorization Goal” set by our Chief Financial Officer, in consultation with our Chief Executive Officer, which goal was defined as the total dollar amount of authorizations for specified customer accounts added to the Company’s backlog during 2019 (the “Annual Payout Percentage”). The leverage curve operates in the same manner as under the SEICP, except there is no maximum Annual Payout Percentage under the Annual Authorization Bonus. Under this leverage curve, achievement of 100% of the Annual Authorization Goal yields a 100% Annual Payout Percentage. The Compensation Committee establishes the Gross Authorization Target so that the threshold performance level is reasonably likely to be achieved, while the target goal is more challenging but achievable. The following chart sets forth the leverage curve for Mr. Thakral’s Annual Authorization Bonus for 2019, as determined by the Compensation Committee:
Authorization Achievement Relative to Annual Authorization Goal (%) | Leverage Ratio (#) | Annual Payout Percentage Range (%) | ||
<90 | — | — | ||
90 | Threshold | 50.0 | ||
91 to 99 | 5.0 | 55.0-95.0 | ||
100 | — | 100.0 | ||
101 to 130 | 6.67 | 106.67-300.0 | ||
131+ | 1.0 | 301.0+ | ||
For 2019, the Annual Authorization achieved was 101.7% of the Authorization Target. Under the Annual Authorization Bonus leverage curve, this level of annual authorization achievement relative to the Annual Authorization Goal, as adjusted by the Leverage Ratio, yielded an Annual Payout Percentage of 111.3%.
2019 Incentive Compensation Awards
Actual amounts paid under the SEICP are calculated by multiplying each Named Executive Officer’s target incentive opportunity under the SEICP by the sum of (i) the weighted achievement factor for the Company Performance Award and (ii) the weighted achievement factor for the Individual Performance Award. Actual amounts paid under the Annual Authorization Bonus are calculated by multiplying Mr. Thakral’s target incentive opportunity under the Annual Authorization Bonus by the annual payout percentage. The following table illustrates the calculation of the 2019 annual cash incentive awards payable to each of our Named Executive Officers under the SEICP and, with respect to Mr. Thakral, the Annual Authorization Bonus.
Name | 2019 Bonus Eligible Earnings ($) | Target Bonus Opportunity (%) | Target Bonus Opportunity ($) | Combined Weighted Achievement Factor (%) | Actual Payout ($) | ||||||||
David Simmons | 1,566,720 | 100.0 | 1,566,720 | 92.3 | 1,445,299 | ||||||||
Christopher G. Scully | 495,000 | 75.0 | 371,250 | 92.3 | 342,478 | ||||||||
William J. Sharbaugh | 520,802 | 90.0 | 468,722 | 90.0 | 421,849 | ||||||||
Anshul Thakral | |||||||||||||
SEICP | 403,958 | 22.5 | 90,891 | 105.0 | 95,435 | ||||||||
Annual Authorization Bonus | 400,000 | 52.5 | 210,000 | 111.3 | 233,814 | ||||||||
B. Judd Hartman | 452,862 | 50.0 | 226,431 | 95.5 | 216,242 | ||||||||
153
Long-Term Equity Incentive Compensation
In addition to base salary and annual incentive compensation, each of our Named Executive Officers is provided long-term equity incentive compensation. The use of long-term equity incentives creates a link between executive compensation and our long-term performance, thereby creating alignment between executive and stockholder interests. In 2017, following the recapitalization, our board of directors and our stockholders approved the 2017 Plan, which provided the flexibility to grant a variety of long-term equity incentive awards, including stock options, restricted stock, restricted stock units and other stock-based awards.
Certain of our Named Executive Officers, along with other key employees, were granted options to purchase shares of our common stock under the 2017 Plan at the time of the recapitalization or, if later, at the commencement of their employment with the Company (including in 2018 with respect to Mr. Scully) or their promotion (including an additional grant in each of 2018 and 2019 with respect to Mr. Thakral), and were eligible to receive additional awards of stock options or other equity or equity-based awards under the 2017 Plan at the discretion of the Compensation Committee. Since the recapitalization, we have not made annual or regular equity grants to our Named Executive Officers or other key employees.
Each of our Named Executive Officers has received grants of stock options under the 2017 Plan pursuant to one or more stock option agreements. The options granted to our Named Executive Officers consist of the following proportions of time-vesting stock options (the “Time Options”), EBITDA performance-vesting stock options (the “EBITDA Options”) and realization event options (the “Realization Event Options”) (or in the case of Mr. Simmons, liquidity event options, the “Liquidity Event Options,” together with the Realization Event Options, and the EBITDA Options, the “Performance-Based Options”):
Name | Time Option Percentage (%) | EBITDA Option Percentage (%) | Liquidity Event/Realization Event Option Percentage (%) | |||
David Simmons | 39.73 | 39.73 | 20.54 | |||
Christopher G. Scully | 41.67 | 41.67 | 16.66 | |||
William J. Sharbaugh | 38.89 | 38.89 | 22.22 | |||
Anshul Thakral | 33.56 | 33.56 | 32.88 | |||
B. Judd Hartman | 31.73 | 31.73 | 36.54 | |||
For further discussion of the vesting and other terms of our outstanding options, see “—Narrative Disclosure to Summary Compensation Table and Grants of Plan-Based Awards Table—Terms of Equity Awards.”
2019 Cash Dividends
In May 2019, our board of directors declared and paid a cash dividend of $3.89 per share of the Company’s outstanding common stock (the “May 2019 Dividend”). Under the terms of the 2017 Plan, an adjustment to the then outstanding Time Options and Performance-Based Options was determined to be equitable and necessary in order to prevent the dilution or enlargement of benefits under the 2017 Plan. Therefore, in connection with the May 2019 Dividend, we treated the stock options then held by all employees, including our Named Executive Officers, as follows:
• | With respect to Time Options (both vested and unvested) and EBITDA Options (vested only), the Named Executive Officers were each entitled to a payment in an amount equal to (x) the number of shares underlying such Time Options and EBITDA Options multiplied by (y) the May 2019 Dividend amount, less applicable tax withholdings, and payable in accordance with the following schedule: |
◦ | 1/3 of such payment was paid in May 2019; |
◦ | 1/3 of such payment will be paid to the applicable Named Executive Officer in September 2020, subject to (x) the applicable Named Executive Officer’s continued employment through such date and (y) the accelerated vesting provisions included in the applicable option agreement; and |
◦ | 1/3 of such payment will be paid to the applicable Named Executive Officer in September 2021, subject to (x) the applicable Named Executive Officer’s continued employment through such date and (y) the accelerated vesting provisions included in the applicable option agreement. |
• | With respect to outstanding unvested Performance-Based Options, we reduced the per share exercise prices of such options by the per share May 2019 Dividend amount. |
154
As of December 31, 2019, the remaining unpaid stock option bonuses for our Named Executive Officers were as follows: Mr. Simmons—$6,478,371; Mr. Scully—$994,863; Mr. Sharbaugh—$1,676,386; Mr. Thakral—$572,162; and Mr. Hartman—$598,710.
In November 2019, our board of directors declared and paid a cash dividend of $0.57 per share of the Company’s outstanding common stock (the “November 2019 Dividend”). Under the terms of the 2017 Plan, an adjustment to the then outstanding Time Options and Performance-Based Options was determined to be equitable and necessary in order to prevent the dilution or enlargement of benefits under the 2017 Plan. Therefore, in connection with the November 2019 Dividend, we treated the stock options then held by all employees, including our Named Executive Officers, as follows:
• | With respect to Time Options (both vested and unvested) and EBITDA Options (vested only), the Named Executive Officers were each entitled to a payment in an amount equal to (x) the number of shares underlying such Time Options and EBITDA Options multiplied by (y) the November 2019 Dividend amount, less applicable tax withholdings, and such payment was made in December 2019. |
• | With respect to outstanding unvested Performance-Based Options, we reduced the per share exercise prices of such options by the per share November 2019 Dividend amount. |
In accordance with FASB Accounting Standards Codification Topic 718, Compensation—Stock Compensation (“ASC Topic 718”), changes to the stock options required in connection with each of the May 2019 Dividend and the November 2019 Dividend were accounted for as modifications. Under ASC Topic 718, only the modifications to the Time Options and the vested EBITDA Options resulted in incremental compensation expense and incremental fair value. In accordance with the SEC’s disclosure rules, such incremental fair value for each of our Named Executive Officers is reflected in the “Option Awards” column of the Summary Compensation Table below.
Other Compensation
Benefits
We provide various employee benefit programs to our Named Executive Officers, including medical, dental, vision, life insurance, accidental death & dismemberment insurance, short-term disability, long-term disability, flexible spending accounts, wellness programs and various other voluntary benefit programs. These benefit programs are generally available to all of our U.S.-based employees.
Defined Contribution Plan
We maintain a defined contribution plan that is tax-qualified under Section 401(k) of the Internal Revenue Code of 1986, as amended (the “Code”), and that we refer to as the “401(k) Retirement Savings Plan” or the “401(k) Plan.” The 401(k) Plan is offered on a nondiscriminatory basis to our full-time regular employees, including our Named Executive Officers, and our eligible part-time and temporary employees. Subject to certain limitations imposed by the Code, the 401(k) Plan permits eligible employees to defer receipt of portions of their eligible compensation by making contributions, including after-tax Roth contributions and catch-up contributions.
Matching contributions to the 401(k) Plan are made in an amount equal to 50% of each participant’s pre-tax contribution (up to a maximum of 3% of the participant’s annual eligible earnings), subject to certain other limits. Participants are 100% vested in their individual contributions and vest 25% per year of credited vesting service in the matching contributions until they are 100% vested in matching contributions at the completion of the fourth year of credited vesting service. Participants receive one year of vesting service for each plan year in which they have at least 1,000 hours of service.
The Compensation Committee believes that matching contributions assist us in attracting and retaining talented employees and executives. The 401(k) Plan provides an opportunity for participants to save money for retirement on a tax-deferred basis and to achieve financial security, thereby promoting retention.
155
Perquisites and Other Benefits
In part because our headquarters is located in Wilmington, North Carolina, which is not a major commercial airport hub, and to increase the efficiency of our executives by helping them avoid the delays of commercial air travel and maximize the use of their time, we own a corporate airplane. We have a corporate airplane policy that provides guidelines for the use of any airplane owned, leased or operated by the Company, and is intended to ensure the efficient operation of the airplane. Under their Employment Agreements (as defined below), our Chief Executive Officer and Chief Operating Officer are entitled to use the corporate airplane for personal use up to 20,000 miles per year and 10,000 miles per year, respectively. If we do not own an airplane for any period of time, Mr. Sharbaugh is entitled to receive $25,000 per year, prorated for any partial year that we do not own an airplane. In addition, family members of our Named Executive Officers may, in limited circumstances, accompany them on business travel on our airplane. The aggregate incremental cost associated with personal use of our airplane by our Named Executive Officers in 2019 is included in the Summary Compensation Table below and detailed in the footnotes to that table.
In addition, the Company provides relocation benefits to newly hired executives consistent with our relocation policy. The benefits we provide to our Named Executive Officers are reflected in the “All Other Compensation” column of the Summary Compensation Table and the accompanying footnote.
Tax and Accounting Implications
The Compensation Committee operates its compensation programs with the good faith intention of complying with Section 409A of the Code. We account for equity-based payments with respect to our long-term equity incentive award programs in accordance with the requirements of ASC Topic 718.
Actions Taken in Connection with the IPO
2019 Recognition Awards
In recognition of their leadership and performance during 2019 in connection with our IPO, Messrs. Scully and Hartman each received a special cash recognition award of $75,000. In addition, on December 30, 2019, the Compensation Committee granted Mr. Hartman a special equity recognition award of Time Options and EBITDA Options with an aggregate grant date fair value of $87,782.
2020 Incentive Plan
In connection with the IPO, our board of directors adopted, and our stockholders approved, the 2020 Incentive Plan, which allows us to implement a new market-based long-term incentive program to align our executive compensation package with similarly situated public companies.
Clawback Policy
In connection with the IPO, we have adopted a clawback policy for incentive compensation. The Compensation Committee determined that it may be appropriate to recover annual and/or long-term incentive compensation in specified situations. Under the policy, if the Compensation Committee determines that incentive compensation of its current and former Section 16 officers (or any other current and former employee designated by the board of directors or the Compensation Committee) was overpaid, in whole or in part, as a result of a restatement of the reported financial results of the Company or any of its segments due to material non-compliance with financial reporting requirements (unless due to a change in accounting policy or applicable law), and such restatement was caused or contributed, directly or indirectly, by such employee’s fraud, willful misconduct or gross negligence, then the Compensation Committee will determine, in its discretion, whether to seek to recover or cancel any overpayment of incentive compensation paid or awarded based on the inaccurate financial information or restated results. The clawback policy and our 2020 Incentive Plan also provide that if a covered person engages in any detrimental activity (as defined in our 2020 Incentive Plan) as determined by the Compensation Committee, the Compensation Committee may, in its sole discretion, provide for one or more of the following: (i) cancellation of any or all of such covered person’s outstanding awards; or (ii) forfeiture by the covered person of any gain realized on the vesting or exercise of awards, and prompt repayment of any such gain to us.
156
Compensation Committee Report
The compensation committee has reviewed and discussed the Compensation Discussion and Analysis with management. Based on its review and discussion with management, the compensation committee recommended to the board of directors that the Compensation Discussion and Analysis be included in this Annual Report on Form 10-K for the fiscal year ended December 31, 2019.
Submitted by the compensation committee of our board of directors:
P. Hunter Philbrick (Chair)
Jeffrey B. Kindler
Maria Teresa Hilado
Stephen H. Wise
Summary Compensation Table
The following table summarizes the total compensation paid or accrued by the Named Executive Officers for fiscal 2019 and 2018.
SUMMARY COMPENSATION TABLE
Name and Principal Position | Year | Salary ($) | Bonus ($) | Option Awards ($)(1) | Non-Equity Incentive Plan Compensation ($)(2) | All Other Compensation ($)(3) | Total ($)(7) | |||||||||||||
David Simmons | 2019 | 1,566,720 | — | 4,540,218 | 1,445,299 | 107,602 | 7,659,839 | |||||||||||||
Chairman and Chief Executive Officer | 2018 | 1,566,720 | — | — | 1,488,384 | 37,976 | 3,093,080 | |||||||||||||
Christopher G. Scully | 2019 | 495,000 | 75,000 | 689,183 | 342,478 | 8,400 | 1,610,061 | |||||||||||||
Executive Vice President and Chief Financial Officer | 2018 | 290,654 | 400,000 | 3,187,399 | — | 90,942 | 3,968,995 | |||||||||||||
William J. Sharbaugh | 2019 | 521,662 | — | 1,174,857 | 421,849 | 47,305 | 2,165,673 | |||||||||||||
Chief Operating Officer | 2018 | 507,291 | — | — | 389,980 | 37,124 | 934,395 | |||||||||||||
Anshul Thakral | 2019 | 408,356 | — | 697,152 | 329,249 | 8,400 | 1,443,157 | |||||||||||||
Executive Vice President, Chief Commercial Officer | 2018 | 345,000 | — | 108,503 | 607,157 | 8,250 | 1,068,910 | |||||||||||||
B. Judd Hartman | 2019 | 453,462 | 75,000 | 507,374 | 216,242 | 8,400 | 1,260,478 | |||||||||||||
Executive Vice President, General Counsel and Chief Administrative Officer | 2018 | 432,760 | — | — | 209,889 | 8,250 | 650,899 | |||||||||||||
_________
(1) | As described in “Compensation Discussion and Analysis—2019 Cash Dividends,” changes to the stock options required in connection with the May 2019 Dividend and the November 2019 Dividend were accounted for as modifications under ASC Topic 718. Amounts reported for 2019 reflect the incremental fair values calculated in accordance with ASC Topic 718 with respect to each dividend for each of our Named Executive Officers as follows: |
Named Executive Officer | May 2019 Dividend | November 2019 Dividend | ||||||
David Simmons | $ | 4,361,137 | $ | 179,081 | ||||
Christopher G. Scully | 661,469 | 27,714 | ||||||
William J. Sharbaugh | 1,128,517 | 46,340 | ||||||
Anshul Thakral | 388,154 | 16,495 | ||||||
B. Judd Hartman | 403,042 | 16,550 | ||||||
In addition, the amounts reported for each of Messrs. Thakral and Hartman include the aggregate grant date fair values, determined in accordance with ASC Topic 718, of $292,503 and $87,782, respectively, for their option awards granted in 2019.
Amounts reported for 2018 and 2019 represent the aggregate grant date fair value of option awards determined in accordance with ASC Topic 718. The Realization Event Options granted in 2018 and 2019 are subject to market conditions and an implied performance condition as defined under applicable accounting standards. The grant date fair values of the Realization Event Options and EBITDA Options were computed based on the probable outcome
157
with respect to performance, which assumes target-level EBITDA achievement, the highest level of performance, for the EBITDA Options. Achievement of the performance conditions for the Realization Event Options was not deemed probable on the applicable grant date and, accordingly, no value is included in the table for these awards pursuant to the SEC’s disclosure rules. Assuming achievement of the performance conditions, the grant date fair values of the Realization Event Options were $637,482 for Mr. Scully, $108,503 for Mr. Thakral’s 2018 grant and $146,251 for Mr. Thakral’s 2019 grant. Refer to Note 4, “Stock-Based Compensation,” of our audited consolidated financial statements included elsewhere in this Annual Report on Form 10-K for information regarding the assumptions used to value these awards.
(2) | Amounts reported for 2019 represent the 2019 annual cash incentive awards earned pursuant to our SEICP (and Mr. Thakral’s Annual Authorization Bonus). Amounts reported for 2018 represent awards earned pursuant to our SEICP in 2018. For Mr. Thakral, the amount also includes his Annual Authorization Bonus. Mr. Scully, our Chief Financial Officer who commenced service in May 2018, received a fixed bonus of $225,000 in lieu of his participation in the SEICP for 2018, which is included in the “Bonus” column for 2018. Effective beginning in 2019, Mr. Scully’s Employment Agreement provides for a targeted annual cash bonus of 75% of annual base salary under the SEICP. For additional information, see “—Compensation Discussion and Analysis—2019 Annual Cash Incentive Compensation.” |
(3) | Other compensation includes the amounts set forth in the following table: |
Name | Year | Employer Contribution to 401(k) ($) | Relocation Benefits ($)(a) | Company Aircraft ($)(b) | Total ($) | |||||||||
David Simmons. | 2019 | 8,400 | — | 99,202 | 107,602 | |||||||||
2018 | 8,250 | — | 29,726 | 37,976 | ||||||||||
Christopher G. Scully. | 2019 | 8,400 | — | — | 8,400 | |||||||||
2018 | 4,950 | 85,992 | — | 90,942 | ||||||||||
William J. Sharbaugh | 2019 | 8,400 | — | 38,905 | 47,305 | |||||||||
2018 | 8,250 | — | 28,874 | 37,124 | ||||||||||
Anshul Thakral | 2019 | 8,400 | — | — | 8,400 | |||||||||
2018 | 8,250 | — | — | 8,250 | ||||||||||
B. Judd Hartman | 2019 | 8,400 | — | — | 8,400 | |||||||||
2018 | 8,250 | — | — | 8,250 | ||||||||||
_________
(a) | Amount represents payments to Mr. Scully as reimbursement for relocation expenses, which was subject to repayment in the event of Mr. Scully’s resignation without good reason or termination by the Company for cause (each as defined in his Employment Agreement discussed below), in either case prior to May 15, 2019. |
(b) | Amounts represent the aggregate incremental cost of personal use of our airplane. Incremental costs include fuel costs, crew travel expenses, passenger catering expenses, trip-related maintenance costs, landing and facility fees, trip-related hangar and parking costs and other similar variable costs. In 2018 and 2019, Mr. Simmons used our airplane for personal use for a total of 4,114 and 15,676 miles, respectively. In 2018 and 2019, Mr. Sharbaugh used our airplane for personal use for a total of 4,676 and 5,466 miles, respectively. In addition, family members of each of Messrs. Simmons and Scully have, in limited circumstances, accompanied them on business travel on our airplane for which we incurred de minimis incremental costs. |
(4) | Mr. Scully commenced employment with the Company in May 2018. Amount represents the portion of Mr. Scully’s annual base salary paid to him in 2018. |
(5) | Amounts reported for 2019 represent the special cash recognition awards paid to Messrs. Scully and Hartman. Amount reported for 2018 represents Mr. Scully’s sign-on bonus payment of $175,000 paid to him at the time he commenced employment with the Company in May 2018, which was subject to repayment in the event of Mr. Scully’s resignation without good reason or termination by us for cause, in either case prior to May 15, 2019, and a fixed bonus of $225,000 paid to him in March 2019, in lieu of his participation in the SEICP for 2018. |
(6) | Mr. Thakral’s annual base salary was increased from $400,000 to $450,000, effective November 1, 2019. |
Grants of Plan-Based Awards in 2019
The following table provides information with respect to (a) grants of non-equity incentive awards to our Named Executive Officers during the 2019 fiscal year under the SEICP, and with respect to Mr. Thakral, under his Annual Authorization Bonus and (b) grants of stock options during 2019 under the 2017 Plan to (i) Mr. Thakral in connection with his promotion to Executive Vice President, Chief Commercial Officer and (ii) Mr. Hartman, in connection with his special equity recognition award. We did not grant equity awards to any of our other Named Executive Officers in 2019.
158
GRANTS OF PLAN-BASED AWARDS
Estimated Future Payouts Under Non-Equity Incentive Plan Awards(1) | Estimated Future Payouts Under Equity Incentive Plan Awards | All Other Option Awards: Number of Securities Underlying Options (#) | Exercise or Base Price of Option Awards ($/Sh) | Grant Date Fair Value of Stock and Option Awards($) (4) | ||||||||||||||||||||||||||
Name | Grant Date | Threshold ($)(2) | Target ($) | Maximum ($) | Threshold (#)(3) | Target (#) | Maximum (#) | |||||||||||||||||||||||
David Simmons 2019 SEICP | — | 75,203 | 1,566,720 | 2,604,672 | ||||||||||||||||||||||||||
Christopher G. Scully 2019 SEICP | — | 17,820 | 371,250 | 617,203 | ||||||||||||||||||||||||||
William J. Sharbaugh 2019 SEICP | — | 22,499 | 468,722 | 779,250 | ||||||||||||||||||||||||||
Anshul Thakral 2019 SEICP | — | 3,636 | 90,891 | 136,338 | ||||||||||||||||||||||||||
Annual Authorization Bonus | — | 105,000 | 210,000 | — | ||||||||||||||||||||||||||
Time Options | 11/26/2019 | 23,041 | 21.70 | 146,251 | ||||||||||||||||||||||||||
EBITDA Options | 11/26/2019 | 2,304 | 23,041 | — | 21.70 | 146,251 | ||||||||||||||||||||||||
Realization Event Options | 11/26/2019 | — | 23,041 | — | 21.70 | — | ||||||||||||||||||||||||
B. Judd Hartman 2019 SEICP | — | 12,680 | 226,431 | 393,424 | ||||||||||||||||||||||||||
Time Options | 12/30/2019 | 6,912 | 21.70 | 43,891 | ||||||||||||||||||||||||||
EBITDA Options | 12/30/2019 | 691 | 6,912 | 21.70 | 43,891 | |||||||||||||||||||||||||
_________
(1) | The amounts reported in these columns reflect the cash incentive award opportunity range under our SEICP and, for Mr. Thakral, under his Annual Authorization Bonus, for 2019, the terms of which are summarized under “—Compensation Discussion and Analysis—2019 Annual Cash Incentive Compensation” above. |
(2) | For purposes of this table, the “Threshold” amount shown for the SEICP represents an assumption that the Named Executive Officer only earns the threshold payout under the EBITDA Performance Award, and the Company did not achieve the threshold level for the Gross Authorization Performance Award and there was no payout under the Individual Qualitative Performance Award. |
(3) | For the EBITDA Options, amount reported in the “Threshold” column assumes that 10% of the EBITDA Options granted will vest. |
(4) | The amounts reported for Mr. Thakral under “Time Options,” “EBITDA Options” and “Realization Event Options” represent the grant date fair values of such options granted to Mr. Thakral in 2019. The amounts reported for Mr. Hartman under “Time Options” and “EBITDA Options” represent the grant date fair values of such options granted to Mr. Hartman in 2019. The grant date fair values of the EBITDA Options and Realization Event Options are based on the probable outcome of the performance conditions. See footnote 1 to the Summary Compensation Table. |
Narrative Disclosure to Summary Compensation Table and Grants of Plan-Based Awards Table
Employment Agreements with Named Executive Officers
The following are the material provisions of the employment agreements for each of the Named Executive Officers (collectively, the “Employment Agreements”).
Employment Agreement with David Simmons
Pharmaceutical Product Development, LLC and our predecessor entity, Jaguar Holding Company I, entered into an Employment Agreement with Mr. Simmons on May 17, 2012 (which was subsequently assigned to, and assumed by, the Company on May 11, 2017 and amended pursuant to that Amendment No. 1, dated April 1, 2018, as amended, the “Simmons Employment Agreement”) pursuant to which Mr. Simmons serves as our Chief Executive Officer and the chairman of our board of directors. The Simmons Employment Agreement is extended automatically on December 31 of each year for successive 12-month periods unless either party delivers notice of non-renewal to the other no later than 60 days before the end of the applicable term. The Simmons Employment Agreement provides that Mr. Simmons’ base salary may not be decreased without his consent and sets forth his target bonus amount for his annual cash bonus award opportunity, as reflected in the discussion above. During his employment and for 24 months following termination, Mr. Simmons’ employment agreement prohibits him from competing with our business and from soliciting our employees, customers or suppliers to terminate their employment or arrangements with the Company. Mr. Simmons is also party to a proprietary information agreement which contains a perpetual confidentiality covenant and an IP assignment provision in favor of the Company. The severance provisions contained in Mr. Simmons’ employment agreement are described below under “—Potential Payments Upon Termination or Change in Control—Severance Benefits Upon Termination.”
159
Employment Agreements with other Named Executive Officers
Our other Named Executive Officers have Employment Agreements (each, as amended and/or restated, a “Named Executive Officer Employment Agreement”) as follows:
• | On May 2, 2018, Pharmaceutical Product Development, LLC and the Company entered into a Named Executive Officer Employment Agreement with Mr. Scully, effective for employment as of May 15, 2018, pursuant to which Mr. Scully serves as our Executive Vice President and Chief Financial Officer; |
• | On April 10, 2012, Pharmaceutical Product Development, LLC and Jaguar Holding Company I entered into a Named Executive Officer Employment Agreement with Mr. Sharbaugh, which was subsequently amended pursuant to that Amendment No. 1, dated February 10, 2016, assigned to, and assumed by, the Company on May 11, 2017 and further amended pursuant to that Amendment No. 2, dated March 1, 2019 pursuant to which Mr. Sharbaugh serves as our Chief Operating Officer; |
• | On April 10, 2012, Pharmaceutical Product Development, LLC and Jaguar Holding Company I entered into a Named Executive Officer Employment Agreement with Mr. Hartman which was subsequently amended pursuant to that Amendment No. 1, dated February 10, 2016, assigned to, and assumed by, the Company on May 11, 2017 and further amended pursuant to that Amendment No. 2, dated April 1, 2018, and that Amendment No. 3, dated December 18, 2019, pursuant to which Mr. Hartman serves as our Executive Vice President, General Counsel and Chief Administrative Officer; and |
• | On June 15, 2016, Pharmaceutical Product Development, LLC and Jaguar Holding Company I entered into a Named Executive Officer Employment Agreement with Mr. Thakral, effective as of June 27, 2016, which was subsequently amended pursuant to that Amendment No. 1, dated September 28, 2016, assigned to, and assumed by, the Company on May 11, 2017 and further amended pursuant to that Amendment No. 2, dated April 1, 2018 and that Amendment No. 3 dated January 1, 2019, pursuant to which Mr. Thakral served as our Executive Vice President, Global Head of PPD Biotech. On November 26, 2019, Pharmaceutical Product Development, LLC and the Company entered into an amended and restated Named Executive Officer Employment Agreement with Mr. Thakral, effective as of November 1, 2019, which supersedes his then-existing Named Executive Officer Employment Agreement and pursuant to which Mr. Thakral serves as our Executive Vice President and Chief Commercial Officer. |
Mr. Scully’s Named Executive Officer Employment Agreement has an initial term which will expire on December 31, 2021 and will extend automatically for successive 12-month periods thereafter unless either party delivers a notice of non-renewal to the other no later than 60 days before the end of the applicable term. Each other Named Executive Officer Employment Agreement is extended automatically on December 31 each year for successive 12-month periods (except for Mr. Thakral whose Named Executive Officer Employment Agreement is extended automatically on June 27 of each year) unless either party delivers notice of non-renewal to the other no later than 60 days before the end of the applicable term. Each Named Executive Officer Employment Agreement provides that the base salary of the applicable Named Executive Officer may not be decreased without his consent and sets forth his target bonus amount for his annual cash bonus award opportunity, as reflected in the discussion above. Each Named Executive Officer Employment Agreement provides that during the employment of the applicable Named Executive Officer and for 18 months following termination thereof, such Named Executive Officer is prohibited from competing with our business and from soliciting our employees, customers or suppliers to terminate their employment or arrangements with the Company. Each Named Executive Officer is also party to a proprietary information agreement which contains a perpetual confidentiality covenant and an IP assignment provision in favor of the Company. The severance provisions contained in the Named Executive Officer Employment Agreements are described below under “—Potential Payments Upon Termination or Change in Control—Severance Benefits Upon Termination.”
Terms of Equity Awards
Time Options
Each Named Executive Officer received Time Options pursuant to their respective option agreements. The Time Options vest and become exercisable in five equal annual installments on the first five anniversaries of the date of grant or vesting reference date, subject to the applicable Named Executive Officer’s continued employment with the Company on each applicable vesting date.
160
EBITDA Options
Each Named Executive Officer received EBITDA Options pursuant to their respective option agreements. The EBITDA Options vest in five equal annual installments on December 31 of each year, subject to our attainment of a predetermined EBITDA (as defined in the option agreement) target for the applicable year and become exercisable on the date our Compensation Committee determines whether such EBITDA target has been attained, subject to the Named Executive Officer’s continued employment on December 31 of the applicable year. Actual EBITDA attained for the applicable year must be equal to or greater than 90.0% of the EBITDA target for any portion of the annual installment to vest. The annual installment will vest at 50.0% of the EBITDA Options if 90% of the EBITDA target is achieved; for each 1% increase in EBITDA achievement over 90.0%, the annual installment vesting percentage will increase by 5.0% up to a maximum of 100%. To the extent all or a portion of the installment of EBITDA Options scheduled to vest for any year do not vest due to failure to attain the EBITDA target described above, the unvested EBITDA Options from that installment are eligible for catch-up vesting in a future year upon attainment of the EBITDA target for that future year. The EBITDA target for the 2019 vesting installment was $828.8 million. Actual EBITDA achieved in 2019 was $821.3 million, or 99.1% of the 2019 EBITDA target, which resulted in the 2019 vesting installment to vest at 95.0%.
Realization Event Options and Liquidity Event Options
Each Named Executive Officer (other than Mr. Simmons and with respect to his 2019 grant, Mr. Hartman) received Realization Event Options pursuant to their respective option agreements and Mr. Simmons received Liquidity Event Options pursuant to his option agreement. The Realization Event Options and Liquidity Event Options held by our Named Executive Officers, as applicable, vest and become exercisable in the event our Sponsors receive proceeds (i) of at least 2.3 times their investment in our common stock and (ii) that result in an annual, compounded pre-tax internal rate of return of at least 15% on their investment (with respect to Mr. Simmons, a “Simmons Liquidity Event” and with respect to each other Named Executive Officer, a “Realization Event”). In addition, in the case of Mr. Simmons, if a Simmons Liquidity Event or, in the case of the other Named Executive Officers, a Change of Control Transaction (as defined in the Stockholder’s Agreement described below under “–Call Rights and Put Rights”), has not occurred prior to the third anniversary of the IPO, the Liquidity Event Options or the Realization Events, as applicable, will vest at such time if (i) the effective multiple on invested capital of our Sponsors’ investment in our common stock is at least the number 2.3 and (ii) our Sponsors’ effective annual, compounded pre-tax internal rate of return is at least 15% on their investment in our common stock.
Forfeiture and Acceleration
In connection with a termination for “cause” (as defined in the 2017 Plan) all unvested options will be immediately forfeited. In addition, other than the potential vesting that may occur in connection with certain termination or other events, all unvested options will be forfeited upon the Named Executive Officer’s termination of employment. Following certain termination or other events, the Named Executive Officers are entitled to accelerated vesting of their stock options as further described below under “—Potential Payments Upon Termination or Change in Control—Accelerated Vesting of Equity Awards.”
Exercise of Options
Vested options held by our Named Executive Officers may not be exercised to any extent by anyone after the first to occur of the following events: (i) the tenth anniversary of the date of grant of the options; (ii) except for such longer period of time as our Compensation Committee may otherwise approve, 90 days following such Named Executive Officer’s termination of employment for any reason other than cause, death or “disability” (as defined in the 2017 Plan) (or, in the case of options which vest following such termination of employment, 90 days following the date on which such options become vested); (iii) except as our Compensation Committee may otherwise approve, the Named Executive Officer’s termination of employment for cause; or (iv) except for such longer period of time as our Compensation Committee may otherwise approve, 12 months following the Named Executive Officer’s termination of employment by reason of the Named Executive Officer’s death or disability; provided, however, that with respect to any Time Options held by Mr. Simmons that vest as a result of the achievement of the EBITDA target for the EBITDA Options in the year in which such termination of employment occurs, the exercise period in clause (iv) would be extended until the first anniversary of the date on which our Compensation Committee certified achievement of such EBITDA target.
161
Call Rights and Put Rights
In connection with their initial equity awards, each of our Named Executive Officers became party to a stockholder’s agreement (the “Stockholder’s Agreement”). Pursuant to the Stockholder’s Agreement, the Company and our Sponsors have the right to repurchase the shares of our common stock (including those issued in respect of the exercise of options) held by our Named Executive Officers (i) in connection with any termination of employment, during the period beginning on the date of such termination of employment and ending on the first anniversary of the later of (x) the date of such termination of employment or (y) as applicable, the date of the last exercise of any options or (ii) in connection with any breach of the restrictive covenants applicable to such Named Executive Officer, during the period beginning on the date of such breach and ending on the first anniversary of such date (the “call right”).
The purchase price payable upon exercise of the call right is (i) in the event of a termination event other than a termination of employment by the Company for cause (as defined in the Stockholder’s Agreement), the fair market value of our common stock as of the date the call right is being exercised or (ii) in the event of any termination of employment by the Company for cause, or in connection with any breach of the restrictive covenants applicable to such Named Executive Officer, the lesser of (x) the fair market value of our common stock as of the date the call right is being exercised and (y) the aggregate purchase price paid for such shares of our common stock by such Named Executive Officer, as proportionately adjusted for any splits, reverse stock splits, combinations, recapitalizations or similar transactions. Notwithstanding the foregoing, the call right applicable to shares of our common stock held by Mr. Simmons terminated on the date of our IPO.
We have entered into a side letter to the Stockholder’s Agreement with each of our Named Executive Officers, which, in part, provides each of our Named Executive Officers with the right to cause the Company to repurchase all, or any portion of, the shares of our common stock held by such Named Executive Officer at fair market value following certain terminations of employment (the “put right”). For the one-year period following the applicable Named Executive Officer’s termination of employment (i) as a result of his death or disability, (ii) with respect to Messrs. Simmons, Sharbaugh and Hartman, by the Company without cause (as defined in the applicable Employment Agreement and with respect to Messrs. Sharbaugh and Hartman, solely with respect to shares of common stock issued to them in connection with the recapitalization), or (iii) with respect to Mr. Simmons, by him for good reason, the Named Executive Officer (or his guardian, executive, administrator or applicable trustee generally having control over the shares of common stock held by such Named Executive Officer) will have the right to exercise the put right. The put right for each Named Executive Officer will terminate on the first anniversary of the IPO.
162
Outstanding Equity Awards at 2019 Year End
The following table includes certain information with respect to stock options held by the Named Executive Officers as of December 31, 2019.
OUTSTANDING EQUITY AWARDS AT FISCAL YEAR END
Grant Date | Option Awards(1) | |||||||||||||||
Name | Number of Securities Underlying Unexercised Options (#) Exercisable | Number of Securities Underlying Unexercised Options (#) Unexercisable | Equity Incentive Plan Awards: Number of Securities Underlying Unexercised Unearned Options (#) | Option Exercise Price ($)(2) | Option Expiration Date | |||||||||||
David Simmons | ||||||||||||||||
Time Options(3) | 5/11/2017 | 590,878 | 1,156,316 | 15.05 | 5/11/2027 | |||||||||||
EBITDA Options(3) | 5/11/2017 | 751,605 | 15.05 | 5/11/2027 | ||||||||||||
EBITDA Options(3) | 5/11/2017 | 366,166 | 809,423 | 10.59 | 5/11/2027 | |||||||||||
Liquidity Event Options(3) | 5/11/2017 | 996,824 | 10.59 | 5/11/2027 | ||||||||||||
Christopher G. Scully | ||||||||||||||||
Time Options(4) | 6/21/2018 | 64,494 | 257,970 | 15.51 | 6/21/2028 | |||||||||||
EBITDA Options(4) | 6/21/2018 | 61,268 | 15.51 | 6/21/2028 | ||||||||||||
EBITDA Options(4) | 6/21/2018 | 61,269 | 199,927 | 11.05 | 6/21/2028 | |||||||||||
Realization Event Options(4) | 6/21/2018 | 128,986 | 11.05 | 6/21/2028 | ||||||||||||
William J. Sharbaugh | ||||||||||||||||
Time Options(3) | 5/11/2017 | 186,075 | 279,109 | 15.05 | 5/11/2027 | |||||||||||
EBITDA Options(3) | 5/11/2017 | 181,420 | 15.05 | 5/11/2027 | ||||||||||||
EBITDA Options(3) | 5/11/2017 | 88,384 | 195,379 | 10.59 | 5/11/2027 | |||||||||||
Realization Event Options(3) | 5/11/2017 | 265,819 | 10.59 | 5/11/2027 | ||||||||||||
Anshul Thakral | ||||||||||||||||
Time Options(3) | 5/11/2017 | 59,810 | 89,713 | 15.05 | 5/11/2027 | |||||||||||
EBITDA Options(3) | 5/11/2017 | 58,313 | 15.05 | 5/11/2027 | ||||||||||||
EBITDA Options(3) | 5/11/2017 | 28,409 | 62,801 | 10.59 | 5/11/2027 | |||||||||||
Realization Event Options(3) | 5/11/2017 | 132,909 | 10.59 | 5/11/2027 | ||||||||||||
Time Options(5) | 12/14/2018 | 2,572 | 10,281 | 19.45 | 12/14/2028 | |||||||||||
EBITDA Options(5) | 12/14/2018 | 2,443 | 10,410 | 14.99 | 12/14/2028 | |||||||||||
Realization Event Options(5) | 12/14/2018 | 25,707 | 14.99 | 12/14/2028 | ||||||||||||
Time Options(6) | 11/26/2019 | 23,041 | 21.70 | 11/26/2029 | ||||||||||||
EBITDA Options(6) | 11/26/2019 | 23,041 | 21.70 | 11/26/2029 | ||||||||||||
Realization Event Options(6) | 11/26/2019 | 23,041 | 21.70 | 11/26/2029 | ||||||||||||
B. Judd Hartman | ||||||||||||||||
Time Options(3) | 5/11/2017 | 66,456 | 99,681 | 15.05 | 5/11/2027 | |||||||||||
EBITDA Options(3) | 5/11/2017 | 64,793 | 15.05 | 5/11/2027 | ||||||||||||
EBITDA Options(3) | 5/11/2017 | 31,566 | 69,777 | 10.59 | 5/11/2027 | |||||||||||
Realization Event Options(3) | 5/11/2017 | 199,364 | 10.59 | 5/11/2027 | ||||||||||||
Time Options(7) | 12/30/2019 | 6,912 | 21.70 | 12/30/2029 | ||||||||||||
EBITDA Options(7) | 12/30/2019 | 6,912 | 21.70 | 12/30/2029 | ||||||||||||
163
___________
(1) | The detailed grant and vesting provisions of the options are discussed above in “—Narrative Disclosure to Summary Compensation Table and Grants of Plan-Based Awards Table—Terms of Equity Awards.” |
(2) | In connection with each of the May 2019 Dividend and the November 2019 Dividend, the exercise prices for then outstanding unvested Performance-Based Options were reduced by the per share May 2019 Dividend amount and the per share November 2019 Dividend amount, respectively. See “—2019 Cash Dividends.” |
(3) | Represents options granted to Messrs. Simmons, Sharbaugh, Thakral and Hartman in connection with the recapitalization. The remaining three annual installments of Time Options vest equally on May 11, 2020, 2021 and 2022, subject to each respective individual’s continued employment on each vesting date. A portion of the unvested Time Options granted to Mr. Simmons vested as of immediately prior to the IPO such that 50% of the total number of Time Options granted to Mr. Simmons were vested and exercisable as of immediately prior to the IPO. 95.0% of the vesting installment vested on December 31, 2019. The remaining two annual installments of EBITDA Options vest equally on December 31, 2020 and 2021, subject to attainment of the predetermined EBITDA target for the 2020 and 2021 fiscal years. The Liquidity Event Options granted to Mr. Simmons vest immediately prior to a Simmons Liquidity Event and the Realization Event Options granted to Messrs. Sharbaugh, Thakral and Hartman vest immediately prior to a Realization Event, each as described in more detail under “—Narrative Disclosure to Summary Compensation Table and Grants of Plan-Based Awards Table—Terms of Equity Awards” above. |
(4) | Represents options granted to Mr. Scully in connection with the commencement of his employment in May 2018. The remaining four annual installments of Time Options vest equally on May 15, 2020, 2021, 2022 and 2023, subject to his continued employment on each vesting date. 95.0% of the vesting installment vested on December 31, 2019. The remaining three annual installments of EBITDA Options vest equally on December 31, 2020, 2021 and 2022, subject to attainment of the predetermined EBITDA target for the 2020, 2021 and 2022 fiscal years. The Realization Event Options vest immediately prior to a Realization Event, as described in more detail under “—Narrative Disclosure to Summary Compensation Table and Grants of Plan-Based Awards Table—Terms of Equity Awards” above. |
(5) | Represents options granted to Mr. Thakral in connection with his promotion to Executive Vice President, Global Head of PPD Biotech, effective January 2019. The four remaining annual installments of Time Options vest equally on December 14, 2020, 2021, 2022 and 2023, subject to his continued employment on each vesting date. 95.0% of the vesting installment vested on December 31, 2019. The four annual installments of EBITDA Options vest equally on December 31, 2020, 2021, 2022 and 2023, subject to our attainment of the predetermined EBITDA target for the 2020, 2021, 2022 and 2023 fiscal years. The Realization Event Options vest immediately prior to a Realization Event, as described in more detail under “—Narrative Disclosure to Summary Compensation Table and Grants of Plan-Based Awards Table—Terms of Equity Awards” above. |
(6) | Represents options granted to Mr. Thakral in connection with his promotion to Executive Vice President, Chief Commercial Officer, effective November 2019. The five annual installments of Time Options vest equally on November 26, 2020, 2021, 2022, 2023 and 2024, subject to his continued employment on each vesting date. The five annual installments of EBITDA Options vest equally on December 31, 2020, 2021, 2022, 2023 and 2024, subject to our attainment of the predetermined EBITDA target for the 2020, 2021, 2022, 2023 and 2024 fiscal years. The Realization Event Options vest immediately prior to a Realization Event, as described in more detail under “—Narrative Disclosure to Summary Compensation Table and Grants of Plan-Based Awards Table—Terms of Equity Awards” above. |
(7) | Represents options granted to Mr. Hartman in connection with his special equity recognition award. The five annual installments of Time Options vest equally on December 30, 2020, 2021, 2022, 2023 and 2024, subject to his continued employment on each vesting date. The five annual installments of EBITDA Options vest equally on December 31, 2020, 2021, 2022, 2023 and 2024, subject to our attainment of the predetermined EBITDA target for the 2020, 2021, 2022, 2023 and 2024 fiscal years. |
Option Exercises and Stock Vested During Fiscal Year 2019
The following table includes information regarding the amounts received by our Named Executive Officers upon exercise of options during 2019.
Option Awards | ||||||
Name | Number of Shares Acquired on Exercise (#) | Value Realized on Exercise(1) ($) | ||||
David Simmons | 180,000 | 792,400 | ||||
Christopher G. Scully | — | — | ||||
William J. Sharbaugh | — | — | ||||
Anshul Thakral | — | — | ||||
B. Judd Hartman | — | — | ||||
__________
(1) | Represents the value of exercised options calculated by multiplying (i) the gross number of shares of our common stock acquired upon exercise by (ii) the excess of the per share fair market value of our common stock on the date of exercise, as determined by the most current valuation of our common stock prior to such exercise, over the exercise price of the option. |
164
Pension Benefits and Nonqualified Deferred Compensation
We do not offer any pension or nonqualified deferred compensation plans to our Named Executive Officers.
Potential Payments Upon Termination or Change in Control
Severance Benefits upon Termination
David Simmons
Pursuant to the terms of the Simmons Employment Agreement, upon our termination of Mr. Simmons’ employment without cause (as defined in the Simmons Employment Agreement) (which includes our non-extension of the term) or by Mr. Simmons for good reason, or due to his death or disability (each as defined in the Simmons Employment Agreement), subject to his timely execution, and non-revocation, of a general release of claims in our favor (except in the event of his death) and continued compliance with the restrictive covenants described above and in his proprietary information agreement, Mr. Simmons would be entitled to receive: (i) an amount in cash equal to the sum of (x) 2.0 times his annual base salary and (y) 1.5 times his annual target bonus, payable in regular installments over a 24-month period in accordance with our regular payroll practices, and (ii) monthly payments for up to a 24-month period equal to the COBRA premiums required to continue the group medical, dental and vision coverage in effect on the termination date for Mr. Simmons and his dependents. If such a termination occurs within two years following a change in control (as defined in the Simmons Employment Agreement), subject to Mr. Simmons’ timely execution, and non-revocation, of a general release of claims against the Company and continued compliance with the restrictive covenants described above and in his proprietary information agreement, he would be entitled to receive a lump-sum payment, instead of installment payments, equal to the sum of (x) 2.0 times his annual base salary and (y) 1.5 times his annual target bonus payable within 60 days of his termination of employment; provided that if such termination results from Mr. Simmons’ resignation due to him not becoming the Chief Executive Officer of the ultimate parent of any successor entity or division operating our business following the change in control, the lump-sum payment would be equal to the sum of (x) 1.0 times his annual base salary and (y) 1.0 times his annual target bonus. In the event of a transaction which would subject any payments, awards, benefits or distributions for the benefit of Mr. Simmons to the excise tax imposed by Section 4999 of the Code or any interest or penalties are incurred with respect to such excise tax by Mr. Simmons (such excise tax, together with any such interest and penalties, the “Excise Tax”), then Mr. Simmons will be entitled to receive a one-time reimbursement equal to the amount of the Excise Tax.
Other Named Executive Officers
Pursuant to the terms of the Named Executive Officer Employment Agreements, upon our termination of the applicable Named Executive Officer’s employment without cause (as defined in the applicable Named Executive Officer Employment Agreement) (which includes our non-extension of the term) or by the applicable Named Executive Officer for good reason (as defined in the applicable Named Executive Officer Employment Agreement), subject to his timely execution, and non-revocation, of a general release of claims in our favor and continued compliance with the restrictive covenants described above and in his proprietary information agreement, the applicable Named Executive Officer would be entitled to receive: (i) an amount in cash equal to (x) 1.5 times his annual base salary, payable in regular installments over an 18-month period in accordance with our regular payroll practices, and (y) a prorated portion of his annual target bonus for the year in which termination occurs, payable in a lump sum within 30 days of his termination of employment, and (ii) monthly payments for up to an 18-month period equal to the COBRA premiums required to continue the group medical, dental and vision coverage in effect on the termination date for the applicable Named Executive Officer and his dependents.
165
Assuming a termination of employment effective as of December 31, 2019 (i) by the Company without cause (including non-extension of the term), (ii) by the Named Executive Officer for good reason or (iii) due to the Named Executive Officer’s death or disability, each of the specified Named Executive Officers in the table below would have received the following severance payments and benefits:
Name | Payment Type | Termination Without Cause (Including Non-Extension of Term) ($) | Termination for Good Reason ($) | Termination due to Death or Disability ($) | |||||||
David Simmons | Cash Severance(1) | 5,483,520 | 5,483,520 | 5,483,520 | |||||||
Benefit Continuation(2) | 48,546 | 48,546 | 48,546 | ||||||||
Total | 5,532,066 | 5,532,066 | 5,532,066 | ||||||||
Christopher G. Scully | Cash Severance(3) | 1,113,750 | 1,113,750 | — | |||||||
Benefit Continuation(2) | 25,964 | 25,964 | — | ||||||||
Total | 1,139,714 | 1,139,714 | — | ||||||||
William J. Sharbaugh | Cash Severance(3) | 1,263,276 | 1,263,276 | — | |||||||
Benefit Continuation(2) | 37,007 | 37,007 | — | ||||||||
Total | 1,300,283 | 1,300,283 | — | ||||||||
Anshul Thakral | Cash Severance(3) | 1,012,500 | 1,012,500 | — | |||||||
Benefit Continuation(2) | 37,007 | 37,007 | — | ||||||||
Total | 1,049,507 | 1,049,507 | — | ||||||||
B. Judd Hartman | Cash Severance(3) | 913,485 | 913,485 | — | |||||||
Benefit Continuation(2) | 37,007 | 37,007 | — | ||||||||
Total | 950,492 | 950,492 | — | ||||||||
_________
(1) | Amount represents the sum of (i) 2.0 times annual base salary and (ii) 1.5 times the annual target bonus for 2019; however, if the resignation for good reason resulted from Mr. Simmons not becoming the Chief Executive Officer of the ultimate parent of any successor entity or division operating our business following a change in control, the amount would be equal to the sum of (i) 1.0 times annual base salary and (ii) 1.0 times the annual target bonus for 2019, or $3,133,440. |
(2) | Amounts represent monthly payments equal to the COBRA premiums required for continuation of group medical, dental and vision benefits for the Named Executive Officer and the Named Executive Officer’s dependents for up to 24 months for Mr. Simmons and 18 months for each of our other Named Executive Officers. |
(3) | Amount represents the sum of (i) 1.5 times annual base salary and (ii) 1.0 times the annual target bonus for 2019. |
Accelerated Vesting of Equity Awards
David Simmons
Pursuant to Mr. Simmons’ option agreements, his options are subject to vesting acceleration in the following circumstances:
Mr. Simmons – Qualifying Termination.
Time Options. Vesting of Mr. Simmons’ Time Options is partially accelerated upon his termination by the Company without cause, by him for good reason, or due to his death or disability, subject to his timely execution, and non-revocation, of a general release of claims in favor of the Company. Upon such termination, a prorated portion of the next installment of Time Options scheduled to vest following such termination will vest and become exercisable based on the number of days Mr. Simmons was employed from the date on which the last annual installment of Time Options vested to the termination date. In addition, if we determine that we attained the applicable EBITDA target for the EBITDA Options for the year of such termination, then, to the extent vesting of his Time Options has not already been accelerated, Mr. Simmons’ unvested Time Options that would have become vested had he remained employed through the first anniversary of such termination will vest and become exercisable.
166
EBITDA Options. With respect to Mr. Simmons’ termination by the Company without cause, or by him for good reason, subject to his timely execution, and non-revocation, of a general release of claims in favor of the Company, a prorated portion of the next installment of EBITDA Options scheduled to vest following such termination (including pursuant to any catch-up provision) will vest based on the number of days Mr. Simmons was employed during the applicable year, provided and to the extent that our Compensation Committee determines that the predetermined EBITDA target for the year of such termination has been achieved. Except in the event of a termination for cause, if Mr. Simmons’s employment is terminated following the end of a fiscal year, but prior to the date that our Compensation Committee has determined achievement with respect to the applicable EBITDA target for such fiscal year, Mr. Simmons’ EBITDA Options will remain eligible to vest and become exercisable on the date such determination is made to the extent our Compensation Committee has determined that the EBITDA target for such fiscal year has been achieved.
Liquidity Event Options. Upon Mr. Simmons’ termination by the Company without cause, or by him for good reason, a pro-rata portion of the Liquidity Event Options held by Mr. Simmons, based on the number of days Mr. Simmons was employed during the five-year period following the date of grant of the Options, will remain eligible to vest following such termination.
Mr. Simmons – Initial Public Offering.
Pursuant to Mr. Simmons’ option agreement, a portion of his unvested Time Options vested and became exercisable immediately prior to the IPO such that 50.0% of his Time Options were vested and exercisable as of immediately prior to the IPO. No other options vested solely in connection with the occurrence of the IPO.
Mr. Simmons – Performance Liquidity Event.
Under Mr. Simmons’ option agreement, the EBITDA Options held by Mr. Simmons vest and become exercisable immediately prior to our Sponsors’ receipt of proceeds (i) of at least 2.0 times their investment in our common stock and (ii) that result in an annual, compounded pre-tax internal rate of return of at least 17.5% on their investment ((i) and (ii), with respect to Mr. Simmons (a “Performance Liquidity Event”)). No other options are subject to accelerated vesting in connection with the occurrence of a Performance Liquidity Event.
Mr. Simmons – Change of Control Transaction.
Under Mr. Simmons’ option agreement, a Change of Control Transaction generally would occur if any person acquires at least 50% of our voting securities in a transaction or a series of related transactions, or we sold substantially all of our assets (other than to our Sponsors). A Change of Control Transaction could include a Performance Liquidity Event or a Simmons Liquidity Event, each of which is described above.
Time Options. Subject to Mr. Simmons remaining employed with the Company through such date, upon a Change of Control Transaction, all then-unvested Time Options will vest and become exercisable immediately prior to such transaction.
EBITDA Options. There is no accelerated vesting of EBITDA Options in connection with a Change of Control Transaction (except if such Change of Control Transaction constitutes a Performance Liquidity Event).
Liquidity Event Options. In the event that the Liquidity Event Options have not otherwise vested, in the event of a Change of Control Transaction on or prior to the fifth anniversary of the date of grant, if our Compensation Committee determines that both (i) the total enterprise value of the Company is greater than 14 times the EBITDA of the Company for the 12 months ending on the last day of the most recently completed calendar quarter of the Company prior to execution of the definitive agreement providing for such Change of Control Transaction and (ii) certain EBITDA thresholds were met in the most recently completed fiscal year prior to the fiscal year in which the Change of Control Transaction is completed, then 100% of Liquidity Event Options will vest.
In addition, in the event of Mr. Simmons’ termination of employment by the Company without cause, or by him for good reason, and either (i) a Change of Control Transaction or a transaction which would result in a Performance Liquidity Event or a Simmons Liquidity Event (a) with respect to which definitive transaction documents are executed prior to or within three months after the date of such termination of employment and (b) that is consummated within 12 months after the date of such termination of employment or (ii) an extraordinary dividend or distribution, regardless of whether any definitive transaction documents are executed, which would result in a Performance Liquidity Event or a Simmons Liquidity Event that occurs prior to or within three months after the date of such termination of employment, any portion of the Options that would otherwise have vested and become exercisable as a result of such event in (i) or (ii) above had he remained employed through the date of such event will vest and become exercisable as of such date, subject to his timely execution, and non-revocation, of a general release of claims in favor of the Company.
167
Other Named Executive Officers
Pursuant to our other Named Executive Officers’ option agreements, their options are subject to vesting acceleration in the following circumstances:
Other Named Executive Officers – Qualifying Termination.
Time Options. Vesting of each of the other Named Executive Officer’s Time Options is partially accelerated upon the Named Executive Officer’s termination by the Company without cause, or by the Named Executive Officer for good reason, subject to the Named Executive Officer’s timely execution, and non-revocation, of a general release of claims in favor of the Company. Upon such termination, a prorated portion of the next installment of Time Options scheduled to vest following such termination will vest and become exercisable based on the number of days the Named Executive Officer was employed from the date on which the last annual installment of Time Options vested to the termination date; provided, that to the extent such termination occurs before the first annual installment of Time Options has vested, the first annual installment of Time Options will vest and become exercisable on the date of such termination of employment.
EBITDA Options. With respect to each other Named Executive Officer, upon the Named Executive Officer’s termination by the Company without cause, or by the Named Executive Officer for good reason, subject to the Named Executive Officer’s timely execution, and non-revocation, of a general release of claims in favor of the Company, a pro-rated portion of the next installment of EBITDA Options scheduled to vest following such termination will vest based on the number of days the Named Executive Officer was employed during the applicable year, provided and to the extent that our Compensation Committee determines that the predetermined EBITDA target for the year of such termination has been achieved. In the event of a termination of the Named Executive Officer’s employment without cause or by the Named Executive Officer for good reason, in each case, following the end of a fiscal year, but prior to the date that our Compensation Committee has determined achievement with respect to the applicable EBITDA target for such fiscal year, subject to the Named Executive Officer’s timely execution, and non-revocation, of a general release of claims in favor of the Company, the annual installment for such fiscal year will remain eligible to vest and become exercisable on the date such determination is made to the extent our Compensation Committee has determined that the EBITDA target for such fiscal year has been achieved.
Realization Event Options. There is no accelerated vesting of Realization Event Options in connection with qualifying terminations of employment.
Other Named Executive Officers – Significant Sale.
Under each other Named Executive Officer’s option agreement, a Significant Sale generally would occur if our Sponsors sold more than 50% of their equity investment in the Company. A Significant Sale could include a Change of Control Transaction, a Liquidity Event, a Qualifying Sale (in each case, as described below) and/or a Realization Event. Upon the occurrence of a Significant Sale, if the total percentage of the Named Executive Officer’s vested Time Options is less than the percentage of our Sponsors’ investment sold in connection with the Significant Sale, then a portion of the Named Executive Officer’s unvested Time Options will vest and become exercisable immediately prior to the Significant Sale such that the total percentage of the Named Executive Officer’s vested Time Options is equal to the percentage of our Sponsors’ investment sold in connection with such Significant Sale. No other Options are subject to accelerated vesting in connection with the occurrence of a Significant Sale (except with respect to a Qualifying Sale, Liquidity Event, Realization Event or a Change of Control Transaction).
Other Named Executive Officers – Qualifying Sale.
Under each other Named Executive Officer’s option agreement, a Qualifying Sale generally would occur if our Sponsors sold more than 50% of their equity investment in the Company (i.e., a Significant Sale occurs) and, prior to or in connection with such sale, our Sponsors received proceeds (i) of at least 2.0 times their investment in our common stock and (ii) an annual, compounded pre-tax internal rate of return of at least 17.5% on their investment. A Qualifying Sale could include a Change of Control Transaction, a Liquidity Event or a Realization Event. Upon the occurrence of a Qualifying Sale, if the total percentage of the Named Executive Officer’s vested EBITDA Options is less than the percentage of our Sponsors’ investment sold in connection with the Qualifying Sale, then a portion of the Named Executive Officer’s unvested EBITDA Options will vest and become exercisable immediately prior to the Qualifying Sale such that the total percentage of the Named Executive Officer’s vested EBITDA Options is equal to the percentage of our Sponsors’ investment sold in connection with the Qualifying Sale. No other Options are subject to accelerated vesting in connection with the occurrence of a Qualifying Sale (except with respect to a Significant Sale, Liquidity Event, Realization Event or Change of Control Transaction).
168
Other Named Executive Officers – Liquidity Event.
Under each other Named Executive Officer’s option agreement, subject to the applicable Named Executive Officer remaining employed with the Company through such date, upon (i) our Sponsors having sold more than 70% of their equity investment in the Company or (ii) a sale of substantially all of our assets (other than to our Sponsors or one of their affiliates) (a “Liquidity Event”), all then-unvested Time Options will vest and become exercisable immediately prior to such event. No other Options are subject to accelerated vesting in connection with the occurrence of a Liquidity Event (except as set forth below with respect to the achievement of the Liquidity Hurdles).
Other Named Executive Officers – Liquidity Hurdle Achievement.
Under each other Named Executive Officer’s option agreement, the EBITDA Options held by our Named Executive Officers vest and become exercisable immediately prior to our Sponsors’ receipt of proceeds (i) of at least 2.0 times their investment in our common stock and (ii) that result in an annual, compounded pre-tax internal rate of return of at least 17.5% on their investment ((i) and (ii), the “Liquidity Hurdles”); provided, that such proceeds are received by our Sponsors in connection with a Liquidity Event. No other Options are subject to accelerated vesting in connection with the achievement of the Liquidity Hurdles in connection with a Liquidity Event.
Other Named Executive Officers – Change of Control Transaction.
Under the option agreements, a Change of Control Transaction generally would occur if any person acquires at least 50% of our voting securities in a transaction or a series of relate transactions, or we sold substantially all of our assets (other than to our Sponsors). A Change of Control Transaction could include a Significant Sale, Qualifying Sale, Liquidity Event or Realization Event, each of which are described above.
Time Options. Under each other Named Executive Officer’s option agreement, in the event of the Named Executive Officer’s termination by the Company without cause, by the Named Executive Officer for good reason or due to the Named Executive Officer’s death or disability, subject to the Named Executive Officer’s timely execution, and non-revocation, of a general release of claims in favor of the Company (except in the event of the Named Executive Officer’s death), in each case, on or following the occurrence of a Change of Control Transaction, all then-unvested Time Options shall vest and become exercisable as of the date such release of claims becomes effective and non-revocable.
EBITDA Options. There is no accelerated vesting of EBITDA Options in connection with a Change of Control Transaction (except if such Change of Control Transaction constitutes a Qualifying Sale or a Liquidity Event in which the Liquidity Hurdles are achieved).
Realization Event Options. In the event that the Realization Event Options have not otherwise vested, in the event of a Change of Control Transaction on or prior to the fifth anniversary of the date of grant, if our Compensation Committee determines that both (i) the total enterprise value of the Company is greater than 14 times the EBITDA of the Company for the 12 months ending on the last day of the most recently completed calendar quarter of the Company prior to execution of the definitive agreement providing for such Change of Control Transaction and (ii) certain EBITDA thresholds were met in the most recently completed fiscal year prior to the fiscal year in which the Change of Control Transaction is completed, then, except with respect to the Realization Event Options granted to Mr. Thakral in 2019, 100% of Realization Event Options will vest.
In addition, in the event of each other Named Executive Officer’s termination of employment by the Company without cause, or by such Named Executive Officer for good reason, and a Realization Event or Liquidity Event that either (i) is consummated within three months after the date of such termination of employment or (ii) if definitive transaction documents are executed within three months after the date of such termination of employment, is consummated within 12 months after the date of such termination of employment, any portion of the Options that would otherwise have vested and become exercisable as a result of such event in (i) or (ii) above had he remained employed through the date of such event will vest and become exercisable as of such date, subject to the Named Executive Officer’s timely execution, and non-revocation, of a general release of claims in favor of the Company.
169
Assuming a hypothetical vesting acceleration event occurred on December 31, 2019, the following table sets forth the amounts the Named Executive Officers would have received from such accelerated vesting. Furthermore, the amounts shown in the table do not include amounts that may have been payable to a Named Executive Officer upon the sale or purchase of his vested equity pursuant to the exercise of put or call rights.
Name | Equity Award(1) | Qualifying Termination ($)(2) | IPO ($)(3) | Significant Sale ($)(4) | Qualifying Sale ($)(5) | Liquidity Event ($)(6) | Performance Liquidity Event / Liquidity Hurdle Achievement ($)(7) | Change of Control Transaction/ Termination Following a Change of Control Transaction ($)(8) | |||||||||||||||
David Simmons | Time Options | 2,952,885 | 2,302,992 | — | — | — | — | 13,817,964 | |||||||||||||||
EBITDA Options | 6,008,784 | — | — | — | — | — | — | ||||||||||||||||
Liquidity Event Options | — | — | — | — | — | — | — | ||||||||||||||||
Total | 8,961,669 | 2,302,992 | — | — | — | — | 13,817,964 | ||||||||||||||||
Christopher G. Scully | Time Options | 466,940 | — | 1,148,571 | — | 2,964,075 | — | 2,964,075 | |||||||||||||||
EBITDA Options | 977,241 | — | — | — | — | — | — | ||||||||||||||||
Realization Event Options | — | — | — | — | — | — | — | ||||||||||||||||
Total | 1,444,181 | — | 1,148,571 | — | 2,964,075 | — | 2,964,075 | ||||||||||||||||
William J. Sharbaugh | Time Options | 712,758 | — | 611,480 | — | 3,335,341 | — | 3,335,341 | |||||||||||||||
EBITDA Options | 1,450,381 | — | — | — | — | — | — | ||||||||||||||||
Realization Event Options | — | — | — | — | — | — | — | ||||||||||||||||
Total | 2,163,139 | — | 611,480 | — | 3,335,341 | — | 3,335,341 | ||||||||||||||||
Anshul Thakral | Time Options | 232,351 | — | 288,890 | — | 1,271,790 | — | 1,271,790 | |||||||||||||||
EBITDA Options | 495,532 | — | — | — | — | — | — | ||||||||||||||||
Realization Event Options | — | — | — | — | — | — | — | ||||||||||||||||
Total | 727,883 | — | 288,890 | — | 1,271,790 | — | 1,271,790 | ||||||||||||||||
B. Judd Hartman | Time Options | 254,583 | — | 237,056 | — | 1,227,811 | — | 1,227,811 | |||||||||||||||
EBITDA Options | 517,998 | — | — | — | — | — | — | ||||||||||||||||
Realization Event Options | — | — | — | — | — | — | — | ||||||||||||||||
Total | 772,581 | — | 237,056 | — | 1,227,811 | — | 1,227,811 | ||||||||||||||||
__________
(1) | Amounts reported are based on our common stock having a fair market value of $21.70 per share as of the date of the most current valuation of our common stock on or prior to December 31, 2019. For additional details regarding the treatment of the options under each of the termination events in this table, see “—Accelerated Vesting of Equity Awards” above. |
(2) | Amounts reported reflect partial accelerated vesting of Time Options held by each Named Executive Officer in connection with certain qualifying terminations of employment. The next installment of EBITDA Options scheduled to vest following certain qualifying terminations of employment will remain eligible to vest and become exercisable provided and to the extent that the Compensation Committee determines that the predetermined EBITDA target has been achieved, subject to the execution of a general release of claims in favor of the Company by the Named Executive Officer (other than Mr. Simmons for whom no such release is required). Amounts reported reflect the 2019 vesting installment vesting at 95.0% based on actual performance. |
(3) | Amounts reported reflect partial accelerated vesting of Time Options held by Mr. Simmons immediately prior to an initial public offering such that the total percentage of Mr. Simmons’ vested Time Options is equal to 50.0%. Such acceleration occurred as of immediately prior to the IPO. |
170
(4) | Assumes that a Significant Sale occurs in which the Sponsors sell 51.0% of their equity investment in the Company. With respect to the Named Executive Officers other than Mr. Simmons, the amounts reported reflect partial accelerated vesting of Time Options immediately prior to the Significant Sale such that the total percentage of the Named Executive Officer’s vested Time Options is equal to 51% (the percentage of the Sponsors’ assumed investment sold in connection with such Significant Sale). |
(5) | Upon a Qualifying Sale, if the total percentage of the vested EBITDA Options held by each of our Named Executive Officers other than Mr. Simmons is less than the percentage of our Sponsors’ investment sold in connection with the Qualifying Sale, then a portion of the Named Executive Officer’s unvested EBITDA Options will vest and become exercisable immediately prior to the Qualifying Sale such that the total percentage of the Named Executive Officer’s vested EBITDA Options is equal to the percentage of our Sponsors’ investment sold in connection with the Qualifying Sale. Amounts reported assume that a Significant Sale occurs but such Significant Sale would not have constituted a Qualifying Sale and therefore there would have been no accelerated vesting of EBITDA Options. |
(6) | Amounts reported reflect full accelerated vesting of Time Options for each of the Named Executive Officers other than Mr. Simmons in connection with a Liquidity Event. |
(7) | Vesting of EBITDA Options fully accelerates for Mr. Simmons in the event of a Performance Liquidity Event and, for each of the other Named Executive Officers, in the event that the Liquidity Hurdles are achieved in connection with a Liquidity Event. Amounts reported for Mr. Simmons assume that a Performance Liquidity Event would not have occurred and, for each of the Named Executive Officers other than Mr. Simmons, that the Liquidity Hurdles would not have been achieved in connection with a Liquidity Event and therefore there would have been no accelerated vesting of EBITDA Options. |
(8) | Amounts reported reflect full accelerated vesting of Time Options for Mr. Simmons in connection with a Change of Control Transaction and, for each of the Named Executive Officers other than Mr. Simmons, in the event of a termination by the Company without cause, by the Named Executive Officer for good reason or due to the Named Executive Officer’s death or disability following a Change of Control Transaction. In addition, in the event that Mr. Simmons’ Liquidity Event Options and the other Named Executive Officers’ Realization Event Options (other than the Realization Event Options granted to Mr. Thakral in 2019) have not otherwise vested either prior to or in connection with a Change of Control Transaction, such options would fully vest in connection with a Change of Control Transaction if the enterprise value of the Company exceeds the required multiple of 2019 EBITDA and certain EBITDA thresholds were met in 2018. Amounts reported assume that the Liquidity Event Options and Realization Options do not vest in connection with a Change of Control Transaction. |
Director Compensation
Pursuant to the company’s Non-Employee Director compensation program, we pay annual compensation to each member of our board of directors who is not either (i) an employee of the Company or any parent or subsidiary of the Company or (ii) an employee of our Sponsors or their respective affiliates (excluding portfolio companies) (each, a “Non-Employee Director”). We do not pay any compensation to a director who is not a Non-Employee Director.
Under our current Non-Employee Director compensation program, each Non-Employee Director is entitled to receive an annual cash retainer of $100,000, payable quarterly in four equal installments of $25,000 each. In addition, each Non-Employee Director is entitled to receive an annual restricted stock award with respect to a number of shares of our non-voting common stock having an aggregate grant date fair market value of $75,000. Subject to the Non-Employee Director’s continued service to the Company on each applicable vesting date, the annual restricted stock awards vest in eight equal installments over the two-year period following the date of grant. Upon the occurrence of a Liquidity Event, all then-unvested restricted stock awards will vest immediately prior to such event. In addition, upon the occurrence of a Significant Sale, if the total percentage of the restricted stock awards that have previously vested is less than the percentage of our Sponsors’ investment sold in connection with the Significant Sale, then a portion of the Non-Employee Director’s unvested restricted stock award will vest immediately prior to the Significant Sale such that the total percentage of the Non-Employee Director’s restricted stock award that is vested is equal to the percentage of our Sponsors’ investment sold in connection with such Significant Sale.
In connection with each of the May 2019 Dividend and the November 2019 Dividend, our board of directors determined that it was in the best interest of the Company to waive the dividend restrictions on all unvested restricted stock held by each Non-Employee Director. Accordingly, each Non-Employee Director received the same cash dividends of $3.89 and $0.57 respectively, per share on their unvested restricted stock as paid to the stockholders on the date of dividend payments.
None of our directors receive separate compensation for attending meetings of, or serving as the chair of, our board of directors or any committees thereof. All directors, including our Non-Employee Directors, are reimbursed for travel and other expenses directly related to director activities and responsibilities.
Maria Teresa Hilado, Colin Hill and Jeffrey B. Kindler were our Non-Employee Directors in 2019. With respect to fiscal year 2019, none of our other directors were entitled to compensation for their service on our board of directors (other than reimbursement for travel and other expenses, as noted above).
In connection with the IPO and with assistance from the Consultant, we analyzed competitive market data relating to director compensation programs, including cash retainers, equity awards and stock ownership guidelines, from the Peer Group.
As a result of this analysis, in connection with the IPO, our board of directors has approved a new Non-Employee Director compensation program. Under the new program, each Non-Employee Director will receive an annual retainer of $200,000, consisting of an annual cash retainer of $100,000 payable in quarterly installments and an additional $100,000, which will be paid in the form of an equity-based award.
171
As part of this program, the chairpersons and members of the following committees will receive the additional fixed annual cash retainers (payable in quarterly installments in arrears) listed below. We reimburse all directors for travel and other expenses directly related to director activities and responsibilities.
Committee | Committee Member Retainer | Committee Chair Retainer | ||||||
Audit Committee | $ | 10,000 | $ | 25,000 | ||||
Compensation Committee | 7,500 | 20,000 | ||||||
Nominating and Corporate Governance Committee | 5,000 | 15,000 | ||||||
In connection with the IPO, we will adopt stock ownership guidelines for our Non-Employee Directors in order to better align our eligible directors’ financial interests with those of our stockholders by requiring such directors to own a minimum level of our shares. Each of our Non-Employee Directors will be required to own stock in an amount equal to five times the amount of the annual cash retainer (excluding committee retainers) within five years of becoming subject to the guidelines. Any such director who has not met the threshold will be required to retain 50% of the qualifying shares awarded to him or her under the Company’s stock incentive plans (net of any shares used to pay the exercise price of stock options in a net-share stock option transaction or to satisfy any applicable tax withholding obligation).
The following table summarizes the compensation paid to or earned by our Non-Employee Directors in 2019.
2019 DIRECTOR COMPENSATION
Name | Fees Earned or Paid in Cash ($) | Stock Awards(1) ($) | All Other Compensation (2)($) | Total ($) | ||||||||
Joe Bress | — | — | — | — | ||||||||
Stephen Ensley | — | — | — | — | ||||||||
Maria Teresa Hilado | 100,000 | 75,000 | 11,828 | 186,828 | ||||||||
Colin Hill | 100,000 | 75,000 | 13,096 | 188,096 | ||||||||
Jeffrey B. Kindler | 100,000 | 75,000 | 14,250 | 189,250 | ||||||||
P. Hunter Philbrick | — | — | — | — | ||||||||
Allen R. Thorpe | — | — | — | — | ||||||||
Stephen H. Wise | — | — | — | — | ||||||||
__________
(1) | Amounts reported represent the grant date fair value of the restricted stock awards granted to the Non-Employee Directors in 2019 determined in accordance with ASC Topic 718. As of December 31, 2019, the aggregate number of outstanding unvested shares of restricted stock held by each Non-Employee Director was 3,117 shares. |
(2) | Amounts reported reflect the cash dividend amounts paid on the unvested shares of restricted stock held by each of the Non-Employee Directors in connection with each of the May 2019 Dividend and the November 2019 Dividend. |
172
Item 12. Security Ownership of Certain Beneficial Owners and Management and Related Stockholder Matters
Securities Authorized for Issuance Under Equity Compensation Plans
The following table provides information with respect to our compensation plans under which equity compensation was authorized as of December 31, 2019. All numbers in the following table are presented after giving effect to the 1.8-for-1 stock split of our common stock that was effected on January 15, 2020. Set forth below is certain information about the Company’s common stock authorized for issuance under the Company's compensation plan.
Number of securities to be issued upon exercise of outstanding options, warrants and rights | Weighted-average exercise price of outstanding options, warrants and rights | Number of securities remaining available for future issuance under equity compensation plans (excluding securities reflected in column (a)) | |||||||
Plan category | (a) | (b) | (c) | ||||||
Equity compensation plan approved by security holders (1) | 20,302,725 | 14.10 | 3,211,535 | ||||||
Equity compensation plans not approved by security holders (2) | — | — | — | ||||||
Total | 20,302,725 | 14.10 | 3,211,535 | ||||||
(1) The amounts shown in this row include securities under the 2017 Plan.
(2) We do not have any equity compensation plans or arrangements that have not been approved by our stockholders.
A description of our equity compensation plan can be found in Note 4, “Stock-Based Compensation,” of our audited consolidated financial statements included elsewhere in this Annual Report on Form 10-K.
Security Ownership of Certain Beneficial Owners and Management
The following table and accompanying footnotes set forth information with respect to the beneficial ownership of the common stock of PPD, Inc. as of February 27, 2020 unless otherwise indicated below by:
• | each person known by us to beneficially own more than 5% of our outstanding shares of common stock; |
• | each of our directors; |
• | each of our named executive officers; and |
• | our directors and executive officers as a group. |
Beneficial ownership for the purposes of the following table is determined in accordance with the rules and regulations of the SEC. A person is a “beneficial owner” of a security if that person has or shares “voting power,” which includes the power to vote or to direct the voting of the security, or “investment power,” which includes the power to dispose of or to direct the disposition of the security or has the right to acquire such powers within 60 days of February 27, 2020. The percent of common stock calculations are based on the 348,580,422 shares of our common stock outstanding as of February 27, 2020.
Unless otherwise noted in the footnotes to the following table, and subject to applicable community property laws, to our knowledge, the persons named in the table have sole voting and investment power with respect to their beneficially owned common stock.
173
Except as otherwise indicated in the footnotes below, the address of each beneficial owner is c/o PPD, Inc., 929 North Front Street, Wilmington, North Carolina 28401.
Common Stock Beneficially Owned | ||||||
Name of Beneficial Owner | Shares | Percentage | ||||
5% Stockholders: | ||||||
H&F Investors(1) | 158,426,641 | 45.4 | % | |||
Carlyle Investor(2) | 66,454,994 | 19.1 | ||||
ADIA Investor(3) | 25,585,173 | 7.3 | ||||
GIC Investor(4) | 25,585,173 | 7.3 | ||||
Directors and Named Executive Officers: | ||||||
David Simmons(5) | 3,039,408 | * | ||||
Joe Bress(6) | — | — | ||||
Stephen Ensley(7) | — | — | ||||
Maria Teresa Hilado(8) | 33,471 | * | ||||
Colin Hill(9) | 12,160 | * | ||||
Jeffrey B. Kindler(10) | 112,095 | * | ||||
P. Hunter Philbrick(7) | — | — | ||||
Allen R. Thorpe(7) | — | — | ||||
Stephen H. Wise(6) | — | — | ||||
William J. Sharbaugh(11) | 908,364 | * | ||||
Christopher G. Scully(12) | 213,031 | * | ||||
Anshul Thakral(13) | 185,773 | * | ||||
B. Judd Hartman(14) | 256,981 | * | ||||
All directors and executive officers as a group (19 persons)(15) | 5,538,353 | 1.6 | % | |||
__________________
* | Indicates beneficial ownership of less than 1%. |
(1) | Reflects (i) 63,069,561 shares directly held by Hellman & Friedman Capital Partners VII, L.P., 24,143,479 shares directly held by Hellman & Friedman Capital Partners VII (Parallel), L.P., 4,330,024 shares directly held by HFCP VII (Parallel-A), L.P. and 428,587 shares directly held by H&F Executives VII, L.P. (collectively, the “H&F VII Funds”) and (ii) 42,483,348 shares directly held by Hellman & Friedman Capital Partners VIII, L.P., 19,066,602 shares directly held by Hellman & Friedman Capital Partners VIII (Parallel), L.P., 3,603,189 shares directly held by HFCP VIII (Parallel-A), L.P., 1,114,449 shares directly held by H&F Executives VIII, L.P. and 187,402 shares directly held by H&F Associates VIII, L.P. (collectively, the “H&F VIII Funds” and, together with the H&F VII Funds, the “H&F Investors”). Hellman & Friedman Investors VII, L.P. (“H&F Investors VII”) is the general partner of the H&F VII Funds. H&F Corporate Investors VII, Ltd. (“H&F VII”) is the general partner of H&F Investors VII. As the general partner of H&F Investors VII, H&F VII may be deemed to have beneficial ownership of the shares of common stock beneficially owned by H&F Investors VII. Hellman & Friedman Investors VIII, L.P. (“H&F Investors VIII”) is the general partner of the H&F VIII Funds. H&F Corporate Investors VIII, Ltd. (“H&F VIII”) is the general partner of H&F Investors VIII. As the general partner of H&F Investors VIII, H&F VIII may be deemed to have beneficial ownership of the shares of common stock beneficially owned by H&F Investors VIII. Voting and investment determinations with respect to shares of common stock held by H&F Investors VII and H&F Investors VIII are made by the boards of directors of H&F VII and H&F VIII, respectively. The board of directors of each of H&F VII and H&F VIII consists of Philip U. Hammarskjold, David R. Tunnell and Allen R. Thorpe. Each of the members of the boards of directors of H&F VII and H&F VIII disclaims beneficial ownership of such shares of our common stock. The address of each entity named in this footnote is c/o Hellman & Friedman LLC, 415 Mission Street, Suite 5700, San Francisco, California 94105. |
(2) | Reflects shares directly held by Carlyle Partners VI Holdings II, L.P. (the “Carlyle Investor”). Carlyle Group Management L.L.C. holds an irrevocable proxy to vote a majority of the shares of The Carlyle Group Inc., which is a publicly traded entity listed on Nasdaq. The Carlyle Group Inc. is the sole member of Carlyle Holdings II GP L.L.C., which is the managing member of Carlyle Holdings II L.L.C., which, with respect to the securities reported herein, is the managing member of CG Subsidiary Holdings L.L.C., which is the general partner of TC Group Cayman Investment Holdings, L.P., which is the general partner of TC Group Cayman Investment Holdings Sub L.P., which is the sole member of TC Group VI, L.L.C., which is the general partner of TC Group VI, L.P., which is the general partner of the Carlyle Investor. Voting and investment determinations with respect to the common shares held by the Carlyle Investor are made by an investment committee of TC Group VI, L.P. comprised of Allan Holt, William Conway, Jr., Daniel D’Aniello, David Rubenstein, Peter Clare, Kewsong Lee, Norma Kuntz, Sandra Horbach and Marco De Benedetti as a non-voting observer. Accordingly, each of the foregoing entities and individuals may be deemed to share beneficial ownership of the securities held of record by Carlyle Partners VI Holdings II, L.P. Each of them disclaims beneficial ownership of such securities. The address of each of TC Group Cayman Investment |
174
Holdings, L.P. and TC Group Cayman Investment Holdings Sub L.P. is c/o Walkers, Cayman Corporate Center, 27 Hospital Road, George Town, Grand Cayman KY1-9008, Cayman Islands. The address of each of the other entities named in this footnote is c/o The Carlyle Group Inc., 1001 Pennsylvania Avenue, NW, Suite 220 South, Washington, D.C. 20004.
(3) | Reflects shares directly held by Blue Spectrum ZA 2015 L.P. (the “Blue Spectrum Investor”). The general partner of the Blue Spectrum Investor is Procific, a Cayman Island exempted company with limited liability and a wholly owned subsidiary of ADIA. By reason of its ownership of Procific and pursuant to the rules and regulations of the SEC, ADIA may be deemed to share investment and voting power over and, therefore, beneficial ownership of, the shares held directly by the Blue Spectrum Investor. The address for each of the Blue Spectrum Investor and Procific is c/o Collas Crill Corporate Services Limited, Willow House, Cricket Square, PO Box 709, Grand Cayman, KY1-1107, Cayman Islands. The address for ADIA is 211 Corniche Street, P.O. Box 3600, Abu Dhabi, United Arab Emirates. |
(4) | Reflects shares directly held by Clocktower Investment Pte Ltd. (the “GIC Investor”). The GIC Investor shares the power to vote and the power to dispose of these shares with GIC Special Investments Pte. Ltd. (“GIC SI”), and GIC, both of which are private limited companies incorporated in Singapore. GIC SI is wholly owned by GIC and is the private equity investment arm of GIC. GIC is wholly owned by the Government of Singapore and was set up with the sole purpose of managing Singapore’s foreign reserves. The Government of Singapore disclaims beneficial ownership of these shares. The business address for the GIC Investor is 168 Robinson Road, #37-01 Capital Tower, Singapore 068912. |
(5) | Consists of 603,000 shares held by 2015 Simmons Family Gift Trust U/A dated June 18, 2015 of which Mr. Simmons is a Trustee, 867,759 shares held by David S. Simmons Revocable Trust dated November 13, 2009 of which Mr. Simmons is a Trustee, 1,528,649 shares issuable upon the exercise of options exercisable within 60 days following February 27, 2020, and 40,000 shares that Mr. Simmons purchased in our initial public offering as part of the directed share program. |
(6) | The address of each of Messrs. Bress and Wise is c/o The Carlyle Group Inc., 1001 Pennsylvania Avenue, NW, Suite 2200 South, Washington, D.C. 20004. |
(7) | The address of each of Messrs. Ensley, Philbrick and Thorpe is c/o Hellman & Friedman LLC, 415 Mission Street, Suite 5700, San Francisco, California 94105. |
(8) | Consists of 22,354 shares, 3,117 restricted shares and 8,000 shares that Ms. Hilado purchased in our initial public offering as part of the directed share program. |
(9) | Consists of 9,043 shares and 3,117 restricted shares. |
(10) | Consists of 90,478 shares, 3,117 restricted shares and 18,500 shares that Mr. Kindler purchased in our initial public offering as part of the directed share program. |
(11) | Consists of 90,000 shares held by William J. Sharbaugh, III 2020 Grantor Retained Annuity Trust u/a 01/15/2020 of which Mr. Sharbaugh is a Trustee, 332,485 shares held by William J. Sharbaugh, and includes 455,879 shares issuable upon the exercise of options exercisable within 60 days following February 27, 2020 and 30,000 shares that Mr. Sharbaugh purchased in our initial public offering as part of the directed share program. |
(12) | Includes 187,031 shares issuable upon the exercise of options exercisable within 60 days following February 27, 2020 and 26,000 shares that Mr. Scully purchased in our initial public offering as part of the directed share program. |
(13) | Includes 151,547 shares issuable upon the exercise of options exercisable within 60 days following February 27, 2020. |
(14) | Includes 162,815 shares issuable upon the exercise of options exercisable within 60 days following February 27, 2020. |
(15) | Consists of 3,088,081 shares issuable upon the exercise of options exercisable within 60 days following February 27, 2020, 9,351 restricted shares, 2,310,521 shares held by our current executive officers and directors, and 130,400 shares purchased in our initial public offering as part of the directed share program. |
175
Item 13. Certain Relationships and Related Transactions, and Director Independence
Transactions with the Majority Sponsors
We are parties to consulting services agreements with affiliates of each of Carlyle and Hellman & Friedman pursuant to which we pay such Majority Sponsor affiliates a fee for advisory, consulting and other services to be provided to us and our subsidiaries. Pursuant to the agreements, subject to certain conditions, we pay an annual sponsor management fee to such Majority Sponsor affiliates of 0.5% of the preceding year’s EBITDA (as calculated in the agreements), calculated annually and payable on a quarterly basis. We also reimburse such Majority Sponsor affiliates’ reasonable out-of-pocket expenses incurred in connection with services provided pursuant to the consulting services agreements, and we may pay such Majority Sponsor affiliates additional fees associated with other future transactions or in consideration of any additional services provided to us under the consulting services agreements. Additionally, we agreed to indemnify such Sponsor affiliates against all actions, causes of action, suits, claims, liabilities, losses, damages, costs and expenses incurred by such Sponsor affiliates in connection with the services provided by such Sponsor affiliates to us pursuant to the consulting services agreements. For the year ended December 31, 2019, we incurred $3.8 million for out-of-pocket expenses and services rendered under the current consulting services agreements. The consulting services agreements terminated pursuant to their terms upon completion of our IPO on February 10, 2020. See Note 22, “Subsequent Events,” to our audited consolidated financial statements included elsewhere in this Annual Report on Form 10-K for more information regarding the IPO.
Affiliates of one of the Majority Sponsors had investments in the Term Loan totaling $78.0 million as of December 31, 2019. For the year ended December 31, 2019, we paid $3.9 million of interest and $0.8 million of principal to the relevant affiliates for the Term Loan.
Second Amended and Restated Stockholders Agreement
We are parties to a second amended and restated stockholders agreement with the Sponsors and members of management.
Nomination of Directors
Pursuant to the second amended and restated stockholders agreement, the board of directors of the Company consists of nine members. Hellman & Friedman has the right to nominate to the Company’s board of directors (such persons, the “Hellman & Friedman nominees”) (i) three members so long as it collectively owns more than 30% of the Company’s outstanding shares of common stock, (ii) two members so long as it collectively owns less than 30% but at least 15% of the Company’s outstanding shares of common stock and (iii) one member so long as it collectively owns less than 15% but at least 7.5% of the Company’s outstanding shares of common stock. Carlyle has the right to nominate to the Company’s board of directors (such persons, the “Carlyle nominees”) (i) two members so long as (x) it collectively owns at least 15% of the Company’s outstanding shares of common stock or (y) (A) Hellman & Friedman collectively owns at least 15% of the Company’s outstanding shares of common stock and (B) Carlyle’s continuing ownership percentage (with respect to its ownership percentage as of May 2017) is not less than Hellman & Friedman’s continuing ownership percentage and (ii) one member so long as (x) it collectively owns less than 15% but at least 7.5% of the Company’s outstanding shares of common stock or (y) (A) Hellman & Friedman collectively owns less than 15% but at least 7.5% of the Company’s outstanding shares of common stock and (B) Carlyle’s continuing ownership percentage of common stock (with respect to its ownership percentage as of May 2017) is not less than Hellman & Friedman’s continuing ownership percentage of common stock. ADIA has the right to designate a board observer to the Company’s board of directors so long as it collectively owns at least 5% of the Company’s outstanding shares of common stock. GIC has the right to designate a board observer to the Company’s board of directors so long as it collectively owns at least 5% of the Company’s outstanding shares of common stock.
Pursuant to the second amended and restated stockholders agreement, the Company will include the Hellman & Friedman nominees and the Carlyle nominees on the slate that is included in the Company’s proxy statement relating to the election of directors of the class of directors to which such persons belong and provide the highest level of support for the election of each such person as the Company provides to any other individual standing for election as a director. In addition, pursuant to the Stockholders Agreement, each of Hellman & Friedman, Carlyle, ADIA and GIC agreed to vote in favor of the Company slate that is included in the Company’s proxy statement.
176
In the event that an Hellman & Friedman nominee or a Carlyle nominee ceases to serve as a director for any reason (other than the failure of the Company’s stockholders to elect such individual as a director), the persons entitled to designate such nominee director under the Stockholders Agreement are entitled to appoint another nominee to fill the resulting vacancy.
Registration Rights
Pursuant to the second amended and restated stockholders Agreement, Hellman & Friedman, Carlyle, ADIA and GIC have certain rights to have their securities registered by the Company under the Securities Act. Hellman & Friedman and Carlyle are entitled to an unlimited number of “demand” registrations and ADIA and GIC collectively are entitled to one “demand” registration, subject in each case to certain limitations. Each stockholder that holds registration rights is also entitled to customary “piggyback” registration rights. In addition, the second amended and restated stockholders agreement provides that the Company pay certain expenses of the stockholders relating to such registrations and indemnify them against certain liabilities which may arise under the Securities Act.
Transfer Restrictions and Tag-Along
Except for certain permitted transfers, prior to the first anniversary of the Company’s IPO, Hellman & Friedman and Carlyle may not transfer any shares of the Company without the prior written consent of the other party. In addition, except as provided below, neither Hellman & Friedman nor Carlyle may transfer shares of the Company pursuant to Rule 144 or make an in-kind distribution without the prior written consent of the other party until the either (i) Hellman & Friedman or Carlyle is no longer entitled to nominate any directors or (ii) Hellman & Friedman or Carlyle own less than 10% of the Company’s outstanding shares.
Except for certain permitted transfers, prior to the first anniversary of the Company’s IPO, ADIA, GIC and the other stockholders party to the Stockholders Agreement (other than Hellman & Friedman and Carlyle) may not transfer any shares of the Company without the prior written consent of the Company’s board of directors.
Except for transfers to permitted transferees, to the Company, in connection with the exercise of registration rights under the Stockholders Agreement or pursuant to certain permitted in-kind distributions in connection with charitable donations, all the stockholders party to the Stockholders Agreement have customary tag-along rights in the event that Hellman & Friedman or Carlyle proposes to transfer any of its shares of the Company prior to the first anniversary of the Company’s IPO.
Put and Call Rights
Pursuant to the Stockholders Agreement, certain members of management have the right to require that the Company purchase all, or any portion of, the shares of the Company held by such member of management in the event of termination of employment by such member of management for good reason or by the Company without cause. In connection with any termination of a member of management for cause or breach of certain restrictive covenants, the Company has the option to repurchase such member of management’s applicable shares.
Indemnification of Directors and Officers
We have entered into an indemnification agreement with each of our directors and executive officers. The indemnification agreements, together with our amended and restated bylaws, provide that we will jointly and severally indemnify each indemnitee to the fullest extent permitted by the Delaware general corporation law from and against all loss and liability suffered and expenses, judgments, fines and amounts paid in settlement actually and reasonably incurred by or on behalf of the indemnitee in connection with any threatened, pending, or completed action, suit or proceeding. Additionally, we agreed to advance to the indemnitee all out-of-pocket costs of any type or nature whatsoever incurred in connection therewith.
177
Related Persons Transaction Policy
We have a written policy on transactions with related persons, which we refer to as our “related person policy.” Our related person policy requires that all “related persons” (as defined in paragraph (a) of Item 404 of Regulation S-K) must promptly disclose to our general counsel any “related person transaction” (defined as any transaction that is anticipated would be reportable by us under Item 404(a) of Regulation S-K in which we were or are to be a participant and the amount involved exceeds $120,000 and in which any related person had or will have a direct or indirect material interest) and all material facts with respect thereto. Our general counsel will communicate that information to our board of directors or to a duly authorized committee thereof. Our related person policy provides that no related person transaction will be executed without the approval or ratification of our board of directors or a duly authorized committee thereof. It is our policy that any directors interested in a related person transaction must recuse themselves from any vote on a related person transaction in which they have an interest.
Director Independence
All of our directors, other than Mr. Simmons, qualify as “independent” in accordance with the listing requirements of Nasdaq. The Nasdaq independence definition includes a series of objective tests, including that the director is not, and has not been for at least three years, one of our employees and that neither the director nor any of his family members has engaged in various types of business dealings with us. In addition, as required by Nasdaq rules, our board of directors has made a subjective determination as to each independent director that no relationships exist, which, in the opinion of our board of directors, would interfere with the exercise of independent judgment in carrying out the responsibilities of a director. In making these determinations, our board of directors reviewed and discussed information provided by the directors to us with regard to each director’s business and personal activities and relationships as they may relate to us and our management. Mr. Simmons is not independent because he is the chairman and chief executive officer of PPD, Inc.
Item 14. Principal Accountant Fees and Services
Audit and Non-Audit Fees
The accounting firm of Deloitte & Touche LLP served as independent auditors of the Company for the years ended December 31, 2019 and 2018. In addition to rendering audit services during those two years, Deloitte & Touche LLP performed various non-audit services for the Company worldwide. The following table presents fees for professional services rendered by Deloitte & Touche LLP for the audit of our financial statements for 2019 and 2018 and fees billed for other services rendered by Deloitte & Touche LLP during those periods:
The aggregate fees, including expenses, of Deloitte & Touche LLP for the fiscal years ended December 31, 2019 and 2018 are as follows:
2019 | 2018 | ||||||
(in thousands) | |||||||
Fee category: | |||||||
Audit fees(1) | $ | 4,610 | $ | 2,221 | |||
Audit-related fees(2) | 1,376 | — | |||||
Tax fees(3) | 26 | 201 | |||||
All other fees(4) | 4 | 5 | |||||
Total fees | $ | 6,016 | $ | 2,427 | |||
(1) | Includes the aggregate fees recognized in each of the last two fiscal years for professional services rendered by Deloitte & Touche LLP for (1) the reviews and audit of our quarterly and annual financial statements, respectively, (2) statutory audits services and (3) consultation on accounting and reporting matters related to the audit and audit services. In 2019, audit fees also includes fees associated with the IPO. |
(2) | Includes the aggregate fees recognized in 2019 for professional services rendered by Deloitte & Touche LLP for (1) work performed in connection with SEC filings related to registration statements, (2) comfort letters issued to underwriters and (3) internal control advisory services outside the scope of the annual audit. |
(3) | Includes the aggregate fees recognized in each of the last two fiscal years for professional services rendered by Deloitte & Touche LLP for tax compliance, tax advice and/or tax planning. |
(4) | Includes the aggregate fees recognized in each of the last two fiscal years for products and services provided by Deloitte & Touche LLP, other than those services described above, primarily related to the annual subscription fee for the Deloitte & Touche LLP accounting research tool. |
178
Audit Committee Pre-Approval Policies and Procedures
The Audit Committee has adopted policies and procedures that require the pre-approval of audit, audit-related and permissible non-audit services provided by Deloitte & Touche LLP. During 2019 and 2018, all audit, audit-related and permissible non-audit services provided by Deloitte & Touche LLP were pre-approved by the Audit Committee. The Audit Committee has considered the provision of these services by Deloitte & Touche LLP and has determined that the services are compatible with Deloitte & Touche LLP maintaining its independence.
179
Part IV
Item 15. Exhibits and Financial Statement Schedules
(1) Financial Statements | |
The following financial statements and supplementary data are included in Item 8 of this Annual Report on Form 10-K: | |
Page | |
Report of Independent Registered Public Accounting Firm | |
Consolidated Statements of Operations for the years ended December 31, 2019, 2018 and 2017 | |
Consolidated Statements of Comprehensive Income for the years ended December 31, 2019, 2018 and 2017 | |
Consolidated Balance Sheets as of December 31, 2019 and 2018 | |
Consolidated Statements of Stockholders’ Deficit and Redeemable Noncontrolling Interest for the years ended December 31, 2019, 2018 and 2017 | |
Consolidated Statements of Cash Flows for the years ended December 31, 2019, 2018 and 2017 | |
Notes to the Consolidated Financial Statements | |
(2) Financial Statements Schedules | |
Schedule I – Condensed Financial Information of Registrant (Parent Company only) | |
All other schedules are omitted, since the required information is not applicable or is not present in amounts sufficient to require submission of the schedule, or because the information required is included in the consolidated financial statements and notes thereto. | |
(3) Exhibits required by Item 601 of Regulation S-K. | |
The exhibits listed in the accompanying Exhibit Index are filed or furnished as a part of this report and are incorporated herein by reference. | |
180
EXHIBIT INDEX
Exhibit Number | Description | |
3.1 | ||
3.2 | ||
4.1 | ||
4.2 | ||
4.3 | ||
4.4 | ||
4.5† | ||
10.1 | ||
10.2* | ||
10.3* | ||
10.4* | ||
10.5* | ||
10.6* | ||
181
Exhibit Number | Description | |
10.7 | ||
10.8 | ||
10.9 | ||
10.10 | ||
10.11 | ||
10.12 | ||
10.13 | ||
10.14 | ||
10.15 | ||
10.16* | ||
10.17* | ||
182
Exhibit Number | Description | |
10.18* | ||
10.19* | ||
10.20* | ||
10.21* | ||
10.22* | ||
10.23* | ||
10.24* | ||
10.25* | ||
10.26* | ||
10.27* | ||
10.28* | ||
10.29* | ||
10.30* | ||
183
Exhibit Number | Description | |
10.31* | ||
10.32* | ||
10.33* | ||
10.34* | ||
10.35* | ||
10.36* | ||
10.37* | ||
10.38* | ||
10.39* | ||
10.40* | ||
10.41* | ||
10.42* | ||
21.1 | ||
23.1† | ||
31.1† | ||
31.2† | ||
184
Exhibit Number | Description | |
32.1†† | ||
32.2†† | ||
__________________
† | Filed herewith. |
†† | Furnished herewith. The certifications attached as Exhibit 32.1 and 32.2 that accompany this Annual Report on Form 10-K are deemed furnished and not filed with the Securities and Exchange Commission and are not to be incorporated by reference into any filing of PPD, Inc. under the Securities Act of 1933, as amended, or the Securities Exchange Act of 1934, as amended, whether made before or after the date of this Annual Report on Form 10-K, irrespective of any general incorporation language contained in such filing. |
* | Management contract or compensatory plan or arrangement. |
Item 16. Form 10-K Summary
None.
185
SIGNATURES
Pursuant to the requirements of Section 13 or 15(d) of the Securities Exchange Act of 1934, the registrant has duly caused this report to be signed on its behalf by the undersigned, thereunto duly authorized.
PPD, Inc. | |
By: | /s/ David Simmons |
Name: | David Simmons |
Title: | Chief Executive Officer and Chairman |
Date: March 5, 2020
Pursuant to the requirements of the Securities Exchange Act of 1934, this report has been signed by the following persons on behalf of the registrant and in the capacities indicated on March 5, 2020.
Signature | Title |
/s/ David Simmons | Chief Executive Officer and Chairman (Principal Executive Officer) |
David Simmons | |
/s/ Christopher G. Scully | Executive Vice President and Chief Financial Officer (Principal Financial Officer) |
Christopher G. Scully | |
/s/ Glen Donovan | Chief Accounting Officer (Principal Accounting Officer) |
Glen Donovan | |
/s/ Joe Bress | Director |
Joe Bress | |
/s/ Stephen Ensley | Director |
Stephen Ensley | |
/s/ Maria Teresa Hilado | Director |
Maria Teresa Hilado | |
/s/ Colin Hill | Director |
Colin Hill | |
/s/ Jeffrey B. Kindler | Director |
Jeffrey B. Kindler | |
/s/ P. Hunter Philbrick | Director |
P. Hunter Philbrick | |
/s/ Allen R. Thorpe | Director |
Allen R. Thorpe | |
/s/ Stephen H. Wise | Director |
Stephen H. Wise | |
186