Attached files
| file | filename |
|---|---|
| EX-32.3 - EX-32.3 - MILLER INDUSTRIES INC /TN/ | mlr-20191231ex3238a3e3e.htm |
| EX-32.2 - EX-32.2 - MILLER INDUSTRIES INC /TN/ | mlr-20191231ex32243dfdd.htm |
| EX-32.1 - EX-32.1 - MILLER INDUSTRIES INC /TN/ | mlr-20191231ex321b2ff86.htm |
| EX-31.3 - EX-31.3 - MILLER INDUSTRIES INC /TN/ | mlr-20191231ex313c4bd6a.htm |
| EX-31.2 - EX-31.2 - MILLER INDUSTRIES INC /TN/ | mlr-20191231ex312ecb72c.htm |
| EX-31.1 - EX-31.1 - MILLER INDUSTRIES INC /TN/ | mlr-20191231ex311143156.htm |
| EX-23.1 - EX-23.1 - MILLER INDUSTRIES INC /TN/ | mlr-20191231ex2314a7562.htm |
| EX-21 - EX-21 - MILLER INDUSTRIES INC /TN/ | mlr-20191231ex21fed6794.htm |
| EX-4.1 - EX-4.1 - MILLER INDUSTRIES INC /TN/ | mlr-20191231ex41cef85d5.htm |
UNITED STATES
SECURITIES AND EXCHANGE COMMISSION
WASHINGTON, D.C. 20549
FORM 10-K
(Mark One)
|
☒ |
ANNUAL REPORT PURSUANT TO SECTION 13 OR 15(d) OF THE SECURITIES EXCHANGE ACT OF 1934 |
|
For the fiscal year ended |
December 31, 2019 |
OR
|
☐ |
TRANSITION REPORT PURSUANT TO SECTION 13 OR 15(d) OF THE SECURITIES EXCHANGE ACT OF 1934 |
For the transition period from to
|
Commission File No. |
001‑14124 |
|
MILLER INDUSTRIES, INC. |
||
|
(Exact name of registrant as specified in its charter) |
||
|
|
||
|
Tennessee |
|
62‑1566286 |
|
(State or other jurisdiction of incorporation or organization) |
|
(I.R.S. Employer Identification No.) |
|
|
|
|
|
8503 Hilltop Drive, Ooltewah, Tennessee |
|
37363 |
|
(Address of principal executive offices) |
|
(Zip Code) |
|
|
|
|
|
(423) 238‑4171 |
||
|
(Registrant’s telephone number, including area code) |
||
Securities registered pursuant to Section 12(b) of the Act:
|
Title of Each Class |
Trading Symbol(s) |
Name of Each Exchange on Which Registered |
||
|
Common Stock, par value $.01 per share |
|
MLR |
|
New York Stock Exchange |
Securities registered pursuant to Section 12(g) of the Act:
|
None |
|
(Title of Class) |
Indicate by check mark if the registrant is a well-known seasoned issuer, as defined in Rule 405 of the Securities Act.
◻ Yes ☒ No
Indicate by check mark if the registrant is not required to file reports pursuant to Section 13 or Section 15(d) of the Act.
◻ Yes ☒ No
Indicate by check mark whether the registrant (1) has filed all reports required to be filed by Section 13 or 15(d) of the Securities Exchange Act of 1934 during the preceding 12 months (or for such shorter period that the registrant was required to file such reports), and (2) has been subject to such filing requirements for the past 90 days.
☒ Yes ◻ No
Indicate by check mark whether the registrant has submitted electronically every Interactive Data File required to be submitted pursuant to Rule 405 of Regulation S-T during the preceding 12 months (or for such shorter period that the registrant was required to submit and post such files).
☒ Yes ◻ No
Indicate by check mark whether the registrant is a large accelerated filer, an accelerated filer, a non-accelerated filer, smaller reporting company or an emerging growth company. See the definitions of “large accelerated filer,” “accelerated filer,” “smaller reporting company,” and “emerging growth company” in Rule 12b‑2 of the Exchange Act:
|
Large Accelerated Filer ◻ |
Accelerated Filer ☒ |
|
|
|
|
Non-accelerated Filer ◻ |
Smaller Reporting Company ◻ |
|
|
|
|
|
Emerging Growth Company ◻ |
If an emerging growth company, indicate by check mark if the registrant has elected not to use the extended transition period for complying with any new or revised financial accounting standards provided pursuant to Section 13(a) of the Exchange Act. ◻
Indicate by check mark whether the registrant is a shell company (as defined in Rule 12b‑2 of the Exchange Act).
◻ Yes ☒ No
The aggregate market value of the voting stock held by non-affiliates of the registrant (which for purposes hereof are all holders other than executive officers, directors and holders of more than 10% of the registrant’s Common Stock) as of June 28, 2019 (the last business day of the registrant’s most recently completed second fiscal quarter) was $296,969,693 (based on 9,657,551 shares held by non-affiliates at $30.75 per share, the last sale price reported on the New York Stock Exchange on June 28, 2019).
At February 28, 2020 there were 11,405,468 shares of the registrant’s common stock, par value $0.01 per share, outstanding.
DOCUMENTS INCORPORATED BY REFERENCE
The information called for by Part III (Items 10, 11, 12, 13 and 14) is incorporated herein by reference to the Registrant’s definitive proxy statement for its 2020 Annual Meeting of Shareholders which is to be filed pursuant to Regulation 14A.
CERTAIN FACTORS AFFECTING FORWARD-LOOKING STATEMENTS
Certain statements in this Annual Report on Form 10‑K, including but not limited to statements made in Part II–Item 7–“Management’s Discussion and Analysis of Financial Condition and Results of Operations,” statements made with respect to future operating results, expectations of future customer orders and the availability of resources necessary for our business may be deemed to be forward-looking statements, as defined in the Private Securities Litigation Reform Act of 1995. Forward-looking statements can be identified by the use of words such as “may,” “will,” “should,” “could,” “continue,” “future,” “potential,” “believe,” “project,” “plan,” “intend,” “seek,” “estimate,” “predict,” “expect,” “anticipate” and similar expressions, or the negative of such terms, or other comparable terminology. Forward-looking statements also include the assumptions underlying or relating to any of the foregoing statements. Such forward-looking statements are made based on our management’s beliefs as well as assumptions made by, and information currently available to, our management. Our actual results may differ materially from the results anticipated in these forward-looking statements due to, among other things: the cyclical nature of our industry and changes in consumer confidence; economic and market conditions; our dependence upon outside suppliers for our raw materials, including aluminum, steel, petroleum-related products and other purchased component parts; changes in price and availability (including as a result of the imposition of additional tariffs and the impact of the outbreak of the coronavirus known as COVID-19) of aluminum, steel, petroleum-related products and other purchased component parts; delays in receiving supplies of such materials or parts; our customers’ access to capital and credit to fund purchases; operational challenges caused by our increased sales volumes; various political, economic and other uncertainties relating to our international operations, including restrictive taxation and foreign currency fluctuation; special risks from our sales to U.S. and other governmental entities through prime contractors; our ability to secure new government orders; changes in fuel and other transportation costs, insurance costs and weather conditions; changes in government regulation; failure to comply with domestic and foreign anti-corruption laws; competition and our ability to attract or retain customers; our ability to develop or acquire proprietary products and technology; assertions against us relating to intellectual property rights; problems hiring or retaining skilled labor; a disruption in, or breach in security of, our information technology systems or any violation of data protection laws; changes in the tax regimes and related government policies and regulations in the countries in which we operate; the effects of regulations relating to conflict minerals; the catastrophic loss of one of our manufacturing facilities; environmental and health and safety liabilities and requirements; loss of the services of our key executives; product warranty or product liability claims in excess of our insurance coverage; potential recalls of components or parts manufactured for us by suppliers or potential recalls of defective products; an inability to acquire insurance at commercially reasonable rates; and those other risks referenced herein, including those risks referred to in this report, in Part I, Item 1A–“Risk Factors” and those risks discussed in our filings with the Securities and Exchange Commission filed after this Annual Report. Such factors are not exclusive. We do not undertake to update any forward-looking statement that may be made from time to time by, or on behalf of, our company.
1
General
Miller Industries is The World’s Largest Manufacturer of Towing and Recovery Equipment®, with executive offices in Ooltewah, Tennessee, domestic manufacturing operations in Tennessee and Pennsylvania, and foreign manufacturing operations in France and the United Kingdom.
In 1990, we began developing or acquiring several of the most well-recognized brands in the towing and recovery equipment manufacturing industry. Our strategy has been to diversify our line of products and increase our presence in the industry through internal growth and development, while remaining open to opportunities for acquisitions of complementary products.
In this Annual Report on Form 10‑K, the words “Miller Industries,” “the Company,” “we,” “our,” “ours” and “us” refer to Miller Industries, Inc. and its subsidiaries or any of them.
Towing and Recovery Equipment
We offer a broad range of towing and recovery equipment products that meet most customer design, capacity and cost requirements. We manufacture the bodies of wreckers and car carriers, which are installed on truck chassis manufactured by third parties. We frequently purchase the truck chassis for integration with our towing and recovery equipment and resale to our customers. Wreckers generally are used to recover and tow disabled vehicles and other equipment and range in type from the conventional tow truck to large recovery vehicles with rotating hydraulic booms and up to 100‑ton lifting capacities. Car carriers are specialized flatbed vehicles with hydraulic tilt mechanisms that enable a towing operator to drive or winch a vehicle onto the bed for transport. Car carriers transport new or disabled vehicles and other equipment and are particularly effective over longer distances. We also manufacture vehicle transport trailers.
Our products primarily are sold through independent distributors that serve all 50 states, Canada and Mexico, and other foreign markets including Europe, the Pacific Rim, the Middle East, South America and Africa, and through prime contractors to governmental entities. Additionally, as a result of our ownership of Jige International S.A. in France and Boniface Engineering, Ltd. in the United Kingdom, we have substantial distribution capabilities in Europe. While most of our distributor agreements do not generally contain exclusivity provisions, management believes that more than 85% of our independent distributors do not offer products of any other towing and recovery equipment manufacturer, which we believe is a testament to their loyalty to our brands. In addition to selling our products to towing operators, our independent distributors provide them with parts and service. We also utilize sales representatives to inform prospective end-users about our current product lines in an effort to drive sales to independent distributors. Management believes the strength of our distribution network and the breadth and quality of our product offerings are two key advantages over our competitors.
Product Lines
We manufacture a broad line of wrecker, car carrier and trailer bodies to meet a full range of customer design, capacity and cost requirements.
Wreckers. Wreckers are generally used to recover and tow disabled vehicles and other equipment and range in type from the conventional tow truck to large recovery vehicles with up to 100‑ton lifting capacities. Wreckers are available with specialized features, including underlifts, L-arms, crossbars and scoops, which lift disabled vehicles by the tires or front axle to minimize front end damage to the towed vehicles. Certain heavy-duty wrecker models offer rotating booms, which allow heavy-duty wreckers to recover vehicles from any angle, and remote control devices for recovery equipment. In addition, certain light-duty wreckers are equipped with automatic wheel-lift hookup devices that allow operators to engage a disabled or unattended vehicle without leaving the cab of the wrecker.
Our wreckers range in capacity from 4 to 100 tons, and are classified as either light-duty or heavy-duty, with wreckers of 16‑ton or greater capacity being classified as heavy-duty. Light-duty wreckers are used to remove vehicles from accident scenes and vehicles illegally parked, abandoned or disabled, and for general recovery. Heavy-duty wreckers are used in towing and recovery applications including overturned tractor trailers, buses, motor homes and other large vehicles.
2
Car Carriers. Car carriers are specialized flat-bed vehicles with hydraulic tilt mechanisms that enable a towing operator to drive or winch a vehicle onto the bed for transport. Car carriers are used to transport new or disabled vehicles and other equipment and are particularly effective for transporting vehicles or other equipment over longer distances. In addition to transporting vehicles, car carriers may also be used for other purposes, including transportation of industrial equipment. Most professional towing operators have car carriers in their fleets to complement their towing capabilities.
Transport Trailers. Our multi-vehicle transport trailers are specialized auto transport trailers with upper and lower decks and hydraulic ramps for loading vehicles. These trailers are used for moving multiple vehicles for auto auctions, car dealerships, leasing companies and other similar applications. These trailers are easy to load and transport 6 to 7 vehicles. The vehicles can be secured to transport quickly with ratchet and chain tie-downs that are mounted throughout the frame of the transport. Many professional towing operators have added auto transport trailers to their fleets to add to their service offerings.
Brand Names
We manufacture and market our wreckers, car carriers and trailers under ten separate brand names. Although certain brands overlap in terms of features, prices and distributors, each brand has its own distinctive image and customer base.
Century®. The Century® brand is our “top-of-the-line” brand and represents what management believes to be the broadest product line in the industry. The Century® line was started in 1974 and produces wreckers ranging from 8‑ton light-duty to 100‑ton heavy-duty models, and car carriers in lengths from 20 to 30 feet. Management believes that the Century® brand has a reputation as the industry’s leading product innovator.
Vulcan®. Our Vulcan® product line includes a range of premium light-duty and heavy-duty wreckers, ranging from 8‑ton light-duty to 75‑ton heavy-duty models, and car carriers.
Challenger®. Our Challenger® products compete with the Century® and Vulcan® products and constitute a third premium product line. Challenger® products consist of heavy-duty wreckers with capacities ranging from 25 to 75 tons. The Challenger® line was started in 1975 and is known for high-performance heavy-duty wreckers and aesthetic design.
Holmes®. Our Holmes® product line includes mid-priced wreckers with 4 to 16‑ton capacities, a 16‑ton rotator and a detachable towing unit (DTU). The Holmes® wrecker was first produced in 1916. Historically, the Holmes® name has been the most well-recognized and leading industry brand both domestically and internationally.
Champion®. The Champion® brand, which was introduced in 1991, includes car carriers which range in length from 19 to 21 feet. The Champion® product line, which is generally lower-priced, allows us to offer a full line of car carriers at various competitive price points.
Chevron™. Our Chevron™ product line is comprised primarily of premium car carriers. Chevron™ produces a range of premium single-car, multi-car and industrial carriers, as well as wreckers ranging from 8‑ton to 16‑ton models.
Eagle®. Our Eagle® products consist of light-duty wreckers with the “Eagle Claw®” hook-up system that allows towing operators to engage a disabled or unattended vehicle without leaving the cab of the tow truck. The “Eagle Claw®” hook-up system was originally developed for the repossession market. Since acquiring Eagle, we have upgraded the quality and features of the Eagle® product line and expanded its recovery capability.
Titan®. Our Titan® product line is comprised of premium multi-vehicle transport trailers which can transport up to 7 vehicles depending on configuration.
Jige™. Our Jige™ product line is comprised of a broad line of premium light-duty and heavy-duty wreckers and car carriers marketed primarily in Europe. Jige™ is a market leader best known for its innovative designs of car carriers and light-duty wreckers necessary to operate within the narrow confines of European cities, as well as heavy-duty wreckers.
Boniface™. Our Boniface™ product line is comprised primarily of premium heavy-duty wreckers marketed primarily in Europe. Boniface™ produces heavy-duty wreckers specializing in the long underlift technology required to tow modern European tour buses.
3
Product Development and Manufacturing
We have a long history of innovation in our products and manufacturing processes based on advanced technologies. Our Holmes® and Century® brand names are associated with four of the major innovations in the industry: the rapid reverse winch; the tow sling; the hydraulic lifting mechanism; and the underlift with parallel linkage and L-arms. Our engineering department currently consists of over 50 engineers who, in consultation with manufacturing personnel, use sophisticated computer-aided design and stress analysis systems to test new product designs and to integrate various product improvements. In addition to licensing new technologies, we have a continuing emphasis on research and development to achieve product innovations. We opened our free-standing research and development (R&D) facility in Chattanooga in 2019, where we are pursuing various innovations in our products and improvements in our manufacturing processes, some of which are intended to enhance the safety of our employees and reduce our environmental impact. These efforts led to our newest product, the M100, which was introduced in the fall of 2019 and we believe to be the world’s largest tow truck.
We manufacture wreckers, car carriers and trailers at six manufacturing facilities located in the United States, France and the United Kingdom. The manufacturing process for our products consists primarily of cutting and bending sheet steel or aluminum into parts that are welded together to form the wrecker, car carrier body or trailer. In addition, during the past several years, we have also begun to produce wrecker bodies using composites and other non-metallic materials. After the frame is formed, components such as hydraulic cylinders, winches, valves and pumps, which are purchased by us from third-party suppliers, are attached to the frame to form the completed wrecker or car carrier body. The completed body is either installed by us or shipped by common carrier to a distributor where it is then installed on a truck chassis. Generally, the wrecker or car carrier bodies are painted, and towing operators can select customized colors to coordinate with chassis colors or customer fleet colors. To the extent final painting is required before delivery, we either complete such painting or contract with independent paint shops for such services.
All of our domestic facilities have undergone substantial expansion and modernization projects during the period 2015 to 2019, as we have invested over $92 million on property, plant and equipment over this five-year period, including approximately $25 million on our Pennsylvania consolidation and expansion project and approximately $21 million on building and equipment improvements at our two Tennessee locations. These projects not only increased our production capacity, but also included installing sophisticated robotics and implementing other advanced technologies to optimize our manufacturing processes, enhance the safety of our employees and reduce our environmental impact.
We purchase raw materials and component parts from several sources. Although we have no long-term supply contracts, management believes we have good relationships with our primary suppliers. In recent years prices have fluctuated significantly, but we have experienced no significant problems in obtaining adequate supplies of raw materials and component parts to meet the requirements of our production schedules. Management believes that the materials used in the production of our products are available at competitive prices from an adequate number of alternative suppliers. Accordingly, management does not believe that the loss of a single supplier would have a material adverse effect on our business. We are closely monitoring the COVID-19 outbreak and the impact it may have on the Company’s supply chain and operations.
Sales, Distribution and Marketing
The industry categorizes the towing and recovery market into three general product types: light-duty wreckers; heavy-duty wreckers; and car carriers. The light-duty wrecker market consists primarily of professional wrecker operators, repossession towing services, local and national governmental entities and repair shop or salvage company owners. The heavy-duty market includes professional wrecker operators serving the needs of commercial vehicle operators as well as governmental entities. The car carrier market has expanded to include equipment rental companies that offer delivery service and professional towing operators who desire to complement their existing towing capabilities.
We sell our products to a diverse network of independent distributors, consisting of approximately 80 distributors in North America, who serve all 50 states, Canada and Mexico, and numerous distributors that serve other foreign markets. These distributors then sell our products to the end-users. In 2019, no single distributor accounted for more than 10% of our sales. Management believes our broad and diverse network of distributors provides us with the flexibility to adapt to market changes, lessens our dependence on particular distributors and reduces the impact of regional economic factors.
Our distributor network has been stable for many years, with a large majority of our distributors having been engaged to sell our products for more than 10 years, and many for more than 25 years. We believe this distributor loyalty results primarily from our high quality
4
and innovative products and our emphasis on customer service. These long-standing relations give our distributors a deep knowledge of our products and our corporate culture, allowing them to effectively promote our products to end-users. While we do not impose exclusivity requirements on our distributors, we believe that more than 85% of our independent distributors do not offer products of any other towing and recovery equipment manufacturer, which we believe is a testament to their loyalty to our brands.
We engage sales representatives who provide sales support to our entire network of independent distributors. Sales representatives receive commissions on direct sales based on product type and brand and generally are assigned specific territories in which to promote sales of our products and to maintain customer relationships. To support sales and marketing efforts, we produce demonstrator models that are used by our sales representatives and independent distributors. In addition to providing services to our network of independent distributors, our sales representatives sell our products to various governmental entities, including the U.S. federal government and foreign governments, through prime contractors.
We routinely respond to requests for proposals or bid invitations in consultation with our local distributors. Our products have been selected by the United States General Services Administration as an approved source for certain federal and defense agencies. We intend to continue to pursue federal, state and local government and foreign government contracting opportunities.
The towing and recovery equipment industry places heavy marketing emphasis on product exhibitions at national, regional and international trade shows. To focus our marketing efforts and to control marketing costs, we concentrate our efforts on the major trade shows each year, and we work with our network of independent distributors to concentrate on various regional shows.
Product Warranties and Insurance
We generally offer a 12‑month limited manufacturer’s product and service warranty on our wrecker and car carrier products. Our warranty generally provides for repair or replacement of failed parts or components. Our independent distributor customers regularly perform any needed warranty repair work themselves, rather than shipping products back to us, and then invoice us for the cost of the parts and labor. Management believes that we maintain adequate general liability and product liability insurance.
Backlog
We produce virtually all of our products to order. Our backlog is based upon customer purchase orders that we believe are firm. The level of backlog at any particular time, however, may not be an appropriate indicator of our future operating performance. Certain purchase orders may be subject to cancellation by the customer upon notification. Given our production and delivery schedules, management generally believes that the current backlog represents approximately four months of production.
Competition
The towing and recovery equipment manufacturing industry is highly competitive for sales to distributors and towing operators. Management believes that competition in our industry focuses on product quality and innovation, reputation, technology, customer service, product availability and price. We compete on the basis of each of these criteria, with an emphasis on product quality and innovation and customer service. Management also believes that a manufacturer’s relationship with distributors is a key component of success in the industry. Accordingly, we have invested substantial resources and management time in building and maintaining strong relationships with distributors. Management also believes that our products are regarded as high quality within their particular price points. Our marketing strategy is to continue to compete primarily on the basis of quality and reputation rather than solely on the basis of price, and to continue to target the growing group of professional towing operators who as end-users recognize the quality of our products.
Traditionally, the capital requirements for entry into the towing and recovery manufacturing industry have been relatively low. Management believes a manufacturer’s capital resources and access to technological improvements have become a more integral component of success in recent years. Certain of our competitors may have greater financial and other resources and may provide more attractive dealer and retail customer financing alternatives than we do.
5
Employees
We employed approximately 1,310 people as of December 31, 2019. None of our employees are covered by a collective bargaining agreement, though our employees in France and the United Kingdom have certain similar rights provided by their respective government’s employment regulations. We consider our employee relations to be good.
We have invested substantial time and resources in recent years to optimize the engagement and productivity of our workforce, which we believe is the foundation upon which we can maintain our competitive advantages in product quality and customer service. For example, we provide training programs that address skills shortages in our workforce, foster career development, and encourage proper use of technology and resources. These include our Welding School that teaching employees how to read blueprints, interpret weld symbols, and learn welding technique. In addition, Miller University One and Two were created to develop high potential employees for future leadership roles in the company, and provide change management, decision making, and problem-solving skills to future leaders. In addition, we seek to provide a healthy and safe workplace. The modernization projects at all our domestic facilities in the last few years included many advanced health and safety features, such as air filtration equipment. We are continually striving to better our workplace safety record and our five-year trend on workplace accidents reflects substantial improvement in this area. We also actively monitor the satisfaction and engagement of our workforce, including through periodic employee surveys conducted by third-party experts.
Intellectual Property Rights
Our development of the underlift parallel linkage and L-arms was at the time considered one of the most innovative developments in the wrecker industry. This technology continues to be significant primarily because it allows the damage-free towing of aerodynamic vehicles made of lighter weight materials. This technology, particularly the L-arms, is still used in a majority of commercial wreckers today. Our patents on the L-arm have expired, but we hold a number of utility and design patents for our products. We have also obtained the rights to use and develop certain technologies owned or patented by others. Management believes that, during the life of our patents on our technology, utilizing our patented technology without a license would be an infringement of such patents.
Our trademarks “M®” (stylized), “Miller Industries®” (with stylized “M”), “Century®,” “Holmes®,” “Champion®,” “Challenger®,” “Pro Star®,” “Street Runner®,” “Vulcan®,” “Right Approach®” and “Extreme Angle®,” among others, are registered with the United States Patent and Trademark Office. Management believes that our trademarks are well-recognized by dealers, distributors and end-users in their respective markets and are associated with a high level of quality and value.
Government Regulations and Environmental Matters
We strive to manufacture our products in a way that minimizes environmental impact and maximizes worker health and safety. Our operations are subject to federal, state and local laws and regulations relating to the generation, storage, handling, emission, transportation and discharge of materials into the environment. Management believes that we are in substantial compliance with all applicable federal, state and local provisions relating to the protection of the environment. The costs of complying with environmental protection laws and regulations have not had a material adverse impact on our financial condition or results of operations in the past.
We act as a subcontractor for certain U.S. and other government programs. As a result, we are subject to extensive regulations and requirements of the U.S. and other government agencies and entities that govern these programs, including with respect to the award, administration and performance of contracts under such programs.
We are also subject to various federal, state and non-U.S. laws and regulations related to privacy, data protection and cybersecurity, including the European Union's General Data Protection Regulation ("GDPR"), which became effective in May 2018. In addition, California’s Consumer Privacy Act came into effect on January 1, 2020, and enforcement will begin July 1, 2020. Many other states are also attempting to enact privacy laws that may impact us in the future.
We are also subject to the additional diligence and disclosure requirements adopted by the Securities and Exchange Commission (the “SEC”) in 2012 related to certain minerals sourced from the Democratic Republic of Congo or adjoining countries in connection with the Dodd-Frank Wall Street Reform and Consumer Protection Act (the “Dodd-Frank Act”). The SEC rules impose these obligations with respect to “conflict minerals,” defined as tin, tantalum, tungsten and gold, which are necessary to the functionality of a product manufactured, or contracted to be manufactured, by an SEC reporting company. If any “conflict minerals” that are necessary to the functionality of a product manufactured by an SEC reporting company originated in the Democratic Republic of Congo or an adjoining country, the
6
rules require the issuer to prepare and file a report addressing its efforts to exercise due diligence on the source of such “conflict minerals” and their chain of custody.
We are also subject to the Magnuson-Moss Warranty Federal Trade Commission Improvement Act which regulates the description of warranties on products. The description and substance of our warranties are also subject to a variety of federal, state and foreign laws and regulations applicable to the manufacturing of vehicle components. Management believes that continued compliance with various government regulations will not materially affect our operations.
Information About Our Executive Officers
Information relating to our current executive officers is set forth below. William G. Miller, II is the son of William G. Miller. Other than Messrs. Miller and Miller II, there are no family relationships among the executive officers, directors or nominees for director, nor are there any arrangements or understandings between any of the executive officers and any other persons pursuant to which they were selected as executive officers.
|
Name |
|
Age |
|
Position |
|
|
|
|
|
|
|
William G. Miller |
|
73 |
|
Chairman of the Board |
|
|
|
|
|
|
|
Jeffrey I. Badgley |
|
67 |
|
Co-Chief Executive Officer |
|
|
|
|
|
|
|
William G. Miller, II |
|
41 |
|
President and Co-Chief Executive Officer |
|
|
|
|
|
|
|
Frank Madonia |
|
71 |
|
Executive Vice President, Secretary and General Counsel |
|
|
|
|
|
|
|
Deborah L. Whitmire |
|
54 |
|
Executive Vice President, Chief Financial Officer and Treasurer |
|
|
|
|
|
|
|
Josias W. Reyneke |
|
63 |
|
Chief Information Officer |
William G. Miller has served as Chairman of the Board since April 1994. Mr. Miller served as President and Chief Executive Officer from 1994 to 1996 and as Chief Executive Officer from 1996 to 1997. Mr. Miller also served as Co-Chief Executive Officer from October 2003 to March 2011. Mr. Miller served as Chairman and President of Miller Group from 1990 to 1993 and as Chairman and CEO of Miller Group from 1993 to 1994. Prior to 1987, Mr. Miller served in various management positions for Bendix Corporation, Neptune International Corporation, Wheelabrator-Frye, Inc. and The Signal Companies, Inc.
Jeffrey I. Badgley has served as our Co-Chief Executive Officer since December 2013. Prior to serving as Co-Chief Executive officer, Mr. Badgley served in various executive positions, including Vice President (1994 – 1996), President (1996 – 2011), Chief Executive Officer (1997 – 2003; 2011 – 2013), and Co-Chief Executive Officer (2003 – 2011). In addition, Mr. Badgley served as a director from 1996 to 2014 and as Vice Chairman of the Board from 2011 to 2014. Mr. Badgley also served as Vice President to Miller Industries Towing from 1988 to 1996 and has been their President since 1996.
William G. Miller, II has served as a director since May 2014, our Co-Chief Executive Officer since December 2013 and President since March 2011, after serving as a Regional Vice President of Sales of Miller Industries Towing Equipment Inc. from November 2009 to February 2011. Mr. Miller II served as Vice President of Strategic Planning of the Company from October 2007 until November 2009. Mr. Miller II served as Light-Duty General Manager from November 2004 to October 2007 and as a Sales Representative of Miller Industries Towing Equipment Inc. from 2002 to 2004.
Frank Madonia has served as our Executive Vice President, Secretary and General Counsel since September 1998. From April 1994 to September 1998 Mr. Madonia served as our Vice President, General Counsel and Secretary. Mr. Madonia served as Secretary and General Counsel to Miller Industries Towing Equipment Inc. since its acquisition by Miller Group in 1990. From July 1987 through April 1994, Mr. Madonia served as Vice President, General Counsel and Secretary of Flow Measurement. Prior to 1987, Mr. Madonia served in various legal and management positions for United States Steel Corporation, Neptune International Corporation, Wheelabrator-Frye, Inc. and The Signal Companies, Inc.
7
Deborah L. Whitmire has served as a director since February 2020, our Executive Vice President, Chief Financial Officer and Treasurer since January 2017, after serving as our Vice President and Corporate Controller from January 2014 to December 2016 and Corporate Controller to Miller Industries Towing Equipment Inc. from March 2005 to January 2014. From April 2000 to March 2005, she also served as Director of Finance – Manufacturing to Miller Industries Towing Equipment Inc. In addition, she served as Controller to Miller Industries Towing Equipment Inc. from October 1997 to April 2000 and Accounting Manager to Miller Industries Towing Equipment Inc. from October 1996 to October 1997.
Josias W. Reyneke has served as our Chief Information Officer since January 2017, after serving as our Vice President of Operations to Miller Industries Towing Equipment Inc. from July 2011 to December 2016. From 2002 to 2011, Mr. Reyneke served as Director of Management Information Systems and Materials of Miller Industries Towing Equipment Inc. Mr. Reyneke joined Miller Industries Towing Equipment Inc. as a consultant in 1997 to assist with the implementation of an enterprise resource planning system and was subsequently offered the position of Director of Management Information Systems in 1998, a position he held until 2002. Prior to 1998, Mr. Reyneke also served in various management positions for SE Technologies, Wheels of Africa and Toyota South Africa.
Available Information
We file annual, quarterly and current reports and other information with the SEC. The SEC maintains a website at www.sec.gov that contains reports, proxy and information statements, and other information regarding issuers that file electronically with the SEC.
Our Internet website address is www.millerind.com. We make available free of charge through our website our Annual Reports on Form 10‑K, Quarterly Reports on Form 10‑Q and Current Reports on Form 8‑K, and amendments to those reports, as soon as reasonably practicable after we file them with, or furnish them to, the Securities and Exchange Commission. Information contained on our website is not part of this Annual Report on Form 10‑K or our other filings with the SEC.
Our Corporate Governance Guidelines, Code of Business Conduct and Ethics and the charters of the Audit, Compensation and Nominating Committees of the Board of Directors are also available on our website.
There are many factors that affect our business and the results of our operations, some of which are beyond our control. The following is a description of all known material risks that may cause the actual results of our operations in future periods to differ materially from those currently expected or desired. We encourage you to read this section carefully.
Our business is subject to the cyclical nature of our industry and changes in consumer confidence and in economic conditions in general. Adverse changes or continued uncertainty with respect to these factors may lead to a downturn in our business.
The towing and recovery industry is cyclical in nature. In recent years, the overall demand for our products and resulting revenues have been positively affected by recovering economic conditions and improving consumer sentiment. However, historically, the overall demand for our products and our resulting revenues have at times been negatively affected by wavering levels of consumer confidence; volatility and disruption in domestic and international capital and credit markets and the resulting decrease in the availability of financing for our customers and towing operators and the overall effects of global economic conditions. We remain concerned about the potential effects of these factors on the towing and recovery industry, and we continue to monitor our overall cost structure to see that it remains in line with business conditions. A prolonged economic downturn, including as a result of political unrest, terrorist acts, military conflict and disease outbreaks, and slow or negative growth in the domestic and global economy, could have a material adverse effect on our business, financial condition and results of operations for the foreseeable future.
Our dependence upon outside suppliers for our raw materials, including aluminum, steel, petroleum-related products and other purchased component parts, leaves us subject to changes in price and availability (including as a result of the imposition of additional tariffs and the impact of the outbreak of the coronavirus known as COVID-19) and delays in receiving supplies of such materials or parts.
We are dependent upon outside suppliers for our raw material needs and other purchased component parts, and events beyond our control could have an adverse effect on the cost or availability of raw materials and component parts. Steel, aluminum, fuel and other commodity prices have historically experienced high volatility depending on market conditions and global demand. Price increases or
8
changes in payment terms from our suppliers of raw materials or component parts could impact our ability to secure necessary raw materials or component parts, or to secure such materials and parts at favorable prices. In addition, government actions related to tariffs on imports and trade policies have impacted, and have the potential to further impact, pricing of raw materials, such as steel and aluminum. For example, in 2018 the United States government imposed import tariffs and restrictions on imports for steel products and aluminum products. The Company uses a substantial amount of imported steel and aluminum in its products and experienced increases in costs for these materials as a result of the tariffs and import quotas. To partially offset price increases for raw materials and component parts, we have, from time to time, implemented general price increases and cost surcharges. While we have attempted to pass these increased costs (including as a result of tariffs and import quotas) on to our customers, there can be no assurance that we will be able to continue to do so. Any further price increases for these or any other materials that we use would require a long lead time to implement while the higher material costs would be felt much sooner. In the future, if we experience increased prices or shortages for key materials that are essential to our manufacturing operations, such as steel and aluminum (including as a result of tariffs or import quotas), there is a substantial risk that the Company’s financial performance and competitive position could be materially adversely impacted.
Demand for our products also could be negatively affected by supply delays of truck chassis and other component parts used in our products. Our third party suppliers’ ability to supply us with truck chassis and component parts is limited by their available capacity to manufacture the component parts we require. We have experienced supply delays and limitations for component parts as our production levels have substantially increased over the last several years. If these delays continue or worsen, our customers may reduce their purchase levels with us and/or seek alternative solutions to meet their demand. At this time, we believe that sources of our raw materials and component parts will continue to be adequate to meet our requirements and that alternative sources are available. However, shortages, price increases or delays in shipments of our raw materials and component parts could have a material adverse effect on our financial performance, competitive position and reputation.
Additionally, in early 2020, an outbreak of the coronavirus known as COVID-19 occurred in China and other jurisdictions. While the Company does not have manufacturing operations in China and does not sell products directly into China, the extent of the outbreak and its impact on the markets served by the Company and on its operations (including its supply chain) are uncertain. A prolonged outbreak of COVID-19 could create disruptions that may, over time, slow down manufacturing in impacted jurisdictions and put pressure on the pricing and availability of raw materials and component parts used in our products. We are unable to determine the full impact of the outbreak at this time and will continue to closely monitor this developing situation.
Demand from our customers and towing operators is affected by the availability of capital and access to credit.
The ability of our customers and of towing operators to purchase our products is affected by the availability of capital and credit to them. Our independent distributor customers rely on floor plan financing in connection with the purchase of our products, and the availability of that financing on acceptable terms has a direct effect on the volume of their purchases. Additionally, in many cases, a towing operator’s decision to purchase our products from one of our distributors is dependent upon their ability to obtain financing upon acceptable terms. Volatility and disruption in the capital and credit markets, principally in the U.S. and Europe, in the past has decreased the availability of capital to, and credit capacity of, our customers and towing operators. In addition, in the past, certain providers of floor plan financing have exited the market, which made floor plan financing increasingly difficult for our independent distributor customers to secure at those times. This reduced availability of capital and credit has negatively affected the ability and capacity of our customers and of towing operators to purchase towing and related equipment. This, in turn, has negatively impacted sales of our products. If customers are unable to access capital or credit, it could materially and adversely affect our ability to sell our products, and as a result, could negatively affect our business and operating results.
Operational challenges caused by our increased sales volumes could result in material delays, increased costs and loss of business opportunities, which could negatively impact our operating results and financial condition.
Substantially increased sales of our products over the last five years have caused a variety of operating challenges, including supply chain constraints and production capacity limitations. The recent major additions and renovations to all our domestic production facilities have allowed us to effectively address these challenges, but they have nevertheless caused increased production costs and delayed deliveries to customers in some instances. These factors could in the future result in delay or termination of orders, the loss of sales and a negative impact on our reputation with our customers, all of which could materially adversely affect our business, financial condition and results of operations. In addition, our recent major additions and renovations to all our domestic facilities may not achieve our intended objectives of lowering costs, improving manufacturing efficiencies and increasing productivity, which could adversely affect our operating results and financial condition.
9
Our international operations are subject to various political, economic and other uncertainties that could adversely affect our business results, including by restrictive taxation or other government regulation and by foreign currency fluctuation.
Historically, a portion of our net sales occur outside the United States, primarily in Europe. In addition, we have manufacturing operations at two facilities located in the Lorraine region of France and manufacturing operations in Norfolk, England. As a result, our operations are subject to various political, economic and other uncertainties, including risks of restrictive taxation policies, changing political conditions and governmental regulations and trade policies. This includes the uncertainty surrounding the United Kingdom’s exit from the European Union, commonly referred to as “Brexit,” on European and worldwide economic conditions, and on our international sales. The United Kingdom formally left the European Union on January 31, 2020. A transition period through December 31, 2020 has been established to allow the United Kingdom and European Union to negotiate the terms of the United Kingdom’s withdrawal. However, there is continued uncertainty surrounding the future relationship between the United Kingdom and the European Union, including whether any trade agreements will be reached between them. Brexit could adversely affect European or worldwide political, regulatory, economic or market conditions and could contribute to instability in political institutions and regulatory agencies. Brexit could also have the effect of disrupting the free movement of goods, services, and people between the United Kingdom, the European Union and elsewhere.
In addition, a portion of our net sales derived outside the United States, as well as salaries of employees located outside the United States and certain other expenses, are denominated in foreign currencies, including the British pound sterling and the euro. We are, therefore, subject to risk of financial loss resulting from fluctuations in exchange rates of these currencies against the U.S. dollar. Brexit has caused, and may continue to result in, significant volatility in global stock markets and currency exchange rate fluctuations of the U.S. dollar relative to other foreign currencies in which we conduct business, including both the British pound sterling and the euro.
In addition, political unrest, terrorist acts, military conflict and disease outbreaks have increased the risks of doing business abroad in general. We are closely monitoring the COVID-19 outbreak and the impact it may have on the Company’s supply chain and operations.
Our sales to U.S. and other governmental entities through prime contractors are subject to special risks.
We act as a subcontractor for certain U.S. and other government programs. As a result, we are subject to extensive regulations and requirements of the U.S. and other government agencies and entities that govern these programs, including with respect to the award, administration and performance of contracts under such programs. Our U.S. and other government business is subject to the following risks, among others: (i) this business is susceptible to changes in government spending, which may reduce future revenues; (ii) most of our contracts with governmental entities through prime contractors are fixed-price contracts, and our actual costs on any of these contracts could exceed our projected costs, (iii) competition for the award of these contracts is intense, and we may not be successful in bidding on future contracts, and (iv) the products we sell to governmental entities are subject to highly technical requirements, and any failure to comply with these requirements could result in unanticipated retrofit costs, delayed acceptance of products, late or reduced payment or cancellation of the contract. Our inability to address any of the foregoing concerns could seriously harm our business, financial condition and results of operations.
We continue to be focused on efforts to secure new government orders to replace existing government projects as they are completed. Our inability to replace sales generated from government orders as they are completed would result in lower sales and have an adverse effect on our business, results of operations and financial condition.
Overall demand from our customers may be affected by increases in their fuel and insurance costs and changes in weather conditions.
In the past, our customers have experienced substantial increases in fuel and other transportation costs, and in the cost of insurance. Our customers also have, from time to time, been subject to unpredictable and varying weather conditions which could, among other things, impact the cost and availability of fuel and other materials. Any of these factors could negatively affect our customers’ capacity for purchasing towing and related equipment, and, consequently, have a material negative effect upon our business and operating results.
Failure to comply with domestic and foreign anti-corruption laws could have an adverse effect on our business.
Our international operations require us to comply with a number of U.S. and international laws and regulations, including those involving anti-bribery and anti-corruption. Failure to comply with the Foreign Corrupt Practices Act (“FCPA”), the U.K. Bribery Act, and other foreign anti-bribery laws could have an adverse effect on our business. Violations of these laws, or allegations of such violations, could
10
result in our incurring significant fees and having fines and criminal sanctions imposed on us or our employees, and could adversely impact our business with government entities.
Our competitors could impede our ability to attract or retain customers.
The towing and recovery equipment manufacturing industry is highly competitive. Capital requirements for entry into the towing and recovery manufacturing industry have been relatively low, which could result in an increase in the number of competitors entering the industry. Competition for sales exists domestically and internationally at the manufacturer, distributor and towing-operator levels and is based primarily on product quality and innovation, reputation, technology, customer service, product availability and price. Competition for sales also comes from the market for used towing and recovery equipment. Certain of our competitors may have substantially greater financial and other resources and may provide more attractive dealer and retail customer financing alternatives than us. If these competitors are able to make it more difficult for us to attract or retain customers, it could have a negative impact on our sales, revenue and financial performance.
Our future success depends upon our ability to develop or acquire proprietary products and technology and assertions against us relating to intellectual property rights could harm our business.
Historically, we have been able to develop or acquire patented and other proprietary product innovations which have allowed us to produce what management believes to be technologically advanced products relative to most of our competition. While we are continuing to develop new technology and apply for patents, if we are unable to develop or acquire new products and technology in the future, our ability to maintain market share, and, consequently, our revenues and operating results, may be negatively affected .
Third parties may claim that our products infringe their patents or other intellectual property rights. If a competitor were to challenge our patents, or assert that our products or processes infringe its patent or other intellectual property rights, we could incur substantial litigation costs, be forced to design around their patents, pay substantial damages or even be forced to cease our operations, any of which could be expensive and/or have an adverse effect on our operating results. Third party infringement claims, regardless of their outcome, would not only consume our financial resources, but also would divert the time and effort of our management and could result in our customers or potential customers deferring or limiting their purchase or use of the affected products or services until resolution of the litigation.
We depend upon skilled labor to manufacture our products, and if we experience problems hiring and retaining skilled labor, our business may be negatively affected.
The timely manufacture and delivery of our products requires an adequate supply of skilled labor, and the operating costs of our manufacturing facilities can be adversely affected by high turnover in skilled positions. Accordingly, our ability to increase sales, productivity and net earnings will be limited to a degree by our ability to employ the skilled laborers necessary to meet our requirements. We must attract, train and retain skilled employees while controlling related labor costs and maintaining our core values, including safety standards. Our ability to control labor costs is subject to numerous external factors, including prevailing wage rates and increases in healthcare and other insurance costs. There can be no assurance that we will be able to maintain an adequate skilled labor force necessary to efficiently operate our facilities. In addition, while our employees are not currently members of a union, there can be no assurance that the employees at any of our facilities will not choose to become unionized in the future.
A disruption in, or breach in security of, our information technology ("IT") systems or any violation of data protection laws could adversely impact our business and operations.
We rely on the accuracy, capacity and security of our IT systems and our ability to update these systems in response to the changing needs of our business. We use our IT systems to collect and store confidential and sensitive data, including information about our business, our customers, our suppliers and our employees. We rely on IT systems to protect this information and to keep financial records, process orders, manage inventory, coordinate shipments to customers, and operate other critical functions. Our IT systems may be disrupted or fail for a number of reasons, including natural disasters, such as fires; power loss; software “bugs”, hardware defects or human error or malfeasance; or security breaches caused by hacking, computer viruses, malware, ransomware or other cyber-attacks.
As technology continues to evolve, we anticipate that we will collect and store even more data in the future and that our systems will increasingly use remote communication features that are susceptible to both willful and unintentional security breaches. We have incurred costs and expect to incur significant additional costs in order to implement security measures that we feel are appropriate to protect
11
our IT systems. Despite these efforts, future attacks could result in our systems or data being breached and/or damaged by computer viruses or unauthorized physical or electronic access. Such a breach could result in theft of our intellectual property or trade secrets and/or unauthorized access to controlled data and personal information stored in connection with our human resources function. In the event of a breach in security that allows third parties access to personal information, we are subject to a variety of ever-changing laws on a global basis that may require us to provide notification to the data owners, and that may subject us to lawsuits, fines and other means of regulatory enforcement or harm employee morale.
Any disruption, outage or breach of our IT systems could result in interruption of our business operations, damage to our reputation and a loss of confidence in our security measures, all of which could adversely affect our business. In addition, if our systems are improperly implemented, breached, damaged or cease to function properly, we may have to make significant investments to fix or replace them. To the extent that any data is lost or destroyed or any confidential information is inappropriately disclosed or used, it could adversely affect our competitive position or customer relationships, harm our business and possibly lead to significant claims, liability, or fines based upon alleged breaches of contract or applicable laws. Regulators globally are also imposing greater monetary fines for privacy violations. For example, in 2016, the European Union adopted a new law governing data practices and privacy called the General Data Protection Regulation (“GDPR”), which became effective in May 2018. The law establishes new requirements regarding the handling of personal data, and non-compliance with the GDPR may result in monetary penalties of up to 4% of worldwide revenue. The GDPR and other changes in laws or regulations associated with the enhanced protection of certain types of sensitive data, such as healthcare data or other personal information, could increase our cost of providing our products and services.
Changes in the tax regimes and related government policies and regulations in the countries in which we operate could adversely affect our results and our effective tax rate.
As a result of our international operations, we are subject to various taxes in both U.S. and non-U.S. jurisdictions. Due to economic and political conditions, tax laws, regulations and rates in these various jurisdictions may be subject to significant change. Our future effective income tax rate could be affected by changes in the mix of earnings in countries with differing statutory tax rates, changes in the valuation of deferred tax assets or changes in tax laws or their interpretation. Changes to long-standing tax principles in the countries in which we operate could adversely affect our effective tax rate or result in higher cash tax liabilities. Increases in our effective tax rate or tax liabilities could have a material adverse effect on us.
The catastrophic loss of one of our manufacturing facilities could harm our business, financial condition and results of operations.
While we manufacture our products in several facilities and maintain insurance covering our facilities, including business interruption insurance to mitigate losses resulting from any production interruption or shutdown caused by an insured loss, a catastrophic loss of the use of all or a portion of any one of our manufacturing facilities due to accident, labor issues, weather conditions, natural disaster, civil unrest, terrorist acts, military conflict and disease outbreaks (including the outbreak of the coronavirus known as COVID-19), or otherwise, whether short or long-term, could materially harm our business, financial condition and results of operations. Any recovery under our insurance policies may not offset the lost sales or increased costs that may be experienced during the disruption of operations.
The effects of regulations relating to conflict minerals may adversely affect our business.
In 2012, the SEC adopted rules under the Dodd-Frank Wall Street Reform and Consumer Protection Act to improve transparency and accountability concerning the supply of certain minerals, known as “conflict minerals”, originating from the Democratic Republic of Congo and adjoining countries. These rules could adversely affect the sourcing, availability and pricing of such minerals if they are found to be used in the manufacture of our products, as the number of suppliers who provide conflict-free minerals may be limited. In addition, we have incurred and expect to incur additional costs to comply with the disclosure requirements, including costs related to determining the source of any of the relevant minerals and metals used in our products. The Company’s supply chain is complex. As a result, we have encountered and continue to expect significant difficulty in determining the country of origin or the source and chain of custody for all “conflict minerals” used in our products and disclosing that our products are “conflict free” (meaning that they do not contain “conflict minerals” that directly or indirectly finance or benefit armed groups in the Democratic Republic of the Congo or an adjoining country). We may face reputational challenges from customers, investors or others if we are unable to verify the origins for all “conflict minerals” used in our products. In such event, we may also face difficulties in satisfying customers who may require that all of the components of our products be certified as conflict mineral free.
12
Environmental and health and safety liabilities and requirements could require us to incur material costs.
We are subject to various U.S. and foreign laws and regulations relating to environmental protection and worker health and safety, including those governing discharges of pollutants into the ground, air and water; the generation, handling, use, storage, transportation, treatment and disposal of hazardous substances and waste materials; and the investigation and cleanup of contaminated properties. In certain cases, these regulatory requirements may limit the productive capacity of our operations.
Environmental and health-related requirements are complex, subject to change and have tended to become more and more stringent. Future developments could cause us to incur various expenditures and could also subject us to fines or sanctions, obligations to investigate or remediate contamination or restore natural resources, liability for third party property damage or personal injury claims and the imposition of new permitting requirements and/or the modification or revocation of our existing operating permits, among other effects. These and other developments could materially harm our business, financial condition and results of operation.
Any loss of the services of our key executives could have a material adverse impact on our operations.
Our success is highly dependent on the continued services of our management team. The loss of services of one or more key members of our senior management team could have a material adverse effect on us.
A product warranty or product liability claim in excess of our insurance coverage, or an inability to acquire or maintain insurance at commercially reasonable rates, could have a material adverse effect upon our business.
We are subject to various claims, including product warranty and product liability claims arising in the ordinary course of business, and may at times be a party to various legal proceedings incidental to our business. We maintain reserves and liability insurance coverage at levels based upon commercial norms and our historical claims experience. If we manufacture poor quality products or receive defective materials, we may incur unforeseen costs in excess of what we have reserved in our financial statements. A successful product warranty, product liability or other claim brought against us in excess of our insurance coverage, or the inability of us to acquire or maintain insurance at commercially reasonable rates, could have a material adverse effect upon our business, operating results and financial condition. In addition, we are subject to potential recalls of components or parts manufactured by suppliers which we purchase and incorporate into our towing and recovery equipment products, as well as potential recalls of our products from customers to cure manufacturing defects or in the event of a failure to comply with applicable regulatory standards or customers’ order specifications. Moreover, the adverse publicity that may result from a product liability claim, perceived or actual defect with our products or a product recall could have a material adverse effect on our ability to market our products successfully.
Our stock price may fluctuate greatly as a result of the general volatility of the stock market.
From time to time, there may be significant volatility in the market price for our common stock. Our quarterly operating results, changes in earnings estimated by analysts, if any, changes in general conditions in our industry or the economy or the financial markets or other developments affecting us, including our ability to pay dividends, could cause the market price of our common stock to fluctuate substantially.
Our charter and bylaws contain anti-takeover provisions that may make it more difficult or expensive to acquire us in the future or may negatively affect our stock price.
Our charter and bylaws contain restrictions that may discourage other persons from attempting to acquire control of us, including, without limitation, prohibitions on shareholder action by written consent and advance notice requirements regarding amendments to certain provisions of our charter and bylaws. In addition, our charter authorizes the issuance of up to 5,000,000 shares of preferred stock. The rights and preferences for any series of preferred stock may be set by the board of directors, in its sole discretion and without shareholder approval, and the rights and preferences of any such preferred stock may be superior to those of common stock and thus may adversely affect the rights of holders of common stock.
13
Our credit facility could restrict our ability to operate our business and failure to comply with its terms could adversely affect our business; our obligations to repurchase products from third-party lenders to our distributors could adversely impact our future revenues and financial condition.
Our credit facility contains customary representations and warranties, events of default, and financial, affirmative and negative covenants for loan agreements of this kind. In addition, covenants under our current credit facility restrict our ability to pay cash dividends if the Company would be in violation of the minimum tangible net worth test or the leverage ratio test in the current loan agreement as a result of the dividend, among various restrictions. We have been in compliance with these covenants throughout 2019 and anticipate that we will continue to be in compliance during 2020. If we fail to comply with the requirements of our current credit facility, such non-compliance would result in an event of default. If not waived by the bank, such event of default would result in the acceleration of any amounts due under the current credit facility.
We also have certain obligations to repurchase our products from third-party lenders if our distributors should default in their obligations to those lenders. Such repurchases could result in reduced net revenue in future periods as we resell such products and, if we are unable to sell the products, could adversely impact our financial condition.
We cannot assure you that we will continue to declare dividends on our common stock.
Our board of directors approved a dividend policy in 2011 to consider and pay quarterly dividends on our common stock subject to our ability to satisfy all applicable statutory requirements and our continued financial strength. While we currently intend to pay a quarterly dividend on shares of our common stock, to the extent that we have sufficient funds available for such purpose, the declaration, amount and payment of any future dividends on shares of common stock will be at the sole discretion of our board of directors and we may reduce or discontinue entirely the payment of such dividends at any time. Our board of directors may take into account general and economic conditions, our financial condition and operating results, capital requirements, restrictions in financing agreements and such other factors as our board of directors may deem relevant from time to time.
ITEM 1B. UNRESOLVED STAFF COMMENTS
None.
We operate four manufacturing facilities in the United States. The facilities are located in Ooltewah (Chattanooga), Tennessee; Hermitage, Pennsylvania; and two in Greeneville, Tennessee. The Ooltewah plant, containing approximately 343,000 square feet, produces light and heavy-duty wreckers; the Hermitage plant, containing approximately 279,000 square feet, produces car carriers; and the Greeneville plants, containing an aggregate of approximately 210,000 square feet, produces car carriers, heavy-duty wreckers and trailers. We opened our free-standing R&D facility in Chattanooga in 2019, containing an aggregate of approximately 34,000 square feet, where we are pursuing various innovations in our products and manufacturing processes.
Since 2015, the Company has modernized and expanded all of its domestic facilities. For a discussion of these capital projects, see “Executive Overview” in Item 7–“Management’s Discussion and Analysis of Financial Condition and Results of Operations,” of this Annual Report on Form 10‑K.
We also have two manufacturing facilities and one storage facility located in the Lorraine region of France, which have, in the aggregate, approximately 205,000 square feet, and manufacturing operations in Norfolk, England, with approximately 48,000 square feet.
We are, from time to time, a party to litigation arising in the normal course of our business. Litigation is subject to various inherent uncertainties, and it is possible that some of these matters could be resolved unfavorably to us, which could result in substantial damages against us. We have established accruals for matters that are probable and reasonably estimable and maintain product liability and other insurance that management believes to be adequate. Management believes that any liability that may ultimately result from the resolution of these matters in excess of available insurance coverage and accruals will not have a material adverse effect on our consolidated financial position or results of operations.
14
15
ITEM 5. MARKET FOR REGISTRANT’S COMMON EQUITY, RELATED STOCKHOLDER MATTERS AND ISSUER PURCHASES OF EQUITY SECURITIES
Market Price of and Dividends on the Registrant’s Common Equity and Related Stockholder Matters
Our common stock is traded on the New York Stock Exchange under the symbol “MLR.” As of February 28, 2020, there were approximately 435 registered holders of record of our common stock. The number of record holders does not include persons who held our common stock in nominee or “street name” accounts through brokers.
The Company has paid consecutive quarterly cash dividends since May 2011. For more information on dividends, see Note 7 to our Consolidated Financial Statements. Any future determination as to the payment of cash dividends will depend upon such factors as earnings, capital requirements, our financial condition, restrictions in financing agreements and other factors deemed relevant by our board of directors. Covenants under our current credit facility restrict the payment of cash dividends if the Company would be in violation of the minimum tangible net worth test or the leverage ratio test in the current loan agreement as a result of the dividend, among various other restrictions.
Sales of Unregistered Securities
We did not sell any unregistered securities during the year ended December 31, 2019.
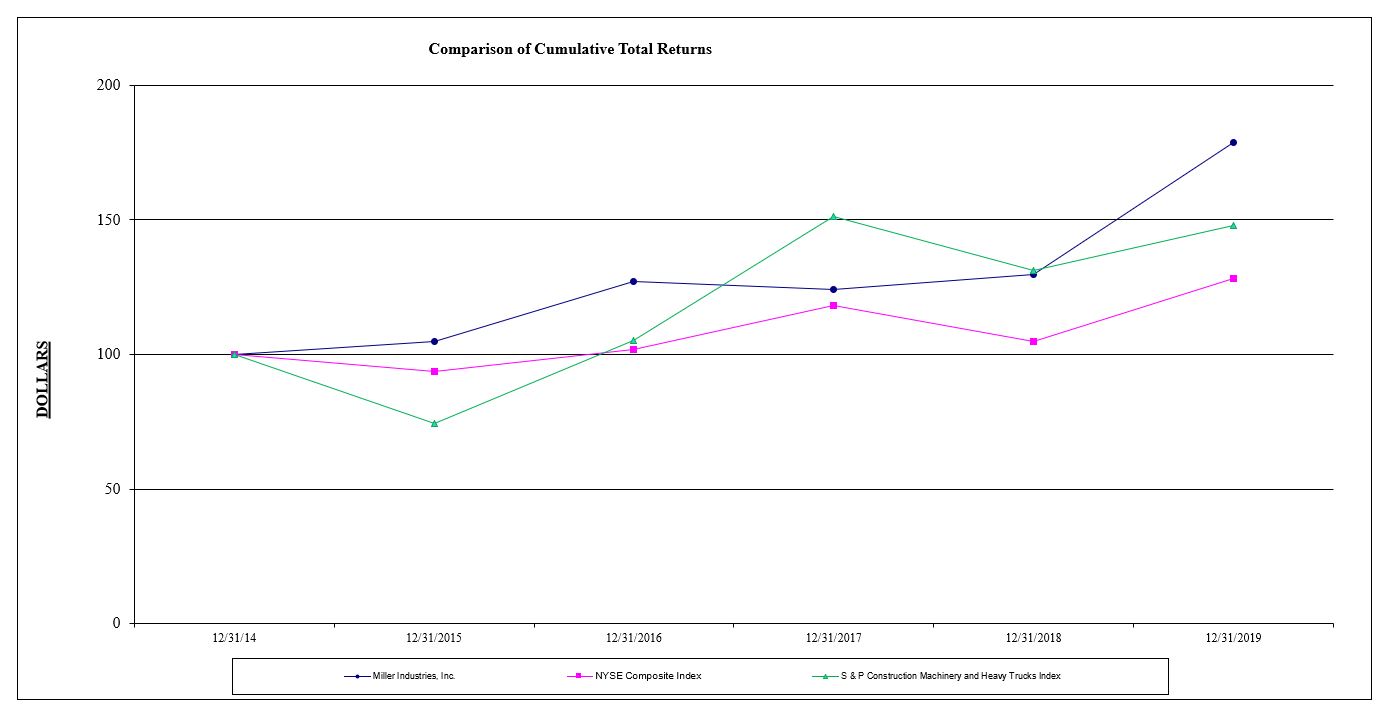
Performance Graph
The following line graph compares the percentage change in the cumulative shareholder return of our common stock with The New York Stock Exchange Composite Index and the Standard & Poor’s Construction Machinery & Heavy Trucks Index over the period of time from December 31, 2014 through December 31, 2019. The respective returns assume reinvestment of dividends paid.
16
|
|
|
12/31/2014 |
|
12/31/2015 |
|
12/31/2016 |
|
12/31/2017 |
|
12/31/2018 |
|
12/31/2019 |
||||||
|
Miller Industries, Inc. |
|
|
100 |
|
|
105 |
|
|
127 |
|
|
124 |
|
|
130 |
|
|
179 |
|
NYSE Composite Index |
|
|
100 |
|
|
94 |
|
|
102 |
|
|
118 |
|
|
105 |
|
|
128 |
|
S&P Construction Machinery & Heavy Trucks Index |
|
|
100 |
|
|
74 |
|
|
105 |
|
|
151 |
|
|
131 |
|
|
148 |
ITEM 6. SELECTED FINANCIAL DATA
The following table presents selected statements of income data and selected balance sheet data on a consolidated basis. We derived the selected historical consolidated financial data from our audited consolidated financial statements and related notes. You should read this data together with Item 7–“Management’s Discussion and Analysis of Financial Condition and Results of Operations” and our consolidated financial statements and related notes that are a part of this Annual Report on Form 10‑K.
|
|
|
Year Ended December 31, |
|||||||||||||
|
|
|
2019 |
|
2018 |
|
2017 |
|
2016 |
|
2015 |
|||||
|
|
|
(In thousands except per share data) |
|||||||||||||
|
Statements of Income Data: |
|
|
|
|
|
|
|
|
|
|
|
|
|
|
|
|
|
|
|
|
|
|
|
|
|
|
|
|
|
|
|
|
|
Net Sales |
|
$ |
818,166 |
|
$ |
711,706 |
|
$ |
615,101 |
|
$ |
601,119 |
|
$ |
540,966 |
|
Costs of operations |
|
|
721,678 |
|
|
628,370 |
|
|
548,000 |
|
|
536,840 |
|
|
483,353 |
|
Gross Profit |
|
|
96,488 |
|
|
83,336 |
|
|
67,101 |
|
|
64,279 |
|
|
57,613 |
|
Operating Expenses: |
|
|
|
|
|
|
|
|
|
|
|
|
|
|
|
|
Selling, general and administrative expenses |
|
|
43,394 |
|
|
39,542 |
|
|
35,561 |
|
|
32,318 |
|
|
31,491 |
|
Non-operating (Income) Expenses: |
|
|
|
|
|
|
|
|
|
|
|
|
|
|
|
|
Interest expense, net |
|
|
2,378 |
|
|
1,878 |
|
|
1,588 |
|
|
1,161 |
|
|
919 |
|
Other (income) expense, net |
|
|
331 |
|
|
253 |
|
|
(387) |
|
|
(277) |
|
|
340 |
|
Total expense, net |
|
|
46,103 |
|
|
41,673 |
|
|
36,762 |
|
|
33,202 |
|
|
32,750 |
|
|
|
|
|
|
|
|
|
|
|
|
|
|
|
|
|
|
Income before income taxes |
|
|
50,385 |
|
|
41,663 |
|
|
30,339 |
|
|
31,077 |
|
|
24,863 |
|
Income tax provision |
|
|
11,274 |
|
|
7,917 |
|
|
7,323 |
|
|
11,155 |
|
|
8,887 |
|
Net income |
|
$ |
39,111 |
|
$ |
33,746 |
|
$ |
23,016 |
|
$ |
19,922 |
|
$ |
15,976 |
|
|
|
|
|
|
|
|
|
|
|
|
|
|
|
|
|
|
Basic income per common share |
|
$ |
3.43 |
|
$ |
2.96 |
|
$ |
2.02 |
|
$ |
1.76 |
|
$ |
1.41 |
|
Diluted income per common share |
|
$ |
3.43 |
|
$ |
2.96 |
|
$ |
2.02 |
|
$ |
1.75 |
|
$ |
1.41 |
|
Weighted average shares outstanding: |
|
|
|
|
|
|
|
|
|
|
|
|
|
|
|
|
Basic |
|
|
11,400 |
|
|
11,388 |
|
|
11,368 |
|
|
11,346 |
|
|
11,324 |
|
Diluted |
|
|
11,400 |
|
|
11,393 |
|
|
11,385 |
|
|
11,374 |
|
|
11,360 |
|
|
|
December 31, |
|||||||||||||
|
|
|
2019 |
|
2018 |
|
2017 |
|
2016 |
|
2015 |
|||||
|
Balance Sheet Data: |
|
|
|
|
|
|
|
|
|
|
|
|
|
|
|
|
Working capital |
|
$ |
163,170 |
|
$ |
149,830 |
|
$ |
125,734 |
|
$ |
119,797 |
|
$ |
121,046 |
|
Total assets |
|
|
391,967 |
|
|
368,184 |
|
|
317,238 |
|
|
297,438 |
|
|
268,356 |
|
Long-term obligations (1) |
|
|
7,061 |
|
|
15,838 |
|
|
10,606 |
|
|
5,000 |
|
|
— |
|
Common shareholders’ equity |
|
|
257,927 |
|
|
227,563 |
|
|
203,100 |
|
|
184,602 |
|
|
173,862 |
|
|
|
December 31, |
|||||||||||||
|
|
|
2019 |
|
2018 |
|
2017 |
|
2016 |
|
2015 |
|||||
|
Other Data: |
|
|
|
|
|
|
|
|
|
|
|
|
|
|
|
|
Cash dividend per common share |
|
$ |
0.72 |
|
$ |
0.72 |
|
$ |
0.72 |
|
$ |
0.68 |
|
$ |
0.64 |
|
(1) |
Long-term obligations consist of outstanding balances on credit facility, lease obligations, and other long-term loans, including current portions. Noncurrent taxes payable and deferred income tax liability are excluded. |
17
ITEM 7. MANAGEMENT’S DISCUSSION AND ANALYSIS OF FINANCIAL CONDITION AND RESULTS OF OPERATIONS
The following discussion of our results of operations and financial condition should be read in conjunction with the Consolidated Financial Statements and Notes thereto. Unless the context indicates otherwise, all dollar amounts in this Management’s Discussion and Analysis of Financial Condition and Results of Operations are in thousands.
Executive Overview
Miller Industries, Inc. is The World’s Largest Manufacturer of Towing and Recovery Equipment®, with domestic manufacturing subsidiaries in Tennessee and Pennsylvania, and foreign manufacturing subsidiaries in France and the United Kingdom. We offer a broad range of equipment to meet our customers’ design, capacity and cost requirements under our Century®, Vulcan®, Challenger®, Holmes®, Champion®, Chevron™, Eagle®, Titan®, Jige™ and Boniface™ brand names.
Our management focuses on a variety of key indicators to monitor our overall operating and financial performance. These indicators include measurements of revenue, operating income, gross margin, net income, earnings per share, capital expenditures and cash flow.
We derive revenues primarily from product sales made through our network of domestic and foreign independent distributors. Our revenues are sensitive to a variety of factors including general economic conditions as well as demand for, and price of, our products, our technological competitiveness, our reputation for providing quality products and reliable service, competition within our industry, and the cost and availability of raw materials (including aluminum, steel and petroleum-related products) and component parts.
Our history of innovation in the towing and recovery industry has been an important factor behind our growth over the last decade and we believe that our continued emphasis on research and development will be a key factor in our future growth. Our recent domestic plant expansion and modernization projects have installed sophisticated robotics and implemented other advanced technologies to optimize our manufacturing processes. We are in the process of implementing an enterprise software solution which we expect to substantially improve our administrative efficiency and customer service levels. We opened our free-standing R&D facility in Chattanooga in 2019, where we pursue various innovations in our products and manufacturing processes, some of which are intended to enhance the safety of our employees and reduce our environmental impact. Our latest new product, the M100, which we believe to be the world’s largest tow truck, was introduced in the fall of 2019.
All of our domestic facilities have undergone substantial expansion and modernization projects during the period 2015 to 2019, as we have invested over $92,000 on property, plant and equipment over this five-year period, including approximately $25,000 on our Pennsylvania consolidation and expansion project and approximately $21,000 on building and equipment improvements at our two Tennessee locations. These projects not only increased our production capacity, but also included installing sophisticated robotics and implementing other advanced technologies to optimize our manufacturing process.
Our industry is cyclical in nature. In recent years, the overall demand for our products and resulting revenues have been positively affected by favorable economic conditions, such as lower fuel prices, and positive consumer sentiment in our industry. However, historically, the overall demand for our products and our resulting revenues have at times been negatively affected by:
|
· |
wavering levels of consumer confidence; |
|
· |
volatility and disruption in domestic and international capital and credit markets and the resulting decrease in the availability of financing, including floor plan financing, for our customers and towing operators; |
|
· |
significant periodic increases in fuel and insurance costs and their negative effect on the ability of our customers to purchase towing and related equipment; and |
|
· |
the overall effects of global, political, economic and health conditions. |
We remain concerned about the continuing effects of these factors on the towing and recovery industry, and we continue to monitor our overall cost structure to see that it remains in line with business conditions. Government orders were down somewhat in 2019 from the
18
prior years, due primarily to the timing of customer delivery requirements. We also continue to be focused on efforts to secure new government orders to replace existing government projects as they are completed.
In addition, we have been and will continue to be affected by changes in the prices that we pay for raw materials, particularly aluminum, steel, petroleum-related products and other raw materials, which represent a substantial part of our total cost of operations. For example, in 2018 the U.S. government imposed certain import tariffs and quantitative restrictions on imports of steel products and aluminum products, which resulted in increases in the prices we paid for these materials. We have implemented price increases on our products to offset price increases in the raw materials that we use. We also developed alternatives to some of the components used in our production process that incorporate these raw materials, and our suppliers have implemented these alternatives in the production of our component parts. We continue to monitor raw material prices and availability in order to more favorably position the Company in this dynamic market.
Additionally, in early 2020, an outbreak of COVID-19 occurred in China and other jurisdictions. A prolonged outbreak of COVID-19 could put pressure on our manufacturing capabilities and on the pricing and availability of raw materials and component parts necessary for our products. We are closely monitoring this developing situation and the impact it may have on the Company’s supply chain and operations.
As of December 31, 2019 and 2018, respectively, the Company owed $4,998 and $15,000 under its primary credit facility.
Critical Accounting Policies
Our consolidated financial statements are prepared in accordance with accounting principles generally accepted in the United States of America, which require us to make estimates. Certain accounting policies are deemed “critical,” as they require management’s highest degree of judgment, estimations and assumptions. A discussion of critical accounting policies, the judgments and uncertainties affecting their application and the likelihood that materially different amounts would be reported under different conditions or using different assumptions follows:
Accounts Receivable
We extend credit to customers in the normal course of business. Collections from customers are continuously monitored and an allowance for doubtful accounts is maintained based on historical experience and any specific customer collection issues. While such bad debt expenses have historically been within expectations and the allowance established, there can be no assurance that we will continue to experience the same credit loss rates as in the past.
Inventory
Inventory costs include materials, labor and factory overhead. Inventories are stated at the lower of cost or net realizable value, determined on a first-in, first-out basis. Appropriate consideration is given to obsolescence, valuation and other factors in determining net realizable value. Revisions of these estimates could result in the need for adjustments.
Long-Lived Assets
Long-lived assets are reviewed for impairment whenever events or circumstances indicate that the carrying amount of these assets may not be fully recoverable. When a determination has been made that the carrying amount of long-lived asset may not be fully recovered, the amount of impairment is measured by comparing an asset’s estimated fair value to its carrying value. The determination of fair value is based on projected future cash flows discounted at a rate determined by management, or if available, independent appraisals or sales price negotiations. The estimation of fair value includes significant judgment regarding assumptions of revenue, operating costs, interest rates, property and equipment additions, and industry competition and general economic and business conditions among other factors. We believe that these estimates are reasonable; however, changes in any of these factors could affect these evaluations. Based on these estimates, we believe that our long-lived assets are appropriately valued.
Goodwill
Goodwill is tested for impairment annually or if an event or circumstance occurs that would more likely than not reduce the fair value of the reporting unit below the carrying amount. Goodwill is reviewed for impairment utilizing a qualitative assessment and, if
19
necessary, a quantitative assessment. If we perform a qualitative analysis of goodwill and determine that fair value more likely than not exceeds the carrying value of the reporting unit, no further testing is needed. Alternatively, if we elect to utilize a quantitative assessment, an impairment loss would be recognized to the extent that the carrying value of the reporting unit exceeds its fair value, not to exceed the carrying value of the goodwill. We cannot predict the occurrence of certain events or changes in circumstances that might adversely affect the carrying value of goodwill. Such events might include, but are not limited to, the impact of the economic environment or a material change in a relationship with significant customers.
Warranty Reserves
We estimate expense for product warranty claims at the time products are sold. These estimates are established using historical information about the nature, frequency, and average cost of warranty claims. We review trends of warranty claims and take actions to improve product quality and minimize warranty claims. We believe the warranty reserve is adequate; however, actual claims incurred could differ from the original estimates, requiring adjustments to the accrual.
Income Taxes
Our income tax expense, deferred tax assets and liabilities for unrecognized tax benefits reflect management’s best assessment of estimated current and future taxes to be paid. We are subject to income taxes in both the United States and foreign jurisdictions. Significant judgments and estimates are required in determining the consolidated income tax expense.
Deferred income taxes arise from temporary differences between the tax basis of assets and liabilities and their reported amounts in the financial statements, which will result in deductible or taxable amounts in the future. In evaluating our ability to recover our deferred tax assets within the jurisdiction from which they arise, we consider all available positive and negative evidence, including scheduled reversals of deferred tax liabilities, projected future taxable income, tax-planning strategies, and results of recent operations. The assumptions about future taxable income require significant judgment and are consistent with the plans and estimates we use to manage the underlying businesses.
The calculation of our tax liabilities involves dealing with uncertainties in the application of complex tax laws and regulations in multiple jurisdictions. Accounting Standards Codification (“ASC”) 740 states that a tax benefit from an uncertain tax position may be recognized when it is more likely than not that the position will be sustained upon examination, including resolutions of any related appeals or litigation process, on the basis of the technical merits.
We (1) record unrecognized tax benefits as liabilities in accordance with ASC 740 and (2) adjust these liabilities when our judgment changes because of the evaluation of new information not previously available to us. Because of the complexity of some of these uncertainties, the ultimate resolution may result in a payment that is materially different from our current estimate of the unrecognized tax benefit liabilities. These differences will be reflected as increases or decreases to income tax expense in the period in which new information is available.
Revenues
Under our accounting policies, revenues are recognized when obligations under the terms of a contract with a customer are satisfied. Generally, this occurs upon shipment, which is when control has transferred to independent distributors or other customers. From time to time, revenue is recognized under a bill and hold arrangement. Recognition of revenue on bill and hold arrangements occurs when control transfers to the customer. Our policy requires the reason for the bill and hold arrangement to be substantive, and the product to be separately identified as belonging to the customer, ready for physical transfer, and unavailable to be used or directed to another customer.
Revenue is measured as the amount of consideration expected to be received in exchange for the transfer of products. Sales and other taxes collected concurrent with revenue-producing activities are excluded from revenue. Warranty related costs are recognized as an expense at the time products are sold. Depending on the terms of the arrangement, for certain contracts the Company may defer the recognition of a portion of the consideration received because a future obligation has not yet been satisfied, such as an extended service contract. An observable stand-alone selling price for separate performance obligations or a cost plus margin approach is utilized when one is not available.
20
While we manufacture only the bodies of wreckers, which are installed on truck chassis manufactured by third parties, we frequently purchase truck chassis for resale to our customers. Sales of company-purchased truck chassis are included in net sales. Margin percentages are substantially lower on completed recovery vehicles containing company-purchased chassis.
Foreign Currency Translation
The functional currency for our foreign operations is the applicable local currency. The translation from the applicable foreign currencies to U.S. dollars is performed for balance sheet accounts using current exchange rates in effect at the balance sheet date, historical rates for equity and the weighted average exchange rate during the period for revenue and expense accounts. Foreign currency translation adjustments are included in shareholders’ equity. Intercompany transactions denominated in a currency other than the functional currency are remeasured into the functional currency. Gains and losses resulting from foreign currency transactions are included in other (income) expense, net in our consolidated statements of income.
Results of Operations
The following table sets forth, for the years indicated, the components of the consolidated statements of income expressed as a percentage of net sales.
|
|
|
2019 |
|
2018 |
|
2017 |
|
|
Net Sales |
|
100.0 |
% |
100.0 |
% |
100.0 |
% |
|
Costs of operations |
|
88.2 |
% |
88.3 |
% |
89.1 |
% |
|
Gross Profit |
|
11.8 |
% |
11.7 |
% |
10.9 |
% |
|
Operating Expenses: |
|
|
|
|
|
|
|
|
Selling, general and administrative |
|
5.3 |
% |
5.6 |
% |
5.8 |
% |
|
Non-operating (income) expenses |
|
|
|
|
|
|
|
|
Interest expense, net |
|
0.3 |
% |
0.3 |
% |
0.3 |
% |
|
Other (income) expense, net |
|
— |
% |
(0.1) |
% |
(0.1) |
% |
|
Total expenses, net |
|
5.6 |
% |
5.8 |
% |
6.0 |
% |
|
Income before income taxes |
|
6.2 |
% |
5.9 |
% |
4.9 |
% |
Year Ended December 31, 2019 Compared to Year Ended December 31, 2018
Net sales were $818,166 for the year ended December 31, 2019, compared to $711,706 for the year ended December 31, 2018, an increase of 15.0%. The increase in revenue was primarily attributable to increased demand levels driven by continued strong economic conditions and positive consumer sentiment in both domestic and international markets. Net domestic sales increased during the period from $574,806 to $697,002, and net foreign sales decreased from $136,900 to $121,164 during the same period. The increase in domestic sales in response to continued strong demand was facilitated by the production capabilities gained from our capital projects completed in recent years at all of our domestic facilities. The decrease in foreign sales was primarily due to a shift in production and deliveries from government orders and other foreign customers to domestic customers due to the timing of customer requirements.
Costs of operations increased 14.8% to $721,678 for the year ended December 31, 2019 from $628,370 for the year ended December 31, 2018, which was attributable to increased production resulting from the strong demand levels. Overall, costs of operations as a percentage of net sales decreased from 88.3% for the year ended December 31, 2018 to 88.2% for the year ended December 31, 2019, primarily due to product mix and continued efforts to increase production efficiencies and monitor costs while meeting customer demand.
Selling, general and administrative expenses for the year ended December 31, 2019 increased to $43,394 from $39,542 for the year ended December 31, 2018, primarily due to increases in marketing and sales-related expenses, software licensing fees, salary and bonus related expenses, and other professional fees. As a percentage of net sales, selling, general and administrative expenses decreased to 5.3% for 2019 from 5.6% for 2018, primarily due to efficiencies gained from our recently completed capital projects and a continual focus on the enhancement of production capabilities.
21
Interest expense, net increased to $2,378 for the year ended December 31, 2019 from $1,878 for the year ended December 31, 2018. Increases in interest expense, net were primarily due to increases in interest on distributor floor planning, increases in interest to chassis suppliers, and increased credit facility borrowing levels under the credit facility during the first half of 2019.
When the Company has transactions that are denominated in a currency other than its functional currency, the Company is exposed to foreign currency transaction risk and must record gains and losses through other (income) expense when the related balance sheet items are remeasured in the functional currency of the Company. Other (income) expense, net is composed primarily of these foreign currency exchange gains and losses, with the remainder being composed of gains and losses on disposals of equipment. The Company experienced a net foreign currency exchange loss of $274 for 2019 compared to a net exchange loss of $97 for 2018.
The provision for income taxes for the years ended December 31, 2019 and 2018 reflects a combined federal, state and foreign tax rate of 22.4% and 19.0%, respectively, which corresponds to a tax provision of $11,274 for 2019 as compared to $7,917 for 2018. Our tax rate in 2019 compares unfavorably to 2018 primarily due to a favorable adjustment to the deemed repatriation tax liability in 2018 that was paid in 2018 and no longer applies to current and future tax periods. For more information on the effective tax rate, see Note 6 to our Consolidated Financial Statements.
Year Ended December 31, 2018 Compared to Year Ended December 31, 2017
For a comparison of the 2018 to 2017 reporting periods, see Part II, Item 7. Management’s Discussion and Analysis of Financial Condition and Results of Operations - “Results of Operations - Year Ended December 31, 2018 Compared to Year Ended December 31, 2017” of our Annual Report on Form 10-K filed on March 6, 2019 for the fiscal year ended December 31, 2018.
Liquidity and Capital Resources
Cash provided by operating activities during 2019 was $35,132, compared to $21,897 provided during 2018. Cash provided by operating activities is generally attributable to the receipt of payments from our customers as settlement of their contractual obligation once we have fulfilled all performance obligations related to our contracts with them. These cash receipts are netted with payments for purchases of inventory, payments for materials used in manufacturing, and other payments that are necessary in the ordinary course of our operations, such as those for utilities and taxes. Cash from operations in 2019 was favorably impacted by increases in revenue growth resulting from our incremental increases in production capacities and favorable changes in inventory levels. During 2019, we have largely used available cash flow from operations to pay for capital expenditures, to pay dividends and to repay debt under our credit facility. Cash from operations in 2018 was favorably impacted by increases in production and gross profit margin, partially offset by timing differences between revenue recognition and cash receipts from customers.
Cash used in investing activities during 2019 was $17,063, compared to $13,201 used during 2018. The cash used in investing activities for 2019 and 2018 was primarily for the purchase of property, plant and equipment relating to capital projects.
Cash used in financing activities during 2019 was $18,597, compared to $2,965 used during 2018. The cash used in financing activities in 2019 was primarily attributable to net payments on the credit facility of $10,002, dividend payments of $8,208, net payments on our French subsidiary’s loan of $367, and an immaterial amount of payments on finance lease obligations. The cash used in financing activities in 2018 was primarily attributable to dividend payments of $8,200, partially offset by net borrowings on the credit facility of $5,000, exercises of stock options, and a small amount of net proceeds from our French subsidiary’s loan. The borrowings in 2018 under the credit facility were primarily used to finance working capital and various capital expenditure projects.
As of December 31, 2019, we had cash and cash equivalents of $26,072. Our primary cash requirements include working capital, capital expenditures, the funding of any declared cash dividends and principal and interest payments on indebtedness. At December 31, 2019, we had commitments of approximately $3,583 for the acquisition of property and equipment and approximately $8,430 in software license fees. We expect our primary sources of cash to be cash flow from operations and cash and cash equivalents on hand at December 31, 2019, with additional borrowings under our credit facility being available as needed. We expect these sources to be sufficient to satisfy our cash needs during 2019 and for the next several years. However, our ability to satisfy our cash needs will substantially depend upon a number of factors including our future operating performance, taking into account the economic, regulatory and other factors discussed above and elsewhere in this Annual Report, as well as financial, business and other factors, many of which are beyond our control.
22
At December 31, 2019 and 2018, $18,103 and $15,815, respectively, of the Company’s cash and temporary investments were held by foreign subsidiaries based in the local currency. We do not currently have plans to repatriate undistributed foreign earnings to the United States and have not determined any timeline or amount for any such future distributions.
During 2018, the Company completed the construction of an administrative building at its Ooltewah, Tennessee facility. During 2019, in addition to investments in manufacturing equipment technology, the Company purchased a facility in Chattanooga to be used in research and development and other various other activities. Total expenditures on these capital projects during 2018 and 2019 were approximately $4,219.
For a discussion of the 2017 reporting period, see Part II, Item 7. Management’s Discussion and Analysis of Financial Condition and Results of Operations - “Liquidity and Capital Resources” of our Annual Report on Form 10-K filed on March 6, 2019 for the fiscal year ended December 31, 2018.
Contractual Obligations
The following is a summary of our contractual obligations as of December 31, 2019.
|
|
|
Payment Due By Period (in thousands) |
|||||||||||||
|
|
|
|
|
Less than |
|
|
|
|
|
|
|
More than |
|||
|
Contractual Obligations (1)(2) |
|
Total |
|
1 year |
|
1-3 years |
|
3-5 years |
|
5 years |
|||||
|
Operating and Finance Lease Obligations |
|
$ |
1,868 |
|
$ |
404 |
|
$ |
687 |
|
$ |
487 |
|
$ |
290 |
|
Purchase Obligations (2) |
|
|
51,313 |
|
|
51,313 |
|
|
— |
|
|
— |
|
|
— |
|
Revolving Credit Facility |
|
|
4,998 |
|
|
— |
|
|
4,998 |
|
|
— |
|
|
— |
|
Other Long-term Obligations |
|
|
368 |
|
|
368 |
|
|
— |
|
|
— |
|
|
— |
|
Software License Fees |
|
|
8,430 |
|
|
3,000 |
|
|
2,172 |
|
|
2,172 |
|
|
1,086 |
|
Capital Projects (3) |
|
|
3,583 |
|
|
3,583 |
|
|
— |
|
|
— |
|
|
— |
|
Total |
|
$ |
70,560 |
|
$ |
58,668 |
|
$ |
7,857 |
|
$ |
2,659 |
|
$ |
1,376 |
|
(1) |
Amounts do not include potential contingent obligations of $73,958 under repurchase commitments with third-party lenders in the event of independent distributor customer default. |
|
(2) |
Purchase obligations represent open purchase orders for raw materials and other components issued in the normal course of business. |
|
(3) |
Represents commitments to various capital projects and equipment acquisitions. |
Credit Facility and Other Obligations
Credit Facility
On December 20, 2018, we amended and restated our loan agreement with First Tennessee Bank National Association, which governs our existing $50,000 unsecured revolving credit facility, to (i) renew and extend the maturity date to May 31, 2022 and make certain other conforming changes, (ii) reduce the interest rate on outstanding loans from one month LIBOR rate plus 150 basis points to one month LIBOR rate plus an applicable margin of either 1.00% or 1.25% depending on the Company’s Leverage Ratio (as such term is defined in the amended and restated master revolving credit note), which margin adjusts periodically from time to time based on changes in such Leverage Ratio, and make certain other changes to the interest rate provisions, (iii) amend the tangible net worth covenant to increase the minimum required compliance level thereunder from $130,000 to $160,000 (the Company’s tangible net worth at December 31, 2019 was approximately $246,000) and (iv) modify certain definitions and other terms thereof. The credit facility contains customary representations and warranties, events of default, and financial, affirmative and negative covenants for loan agreements of this kind. Covenants under the credit facility restrict the payment of cash dividends if the Company would be in violation of the minimum tangible net worth test or the leverage ratio test in the current loan agreement as a result of the dividend, among various restrictions. We have been in compliance with these covenants throughout 2018 and 2019. In the absence of a default, all borrowings under the credit facility bear interest at the LIBOR Rate plus 1.00% or 1.25% per annum. The Company will pay a non-usage fee under the current loan agreement at a rate per annum equal to between 0.15% and 0.35% of the unused amount of the credit facility, which fee is paid quarterly.
23
Outstanding Borrowings
As of December 31, 2019, the Company owed $4,998 under the credit facility. As of December 31, 2018, the Company owed $15,000 under the credit facility. The borrowings under the credit facility in 2018 were primarily used to finance working capital and various capital expenditure projects.
Our French subsidiary, Jige International S.A., has an agreement with Banque Européenne du Crédit Mutuel for an unsecured fixed rate loan with a maturity date of September 30, 2020. All borrowings under this loan bear interest at 0.3% per annum. At December 31, 2019, the Company had $368 in outstanding borrowings under the loan agreement, all of which was classified as long-term obligations due within one year on the consolidated balance sheets. At December 31, 2018, the Company had $760 in outstanding borrowings under the loan agreement, of which $475 and $285 were classified as long-term obligations and long-term obligations due within one year, respectively, on the consolidated balance sheets. These borrowings are being used primarily for the purchase of land and routine repairs to the operating facilities in France. The loan agreement contains no material covenants.
Interest Rate Sensitivity
Changes in interest rates affect the interest paid on indebtedness under our credit facility because the outstanding amounts of indebtedness under our current credit facility are subject to variable interest rates. Under our credit facility, the non-default rate of interest is equal to the LIBOR Market Index Rate plus 1.00% or 1.25% per annum, depending on our leverage ratio (for a rate of interest of 2.76% at December 31, 2019). A one percent change in the interest rate on our variable-rate debt would not have materially impacted our financial position, results of operations or cash flows for the year ended December 31, 2019.
Other Long-Term Obligations
Prior to applying a discount rate to our lease liabilities, we had approximately $1,807 in non-cancellable operating lease obligations and $61 in non-cancellable finance lease obligations at December 31, 2019. Leases with original contractual terms less than one year were excluded from non-cancellable lease obligations.
We are in the process of implementing an enterprise software solution which we expect to substantially improve our administrative efficiency and customer service levels. We have $8,430 in remaining contractual payments under our agreement with the software provider, which extends through 2025.
Recent Accounting Pronouncements
Recently Issued Standards
In December 2019, the Financial Accounting Standards Board (“FASB”) issued Accounting Standards Updated (“ASU”) 2019-12 Income Taxes (Topic 740), which among other things will require the Company to recognize franchise tax that is partially based on income as an income-based tax. The update will be effective for financial statements issued for annual periods, and interim periods within these annual periods, beginning after December 15, 2020, with early adoption permitted. The Company plans to apply the amendments in the update on a modified retrospective basis. The adoption of this update will not have a material impact on the Company’s consolidated financial statements and related disclosures.
In August 2018, the FASB issued ASU 2018‑15 Intangibles – Goodwill and Other – Internal-Use Software (Subtopic 350‑40) to align the requirements for capitalizing implementation costs incurred in cloud computing arrangements that are service contracts with the requirements for capitalizing implementation costs incurred to develop or obtain internal-use software. The update will be effective for financial statements issued for annual periods, and interim periods within these annual periods, beginning after December 15, 2019, with early adoption permitted. The Company plans to apply the amendments in the update prospectively to all implementation costs incurred after the date of the adoption. The adoption of this update will not have a material impact on the Company’s consolidated financial statements and related disclosures.
24
Recently Adopted Standards
During the first quarter of 2019, the Company adopted ASU 2016-02 Leases (Topic 842). The FASB issued ASU 2016‑02 to improve financial reporting on leasing transactions. The update affects all companies that lease assets. The amendments require lessees to recognize on the balance sheet the assets and liabilities for the rights and obligations created by lease agreements with terms greater than twelve months. Companies are also required to provide disclosures designed to enable users of financial statements to understand the amount, timing, and uncertainty of cash flows arising from leases. These disclosures include qualitative and quantitative requirements concerning additional information about the amounts recorded in the financial statements. The Company elected the package of practical expedients permitted by ASC Topic 842. Accordingly, the Company accounted for its existing operating leases as operating leases under the new guidance without reassessing whether the contracts contained a lease under ASC Topic 842 or whether classification of the operating leases would be different in accordance with ASC Topic 842. In the same manner, the company will not reassess the allocation of initial direct costs on existing leases. The Company also elected to not allocate consideration between lease and non-lease components. The amendments were adopted by the Company in the first quarter of 2019 by applying the modified retrospective approach and making a cumulative-effect adjustment to the opening balance of retained earnings at January 1, 2019. The cumulative effect adjustment to the consolidated balance sheets as of January 1, 2019 was as follows:
|
|
|
Balance at |
|
Cumulative Effect |
|
Balance at |
|||
|
|
|
December 31, 2018 |
|
Adjustment |
|
January 1, 2019 |
|||
|
Assets |
|
|
|
|
|
|
|
|
|
|
Right-of-use assets - operating leases |
|
$ |
— |
|
$ |
2,268 |
|
$ |
2,268 |
|
|
|
|
|
|
|
|
|
|
|
|
Liabilities and Shareholders’ Equity |
|
|
|
|
|
|
|
|
|
|
Current portion of operating lease obligation |
|
|
— |
|
|
1,358 |
|
|
1,358 |
|
Noncurrent portion of operating lease obligation |
|
|
— |
|
|
905 |
|
|
905 |
|
Deferred income tax liabilities |
|
|
1,700 |
|
|
1 |
|
|
1,701 |
|
Accumulated surplus |
|
|
81,354 |
|
|
4 |
|
|
81,358 |
ITEM 7A. QUANTITATIVE AND QUALITATIVE DISCLOSURES ABOUT MARKET RISK
In the normal course of our business, we are exposed to market risk from changes in interest rates and foreign currency exchange rates that could impact our results of operations and financial position. Unless the context indicates otherwise, all dollar amounts in this “Item 7A. Quantitative and Qualitative Disclosures About Market Risk” are in thousands.
Interest Rate Risk
Changes in interest rates affect the interest paid on indebtedness under our current credit facility because the outstanding amounts of indebtedness under our current credit facility are subject to variable interest rates. Under our current credit facility, the non-default rate of interest is equal to the LIBOR Market Index Rate plus 1.00% or 1.25% per annum, depending on our leverage ratio (for a rate of interest of 2.76% at December 31, 2019). A one percent change in the interest rate on our variable-rate debt would not have materially impacted our financial position, results of operations or cash flows for the year ended December 31, 2019.
Foreign Currency Risk
We are subject to risk arising from changes in foreign currency exchange rates related to our international operations in Europe. We manage our exposure to our foreign currency exchange rate risk through our regular operating and financing activities. Additionally, from time to time, we enter into certain forward foreign currency exchange contracts.
During the years ended December 31, 2019, 2018, and 2017 the impact of foreign currency exchange rate changes on our results of operations and cash flows was a net foreign currency exchange loss of $274, $97, and $221, respectively.
Because we report in U.S. dollars on a consolidated basis, foreign currency exchange fluctuations could have a translation impact on our financial position. During 2019, we recognized a $693 decrease in our foreign currency translation adjustment account because of
25
the strengthening of the U.S. dollar against certain foreign currencies, primarily the euro, compared to a decrease of $965 during 2018 and an increase of $3,374 during 2017.
ITEM 8. FINANCIAL STATEMENTS AND SUPPLEMENTARY DATA
The response to this item is included in Part IV, Item 15 of this Report.
ITEM 9. CHANGES IN AND DISAGREEMENTS WITH ACCOUNTANTS ON ACCOUNTING AND FINANCIAL DISCLOSURE
None.
26
ITEM 9A. CONTROLS AND PROCEDURES
Disclosure Controls and Procedures
We carried out an evaluation, under the supervision and with the participation of our management, including our Co-Chief Executive Officers and our Chief Financial Officer, of the effectiveness of the design and operation of our disclosure controls and procedures, as defined in Rules 13a‑15(e) and 15d‑15(e) under the Securities Exchange Act of 1934, as of the end of the period covered by this report. Based upon this evaluation, our Co-Chief Executive Officers and our Chief Financial Officer have concluded that the disclosure controls and procedures were effective as of the end of the period covered by this Annual Report to ensure that information required to be disclosed in our reports that we file or submit under the Exchange Act are recorded, processed, summarized and reported within the time periods specified in Securities and Exchange Commission rules and forms.
Changes in Internal Control over Financial Reporting
There were no significant changes in our internal control over financial reporting that occurred during our most recent fiscal quarter that have materially affected, or are reasonably likely to materially affect, our internal control over financial reporting
Management’s Report on Internal Control over Financial Reporting
Management is responsible for establishing and maintaining adequate internal control over financial reporting (as defined in Rules 13a‑15(f) and 15d‑15(f) under the Exchange Act). Our internal control over financial reporting is a process designed to provide reasonable assurance regarding the reliability of financial reporting and the preparation of consolidated financial statements for external purposes in accordance with accounting principles generally accepted in the United States of America. The Company’s internal control over financial reporting includes those policies and procedures that (1) pertain to the maintenance of records that, in reasonable detail, accurately and fairly reflect the transactions and dispositions of the assets of the Company; (2) provide reasonable assurance that transactions are recorded as necessary to permit preparation of consolidated financial statements in accordance with U.S. generally accepted accounting principles, and that receipts and expenditures of the Company are being made only in accordance with authorizations of management and directors of the Company; and (3) provide reasonable assurance regarding prevention or timely detection of unauthorized acquisition, use, or disposition of the Company’s assets that could have a material effect on the consolidated financial statements.
Because of its inherent limitations, internal control over financial reporting may not prevent or detect misstatements. Also, projections of any evaluation of effectiveness to future periods are subject to the risk that controls may be inadequate because of changes in conditions, or that the degree of compliance with the policies or procedures may deteriorate.
Management conducted an evaluation of the effectiveness of our internal control over financial reporting as of December 31, 2019. In making this assessment, management used the criteria set forth by the Committee of Sponsoring Organizations of the Treadway Commission in “Internal Control—Integrated Framework” (2013). Based on our assessment under those criteria, we concluded that, as of December 31, 2019, we maintained effective internal control over financial reporting.
Elliott Davis, LLC, the independent registered public accounting firm who audited the Company’s consolidated financial statements included in this report, has issued an audit report on the effectiveness of the Company’s internal control over financial reporting as of December 31, 2019, which appears herein.
March 4, 2020
27
Report of Independent Registered Public Accounting Firm
To the Shareholders and the Board of Directors of Miller Industries, Inc.:
Opinion on the Internal Control Over Financial Reporting
We have audited Miller Industries, Inc.’s and its subsidiaries (the Company) internal control over financial reporting as of December 31, 2019, based on criteria established in Internal Control — Integrated Framework issued by the Committee of Sponsoring Organizations of the Treadway Commission in 2013. In our opinion, the Company maintained, in all material respects, effective internal control over financial reporting as of December 31, 2019, based on the criteria established in Internal Control — Integrated Framework issued by the Committee of Sponsoring Organizations of the Treadway Commission in 2013.
We have also audited, in accordance with the standards of the Public Company Accounting Oversight Board (United States) (PCAOB), the consolidated balance sheets as of December 31, 2019 and 2018, the related consolidated statements of income, comprehensive income, shareholders’ equity and cash flows for each of the three years in the period ended December 31, 2019, and the related notes to the consolidated financial statements and financial statement schedule listed in the index at Item 15, of the Company and our report dated March 4, 2020, expressed an unqualified opinion.
Basis for Opinion
The Company’s management is responsible for maintaining effective internal control over financial reporting and for its assessment of the effectiveness of internal control over financial reporting in the accompanying Management’s Report on Internal Control over Financial Reporting. Our responsibility is to express an opinion on the Company’s internal control over financial reporting based on our audit. We are a public accounting firm registered with the PCAOB and are required to be independent with respect to the Company in accordance with U.S. federal securities laws and the applicable rules and regulations of the Securities and Exchange Commission and the PCAOB.
We conducted our audit in accordance with the standards of the PCAOB. Those standards require that we plan and perform the audit to obtain reasonable assurance about whether effective internal control over financial reporting was maintained in all material respects. Our audit included obtaining an understanding of internal control over financial reporting, assessing the risk that a material weakness exists, and testing and evaluating the design and operating effectiveness of internal control based on the assessed risk. Our audit also included performing such other procedures as we considered necessary in the circumstances. We believe that our audit provides a reasonable basis for our opinion.
Definition and Limitations of Internal Control Over Financial Reporting
A company’s internal control over financial reporting is a process designed to provide reasonable assurance regarding the reliability of financial reporting and the preparation of financial statements for external purposes in accordance with generally accepted accounting principles. A company’s internal control over financial reporting includes those policies and procedures that (1) pertain to the maintenance of records that, in reasonable detail, accurately and fairly reflect the transactions and dispositions of the assets of the company; (2) provide reasonable assurance that transactions are recorded as necessary to permit preparation of financial statements in accordance with generally accepted accounting principles, and that receipts and expenditures of the company are being made only in accordance with authorizations of management and directors of the company; and (3) provide reasonable assurance regarding prevention or timely detection of unauthorized acquisition, use or disposition of the company’s assets that could have a material effect on the financial statements.
Because of its inherent limitations, internal control over financial reporting may not prevent or detect misstatements. Also, projections of any evaluation of effectiveness to future periods are subject to the risk that controls may become inadequate because of changes in conditions, or that the degree of compliance with the policies or procedures may deteriorate.
|
/s/ Elliott Davis, LLC |
|
|
Chattanooga, Tennessee |
|
|
March 4, 2020 |
|
28
None.
ITEM 10. DIRECTORS, EXECUTIVE OFFICERS AND CORPORATE GOVERNANCE
The Proxy Statement for our Annual Meeting of Shareholders, to be filed with the Securities and Exchange Commission pursuant to Regulation 14A not later than 120 days after the end of our 2019 fiscal year, will contain information relating to our directors and audit committee, compliance with Section 16(a) of the Exchange Act (if there are any applicable delinquencies to report), and our code of ethics applicable to our chief executive, financial and accounting officers, which information is incorporated by reference herein. Information relating to our executive officers is included in Part I, Item 1 of this report.
ITEM 11. EXECUTIVE COMPENSATION
The Proxy Statement for our Annual Meeting of Shareholders, to be filed with the Securities and Exchange Commission pursuant to Regulation 14A not later than 120 days after the end of our 2019 fiscal year, will contain our compensation committee report, information relating to director and executive officer compensation and information relating to compensation committee interlocks and insider participation, each of which is incorporated by reference herein.
ITEM 12. SECURITY OWNERSHIP OF CERTAIN BENEFICIAL OWNERS AND MANAGEMENT AND RELATED STOCKHOLDER MATTERS
The Proxy Statement for our Annual Meeting of Shareholders, to be filed with the Securities and Exchange Commission pursuant to Regulation 14A not later than 120 days after the end of our 2019 fiscal year, will contain information relating to security ownership of certain beneficial owners and management, which information is incorporated by reference herein.
The Proxy Statement will also contain information relating to our equity compensation plans, which information is incorporated by reference herein.
ITEM 13. CERTAIN RELATIONSHIPS AND RELATED TRANSACTIONS, AND DIRECTOR INDEPENDENCE
The Proxy Statement for our Annual Meeting of Shareholders, to be filed with the Securities and Exchange Commission pursuant to Regulation 14A not later than 120 days after the end of our 2019 fiscal year, will contain information relating to certain relationships and related transactions between us and certain of our directors and executive officers, which information is incorporated by reference herein.
ITEM 14. PRINCIPAL ACCOUNTING FEES AND SERVICES
The Proxy Statement for our Annual Meeting of Shareholders, to be filed with the Securities and Exchange Commission pursuant to Regulation 14A not later than 120 days after the end of our 2019 fiscal year, will contain information relating to the fees charged and services provided by Elliott Davis, LLC (f/k/a Elliott Davis Decosimo, LLC), our principal accountants, and our pre-approval policy and procedures for audit and non-audit services, which information is incorporated by reference into this report.
ITEM 15. EXHIBITS, FINANCIAL STATEMENT SCHEDULES
|
(a) |
The following documents are filed as part of this Report: |
|
1. |
Financial Statements |
29
2.Financial Statement Schedules
The following Financial Statement Schedule for the Registrant is filed as part of this Report and should be read in conjunction with the Consolidated Financial Statements:
|
Description |
|
Page |
|
|
|
|
|
|
F-21 |
All schedules, except those set forth above, have been omitted since the information required is included in the financial statements or notes or have been omitted as not applicable or not required.
3.Exhibits
The following exhibits are required to be filed with this Report by Item 601 of Regulation S-K:
|
|
|
Description |
|
Incorporated |
|
Form or |
|
Date of Report |
|
Exhibit |
|
|
|
|
|
|
|
|
|
|
|
|
|
|
|
|
|
|
||||||
|
|
|
|
|
|
|
|
|
|
|
|
|
|
|
|
|
|
||||||
|
|
|
|
|
|
|
|
|
|
|
|
|
|
|
|
|
|
|
|
|
|
||
|
|
|
|
|
|
|
|
|
|
|
|
|
10.1 |
|
Form of Noncompetition Agreement between the Registrant and certain officers of the Registrant |
|
33‑79430 |
|
S‑1 |
|
August 1994 |
|
10.28 |
|
|
|
|
|
|
|
|
|
|
|
|
|
|
|
|
|
|
||||||
|
|
|
|
|
|
|
|
|
|
|
|
|
|
|
|
|
|
||||||
|
|
|
|
|
|
|
|
|
|
|
|
|
|
|
|
|
|
||||||
|
|
|
|
|
|
|
|
|
|
|
|
|
|
Amendment No. 1 to Miller Industries, Inc. 2013 Non-Employee Director Stock Plan** |
|
|
|
|
|||||
|
|
|
|
|
|
|
|
|
|
|
|
|
|
|
|
|
|
||||||
|
|
|
|
|
|
|
|
|
|
|
|
|
|
|
|
|
|
||||||
|
|
|
|
|
|
|
|
|
|
|
|
|
|
|
|
|
|
||||||
|
|
|
|
|
|
|
|
|
|
|
|
|
|
|
|
|
|
||||||
|
|
|
|
|
|
|
|
|
|
|
|
|
|
|
|
|
|
||||||
|
|
|
|
|
|
|
|
|
|
|
|
|
|
|
|
|
|
||||||
|
|
|
|
|
|
|
|
|
|
|
|
|
|
|
|
|
|
||||||
|
|
|
|
|
|
|
|
|
|
|
|
|
|
|
|
|
|
|
|
|
|
||
|
|
|
|
|
|
|
|
|
|
|
|
|
|
|
|
|
|
|
|
|
|
||
|
|
|
|
|
|
|
|
|
|
|
|
|
|
|
|
|
|
|
|
|
|
||
|
|
|
|
|
|
|
|
|
|
|
|
|
|
Certification Pursuant to Rules 13a‑14(a)/15d‑14(a) by Co-Chief Executive Officer* |
|
|
|
|
|
|
|
|
|
|
|
|
|
|
|
|
|
|
|
|
|
|
|
Certification Pursuant to Rules 13a‑14(a)/15d‑14(a) by Co-Chief Executive Officer* |
|
|
|
|
|
|
|
|
|
|
|
|
|
|
|
|
|
|
|
|
|
|
|
Certification Pursuant to Rule 13a‑14(a)/15d‑14(a) by Chief Financial Officer* |
|
|
|
|
|
|
|
|
|
|
|
|
|
|
|
|
|
|
|
|
|
|
|
|
|
|
|
|
|
|
|
||
|
|
|
|
|
|
|
|
|
|
|
|
|
|
|
|
|
|
|
|
|
|
||
|
|
|
|
|
|
|
|
|
|
|
|
|
|
|
|
|
|
|
|
|
|
||
|
|
|
|
|
|
|
|
|
|
|
|
30
|
|
|
Description |
|
Incorporated |
|
Form or |
|
Date of Report |
|
Exhibit |
|
101 |
|
The following financial information from Miller Industries, Inc.’s Annual Report on Form 10‑K for the year ended December 31, 2019, formatted in XBRL (eXtensible Business Reporting Language): (i) Consolidated Balance Sheets as of December 31, 2019 and December 31, 2018, (ii) Consolidated Statements of Income for the years ended December 31, 2019, 2018 and 2017, (iii) Consolidated Statements of Comprehensive Income for the years ended December 31, 2019, 2018 and 2017, (iv) Consolidated Statements of Shareholder’s Equity for the years ended December 31, 2019, 2018 and 2017, (v) Consolidated Statements of Cash Flows for the years ended December 31, 2019, 2018 and 2017, and (vi) the Notes to Consolidated Financial Statements.* |
|
|
|
|
|
|
|
|
*Filed herewith.
±Exhibit is being furnished and shall not be deemed “filed” for purposes of Section 18 of the Exchange Act, or otherwise subjected to the liabilities of that Section. This exhibit shall not be incorporated by reference into any given registration statement or other document pursuant to the Securities Act of 1933, as amended, except as shall be expressly set forth by specific reference in such a filing.
**Management contract or compensatory plan or arrangement.
|
(b) |
The Registrant hereby files as exhibits to this Report the exhibits set forth in Item 15(a)3 hereof. |
|
(c) |
The Registrant hereby files as financial statement schedules to this Report the financial statement schedules set forth in Item 15(a)2 hereof. |
None.
31

INDEX TO CONSOLIDATED FINANCIAL STATEMENTS
F-1
Report of Independent Registered Public Accounting Firm
To the Shareholders and the Board of Directors of Miller Industries, Inc.:
Opinion on the Financial Statements
We have audited the accompanying consolidated balance sheets of Miller Industries, Inc. and its subsidiaries (the Company) as of December 31, 2019 and 2018, the related consolidated statements of income, comprehensive income, shareholders’ equity and cash flows for each of the three years in the period ended December 31, 2019, and the related notes to the consolidated financial statements and financial statement schedule listed in the index at Item 15 (collectively, the financial statements). In our opinion, the financial statements present fairly, in all material respects, the financial position of the Company as of December 31, 2019 and 2018, and the results of its operations and its cash flows for each of the three years in the period ended December 31, 2019, in conformity with accounting principles generally accepted in the United States of America.
We have also audited, in accordance with the standards of the Public Company Accounting Oversight Board (United States) (PCAOB), the Company’s internal control over financial reporting as of December 31, 2019, based on criteria established in Internal Control — Integrated Framework issued by the Committee of Sponsoring Organizations of the Treadway Commission in 2013, and our report dated March 4, 2020 expressed an unqualified opinion on the effectiveness of the Company’s internal control over financial reporting.
Basis for Opinion
These financial statements are the responsibility of the Company’s management. Our responsibility is to express an opinion on the Company’s financial statements based on our audits. We are a public accounting firm registered with the PCAOB and are required to be independent with respect to the Company in accordance with U.S. federal securities laws and the applicable rules and regulations of the Securities and Exchange Commission and the PCAOB.
We conducted our audits in accordance with the standards of the PCAOB. Those standards require that we plan and perform the audits to obtain reasonable assurance about whether the financial statements are free of material misstatement, whether due to error or fraud. Our audits included performing procedures to assess the risks of material misstatement of the financial statements, whether due to error or fraud, and performing procedures that respond to those risks. Such procedures included examining, on a test basis, evidence regarding the amounts and disclosures in the financial statements. Our audits also included evaluating the accounting principles used and significant estimates made by management, as well as evaluating the overall presentation of the financial statements. We believe that our audits provide a reasonable basis for our opinion.
|
We have served as the Company’s auditor since 2003. |
|
|
|
|
|
/s/ Elliott Davis, LLC |
|
|
|
|
|
Chattanooga, Tennessee |
|
|
March 4, 2020 |
|
F-2
MILLER INDUSTRIES, INC. AND SUBSIDIARIES
DECEMBER 31, 2019 AND 2018
(In thousands, except share data)
|
|
|
|
|
|
|
|
|
|
|
2019 |
|
2018 |
||
|
|
|
|
|
|
|
|
|
ASSETS |
|
|
|
|
|
|
|
CURRENT ASSETS: |
|
|
|
|
|
|
|
Cash and temporary investments |
|
$ |
26,072 |
|
$ |
27,037 |
|
Accounts receivable, net of allowance for doubtful accounts of $1,106 and $1,112 at December 31, 2019 and December 31, 2018, respectively |
|
|
168,619 |
|
|
149,142 |
|
Inventories, net |
|
|
87,965 |
|
|
93,767 |
|
Prepaid expenses |
|
|
4,796 |
|
|
3,272 |
|
Total current assets |
|
|
287,452 |
|
|
273,218 |
|
NONCURRENT ASSETS: |
|
|
|
|
|
|
|
Property, plant and equipment, net |
|
|
90,735 |
|
|
82,850 |
|
Right-of-use assets - operating leases |
|
|
1,640 |
|
|
— |
|
Goodwill |
|
|
11,619 |
|
|
11,619 |
|
Other assets |
|
|
521 |
|
|
497 |
|
TOTAL ASSETS |
|
$ |
391,967 |
|
$ |
368,184 |
|
|
|
|
|
|
|
|
|
LIABILITIES AND SHAREHOLDERS’ EQUITY |
|
|
|
|
|
|
|
CURRENT LIABILITIES: |
|
|
|
|
|
|
|
Accounts payable |
|
$ |
95,750 |
|
$ |
98,220 |
|
Accrued liabilities |
|
|
27,813 |
|
|
24,863 |
|
Current portion of operating lease obligation |
|
|
330 |
|
|
— |
|
Current portion of finance lease obligation |
|
|
21 |
|
|
20 |
|
Long-term obligations due within one year |
|
|
368 |
|
|
285 |
|
Total current liabilities |
|
|
124,282 |
|
|
123,388 |
|
NONCURRENT LIABILITIES |
|
|
|
|
|
|
|
Long-term obligations |
|
|
4,998 |
|
|
15,475 |
|
Noncurrent portion of operating lease obligation |
|
|
1,307 |
|
|
— |
|
Noncurrent portion of finance lease obligation |
|
|
37 |
|
|
58 |
|
Deferred income tax liabilities |
|
|
3,416 |
|
|
1,700 |
|
Total liabilities |
|
|
134,040 |
|
|
140,621 |
|
|
|
|
|
|
|
|
|
COMMITMENTS AND CONTINGENCIES (Notes 6 and 7) |
|
|
|
|
|
|
|
|
|
|
|
|
|
|
|
SHAREHOLDERS’ EQUITY: |
|
|
|
|
|
|
|
Preferred stock, $0.01 par value; 5,000,000 shares authorized, none issued or outstanding |
|
|
— |
|
|
— |
|
Common stock, $0.01 par value; 100,000,000 shares authorized, 11,400,102 and 11,394,546, outstanding at December 31, 2019 and December 31, 2018, respectively |
|
|
114 |
|
|
114 |
|
Additional paid-in capital |
|
|
151,055 |
|
|
150,905 |
|
Accumulated surplus |
|
|
112,261 |
|
|
81,354 |
|
Accumulated other comprehensive loss |
|
|
(5,503) |
|
|
(4,810) |
|
Total shareholders’ equity |
|
|
257,927 |
|
|
227,563 |
|
TOTAL LIABILITIES AND SHAREHOLDERS' EQUITY |
|
$ |
391,967 |
|
$ |
368,184 |
The accompanying notes are an integral part of these consolidated statements.
F-3
MILLER INDUSTRIES, INC. AND SUBSIDIARIES
CONSOLIDATED STATEMENTS OF INCOME
FOR THE YEARS ENDED DECEMBER 31, 2019, 2018 AND 2017
(In thousands, except per share data)
|
|
|
|
|
|
|
||||
|
|
|
|
|
|
|
||||
|
|
|
2019 |
|
2018 |
|
2017 |
|||
|
|
|
|
|
|
|
|
|
|
|
|
NET SALES |
|
$ |
818,166 |
|
$ |
711,706 |
|
$ |
615,101 |
|
COSTS OF OPERATIONS |
|
|
721,678 |
|
|
628,370 |
|
|
548,000 |
|
GROSS PROFIT |
|
|
96,488 |
|
|
83,336 |
|
|
67,101 |
|
|
|
|
|
|
|
|
|
|
|
|
OPERATING EXPENSES: |
|
|
|
|
|
|
|
|
|
|
Selling, general and administrative expenses |
|
|
43,394 |
|
|
39,542 |
|
|
35,561 |
|
|
|
|
|
|
|
|
|
|
|
|
NON-OPERATING (INCOME) EXPENSES: |
|
|
|
|
|
|
|
|
|
|
Interest expense, net |
|
|
2,378 |
|
|
1,878 |
|
|
1,588 |
|
Other (income) expense, net |
|
|
331 |
|
|
253 |
|
|
(387) |
|
Total expense, net |
|
|
46,103 |
|
|
41,673 |
|
|
36,762 |
|
|
|
|
|
|
|
|
|
|
|
|
INCOME BEFORE INCOME TAXES |
|
|
50,385 |
|
|
41,663 |
|
|
30,339 |
|
INCOME TAX PROVISION |
|
|
11,274 |
|
|
7,917 |
|
|
7,323 |
|
NET INCOME |
|
$ |
39,111 |
|
$ |
33,746 |
|
$ |
23,016 |
|
|
|
|
|
|
|
|
|
|
|
|
BASIC INCOME PER COMMON SHARE |
|
$ |
3.43 |
|
$ |
2.96 |
|
$ |
2.02 |
|
DILUTED INCOME PER COMMON SHARE |
|
$ |
3.43 |
|
$ |
2.96 |
|
$ |
2.02 |
|
|
|
|
|
|
|
|
|
|
|
|
CASH DIVIDENDS DECLARED PER COMMON SHARE |
|
$ |
0.72 |
|
$ |
0.72 |
|
$ |
0.72 |
|
|
|
|
|
|
|
|
|
|
|
|
WEIGHTED AVERAGE SHARES OUTSTANDING: |
|
|
|
|
|
|
|
|
|
|
Basic |
|
|
11,400 |
|
|
11,388 |
|
|
11,368 |
|
Diluted |
|
|
11,400 |
|
|
11,393 |
|
|
11,385 |
The accompanying notes are an integral part of these consolidated statements.
F-4
MILLER INDUSTRIES, INC. AND SUBSIDIARIES
CONSOLIDATED STATEMENTS OF COMPREHENSIVE INCOME
FOR THE YEARS ENDED DECEMBER 31, 2019, 2018 AND 2017
(In thousands)
|
|
|
|
|
|
|
|
|
|
|
|
|
|
|
|
|
|
|
|
|
|
|
|
|
2019 |
|
2018 |
|
2017 |
|||
|
NET INCOME |
|
$ |
39,111 |
|
$ |
33,746 |
|
$ |
23,016 |
|
|
|
|
|
|
|
|
|
|
|
|
OTHER COMPREHENSIVE INCOME: |
|
|
|
|
|
|
|
|
|
|
Foreign currency translation adjustment |
|
|
(693) |
|
|
(965) |
|
|
3,374 |
|
Total other comprehensive income |
|
|
(693) |
|
|
(965) |
|
|
3,374 |
|
|
|
|
|
|
|
|
|
|
|
|
COMPREHENSIVE INCOME |
|
$ |
38,418 |
|
$ |
32,781 |
|
$ |
26,390 |
The accompanying notes are an integral part of these consolidated statements.
F-5
MILLER INDUSTRIES, INC. AND SUBSIDIARIES
CONSOLIDATED STATEMENTS OF SHAREHOLDERS’ EQUITY
FOR THE YEARS ENDED DECEMBER 31, 2019, 2018 AND 2017
(In thousands, except share data)
|
|
|
|
|
|
|
|
|
|
|
Accumulated |
|
|
|
||
|
|
|
|
|
|
Additional |
|
|
|
|
Other |
|
|
|
||
|
|
|
Common |
|
Paid-In |
|
Accumulated |
|
Comprehensive |
|
|
|
||||
|
|
|
Stock |
|
Capital |
|
Surplus |
|
Income (Loss) |
|
Total |
|||||
|
BALANCE, December 31, 2016 |
|
$ |
113 |
|
$ |
150,404 |
|
$ |
40,752 |
|
$ |
(6,667) |
|
$ |
184,602 |
|
Components of comprehensive income: |
|
|
|
|
|
|
|
|
|
|
|
|
|
|
|
|
Net income |
|
|
— |
|
|
— |
|
|
23,016 |
|
|
— |
|
|
23,016 |
|
Foreign currency translation adjustments |
|
|
— |
|
|
— |
|
|
— |
|
|
3,374 |
|
|
3,374 |
|
Total comprehensive income |
|
|
— |
|
|
— |
|
|
23,016 |
|
|
3,374 |
|
|
26,390 |
|
Issuance of common stock to non-employee directors (5,922) |
|
|
— |
|
|
150 |
|
|
— |
|
|
— |
|
|
150 |
|
Exercise of stock options (26,500) |
|
|
1 |
|
|
145 |
|
|
— |
|
|
— |
|
|
146 |
|
Dividends paid, $0.72 per share |
|
|
— |
|
|
— |
|
|
(8,188) |
|
|
— |
|
|
(8,188) |
|
BALANCE, December 31, 2017 |
|
|
114 |
|
|
150,699 |
|
|
55,580 |
|
|
(3,293) |
|
|
203,100 |
|
Cumulative effect adjustment for adoption of ASU 2014-09 |
|
|
— |
|
|
— |
|
|
(324) |
|
|
— |
|
|
(324) |
|
BALANCE, January 1, 2018 |
|
|
114 |
|
|
150,699 |
|
|
55,256 |
|
|
(3,293) |
|
|
202,776 |
|
Prior period accounting reclassification |
|
|
— |
|
|
— |
|
|
552 |
|
|
(552) |
|
|
- |
|
Components of comprehensive income: |
|
|
|
|
|
|
|
|
|
|
|
|
|
|
- |
|
Net income |
|
|
— |
|
|
— |
|
|
33,746 |
|
|
— |
|
|
33,746 |
|
Foreign currency translation adjustments |
|
|
— |
|
|
— |
|
|
— |
|
|
(965) |
|
|
(965) |
|
Total comprehensive income |
|
|
— |
|
|
— |
|
|
34,298 |
|
|
(1,517) |
|
|
32,781 |
|
Issuance of common stock to non-employee directors (5,814) |
|
|
— |
|
|
150 |
|
|
— |
|
|
— |
|
|
150 |
|
Exercise of stock options (10,250) |
|
|
— |
|
|
56 |
|
|
— |
|
|
— |
|
|
56 |
|
Dividends paid, $0.72 per share |
|
|
— |
|
|
— |
|
|
(8,200) |
|
|
— |
|
|
(8,200) |
|
BALANCE, December 31, 2018 |
|
|
114 |
|
|
150,905 |
|
|
81,354 |
|
|
(4,810) |
|
|
227,563 |
|
Cumulative effect adjustment for adoption of ASU 2016-02 |
|
|
— |
|
|
— |
|
|
4 |
|
|
— |
|
|
4 |
|
BALANCE, January 1, 2019 |
|
|
114 |
|
|
150,905 |
|
|
81,358 |
|
|
(4,810) |
|
|
227,567 |
|
Components of comprehensive income: |
|
|
|
|
|
|
|
|
|
|
|
|
|
|
|
|
Net income |
|
|
- |
|
|
- |
|
|
39,111 |
|
|
- |
|
|
39,111 |
|
Foreign currency translation adjustments |
|
|
- |
|
|
- |
|
|
- |
|
|
(693) |
|
|
(693) |
|
Total comprehensive income |
|
|
- |
|
|
- |
|
|
39,111 |
|
|
(693) |
|
|
38,418 |
|
Issuance of common stock to non-employee directors (5,556) |
|
|
- |
|
|
150 |
|
|
- |
|
|
- |
|
|
150 |
|
Dividends paid, $0.72 per share |
|
|
- |
|
|
- |
|
|
(8,208) |
|
|
- |
|
|
(8,208) |
|
BALANCE, December 31, 2019 |
|
$ |
114 |
|
$ |
151,055 |
|
$ |
112,261 |
|
$ |
(5,503) |
|
$ |
257,927 |
The accompanying notes are an integral part of these consolidated statements.
F-6
MILLER INDUSTRIES, INC. AND SUBSIDIARIES
CONSOLIDATED STATEMENTS OF CASH FLOWS
FOR THE YEARS ENDED DECEMBER 31, 2019, 2018 AND 2017
(In thousands)
|
|
|
|
|
|
|
|
|
|
|
|
|
|
|
|
|
|
|
|
|
|
|
|
|
2019 |
|
2018 |
|
2017 |
|||
|
OPERATING ACTIVITIES: |
|
|
|
|
|
|
|
|
|
|
Net income |
|
$ |
39,111 |
|
$ |
33,746 |
|
$ |
23,016 |
|
Adjustments to reconcile net income to net cash flows from operating activities: |
|
|
|
|
|
|
|
|
|
|
Depreciation and amortization |
|
|
9,127 |
|
|
7,745 |
|
|
6,147 |
|
(Gain) Loss on disposal of property, plant and equipment |
|
|
(21) |
|
|
156 |
|
|
(608) |
|
Provision for doubtful accounts |
|
|
15 |
|
|
214 |
|
|
86 |
|
Issuance of non-employee director shares |
|
|
150 |
|
|
150 |
|
|
150 |
|
Deferred tax provision |
|
|
1,708 |
|
|
568 |
|
|
(868) |
|
Changes in operating assets and liabilities: |
|
|
|
|
|
|
|
|
|
|
Accounts receivable |
|
|
(19,605) |
|
|
(19,353) |
|
|
(6,668) |
|
Inventories |
|
|
5,453 |
|
|
(23,865) |
|
|
(2,844) |
|
Prepaid expenses |
|
|
(1,529) |
|
|
989 |
|
|
765 |
|
Other assets |
|
|
609 |
|
|
60 |
|
|
8 |
|
Accounts payable |
|
|
(2,165) |
|
|
19,425 |
|
|
(5,806) |
|
Accrued liabilities |
|
|
2,279 |
|
|
2,062 |
|
|
575 |
|
Net cash flows from operating activities |
|
|
35,132 |
|
|
21,897 |
|
|
13,953 |
|
INVESTING ACTIVITIES: |
|
|
|
|
|
|
|
|
|
|
Purchases of property, plant and equipment |
|
|
(17,391) |
|
|
(13,342) |
|
|
(24,693) |
|
Proceeds from sale of property, plant and equipment |
|
|
328 |
|
|
141 |
|
|
1,303 |
|
Net cash flows from investing activities |
|
|
(17,063) |
|
|
(13,201) |
|
|
(23,390) |
|
FINANCING ACTIVITIES: |
|
|
|
|
|
|
|
|
|
|
Net proceeds (payments) under credit facility |
|
|
(10,002) |
|
|
5,000 |
|
|
5,000 |
|
Payments of cash dividends |
|
|
(8,208) |
|
|
(8,200) |
|
|
(8,188) |
|
Net proceeds (payments) on other long-term obligations |
|
|
(367) |
|
|
56 |
|
|
146 |
|
Finance lease obligation payments |
|
|
(20) |
|
|
— |
|
|
— |
|
Proceeds from exercise of stock options |
|
|
— |
|
|
179 |
|
|
606 |
|
Net cash flows from financing activities |
|
|
(18,597) |
|
|
(2,965) |
|
|
(2,436) |
|
EFFECT OF EXCHANGE RATE CHANGES ON CASH AND TEMPORARY INVESTMENTS |
|
|
(437) |
|
|
(589) |
|
|
2,653 |
|
NET CHANGE IN CASH AND TEMPORARY INVESTMENTS |
|
|
(965) |
|
|
5,142 |
|
|
(9,220) |
|
CASH AND TEMPORARY INVESTMENTS, beginning of period |
|
|
27,037 |
|
|
21,895 |
|
|
31,115 |
|
CASH AND TEMPORARY INVESTMENTS, end of period |
|
$ |
26,072 |
|
$ |
27,037 |
|
$ |
21,895 |
|
SUPPLEMENTAL DISCLOSURE OF CASH FLOW INFORMATION: |
|
|
|
|
|
|
|
|
|
|
Cash payments for interest |
|
$ |
3,249 |
|
$ |
2,437 |
|
$ |
1,877 |
|
Cash payments for income taxes, net of refunds |
|
$ |
10,067 |
|
$ |
7,457 |
|
$ |
11,605 |
The accompanying notes are an integral part of these consolidated statements.
F-7
MILLER INDUSTRIES, INC. AND SUBSIDIARIES
NOTES TO CONSOLIDATED FINANCIAL STATEMENTS
(in thousands, except share data and except as otherwise noted)
1.ORGANIZATION AND NATURE OF OPERATIONS
Miller Industries, Inc. and subsidiaries (the “Company”) is The World’s Largest Manufacturer of Towing and Recovery Equipment.® The principal markets for the Company’s towing and recovery equipment are approximately 80 independent distributors and the users of towing and recovery equipment located primarily throughout North America, and other customers throughout the world. The Company’s products are marketed under the brand names of Century®, Challenger®, Holmes®, Champion®, Eagle®, Titan®, JigeTM, BonifaceTM, Vulcan®, and ChevronTM.
2.SUMMARY OF SIGNIFICANT ACCOUNTING POLICIES
Use of Estimates in the Preparation of Financial Statements
The preparation of financial statements in conformity with U.S. generally accepted accounting principles requires management to make estimates and assumptions that affect the reported amounts of assets and liabilities and disclosure of contingent assets and liabilities at the date of the financial statements and the reported amounts of revenues and expenses during the reporting period. Actual results could differ from those estimates.
Consolidation
The accompanying consolidated financial statements include the accounts of Miller Industries, Inc. and its subsidiaries. All significant intercompany transactions and balances have been eliminated.
To facilitate timely reporting, the consolidated financial statements include accounts of certain subsidiaries whose fiscal closing dates differ from December 31st by 31 days (or less).
Cash and Temporary Investments
Cash and temporary investments include all cash and cash equivalent investments with original maturities of three months or less.
Accounts Receivable
Receivables are stated at their estimated collectible amounts and consist of amounts billed and currently due from customers. The Company extends credit to customers in the normal course of business. Collections from customers are continuously monitored and an allowance for doubtful accounts is maintained based on historical experience and any specific customer collection issues. Data by each major customer is regularly reviewed to evaluate the adequacy of the allowance for doubtful accounts and actual write-offs are charged against the allowance.
Inventories
Inventory costs include materials, labor and factory overhead. Inventories are stated at the lower of cost or net realizable value, determined on a first-in, first-out basis. Appropriate consideration is given to obsolescence, valuation and other factors in determining net
F-8
realizable value. Revisions of these estimates could result in the need for adjustments. Inventories, net of reserves, at December 31, 2019 and 2018 consisted of the following:
|
|
|
December 31, |
|
December 31, |
||
|
|
|
2019 |
|
2018 |
||
|
Chassis |
|
$ |
6,561 |
|
$ |
8,921 |
|
Raw materials |
|
|
39,444 |
|
|
40,021 |
|
Work in process |
|
|
16,520 |
|
|
14,995 |
|
Finished goods |
|
|
25,440 |
|
|
29,830 |
|
|
|
$ |
87,965 |
|
$ |
93,767 |
Property, Plant and Equipment
Property, plant and equipment are recorded at cost, less accumulated depreciation. Depreciation for financial reporting purposes is provided using the straight-line method over the estimated useful lives of the assets. Accelerated depreciation methods are used for income tax reporting purposes. Estimated useful lives range from 20 to 30 years for buildings and improvements and 5 to 10 years for machinery and equipment, furniture and fixtures, and software costs. Expenditures for routine maintenance and repairs are charged to expense as incurred. Internal labor is used in certain capital projects. Fully depreciated assets are retained in property, plant and equipment and accumulated depreciation until they are removed from service. When assets are retired or otherwise disposed of, the related costs and accumulated depreciation are removed from the consolidated balance sheets and any resulting gain or loss from disposition is recorded as other (income) expense, net in the consolidated statements of income in the period realized.
Property, plant and equipment at December 31, 2019 and 2018 consisted of the following:
|
|
|
2019 |
|
2018 |
||
|
Land and improvements |
|
$ |
13,953 |
|
$ |
11,807 |
|
Buildings and improvements |
|
|
73,121 |
|
|
68,717 |
|
Machinery and equipment |
|
|
50,235 |
|
|
43,961 |
|
Furniture and fixtures |
|
|
9,172 |
|
|
7,786 |
|
Software costs |
|
|
6,033 |
|
|
5,695 |
|
|
|
|
152,514 |
|
|
137,966 |
|
Less accumulated depreciation |
|
|
(61,779) |
|
|
(55,116) |
|
|
|
$ |
90,735 |
|
$ |
82,850 |
The Company recognized $9,127, $7,745 and $6,147, in depreciation and amortization expense in 2019, 2018 and 2017, respectively.
The Company capitalizes costs related to software development in accordance with established criteria, and amortizes those costs to expense on a straight-line basis over five years. System development costs not meeting proper criteria for capitalization are expensed as incurred.
Basic and Diluted Income Per Common Share
Basic income per common share is computed by dividing net income by the weighted average number of common shares outstanding. Diluted income per common share is calculated by dividing net income by the weighted average number of common and potential dilutive common shares outstanding. Diluted income per common share takes into consideration the assumed exercise of outstanding stock options resulting in approximately 5,000 and 17,000 potential dilutive common shares in each of the years ended December 31, 2018 and 2017, respectively. The Company had no outstanding stock options and no potential dilutive common shares for the year ended December 31, 2019. For the years ended December 31, 2018 and 2017, none of the outstanding stock options would have been anti-dilutive.
F-9
Long-Lived Assets
The Company periodically reviews the carrying amount of its long-lived assets to determine if those assets may not be recoverable based upon the future operating cash flows expected to be generated by those assets. Management believes that its long-lived assets are appropriately valued.
Goodwill
Goodwill consists of the excess of cost of acquired entities over the sum of the amounts assigned to identifiable assets acquired less liabilities assumed. Goodwill is not amortized. However, the Company evaluates the carrying value of goodwill for impairment at least annually or if an event or circumstance occurs that would indicate that the carrying amount had been impaired. Goodwill is reviewed for impairment utilizing a qualitative assessment and, if necessary, a quantitative assessment. If we perform a qualitative analysis of goodwill and determine that fair value more likely than not exceeds the carrying value of the reporting unit, no further testing is needed. Alternatively, if we elect to utilize a quantitative assessment, an impairment loss would be recognized to the extent that the carrying value of the reporting unit exceeds its fair value, not to exceed the carrying value of the goodwill.
Accrued Liabilities
Accrued liabilities consisted of the following at December 31, 2019 and 2018:
|
|
|
2019 |
|
2018 |
||
|
Accrued wages, commissions, bonuses and benefits |
|
$ |
12,382 |
|
$ |
9,152 |
|
Accrued products warranty |
|
|
3,859 |
|
|
3,752 |
|
Accrued taxes |
|
|
2,079 |
|
|
1,039 |
|
Other |
|
|
9,493 |
|
|
10,920 |
|
|
|
$ |
27,813 |
|
$ |
24,863 |
Income Taxes
The Company’s income tax expense, deferred tax assets and liabilities and liabilities for unrecognized tax benefits reflect management’s best assessment of estimated current and future taxes to be paid. The Company is subject to income taxes in both the United States and foreign jurisdictions. Significant judgments and estimates are required in determining the consolidated income tax expense.
The Company recognizes as deferred income tax assets and liabilities the future tax consequences of the differences between the financial statement carrying amounts of existing assets and liabilities and their respective tax bases. The Company considers the need to record a valuation allowance to reduce deferred tax assets to the amount that is more likely than not to be realized. Tax loss carryforwards, reversal of deferred tax liabilities, tax planning and estimates of future taxable income are considered in assessing the need for a valuation allowance.
The Company records uncertain tax positions in accordance with ASC 740 on the basis of a two-step process whereby (1) the Company determines whether it is more likely than not that the tax positions will be sustained on the basis of the technical merits of the positions and (2) for those tax positions that meet the more-likely-than-not recognition threshold, the Company recognizes the largest amount of tax benefit that is more than 50% likely to be realized upon ultimate settlement with the related tax authority. The Company recognizes interest and penalties related to unrecognized tax benefits within the income tax expense line in the accompanying consolidated statements of income. Accrued interest and penalties are included within the related tax liability line in the accompanying consolidated balance sheets.
Stock-Based Compensation
Stock compensation expense was $150 for 2019, 2018 and 2017.
No options were granted during 2019, 2018, or 2017. The fair value of options granted in 2008 has been estimated as of the date of the grant using the Black-Scholes option-pricing model with the following weighted average assumptions: expected dividend yield of 0%; expected volatility of 44%; risk-free interest rate of 1.71%; and expected life of four years. Using these assumptions, the fair value of options granted in 2008 was $1,596, which was amortized as compensation expense over the vesting period.
F-10
At December 31, 2018, the Company had no unrecognized compensation expense related to stock options. The Company issued 10,250 and 26,500 shares of common stock during 2018 and 2017, respectively, from the exercise of stock options. The company issued no shares from the exercise of stock options during 2019.
Product Warranty
The Company generally provides a one-year limited product and service warranty on certain of its products. The Company provides for the estimated cost of this warranty at the time of sale. These estimates are established using historical information about the nature, frequency, and average cost of warranty claims. Warranty expense in 2019, 2018 and 2017, was $2,483, $3,793 and $2,618, respectively.
The table below provides a summary of the warranty liability for December 31, 2019 and 2018:
|
|
|
2019 |
|
2018 |
||
|
Accrual at beginning of the year |
|
$ |
3,752 |
|
$ |
3,147 |
|
Provision |
|
|
2,483 |
|
|
3,793 |
|
Settlement and Other |
|
|
(2,376) |
|
|
(3,188) |
|
Accrual at end of year |
|
$ |
3,859 |
|
$ |
3,752 |
Credit Risk
Financial instruments that potentially subject the Company to significant concentrations of credit risk consist principally of cash investments and trade accounts receivable. The Company places its cash investments with high-quality financial institutions. In addition, the Company limits the amount of credit exposure through the use of accounts and funds backed by the U.S. Government and its agencies. Trade accounts receivable are generally diversified due to the number of entities comprising the Company’s customer base and their dispersion across many geographic regions and by frequent monitoring of the creditworthiness of the customers to whom the credit is granted in the normal course of business. At December 31, 2018, the Company had one customer with a trade account receivable balance greater than 10% of total accounts receivable. The account balance was 16% of total accounts receivable at December 31, 2018. There were no customers with a trade account receivable balance greater than 10% at December 31, 2019.
Revenue Recognition
Revenue is recognized when obligations under the terms of a contract with a customer are satisfied. Except for certain extended service contracts on a small percentage of units sold, the Company’s performance obligations are satisfied, and sales revenue is recognized when products are shipped from the Company’s facilities. From time to time, revenue is recognized under a bill and hold arrangement. Recognition of revenue on bill and hold arrangements occurs when control transfers to the customer. Our policy requires the reason for the bill and hold arrangement to be substantive, and the product to be separately identified as belonging to the customer, ready for physical transfer, and unavailable to be used or directed to another customer.
Revenue is measured as the amount of consideration expected to be received in exchange for the transfer of products. Sales and other taxes collected concurrent with revenue-producing activities are excluded from revenue. Warranty related costs are recognized as an expense at the time products are sold and a reserve is established. Depending on the terms of the arrangement, for certain contracts the Company may defer the recognition of a portion of the consideration received because a future obligation has not yet been satisfied, such as an extended service contract. An observable price is used to determine the stand-alone selling price for separate performance obligations or a cost plus margin approach is utilized when one is not available.
Shipping and Handling Fees and Cost
The Company records revenues earned for shipping and handling as revenue, while the cost of shipping and handling is classified as cost of operations.
Research and Development
Research and development costs are expensed as incurred and included in cost of operations and to a lesser extent in selling, general and administrative expenses. Research and development costs amounted to $3,702, $3,127 and $1,943 for 2019, 2018 and 2017, respectively.
F-11
Foreign Currency Translation
The functional currency for the Company’s foreign operations is the applicable local currency. The translation from the applicable foreign currencies to U.S. dollars is performed for balance sheet accounts using current exchange rates in effect at the balance sheet date, historical rates for equity and the weighted average exchange rate during the period for revenue and expense accounts. Foreign currency translation adjustments resulting from such translations are included in shareholders’ equity. Intercompany transactions denominated in a currency other than the functional currency are remeasured into the functional currency. Gains and losses resulting from foreign currency transactions are included in other (income) expense, net in our consolidated statements of income.
Recent Accounting Pronouncements
Recently Issued Standards
In December 2019, the Financial Accounting Standards Board (“FASB”) issued Accounting Standards Updated (“ASU”) 2019-12 Income Taxes (Topic 740), which among other things will require the Company to recognize franchise tax that is partially based on income as an income-based tax. The update will be effective for financial statements issued for annual periods, and interim periods within these annual periods, beginning after December 15, 2020, with early adoption permitted. The Company plans to apply the amendments in the update on a modified retrospective basis. The adoption of this update will not have a material impact on the Company’s consolidated financial statements and related disclosures.
In August 2018, the FASB issued ASU 2018‑15 Intangibles – Goodwill and Other – Internal-Use Software (Subtopic 350‑40) to align the requirements for capitalizing implementation costs incurred in cloud computing arrangements that are service contracts with the requirements for capitalizing implementation costs incurred to develop or obtain internal-use software. The update will be effective for financial statements issued for annual periods, and interim periods within these annual periods, beginning after December 15, 2019, with early adoption permitted. The Company plans to apply the amendments in the update prospectively to all implementation costs incurred after the date of the adoption. The adoption of this update will not have a material impact on the Company’s consolidated financial statements and related disclosures.
Recently Adopted Standards
During the first quarter of 2019, the Company adopted ASU 2016-02 Leases (Topic 842). The FASB issued ASU 2016‑02 to improve financial reporting on leasing transactions. The update affects all companies that lease assets. The amendments require lessees to recognize on the balance sheet the assets and liabilities for the rights and obligations created by lease agreements with terms greater than twelve months. Companies are also required to provide disclosures designed to enable users of financial statements to understand the amount, timing, and uncertainty of cash flows arising from leases. These disclosures include qualitative and quantitative requirements concerning additional information about the amounts recorded in the financial statements. The Company elected the package of practical expedients permitted by ASC Topic 842. Accordingly, the Company accounted for its existing operating leases as operating leases under the new guidance without reassessing whether the contracts contained a lease under ASC Topic 842 or whether classification of the operating leases would be different in accordance with ASC Topic 842. In the same manner, the company will not reassess the allocation of initial direct costs on existing leases. The Company also elected to not allocate consideration between lease and non-lease components. The amendments were adopted by the Company in the first quarter of 2019 by applying the modified retrospective approach and making a cumulative-effect adjustment to the opening balance of retained earnings at January 1, 2019. The cumulative effect adjustment to the consolidated balance sheets as of January 1, 2019 was as follows:
|
|
|
Balance at |
|
Cumulative Effect |
|
Balance at |
|||
|
|
|
December 31, 2018 |
|
Adjustment |
|
January 1, 2019 |
|||
|
Assets |
|
|
|
|
|
|
|
|
|
|
Right-of-use assets - operating leases |
|
$ |
— |
|
$ |
2,268 |
|
$ |
2,268 |
|
|
|
|
|
|
|
|
|
|
|
|
Liabilities and Shareholders’ Equity |
|
|
|
|
|
|
|
|
|
|
Current portion of operating lease obligation |
|
|
— |
|
|
1,358 |
|
|
1,358 |
|
Noncurrent portion of operating lease obligation |
|
|
— |
|
|
905 |
|
|
905 |
|
Deferred income tax liabilities |
|
|
1,700 |
|
|
1 |
|
|
1,701 |
|
Accumulated surplus |
|
|
81,354 |
|
|
4 |
|
|
81,358 |
F-12
3.LONG-TERM OBLIGATIONS
Long-Term Obligations
On December 20, 2018, we amended and restated our loan agreement with First Tennessee Bank National Association, which governs our existing $50,000 unsecured revolving credit facility, to (i) renew and extend the maturity date to May 31, 2022 and make certain other conforming changes, (ii) reduce the interest rate on outstanding loans from one month LIBOR rate plus 150 basis points to one month LIBOR rate plus an applicable margin of either 1.00% or 1.25% depending on the Company’s Leverage Ratio (as such term is defined in the amended and restated master revolving credit note), which margin adjusts periodically from time to time based on changes in such Leverage Ratio, and make certain other changes to the interest rate provisions, (iii) amend the tangible net worth covenant to increase the minimum required compliance level thereunder from $130,000 to $160,000 (the Company’s tangible net worth at December 31, 2019 was approximately $246,000) and (iv) modify certain definitions and other terms thereof. The credit facility contains customary representations and warranties, events of default, and financial, affirmative and negative covenants for loan agreements of this kind. Covenants under the credit facility restrict the payment of cash dividends if the Company would be in violation of the minimum tangible net worth test or the leverage ratio test in the current loan agreement as a result of the dividend, among various restrictions. We have been in compliance with these covenants throughout 2018 and 2019. In the absence of a default, all borrowings under the credit facility bear interest at the LIBOR Rate plus 1.00% or 1.25% per annum. The Company will pay a non-usage fee under the current loan agreement at a rate per annum equal to between 0.15% and 0.35% of the unused amount of the credit facility, which fee is paid quarterly.
In the absence of a default, all borrowings under the credit facility bear interest at the LIBOR Rate plus 1.00% or 1.25% per annum, depending on the leverage ratio. The Company will pay a non-usage fee under the current loan agreement at a rate per annum equal to between 0.15% and 0.35% of the unused amount of the credit facility, which fee is paid quarterly. Interest expense on the credit facility was $684, $512, and $492 for the years ended December 31, 2019, 2018, and 2017, respectively.
The Company had $4,998 and $15,000, in outstanding borrowings under the credit facility at December 31, 2019 and 2018, respectively.
Our French subsidiary, Jige International S.A., has an agreement with Banque Européenne du Crédit Mutuel for an unsecured fixed rate loan with a maturity date of September 30, 2020. All borrowings under this loan bear interest at 0.3% per annum. At December 31, 2019, the Company had $368 in outstanding borrowings under the loan agreement, all of which was classified as long-term obligations due within one year on the consolidated balance sheets. At December 31, 2018, the Company had $760 in outstanding borrowings under the loan agreement, of which $475 and $285 were classified as long-term obligations and long-term obligations due within one year, respectively, on the consolidated balance sheets. These borrowings are being used primarily for the purchase of land and routine repairs to the operating facilities in France. The loan agreement contains no material covenants.
Interest Rate Sensitivity. Changes in interest rates affect the interest paid on indebtedness under our credit facility because the outstanding amounts of indebtedness under our credit facility are subject to variable interest rates. Under our credit facility, the non-default rate of interest is equal to the LIBOR Market Index Rate plus 1.00% or 1.25% per annum, depending on the leverage ratio (for a rate of interest of 2.76% at December 31, 2019). A one percent change in the interest rate on our variable-rate debt would not have materially impacted our financial position, results of operations or cash flows for the year ended December 31, 2019.
4.STOCK-BASED COMPENSATION PLANS
In accordance with the Company’s stock-based compensation plans, the Company may grant incentive stock options as well as non-qualified and other stock-related incentives to officers, employees and non-employee directors of the Company. At the Annual Meeting of Shareholders of the Company held on May 26, 2017, the Company’s shareholders voted to approve the Miller Industries, Inc. 2016 Stock Incentive Plan, pursuant to which 800,000 shares of common stock are available for issuance pursuant to awards granted under the plan. No awards may be granted under the Company’s 2016 Stock Incentive Plan on or after August 1, 2026. Shares available for granting options at each of the years ended December 31, 2019, 2018 and 2017 were 800,000.
F-13
A summary of the activity of stock options for the years ended December 31, 2019, 2018 and 2017, is presented below (shares in thousands):
|
|
|
2019 |
|
2018 |
|
2017 |
|||||||||
|
|
|
|
|
Weighted |
|
|
|
Weighted |
|
|
|
Weighted |
|||
|
|
|
Shares |
|
Average |
|
Shares |
|
Average |
|
Shares |
|
Average |
|||
|
|
|
Under |
|
Exercise |
|
Under |
|
Exercise |
|
Under |
|
Exercise |
|||
|
|
|
Option |
|
Price |
|
Option |
|
Price |
|
Option |
|
Price |
|||
|
Outstanding at Beginning of Period |
|
— |
|
$ |
— |
|
11 |
|
$ |
5.49 |
|
37 |
|
$ |
5.49 |
|
Granted |
|
— |
|
|
— |
|
— |
|
|
— |
|
— |
|
|
— |
|
Exercised |
|
— |
|
|
— |
|
(10) |
|
|
5.49 |
|
(26) |
|
|
5.49 |
|
Forfeited and cancelled |
|
— |
|
|
— |
|
(1) |
|
|
5 |
|
— |
|
|
— |
|
Outstanding at End of Period |
|
— |
|
$ |
— |
|
— |
|
$ |
— |
|
11 |
|
$ |
5.49 |
|
Options exercisable at year end |
|
— |
|
$ |
— |
|
— |
|
$ |
— |
|
11 |
|
$ |
5.49 |
5.COMMITMENTS AND CONTINGENCIES
Leasing Activities
The Company leases certain equipment and facilities under long-term non-cancellable operating and finance lease agreements. The leases expire at various dates through 2026. Certain of the lease agreements contain renewal options. For those leases that have renewal options, the Company included these renewal periods in the lease term if the Company determined it was reasonably certain to exercise the renewal option. Lease payments during such renewal periods were also considered in the calculation of right-of-use assets and lease obligations.
Right-of-use assets represent the Company’s right to use an underlying asset for the lease term and lease obligations represent the Company’s obligation to make lease payments arising from the lease. Lease obligations are recognized at the commencement date based on the present value of lease payments over the lease term. Right-of-use assets are recognized at the commencement date as the initial measurement of the lease liability, plus payments made prior to lease commencement and any initial direct costs. As most of the Company’s leases do not provide an implicit rate, the Company uses its incremental borrowing rate based on the information available at the commencement date in determining the present value of lease payments. The Company’s lease terms may include options to extend or terminate the lease when it is reasonably certain that the Company will exercise that option. Expense is recognized on a straight-line basis over the lease term for operating leases. For finance leases, expense is recognized as the expense from straight-line amortization of the right-of-use asset plus the periodic interest expense from the lease obligation. Short-term leases have a lease term of twelve months or less. The Company recognizes short-term leases on a straight-line basis and does not record a related right-of-use asset or lease obligation for such contracts.
Right-of-use assets related to finance leases are included as a component of property, plant and equipment, net on the consolidated balance sheets and had the following values at December 31, 2019.
|
|
|
December 31, |
|
|
|
|
2019 |
|
|
Finance lease right-of-use assets |
|
$ |
78 |
|
Accumulated amortization |
|
|
(21) |
|
Finance lease right-of-use assets, net |
|
$ |
57 |
A maturity analysis of the undiscounted cash flows of operating and finance lease obligations is as follows:
|
|
|
Operating Lease Obligation |
|
Finance Lease Obligation |
||
|
Remaining lease payments to be paid during the year ended December 31, |
|
|
|
|
|
|
|
2020 |
|
$ |
381 |
|
$ |
23 |
|
2021 |
|
|
332 |
|
|
23 |
|
2022 |
|
|
317 |
|
|
15 |
|
2023 |
|
|
262 |
|
|
— |
|
2024 |
|
|
225 |
|
|
— |
F-14
|
Thereafter |
|
|
290 |
|
|
— |
|
Total lease payments |
|
|
1,807 |
|
|
61 |
|
Less Imputed Interest |
|
|
(170) |
|
|
(3) |
|
Lease obligation at December 31, 2019 |
|
$ |
1,637 |
|
$ |
58 |
The lease cost and certain other information during the year ended December 31, 2019 is as follows:
|
|
|
|
|
|
|
|
|
|
|
|
|
2019 |
|
|
Lease Cost |
|
|
|
|
Finance lease cost: |
|
|
|
|
Amortization of right-of-use assets |
|
$ |
21 |
|
Interest on lease obligation |
|
|
2 |
|
Total finance lease cost |
|
|
23 |
|
Total operating lease cost |
|
|
585 |
|
Short-term lease cost |
|
|
1,231 |
|
Total lease cost |
|
$ |
1,839 |
|
|
|
|
|
|
Other Information |
|
|
|
|
Cash paid for amounts included in the measurement of lease obligation: |
|
|
|
|
Operating cash flows from operating leases |
|
$ |
582 |
|
Financing cash flows from finance leases |
|
|
20 |
|
|
|
|
|
|
Right-of-use assets obtained in exchange for new finance lease obligations |
|
|
— |
|
Right-of-use assets obtained in exchange for new operating lease obligations |
|
|
265 |
The weighted average remaining lease term for operating leases and finance leases at December 31, 2019 was 5.6 years and 2.7 years, respectively. The weighted average discount rate for operating leases and finance leases at December 31, 2019 was 3.4% and 4.0%, respectively. The Company’s subsidiary in the United Kingdom leased facilities used for manufacturing and office space from a related party with related lease costs during the year ended December 31, 2019, 2018, and 2017 of $223, $219, and $202, respectively. The Company’s French subsidiary leased a fleet of vehicles from a related party with related lease costs during the year ended December 31, 2019, 2018, and 2017 of $109, $116, and $102, respectively.
Contingencies
The Company has entered into arrangements with third-party lenders where it has agreed, in the event of default by a distributor within the independent distributor network, to repurchase from the third-party lender company products repossessed from the independent distributor customer. These arrangements are typically subject to a maximum repurchase amount. The maximum amount of collateral that the Company could be required to purchase was approximately $73,958 and $49,694 at December 31, 2019 and 2018, respectively, as distributors increased usage of floor plan financing. The Company’s risk under these arrangements is mitigated by the value of the products that would be repurchased as part of the transaction. The Company considered the fair value at inception of its liability under these arrangements and concluded that the liability associated with these potential repurchase obligations was not probable and thus not material at December 31, 2019 or 2018. No repurchases of products were required during 2019 or 2018.
The Company is, from time to time, a party to litigation arising in the normal course of its business. Litigation is subject to various inherent uncertainties, and it is possible that some of these matters could be resolved unfavorably to the Company, which could result in substantial damages against the Company. The Company has established accruals for matters that are probable and reasonably estimable and maintains product liability and other insurance that management believes to be adequate. Management believes that any liability that may ultimately result from the resolution of these matters in excess of available insurance coverage and accruals will not have a material adverse effect on the consolidated financial position or results of operations of the Company.
F-15
6.INCOME TAXES
The Tax Cuts and Jobs Act (TCJA) was signed into law by the President in 2017. The TCJA created a territorial tax system, which generally allows companies to repatriate future foreign earnings without incurring additional U.S. taxes. It also includes a reduction in the corporate tax rate from a top rate of 35% to a flat rate of 21%, changes in business deductions, and many international provisions.
One of the main provisions of the TCJA requires the Company to compute a tax based on a deemed repatriation of deferred foreign income, whether or not actually distributed. At December 31, 2017, the Company had computed a reasonable estimate of this amount to be $1,102, net of foreign tax credits, and reflected it as a component of income tax provision in the consolidated statements of income during 2017. During 2018, the Company gathered additional information which demonstrated that the Company had over-accrued for this tax and reduced the liability to $625, which amount was paid during 2018.
Additional provisions of the TCJA are the Global Intangible-Low Taxed Income tax, or "GILTI" and the Foreign Derived Intangible Income deduction, or “FDII”. The provisions were effective for tax years beginning after December 31, 2017. The Company has implemented a policy to account for the impact of book to tax differences resulting from GILTI in the period in which the tax applies to the Company. The impact of GILTI and FDII were considered in the calculation of income tax for the years ended December 31, 2019 and 2018.
Income before income taxes includes the following components:
|
|
|
2019 |
|
2018 |
|
2017 |
|||
|
United States |
|
$ |
41,220 |
|
$ |
34,220 |
|
$ |
22,695 |
|
Foreign |
|
|
9,165 |
|
|
7,443 |
|
|
7,644 |
|
Total |
|
$ |
50,385 |
|
$ |
41,663 |
|
$ |
30,339 |
The provision for income taxes on income consisted of the following in 2019, 2018 and 2017:
|
|
|
2019 |
|
2018 |
|
2017 |
|||
|
Current: |
|
|
|
|
|
|
|
|
|
|
Federal |
|
$ |
6,422 |
|
$ |
5,480 |
|
$ |
4,871 |
|
Federal – Deemed Repatriation |
|
|
— |
|
|
(477) |
|
|
1,102 |
|
State |
|
|
53 |
|
|
(380) |
|
|
(1,435) |
|
Foreign |
|
|
3,083 |
|
|
2,719 |
|
|
3,653 |
|
|
|
|
9,558 |
|
|
7,342 |
|
|
8,191 |
|
Deferred: |
|
|
|
|
|
|
|
|
|
|
Federal |
|
|
1,599 |
|
|
571 |
|
|
(919) |
|
State |
|
|
17 |
|
|
(55) |
|
|
150 |
|
Foreign |
|
|
100 |
|
|
59 |
|
|
(99) |
|
|
|
|
1,716 |
|
|
575 |
|
|
(868) |
|
|
|
$ |
11,274 |
|
$ |
7,917 |
|
$ |
7,323 |
F-16
The principal differences between the federal statutory tax rate and the income tax expense in 2019, 2018 and 2017:
|
|
|
2019 |
|
2018 |
|
2017 |
|
|
Federal statutory tax rate |
|
21.0 |
% |
21.0 |
% |
35.0 |
% |
|
State taxes, net of federal tax benefit |
|
0.1 |
% |
(0.8) |
% |
1.0 |
% |
|
Excess of (decreases in) foreign tax over US tax on foreign income |
|
2.5 |
% |
2.9 |
% |
2.9 |
% |
|
Remeasurement of deferred taxes under TCJA |
|
— |
% |
— |
% |
(8) |
% |
|
Deemed repatriation tax |
|
— |
% |
(1.1) |
% |
3.6 |
% |
|
Domestic tax deductions and credits |
|
(0.4) |
% |
(0.4) |
% |
(3.1) |
% |
|
Foreign Derived Intangible Income deduction |
|
(1.1) |
% |
(1.3) |
% |
— |
% |
|
Release of unrecognized tax benefit |
|
— |
% |
— |
% |
(6) |
% |
|
Other |
|
0.3 |
% |
(1.3) |
% |
(1.8) |
% |
|
Effective tax rate |
|
22.4 |
% |
19.0 |
% |
24.1 |
% |
Deferred tax assets and liabilities are determined based on the differences between the financial and tax basis of existing assets and liabilities using the currently enacted tax rates in effect for the year in which the differences are expected to reverse.
Deferred income tax assets and liabilities reflect the impact of temporary differences between the amounts of assets and liabilities for financial reporting and income tax reporting purposes. Temporary differences and carry forwards which give rise to deferred tax assets and liabilities at December 31, 2019 and 2018 are as follows:
|
|
|
2019 |
|
2018 |
||
|
Deferred tax assets: |
|
|
|
|
|
|
|
Allowance for doubtful accounts |
|
$ |
212 |
|
$ |
213 |
|
Accruals and reserves |
|
|
1,902 |
|
|
1,963 |
|
Other |
|
|
399 |
|
|
811 |
|
Total deferred tax assets |
|
|
2,513 |
|
|
2,987 |
|
Deferred tax liabilities: |
|
|
|
|
|
|
|
Property, plant, and equipment |
|
|
5,926 |
|
|
4,686 |
|
Other |
|
|
3 |
|
|
1 |
|
Total deferred tax liabilities |
|
|
5,929 |
|
|
4,687 |
|
Valuation Allowance |
|
|
— |
|
|
— |
|
Net deferred tax asset/(liability) |
|
$ |
(3,416) |
|
$ |
(1,700) |
Deferred tax assets represent the future tax benefit of future deductible differences and, if it is more likely than not that a tax asset will not be realized, a valuation allowance is required to reduce the recorded deferred tax assets to net realizable value. The Company has evaluated positive and negative evidence to assess the realizability of its deferred taxes. Based on the evidence, the Company believes it is more likely than not that its deferred tax assets will be realizable. Accordingly, the Company has not included a valuation allowance against its deferred tax assets at this time. During 2018, the Company released $44 from its valuation allowance related to a deferred tax asset on a state net operating loss carryforward.
We do not currently have plans to repatriate undistributed foreign earnings to the United States and have not determined any timeline or amount for any such future distributions.
As of December 31, 2019, the Company had no federal net operating loss carryforwards, and no significant state net operating loss carryforwards. At December 31, 2018, the Company had a state net operating loss carryforward of $834.
Tax positions are evaluated in a two-step process. The Company first determines whether it is more likely than not that a position will be sustained upon examination. If a tax position meets the more-likely-than-not recognition threshold, it is then measured to determine the amount of benefit to recognize in the financial statements. The tax position is measured as the largest amount of benefit that is greater than 50% likely of being recognized.
F-17
A summary of the activity of the unrecognized tax benefits for the years ended December 31, 2019, 2018 and 2017, is presented below:
|
|
|
2019 |
|
2018 |
|
2017 |
|||
|
Unrecognized tax benefits – January 1 |
|
|
— |
|
|
— |
|
|
1,037 |
|
Gross increases – tax positions in prior period |
|
|
— |
|
|
— |
|
|
120 |
|
Gross decreases – tax positions in prior period |
|
|
— |
|
|
— |
|
|
(1,157) |
|
Unrecognized tax benefits –December 31, |
|
$ |
— |
|
$ |
— |
|
$ |
— |
During 2017, the Company accrued additional interest of $1 and penalties of $61 related to the unrecognized tax benefit, but subsequently released the $1,157 liability for the unrecognized tax benefits in full, including all related interest and penalties, due to changes in judgment resulting from the evaluation of new information not previously available.
The Company is subject to United States federal income taxes, as well as income taxes in various states and foreign jurisdictions. The Company’s 2016 and later tax years remain open to examination by the tax authorities. With few exceptions, as of December 31, 2019, the Company is no longer subject to U.S. federal, state or non-U.S. income tax examinations prior to 2016.
7.SHAREHOLDERS EQUITY
Common Stock
The Company is authorized to issue up to 100,000,000 shares of common stock with a par value of one cent per share.
Preferred Stock
The Company is authorized to issue up to 5,000,000 shares of undesignated preferred stock with a par value of one cent per share and which can be issued in one or more series. The terms, price and conditions of the preferred shares will be set by the board of directors. No shares of preferred stock have been issued.
F-18
Dividends
The Company has paid consecutive quarterly cash dividends since May 2011. Dividend payments made for 2019, 2018 and 2017 were as follows:
|
|
|
|
|
|
|
Dividend |
|
|
|
|
|
Payment |
|
Record Date |
|
Payment Date |
|
(per share) |
|
Amount |
||
|
|
|
|
|
|
|
|
|
|
|
|
|
Q1 2017 |
|
March 27, 2017 |
|
April 3, 2017 |
|
$ |
0.18 |
|
$ |
2,043 |
|
Q2 2017 |
|
June 13, 2017 |
|
June 20, 2017 |
|
|
0.18 |
|
|
2,048 |
|
Q3 2017 |
|
September 11, 2017 |
|
September 18, 2017 |
|
|
0.18 |
|
|
2,048 |
|
Q4 2017 |
|
December 4, 2017 |
|
December 11, 2017 |
|
|
0.18 |
|
|
2,049 |
|
Total for 2017 |
|
|
|
|
|
$ |
0.72 |
|
$ |
8,188 |
|
|
|
|
|
|
|
|
|
|
|
|
|
Q1 2018 |
|
March 19, 2018 |
|
March 26, 2018 |
|
$ |
0.18 |
|
$ |
2,049 |
|
Q2 2018 |
|
June 11, 2018 |
|
June 18, 2018 |
|
|
0.18 |
|
|
2,049 |
|
Q3 2018 |
|
September 10, 2018 |
|
September 17, 2018 |
|
|
0.18 |
|
|
2,051 |
|
Q4 2018 |
|
December 3, 2018 |
|
December 10, 2018 |
|
|
0.18 |
|
|
2,051 |
|
Total for 2018 |
|
|
|
|
|
$ |
0.72 |
|
$ |
8,200 |
|
|
|
|
|
|
|
|
|
|
|
|
|
Q1 2019 |
|
March 18, 2019 |
|
March 25, 2019 |
|
$ |
0.18 |
|
$ |
2,052 |
|
Q2 2019 |
|
June 10, 2019 |
|
June 17, 2019 |
|
|
0.18 |
|
|
2,051 |
|
Q3 2019 |
|
September 9, 2019 |
|
September 16, 2019 |
|
|
0.18 |
|
|
2,053 |
|
Q4 2019 |
|
December 9, 2019 |
|
December 16, 2019 |
|
|
0.18 |
|
|
2,052 |
|
Total for 2019 |
|
|
|
|
|
$ |
0.72 |
|
$ |
8,208 |
Accumulated Other Comprehensive Loss
During the year ended December 31, 2018, the Company reclassified a net foreign currency gain related to operations discontinued in previous years of $552 from accumulated other comprehensive loss to accumulated surplus.
8.EMPLOYEE BENEFIT PLANS
The Company maintains a contributory retirement plan for all full-time employees with at least 90 days of service. The plan is designed to provide tax-deferred income to the Company’s employees in accordance with the provisions of Section 401(k) of the Internal Revenue Code.
The plan provides that each participant may contribute the maximum allowable under Internal Revenue Service regulations. For 2019, 2018 and 2017, the Company matched 50% of the first 5% of participant contributions. Matching contributions vest over the first five years of employment. Company contributions to the plan were $1,030, $917 and $833 in 2019, 2018 and 2017, respectively.
9.REVENUE AND LONG-LIVED ASSETS
Substantially all of our revenue is generated from sales of towing equipment. As such, disaggregation of revenue by product line would not provide useful information because all product lines have substantially similar characteristics. However, revenue streams are
F-19
tracked by the geographic location of customers. Net sales and long-lived assets (property, plant and equipment, operating lease right-of-use assets, and goodwill) by region were as follows. Net sales are attributed to regions based on the locations of customers:
|
|
|
2019 |
|
2018 |
|
2017 |
||||||||||||
|
|
|
|
|
|
Long- |
|
|
|
|
Long- |
|
|
|
|
Long- |
|||
|
|
|
|
|
|
Lived |
|
|
|
|
Lived |
|
|
|
|
Lived |
|||
|
|
|
Net Sales |
|
Assets |
|
Net Sales |
|
|
Assets |
|
Net Sales |
|
|
Assets |
||||
|
North America |
|
$ |
697,002 |
|
$ |
97,650 |
|
$ |
574,806 |
|
$ |
90,036 |
|
$ |
527,134 |
|
$ |
85,707 |
|
|
|
|
|
|
|
|
|
|
|
|
|
|
|
|
|
|
|
|
|
Foreign |
|
|
121,164 |
|
|
6,344 |
|
|
136,900 |
|
|
4,433 |
|
|
87,967 |
|
|
3,540 |
|
|
|
|
|
|
|
|
|
|
|
|
|
|
|
|
|
|
|
|
|
|
|
$ |
818,166 |
|
$ |
103,994 |
|
$ |
711,706 |
|
$ |
94,469 |
|
$ |
615,101 |
|
$ |
89,247 |
Contract assets primarily relate to the Company’s rights to consideration for work completed but not billed at the reporting date. The contract assets are transferred to receivables when the rights become unconditional. Contract liabilities primarily relate to performance obligations to be satisfied in the future. As of December 31, 2019 and December 31, 2018, contract liability balances were $324 and $331, respectively, and are included in accrued liabilities on the accompanying consolidated balance sheets. During the years ended December 31, 2019 and 2018, the Company increased contract liabilities by $310 and $1,391, respectively. However, during the third quarter of 2019 and fourth quarter of 2018, respectively, the Company settled $361 and $1,214 of this liability with a contract credit in lieu of satisfaction of these obligations. The Company did not have any contract assets at December 31, 2019 or December 31, 2018. Terms on account receivables vary and are based on specific terms agreed upon with each customer. Write-offs of accounts receivable were not material during the years ended December 31, 2019 or 2018.
10.CUSTOMER INFORMATION
No single customer accounted for 10% or more of consolidated net sales for 2019, 2018 and 2017.
11.QUARTERLY FINANCIAL INFORMATION (UNAUDITED)
The following is a summary of the unaudited quarterly financial information for the years ended December 31, 2019 and 2018:
|
|
|
|
|
|
|
|
|
|
|
|
|
|
|
|
|
|
Cash |
|
|
|
|
|
|
|
|
|
|
|
|
|
Basic |
|
Diluted |
|
Dividends |
|||
|
|
|
|
|
|
Operating |
|
Net |
|
Income |
|
Income Per |
|
Declared |
|||||
|
|
|
Net Sales |
|
Income |
|
Income |
|
Per Share |
|
Share |
|
Per Share |
||||||
|
|
|
|
|
|
|
|
|
|
|
|
|
|
|
|
|
|
|
|
|
2019 |
|
|
|
|
|
|
|
|
|
|
|
|
|
|
|
|
|
|
|
First Quarter |
|
$ |
197,213 |
|
$ |
12,382 |
|
$ |
8,660 |
|
$ |
0.76 |
|
$ |
0.76 |
|
$ |
0.18 |
|
Second Quarter |
|
|
222,346 |
|
|
14,245 |
|
|
10,683 |
|
|
0.94 |
|
|
0.94 |
|
|
0.18 |
|
Third Quarter |
|
|
195,467 |
|
|
11,293 |
|
|
8,076 |
|
|
0.71 |
|
|
0.71 |
|
|
0.18 |
|
Fourth Quarter |
|
|
203,140 |
|
|
15,174 |
|
|
11,692 |
|
|
1.03 |
|
|
1.03 |
|
|
0.18 |
|
|
|
|
|
|
|
|
|
|
|
|
|
|
|
|
|
|
|
|
|
2018 |
|
|
|
|
|
|
|
|
|
|
|
|
|
|
|
|
|
|
|
First Quarter |
|
$ |
159,160 |
|
$ |
8,838 |
|
$ |
6,670 |
|
$ |
0.59 |
|
$ |
0.59 |
|
$ |
0.18 |
|
Second Quarter |
|
|
176,888 |
|
|
11,601 |
|
|
7,600 |
|
|
0.67 |
|
|
0.67 |
|
|
0.18 |
|
Third Quarter |
|
|
195,690 |
|
|
12,026 |
|
|
8,677 |
|
|
0.76 |
|
|
0.76 |
|
|
0.18 |
|
Fourth Quarter |
|
|
179,968 |
|
|
11,329 |
|
|
10,799 |
|
|
0.95 |
|
|
0.95 |
|
|
0.18 |
12.SUBSEQUENT EVENTS
On March 2, 2020, the Company’s board of directors declared a quarterly cash dividend of $0.18 per share. The dividend is payable March 23, 2020 to shareholders of record as of March 16, 2020.
F-20
MILLER INDUSTRIES, INC. AND SUBSIDIARIES
SCHEDULE II –VALUATION AND QUALIFYING ACCOUNTS
(in thousands)
|
|
|
Balance at |
|
|
|
Accounts |
|
Balance at |
||
|
|
|
Beginning |
|
Charged to |
|
Written |
|
End of |
||
|
|
|
of Period |
|
Expense |
|
Off |
|
Period |
||
|
|
|
|
|
|
|
|
|
|
|
|
|
Year Ended December 31, 2017 |
|
|
|
|
|
|
|
|
|
|
|
Deduction from asset accounts: |
|
|
|
|
|
|
|
|
|
|
|
Allowance for doubtful accounts |
|
$ |
1,004 |
|
86 |
|
(52) |
|
$ |
1,038 |
|
|
|
|
|
|
|
|
|
|
|
|
|
Year Ended December 31, 2018 |
|
|
|
|
|
|
|
|
|
|
|
Deduction from asset accounts: |
|
|
|
|
|
|
|
|
|
|
|
Allowance for doubtful accounts |
|
$ |
1,038 |
|
214 |
|
(140) |
|
$ |
1,112 |
|
|
|
|
|
|
|
|
|
|
|
|
|
Year Ended December 31, 2019 |
|
|
|
|
|
|
|
|
|
|
|
Deduction from asset accounts: |
|
|
|
|
|
|
|
|
|
|
|
Allowance for doubtful accounts |
|
$ |
1,112 |
|
15 |
|
(21) |
|
$ |
1,106 |
F-21
Pursuant to the requirements of Section 13 or 15(d) of the Securities Exchange Act of 1934, the Registrant has duly caused this Report to be signed on its behalf by the undersigned, thereunto duly authorized, on the 4th day of March, 2020.
|
|
MILLER INDUSTRIES, INC. |
|
|
|
|
|
|
|
By: |
/s/ Jeffrey I. Badgley |
|
|
Jeffrey I. Badgley |
|
|
|
Co-Chief Executive Officer |
|
Know all men by these presents, that each person whose signature appears below constitutes and appoints Jeffrey I. Badgley, William G. Miller, II and Frank Madonia, and each or any one of them, as attorney-in-fact and agent, with full power of substitution, for him in any and all capacities, to sign any amendments to this Report on Form 10 K, and to file the same, with exhibits thereto, and other documents in connection therewith, with the Securities and Exchange Commission, hereby ratifying and confirming all that said attorneys-in-fact and agents, or any of them, or their or his substitutes or substitute, may lawfully do or cause to be done by virtue hereof.
Pursuant to the requirements of the Securities Exchange Act of 1934, this Report has been signed below by the following persons on behalf of the Registrant in the capacities indicated on the 4th day of March, 2020.
|
Signature |
|
Title |
|
|
|
|
|
/s/ William G. Miller |
|
Chairman of the Board of Directors |
|
William G. Miller |
|
|
|
|
|
|
|
/s/ Jeffrey I. Badgley |
|
Co-Chief Executive Officer |
|
Jeffrey I. Badgley |
|
|
|
|
|
|
|
/s/ William G. Miller, II |
|
President, Co-Chief Executive Officer and Director |
|
William G. Miller, II |
|
|
|
|
|
|
|
/s/ Deborah L. Whitmire |
|
Executive Vice President, Chief Financial Officer, Treasurer and Director (Principal Financial and Accounting Officer) |
|
Deborah L. Whitmire |
|
|
|
|
|
|
|
/s/ Theodore H. Ashford, III |
|
Director |
|
Theodore H. Ashford, III |
|
|
|
|
|
|
|
/s/ A. Russell Chandler, III |
|
Director |
|
A. Russell Chandler, III |
|
|
|
|
|
|
|
/s/ Richard H. Roberts |
|
Director |
|
Richard H. Roberts |
|
|
|
|
|
|
|
/s/ Leigh Walton |
|
Director |
|
Leigh Walton |
|
|
S-1