Attached files
UNITED STATES
SECURITIES AND EXCHANGE COMMISSION
WASHINGTON, D.C. 20549
FORM 10-K
(Mark One)
☒ ANNUAL REPORT PURSUANT TO SECTION 13 OR 15(d) OF THE SECURITIES EXCHANGE ACT OF 1934
For the fiscal year ended December 31, 2019
☐ TRANSITION REPORT PURSUANT TO SECTION 13 OR 15(d) OF THE SECURITIES EXCHANGE ACT OF 1934
For the transition period from ______________to ______________
Commission File Number 001-35898
LINDBLAD EXPEDITIONS HOLDINGS, INC.
(Exact Name of Registrant as Specified in Its Charter)
|
Delaware |
|
27-4749725 |
|
(State or Other Jurisdiction of |
|
(I.R.S. Employer |
|
96 Morton Street, 9th Floor, New York, New York |
|
10014 |
|
(Address of Principal Executive Offices) |
|
(Zip Code) |
(212) 261-9000
(Registrant’s Telephone Number, Including Area Code)
Securities registered pursuant to Section 12(b) of the Act:
|
Title of each class |
Trading Symbol(s) |
|
Name of each exchange on which registered |
|
|
|
|
|
||
|
Common Stock, par value $0.0001 per share |
LIND |
|
The NASDAQ Stock Market LLC |
|
|
|
|
|
Securities registered pursuant to Section 12(g) of the Act:
None
Indicate by check mark if the registrant is a well-known seasoned issuer, as defined in Rule 405 of the Securities Act. Yes ☐ No ☒
Indicate by check mark if the registrant is not required to file reports pursuant to Section 13 or 15(d) of the Exchange Act. Yes ☐ No ☒
Indicate by check mark whether the registrant (1) has filed all reports required to be filed by Section 13 or 15(d) of the Exchange Act of 1934 during the past 12 months (or for such shorter period that the registrant was required to file such reports), and (2) has been subject to such filing requirement for the past 90 days. Yes ☒ No ☐
Indicate by check mark whether the registrant has submitted electronically every Interactive Data File required to be submitted pursuant to Rule 405 of Regulation S-T during the preceding 12 months (or for such shorter period that the registrant was required to submit such files). Yes ☒ No ☐
Indicate by check mark whether the registrant is a large accelerated filer, an accelerated filer, a non-accelerated filer, smaller reporting company, or an emerging growth company. See the definitions of “large accelerated filer,” “accelerated filer,” “smaller reporting company,” and “emerging growth company” in Rule 12b-2 of the Exchange Act.
|
Large accelerated filer ☐ |
Accelerated filer ☒ |
|
Non-accelerated filer ☐ |
Smaller reporting company ☐ |
|
|
Emerging growth company ☐ |
If an emerging growth company, indicate by check mark if the registrant has elected not to use the extended transition period for complying with any new or revised financial accounting standards provided pursuant to Section 13(a) of the Exchange Act. ☐
Indicate by check mark whether the registrant is a shell company (as defined in Rule 12b-2 of the Exchange Act). Yes ☐ No ☒
As of June 28, 2019 (the last business day of the registrant’s most recently completed second fiscal quarter), the aggregate market value of the common stock held by non-affiliates of the registrant was approximately $509.4 million based on the closing sales price of $17.95 on the NASDAQ Capital Market.
As of February 18, 2020, there were 49,718,438 shares of the registrant’s common stock outstanding.
DOCUMENTS INCORPORATED BY REFERENCE:
Portions of the registrant’s Definitive Proxy Statement relating to its 2020 Annual Meeting of Stockholders are incorporated by reference in Part III, Items 10-14 of this Annual Report on Form 10-K as indicated herein.
LINDBLAD EXPEDITIONS HOLDINGS, INC.
Annual Report on Form 10-K
For the year ended December 31, 2019
Table of Contents
|
|
|
Page(s) |
|
|
|
|
|
|
||
|
|
||
|
Item 1. |
2 | |
|
Item 1A. |
15 | |
|
Item 1B. |
26 | |
|
Item 2. |
26 | |
|
Item 3. |
27 | |
|
Item 4. |
27 | |
|
|
|
|
|
|
|
|
|
Item 5. |
28 | |
|
Item 6. |
29 | |
|
Item 7. |
Management’s Discussion and Analysis of the Results of Operations and Financial Condition |
30 |
|
Item 7A. |
43 | |
|
Item 8. |
44 | |
|
Item 9. |
Changes in and Disagreements with Accountants on Accounting and Financial Disclosure |
44 |
|
Item 9A. |
44 | |
|
Item 9B. |
46 | |
|
|
|
|
|
|
|
|
|
Item 10. |
46 | |
|
Item 11. |
46 | |
|
Item 12. |
Security Ownership of Certain Beneficial Owners and Management and Related Shareholder Matters |
46 |
|
Item 13. |
Certain Relationships and Related Transactions, and Director Independence |
46 |
|
Item 14. |
46 | |
|
|
|
|
|
|
||
|
Item 15. |
47 | |
|
|
50 | |
i
Cautionary Note Regarding Forward-Looking Statements
Any statements in this Annual Report on Form 10-K (the “Form 10-K”) about our expectations, beliefs, plans, objectives, prospects, financial condition, assumptions or future events or performance are not historical facts and are “forward-looking statements” as that term is defined under the federal securities laws. These statements are often, but not always, made through the use of words or phrases such as “believe,” “anticipate,” “should,” “intend,” “plan,” “will,” “expects,” “estimates,” “projects,” “positioned,” “strategy,” “outlook” and similar words. You should read the statements that contain these types of words carefully. Such forward-looking statements are subject to a number of risks, uncertainties and other factors that could cause actual results to differ materially from what is expressed or implied in such forward-looking statements. There may be events in the future that we are not able to predict accurately or over which we have no control. Potential risks and uncertainties include, but are not limited to:
|
|
● |
general economic conditions; |
|
|
|
|
|
|
● |
unscheduled disruptions in our business due to weather events, mechanical failures, or other events; |
|
|
|
|
|
|
● |
changes adversely affecting the business in which we are engaged; |
|
|
|
|
|
|
● |
management of our growth and our ability to execute on our planned growth; |
|
|
|
|
|
|
● |
our business strategy and plans; |
|
|
|
|
|
|
● |
our ability to maintain our relationship with National Geographic Society; |
|
|
|
|
|
|
● |
compliance with new and existing laws and regulations, including environmental regulations; |
|
|
|
|
|
|
● |
compliance with the financial and/or operating covenants in our debt arrangements; |
|
|
|
|
|
|
● |
adverse publicity regarding the travel and cruise industry in general; |
|
|
|
|
|
|
● |
loss of business due to competition; |
|
|
|
|
|
|
● |
the result of future financing efforts; |
|
|
|
|
|
|
● |
delays and costs overruns with respect to the construction and delivery of newly constructed vessels or financial difficulties of the shipyard constructing such vessels; |
|
|
|
|
|
|
● |
the inability to meet revenue and Adjusted EBITDA projections; and |
|
|
|
|
|
|
● |
those risks discussed in Item 1A. Risk Factors. |
We urge you not to place undue reliance on these forward-looking statements, which speak only as of the date of this report. We do not undertake any obligation to release publicly any revisions to such forward-looking statements to reflect events or uncertainties after the date hereof or to reflect the occurrence of unanticipated events.
Unless the context otherwise requires, in this Form 10-K, “Company,” “Lindblad,” “we,” “us,” “our,” and “ours” refer to Lindblad Expeditions Holdings, Inc., and its subsidiaries.
|
Item 1. |
Overview
Lindblad provides expedition cruising and adventure travel experiences, fostering a spirit of exploration and discovery, using itineraries that feature up-close encounters with wildlife, nature, history and culture, and promote guest empowerment and interactivity. Our mission is to offer life-changing adventures around the world and pioneer innovative ways to allow our guests to connect with exotic and remote places. Our expedition ships are customized, nimble and intimately-scaled vessels that are able to venture where larger cruise ships cannot, thus allowing us to offer up-close experiences in the planet’s wild and remote places and capitals of culture. Many of these expeditions involve travel to remote places with limited infrastructure and ports (such as Antarctica and the Arctic), including places that are best accessed by a ship (such as the Galápagos, the Alaskan coast and Baja California’s Sea of Cortez), and foster active engagement by guests. Each expedition ship is designed to be comfortable and inviting, while being fully equipped with state-of-the-art tools for in-depth exploration. In addition to our sea-based expeditions, we offer land-based, eco-conscious expeditions across the globe from Antarctica to Zimbabwe primarily through our Natural Habitat, Inc. (“Natural Habitat”) subsidiary.
We choose to visit geographic areas based upon many factors, including weather, marine conditions, migration patterns and various natural phenomena. In the northern hemisphere summer months, we primarily visit the High Arctic regions of the world, Alaska, the Canadian Maritimes, Europe, as well as the South Pacific, and in the northern hemisphere winter months, we primarily travel to Antarctica, South America, Costa Rica, Baja California and the Caribbean. The Galápagos Islands are a year-round destination offering a diverse variety of marine, land and airborne wildlife.
We currently operate a fleet of eight owned expedition ships and five seasonal charter vessels. In addition, we are building two new polar ice-class vessels, the National Geographic Endurance, scheduled for delivery in the first quarter of 2020, and her sister ship, the National Geographic Resolution, scheduled to be delivered in the fourth quarter of 2021.
We deploy chartered vessels for various seasonal offerings and continually seek to optimize our charter fleet to balance our inventory with demand and maximize yields. We use our charter inventory as a mechanism to both increase travel options for our existing and prospective guests and also to test demand for certain areas and seasons to understand the potential for longer term deployments and additional vessel needs.
Our offerings appeal to a wide range of travelers, both individuals and families, with affluent individuals in the U.S. aged 50 years or older representing our largest demographic category. The quality of our offerings has enabled us to achieve and maintain premium pricing in the market instead of pursuing the type of discounting in which most large cruise lines that are focused on the broader market engage. Our product offering, value proposition and differentiated pricing approach have enabled us to achieve high net yields and occupancy rates.
We have a longstanding relationship with the National Geographic Society, which was founded on a shared interest in exploration, research, technology and conservation. This relationship includes co-selling, co-marketing and branding arrangements with National Geographic Partners, LLC (“National Geographic”) whereby our owned vessels carry the National Geographic name and National Geographic sells our expeditions through their internal travel divisions. We collaborate with National Geographic on expedition planning to enhance the guest experience by having National Geographic experts, including photographers, writers, marine biologists, naturalists, field researchers and film crews, join our expeditions. Guests have the ability to interface with these experts through lectures, excursions, dining and other experiences throughout their expedition.
Our business benefits from significant visibility into future revenues, as our guests generally plan and book their voyages far in advance of their departure dates. As of February 18, 2020, 86% of the Lindblad segment’s expected guest ticket revenues for 2020 have been booked.
Natural Habitat specializes in nature adventures, that provide unparalleled access to the planet's most extraordinary wildlife, landscapes and cultures. We provide unique itineraries that include access to private wildlife reserves, remote corners of national parks and distinctive, secluded and remote lodges and camps situated where wildlife viewing is best. Because of our commitment to environmentally friendly travel and the exceptional quality of our worldwide adventures, we have partnered with World Wildlife Fund (“WWF”) as their exclusive conservation travel partner. Through our relationship with WWF, their top scientists and staff collaborate with us in planning journeys to the world’s most captivating nature destinations.
Lindblad Expeditions Ships and Voyages
Itineraries
Currently we operate a fleet of eight owned expedition vessels, with our ninth and tenth, the National Geographic Endurance and the National Geographic Resolution, scheduled to be delivered in the first quarter of 2020 and the fourth quarter of 2021, respectively, and five seasonal chartered ships to provide our signature marine-based adventures to over 40 destinations on six continents, offering itineraries that last from four to 35 days. We have extensive experience operating in the Galápagos Islands, Alaska, Antarctica and the Arctic, with the Lindblad family having been among the first to bring non-scientist travelers to these regions. We currently operate two vessels providing itineraries in the Galápagos throughout the year. We operate two polar vessels that serve primarily in Antarctica during the northern hemisphere winter, in the Arctic during the northern hemisphere summer and various destinations during the intermediate months. We also operate four ships in Alaska during the northern hemisphere summer months that travel south along the North American coastline to the Sea of Cortez, Belize, Guatemala, Costa Rica and Panama for the winter. In addition, we charter five vessels for seasonal itineraries in the Amazon, Scotland, the Caribbean, the Mediterranean, Cambodia and Vietnam, and Egypt.
We place a strong focus on innovation, which we seek to achieve by introducing new expedition options and continuously making improvements to our fleet and voyage experiences as new technology or operating procedures are developed. We make deployment decisions with the goal of optimizing the overall profitability of our portfolio, with these decisions generally made 18 to 24 months in advance. Lindblad segment occupancy rates were 91%, 91% and 87% for the years ended December 31, 2019, 2018 and 2017, respectively, indicating strong consumer interest in our offerings. Adding new capacity allows us to expand our inventory of existing itineraries, extend into new markets and explore new destinations. The following table presents summary information concerning the ships we currently operate, and their geographic areas of operation based on planned 2020 itineraries:
|
Vessel Name |
|
Date Built |
|
Guest Capacity |
|
Cabins |
|
Primary Areas of Operation |
|
Flag |
|
|
|
|
|
|
|
|
|
|
|
|
|
National Geographic Endeavour II |
|
2005, renovated in 2016 |
|
95 |
|
50 |
|
Galápagos |
|
Ecuador |
|
National Geographic Explorer |
|
1982, rebuilt in 2008 |
|
148 |
|
81 |
|
Arctic, Antarctica, Europe, the British Isles and Patagonia/South America |
|
Bahamas |
|
National Geographic Islander |
|
1995 |
|
47 |
|
24 |
|
Galápagos |
|
Ecuador |
|
National Geographic Orion |
|
2003 |
|
102 |
|
53 |
|
Arctic, Antarctica, Bering Sea, South America and the South Pacific |
|
Bahamas |
|
National Geographic Quest |
|
2017 |
|
96 |
|
50 |
|
Alaska, Canada, the Pacific Northwest, Belize, Columbia, Costa Rica and Panama |
|
U.S.A. |
|
National Geographic Sea Bird |
|
1981 |
|
62 |
|
31 |
|
Alaska, Baja California and the Pacific Northwest |
|
U.S.A. |
|
National Geographic Sea Lion |
|
1982 |
|
62 |
|
31 |
|
Alaska, Costa Rica, Panama and the Pacific Northwest |
|
U.S.A. |
|
National Geographic Venture |
|
2018 |
|
96 |
|
50 |
|
Alaska, Pacific Northwest, California Coast and Baja California |
|
U.S.A. |
|
Delfin II* |
|
2009 |
|
28 |
|
14 |
|
Amazon |
|
Peru |
|
Jahan* |
|
2011 |
|
48 |
|
24 |
|
Vietnam and Cambodia |
|
Vietnam |
|
Lord of the Glens* |
|
1985, renovated in 2016 |
|
48 |
|
26 |
|
Scotland |
|
UK |
|
Oberoi Philae* |
|
1996, renovated in 2015 |
|
44 |
|
22 |
|
Egypt |
|
Egypt |
|
Sea Cloud* |
|
1931, rebuilt in 1979, renovated in 2011 |
|
58 |
|
28 |
|
Caribbean and Mediterranean |
|
Malta |
* Chartered Vessel
The following table presents summary information concerning our new passenger cruise vessels under construction.
|
Vessel Name |
|
Scheduled Delivery |
|
Guest Capacity |
|
Cabins |
|
Primary Areas of Operation |
|
Flag |
|
|
|
|
|
|
|
|
|
|
|
|
|
National Geographic Endurance |
|
Q1 2020 |
|
126 |
|
69 |
|
Arctic, Antarctic, Greenland and Norway |
|
Bahamas |
|
National Geographic Resolution |
|
Q4 2021 |
|
126 |
|
69 |
|
Arctic, Antarctic, Greenland and Norway |
|
Bahamas |
Owned Vessels
National Geographic Endeavour II joined the fleet in 2016, sailing year-round in the Galápagos. The National Geographic Endeavour II accommodates 95 guests in 50 cabins and offers public areas designed for maximum viewing of nature and wildlife. The forward lounge features a presentation space that offers all aboard the chance to participate in evening exploration recaps or special guest events. The ship is also outfitted with the tools of exploration, including Zodiacs, kayaks, paddleboards and underwater cameras, to connect guests with the islands and undersea wildlife.
National Geographic Explorer joined the fleet in 2008 and primarily operates in the Arctic, Antarctica, Europe, the British Isles and Patagonia/South America. The National Geographic Explorer accommodates 148 guests in 81 cabins, including 13 cabins with private balconies and six suites. The National Geographic Explorer is outfitted with an ice-strengthened hull, advanced navigation equipment and is equipped to visit some of the most remote and extreme areas on the planet. The vessel is spacious and modern, with a variety of public areas that offer views of the passing landscape and for observing wildlife, including a window-lined library and observation lounge located at the top of the ship, several observation decks and a forward-facing chart room.
National Geographic Islander joined the fleet in 2005 and sails year-round in the Galápagos. The National Geographic Islander accommodates 47 guests in 24 outside cabins, including two suites The National Geographic Islander is a twin-hulled, yacht-scale ship designed for active exploration which it is ideally suited for as its trim design and maneuvering abilities enable it to visit areas larger vessels cannot, allowing guests to experience the islands from a more up-close perspective. On board there are open decks that are complete with hammocks as well as a large dining room and large lounges that form part of the social hub of the ship.
National Geographic Orion joined the fleet in 2013 and primarily operates in the Arctic, Antarctic, Alaska, South America, the Bering Sea, Russia and the South Pacific. The National Geographic Orion accommodates 102 guests in 53 cabins and a variety of public spaces that offer panoramic views of the passing landscape. The National Geographic Orion is a blue water, ice-class vessel, equipped with advanced technology, including large retractable stabilizers, sonar, radar and an ice-strengthened hull. A shallow draft as well as bow and stern thrusters allow for maneuvering close to shore. The public rooms include a window-lined main lounge, as well as an observation lounge and library at the top of the ship, with numerous observation decks.
National Geographic Quest joined the fleet during the third quarter of 2017 and is the sister-ship of the National Geographic Venture. The National Geographic Quest primarily sails in Alaska, Canada, the Pacific Northwest, Belize, Columbia, Costa Rica and Panama. The vessel accommodates 96 guests in 50 cabins, including 22 cabins with step-out balconies. The ship features the latest satellite communication and navigation technology, designed with superior viewing experiences from the decks and common areas, and is equipped with Zodiacs, kayaks, paddleboards and other expeditionary equipment. The National Geographic Quest has a shallow draft and small size, which allows it to reach places inaccessible to larger ships.
National Geographic Sea Bird joined the fleet in 1991 and is the twin ship of the National Geographic Sea Lion. The National Geographic Sea Bird accommodates 62 guests in 31 outside cabins and has an open bow that provides for shared wildlife viewing experiences. The vessel offers expedition cruises in Alaska, the Pacific Northwest, Baja California and the Sea of Cortez. The National Geographic Sea Bird’s shallow draft and small size allow it to reach places inaccessible to larger ships.
National Geographic Sea Lion joined the fleet in 1990 and is the twin ship of National Geographic Sea Bird. The National Geographic Sea Lion accommodates 62 guests in 31 outside cabins and has an open bow that provides for shared wildlife viewing experiences. The vessel offers expedition cruises in Alaska, the Pacific Northwest, Baja California, Costa Rica and Panama. The National Geographic Sea Lion has a shallow draft and a small size so that it can reach places inaccessible to larger ships.
National Geographic Venture is our newest vessel, joining the fleet during the fourth quarter of 2018, and is the sister-ship of the National Geographic Quest. The vessel accommodates 96 guests in 50 cabins, including 22 cabins with step-out balconies. The vessel cruises in Alaska, the Pacific Northwest, the California Coast, Baja California and the Sea of Cortez. The ship features the latest satellite communication and navigation technology, designed with superior viewing experiences from the decks and common areas, and is equipped with Zodiacs, kayaks, paddleboards and other expeditionary equipment. The National Geographic Venture’s shallow draft and small size allow it to reach places inaccessible to larger ships.
Chartered Vessels
Delfin II is a riverboat built to explore the Peruvian Amazon. The Delfin II accommodates 28 guests in 10 suites and four master suites. The entire third deck is open-air, offering a view of the river and the rainforest. The ship is purpose built to serve the waterways of the Amazon and the ship is decorated with handicrafts from the ribereños, indigenous people of the native wildlife preserves.
Jahan is a riverboat built in 2011 for exploring Vietnam and Cambodia. The Jahan accommodates 48 guests in 24 cabins, including two suites. Every cabin has a private balcony and the suites each have a private Jacuzzi. Jahan has four decks and has several public areas where the expedition community can gather to watch life along the riverbank. The public spaces include a covered, open-air observatory, open bow and a pool on the top deck.
Lord of the Glens is specifically sized to be able to sail through the Caledonian Canal in Scotland, which connects the North Sea to the Atlantic and can navigate the coastline and venture to the islands of the Inner Hebrides. The Lord of the Glens accommodates 48 guests in 26 outside cabins.
Oberoi Philae explores the Nile River in Egypt and accommodates 42 guests in 22 cabins, including four suites with modern amenities, and a relaxed, elegant ambiance. Oberoi Philae has the feel of a luxurious private yacht and has five decks with several public spaces. The public spaces include a fitness room, a fully equipped spa with treatment rooms, lounge and library, and a pool on the top deck.
Sea Cloud offers the experience of sailing aboard a fully-rigged ship in the Caribbean and Mediterranean and accommodates 58 guests in 28 outside cabins, including two original owner’s suites that still feature original marble baths and fireplaces. The Sea Cloud has extensive public spaces on the top deck, a dining room that can accommodate all guests at once for single seating and a lounge.
New Passenger Vessels Under Construction
National Geographic Endurance is scheduled to join the fleet in the first quarter of 2020. The National Geographic Endurance will accommodate 126 guests in 69 cabins, including 53 cabins with balconies, and all cabins are equipped with expedition command centers with tablets and TVs, allowing guests to view presentations from their cabins. The National Geographic Endurance is a next-generation expedition ship, purpose-built for polar navigation, fully stabilized, highly strengthened, ice-class Polar Code PC5 (Category A) vessel that is designed to navigate polar passages year-round, and safely explore uncharted waters, while providing exceptional comfort. The National Geographic Endurance will feature an X-BOW® design providing an extremely smooth ride even in adverse conditions and contains a full suite of expedition tools. The variety of public areas include two restaurants, one with 270º views of the surrounding ocean and landscape, and an observation lounge with state-of-the art facilities for presentations. In 2020, the National Geographic Endurance will explore the Arctic, Antarctic and Northern Europe.
National Geographic Resolution is scheduled to join the fleet in the fourth quarter of 2021. Similar to its sister ship, the National Geographic Endurance, the National Geographic Resolution will accommodate 126 guests in 69 cabins, including 53 cabins with balconies, and all cabins are equipped with expedition command centers with tablets and TVs, allowing guests to view presentations from their cabins. The National Geographic Resolution is a next-generation expedition ship, purpose-built for polar navigation, fully stabilized, highly strengthened, ice-class Polar Code PC5 (Category A) vessel that is designed to navigate polar passages year-round, and safely explore uncharted waters, while providing exceptional comfort. The National Geographic Resolution will feature an X-BOW® design providing an extremely smooth ride even in adverse conditions and contains a full suite of expedition tools. The variety of public areas include two restaurants, one with 270º views of the surrounding ocean and landscape, and an observation lounge with state-of-the art facilities for presentations.
Ship Repair and Maintenance
In addition to routine repairs and maintenance performed on an ongoing basis and in accordance with applicable requirements, each of our expedition ships is taken out of service periodically for a scheduled deeper maintenance period to conduct repairs and improvements. We maintain our fleet in accordance with applicable regulations, international conventions and insurance requirements. This includes regularly scheduled maintenance, periodic inspections, drydocking, wetdocking and overhaul. In addition, renovations and replacements of various vessel elements are part of the ongoing process of maintaining the vessels to a high standard of reliability.
For U.S. flagged ships, the statutory requirement is an annual docking and U.S. Coast Guard inspections, normally conducted in drydock. Internationally flagged ships have scheduled dockings approximately every 12 months, for a period of up to three to six weeks. Drydock interval and required inspections are statutory requirements controlled under chapters of the International Convention of the Safety of Life at Seas (“SOLAS”) and Classification Society instructions. Under these regulations, passenger ships must be inspected in drydock twice in five years, with the maximum duration between each drydock inspection not to exceed three years, and an underwater hull inspection is required annually. To the extent practicable each ship’s crew and hotel staff remain with the ship during docking periods and assist in performing repair and maintenance work. Dockings are typically planned during non-peak demand periods to minimize the adverse effect on revenue that results from ships being out of service.
Guest Activities and Services
We provide our guests the opportunity and the tools to be active and engaged explorers. Our vessels carry a variety of equipment for exploration which, depending on the ship and destination, may include Zodiacs for water-based activities and quick transfers to shore, kayaks and paddleboards for personal exploration, motorized skiffs, an underwater camera, a remotely operated vehicle, a video microscope to study some of the smallest organisms of the marine ecosystem, a crow’s nest camera atop a ship’s mast, hydrophones for listening to vocalizations of marine mammals, snorkeling gear, scuba gear and wetsuits. An experienced and knowledgeable expedition staff leads guests in exploration while Zodiac riding, hiking onshore, paddling on the water or observing wildlife from ashore or onboard the ship. All voyages feature a certified photo instructor onboard and many include photographers from National Geographic.
Our ships allow us to offer guests authentic, up-close experiences in the planet's wild, remote places, but at the same time, enjoy a high level of comfort, convenience and safety. High-quality dining is an integral part of our expedition experience with influences and flavors that reflect the regions being explored, along with traditional fare. Food prepared aboard is sourced locally whenever practicable from sustainable providers. Seating is open and the atmosphere is relaxed. Our ships offer a range of services and amenities which allow our guests to travel in comfort. Depending on the ship, these may include a fitness center, a spa offering a variety of treatments, a photo kiosk for photographers to edit and sort photos, 24-hour beverage service, internet connection, laundry facilities and a doctor on call.
We offer to handle virtually all travel aspects related to guest reservations and transportation, simplifying the planning and booking process for our guests. We also provide guests the opportunity to purchase pre- and post-expedition extensions or services that may include additional hotel nights, air travel, private transfers, excursions, land travel packages and travel protection insurance.
Competitive Strengths
Our management team believes the following characteristics of our business model will enable us to successfully execute our strategy:
Expertise and Name Recognition
Our leadership and expertise today are built on the Lindblad family’s decades of experience in expedition adventure travel. Sven-Olof Lindblad, our President and Chief Executive Officer, comes from a rich expedition heritage. The International Association of Antarctica Tour Operators, which was established in 1991, believes that the concept of expedition cruising, coupled with education as a major theme, began when Lars-Eric Lindblad, Sven-Olof Lindblad’s father, led the first traveler’s expedition to Antarctica in 1966. Lars-Eric Lindblad has also been recognized by The New York Times, Travel + Leisure Magazine and other publications for his vision and leadership in developing what is today known as expedition travel. Believing that educated people who saw things with their own eyes would be a potent force for the preservation of the places they visited, Lars-Eric Lindblad worked to promote conservation and restoration projects worldwide. Sven-Olof Lindblad founded Lindblad in 1979, expanding the legacy of his father by providing expanded marine experiences around the world.
Under Mr. Lindblad’s leadership, we have led innovation in the expedition adventure travel industry. We pioneered expeditions in the High Arctic and Baja California’s Sea of Cortez and created what we view as the most innovative and in-depth expedition program in Alaska. We initiated the use of kayaks for active exploration in the Polar Regions and in the Galápagos, a feature which is now available on all of our owned vessels to enable personal, water-level encounters with nature. We were also one of the first to develop an undersea exploration program as part of a small ship expedition utilizing state-of-the-art equipment and technology.
As a pioneer in the expedition adventure travel sector, we have established deep expertise and knowledge of operating expedition cruises in extreme locations. We have earned awards and honors from various representatives of the travel industry, including recognition for the quality of our offerings and our support for conservation and sustainable tourism. Some of the awards we earned during 2019 are as follows:
|
|
● |
Cruise Critic 2019 Cruisers’ Choice Destination Awards: Top Small Ship Cruise Line in Alaska |
|
|
|
|
|
|
● |
Conde Nast Traveler 2019 Readers Choice Awards: Top Small Cruise Lines in The World |
|
|
|
|
|
|
● |
Travel Weekly Gold Magellan Awards: Best Expedition Cruise Itinerary |
|
|
|
|
|
|
● |
Travel + Leisure World’s Best: Top Small-Ship Ocean Cruise Lines |
|
|
|
|
|
|
● |
USA TODAY 10Best Readers’ Choice Travel Award: Best Adventure Travel Company |
|
|
● |
USA TODAY 10Best Readers’ Choice Travel Award: Best Adventure Cruise Lines |
|
|
● |
Global Traveler Magazine’s Wherever Family Awards – Best Family Friendly Travel Provider of the Year |
|
|
|
|
|
|
● |
Ensemble Travel Purpose Awards: Caring for Community, Environment and Protecting Local Heritage |
|
|
|
|
|
● |
PURE Life Experiences: Transformative Travel Award: Natural Habitat Adventures World’s First Zero Waste Adventure |
|
|
● |
Outdoor Magazine: Best Trips of 2019: Natural Habitat Adventures Seven-Day Yellowstone Safari |
|
|
● |
AFAR 2019 World’s Best Trips: Best Wildlife Encounters: Natural Habitat Adventures |
When customers select an expedition provider for the types of journeys that we offer, we believe that being known as a trusted brand with extensive operating history and knowledge in the market is a significant competitive strength.
Compelling Expedition Offerings
Lindblad is known for delivering voyages that offer in-depth exploration opportunities in locations around the world. Expeditions are operated on intimately-scaled ships with capacities ranging between 28 and 148 guests, fostering a friendly atmosphere on board and extensive interaction between guests, crew and the teams of world-class scientists, naturalists, researchers and photographers that participate in the expeditions. The vessels are nimble and can access locations that are unattainable for large cruise ships, allowing for in-depth exploration itineraries and viewpoints. The ships are customized to provide our signature adventure experiences and activities, such as kayaking among Antarctic icebergs to view penguins or traveling on a Zodiac for an up-close encounter with a whale.
Natural Habitat offers over 100 different expedition itineraries of primarily land-based nature adventures in more than 45 countries spanning all seven continents. Natural Habitat expeditions focus on small groups led by award-winning naturalists to achieve close-up wildlife and nature experiences. Examples of expeditions offered by Natural Habitat include safaris in Botswana, grizzly bear adventures in Alaska and polar bear tours in Canada. Many of Natural Habitat’s expeditions feature access to private wildlife reserves, remote corners of national parks and distinctive lodges and camps for the best wildlife viewing. Expeditions average nine guests with itineraries running from six to 17 days, with an average of 10 days.
We are continuously focused on maintaining and elevating the guest experience and identifying new opportunities to help people discover the wonders of the world. We believe that our track record of high-quality expedition offerings, along with our history of providing in-depth and highly innovative itineraries, represent significant competitive advantages for us.
Strong Financial Profile
Our business model allows us to generate consistent operating cash flow with high revenue visibility. Our guests plan and book their expeditions on average nine months in advance, with a deposit due upon booking, providing us insight into future revenue and a source of cash flow. Based on our product offerings, we are able to support premium pricing with minimal discounting and benefit from low maintenance expenditure requirements, minimal working capital needs and favorable tax attributes.
We also have a strong cash position, providing us with ample financial flexibility to pursue growth opportunities through investment in new vessels, new charters, tactical land-based products or potential acquisitions of ships or other operators, while still maintaining a prudent capital structure.
Significant Growth Opportunities
We believe affluent travelers view their retirement as “a time to travel and explore new places,” favoring travel experiences such as expedition cruising. This has led to strong growth in the specialty cruise segment and we believe these trends will continue. We have expanded the number of ships in our fleet, with the National Geographic Quest in 2017 and the National Geographic Venture in 2018, and additional chartered vessels. We have two contracted new polar ice-class vessels, the National Geographic Endurance, scheduled to be delivered in the first quarter of 2020, and the National Geographic Resolution, with scheduled delivery in the fourth quarter of 2021. Additionally, we believe that our platform is well positioned to opportunistically seek accretive purchases of operators that lack scale and capital, further extending our growth prospects.
Strategic Alliance with National Geographic
We benefit from a longstanding relationship with National Geographic, one of the world’s leading proponents of eco-tourism and natural history. The strategic alliance, which began in 2004, is built on our shared interest in education, exploration, research, storytelling, technology and conservation. Founded in 1888, the National Geographic Society is one of the largest non-profit scientific and educational institutions in the world with interests ranging from geography, archaeology and natural science, to the promotion of environmental and historical conservation. Working to inspire, illuminate and teach, National Geographic Partners reaches hundreds of millions of people around the world through a wide range of media, including print, TV, digital and social media platforms. The National Geographic name has significant value for use in connection with travel-related goods and services. The Lindblad/National Geographic alliance includes a co-selling and co-marketing arrangement through which National Geographic promotes our offerings in its marketing campaigns across web-based, email, print and other marketing platforms and sells our expeditions through its internal travel division. We believe that the alliance with National Geographic provides us with a substantial competitive advantage in the expedition market based on the brand enhancement, expanded marketing reach and the relationship with National Geographic’s naturalists and photographers.
Through this alliance, we collaborate with National Geographic on exploration, research, technology and conservation in order to provide travel experiences and disseminate geographic knowledge around the globe. The Lindblad/National Geographic alliance is set forth in an Alliance and License Agreement and a Tour Operator Agreement, both which run until December 31, 2025 (that may be terminated early by National Geographic in certain instances). In 2018, this alliance was expanded to include all of the Americas.
Sven-Olof Lindblad, our founder, previously served on the National Geographic Society’s International Council of Advisors, which was composed of individuals identified by the National Geographic Society as visionary leaders from a range of professions and industries across the globe that exemplify the intellectual curiosity and quest for adventure that has driven the National Geographic Society’s mission since 1888. Mr. John M. Fahey, Jr., one of our directors, previously served as the Chairman and Chief Executive Officer of the National Geographic Society.
Partnership with World Wildlife Fund
Natural Habitat has partnered with WWF, since 2003, to promote sustainable conservation travel that directly promotes and protects nature. WWF is one of the world’s leading conservation groups with over six million members globally. Natural Habitat’s exclusive license agreement with WWF allows Natural Habitat to use the WWF name and logo through 2023 in return for a royalty fee.
Industry and Market
We believe the specialty and small ship cruising segment of the cruise industry demonstrates the following positive fundamentals:
Strong Growth in Specialty and Small Ship Cruising Segment
The specialty and small ship cruising segment of the cruise industry is characterized by the smallest vessel size, unique itineraries, active adventures, gourmet culinary programs, highly personalized service and a more inclusive offering. These exclusive attributes, combined with a growing worldwide target population, provide specialty and small ship cruising operators with significant pricing leverage as compared to the other segments of the cruise industry.
The specialty cruise segment has demonstrated strong growth as consumers increasingly prefer experiences over other forms of discretionary spending. The United States Tour Operators Association (“USTOA”) named the three top travel trends projected for growth over the next five years as (i) local immersion, (ii) small group/small ships and (iii) uncharted destinations. In its 2020 Trend and Industry Outlook, Cruise Lines International Association is predicting a 12% passenger growth for 2020 over 2018. Despite consistent growth, we believe the specialty cruise industry still has low penetration levels compared to similar land-based vacations, which we believe highlights the continued growth potential for the specialty cruise market.
Attractive Target Market Demographics
Our offerings appeal to a wide range of travelers, both individuals and families, but affluent individuals in the U.S. aged 50 years or older represent our largest demographic category. We believe that our small ship expedition offerings, with itineraries that promote up-close encounters with wildlife, nature and culture, have significant appeal to this target market. These individuals are also generally near-retirement or retired and have the leisure time and disposable income available to pursue the type of activities that we provide. The U.S. Census Bureau projects that the age group of 50 years and older to grow to approximately 126 million individuals by 2025. According to a USTOA report, approximately 60% of its members’ customer base are aged 51 and older.
High Barriers to Entry
The cruise industry in general, and the adventure travel and specialty cruise industries specifically, are characterized by high barriers to entry, which include the expertise and experience required to operate safely and effectively in remote locations, the existence of several well-established and recognizable brands and the time and personal relationships required to develop strong networks of experts to lead and support expeditions. Additionally, there are large investments required to build new, sophisticated ships, long lead times necessary to construct new ships and limited newbuild shipyard capacity. Operators must also develop strong travel agent network partnerships, as well as acquire local permits of licenses required to operate in a diverse range of geographies.
Competition
We compete with a number of cruise lines with competition varying by destination. The market is currently fragmented and primarily comprised of private operators. The primary competitors that operate in the geographic regions we serve include Silversea Expeditions, Quark Expeditions, Compagnie du Ponant, Hurtigruten and UnCruise Adventures. We expect our competition in the specialty cruise business to increase in future years as established and newer operators in the expedition market are forecasted to launch numerous vessels into the market over the next two years, either as expansion or vessel replacements. In addition, we face increased competition with respect to our itineraries in areas such as Alaska, the Arctic and Antarctica.
For our land-based expeditions, we compete with a variety of companies offering itineraries in the countries in which we operate. These range from small private operators to larger companies operating across multiple countries. Some of our larger competitors include Abercrombie & Kent, Overseas Adventure Travel and GeoEx.
We also compete with other vacation alternatives such as land-based resort hotels and sightseeing destinations for guests’ leisure time.
Business and Growth Strategies
The following are the key components of our business strategy:
Deliver Exceptional Guest Experiences
Our chief governing principle throughout the organization is to ensure that everything adds value to the guest experience. This applies to every step of the process from the first engagement with a potential guest, through the booking process and travel preparations, the actual expedition, whether onboard the vessel or off on explorations, and once back at home.
We believe that our guests do not want to be passive tourists, so our expeditions foster active engagement. Our ships are equipped with tools for exploration to promote and facilitate up-close forays, or to let guests see deeper into the marine or terrestrial environments surrounding them. It is our goal to provide guests with differentiated opportunities with an experienced expedition team that adds to the guests’ understanding and appreciation, through dedicated observation, insightful commentary and engaging presentations, weaving the expedition into a cohesive narrative. This could include an opportunity for the guest to watch a killer whale circling a seal on an ice floe, while standing next to a marine biologist and an experienced nature photographer from National Geographic. This intense focus on seeking to elevate the overall experience and engaging with guests has resulted in highly favorable customer feedback. We believe that by consistently delivering exceptional experiences to our guests, we have built a highly valuable and trusted brand in the expedition cruising and land-based expedition market, which attracts a growing number of discerning and affluent guests who are prepared to pay a premium for our offerings.
High Visibility and Differentiated Revenue Management Strategy
Given the nature of our expeditions and the expectation that our guests will seek to plan such trips with substantial notice, we begin to market our voyages approximately 12 to 24 months in advance of the departure date, depending on the destination. Guests book their trips, on average, nine months prior to sail date, paying a deposit at booking and the final payment 60 to 120 days prior to the date of travel, dependent upon the selected voyage. As of February 18, 2020, 86% of the Lindblad segment’s expected guest ticket revenues for 2020 has been booked.
Unlike the large cruise line operators that serve the broader market, our product offering is inclusive of most costs and therefore the advance customer payments provide us strong visibility into future revenues and the associated cash flows. By having such visibility into future business, we can more effectively manage any additional sales and marketing efforts that may be required to ensure that the programs reach their targeted occupancy levels. We do not believe in primarily driving participation through discounting and do not generally pursue such strategies. Instead, we focus on voyage enhancements that add significant value to the product without significant incremental cost, as well as targeted marketing efforts in order to strengthen occupancy rates, if required. Based on our offerings, the targeted audience and premium pricing, our guests are generally older, more affluent and do not travel with three or four individuals in one cabin. As it is industry convention to base 100% occupancy on two persons per cabin, we may report occupancy levels that are somewhat lower than the large cruise lines serving the broader market. However, we have achieved strong occupancy rates for the Lindblad segment in the last three years (based on two persons per cabin), operating at 91%, 91% and 87% occupancy rate for the years ended December 31, 2019, 2018 and 2017, respectively.
Maximize and Grow Net Yields
We have historically achieved high net yields and continue to see opportunities for growth. Net yield is a frequently referenced metric in the cruise industry and refers to tour revenues net of commissions and certain direct costs in a specific period divided by the number of available guest nights. Our net yields are driven by our offerings, premium pricing and ancillary guest revenue, such as pre- or post-voyage trip extensions, add-on optional activities, trip insurance and onboard spend, including spa services and alcoholic beverages. Our net yields for the Lindblad segment were $1,050, $1,044 and $985 in 2019, 2018 and 2017, respectively. Furthermore, our historical net yield has been significantly higher than the large-scale cruise line operators. We expect to be able to continue our track record of maintaining strong pricing and growing ancillary guest revenues through increased sales focus and marketing efforts.
Elevate Brand Awareness and Loyalty
Our brand is recognizable by our guests primarily due to our heritage, decades of sales and marketing investment and longstanding strategic alliance with National Geographic. We believe we have fostered strong guest and brand loyalty, which is evidenced by our high levels of repeat guests. In 2019, 41% of our guests had been on a previous expedition with us. We have closely aligned our marketing efforts with National Geographic to maximize impact in the marketplace and have engaged in a co-branding strategy with respect to our owned vessels. In addition, we are recognized as a leader in promoting the issue of conservation of the planet and encourage our guests to become engaged through the Lindblad Expeditions – National Geographic Joint Fund for Exploration and Conservation (“LEX-NG Fund”). In the past, we have organized high-level meetings in the Arctic, Antarctic, Galápagos and Baja California to put a spotlight on key environmental issues in conjunction with organizations such as the Aspen Institute, TED and the WWF. These efforts help to build our brand and network of relationships and enhance our thought leadership. We will continue to focus on ensuring that each of our guests associates our brand with high-quality marine based adventure vacation experiences.
We maintain an active presence on numerous social media platforms, focusing primarily on those with the greatest reach to our target demographic. In addition, we routinely feed content to National Geographic’s social media platforms, which extend the reach of our brand significantly.
Disciplined Expansion
We are focused on growing our business in a prudent and disciplined manner. When evaluating various strategies for expansion of guest capacity, we consider closely the expected return on invested capital and the range of possibilities, such as a newbuild program, adding selected charters and the acquisitions of existing ships or operators. We currently have two polar ice-class vessels under construction and scheduled for delivery, the National Geographic Endurance in the first quarter of 2020, and the National Geographic Resolution in the fourth quarter of 2021. We launched two new coastal vessels, the National Geographic Quest in 2017 and the National Geographic Venture in 2018, and increased both our Net Yield and occupancy with the addition of this new inventory. In 2016, we acquired an 80.1% ownership in Natural Habitat. We believe that we have ample capital and financial flexibility to fund investments in new-builds, acquisitions of vessels or travel related businesses and management considers it to be an important step to meet increasing demand for our offerings.
Operations
Sales and Marketing
We place a strong emphasis on identifying the needs of our guests and creating expedition opportunities and products that guests value. We use communication strategies and marketing campaigns designed to strengthen brand awareness and to emphasize the distinctive qualities of each expedition we offer. Marketing strategies include the use of direct marketing, mail and email; digital media, including search, social media and programmatic ad buying; traditional media; brand websites; and travel agencies and other strategic third-party distribution partners.
We source our business through a combination of direct selling, travel agency networks and our strategic alliance with National Geographic. We invest in maintaining strong relationships with our key travel agency network partners and seek to maintain commission rates and incentive structures that are competitive within the marketplace.
Historically, our focus has been to primarily source guests for our expeditions from the United States. Expedition cruise guests sourced from the U.S. represented approximately 91% of our total global expedition cruise guests’ ticket revenue in 2019 and 90% in 2018 and 2017.
Our largest channel for expedition cruise guest bookings is direct contact, either by guests calling and speaking with our expedition specialists or requesting a reservation online at our website. The direct channel represented approximately 40% of expedition cruise guest ticket revenues for 2019 and 2018, and 41% for 2017.
We also generate significant bookings from travel agents and wholesalers, representing approximately 28% for the years ended 2019 and 2018, and 27% for the year ended 2017, for expedition cruises guest ticket revenue. Agent outreach efforts are focused primarily on consortiums, or travel agent networks, which target affluent travelers. The four consortiums with which we have preferred partner agreements are Virtuoso, Signature, American Express and Ensemble. Preferred status provides their agents with financial incentives to book their customers on our expeditions and provides us the opportunity for enhanced marketing to their agents and end-user customers. Our agent and affinity sales team meet with hundreds of highly-targeted agents annually, at consortium conferences and training seminars, and in-person at agency offices to provide hands-on training, support and product knowledge.
The National Geographic relationship also serves as a significant channel for bookings. Our alliance with National Geographic includes a co-selling and co-marketing arrangement through which National Geographic promotes our expedition cruise offerings in its marketing campaigns across web-based, email, print and other marketing platforms and sells our expeditions through its internal travel division. The National Geographic channel represented approximately 24%, 26% and 25% of expedition cruise guest ticket revenues for 2019, 2018 and 2017, respectively. As part of this relationship, our owned vessels carry the National Geographic name.
The remainder of our expedition cruise bookings, 8% of guest ticket revenues for 2019 and 6% for 2018 and 2017, respectively, comes from affinity groups and charters. Affinity groups are predominantly college and university alumni associations, and other travel organizations targeting specific market niches.
We have a broad and diverse marketing mix across multiple media platforms and channels, allowing us to effectively communicate our product offerings to past guests and prospective guests. We continually optimize our media mix to reach our target demographic. The majority of our annual global marketing spend is focused on consumer-direct channels, with direct mail being the largest segment of our marketing expenditures. Our detailed brochures present our expedition offerings comprehensively, providing guests with all the information needed to make an informed travel decision. We execute direct mail campaigns with the primary purpose of generating qualified leads, upon which we will fulfill requests with the appropriate product brochure and/or digital media. We also invest significantly in digital media as part of our guest acquisition efforts with particular focus in paid search, paid social media, and programmatic video and display advertising.
We operate two websites, www.expeditions.com for our Lindblad expedition cruise offerings and www.nathab.com for our Natural Habitat nature adventures. Both websites are supported internally by a dynamic content management system, allowing frequent updates, a visually-impactful design, large photos and video display with simple, straightforward navigation. Consumers are directed to key areas on either www.expeditions.com or www.nathab.com through weekly emails, direct mail, social media, PR, and advertising. We also routinely offer webinars to offer greater insights into our expeditions, hosted by members of the expedition teams with intimate knowledge of the geographies featured. In 2019, our www.nathab.com site was redesigned to provide an enhanced user experience with improved video integration and easier, more intuitive page and trip navigation. In addition, www.expeditions.com will see the launch of a fully redesigned website in the first half of 2020. The redesigned www.expeditions.com website will be designed to fit any device or screen and feature enhanced functionality such as: real-time cabin availability, e-commerce capability, enhanced personalization, enriched design and content to better reflect the expedition experience, and improved organic search.
We maintain an active presence on numerous social media platforms, focusing primarily on those with the greatest reach to our target demographic. In addition, we routinely feed content to National Geographic’s social media platforms, which extend the reach of our brand significantly.
Our marketing team encompasses broad and diverse skill sets including product and channel marketing, digital marketing, database marketing, copywriting and creative, video production and research and analytics.
Expedition Cruise Pricing
Our voyage prices typically include accommodations and all expedition activities and meals, other than items of a personal nature, such as airfare to and from an expedition, spa treatments and certain other specialized events or activities. Prices vary depending on many factors, including the vessel, the destinations on a particular voyage, number of guest berths available, expedition length, cabin category selected and time of year during which the expedition takes place. Payment terms generally require an upfront deposit to confirm a reservation with the balance due prior to departure.
We focus on maintaining list pricing of our offerings and any discounting that we pursue is tactical, targeted and infrequent. In addition to our standard expedition packages, we may be able to offer a complete vessel for charter and may provide incentives for this type of arrangement. Group and multi-generational family travel may also be eligible for additional incentives based upon the voyage, duration and number of guests travelling. From time to time, we may incentivize guests to book with us with a variety of offers, including free or reduced-price air transportation, hotel nights or other value-added items. We offer rewards to our guests through our loyalty program, Friends for Life, to encourage repeat business.
Lindblad Expeditions–National Geographic Joint Fund for Exploration and Conservation (LEX-NG Fund)
We seek to inspire people to explore and care about the planet. One of Lindblad’s governing principles is to positively impact the areas we explore and in which we work. To this end, we, along with the National Geographic Society, created the LEX-NG Fund to support projects at the global, regional and local level. The objective of the LEX-NG Fund is to support projects to understand and protect our world’s oceans, restore critical marine and coastal habitats, and foster environmental stewardship in the regions visited by our fleet, and beyond. Together with our guests, we have raised $12.3 million since the Fund was established in 2008. In addition, 500,000 shares of Lindblad common stock were contributed to the LEX-NG Fund by the founders of Capitol Acquisition Corp. II in connection with the merger with Lindblad Expeditions, Inc., to support the regions that we visit. Since we and the National Geographic Society together cover the LEX-NG Fund’s operating costs, 100% of guest contributions go directly to on-the-ground projects. In 2019, the LEX-NG Fund issued 10 unique grants to nine regional partners in six key regions, while also supporting three major National Geographic Society conservation, education and research initiatives: Pristine Seas, Grosvenor Teacher Fellowship and Early Career Grants. The majority of funds were donated by guests traveling aboard our fleet. The LEX-NG Fund is managed jointly by one of our staff members and one National Geographic Society staff member, and the Board is currently comprised of five members, including Sven-Olof Lindblad, our founder, President and Chief Executive Officer, Glynis Lough, Vice President at the National Geographic Society, and Valerie Craig (Interim Member), Deputy to the Chief Scientist and Senior Vice President, Science & Exploration at the National Geographic Society.
Environmental Stewardship
Our staff is involved in organizations such as the International Association of Antarctic Tour Operators and the Association of Arctic Expedition Cruise Operators, which seek to lead the tourism industry with management best practices for visiting places such as Antarctica, the Arctic and the Galápagos Islands. Our staff also works with several organizations to promote sustainable seafood programs where possible, including (i) the MarViva Foundation (a non-governmental organization focused on promoting the conservation and sustainable use of coastal and marine ecosystems in the eastern tropical Pacific) to provide a consumer market for sustainably caught fish from the first designated responsible fishing area of Costa Rica, (ii) a co-op in the Galápagos Islands committed to ocean conservancy and sustainable, transparent practices minimizing negative impact on the ocean density, ocean floor and the by-catch of non-targeted species, and (iii) a company in Baja California, Mexico that works to foster a market for environmentally sustainable and socially responsible seafood by working with local fisher cooperatives, promoting good fishing management and sustainability of Mexico’s marine ecosystem. We also work with the Charles Darwin Research Station and Charles Darwin Foundation on conservation initiatives geared toward preserving the Galápagos Islands. In 2018, we announced the elimination of single-use plastics fleet-wide, and in 2019 we announced our intention to become a carbon neutral company.
Seasonality
Our Lindblad tour revenues from the sale of guest tickets are mildly seasonal, historically larger in the first and third quarters. The seasonality of our operating results fluctuates due to our vessels being taken out of service for scheduled maintenance or drydocking, which is typically during nonpeak demand periods, in the second and fourth quarters. Our drydock schedules are subject to cost and timing differences from year to year due to the availability of shipyards for certain work, drydock locations based on ship itineraries, operating conditions experienced especially in the polar regions and the applicable regulations of class societies in the maritime industry, which require more extensive reviews periodically. Drydocking impacts operating results by reducing tour revenues and increasing cost of tours. Natural Habitat is a seasonal business, with the majority of its tour revenue recorded in the third and fourth quarters from its summer season departures and polar bear tours.
Suppliers
Our largest capital expenditures are for ship acquisition and capital improvements. Our largest operating expenditures are for ship maintenance, payroll, fuel, food and beverage, travel agent services and advertising and marketing. Most of the supplies that we require are available from numerous sources at competitive prices.
Insurance
We maintain comprehensive insurance coverage at commercially reasonable rates and believe that our current coverage is at appropriate levels to protect against most of the risk involved in the conduct of our business.
We maintain insurance on the hull and machinery of each of our ships that includes additional coverage for disbursements, earnings and increased value. We also maintain protection and indemnity insurance for each of our owned ships. In addition, we maintain war risk insurance on each ship, which covers damage due to acts of war, including invasion, insurrection, terrorism, rebellion, piracy and hijacking. This coverage includes coverage for physical damage to the ship, which is not covered under the hull policies as a result of war exclusion clauses in such hull policies. We also maintain protection and indemnity war risk coverage. Consistent with most marine war risk policies, under the terms of the war risk insurance coverage, underwriters can give notice that the policy will be canceled and reinstated at higher premium rates. We also maintain insurance coverage for shoreside property, shipboard inventory and marine and non-marine general liability risks, as well as business interruption insurance for our owned ships based on the evaluation of the financial exposure per vessel for profitability. In addition, we maintain workers’ compensation, directors’ and officers’ liability and other insurance coverage.
We historically have been able to obtain insurance coverage in amounts and at premiums we have deemed to be commercially acceptable. No assurance can be given that affordable and secure insurance markets will be available in the future, particularly for war risk insurance. All of our insurance coverage is subject to certain limitations, exclusions and deductible levels.
Regulation
Our ships are regulated by various international, national, state and local laws, regulations and treaties in force in the jurisdictions in which they operate. Our owned ships are registered in the U.S., the Bahamas or Ecuador, as applicable. These countries are signatories to the International Maritime Organization (IMO) safety, security and environmental instruments and policy. Each ship is subject to regulations issued by its country of registry, including regulations issued pursuant to international treaties governing the safety of the ships, guests and crew as well as environmental protection. Each country of registry conducts periodic inspections to verify compliance with these regulations. Ships operating out of U.S. ports are subject to inspection by the U.S. Coast Guard for compliance with international treaties and by the United States Public Health Service for sanitary and health conditions. Ships are also subject to similar inspections pursuant to the laws and regulations of various other countries visited. Health, safety, security, environmental and financial responsibility issues are, and will continue to be, an area of focus by the relevant government authorities in the U.S. and internationally. From time to time, various regulatory and legislative changes may be proposed that could impact operations and subject us to increasing compliance costs in the future.
Safety and Security Regulations
Our ships are required to comply with international safety standards established by SOLAS, which, among other things, establishes requirements for ship design, structural features, materials, construction, life-saving equipment and safe management, and operation of ships to ensure guest and crew safety. The SOLAS standards are revised from time to time and our vessels are compliant with applicable SOLAS requirements. SOLAS incorporates the International Safety Management Code (“ISM Code”), which provides an international standard for the safe management and operation of ships and for pollution prevention. The ISM Code is mandatory for all vessels, including passenger vessel operators. All of our operations and ships are regularly audited by various national authorities and maintain the required certificates of compliance with the ISM Code.
Our ships are also subject to various security requirements, including the International Ship and Port Facility Security Code (“ISPS Code”), which is part of SOLAS, and the U.S. Maritime Transportation Security Act of 2002 (“MTSA”), which applies to ships that operate in U.S. ports. In order to satisfy these security requirements, we implement security measures, conduct vessel security assessments and develop security plans. The security plans for all of the ships have been submitted to, and approved by, the respective countries of registry for compliance with the ISPS Code and the MTSA.
Environmental Regulations
We are subject to various U.S. and international laws and regulations relating to environmental protection. Under such laws and regulations, we are prohibited from, among other things, discharging certain materials, such as petrochemicals and plastics, into the waterways. From time to time, environmental and other regulators may consider more stringent regulations, which may affect our operations and increase compliance costs.
The ships are subject to the International Maritime Organization’s regulations under the International Convention for the Prevention of Pollution from Ships (the “MARPOL Regulations”), which includes requirements designed to minimize pollution by oil, sewage, garbage and air emissions. We have obtained the relevant international compliance certificates relating to oil, sewage and air pollution prevention for all of our ships.
The MARPOL Regulations impose global limitations on the sulfur content of fuel used by ships operating worldwide and also establish special Emission Control Areas (“ECAs”) with stringent limitations on sulfur and nitrogen oxide emissions in these areas. As of February 2014, there were four established ECAs: the Baltic Sea, the North Sea/English Channel, certain of the waters surrounding the North American coast, and the waters surrounding Puerto Rico and the U.S. Virgin Islands. Currently, ships operating in ECAs are required to operate on fuel with a sulfur content of not more than 0.1% m/m (mass by mass). Ships operating elsewhere were previously subject to a limit of 3.5%, which was reduced to not more than 0.5% m/m on and after January 1, 2020.
In July 2011, MARPOL Regulations introduced mandatory measures to reduce greenhouse gas emissions. These include the utilization of an energy efficiency design index (“EEDI”) for new ships as well as the establishment of an energy efficient management plan for all ships. The EEDI is a performance-based mechanism that requires a certain minimum energy efficiency in new ships. These regulations apply to new vessels commissioned after January 1, 2013. In June 2013, the European Commission proposed legislation that would require cruise ship operators using ports in the European Union to monitor and report on the vessels’ annual carbon dioxide emissions starting in 2018.
The Coastwise Laws
Our U.S. flagged vessels are subject to the U.S. laws relating to the transport of passengers or cargo between U.S. ports in the U.S. coastwise trade.
These laws relating to vessels are principally contained in 46 U.S.C. §55103 and the federal regulations promulgated thereunder and are commonly referred to collectively as the “Coastwise Laws.” Subject to limited exceptions, vessels transporting passengers between ports of places in the United States, whether directly or by the way of foreign port, must be “Coastwise qualified”. To be qualified, a vessel must be owned and operated by “citizens of the United States” within the meaning of the governing laws and regulations. In the case of a corporation to be deemed a U.S. citizen: (i) the corporation must be organized under the laws of the U.S. or of a state, territory or possession thereof; (ii) each of the chief executive officer and the chairman of the board of directors of such corporation, and each person authorized to act in the absence or disability of such persons, must be a U.S. citizen; (iii) no more than a minority of the number of directors of such corporation necessary to constitute a quorum for the transaction of business can be non-U.S. citizens; and (iv) at least 75% of each class or series of stock in such corporation must be beneficially owned by U.S. citizens.
Labor Regulations
The International Labour Organization, an agency of the United Nations that develops worldwide employment standards, adopted a Consolidated Maritime Labour Convention (the “Convention”) in 2006, which became effective in August 2013. The Convention reflects a broad range of standards and conditions governing all aspects of crew management for ships in international commerce, including additional requirements not previously in effect relating to the health, safety, repatriation, entitlements and status of crewmembers and crew recruitment practices. Each of our ships, except for our two ships operating in Ecuador (not a signatory to the Convention), has received its certification of compliance with the requirements of the Convention.
Consumer Financial Responsibility Regulations
U.S. law requires the operators of passenger vessels embarking passengers at U.S. ports to be certified by the United States Federal Maritime Commission as to their ability to satisfy obligations with respect to unearned passenger revenue in case of non-performance, and for liability in case of casualty or personal injury. We satisfy these requirements with respect to our U.S. embarking expeditions through an escrow account for passenger deposits and through our liability insurers.
Certain jurisdictions require that we establish financial responsibility to our guests resulting from the non-performance of our obligations; however, the related amounts do not have a material effect on our costs.
Regulations Regarding Protection of Disabled Persons
Our U.S. flag vessels are subject to the Americans with Disabilities Act (ADA), which creates affirmative requirements intended to facilitate access by disabled persons. The ADA requires that our U.S. flagged vessels make “reasonable accommodation” in their policies, practices and procedures to facilitate the carriage of passengers with disabilities.
In June 2013, the U.S. Architectural and Transportation Barriers Compliance Board proposed guidelines for the construction and alteration of passenger vessels to ensure that the vessels are readily accessible to and usable by passengers with disabilities. If and when finalized, these guidelines will be used by the U.S. Department of Transportation and U.S. Department of Justice to implement mandatory and enforceable standards for passenger vessels covered by the Americans with Disabilities Act. We cannot, at this time, accurately predict whether we will be required to make material modifications or incur significant additional expenses given the status of the proposed guidelines.
Employees
As of December 31, 2019, we had approximately 650 employees, including approximately 350 shipboard employees, and approximately 290 full-time and ten part-time employees in our shoreside operations.
Corporate Information and History
We were originally incorporated in Delaware on August 9, 2010 with the name Capitol Acquisition Corp. II as a blank check company to acquire, through a merger, share exchange, asset acquisition, stock purchase, plan of arrangement, recapitalization, reorganization or other similar business combination, one or more businesses or entities.
On July 8, 2015, we completed a series of mergers whereby Lindblad Expeditions, Inc., a New York corporation originally incorporated in July 1979, became our wholly-owned subsidiary. Immediately following the mergers, we changed our name to Lindblad Expeditions Holdings, Inc.
In 2016, we acquired Natural Habitat, based in Louisville, Colorado, to expand our expedition offerings with land-based adventure travel expeditions.
Our corporate headquarters are located at 96 Morton Street, 9th Floor, New York, New York 10014. Our telephone number is (212) 261-9000. Our website is www.expeditions.com. All of our filings with the Securities and Exchange Commission, can be accessed free of charge through our website promptly after filing; however, in the event the website is inaccessible, we will provide paper copies of our most recent Annual Report on Form 10-K, the most recent Quarterly Report on Form 10-Q, current reports filed or furnished on Form 8-K, and all related amendments excluding exhibits, free of charge, upon request. These filings are also accessible on the Securities and Exchange Commission's website at www.sec.gov. We do not intend for information contained on our website to be a part of this Annual Report on Form 10-K and such information is not incorporated by reference herein.
|
Item 1A. |
You should carefully consider the risk factors set forth below and the other information in this Annual Report on Form 10-K. The matters discussed in the risk factors, and additional risks and uncertainties not currently known to us or that we currently deem immaterial, could have a material adverse effect on our business, financial condition, results of operation and future growth prospects.
Risks Related to Our Business and Operations
Adverse worldwide economic, geopolitical or other conditions could reduce the demand for expedition travel and adversely impact our operating results, cash flows and financial condition.
The demand for travel experiences, including expedition cruises and land-based travel, may be adversely affected by international, national and local economic and geopolitical conditions. In particular, a deterioration in global economic conditions that adversely affects discretionary income and consumer confidence may, in turn, result in decreased bookings, prices and onboard revenues for the expedition and cruise industries. Uncertain economic conditions also impact consumer confidence and pose a risk as vacationers may postpone or reduce discretionary spending. Demand for our expeditions may also be influenced by geopolitical events. Unfavorable conditions, such as cross-border conflicts, civil unrest and governmental changes, can decrease consumer demand and result in reduced pricing for expeditions in areas affected by such conditions.
Incidents or adverse publicity concerning the cruise industry, the expedition travel industry or the travel industry in general, terrorist attacks, war, travel restrictions or other disruptions could affect our reputation as well as have a negative impact on our sales and results of operations.
The operation and/or use of cruise ships, land tours, port facilities and shore excursions involves the risk of accidents, illnesses, mechanical failures, environmental incidents including oil spills, and other incidents. Such incidents, whether on one of our expeditions or not, may cause guests and potential guests to question their safety, health, security and vacation satisfaction, and could negatively impact our reputation. Incidents involving cruise ships, particularly the safety and security of guests and crew, media coverage thereof, as well as adverse media publicity in general concerning the cruise industry, have previously impacted and could in the future impact demand for our expeditions and pricing in the industry. The considerable expansion in the use of social media over recent years has compounded the potential scope of the negative publicity that could be generated by those incidents. If any such incident occurs during a time of high seasonal demand, the effect could disproportionately impact our results of operations for the year. In addition, incidents involving cruise ships may result in additional costs to our business, including costs related to increasing government or other regulatory oversight. Incidents involving our own fleet may result in litigation.
Events such as terrorist and pirate attacks, war and other hostilities and the resulting political instability, travel restrictions, such as travel bans to and from certain geographical areas and heightened regulations around customs and border control, the spread of contagious diseases, such as the COVID-19 Coronavirus, and other related concerns over the safety, health and security aspects of traveling, or the fear of any of the foregoing, have had, and could have in the future, a significant adverse impact on demand and pricing in the travel and vacation industry. In view of our global operations, we are susceptible to a wide range of adverse events, which could decrease demand and adversely affect our business. In addition, adverse publicity from incidents at sea or in remote locations, even when not involving any of our ships or travel offerings, may discourage prospective travelers from taking an expedition-style trip.
Our business may be negatively affected by severe or unusual weather conditions, including climate change.
Our fleet and the port facilities we use may also be adversely impacted by weather patterns or natural disasters or disruptions, such as hurricanes, earthquakes and changes in ice floes. From time to time, we may be forced to alter itineraries or cancel expeditions due to these or other factors, which could negatively impact our sales and profitability. Additionally, substantial changes to historical weather patterns, whether caused by climate change or other factors, including changing temperature levels, changing rainfall patterns and changing storm patterns and intensities, could significantly impact our future business. Substantial changes to historical weather patterns could result in significant negative changes to the delicate regions that our expeditions venture, such as rising temperatures in the Arctic region that could accelerate the melting of the polar ice cap or changes to the historical weather patterns in delicate areas such as the Galapagos that impacts its ecosystem.
In addition, these and any other events that impact the travel industry more generally may negatively impact our ability to deliver guests or crew to our expeditions and/or interrupt our ability to obtain services and goods from key vendors in our supply chain. Any of the foregoing could have an adverse impact on our results of operations and on industry performance.
Ship repair, revitalization delays or mechanical issues on existing vessels may result in cancellation of expeditions or unscheduled drydockings and repairs and thus adversely affect our results of operations.
We depend on shipyards to repair, maintain and revitalize our ships on a timely basis and to ensure they remain in good working order. The sophisticated nature of repairing and revitalizing a ship involves risks, and shipyards may encounter financial, technical or design problems when doing these jobs. Delays in ship repair, revitalization or mechanical failures have in the past and may in the future result in delays or cancellations of expeditions and unscheduled drydocks and repairs of ships. If there is a significant accident, mechanical failure or similar problem involving a ship, we may have to place a ship in drydock for an extended period for repairs. Any such delays, cancellations of expeditions and/or unscheduled drydockings could have a material adverse effect on our business, results of operations and financial condition. These events and any related adverse publicity could result in lost revenue, increased operating expenses, or both, and thus adversely affect our results of operations.
Delays or cost overruns in building new vessels, including the failure to deliver new vessels, or the financial difficulties of the shipyard building a vessel could have negative impact on us.
We are currently in the process of building two new polar ice-class vessels. Building new vessels is subject to risks of delay or cost overruns caused by conditions beyond our control including, but not limited to, one or more of the following:
|
|
● |
unforeseen engineering or construction problems; |
|
|
|
|
|
|
● |
changes to design specifications; |
|
|
|
|
|
|
● |
delays or unanticipated shortages with respect to necessary materials, equipment or skilled labor; |
|
|
|
|
|
|
● |
inability to obtain the requisite permits, approvals or certifications from governmental authorities and the applicable classification society upon completion of work; |
|
|
|
|
|
|
● |
financial difficulties of the shipyard building a vessel, including bankruptcy; |
|
|
|
|
|
|
● |
lack of shipyard availability; |
|
|
|
|
|
|
● |
work stoppages; and |
|
|
|
|
|
|
● |
weather interference. |
Significant delays, cost overruns and failure to timely deliver new vessels we have committed to service our guests could adversely affect us in several ways, including delaying the implementation of our business strategies, materially increasing our cost of servicing our commitments to our guests or resulting in the cancellation of scheduled expeditions, which have occurred in the past. In addition, there are a limited number of shipyards with the capability and capacity to build our new ships and, accordingly, increased demand for available new construction slots could impact our ability to construct new ships when and as planned and/or result in stronger bargaining power on the part of the shipyards. We are also at risk of a shipyard experiencing financial difficulty during the process of a new-build, which would subject us to the risk of a shipyard ceasing operations or filing for bankruptcy before delivering a vessel to us, which could substantially delay any new-build and could have a material adverse impact on our business.
We must make substantial capital expenditures to maintain and/or expand our fleet and we may not be able to obtain sufficient financing or capital on favorable terms or at all.
We must make substantial capital expenditures to maintain our fleet in good working order. Maintenance capital expenditures include those associated with dry docking a vessel, modifying an existing vessel or acquiring a new vessel. These expenditures could increase as a result of changes in the cost of labor and materials; customer requirements; increases in our fleet size or the cost of replacement vessels; governmental regulations and maritime self-regulatory organization standards relating to safety, security or the environment; and competitive standards. In addition, maintenance capital expenditures will vary from quarter to quarter based on the number of vessels dry docked during that quarter. Significant unexpected maintenance capital expenditures could have an adverse impact on our operations.
We also continue to make substantial capital expenditures to increase the size of our fleet by constructing new vessels and may acquire existing vessels from other parties in the future. Shipyards generally require us to make installment payments on any new ship build prior to delivery, which requires us to obtain financing or expend a significant amount of our own money to build a new vessel without any corresponding revenue for an extended period of time. In addition, we may not receive the expected demand for our newly constructed or acquired vessels, which could have an adverse impact on our operations.
Although we believe we can access sufficient liquidity to fund our maintenance, investments, including new ship construction, and obligations as expected, there can be no assurances to that effect. Our ability to access additional funding as and when needed, including for new ship builds, our ability to timely refinance and/or replace our outstanding debt and credit facilities on acceptable terms or at all will depend upon numerous factors, many of which are beyond our control. Our inability to access sufficient liquidity on favorable terms when needed would have a negative impact on our ability to expand our fleet, our results of operations and our financial condition.
Failure to maintain our partnership with National Geographic could adversely affect our results of operations.
We have an on-going partnership with National Geographic and any termination or alterations to this relationship will likely have an adverse effect on our business. Pursuant to such agreements, our owned vessels contain the phrase “National Geographic” in their names, we have access to certain of National Geographic’s marks and images for advertising purposes and we and our guests have access to National Geographic photographers, naturalists and other experts. National Geographic has the right in certain instances to unilaterally terminate the Alliance and License Agreement with us, including:
|
● |
|
in the event of a change of control in which Sven-Olof Lindblad or his designated successor ceases to hold a senior management role with the company; |
|
|
|
|
|
● |
|
our failure to achieve specified year-over-year percentage revenue growth requirements; or |
|
|
|
|
|
● |
|
a failure to meet the conditions necessary to maintain the relationship through 2025. |
If any of our agreements with National Geographic are terminated or modified in any material respect, due to any of the reasons set forth above or otherwise, our results of operations will likely be materially adversely affected due to loss of name recognition associated with the National Geographic brand as well as a loss of sales generated through National Geographic channels.
An increase in capacity worldwide or excess capacity in a particular market could adversely impact our expedition sales and/or pricing.
Expedition sales and/or pricing may be impacted both by the introduction of new ships into the marketplace and by deployment decisions of us and our competitors. Many new expedition class ships have been ordered or are already under construction for our competitors. The growth in capacity from these new ships and future orders, without an increase in the cruise industry’s share of the vacation market, could depress expedition prices and impede our ability to maintain high yields. In addition, to the extent that we or our competitors deploy ships to a particular itinerary and the resulting capacity in that region exceeds the demand, we may consider pricing adjustments or redeploy to other regions, either of which may result in lower than anticipated profitability. We expect our competition in the specialty cruise business to increase in future years as established and newer operators in the expedition market are forecasted to launch numerous vessels into the market over the next two years, either as expansion or vessel replacements. Any of the foregoing could have an adverse impact on our results of operations, cash flows and financial condition.
We may lose business to competitors throughout the vacation market.
We operate in the vacation market, and expedition cruising is one of many alternatives for people choosing a vacation. We therefore risk losing business not only to other cruise lines, but also to other vacation operators who provide other leisure options, including hotels, resorts and package holidays and tours.
We face significant competition from other vacation operators and cruise companies on the basis of pricing, destination, travel agent preference and also in terms of the nature of ships and services we offer to guests. Our competition within the expedition and cruise vacation industries depends on the destination and is fragmented and primarily comprised of private operators. Currently, we do not directly compete with large cruise vessels. However, in the event large cruise operators further expand into offering smaller sized vessels to compete directly with us and our itineraries, we would have increased competition and could face pricing pressures by such competitors through discounts or otherwise that would likely negatively impact our profitability.
In the event that we do not differentiate our offerings or otherwise do not compete effectively with other vacation operators and cruise companies, our results of operations and financial position could be adversely affected.
Unavailability of ports of call may adversely affect our results of operations.
The availability of ports and destinations is affected by a number of factors, including existing capacity constraints, constraints related to the size of certain ships, security, environmental and health concerns, adverse weather conditions and natural disasters, financial limitations on port development, exclusivity arrangements that ports may have, geopolitical developments, local governmental regulations and local community concerns about port development and other adverse impacts on their communities from additional tourists and overcrowding. In addition, fuel costs may adversely impact the destinations on certain of our itineraries.
Today certain ports and destinations are facing a surge of both cruise and non-cruise tourism which, in certain cases, has fueled anti-tourism sentiments and related countermeasures to limit the volume of tourists allowed in these destinations, including proposed limits on cruise ships and cruise passengers.
Any limitations on the availability or feasibility of our ports of call could adversely affect our results of operations.
Conducting business globally may result in increased costs and other risks.
We operate our business globally and plan to continue to expand our international presence. Operating internationally exposes us to a number of risks, including unstable local economic conditions, volatile local political conditions, potential changes in duties and taxes, including changing interpretations of existing tax laws and regulations, potential changes in local laws, rules and regulations, required compliance with additional laws and policies affecting cruising, vacation or maritime businesses or governing the operations of foreign-based companies, currency fluctuations, interest rate movements, government controlled fuel prices, difficulties in operating under local business environments, U.S. and global anti-bribery laws and regulations, imposition of trade barriers, and restrictions on repatriation of earnings. If we are unable to address these risks adequately, our financial position and results of operations could be adversely affected, including potentially impairing the value of our ships, goodwill and other assets.
Operating globally also exposes us to numerous and sometimes conflicting legal and regulatory requirements. In many parts of the world, including countries in which we operate, practices in the local business communities might not conform to international business standards. We must adhere to policies designed to promote legal and regulatory compliance with applicable laws and regulations. However, we might not be successful in ensuring that our employees, agents, representatives and other third parties with whom we associate throughout the world properly adhere to these laws and regulations.
Failure by us, our employees or any of these third parties to adhere to our policies or applicable laws or regulations could result in penalties, sanctions, damage to our reputation and related costs which in turn could negatively affect our results of operations and cash flows.
Our efforts to expand our business into new markets or complete acquisitions may not be successful.
Expansion into new markets requires significant levels of investment. There can be no assurance that any new markets will develop as anticipated or that we will have success in any new markets, and if we do not, we may be unable to recover our investment, which could adversely impact our business, financial condition and results of operations, including potentially impairing the value of our goodwill.
We may also pursue acquisitions in the future, which are subject to, among other factors, our ability to identify attractive business opportunities and to negotiate favorable terms for such opportunities. Accordingly, we cannot make any assurances that potential acquisitions will be completed timely or at all, or that if completed, we would realize the anticipated benefits of such acquisition. Acquisitions also carry inherent risks such as, among others: (i) the potential delay or failure of our efforts to successfully integrate business processes and realizing expected synergies; (ii) difficulty in aligning procedures, controls and/or policies; and (iii) future unknown liabilities and costs that may be associated with an acquisition. In addition, acquisitions may also adversely impact our liquidity and/or debt levels, and the recognized value of goodwill and other intangible assets can be negatively affected by unforeseen events and/or circumstances, which may result in an impairment charge. Any of the foregoing events could adversely impact our financial condition and results of operations.
If our redeployment of vessels to a new market with new itineraries is not successful, our business and operating results may be adversely affected.
We cannot predict whether new expeditions and new itineraries that we may offer in connection with the redeployment of any of our vessels will attract a number of guests comparable to previous expeditions. If redeployments and new expeditions do not attract as many guests as past expeditions or if there is a delay in finalizing or marketing the new itineraries, our business and operating results may be adversely affected.
Failure to develop the value of our brand and differentiate our products could adversely affect our results of operations.
Our success depends on the strength and continued development of our expedition brand and on the effectiveness of our brand strategies. Failure to protect and differentiate our brand from competitors throughout the vacation market could adversely affect our results of operations.
We have a relationship with World Wildlife Fund (“WWF”) and the termination or alterations in this relationship may have an adverse effect on our Natural Habitat business.
WWF is a leading conservation organization whose mission is to conserve nature and reduce the most pressing threats to the diversity of life on Earth. Natural Habitat partners with WWF to offer conservation travel through a license agreement that allows Natural Habitat to use the WWF name and logo in return for a royalty fee, through 2023.
If Natural Habitat’s license agreement with World Wildlife Fund was terminated or modified in any material respect, our results of operations for the Natural Habitat segment may be materially adversely affected.
We may not be able to obtain sufficient financing or capital for our needs or may not be able to do so on terms that are acceptable or consistent with our expectations.
Any circumstance or event that leads to a decrease in consumer cruise and land-based travel spending, such as worsening global economic conditions or significant incidents impacting the cruise industry, the expedition cruise industry or the travel industry, could negatively affect our operating cash flows. Although we believe that we have sufficient cash flows from operations and will have sufficient access to capital to fund our operations and obligations as expected, there can be no assurances to that effect. Our ability to access additional funding as and when needed, our ability to timely refinance and/or replace outstanding debt and credit facilities on acceptable terms and our cost of funding will depend upon numerous factors including but not limited to the condition of the financial markets, our financial performance and credit ratings and the performance of our industry in general.
Any inability to satisfy any covenants required by existing or future credit facilities could adversely impact our liquidity.
Our Third Amended and Restated Credit Agreement (“Amended Credit Agreement”) and our senior secured credit agreements (the “Export Credit Agreement” and the “Second Export Credit Agreement”) contain certain financial covenants and are secured by substantially all of our assets. Any failure to comply with such terms, conditions, and covenants could result in an event of default. Further, if an event of default under a facility were to occur, cross default provisions, if any, could cause our other outstanding debt, if any, to be immediately due and payable. Upon such an occurrence, there could be no assurance that we would have sufficient liquidity to repay or the ability to refinance the borrowings under any such credit facilities or settle other outstanding contracts if such amounts were accelerated upon an event of default.
Environmental, labor, health and safety, financial responsibility and other maritime regulations could affect operations and increase operating costs.
Due to concern over the risk of climate change or otherwise, the United States and various state and foreign government or regulatory agencies have enacted or are considering new environmental regulations or policies, such as requiring the use of low sulfur fuels, increasing fuel efficiency requirements, further restricting emissions, or other initiatives to limit greenhouse gas emissions compliance with changes in such laws, regulations and obligations could increase costs related to operating and maintaining our vessels and require us to install new emission controls, acquire allowances or pay taxes related to our greenhouse gas emissions, or administer and manage a greenhouse gas emissions program. Revenue generation and strategic growth opportunities could also be adversely affected by compliance with such changes.
In addition, we are subject to various international, national, state and local laws, regulations and treaties that govern, among other things, safety standards applicable to our ships, treatment of disabled persons, health and sanitary standards applicable to our guests, security standards on board our ships and at the ship/port interface areas, and financial responsibilities to our guests. These issues are, and we believe will continue to be, an area of focus by the relevant authorities throughout the world. This could result in the enactment of more stringent regulation of cruise ships that could subject us to increasing compliance costs in the future.
Our operating costs could increase due to market forces and economic or geopolitical factors beyond our control.
Our capital expenditure and operating costs, including food, hotel, payroll, fuel, maintenance and repair, airfare, taxes, insurance and security costs, are subject to increases due to market forces and economic or political conditions or other factors beyond our control. If prices rise significantly in a short period of time, we may be unable to sufficiently increase fares or other fees to fully offset our increased costs. Increases in capital expenditures and operating costs could adversely affect our profitability.
Price increases for commercial airline service for our guests or major changes or reductions in commercial airline service and/or availability could increase our operating expenses and adversely impact the demand for expedition travel.
Most of our guests depend on scheduled commercial airline services to transport them to or from the ports where our expeditions embark or disembark passengers. Increases in the price of airfare would increase the overall price of the expedition vacation to our guests, which may adversely impact demand for our expeditions. In addition, changes in the availability of commercial airline services could adversely affect our guests’ ability to obtain air transport, which could adversely affect our results of operations.
Our reliance on travel agencies to sell and market our cruises exposes us to certain risks that, if realized, could adversely impact our business.
Because we rely on travel agencies to generate a substantial portion of the bookings for our ships, we must ensure that our commission rates and incentive structures remain competitive. If we fail to offer competitive compensation packages, these agencies may be incentivized to sell vacation packages offered by our competitors to our detriment, which could adversely impact our operating results. In addition, the travel agent industry is sensitive to economic conditions that impact discretionary income. Significant disruptions or contractions in the industry could reduce the number of travel agencies available for us to market and sell our expeditions, which could have an adverse impact on our financial condition and results of operations.
Disruptions in our shoreside operations or our information systems may adversely affect our results of operations.
Our principal executive offices are located in New York, New York, and our principal shoreside operations are located in Seattle, Washington. Actual or threatened natural disasters (e.g., hurricanes, earthquakes, tornadoes, fires, and floods), terrorist attacks, or other similar disruptive events in these locations may have a material impact on our business continuity, reputation and results of operations. In addition, substantial or repeated information systems failures, computer viruses or cyber-attacks impacting our shoreside or shipboard operations could adversely impact our business. We do not generally carry business interruption insurance for our shoreside operations or our information systems. As such, any losses or damages incurred by us could have an adverse impact on our results of operations.
Fluctuations in foreign currency exchange rates could affect our financial results.
We pay expenses, recognize assets and incur liabilities in currencies other than the U.S. dollar. Because our consolidated financial statements are presented in U.S. dollars, we must convert expenses and liabilities into U.S. dollars at exchange rates in effect during or at the end of each reporting period. Therefore, absent offsetting changes in other foreign currencies, increases or decreases in the value of the U.S. dollar against other major currencies will affect our net income and the value of balance sheet items denominated in foreign currencies. We use limited financial instruments, such as foreign currency forward contracts and swaps, to mitigate our net balance sheet exposure to currency exchange rate fluctuations. However, there can be no assurances that fluctuations in foreign currency exchange rates, particularly the strengthening of the U.S. dollar against major currencies, would not materially affect our financial results.
In addition, we have ship maintenance contracts and ship construction contracts that are denominated in currencies other than the U.S. dollar. We have entered into, and may enter into in the future, forward contracts and/or options to manage a portion of the currency risk associated with these contracts, and we are or may be exposed to fluctuations in the exchange rates for the portions of the contracts that have not been hedged. Additionally, if a shipyard is unable to perform under such a contract, any foreign currency forward contracts that were entered into to manage the currency risk would need to be terminated. Termination of these contracts could result in a significant loss.
The interest rates on our credit facilities might change based on changes to the method in which the London Interbank Offered Rate (“LIBOR”) or its replacement rate is determined.
LIBOR is the basic rate of interest used in lending transactions between banks on the London interbank market, and is widely used as a reference for setting the interest rate on loans globally. Our Amended Credit Agreement, our Export Credit Agreement and our Second Export Credit Agreement each contain variable interest rates referenced to LIBOR.
On July 27, 2017, the United Kingdom’s Financial Conduct Authority, which regulates LIBOR, announced that it intends to phase out LIBOR by the end of 2021. The Alternative Reference Rates Committee, a steering committee comprised of large U.S. financial institutions, has proposed replacing USD-LIBOR with a new index calculated by short term repurchase agreements - the Secured Overnight Financing Rate. At this time, no consensus exists as to what rate or rates may become accepted alternatives to LIBOR, and it is impossible to predict whether and to what extent banks will continue to provide LIBOR submissions to the administrator of LIBOR, whether LIBOR rates will cease to be published or supported before or after 2021 or whether any additional reforms to LIBOR may be enacted in the United Kingdom or elsewhere.
The consequences of these developments cannot be entirely predicted, but may result in an increase to our overall borrowing costs and interest expense, which could adversely affect our profitability.
The loss of key personnel, our inability to recruit or retain qualified personnel, or disruptions among our shipboard personnel due to strained employee relations could adversely affect our results of operations.
Our success depends, in large part, on the reputation, skills and contributions of key executives, including Sven-Olof Lindblad, in particular, and other employees, and on our ability to recruit and retain high quality personnel. Our management team is comprised of individuals with a diverse knowledge base and skill sets acquired through extensive experience in expedition cruising, adventure travel, and hospitality. We must continue to sufficiently recruit, retain, train and motivate our employees to maintain our current business and support our projected growth. A loss of key executives or other key employees or disruptions among our personnel could adversely affect our results of operations.
We rely on third-party providers of various services integral to the operation of our businesses. These third parties may act in ways that could harm our business.
In order to achieve cost and operational efficiencies, we outsource to third-party vendors certain services that are integral to the operations of our global businesses. We are subject to the risk that certain decisions are subject to the control of third-party service providers and that these decisions may adversely affect our activities. A failure to adequately monitor a third-party service provider’s compliance with a service level agreement or regulatory or legal requirements could result in significant economic and reputational harm to us.
There is also a risk that the confidentiality, privacy and/or security of data held by third parties or communicated over third-party networks or platforms could become compromised. Such a breach could adversely affect our reputation and in turn adversely affect our business.
A failure to keep pace with developments in technology or technological obsolescence could impair our operations or competitive position.
Our business continues to demand the use of sophisticated technology and systems, such as reservations and reporting systems. These technologies and systems must be refined, updated and/or replaced with more advanced systems in order to continue to meet our guests’ demands and expectations. If we are unable to do so in a timely manner or within reasonable cost parameters or if we are unable to appropriately and timely train our employees to operate any of these new systems, our business could suffer. We also may not achieve the benefits that we anticipate from any new technology or system, and a failure to do so could result in higher than anticipated costs or could impair our operating results.
Our failure to properly and efficiently design, construct, implement and operate our new reservations and customer relationship management (“CRM”) computer systems could materially disrupt our operations, adversely impact the servicing of our customers and have a material adverse effect on our financial performance.
We are implementing new reservations and CRM systems to modernize and improve current capabilities. The new systems are intended to combine enterprise resource planning solutions and custom-built applications to address, among other areas, account management, billing and customer service. The new systems also intend to improve functionality and information flow and increase automation in servicing our customers.
The failure to properly, efficiently and economically complete transition to and operate the new systems on a timely basis, or at all, could materially disrupt our operations, adversely impact the servicing of our customers and have a material adverse effect on our financial results.
Failure to comply with data privacy and security laws and regulations could adversely affect our operating results and business.
A number of U.S. states have enacted data privacy and security laws and regulations that govern the collection, use, disclosure, transfer, storage, disposal, and protection of sensitive personal information, such as social security numbers, financial information and other personal information. For example, several U.S. territories and all 50 states now have data breach laws that require timely notification to individual victims, and at times regulators, if a company has experienced the unauthorized access or acquisition of sensitive personal data. Other state laws include the California Consumer Privacy Act (“CCPA”), which contains new disclosure obligations for businesses that collect personal information about California residents and affords those individuals new rights relating to their personal information that may affect our ability to use personal information or share it with our business partners. In addition, numerous other states have also considered privacy laws like the CCPA. We will continue to monitor and assess the impact of these state laws, which may impose substantial penalties for violations, impose significant costs for investigations and compliance, allow private class-action litigation and carry significant potential liability for our business.
Outside of the U.S., data protection laws, including the EU General Data Protection Regulation (the “GDPR”), also apply to some of our operations. Legal requirements in these countries relating to the collection, storage, processing and transfer of personal data continue to evolve. The GDPR imposes, among other things, data protection requirements that include strict obligations and restrictions on the ability to collect, analyze and transfer EU personal data, a requirement for prompt notice of data breaches to effected subjects and supervisory authorities in certain circumstances, and possible substantial fines for any violations (including possible fines for certain violations). Other governmental authorities around the world are considering similar types of legislative and regulatory proposals concerning data protection.
The interpretation and enforcement of the laws and regulations described above are uncertain and subject to change, and may require substantial costs to monitor and implement compliance with any additional requirements. Failure to comply with U.S. and international data protection laws and regulations could result in government enforcement actions (which could include substantial civil and/or criminal penalties), private litigation and/or adverse publicity and could negatively affect our operating results and business.
Our information technology systems are subject to cyber and other risks, some of which are beyond our control, which could have a material adverse effect on our business, results of operations and financial position.
We rely heavily on the proper functioning and availability of our information systems for our operations as well as for providing services to our customers. Our information systems, including our accounting, communications and data processing systems, as well as our maritime and/or shoreside operations, are integral to the efficient operation of our business. It is critical that the data processed by these systems remain confidential, as it often includes competitive customer information, confidential customer personally identifiable information and transaction data, employee records and key financial and operational plans, results and statistics. The sophistication of efforts by hackers, foreign governments, cyber-terrorists, and cyber-criminals, acting individually or in coordinated groups, to launch distributed denial of service attacks or other coordinated attacks that may cause service outages, gain inappropriate or block legitimate access to systems or information, or result in other business interruptions has continued to increase in recent years. We utilize third-party service providers who have access to our systems and certain sensitive data, which exposes us to additional security risks, particularly given the complex and evolving laws and regulations regarding privacy and data protection. Cyber incidents that impact the security, availability, reliability, speed, accuracy or other proper functioning of our systems, information and measures, including outages, computer viruses, break-ins and similar disruptions, could have a significant impact on our operations.
Although our information systems are protected through physical and software safeguards, as well as redundant systems, network security measures and backup systems, it is difficult to fully protect against the possibility of power loss, telecommunications failures, cyber-attacks, and other cyber incidents in every potential circumstance that may arise. A significant cyber incident, including system failure, security breach, disruption by malware or ransomware, or other damage, could interrupt or delay our operations, damage our reputation and brand, cause a loss of customers, expose us to a risk of loss or litigation, result in regulatory scrutiny, investigations, actions, fines or penalties and/or cause us to incur significant time and expense to remedy such an event, any of which could have a material adverse impact on our results of operations and financial position. Furthermore, any failure to comply with data privacy, security or other laws and regulations could result in claims, legal or regulatory proceedings, inquiries or investigations. As cyber threats are continually evolving, our controls and procedures may become inadequate and we may be required to devote additional resources to modifying or enhancing our systems in the future. Furthermore, while we maintain insurance intended to address costs associated with aspects of cyber incidents, network failures and data privacy-related concerns, our coverage may not sufficiently cover all types of losses or claims that may arise.
A change in our tax status under the United States Internal Revenue Code (the “Internal Revenue Code”), or other jurisdictions, may have adverse effects on our income.
At the present time, many of our subsidiaries that are foreign corporations do not derive any significant income from sources within the United States and are not subject to significant United States federal income taxes. Any income earned by these subsidiaries from sources within the United States generally is subject to United States federal income tax (and United States branch profits tax) unless the requirements of the exemption under Section 883 of the Internal Revenue Code are met. Although we expect that any United States source income of our foreign subsidiaries will generally qualify for the benefits of the Section 883 exemption, there is no assurance that such benefits will be available.
In addition, the enactment of legislation implementing changes in taxation of international business activities, the adoption of other corporate tax reform policies, or changes in tax legislation or policies could materially affect our financial position and results of operations. In general, changes in tax laws may affect our tax rate, increase our tax liabilities, carrying value of deferred tax assets, or our deferred tax liabilities. Any substantial changes in international corporate tax policies, enforcement activities or legislative initiatives may materially and adversely affect our business, the amount of taxes we are required to pay and our financial condition and results of operations generally.
Restrictions on travel or access to certain protected or preserved areas could adversely affect our business.
Our ability to follow our planned itinerary for any expedition cruise may be affected by a number of factors, including security concerns, adverse weather conditions and natural disasters, local government regulations and restrictions and other restrictions on access, including access to protected or preserved areas.
For instance, the number of visitors admitted to the Galápagos National Park at any given time is limited by the number of “cupos” permits issued by the Galápagos National Parks Service. In June 2015, the Special Law of Special Regimen for Province of Galapagos was approved and subsequently updated in November 2015. The law established that cupos, which were in effect as of July 2015, will have a validity of nine years. Our rights to operate in the Galapagos will therefore expire in July 2024 based on the law and decree.
Although the current holders of cupos will have the opportunity to re-apply for them, other enterprises and individuals will also have the opportunity to bid on cupos as they become subject to renewal. All bidders in this process must present proof that they fulfill the conditions to properly utilize the license. Notable criteria include, without limitation, access to a vessel, experience in tourism, a proven record of environmentally sensitive behavior, marketing requirements, etc. If the Galápagos National Parks Service were to further restrict access to the park, we might be required to alter certain of our travel itineraries. Such a development would negatively impact our business and revenues.
Changes in other governmental and environmental rules and regulations in the Galápagos Islands and other travel destinations could also cause sudden losses in revenue, together with additional expenditures due to the need to revise our existing itineraries. Restrictions on access for us and our guests to other protected or preserved areas, including national parks, may result in losses in revenues typically generated by our expeditions to such areas.
Litigation, enforcement actions, fines or penalties could adversely impact our financial condition or results of operations and/or damage our reputation.
Our business is subject to various United States and international laws and regulations that could lead to enforcement actions, fines, civil or criminal penalties or the assertion of litigation claims and damages. In addition, improper conduct by our employees, agents, partners, or expedition representatives could damage our reputation and/or lead to litigation or legal proceedings that could result in civil or criminal penalties, including substantial monetary fines. In certain circumstances, it may not be economical to defend against such matters and/or a legal strategy may not ultimately result in us prevailing in a matter. Such events could lead to an adverse impact on our financial condition or results of operations.
In addition, as a result of any ship-related or other incidents, claims, enforcement actions and regulatory actions and investigations, including, but not limited to, those arising from personal injury, loss of life, loss of or damage to personal property, business interruption losses or environmental damage to any affected coastal waters and the surrounding area, may be asserted or brought against various parties, including us and/or our subsidiaries. The time and attention of our management may also be diverted in defending such claims, actions and investigations. Subject to applicable insurance coverage, we may also incur costs both in defending against any claims, actions and investigations and for any judgments, fines, civil or criminal penalties if such claims, actions or investigations are adversely determined.
Failure to comply with international safety regulations may subject us to increased liability that may adversely affect our insurance coverage resulting in a denial of access to, or detention in, certain ports which could adversely affect our business.
The operation of vessels is affected by the requirements of the International Maritime Organization’s International Safety Management Code for the Safe Operation of Ships and Pollution Prevention (“ISM Code”). The ISM Code requires ship owners and bareboat charterers to develop and maintain an extensive “Safety Management System” that includes the adoption of a safety and environmental protection policy setting forth instructions and procedures for safe operation and describing procedures for dealing with emergencies. A failure to comply with the ISM Code may subject us to increased liability, invalidate existing insurance or decrease available insurance coverage for the affected vessels and result in a denial of access to or detention in certain ports, all of which could materially and adversely affect our results of operations and liquidity.
Compliance with existing or changing laws and regulations could adversely affect our business.
Extensive and changing laws and regulations directly affect the operation of our vessels. These laws and regulations take the form of international conventions and agreements, including the International Maritime Organization conventions and regulations and the International Convention for the Safety of Life at Sea, which are applicable to all internationally trading vessels, and national, state and local laws and regulations, all of which are amended frequently. Under these laws and regulations, various governmental and quasi-governmental agencies and other regulatory authorities may require us to obtain permits, licenses and certificates in connection with our operations. Some countries in which we operate have laws that restrict the nationality of a vessel’s crew and prior and future ports of call, as well as other considerations relating to particular national interests. Changes in governmental regulations and safety or other equipment standards may require unbudgeted expenditures for alterations or the addition of new equipment for our vessels.
An inability to obtain adequate insurance coverage could adversely affect our business, financial condition and results of operations.
While we maintain comprehensive insurance and believe that our current coverage is at appropriate levels, we are not protected against all risks and there can be no assurance that any particular claim will be fully paid by our insurance. Such losses, to the extent they are not adequately covered by contractual remedies or insurance, could affect our financial results. Our protection and indemnity (“P&I”) liability insurance is placed on a mutual basis and we are subject to additional premium calls in amounts based on claim records of all members of the P&I Club (i.e. mutual association) in which our ships are entered. We are also subject to additional premium assessments including, but not limited to, investment or underwriting shortfalls experienced by the P&I Club. If we were to sustain significant losses in the future, our ability to obtain insurance coverage at all or at commercially reasonable rates could be materially adversely affected. Moreover, irrespective of the occurrence of such events, there can still be no assurance that we will be able to obtain adequate insurance coverage at commercially reasonable rates or at all.
If we do not restrict the amount of ownership of our common stock by non-U.S. citizens, we could be prohibited from operating vessels in U.S. coastwise trade, which would adversely impact our business and operating results.
To the extent any of our United States flagged vessels are engaged in transporting passengers on the U.S. coastwise trade, we will be subject to the Coastwise Laws, which govern, among other things, the ownership and operation of vessels used to carry cargo or passengers between U.S. ports. Subject to limited exceptions, the Coastwise Laws and the regulations promulgated thereunder require that such vessels engaged in the U.S. coastwise trade be built in the United States, registered under the U.S. flag, manned by predominantly U.S. crews, and beneficially owned and operated by U.S. organized companies that are controlled and at least 75% owned by U.S. citizens within the meaning of the statutes. A failure to maintain compliance with the Coastwise Laws would adversely affect our financial position and our results of operations as we would be prohibited from operating vessels in the U.S. coastwise trade during any period in which we do not comply or cannot demonstrate to the satisfaction of the relevant governmental authorities our compliance with the Coastwise Laws. In addition, a failure to maintain compliance could subject us to fines and our vessels could be subject to seizure and forfeiture for violations of the Coastwise Laws and the related U.S. vessel documentation laws.
Restrictions on non-U.S. citizen ownership of certain U.S. flagged vessels could limit our ability to sell off a portion of our business or result in the forfeiture of certain of our vessels.
Compliance with the Coastwise Laws requires that non-U.S. citizens beneficially own no more than 24.99% in the entities that directly or indirectly own the vessels that operate in the U.S. coastwise trade. If we were to seek to sell any portion of our business that owns any of these vessels, we would have fewer potential purchasers because some potential purchasers might be unable or unwilling to satisfy the U.S. citizenship restrictions described above. As a result, the sales price for that portion of the business may not attain the amount that could be obtained in an unregulated market.
Risks Related to Our Securities
Our amended and restated certificate of incorporation limits the beneficial ownership of our common stock by individuals and entities that are not U.S. citizens within the meaning of the Coastwise Laws. These restrictions may affect the liquidity of our common stock and may result in non-U.S. citizens being required to disgorge profits, sell their shares at a loss or relinquish their voting, dividend and distribution rights.
Under the Coastwise Laws, and so long as we operate U.S. flagged vessels in coastwise trade, at least 75% of the outstanding shares of each class or series of our capital stock must be beneficially owned and controlled by U.S. citizens within the meaning of the Coastwise Laws. Certain provisions of our amended and restated certificate of incorporation are intended to facilitate compliance with this requirement and may have an adverse effect on certain holders or proposed transferees of shares of our common stock.
Under the provisions of our amended and restated certificate of incorporation, any transfer, or attempted transfer, of any shares of capital stock will be void if the effect of such transfer, or attempted transfer, would be to cause one or more non-U.S. citizens in the aggregate to own (of record or beneficially) shares of any class or series of our capital stock in excess of 22% of the outstanding shares of such class or series. The liquidity or market value of the shares of common stock may be adversely impacted by such transfer restrictions.
In the event such restrictions voiding transfers would be ineffective for any reason, our amended and restated certificate of incorporation provides that if any transfer would otherwise result in the number of shares of any class or series of capital stock owned (of record or beneficially) by non-U.S. citizens being in excess of 22% of the outstanding shares of such class or series, such transfer will cause such excess shares to be automatically transferred to a trust for the exclusive benefit of one or more charitable beneficiaries that are U.S. citizens. The proposed transferee will have no rights in the shares transferred to the trust, and the trustee, who is a U.S. citizen chosen by us and unaffiliated with us or the proposed transferee, will have all voting, dividend and distribution rights associated with the shares held in the trust. The trustee will sell such excess shares to a U.S. citizen within 20 days of receiving notice from us and distribute to the proposed transferee the lesser of the price that the proposed transferee paid for such shares and the amount received from the sale, and any gain from the sale will be paid to the charitable beneficiary of the trust.
These trust transfer provisions also apply to situations where ownership of a class or series of capital stock by non-U.S. citizens in excess of 22% would be exceeded by a change in the status of a record or beneficial owner thereof from a U.S. citizen to a non-U.S. citizen, in which case such person will receive the lesser of the market price of the shares on the date of such status change and the amount received from the sale. In addition, under our amended and restated certificate of incorporation, if the sale or other disposition of shares of common stock would result in non-U.S. citizens owning (of record or beneficially) in excess of 22% of the outstanding shares of common stock, the excess shares shall be automatically transferred to a trust for disposal by a trustee in accordance with the trust transfer provisions described above. As part of the foregoing trust transfer provisions, the trustee will be deemed to have offered the excess shares in the trust to us at a price per share equal to the lesser of (i) the market price on the date we accept the offer and (ii) the price per share in the purported transfer or original issuance of shares, as described in the preceding paragraph, or the market price per share on the date of the status change, that resulted in the transfer to the trust.
As a result of the above trust transfer provisions, a proposed transferee that is a non-U.S. citizen or a record or beneficial owner whose citizenship status change results in excess shares may not receive any return on its investment in shares it purportedly purchases or owns, as the case may be, and it may sustain a loss.
To the extent that the above trust transfer provisions would be ineffective for any reason, our amended and restated certificate of incorporation provides that, if the percentage of the shares of any class or series of capital stock owned (of record or beneficially) by non-U.S. citizens is known to us to be in excess of 22% for such class or series, we, in our sole discretion, shall be entitled to redeem all or any portion of such shares most recently acquired (as determined by us in accordance with guidelines that are set forth in our amended and restated certificate of incorporation), by non-U.S. citizens, or owned (of record or beneficially) by non-U.S. citizens as a result of a change in citizenship status, in excess of such permitted percentage for such class or series at a redemption price based on a fair market value formula that is set forth in our amended and restated certificate of incorporation. Such excess shares shall not be accorded any voting, dividend or distribution rights until they have ceased to be excess shares, provided that they have not been already redeemed by us. As a result of these provisions, a shareholder who is a non-U.S. citizen may be required to sell its shares of common stock at an undesirable time or price and may not receive any return on its investment in such shares. Further, we may have to incur additional indebtedness, or use available cash (if any), to fund all or a portion of such redemption, in which case our financial condition may be materially weakened.
In order to assist our compliance with the Coastwise Laws, our amended and restated certificate of incorporation permits us to require that any record or beneficial owner of any shares of our capital stock provide us with certain documentation concerning such owner’s citizenship. These provisions include a requirement that every person acquiring, directly or indirectly, five percent (5%) or more of the shares of any class or series of our capital stock must provide us with specified citizenship documentation. In the event that any person does not submit such requested or required documentation to us, our amended and restated certificate of incorporation provides us with certain remedies, including the suspension of the voting rights of the person’s shares owned by persons unable or unwilling to submit such documentation and the payment of dividends and distributions with respect to those shares into a segregated account. As a result of non-compliance with these provisions, a record or beneficial owner of the shares of our common stock may lose significant rights associated with those shares.
In addition to the risks described above, the foregoing ownership restrictions on non-U.S. citizens could delay, defer or prevent a transaction or change in control that might involve a premium price for common stock or otherwise be in the best interest of our shareholders.
If non-U.S. citizens own more than 22% of our common stock, we may not have the funds or the ability to redeem any excess shares and the charitable trust mechanism described above may be deemed invalid or unenforceable, all with the result that we could be forced to either suspend our operations in the U.S. coastwise trade or be subject to substantial penalties.
Our amended and restated certificate of incorporation contains provisions voiding transfers of shares of any class or series of our capital stock that would result in non-U.S. citizens within the meaning of the Coastwise Laws, in the aggregate, owning in excess of 22% of the shares of such class or series. In the event that this transfer restriction would be ineffective, our amended and restated certificate of incorporation provides for the automatic transfer of such excess shares to a trust specified therein. These trust provisions also apply to excess shares that would result from a change in the status of a record or beneficial owner of shares of our capital stock from a U.S. citizen to a non-U.S. citizen. In the event that these trust transfer provisions would also be ineffective, our amended and restated certificate of incorporation permits us to redeem such excess shares. The per-share redemption price may be paid, as determined by our Board of Directors, by cash or redemption notes or the shares may be redeemed for warrants. However, we may not be able to redeem such excess shares for cash because our operations may not have generated sufficient excess cash flow to fund such redemption. Further, the methodology for transfer to and sale by a charitable trust could be deemed invalid or unenforceable in one or more jurisdictions. If, for any reason, we are unable to effect a redemption or charitable sale when beneficial ownership of shares by non-U.S. citizens is in excess of 24.99% of the common stock, or otherwise prevent non-U.S. citizens in the aggregate from beneficially owning shares in excess of 24.99% of any class or series of capital stock, or fail to exercise our redemption or forced sale rights because we are unaware that ownership exceeds such percentage, we will likely be unable to comply with the Coastwise Laws and will likely be required by the applicable governmental authorities to suspend our operations in the U.S. coastwise trade. Any such actions by governmental authorities would have a severely detrimental impact on our financial position, results of operations and cash flows and any failure to suspend operations in violation of the Coastwise Laws could cause us to be subject to material financial and operational penalties.
An active trading market for our common stock may not be sustained, and you may not be able to resell your shares at or above the price at which you purchased them.
An active trading market for our shares may not be sustained. In the absence of an active trading market for our common stock, shares of common stock may not be able to be resold at or above the purchase price of such shares. Although there can be no assurances, we expect that our common stock will continue to be listed on the NASDAQ Stock Market. However, even if our common stock continues to be listed on the NASDAQ Stock Market, there is no assurance that an active market for our common stock will continue in the foreseeable future.
We do not intend to pay any dividends to shareholders in the foreseeable future.
We have not paid any cash dividends on our shares of common stock to date and do not intend to pay cash dividends in the foreseeable future. The payment of cash dividends in the future will be dependent upon our revenues and earnings, if any, capital requirements and general financial conditions. The payment of any dividends is within the discretion of our Board of Directors. It is the present intention of our Board of Directors to retain all earnings, if any, for use in our business operations and, accordingly, our Board of Directors does not anticipate declaring any dividends in the foreseeable future. As a result, any gain you will realize on our securities will result solely from the appreciation of such securities.
Provisions in our amended and restated certificate of incorporation and bylaws and Delaware law may inhibit a takeover of us, which could limit the price investors might be willing to pay in the future for our common stock and could entrench management.
Our amended and restated certificate of incorporation and bylaws contain provisions that may discourage unsolicited takeover proposals that stockholders may consider to be in their best interests. Our board of directors is divided into three classes, each of which will generally serve for a term of three years with only one class of directors being elected in each year. As a result, at a given annual meeting only a minority of the board of directors may be considered for election. Since our “staggered board” may prevent our stockholders from replacing a majority of our board of directors at any given annual meeting, it may entrench management and discourage unsolicited stockholder proposals that may be in the best interests of stockholders. Moreover, our Board of Directors has the ability to designate the terms of and issue new series of preferred stock.
We are also subject to anti-takeover provisions under Delaware law, which could delay or prevent a change of control. Together these provisions may make more difficult the removal of management and may discourage transactions that otherwise could involve payment of a premium over prevailing market prices for our securities.
|
Item 1B. |
None.
|
Item 2. |
Our principal executive office is located at 96 Morton Street, New York, New York where we lease approximately 13,000 square feet. Our principal shoreside operations are located at 2505 Second Avenue, Seattle, Washington, consisting of approximately 11,000 square feet. We also lease our Natural Habitat office in Louisville, Colorado, a media studio in Burlington, Vermont and warehouse space in Seattle, Washington for our shoreside operations. A description of our vessels is set forth in Item 1 under the subheading “Lindblad Expeditions, Ships and Voyages.”
|
Item 3. |
We are involved in various claims, legal actions and regulatory proceedings arising from time to time in the ordinary course of business. We are not currently involved in any litigation nor, to our knowledge, is any litigation threatened against us, the outcome of which would, in our judgment based on information currently available to us, have a material adverse effect on our financial position or results of operations.
|
Item 4. |
Not applicable.
|
Item 5. |
Market Information
Our common stock is traded on the NASDAQ Capital Market under the symbol “LIND”.
Holders
As of January 31, 2020, there were 172 holders of record of our common stock. Since certain of our shares are held by brokers and other institutions on behalf of shareholders, the foregoing number is not representative of the number of beneficial owners.
Dividends
We have not paid any cash dividends on our common stock to date. We intend to retain all earnings for use in our business operations and for purchases of our common stock, accordingly, our Board of Directors does not anticipate declaring any dividends in the foreseeable future. Any determination to pay dividends in the future will be at the discretion of our Board and will depend upon our results of operations, financial condition, restrictions imposed by applicable law and our financing agreements and other factors that our Board of Directors deems relevant.
Recent Sales by the Company of Unregistered Securities
There were no unregistered sales of equity securities during the three months ended December 31, 2019.
Repurchases of Securities
Our Board of Directors approved a stock and warrant repurchase plan (“Repurchase Plan”) in November 2015 and increased the Repurchase Plan to $35.0 million in November 2016. This Repurchase Plan authorizes us to purchase from time to time our outstanding common stock through open market repurchases in compliance with Rule 10b-18 of the Securities Exchange Act of 1934, as amended, and/or in privately negotiated transactions based on market and business conditions, applicable legal requirements and other factors. Any shares purchased will be retired. The Repurchase Plan has no time deadline and will continue until otherwise modified or terminated at the sole discretion of our Board of Directors at any time. The repurchases exclude shares repurchased to settle statutory employee tax withholding related to the vesting of stock awards. See Notes to the Consolidated Financial Statements Note 11 – Stockholders' Equity for more information. No shares were repurchased under the Repurchase Plan during the three months ended December 31, 2019.
On June 14, 2019, the Company launched an offer to exchange all warrants to purchase common stock of the Company (the "Warrant Exchange"). The Warrant Exchange provided (i) an offer to each holder of the Company's outstanding warrants to receive 0.385 shares of common stock in exchange for each warrant tendered by the holder and exchanged pursuant to the Warrant Exchange, and (ii) the solicitation of consents (the "Consent Solicitation") from holders of the warrants to amend the warrant agreement that governs all of the warrants to permit the Company to require that each outstanding warrant not tendered in the Warrant Exchange be converted into 0.36575 shares of common stock. The Warrant Exchange and Consent Solicitation closed on July 17, 2019, with 9,935,000 warrants tendered via the Warrant Exchange for an aggregate of 3,824,959 shares of Company common stock, and approval was received for the Consent Solicitation. The remaining 125,763 warrants not tendered via the Warrant Exchange were converted, per the Consent Solicitation, into 45,981 shares of Company common stock. Following the Warrant Exchange and Consent Solicitation, no warrants remain outstanding.
As the fair value of the warrants tendered in the Warrant Exchange offer was less than the fair value of the common stock issued, the Company recorded a non-cash deemed dividend of approximately $2.7 million for the incremental fair value provided to the warrant holders. The fair value of the Company's common stock and warrants were determined using the closing market prices on August 17, 2019, Level 1 fair value inputs.
Stock Performance Graph
The following stock performance graph compares the performance of our common stock from December 31, 2014 to December 31, 2019 with the performance of the Standard & Poor’s 500 Composite Stock Index and the FTSE 100 Index. The graph assumes an initial investment of $100 on December 31, 2014 and reinvestment of dividends.
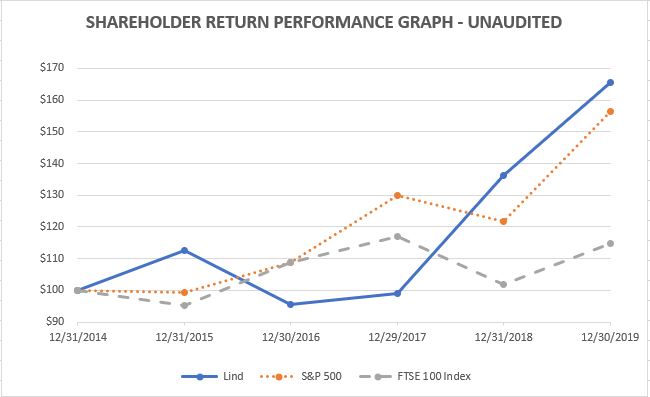
|
|
|
12/31/14 |
|
|
12/31/15 |
|
|
12/31/16 |
|
|
12/31/17 |
|
|
12/31/18 |
|
|
12/31/19 |
|
||||||
|
LIND |
|
$ |
100.00 |
|
|
$ |
112.45 |
|
|
$ |
95.65 |
|
|
$ |
99.09 |
|
|
$ |
136.23 |
|
|
$ |
165.59 |
|
|
S&P 500 |
|
|
100.00 |
|
|
|
99.27 |
|
|
|
108.74 |
|
|
|
129.86 |
|
|
|
121.76 |
|
|
|
156.46 |
|
|
FTSE 100 Index |
|
|
100.00 |
|
|
|
95.07 |
|
|
|
108.78 |
|
|
|
117.08 |
|
|
|
101.93 |
|
|
|
114.87 |
|
|
Item 6. |
The following selected financial data should be read in conjunction with Management’s Discussion and Analysis of Results of Operations and Financial Condition, the Consolidated Financial Statements and the Notes to the Consolidated Financial Statements in this Annual Report on Form 10-K.
|
For the years ended December 31, |
||||||||||||||||||||
|
(In thousands, except share and per share data) |
2019 |
2018 |
2017 |
2016 |
2015 |
|||||||||||||||
|
Income Statement Data: |
||||||||||||||||||||
|
Tour revenues |
$ | 343,091 | $ | 309,734 | $ | 266,504 | $ | 242,346 | $ | 209,985 | ||||||||||
|
Operating income |
33,198 | 25,338 | 10,744 | 13,981 | 15,502 | |||||||||||||||
|
Net income (loss) |
18,748 | 11,552 | (7,529 | ) | 5,059 | 19,742 | ||||||||||||||
|
Per Share Data: |
||||||||||||||||||||
|
Earnings (loss) per share: |
||||||||||||||||||||
|
Basic |
$ | 0.29 | $ | 0.25 | $ | (0.19 | ) | $ | 0.11 | $ | 0.44 | |||||||||
|
Diluted |
$ | 0.28 | $ | 0.24 | $ | (0.19 | ) | $ | 0.10 | $ | 0.43 | |||||||||
|
Weighted average shares outstanding, basic |
47,440,788 | 45,378,188 | 44,576,912 | 45,649,971 | 44,917,829 | |||||||||||||||
|
Weighted average shares outstanding, diluted |
49,426,563 | 46,340,054 | 44,576,912 | 46,456,921 | 45,575,387 | |||||||||||||||
|
As of December 31, |
||||||||||||||||||||
|
(In thousands) |
2019 |
2018 |
2017 |
2016 |
2015 |
|||||||||||||||
|
Balance Sheet Data: |
||||||||||||||||||||
|
Total assets |
$ | 548,658 | $ | 473,409 | $ | 424,348 | $ | 407,701 | $ | 381,613 | ||||||||||
|
Long-term debt |
218,068 | 190,089 | 165,936 | 165,878 | 164,443 | |||||||||||||||
|
Total liabilities |
409,296 | 350,863 | 311,724 | 288,722 | 267,692 | |||||||||||||||
|
Total stockholders' equity |
123,250 | 116,044 | 106,322 | 113,809 | 113,921 | |||||||||||||||
|
Item 7. |
Management’s Discussion and Analysis of the Results of Operations and Financial Condition |
The information contained in this section should be read in conjunction with our consolidated financial statements and related notes and the information contained elsewhere in this Form 10-K under the headings “Risk Factors,” “Selected Financial Data,” and “Business.”
Overview
We provide expedition cruising and adventure travel experiences that include itineraries featuring up-close encounters with wildlife and nature, history and culture and promote guest empowerment and interactivity. Our mission is to offer life-changing adventures and wildlife experiences around the world and pioneer innovative ways to allow our guests to connect with exotic and remote places. Many of these expeditions involve travel to remote places, such as the Arctic, Antarctic, the Galapagos Islands, Alaska, Baja’s Sea of Cortez, Costa Rica, Panama, polar bear tours in Churchill, Canada, Alaskan grizzly bear tours and African safaris.
We currently operate a fleet of eight owned expedition ships and five seasonal charter vessels under the Lindblad brand. We have a strategic business alliance with National Geographic founded on a shared interest in exploration, research, technology and conservation. This relationship includes a co-selling, co-marketing and branding arrangement whereby our owned vessels carry the National Geographic name and National Geographic sells our expeditions through its internal travel division. We collaborate with National Geographic on voyage planning to enhance the guest experience by having National Geographic experts, including photographers, writers, marine biologists, naturalists, field researchers and film crews, join our expeditions. Guests have the ability to interface with these experts through lectures, excursions, dining and other experiences throughout their voyage.
We deploy chartered vessels for various seasonal offerings and continually seek to optimize our charter fleet to balance our inventory with demand and maximized yields. We use our charter inventory as a mechanism to both increase travel options of our existing and prospective guests and also to test demand for certain areas and seasons to understand the potential for longer term deployments and additional vessel needs.
Management considers investments in new ships to be an important step to meet increasing demand for our expedition cruise offerings. The National Geographic Quest launched in 2017 and operates in Alaska, British Columbia and the Pacific Northwest during the summer months and voyages to the Channel Islands, Belize, Columbia, Costa Rica and Panama to provide expeditions for the Northern Hemisphere winter season. The National Geographic Venture launched in 2018 and operates primarily in the Channel Islands, Baja California and the Sea of Cortez during the Northern Hemisphere winter seasons and Alaska, British Columbia and the Pacific Northwest during the summer. In 2020, the National Geographic Endurance is scheduled to launch and operate primarily in the Arctic and Antarctic.
In February 2019, we entered into an agreement to construct a new polar ice-class vessel, the National Geographic Resolution, scheduled to be delivered in the fourth quarter of 2021. In March of 2019, we entered into a senior secured credit agreement, for a loan in an aggregate principal amount not to exceed $122.8 million for the purpose of providing financing for up to 80% of the purchase price of the vessel. During September of 2019, we drew approximately $30.5 million against the senior secured credit agreement for a contracted installment payment.
In July 2019, we closed an offer and solicitation of consent to exchange all of our previously outstanding warrants to purchase our common stock, during which all our outstanding warrants were converted into approximately 3.9 million shares of our common stock.
The discussion and analysis of our results of operations and financial condition are organized as follows:
|
|
● |
a description of certain line items and operational and financial metrics we utilize to assist us in managing our business; |
|
|
|
|
|
|
● |
a comparable discussion of our consolidated and segment results of operations for the years ended December 31, 2019, 2018 and 2017; |
|
|
|
|
|
|
● |
a discussion of our liquidity and capital resources, including future capital and contractual commitments and potential funding sources; and |
|
|
|
|
|
|
● |
a review of our critical accounting policies. |
Financial Presentation
Description of Certain Line Items
Tour revenues
Tour revenues consist of the following:
|
|
● |
Guest ticket revenues recognized from the sale of guest tickets; and |
|
|
|
|
|
|
● |
Other tour revenues from the sale of pre- or post-expedition excursions, hotel accommodations and land-based expeditions; air transportation to and from the ships, goods and services rendered onboard that are not included in guest ticket prices, trip insurance and cancellation fees. |
Cost of tours
Cost of tours includes the following:
|
|
● |
Direct costs associated with revenues, including cost of pre- or post-expedition excursions, hotel accommodations and land-based expeditions, air and other transportation expenses and cost of goods and services rendered onboard; |
|
|
|
|
|
|
● |
Payroll costs and related expenses for shipboard and expedition personnel; |
|
|
|
|
|
|
● |
Food costs for guests and crew, including complimentary food and beverage amenities for guests; |
|
|
|
|
|
|
● |
Fuel costs and related costs of delivery, storage and safe disposal of waste; and |
|
|
|
|
|
|
● |
Other tour expenses, such as land costs, port costs, repairs and maintenance, equipment expense, drydock, ship insurance and charter hire costs. |
Selling and marketing
Selling and marketing expenses include commissions, royalties and a broad range of advertising and promotional expenses.
General and administrative
General and administrative expenses include the cost of shoreside vessel support and other administrative functions, including salaries and related benefits, credit card commissions, professional fees and rent.
Operational and Financial Metrics
We use a variety of operational and financial metrics, including non-GAAP financial measures, such as Adjusted EBITDA, Net Yields, Occupancy and Net Cruise Costs, to enable us to analyze our performance and financial condition. We utilize these financial measures to manage our business on a day-to-day basis and believe that they are the most relevant measures of performance. Some of these measures are commonly used in the cruise and tourism industry to evaluate performance. We believe these non-GAAP measures provide expanded insight to assess revenue and cost performance, in addition to the standard GAAP-based financial measures. There are no specific rules or regulations for determining non-GAAP measures, and as such, our non-GAAP financial measures may not be comparable to measures used by other companies within the industry.
The presentation of non-GAAP financial information should not be considered in isolation or as a substitute for, or superior to, the financial information prepared and presented in accordance with GAAP. You should read this discussion and analysis of our results of operations and financial condition together with the consolidated financial statements and the related notes thereto also included in Item 8 of this Annual Report on Form 10-K.
Adjusted EBITDA is net income (loss) excluding depreciation and amortization, net interest expense, other income (expense), income tax (expense) benefit, (gain) loss on foreign currency, (gain) loss on transfer of assets, reorganization costs, and other supplemental adjustments. Other supplemental adjustments include certain non-operating items such as stock-based compensation, executive severance costs, the National Geographic fee amortization, debt refinancing costs, acquisition-related expenses and other non-recurring charges. We believe Adjusted EBITDA, when considered along with other performance measures, is a useful measure as it reflects certain operating drivers of the business, such as sales growth, operating costs, selling and administrative expense, and other operating income and expense. We believe Adjusted EBITDA helps provide a more complete understanding of the underlying operating results and trends and an enhanced overall understanding of our financial performance and prospects for the future. Adjusted EBITDA is not intended to be a measure of liquidity or cash flows from operations or a measure comparable to net income as it does not take into account certain requirements, such as unearned passenger revenues, capital expenditures and related depreciation, principal and interest payments, and tax payments. Our use of Adjusted EBITDA may not be comparable to other companies within the industry.
The following metrics apply to our Lindblad segment:
Adjusted Net Cruise Cost represents Net Cruise Cost adjusted for Non-GAAP other supplemental adjustments which include certain non-operating items such as stock-based compensation, the National Geographic fee amortization and acquisition-related expenses.
Available Guest Nights is a measurement of capacity and represents double occupancy per cabin (except single occupancy for a single capacity cabin) multiplied by the number of cruise days for the period. We also record the number of guest nights available on our limited land programs in this definition.
Gross Cruise Cost represents the sum of cost of tours plus selling and marketing expenses, and general and administrative expenses.
Gross Yield represents tour revenues less insurance proceeds divided by Available Guest Nights.
Guest Nights Sold represents the number of guests carried for the period multiplied by the number of nights sailed within the period.
Maximum Guests is a measure of capacity and represents the maximum number of guests in a period and is based on double occupancy per cabin (except single occupancy for a single capacity cabin).
Net Cruise Cost represents Gross Cruise Cost excluding commissions and certain other direct costs of guest ticket revenues and other tour revenues.
Net Cruise Cost Excluding Fuel represents Net Cruise Cost excluding fuel costs.
Net Revenue represents tour revenues less commissions and direct costs of other tour revenues.
Net Yield represents Net Revenue divided by Available Guest Nights.
Number of Guests represents the number of guests that travel with us in a period.
Occupancy is calculated by dividing Guest Nights Sold by Available Guest Nights.
Voyages represent the number of ship expeditions completed during the period.
Foreign Currency Translation
The U.S. dollar is the functional currency in our foreign operations and re-measurement adjustments and gains or losses resulting from foreign currency transactions are recorded as foreign exchange gains or losses in the consolidated statements of operations.
Seasonality
Lindblad tour revenues from the sale of guest tickets are mildly seasonal, historically larger in the first and third quarters. The seasonality of our operating results increases due to our vessels being taken out of service for scheduled maintenance or drydocking, which is typically during non-peak demand periods, in the second and fourth quarters. Our drydock schedules are subject to cost and timing differences from year-to-year due to the availability of shipyards for certain work, drydock locations based on ship itineraries, operating conditions experienced especially in the polar regions, and the applicable regulations of class societies in the maritime industry, which require more extensive reviews periodically. Drydocking impacts operating results by reducing tour revenues and increasing cost of tours. Natural Habitat is a seasonal business, with the majority of its tour revenue earned in the third and fourth quarters from its summer season departures and polar bear tours.
Results of Operations – Consolidated
We reported consolidated tour revenues, cost of tours, operating expenses, operating income and net income for the years ended December 31, 2019, 2018 and 2017 as shown in the following table:
|
For the years ended December 31, |
||||||||||||||||||||||||||||
|
(In thousands) |
2019 |
2018 |
Change |
% |
2017 |
Change |
% | |||||||||||||||||||||
|
Tour revenues |
$ | 343,091 | $ | 309,734 | $ | 33,357 | 11 | % | $ | 266,504 | $ | 43,230 | 16 | % | ||||||||||||||
|
Cost of tours |
166,608 | 153,743 | 12,865 | 8 | % | 135,526 | 18,217 | 13 | % | |||||||||||||||||||
|
General and administrative |
62,744 | 62,898 | (154 | ) | (0 | %) | 60,529 | 2,369 | 4 | % | ||||||||||||||||||
|
Selling and marketing |
54,772 | 46,987 | 7,785 | 17 | % | 42,354 | 4,633 | 11 | % | |||||||||||||||||||
|
Depreciation and amortization |
25,769 | 20,768 | 5,001 | 24 | % | 17,351 | 3,417 | 20 | % | |||||||||||||||||||
|
Operating income |
$ | 33,198 | $ | 25,338 | $ | 7,860 | 31 | % | $ | 10,744 | $ | 14,594 | 136 | % | ||||||||||||||
|
Net income (loss) |
$ | 18,748 | $ | 11,552 | $ | 7,196 | 62 | % | $ | (7,529 | ) | $ | 19,081 | 253 | % | |||||||||||||
|
Net income (loss) per share available to common stockholders |
||||||||||||||||||||||||||||
|
Basic |
$ | 0.29 | $ | 0.25 | $ | 0.04 | $ | (0.19 | ) | $ | 0.44 | |||||||||||||||||
|
Diluted |
$ | 0.28 | $ | 0.24 | $ | 0.04 | $ | (0.19 | ) | $ | 0.43 | |||||||||||||||||
Comparison of Years Ended December 31, 2019 and December 31, 2018 - Consolidated
Tour Revenues
Tour revenues for the year ended December 31, 2019 increased $33.4 million, or 11%, to $343.1 million compared to $309.7 million for the year ended December 31, 2018. At the Lindblad segment, tour revenues increased by $26.1 million driven primarily by an increase in Available Guest Nights during 2019 due to the addition of the National Geographic Venture to our fleet in the fourth quarter of 2018. At the Natural Habitat segment, tour revenues increased $7.3 million over the prior year period primarily due to additional departures, increased travelers and itinerary changes that drove higher average pricing.
Cost of Tours
Total cost of tours for the year ended December 31, 2019 increased $12.9 million, or 8%, to $166.6 million compared to $153.7 million for the year ended December 31, 2018. At the Lindblad segment, cost of tours increased $10.5 million primarily due to incremental costs related to the National Geographic Venture and higher charter costs, partially offset by lower drydock expense. At the Natural Habitat segment, cost of tours increased $2.4 million due to additional departures.
General and Administrative Expenses
General and administrative expenses for the year ended December 31, 2019 decreased $0.2 million to $62.7 million compared to $62.9 million for the year ended December 31, 2018. At the Lindblad segment, general and administrative expenses decreased $2.3 million from the prior year primarily as a result of lower value-added tax (“VAT”) expense, a decrease in stock-based compensation expense and the absence of debt refinancing costs incurred in 2018, partially offset by costs incurred related to the warrant exchange, higher personnel costs and increased credit card fees associated with higher bookings. At the Natural Habitat segment, general and administrative expenses increased $2.1 million primarily due to increased personnel costs.
Selling and Marketing Expenses
Selling and marketing expenses increased $7.8 million, or 17%, to $54.8 million for the year ended December 31, 2019 compared to $47.0 million for the year ended December 31, 2018, primarily due to a $6.6 million increase at the Lindblad segment driven by higher advertising spend, costs related to implementation of our new reservation and customer relationship management systems and increased commission expense associated with the higher tour revenues. At the Natural Habitat segment, selling and marketing expenses increased $1.2 million primarily driven by an increase in advertising expenditures and commission expense.
Depreciation and Amortization Expenses
Depreciation and amortization expenses increased $5.0 million, or 24%, to $25.8 million for the year ended December 31, 2019 compared to $20.8 million for the year ended December 31, 2018, primarily related to a full year of depreciation on the National Geographic Venture.
Other (Expense) Income
Other expenses were $12.3 million for the year ended December 31, 2019, compared to $13.2 million for the year ended December 31, 2018. The $0.9 million decrease was primarily due to the following factors:
|
|
● |
In 2019, we recorded an $0.1 million gain in foreign currency translation compared to a loss of $2.2 million in 2018 due to the strengthening of the U.S. dollar primarily in relation to the Canadian dollar, South African Rand and the Euro in the same period a year ago. |
|
|
|
|
|
|
● |
Interest expense, net, increased $1.5 million to $12.3 million in 2019 from $10.8 million in 2018 due to borrowings and the commitment fees under our senior secured credit agreements and related foreign exchange hedge expenses, partially offset by lower interest rates on our term loan facility and higher capitalized interest for the National Geographic Endurance and the National Geographic Resolution. |
Comparison of Years Ended December 31, 2018 and December 31, 2017 - Consolidated
Tour Revenues
Tour revenues for the year ended December 31, 2018 increased $43.2 million, or 16%, to $309.7 million compared to $266.5 million for the year ended December 31, 2017. At the Lindblad segment, tour revenues increased by $29.5 million driven by higher guest ticket revenue. At the Natural Habitat segment, tour revenues increased $13.7 million over the prior year period primarily due to additional departures and an increase in pricing.
Cost of Tours
Total cost of tours for the year ended December 31, 2018 increased $18.2 million, or 13%, to $153.7 million compared to $135.5 million for the year ended December 31, 2017. At the Lindblad segment, cost of tours increased $9.8 million primarily due to costs related to the National Geographic Quest and the National Geographic Venture, the impact of cancelled voyages in the first quarter of 2017 and higher fuel costs. At the Natural Habitat segment, cost of tours increased $8.4 million due to additional departures.
General and Administrative Expenses
General and administrative expenses for the year ended December 31, 2018 increased $2.4 million, or 4%, to $62.9 million compared to $60.5 million for the year ended December 31, 2017. At the Lindblad segment, general and administrative expenses were flat to the prior year primarily as a result of lower stock-based compensation expense, as the 2016 CEO Allocation Grant and option grants were primarily expensed in 2017, and the executive severance costs incurred in 2017. These were offset by increased personnel costs, debt refinancing costs, credit card fees and increased professional fees. At the Natural Habitat segment, general and administrative expenses increased $2.4 million primarily due to an increase in personnel.
Selling and Marketing Expenses
Selling and marketing expenses increased $4.6 million, or 11%, to $47.0 million for the year ended December 31, 2018 compared to $42.4 million for the year ended December 31, 2017, primarily due to a $3.9 million increase at the Lindblad segment, primarily as the result of increased commission and royalty expense associated with the higher tour revenues. At the Natural Habitat segment, selling and marketing expenses increased $0.7 million primarily driven by an increase in advertising expenditures.
Depreciation and Amortization Expenses
Depreciation and amortization expenses increased $3.4 million, or 20%, to $20.8 million for the year ended December 31, 2018 compared to $17.4 million for the year ended December 31, 2017, primarily related to a full year of depreciation on the National Geographic Quest.
Other (Expense) Income
Other expenses were $13.2 million for the year ended December 31, 2018 compared to $8.3 million for the year ended December 31, 2017. The $4.9 million change was primarily due to the following factors:
|
|
● |
In 2018, we recorded a $2.2 million loss in foreign currency translation compared to a gain of $1.1 million in 2017 due to the weakening of the U.S. dollar primarily in relation to the Canadian dollar. |
|
|
|
|
|
|
● |
Interest expense, net, increased $1.1 million to $10.8 million in 2018 from $9.7 million in 2017 due to additional borrowings under our first lien term loan facility and the commitment fees for our new senior secured credit agreement, partially offset by higher capitalized interest for the National Geographic Endurance and the National Geographic Venture. |
|
|
|
|
|
|
● |
2017 included a $0.5 million gain on sale related to the sale of the National Geographic Endeavour. |
Results of Operations – Segments
Selected information for our segments is below. The presentation of non-GAAP financial information should not be considered in isolation or as a substitute for, or superior to, the financial information prepared and presented in accordance with GAAP.
|
For the years ended December 31, |
||||||||||||||||||||||||||||
|
(In thousands) |
2019 |
2018 |
Change |
% |
2017 |
Change |
% | |||||||||||||||||||||
|
Tour revenues: |
||||||||||||||||||||||||||||
|
Lindblad |
$ | 272,410 | $ | 246,334 | $ | 26,076 | 11 | % | $ | 216,815 | $ | 29,519 | 14 | % | ||||||||||||||
|
Natural Habitat |
70,681 | 63,400 | 7,281 | 11 | % | 49,689 | 13,711 | 28 | % | |||||||||||||||||||
|
Total tour revenues |
$ | 343,091 | $ | 309,734 | $ | 33,357 | 11 | % | $ | 266,504 | $ | 43,230 | 16 | % | ||||||||||||||
|
Operating Income: |
||||||||||||||||||||||||||||
|
Lindblad |
$ | 26,203 | $ | 19,798 | $ | 6,405 | 32 | % | $ | 7,292 | $ | 12,506 | 172 | % | ||||||||||||||
|
Natural Habitat |
6,995 | 5,540 | 1,455 | 26 | % | 3,452 | 2,088 | 60 | % | |||||||||||||||||||
|
Total operating income |
$ | 33,198 | $ | 25,338 | $ | 7,860 | 31 | % | $ | 10,744 | $ | 14,594 | 136 | % | ||||||||||||||
|
Adjusted EBITDA: |
||||||||||||||||||||||||||||
|
Lindblad |
$ | 57,971 | $ | 47,815 | $ | 10,156 | 21 | % | $ | 38,655 | $ | 9,160 | 24 | % | ||||||||||||||
|
Natural Habitat |
8,648 | 7,031 | 1,617 | 23 | % | 4,834 | 2,197 | 45 | % | |||||||||||||||||||
|
Total adjusted EBITDA |
$ | 66,619 | $ | 54,846 | $ | 11,773 | 21 | % | $ | 43,489 | $ | 11,357 | 26 | % | ||||||||||||||
Results of Operations – Lindblad Segment
Comparison of Years Ended December 31, 2019 to December 31, 2018
Tour Revenues
Tour revenues for the year ended December 31, 2019 increased $26.1 million, or 11%, to $272.4 million compared to $246.3 million for the year ended December 31, 2018. The increase was driven by higher guest ticket revenue primarily from an increase in Available Guest Nights due to the addition to our fleet of the National Geographic Venture in the fourth quarter of 2018. Additionally, Net Yield for the year ended December 31, 2019 increased to $1,050 compared to $1,044 for the year ended December 31, 2018, primarily driven by price increases and changes in itineraries. Occupancy of 91% was in line with a year ago as increased demand filled the additional capacity from the National Geographic Venture as we maintained a constant 91% occupancy rate for the years ended December 31, 2019 and 2018,
Operating Income
Operating income increased $6.4 million to $26.2 million for the year ended December 31, 2019 compared to $19.8 million for the year ended December 31, 2018. The increase was primarily driven by a full year of operations of the National Geographic Venture, as well as lower VAT expense and a decline in stock-based compensation expense, partially offset by higher selling and marketing expenditures, increased personnel costs, higher credit card fees associated with revenue growth and costs related to the warrant exchange.
Comparison of Years Ended December 31, 2018 to December 31, 2017
Tour Revenues
Tour revenues for the year ended December 31, 2018 increased $29.5 million, or 14%, to $246.3 million compared to $216.8 million for the year ended December 31, 2017. The increase was driven by higher guest ticket revenue primarily from an increase in Available Guest Nights due to the additions to our fleet of the National Geographic Quest in the third quarter of 2017 and the National Geographic Venture in the fourth quarter 2018. In addition, Net Yield for the year ended December 31, 2018 increased to $1,044 compared to $985 for the year ended December 31, 2017, primarily driven by price increases and changes in itineraries. Occupancy rates also increased for the year ended December 31, 2018 to 91% compared to 87% for the year ended December 31, 2017, reflecting higher demand across the fleet. 2017 results also included the impact of the cancellation of four highly booked voyages of the National Geographic Orion and two highly booked voyages of the National Geographic Sea Lion.
Operating Income
Operating income increased $12.5 million to $19.8 million for the year ended December 31, 2018 compared to $7.3 million for the year ended December 31, 2017. The increase was driven by higher tour revenues, partially offset by higher operating costs, primarily related to the full year of operations of the National Geographic Quest and the addition of the National Geographic Venture to the fleet in the fourth quarter 2018, as well as the impact of the cancelled voyages in 2017. Operating income for 2018 also benefited from lower stock-based compensation expense and executive severance costs.
Results of Operations – Natural Habitat Segment
Comparison of Years Ended December 31, 2019 to December 31, 2018
Tour Revenues
Tour revenues increased $7.3 million, or 11%, to $70.7 million compared to $63.4 million in 2018 primarily due to additional departures, increased travelers and itinerary changes that drove higher average pricing.
Operating Income
Operating income increased $1.5 million, or 26%, to $7.0 million in 2019 compared to $5.5 million in 2018 primarily due to the growth in tour revenues, partially offset by higher operating costs related to the additional departures, as well as increased personnel expenses and marketing costs to support future growth initiatives.
Comparison of Years Ended December 31, 2018 to December 31, 2017
Tour Revenues
Tour revenues increased $13.7 million, or 28%, to $63.4 million compared to $49.7 million in 2017 primarily due to additional departures and increased pricing.
Operating Income
Operating income increased $2.1 million, or 60%, to $5.5 million in 2018 compared to $3.5 million in 2017 primarily due to the growth in tour revenues, partially offset by higher operating costs related to the additional departures, as well as higher personnel and marketing costs to support future growth initiatives.
Adjusted EBITDA – Consolidated
The following table outlines the reconciliation to Net income and calculation of consolidated Adjusted EBITDA. The presentation of non-GAAP financial information should not be considered in isolation or as a substitute for, or superior to, the financial information prepared and presented in accordance with GAAP.
|
Reconciliation of Net Income to Adjusted EBITDA |
|
|
|
Consolidated |
|
For the years ended December 31, |
||||||||||||
|
(In thousands) |
2019 |
2018 |
2017 |
|||||||||
|
Net income (loss) |
$ | 18,748 | $ | 11,552 | $ | (7,529 | ) | |||||
|
Interest expense, net |
12,288 | 10,830 | 9,736 | |||||||||
|
Income tax expense |
2,190 | 616 | 10,002 | |||||||||
|
Depreciation and amortization |
25,769 | 20,768 | 17,351 | |||||||||
|
Loss (gain) on foreign currency |
(94 | ) | 2,175 | (1,144 | ) | |||||||
|
Gain on transfer of assets |
- | - | (454 | ) | ||||||||
|
Other expense |
66 | 165 | 133 | |||||||||
|
Stock-based compensation |
3,573 | 4,405 | 10,627 | |||||||||
|
National Geographic fee amortization |
2,907 | 2,907 | 2,907 | |||||||||
|
Warrant exchange and debt refinancing costs |
970 | 997 | - | |||||||||
|
Reorganization costs |
90 | 360 | 451 | |||||||||
|
Other (a) |
112 | 71 | 1,409 | |||||||||
|
Adjusted EBITDA |
$ | 66,619 | $ | 54,846 | $ | 43,489 | ||||||
__________
(a) Consists of expenses related to emergency search and rescue assistance and other non-recurring charges for 2019 and executive severance costs for 2018 and 2017.
The following tables outline the reconciliation for each segment from operating income to Adjusted EBITDA:
|
Reconciliation of Operating Income to Adjusted EBITDA |
|
|
|
Lindblad Segment |
|
For the years ended December 31, |
||||||||||||
|
(In thousands) |
2019 |
2018 |
2017 |
|||||||||
|
Operating income |
$ | 26,203 | $ | 19,798 | $ | 7,292 | ||||||
|
Depreciation and amortization |
24,116 | 19,277 | 15,969 | |||||||||
|
Stock-based compensation |
3,573 | 4,405 | 10,627 | |||||||||
|
National Geographic fee amortization |
2,907 | 2,907 | 2,907 | |||||||||
|
Warrant exchange and debt refinancing costs |
970 | 997 | - | |||||||||
|
Reorganization costs |
90 | 360 | 451 | |||||||||
|
Other (a) |
112 | 71 | 1,409 | |||||||||
|
Adjusted EBITDA |
$ | 57,971 | $ | 47,815 | $ | 38,655 | ||||||
__________
(a) Consists of expenses related to emergency search and rescue assistance and other non-recurring charges for 2019 and executive severance costs for 2018 and 2017.
|
Natural Habitat Segment |
|
For the years ended December 31, |
||||||||||||
|
(In thousands) |
2019 |
2018 |
2017 |
|||||||||
|
Operating income |
$ | 6,995 | $ | 5,540 | $ | 3,452 | ||||||
|
Depreciation and amortization |
1,653 | 1,491 | 1,382 | |||||||||
|
Adjusted EBITDA |
$ | 8,648 | $ | 7,031 | $ | 4,834 | ||||||
|
Guest Metrics |
|
Lindblad Segment |
The following tables set forth our Guest Metrics for the Lindblad segment. Please refer to our Description of Certain Line Items above for the specific definition by line item and segment. The presentation of non-GAAP financial information should not be considered in isolation or as a substitute for, or superior to, the financial information prepared and presented in accordance with GAAP.
|
For the years ended December 31, |
||||||||||||
|
2019 |
2018 |
2017 |
||||||||||
|
Available Guest Nights |
221,516 | 200,849 | 186,719 | |||||||||
|
Guest Nights Sold |
201,600 | 182,298 | 163,256 | |||||||||
|
Occupancy |
91 | % | 91 | % | 87 | % | ||||||
|
Maximum Guests |
27,831 | 25,449 | 22,805 | |||||||||
|
Number of Guests |
25,326 | 23,102 | 20,140 | |||||||||
|
Voyages |
351 | 330 | 308 | |||||||||
|
Calculation of Gross Yield and Net Yield |
For the years ended December 31, |
|||||||||||
|
(In thousands, except for Available Guest Nights, Gross and Net Yield) |
2019 |
2018 |
2017 |
|||||||||
|
Guest ticket revenues |
$ | 244,207 | $ | 220,841 | $ | 191,113 | ||||||
|
Other tour revenue |
28,203 | 25,493 | 25,702 | |||||||||
|
Tour Revenues |
272,410 | 246,334 | 216,815 | |||||||||
|
Less: Orion Insurance Proceeds (a) |
- | - | (2,273 | ) | ||||||||
|
Adjusted Tour Revenues |
272,410 | 246,334 | 214,542 | |||||||||
|
Less: Commissions |
(20,770 | ) | (19,521 | ) | (16,365 | ) | ||||||
|
Less: Other tour expenses |
(18,813 | ) | (17,106 | ) | (14,325 | ) | ||||||
|
Net Revenue |
$ | 232,827 | $ | 209,707 | $ | 183,852 | ||||||
|
Available Guest Nights |
221,516 | 200,849 | 186,719 | |||||||||
|
Gross Yield |
$ | 1,230 | $ | 1,226 | $ | 1,149 | ||||||
|
Net Yield |
1,051 | 1,044 | 985 | |||||||||
_________
(a) Insurance proceeds received related to the National Geographic Orion voyage cancellations from the first quarter 2017.
|
Calculation of Gross Cruise Cost and Net Cruise Cost |
For the years ended December 31, |
|||||||||||
|
(In thousands, except for Available Guest Nights, Gross and Net Cruise Cost per Avail. Guest Night) |
2019 |
2018 |
2017 |
|||||||||
|
Cost of tours |
$ | 125,343 | $ | 114,841 | $ | 105,044 | ||||||
|
Plus: Selling and marketing |
48,955 | 42,325 | 38,429 | |||||||||
|
Plus: General and administrative |
47,793 | 50,093 | 50,082 | |||||||||
|
Gross Cruise Cost |
222,091 | 207,259 | 193,555 | |||||||||
|
Less: Commissions |
(20,770 | ) | (19,521 | ) | (16,365 | ) | ||||||
|
Less: Other tour expenses |
(18,813 | ) | (17,106 | ) | (14,325 | ) | ||||||
|
Net Cruise Cost |
182,508 | 170,632 | 162,865 | |||||||||
|
Less: Fuel Expense |
(10,227 | ) | (9,228 | ) | (7,013 | ) | ||||||
|
Net Cruise Cost Excluding Fuel |
172,281 | 161,404 | 155,852 | |||||||||
|
Non-GAAP Adjustments: |
||||||||||||
|
Stock-based compensation |
(3,573 | ) | (4,405 | ) | (10,627 | ) | ||||||
|
National Geographic fee amortization |
(2,907 | ) | (2,907 | ) | (2,907 | ) | ||||||
|
Warrant exchange and debt refinancing costs |
(970 | ) | (997 | ) | - | |||||||
|
Reorganization costs |
(90 | ) | (360 | ) | (451 | ) | ||||||
|
Other (a) |
(112 | ) | (71 | ) | (1,409 | ) | ||||||
|
Adjusted Net Cruise Cost Excluding Fuel |
$ | 164,629 | $ | 152,664 | $ | 140,458 | ||||||
|
Adjusted Net Cruise Cost |
$ | 174,856 | $ | 161,892 | $ | 147,471 | ||||||
|
Available Guest Nights |
221,516 | 200,849 | 186,719 | |||||||||
|
Gross Cruise Cost per Available Guest Night |
$ | 1,003 | $ | 1,032 | $ | 1,037 | ||||||
|
Net Cruise Cost per Available Guest Night |
824 | 850 | 872 | |||||||||
|
Net Cruise Cost Excluding Fuel per Available Guest Night |
778 | 804 | 835 | |||||||||
|
Adjusted Net Cruise Cost Excluding Fuel per Available Guest Night |
743 | 760 | 752 | |||||||||
|
Adjusted Net Cruise Cost per Available Guest Night |
789 | 806 | 790 | |||||||||
__________
(a) Consists of expenses related to emergency search and rescue assistance and other non-recurring charges for 2019 and executive severance costs for 2018 and 2017.
Liquidity and Capital Resources
Sources and Uses of Cash for the Years Ended December 31, 2019, 2018 and 2017
Net cash provided by operating activities was $62.6 million in 2019 compared to $56.4 million in 2018. The $6.2 million increase was primarily due to improved operating results. Net cash provided by operating activities increased by $3.5 million in 2018 to $56.4 million from $52.9 million in 2017 primarily due to improved operating results.
Net cash used in investing activities was $100.1 million in 2019 compared to $54.3 million in 2018. The $45.7 million increase was mainly due to the $41.7 million increase in purchases of property and equipment in 2019, primarily related to spend on the two new polar ice-class vessels. Net cash used in investing activities was $54.3 million in 2018 compared to $80.5 million in 2017. The $26.2 million decrease was due to the $26.2 million decrease in purchases of property and equipment in 2018 primarily related to higher payments for the new-build vessels in 2017.
Net cash provided by financing activities was $24.6 million in 2019 compared to $16.5 million in 2018. The $8.1 million increase was primarily due to lower deferred financing fee payments in 2019, a reduction in stock and warrant repurchases in 2019 compared to 2018, including tax withholding on vested grants, and borrowings under a senior secured credit agreement associated with new builds, offset by the net proceeds from debt financing in 2018. The $29.9 million increase in cash provided by financing activities of $16.5 million in 2018 compared to net cash used in financing activities of $13.4 million in 2017 was primarily related to the net proceeds from refinancing the Company's long-term debt.
Contractual Obligations
As of December 31, 2019, our contractual obligations were as follows:
|
Payments due by period |
||||||||||||||||||||
|
(In thousands) |
Total |
2020 |
2021-2022 | 2023-2024 |
Thereafter |
|||||||||||||||
|
Operating Activities: |
||||||||||||||||||||
|
Operating lease obligations |
$ | 7,388 | $ | 1,335 | $ | 2,809 | $ | 2,652 | $ | 592 | ||||||||||
|
Charter commitments |
23,432 | 12,769 | 10,663 | - | - | |||||||||||||||
|
Investing Activities: |
||||||||||||||||||||
|
Purchase obligations - Fleet expansion |
200,850 | 138,644 | 62,206 | - | - | |||||||||||||||
|
Financing Activities: |
||||||||||||||||||||
|
Long-term debt obligations |
230,001 | 4,525 | 6,540 | 9,080 | 209,856 | |||||||||||||||
|
Interest on long-term debt |
70,110 | 11,943 | 27,970 | 25,389 | 4,808 | |||||||||||||||
|
Total |
$ | 531,781 | $ | 169,216 | $ | 110,188 | $ | 37,121 | $ | 215,256 | ||||||||||
Funding Sources and Needs
Debt Facilities
Credit Facility
On March 27, 2018, we entered into a Third Amended and Restated Credit Agreement (the “Amended Credit Agreement”), providing for a refinancing and amendment of the terms of our prior secured credit facility, dated as of March 7, 2016 (the “Superseded Agreement”). The Amended Credit Agreement provided for a $200.0 million senior secured first lien term loan facility (the “Term Facility”), which represented an increase of $25.0 million from the senior secured first lien term loan facility under the Superseded Agreement. The Term Facility matures March 27, 2025. The Amended Credit Agreement also provides for a $45.0 million senior secured incremental revolving credit facility (the “Revolving Facility”), which includes a $5.0 million letter of credit sub-facility. Our obligations under the Amended Credit Agreement remain secured by substantially all of our assets.
In connection with the Amended Credit Agreement, the Company capitalized $4.2 million in 2018 related to lender and third-party fees. In addition, the entry into the Amended Credit Agreement was considered a debt modification with a partial extinguishment, as a result the Company expensed $1.0 million of related costs during the year ended December 31, 2018.
Borrowings under the Term Facility bear interest at an adjusted Intercontinental Exchange (“ICE”) Benchmark administration LIBOR plus a spread of 3.25%, which stepped down from 3.50% during 2019 as our debt rating from Moody’s and S&P are both B1 (stable) or better and BB (negative) or better, respectively. The interest rate under the Term Facility at December 31, 2019 was 5.01%. Borrowings under the Revolving Facility will bear interest at an adjusted ICE Benchmark administration LIBOR plus a spread of 3.00%, or, at our option, an alternative base rate plus a spread of 2.00%. We are also required to pay a 0.5% annual commitment fee on undrawn amounts under the Revolving Credit Facility, which matures on March 27, 2023.
During the second quarter of 2018, we entered into interest rate cap agreements to hedge a portion of our exposure to interest rate movements and manage our interest rate expense related to the Term Facility.
The Amended Credit Agreement contains financial covenants that, among other things, (i) require us to maintain a total net leverage ratio (defined as on any date of determination, the ratio of total debt on such date, less up to $50.0 million of the unrestricted cash and cash equivalents to Adjusted EBITDA (as defined in the Amended Credit Agreement) for the trailing 12-month period) of 5.25 to 1.00 initially, with 0.25 equal reductions every two years thereafter until June 30, 2022 when the total net leverage ratio shall be 4.75 to 1.00 thereafter; (ii) limit the amount of indebtedness we may incur generally and specifically for intercompany debt, debt incurred to finance acquisitions and improvements, for capital and synthetic lease obligations, for standby letters of credit, and in connection with refinancing; (iii) limit the amount we may spend in connection with certain types of investments; and (iv) require the delivery of certain periodic financial statements and an operating budget. As of December 31, 2019, we were in compliance with the covenants.
Senior Secured Credit Agreements
On January 8, 2018, we entered into a senior secured credit agreement (the “Export Credit Agreement”) with Citibank, N.A., London Branch (“Citi”) and Eksportkreditt Norge AS (together with Citi, the “Lenders”). Pursuant to the Export Credit Agreement, the Lenders have agreed to make available to us, at our option and subject to certain conditions, a loan in an aggregate principal amount not to exceed $107.7 million for the purpose of providing financing for up to 80% of the purchase price of our new polar ice-class vessel, the National Geographic Endurance, scheduled for delivery in the first quarter of 2020. Seventy percent of the loan will be guaranteed by Garantiinstituttet for Eksportkreditt, the official export credit agency of Norway. If drawn upon, the loan will be made at the time of delivery of the vessel. At our election, the Export Credit Agreement will bear interest either at a fixed interest rate effectively equal to 5.78% or a floating interest rate equal to three-month LIBOR plus a margin of 3.00% per annum, 4.98% as of December 31, 2019. The loan will amortize quarterly based on a twelve-year profile, with 70% maturing over twelve years from drawdown, and 30% maturing over five years from drawdown.
On April 8, 2019, we entered into a senior secured credit agreement (the “Second Export Credit Agreement”) with the Lenders. Pursuant to the Second Export Credit Agreement, the Lenders have agreed to make available to us, at our option and subject to certain conditions, a loan in an aggregate principal amount not to exceed $122.8 million for the purpose of providing pre- and post- delivery financing for up to 80% of the purchase price of our new expedition ice-class cruise vessel, the National Geographic Resolution, scheduled to be delivered in the fourth quarter of 2021. 30% of the borrowing will mature over five years from drawdown, and 70% of the borrowing will mature over twelve years from drawdown. Additionally, 70% percent of the loan will be guaranteed by Garantiinstituttet for Eksportkreditt. We incurred approximately $2.3 million in financing fees related to the Second Export Agreement, recorded as deferred financing costs as part of long-term debt. During September 2019, we drew approximately $30.5 million against the Second Export Credit Agreement for the second contracted installment payment on the National Geographic Resolution. The Second Export Credit Agreement bears a variable interest rate equal to three-month LIBOR plus a margin of 3.00% per annum, or 4.98% as of December 31, 2019. After completion of the vessel, the Second Export Credit Agreement, at our option, will bear an interest rate of either a fixed rate of 6.36% or a variable rate equal to three-month LIBOR plus a margin of 3.00% per annum.
During March of 2019, we entered into foreign exchange forward contracts, designated as cash flow hedges, to hedge our exposure to the Norwegian Kroner (“NOK”), related to our installment payments under the contract to purchase the National Geographic Resolution.
The Export Credit Agreement and Second Export Credit Agreement contains financial covenants that, among other things, require us to maintain a total net leverage ratio (defined as on any date of determination, the ratio of total debt on such date, less up to $50.0 million of the unrestricted cash and cash equivalents to Adjusted EBITDA (as defined in the Export Credit Agreement) for the trailing 12-month period) of 5.25 to 1.00. As of December 31, 2019, we were in compliance with the covenants.
Funding Needs
Similar to others in the industry, we have historically operated with a meaningful working capital deficit. This deficit is mainly attributable to the fact that, under our business model, a vast majority of guest ticket receipts are collected in advance of the applicable expedition date. These advance passenger receipts remain a current liability until the expedition date and the cash generated from these advance receipts is used interchangeably with cash on hand from other cash from operations. The cash received as advanced receipts can be used to fund operating expenses for the applicable future expeditions or otherwise, pay down credit facilities, make long-term investments or any other use of cash. As of December 31, 2019 and 2018, we had a working capital deficit of $36.3 million and $9.3 million, respectively. As of December 31, 2019 and 2018, we had cash and cash equivalents, excluding restricted cash of $101.6 million and $113.4 million, respectively.
Our Board of Directors approved a stock and warrant repurchase plan (“Repurchase Plan”) in 2015 and increased the repurchase plan to $35.0 million in 2016. The Repurchase Plan authorizes us to purchase from time to time the Company’s outstanding common stock. Any shares purchased will be retired. The Repurchase Plan has no time deadline and will continue until otherwise modified or terminated at the sole discretion of our Board of Directors. These repurchases exclude shares repurchased to settle statutory employee tax withholding related to the exercise of stock options and vesting of stock awards. During the year ended December 31, 2019, we repurchased 1,895 shares of common stock for $23,000. As of December 31, 2019, we have cumulatively repurchased an aggregate of 866,701 shares of common stock for $8.2 million and 6,011,926 warrants for $14.7 million, since plan inception. All repurchases were made using cash resources. The balance for the Repurchase Plan was $12.1 million as of December 31, 2019.
In November 2017, we executed a contract to build a polar ice-class vessel, the National Geographic Endurance, scheduled for delivery in the first quarter of 2020, for a total purchase price of 1,066.0 million NOK. Subsequently, we exercised our right under the contract to make payments in United States Dollars, which resulted in a purchase price of $134.6 million, including hedging costs. The first twenty percent of the purchase price was paid shortly after execution of the Agreement with the remaining eighty percent due upon delivery and acceptance of the vessel. The remaining purchase price of the ship will be funded through a combination of available cash and borrowing under our Export Credit Agreement and our revolving credit facility.
In February 2019, we entered into an agreement with Ulstein Verft to construct a polar ice-class vessel, the National Geographic Resolution, a sister ship of the National Geographic Endurance, with a total purchase price of 1,291.0 million NOK, which was amended in December 2019 to (i) provide a $4 million loan to the builder, to be repaid at 112% of the principle balance on maturity in December 2023, and (ii) an expedited delivery incentive that, if the National Geographic Resolution is delivered early, as determined by the expedited delivery schedule per the agreement, that all or a portion of the of the loan will be considered as a delivery bonus and forgiven. The purchase price is due in installments, with the first 20% paid shortly after execution of the agreement, 50% being paid over the duration of the build and the final 30% due upon delivery and acceptance of the vessel. The vessel is scheduled to be delivered in the fourth quarter of 2021. The new-build process exposes us to certain risks typically associated with new ship construction which we manage through detailed planning and close monitoring by our internal marine team. As noted, during September 2019, we drew approximately $30.5 million against the Second Export Credit Agreement for the contracted installment payment on the National Geographic Resolution. The remaining purchase price will be funded through a combination of available cash, borrowing under our Second Export Credit Agreement and our Revolving Facility and excess cash flows generated by our existing operations.
As of December 31, 2019, we had $230.0 million in long-term debt obligations, including the current portion of long-term debt and excluding deferred financing costs. We believe that our cash on hand, our debt facilities (described above) and expected future operating cash inflows will be sufficient to fund operations, debt service requirements, capital expenditures for our newbuilds and other assets and acquisitions, and our Repurchase Plan. However, there can be no assurance that cash flows from operations will be available in the future to fund future obligations.
Critical Accounting Policies and Estimates
Our consolidated financial statements are prepared in accordance with accounting principles generally accepted in the United States of America, which require us to make estimates and assumptions that affect the reported amounts of assets and liabilities as of the date of the financial statements, the reported amounts of revenues and expenses during the reporting periods and the related disclosures in the consolidated financial statements and accompanying footnotes. Out of our significant accounting policies, which are described in Note 2 – Summary of Significant Accounting Policies of our consolidated financial statements included elsewhere in this Form 10-K, certain accounting policies are deemed “critical,” as they require management’s highest degree of judgment, estimates and assumptions. While management believes its judgments, estimates and assumptions are reasonable, they are based on information presently available and actual results may differ significantly from those estimates under different assumptions and conditions.
Ship Accounting
Ships, including ship improvements and ships under construction, are our most significant assets, comprising over 80% of our non-current assets at December 31, 2019. We make several critical accounting estimates with respect to our ship accounting. Given the very large and complex nature of our ships, our accounting estimates related to ships and determinations of ship improvement costs to be capitalized require considerable judgment and are inherently uncertain.
We have to estimate the useful life of each of our ships as well as their residual values. We account for ship improvement costs by capitalizing those costs we believe add value to our ships and have a useful life greater than one year and depreciate those improvements over its estimated remaining useful life. The costs of repairs and maintenance, including minor improvement costs and dry-dock expenses, are charged to expense as incurred.
If materially different conditions existed, or if we materially changed our assumptions of ship useful lives and residual values, our depreciation expense, loss on retirement of ship components and net book value of our ships would be materially different. In addition, if we change our assumptions in making our determinations as to whether improvements to a ship add value, the amounts we expense each year as repair and maintenance expense could increase, which would be partially offset by a decrease in depreciation expense, resulting from a reduction in capitalized costs. We believe we have made reasonable estimates for ship accounting purposes.
Stock-Based Compensation
We account for stock-based compensation issued to employees, non-employee directors or other service providers in accordance with Accounting Standards Codification 718, Compensation - Stock Compensation, that requires awards to be recorded at their fair value on the date of grant and amortized over the service period of the award. Stock-based compensation costs are recognized on a straight-line basis over the requisite service period of the award, which is generally the vesting term of the equity instrument issued.
Income Taxes
To measure deferred tax assets and liabilities, we provide a valuation allowance against deferred tax assets if, based upon the weight of available evidence, we do not believe it is “more-likely-than-not” that some or all of the deferred tax assets will be realized. We will continue to evaluate the deferred tax asset valuation allowance balances in all of our foreign and U.S. companies to determine the appropriate level of valuation allowances. While we believe that the amount of the recorded financial statement benefits and tax reserves reflect the more-likely-than-not criteria, it is possible that the ultimate outcome of current or future examinations may result in a reduction to the tax benefits previously recorded on our consolidated financial statements or may exceed the current income tax reserves in amounts that could be material.
Valuation of Long-Lived Assets
We review our long-lived assets, principally our vessels and operating rights, for impairment whenever events or changes in circumstances indicate that the carrying amounts of these assets may not be fully recoverable. Upon the occurrence of a triggering event, the assessment of possible impairment is based on our ability to recover the carrying value of our asset, which is determined by using the asset’s estimated undiscounted future cash flows. If these estimated undiscounted future cash flows are less than the carrying value of the asset, an impairment charge is recognized for the excess, if any, of the asset’s carrying value over its estimated fair value. A significant amount of judgment is required in estimating the future cash flows and fair values of our vessels and operating rights.
Off-Balance Sheet Arrangements
On January 8, 2018 and April 8, 2019, the Company entered into an Export Credit Agreement and a Second Export Credit Agreement, respectively, as described under our debt facilities above.
Future Application of Accounting Standards
Refer to Item 8 of this Annual Report Note 2 – Summary of Significant Accounting Policies for further information on Recent Accounting Pronouncements.
|
Item 7A. |
We are exposed to market risk in the normal course of our business. The primary exposure relates to the exchange rate fluctuations between our U.S. dollar functional reporting currency and other currencies. This exposure includes prepaid assets, newbuild contracted payments, charter commitments and current liabilities that are denominated in currencies other than our functional currency.
In addition, we have ship maintenance and construction contracts which are denominated in currencies other than the U.S. dollar. While we have entered into, and may, in the future, enter into, forward contracts and collar options to manage a portion of the currency risk associated with these contracts, we are, or may be, exposed to fluctuations in the exchange rates for the portions of the contracts that have not been hedged. Additionally, if a shipyard is unable to perform under such a contract, any foreign currency forward contracts that were entered into to manage the currency risk would need to be terminated.
Historically, we have not experienced significant fluctuations in fuel costs with changes in world fuel commodity prices, the specific geographies in which we operate and the cost of providing access to fuel in our remote destinations, and have not historically hedged our fuel purchases. Fuel costs represented 3.8%, 3.7% and 3.4% of our Lindblad segment tour revenues for the years ended December 31, 2019, 2018 and 2017, respectively.
We use currency exchange contracts to manage our exposure to changes in currency exchange rates associated with certain of our non-U.S. dollar denominated receivables and payables. We primarily hedge a portion of our current-year currency exposure to the Canadian and New Zealand dollars, the Brazilian Real, South African Rand, Indian Rupee, the Euro and the British pound sterling. The fluctuations in the value of these forward contracts largely offset the impact of changes in the value of the underlying risk they economically hedge.
We are exposed to market risk from changes in foreign currency of the Norwegian Kroner ("NOK"), due to NOK denominated agreement for the construction of our polar ice-class vessel, the National Geographic Resolution, and the foreign exchange forward contracts that we entered into and designated as a cash flow hedge for the purchase of the National Geographic Resolution, scheduled to be delivered in the fourth quarter of 2021.
As of December 31, 2019, we had foreign currency forward contracts to hedge our exposure to foreign currency exchange rate risk related to our ship construction contracts denominated in NOK. For the year ended December 31, 2019, we recorded a loss of approximately $5.1 million in other comprehensive income related to these foreign exchange derivatives. During the year ended December 31, 2019, we reclassified a loss of $1.6 million from other comprehensive income to a loss on foreign currency due to the maturity of a foreign exchange contract that was designated as a cash flow hedge. The strengthening of the NOK at December 31, 2019 by a hypothetical 10%, would result in an approximately $9.8 million gain being recorded in other comprehensive income. The weakening of the NOK at December 31, 2019 by a hypothetical 10%, would result in an approximately $8.0 million loss being recorded in other comprehensive income.
We are also exposed to market risk from changes in interest rates related to our variable rate debt. We assess our market risks based on changes in interest rates utilizing a sensitivity analysis that measures the potential impact on earnings and cash flows based on a hypothetical 1.0% change in interest rates.
As of December 31, 2019, we had interest rate cap agreements to hedge a portion of our exposure to interest rate movements of our variable rate debt and to manage our interest expense. The notional amount of outstanding debt associated with interest rate cap agreements as of December 31, 2019 was $100.0 million. Based on our December 31, 2019 outstanding un-hedged variable rate debt balance, a hypothetical 1.0% change in the six-month LIBOR interest rates would impact our annual interest expense by approximately $1.0 million.
|
Item 8. |
The consolidated financial statements and related financial statement schedules required under Item 8 are included beginning on page F-1 of this Report.
|
Item 9. |
Changes in and Disagreements with Accountants on Accounting and Financial Disclosure |
None.
|
Item 9A. |
Evaluation of Disclosure Controls and Procedures
Under the supervision and with the participation of our principal executive officer and principal financial officer, our management conducted an evaluation of the effectiveness of the design and operation of our disclosure controls and procedures. The term “disclosure controls and procedures,” as defined in Rules 13a-15(e) under the Securities Exchange Act of 1934, as amended, or the Exchange Act, means controls and other procedures of a company that are designed to ensure that information required to be disclosed in the reports that it files or submits under the Exchange Act is recorded, processed, summarized and reported, within the time periods specified in the rules and forms of the Securities and Exchange Commission (“SEC”). Disclosure controls and procedures include, without limitation, controls and procedures designed to ensure that information required to be disclosed by a company in the reports that it files or submits under the Exchange Act is accumulated and communicated to the company’s management, including its principal executive and principal financial officers, as appropriate to allow timely decisions regarding required disclosure.
Based on this evaluation, our Chief Executive Officer and Chief Financial Officer concluded that our disclosure controls and procedures were effective as of December 31, 2019.
Management’s Report on Internal Control over Financial Reporting
Our management is responsible for establishing and maintaining adequate internal control over financial reporting, as such term is defined in Exchange Act Rule 13a-15(f). Our internal control over financial reporting is a process designed to provide reasonable assurance regarding the reliability of financial reporting and the preparation of financial statements for external purposes in accordance with GAAP. Our internal control over financial reporting includes those policies and procedures that: (1) pertain to the maintenance of records that in reasonable detail accurately and fairly reflect our transactions and dispositions of our assets; (2) provide reasonable assurance that transactions are recorded as necessary to permit preparation of financial statements in accordance with GAAP and that our receipts and expenditures are being made only in accordance with authorizations of our management and our directors; and (3) provide reasonable assurance regarding prevention or timely detection of unauthorized acquisition, use or disposition of our assets that could have a material effect on the financial statements.
Because of its inherent limitations, internal control over financial reporting may not prevent or detect misstatements. Also, projections of any evaluation of effectiveness to future periods are subject to the risk that controls may become inadequate because of changes in conditions, or that the degree of compliance with the policies or procedures may deteriorate.
Our management, with the participation of our Chief Executive Officer and Chief Financial Officer, assessed the effectiveness of our internal control over financial reporting, as of December 31, 2019, using the criteria described in Internal Control-Integrated Framework (2013) issued by the Committee of Sponsoring Organizations of the Treadway Commission (COSO). Based on our evaluation under the updated internal control framework in Internal Control-Integrated Framework (2013), management concluded that our internal control over financial reporting was effective as of December 31, 2019.
Changes in Internal Control Over Financial Reporting
There was no change in the internal control over financial reporting that occurred during the period covered by this report that has materially affected, or is reasonably likely to materially affect, our internal control over financial reporting.
Inherent Limitations on Effectiveness of Controls
We do not expect that our disclosure controls and procedures or our internal controls will prevent all error and all fraud. A control system, no matter how well conceived and operated, can provide only reasonable, not absolute, assurance that the objectives of the control system are met. Because of the inherent limitations in all control systems, no evaluation of controls can provide absolute assurance that all control issues and instances of fraud, if any, within the company have been detected. These inherent limitations include the realities that judgments in decision-making can be faulty, and that breakdowns can occur because of a simple error or mistake. Additionally, controls can be circumvented by the individual acts of some persons, by collusion of two or more people, or by management override of the control. The design of any system of controls also is based in part upon certain assumptions about the likelihood of future events and there can be no assurance that any design will succeed in achieving its stated goals under all potential future conditions. Over time, controls may become inadequate because of changes in conditions, or the degree of compliance with the policies or procedures may deteriorate. Because of the inherent limitations in a cost-effective control system, misstatements due to error or fraud may occur and not be detected.
REPORT OF INDEPENDENT REGISTERED PUBLIC ACCOUNTING FIRM ON
INTERNAL CONTROL OVER FINANCIAL REPORTING
To the Shareholders and Board of Directors of
Lindblad Expeditions Holdings, Inc. and Subsidiaries
Opinion on Internal Control over Financial Reporting
We have audited Lindblad Expeditions Holdings, Inc. and Subsidiaries (the “Company”) internal control over financial reporting as of December 31, 2019, based on criteria established in Internal Control-Integrated Framework (2013) issued by the Committee of Sponsoring Organizations of the Treadway Commission. In our opinion, the Company maintained, in all material respects, effective internal control over financial reporting as of December 31, 2019, based on criteria established in Internal Control – Integrated Framework (2013) issued by the Committee of Sponsoring Organizations of the Treadway Commission.
We have also audited, in accordance with the standards of the Public Company Accounting Oversight Board (United States) (“PCAOB”), the consolidated balance sheets as of December 31, 2019 and 2018 and the related consolidated statements of operations, comprehensive income, stockholders’ equity, and cash flows and the related notes for each of the three years in the period ended December 31, 2019 of the Company, and our report dated February 26, 2020 expressed an unqualified opinion on those financial statements.
Basis for Opinion
The Company's management is responsible for maintaining effective internal control over financial reporting, and for its assessment of the effectiveness of internal control over financial reporting, included in the accompanying “Management Annual Report on Internal Control over Financial Reporting”. Our responsibility is to express an opinion on the Company's internal control over financial reporting based on our audit. We are a public accounting firm registered with the PCAOB and are required to be independent with respect to the Company in accordance with the U.S. federal securities laws and the applicable rules and regulations of the Securities and Exchange Commission and the PCAOB.
We conducted our audit in accordance with the standards of the PCAOB. Those standards require that we plan and perform the audit to obtain reasonable assurance about whether effective internal control over financial reporting was maintained in all material respects. Our audit of internal control over financial reporting included obtaining an understanding of internal control over financial reporting, assessing the risk that a material weakness exists, and testing and evaluating the design and operating effectiveness of internal control based on the assessed risk. Our audit also included performing such other procedures as we considered necessary in the circumstances. We believe that our audit provides a reasonable basis for our opinion.
Definition and Limitations of Internal Control over Financial Reporting
A company’s internal control over financial reporting is a process designed to provide reasonable assurance regarding the reliability of financial reporting and the preparation of financial statements for external purposes in accordance with generally accepted accounting principles. A company's internal control over financial reporting includes those policies and procedures that (1) pertain to the maintenance of records that, in reasonable detail, accurately and fairly reflect the transactions and dispositions of the assets of the company; (2) provide reasonable assurance that transactions are recorded as necessary to permit preparation of financial statements in accordance with generally accepted accounting principles, and that receipts and expenditures of the company are being made only in accordance with authorizations of management and directors of the company; and (3) provide reasonable assurance regarding prevention or timely detection of unauthorized acquisition, use, or disposition of the company’s assets that could have a material effect on the financial statements.
Because of the inherent limitations, internal control over financial reporting may not prevent or detect misstatements. Also, projections of any evaluation of effectiveness to future periods are subject to the risk that controls may become inadequate because of changes in conditions, or that degree of compliance with the policies or procedures may deteriorate.
/s/ Marcum LLP
Marcum llp
Melville, NY
February 26, 2020
|
Item 9B. |
None.
|
Item 10. |
Information concerning our executive officers, directors and corporate governance is incorporated herein by reference to our Definitive Proxy Statement to be filed with the Securities and Exchange Commission (“SEC”) within 120 days after the end of our fiscal year covered by this Form 10-K with respect to our 2020 Annual Meeting of Stockholders.
Code of Conduct and Ethics
We have adopted Codes of Business Conduct and Ethics that applies to our employees, including our principal executive officer, principal financial officer and persons performing similar functions, and our directors. Our codes of ethics and business conduct can be found posted in the investor relations sections on our website at http://investors.expeditions.com. None of the websites referenced in this Annual Report on or the information contained therein is incorporated herein by reference. Future material amendments or waivers relating to the Code of Ethics will be disclosed on our website referenced in this paragraph within four business days following the date of such amendment or waiver.
|
Item 11. |
Information is incorporated herein by reference to our Definitive Proxy Statement to be filed with the SEC within 120 days after the end of our fiscal year covered by this Form 10-K with respect to our 2020 Annual Meeting of Stockholders.
|
Item 12. |
Security Ownership of Certain Beneficial Owners and Management and Related Stockholder Matters |
Information is incorporated herein by reference to our Definitive Proxy Statement to be filed with the SEC within 120 days after the end of our fiscal year covered by this Form 10-K with respect to our 2020 Annual Meeting of Stockholders.
Securities Authorized for Issuance under Equity Compensation Plans
|
Plan category |
|
Number of securities |
|
|
Weighted |
|
|
Number of securities remaining |
|
|||
|
Equity compensation plans approved by security holders (1) |
|
|
757,467 |
|
|
$ |
11.31 |
|
|
|
1,309,783 |
(2) |
| Equity compensation plans not approved by security holders | N/A | N/A | N/A | |||||||||
__________
|
(1) |
Information is as of December 31, 2019. |
|
(2) |
Consists of shares available for issuance under our 2015 Long-Term Incentive Plan. |
|
Item 13. |
Certain Relationships and Related Transactions, and Director Independence |
Information is incorporated herein by reference to our Definitive Proxy Statement to be filed with the SEC within 120 days after the end of our fiscal year covered by this Form 10-K with respect to our 2020 Annual Meeting of Stockholders.
|
Item 14. |
Information is incorporated herein by reference to our Definitive Proxy Statement to be filed with the SEC within 120 days after the end of our fiscal year covered by this Form 10-K with respect to our 2020 Annual Meeting of Stockholders.
|
Item 15. |
|
|
(a) |
The following documents are filed as part of this Form 10-K or incorporated herein by reference: |
|
|
(1) |
Consolidated Financial Statements. |
See Index to Consolidated Financial Statements on page F-1.
|
|
(2) |
Financial Statement Schedules. |
None.
|
|
(3) |
Exhibits. |
The following exhibits are filed or incorporated by reference as part of this Form 10-K.
|
Number |
|
Description |
|
Included |
|
Form |
|
Filing Date |
|
|
|
|
|
|
|
|
|
|
|
3.1 |
|
|
By Reference |
|
DEFM 14-A |
|
June 24, 2015 |
|
|
3.2 |
|
|
By Reference |
|
S-1 |
|
February 15, 2011 |
|
|
4.1 |
|
|
By Reference |
|
8-K |
|
July 10, 2015 |
|
| 4.2 | Securities Registered Pursuant to Section 12. | Herewith | ||||||
|
10.1 |
|
|
By Reference |
|
8-K |
|
May 15, 2013 |
|
10.2 |
|
|
By Reference |
|
DEFM 14-A |
|
June 24, 2015 |
|
|
10.3 |
|
Non-Competition Agreement between Sven-Olof Lindblad and the Company. |
|
By Reference |
|
8-K |
|
July 10, 2015 |
|
10.4 |
|
|
By Reference |
|
8-K |
|
July 10, 2015 |
|
|
10.5 |
|
|
By Reference |
|
8-K |
|
July 10, 2015 |
|
|
10.6 |
|
|
By Reference |
|
8-K |
|
September 2, 2015 |
|
|
10.7 |
|
|
By Reference |
|
8-K |
|
July 10, 2015 |
|
|
10.8 |
|
|
By Reference |
|
8-K |
|
July 10, 2015 |
|
|
10.9 |
|
|
By Reference |
|
8-K |
|
July 10, 2015 |
|
|
10.10 |
|
|
By Reference |
|
8-K |
|
July 10, 2015 |
|
|
10.11 |
|
|
By Reference |
|
8-K |
|
July 10, 2015 |
|
|
10.12 |
|
|
By Reference |
|
8-K |
|
July 10, 2015 |
|
|
10.13 |
|
|
By Reference |
|
8-K |
|
October 30, 2015 |
|
Number |
|
Description |
|
Included |
|
Form |
|
Filing Date |
|
|
|
|
|
|
|
|
|
|
|
10.14 |
|
|
By Reference |
|
10-Q |
|
May 3, 2018 |
|
|
10.15 |
|
Form of Non-Employee Director Restricted Stock Award Agreement. |
|
By Reference |
|
10-K |
|
March 14, 2016 |
|
10.16 |
|
|
By Reference |
|
10-K |
|
March 14, 2016 |
|
|
10.17 |
|
|
By Reference |
|
DEF 14-A |
|
April 15, 2016 |
|
|
10.18 |
|
Employment Agreement by and between Lindblad Expeditions Holdings, Inc. and Philip Auerbach.* |
|
By Reference |
|
8-K |
|
May 3, 2016 |
|
10.19 |
|
|
By Reference |
|
8-K |
|
May 5, 2016 |
|
|
10.20 |
|
Employment Agreement by and between Lindblad Expeditions Holdings, Inc. and Craig Felenstein.* |
|
By Reference |
|
8-K |
|
July 27, 2016 |
|
10.21 |
|
Contribution Agreement by and between Lindblad Expeditions Holdings, Inc. and Sven-Olof Lindblad. |
|
By Reference |
|
10-Q |
|
August 8, 2016 |
|
10.22 |
|
Amendment No. 3 to Alliance and License Agreement with National Geographic. † |
|
By Reference |
|
10-K |
|
March 7, 2017 |
|
10.23 |
|
Amendment No. 4 to Alliance and License Agreement with National Geographic. † |
|
By Reference |
|
10-K |
|
March 2, 2018 |
|
10.24 |
|
Shipbuilding Contract between Ulstein Verft AS and Lindblad Maritime Enterprises, Ltd. † |
|
By Reference |
|
10-Q |
|
May 3, 2018 |
|
10.25 |
|
Lindblad Expeditions Holdings, Inc. Employee Incentive Plan. * |
|
By Reference |
|
8-K |
|
April 3, 2017 |
|
10.26 |
|
|
By Reference |
|
8-K |
|
April 3, 2017 |
|
|
10.27 |
|
|
By Reference |
|
8-K |
|
April 3, 2017 |
|
|
10.28 |
|
|
By Reference |
|
8-K |
|
September 6, 2018 |
|
|
10.29 |
|
|
By Reference |
|
10-Q |
|
May 3, 2018 |
|
|
10.30 |
|
Amendment No. 5 to Alliance and License Agreement with National Geographic. † |
|
By Reference |
|
10-K |
|
February 28, 2019 |
|
10.31 |
|
|
By Reference |
|
10-K |
|
February 28, 2019 |
|
|
10.32 |
By Reference |
10-Q |
May 2, 2019 |
|||||
|
10.33 |
By Reference |
10-Q |
May 2, 2019 |
|||||
|
10.34 |
Herewith |
|||||||
|
21.1 |
|
|
Herewith |
|
|
|
|
|
|
23.1 |
|
|
Herewith |
|
|
|
|
|
|
31.1 |
|
|
Herewith |
|
|
|
|
|
|
31.2 |
|
|
Herewith |
|
|
|
|
|
|
32.1 |
|
|
Herewith |
|
|
|
|
|
|
32.2 |
|
|
Herewith |
|
|
|
|
|
|
|
|
|
|
|
|
|
|
|
Number |
|
Description |
|
Included |
|
Form |
|
Filing Date |
|
|
|
|
|
|
|
|
|
|
|
101.INS |
|
XBRL Instance Document |
|
Herewith |
|
|
|
|
|
101.SCH |
|
XBRL Taxonomy Extension Schema |
|
Herewith |
|
|
|
|
|
101.CAL |
|
XBRL Taxonomy Extension Calculation Linkbase |
|
Herewith |
|
|
|
|
|
101.DEF |
|
XBRL Taxonomy Extension Definition Linkbase |
|
Herewith |
|
|
|
|
|
101.LAB |
|
XBRL Taxonomy Extension Label Linkbase |
|
Herewith |
|
|
|
|
|
101.PRE |
|
XBRL Taxonomy Extension Presentation Linkbase |
|
Herewith |
|
|
|
|
|
* |
Management compensatory agreement. |
|
† |
Certain portions of the exhibit have been omitted pursuant to Regulation S-K Item 601(b) because it is both (i) not material to investors and (ii) likely to cause competitive harm to the Company if publicly disclosed. |
Pursuant to the requirements of Section 13 or 15(d) of the Securities Exchange Act of 1934, as amended, the registrant has duly caused this Annual Report on Form 10-K to be signed on its behalf by the undersigned, thereunto duly authorized on February 26, 2020.
|
|
LINDBLAD EXPEDITIONS HOLDINGS, INC. |
|
|
|
(Registrant) |
|
|
|
|
|
|
|
By: |
/s/ Sven-Olof Lindblad |
|
|
|
Sven-Olof Lindblad |
|
|
|
Chief Executive Officer and President |
|
|
|
(Principal Executive Officer) |
Pursuant to the requirements of the Securities Exchange Act of 1934, as amended, this report has been signed below by the following persons on behalf of the registrant and in the capacities and on the dates indicated.
|
Signature |
|
Title |
|
Date |
|
|
|
|
|
|
|
/s/ Sven-Olof Lindblad |
|
Chief Executive Officer and Director |
|
February 26, 2020 |
|
Sven-Olof Lindblad |
|
(Principal Executive Officer) |
|
|
|
|
|
|
|
|
|
/s/ Craig I. Felenstein |
|
Chief Financial Officer |
|
February 26, 2020 |
|
Craig I. Felenstein |
|
(Principal Financial and Accounting Officer) |
|
|
|
|
|
|
|
|
|
/s/ Bernard W. Aronson |
|
Director |
|
February 26, 2020 |
|
Bernard W. Aronson |
|
|
|
|
|
|
|
|
|
|
|
/s/ Elliott Bisnow |
|
Director |
|
February 26, 2020 |
|
Elliott Bisnow |
|
|
|
|
|
|
|
|
|
|
|
/s/ L. Dyson Dryden |
|
Director |
|
February 26, 2020 |
|
L. Dyson Dryden |
|
|
|
|
|
|
|
|
|
|
|
/s/ Mark D. Ein |
|
Chairman of the Board |
|
February 26, 2020 |
|
Mark D. Ein |
|
|
|
|
|
|
|
|
|
|
|
/s/ Daniel J. Hanrahan |
|
Director |
|
February 26, 2020 |
|
Daniel J. Hanrahan |
|
|
|
|
|
|
|
|
|
|
|
/s/ John M. Fahey Jr. |
|
Director |
|
February 26, 2020 |
|
John M. Fahey Jr. |
|
|
|
|
|
|
|
|
|
|
|
/s/ Catherine B. Reynolds |
|
Director |
|
February 26, 2020 |
|
Catherine B. Reynolds |
|
|
|
|
LINDBLAD EXPEDITIONS HOLDINGS, INC.
INDEX TO CONSOLIDATED FINANCIAL STATEMENTS
REPORT OF INDEPENDENT REGISTERED PUBLIC ACCOUNTING FIRM
To the Shareholders and Board of Directors of
Lindblad Expeditions Holdings, Inc. and Subsidiaries
Opinion on the Financial Statements
We have audited the accompanying consolidated balance sheets of Lindblad Expeditions Holdings, Inc. and Subsidiaries (the “Company”) as of December 31, 2019 and 2018, the related consolidated statements of operations, comprehensive income (loss), stockholders’ equity and cash flows for each of the three years in the period ended December 31, 2019, and the related notes (collectively referred to as the “financial statements”). In our opinion, the financial statements present fairly, in all material respects, the financial position of the Company as of December 31, 2019 and 2018 and the results of its operations and its cash flows for each of the three years in the period ended December 31, 2019, in conformity with accounting principles generally accepted in the United States of America.
We also have audited, in accordance with the standards of the Public Company Accounting Oversight Board (United States) ("PCAOB"), the Company's internal control over financial reporting as of December 31, 2019, based on the criteria established in Internal Control - Integrated Framework issued by the Committee of Sponsoring Organizations of the Treadway Commission (COSO) in 2013 and our report dated February 26, 2020, expressed an unqualified opinion on the effectiveness of the Company’s internal control over financial reporting.
Basis for Opinion
These financial statements are the responsibility of the Company's management. Our responsibility is to express an opinion on the Company's financial statements based on our audits. We are a public accounting firm registered with the PCAOB and are required to be independent with respect to the Company in accordance with the U.S. federal securities laws and the applicable rules and regulations of the Securities and Exchange Commission and the PCAOB.
We conducted our audits in accordance with the standards of the PCAOB. Those standards require that we plan and perform the audits to obtain reasonable assurance about whether the financial statements are free of material misstatement, whether due to error or fraud. Our audits included performing procedures to assess the risks of material misstatement of the financial statements, whether due to error or fraud, and performing procedures that respond to those risks. Such procedures included examining, on a test basis, evidence regarding the amounts and disclosures in the financial statements. Our audits also included evaluating the accounting principles used and significant estimates made by management, as well as evaluating the overall presentation of the financial statements. We believe that our audits provide a reasonable basis for our opinion.
Adoption of New Accounting Standards
ASU No. 2016-02
As discussed in Note 2 to the consolidated financial statements, the Company changed its method of accounting for leases in 2019 due to the adoption of ASU No. 2016-02, Leases (Topic 842), as amended, effective January 1, 2019, using the modified retrospective approach.
/s/ Marcum llp
Marcum llp
We have served as the Company’s auditor since 2015.
Melville, NY
February 26, 2020
LINDBLAD EXPEDITIONS HOLDINGS, INC. AND SUBSIDIARIES
(In thousands, except share and per share data)
|
As of December 31, |
||||||||
|
2019 |
2018 |
|||||||
|
ASSETS |
||||||||
|
Current Assets: |
||||||||
|
Cash and cash equivalents |
$ | 101,579 | $ | 113,396 | ||||
|
Restricted cash |
7,679 | 8,755 | ||||||
|
Marine operating supplies |
6,299 | 5,165 | ||||||
|
Inventories |
2,027 | 1,604 | ||||||
|
Prepaid expenses and other current assets |
29,055 | 21,263 | ||||||
|
Total current assets |
146,639 | 150,183 | ||||||
|
Property and equipment, net |
357,790 | 285,979 | ||||||
|
Goodwill |
22,105 | 22,105 | ||||||
|
Intangibles, net |
6,396 | 7,975 | ||||||
| Deferred tax asset | 218 | - | ||||||
|
Right-to-use lease assets |
6,105 | - | ||||||
|
Other long-term assets |
9,405 | 7,167 | ||||||
|
Total assets |
$ | 548,658 | $ | 473,409 | ||||
|
LIABILITIES |
||||||||
|
Current Liabilities: |
||||||||
|
Unearned passenger revenues |
$ | 138,825 | $ | 123,489 | ||||
|
Accounts payable and accrued expenses |
38,231 | 33,944 | ||||||
|
Lease liabilities - current |
1,335 | - | ||||||
|
Long-term debt - current |
4,525 | 2,000 | ||||||
|
Total current liabilities |
182,916 | 159,433 | ||||||
|
Long-term debt, less current portion |
213,543 | 188,089 | ||||||
|
Deferred tax liabilities |
4,491 | 2,787 | ||||||
|
Lease liabilities |
5,029 | - | ||||||
|
Other long-term liabilities |
3,317 | 554 | ||||||
|
Total liabilities |
409,296 | 350,863 | ||||||
|
COMMITMENTS AND CONTINGENCIES |
||||||||
|
REDEEMABLE NONCONTROLLING INTEREST |
16,112 | 6,502 | ||||||
|
STOCKHOLDERS’ EQUITY |
||||||||
|
Preferred stock, $0.0001 par value, 1,000,000 shares authorized; no shares issued and outstanding |
- | - | ||||||
|
Common stock, $0.0001 par value, 200,000,000 shares authorized; 49,717,522 and 45,814,925 issued, 49,626,498 and 45,442,728 outstanding as of December 31, 2019 and December 31, 2018, respectively |
5 | 5 | ||||||
|
Additional paid-in capital |
46,271 | 41,539 | ||||||
|
Retained earnings |
81,655 | 75,171 | ||||||
|
Accumulated other comprehensive loss |
(4,681 | ) | (671 | ) | ||||
|
Total stockholders' equity |
123,250 | 116,044 | ||||||
|
Total liabilities, stockholders' equity and redeemable noncontrolling interest |
$ | 548,658 | $ | 473,409 | ||||
The accompanying notes are an integral part of these consolidated financial statements.
LINDBLAD EXPEDITIONS HOLDINGS, INC. AND SUBSIDIARIES
Consolidated Statements of Operations
(In thousands, except share and per share data)
|
For the years ended December 31, |
||||||||||||
|
2019 |
2018 |
2017 |
||||||||||
|
Tour revenues |
$ | 343,091 | $ | 309,734 | $ | 266,504 | ||||||
|
Operating expenses: |
||||||||||||
|
Cost of tours |
166,608 | 153,743 | 135,526 | |||||||||
|
General and administrative |
62,744 | 62,898 | 60,529 | |||||||||
|
Selling and marketing |
54,772 | 46,987 | 42,354 | |||||||||
|
Depreciation and amortization |
25,769 | 20,768 | 17,351 | |||||||||
|
Total operating expenses |
309,893 | 284,396 | 255,760 | |||||||||
|
Operating income |
33,198 | 25,338 | 10,744 | |||||||||
|
Other (expense) income: |
||||||||||||
|
Interest expense, net |
(12,288 | ) | (10,830 | ) | (9,736 | ) | ||||||
|
Gain (loss) on foreign currency |
94 | (2,175 | ) | 1,144 | ||||||||
|
Other expense |
(66 | ) | (165 | ) | (133 | ) | ||||||
|
Gain on transfer of assets |
- | - | 454 | |||||||||
|
Total other expense |
(12,260 | ) | (13,170 | ) | (8,271 | ) | ||||||
|
Income before income taxes |
20,938 | 12,168 | 2,473 | |||||||||
|
Income tax expense |
2,190 | 616 | 10,002 | |||||||||
|
Net income (loss) |
18,748 | 11,552 | (7,529 | ) | ||||||||
|
Net income attributable to noncontrolling interest |
2,395 | 200 | 1,132 | |||||||||
|
Net income (loss) attributable to Lindblad Expeditions Holdings, Inc. |
16,353 | 11,352 | (8,661 | ) | ||||||||
|
Non-cash deemed dividend to warrant holders |
2,654 | - | - | |||||||||
|
Net income (loss) available to common stockholders |
$ | 13,699 | $ | 11,352 | $ | (8,661 | ) | |||||
|
Weighted average shares outstanding |
||||||||||||
|
Basic |
47,440,788 | 45,378,188 | 44,576,912 | |||||||||
|
Diluted |
49,426,563 | 46,340,054 | 44,576,912 | |||||||||
|
Net income (loss) per share available to common stockholders |
||||||||||||
|
Basic |
$ | 0.29 | $ | 0.25 | $ | (0.19 | ) | |||||
|
Diluted |
$ | 0.28 | $ | 0.24 | $ | (0.19 | ) | |||||
The accompanying notes are an integral part of these consolidated financial statements.
|
LINDBLAD EXPEDITIONS HOLDINGS, INC. AND SUBSIDIARIES |
|
(In thousands) |
|
For the years ended December 31, |
||||||||||||
|
2019 |
2018 |
2017 |
||||||||||
|
Net income (loss) |
$ | 18,748 | $ | 11,552 | $ | (7,529 | ) | |||||
|
Other comprehensive income: |
||||||||||||
|
Cash flow hedges: |
||||||||||||
|
Net unrealized (loss) gain |
(5,634 | ) | (671 | ) | - | |||||||
|
Reclassification adjustment, net of tax |
1,624 | - | - | |||||||||
|
Total other comprehensive (loss) income |
(4,010 | ) | (671 | ) | - | |||||||
|
Total comprehensive income (loss) |
14,738 | 10,881 | (7,529 | ) | ||||||||
|
Less: comprehensive income attributive to non-controlling interest |
2,395 | 200 | 1,132 | |||||||||
|
Comprehensive income (loss) attributable to common shareholders |
$ | 12,343 | $ | 10,681 | $ | (8,661 | ) | |||||
The accompanying notes are an integral part of these consolidated financial statements.
|
LINDBLAD EXPEDITIONS HOLDINGS, INC. AND SUBSIDIARIES |
|
(In thousands, except share data) |
|
Common Stock |
Additional Paid-In |
Retained |
Accumulated Other Comprehensive |
Total Stockholders' |
||||||||||||||||||||
|
Shares |
Amount |
Capital |
Earnings |
Loss |
Equity |
|||||||||||||||||||
|
Balance as of December 31, 2016 |
45,659,762 | $ | 5 | $ | 43,097 | $ | 70,707 | $ | - | $ | 113,809 | |||||||||||||
|
Stock-based compensation |
- | - | 10,627 | - | - | 10,627 | ||||||||||||||||||
|
Issuance of stock for equity compensation plans, net |
314,326 | - | (5,034 | ) | - | - | (5,034 | ) | ||||||||||||||||
|
Repurchase of shares and warrants |
(547,058 | ) | - | (6,192 | ) | - | - | (6,192 | ) | |||||||||||||||
|
Cumulative effect of change in accounting principle |
- | - | - | 1,773 | - | 1,773 | ||||||||||||||||||
|
Net loss attributable to Lindblad Expeditions Holdings, Inc. |
- | - | - | (8,661 | ) | - | (8,661 | ) | ||||||||||||||||
|
Balance as of December 31, 2017 |
45,427,030 | 5 | 42,498 | 63,819 | - | 106,322 | ||||||||||||||||||
|
Stock-based compensation |
- | - | 4,405 | - | - | 4,405 | ||||||||||||||||||
|
Issuance of stock for equity compensation plans, net |
396,925 | - | (4,510 | ) | - | - | (4,510 | ) | ||||||||||||||||
|
Repurchase of shares and warrants |
(9,030 | ) | - | (854 | ) | - | - | (854 | ) | |||||||||||||||
|
Other comprehensive loss, net |
- | - | - | - | (671 | ) | (671 | ) | ||||||||||||||||
|
Net income attributable to Lindblad Expeditions Holdings, Inc. |
- | - | - | 11,352 | - | 11,352 | ||||||||||||||||||
|
Balance as of December 31, 2018 |
45,814,925 | 5 | 41,539 | 75,171 | (671 | ) | 116,044 | |||||||||||||||||
|
Stock-based compensation |
- | - | 3,573 | - | - | 3,573 | ||||||||||||||||||
|
Issuance of stock for equity compensation plans, net |
6,241 | - | (1,786 | ) | - | - | (1,786 | ) | ||||||||||||||||
|
Repurchase of shares and warrants |
(1,895 | ) | - | (23 | ) | - | - | (23 | ) | |||||||||||||||
|
Warrants |
3,898,251 | - | 2,968 | (2,654 | ) | - | 314 | |||||||||||||||||
|
Other comprehensive loss, net |
- | - | - | - | (4,010 | ) | (4,010 | ) | ||||||||||||||||
| Redeemable noncontrolling interest | - | - | - | (7,215 | ) | - | (7,215 | ) | ||||||||||||||||
|
Net income attributable to Lindblad Expeditions Holdings, Inc. |
- | - | - | 16,353 | - | 16,353 | ||||||||||||||||||
|
Balance as of December 31, 2019 |
49,717,522 | $ | 5 | $ | 46,271 | $ | 81,655 | $ | (4,681 | ) | $ | 123,250 | ||||||||||||
The accompanying notes are an integral part of these consolidated financial statements.
LINDBLAD EXPEDITIONS HOLDINGS, INC. AND SUBSIDIARIES
Consolidated Statements of Cash Flows
(In thousands)
|
For the years ended December 31, |
||||||||||||
|
2019 |
2018 |
2017 |
||||||||||
|
Cash Flows From Operating Activities |
||||||||||||
|
Net income (loss) |
$ | 18,748 | $ | 11,552 | $ | (7,529 | ) | |||||
|
Adjustments to reconcile net income to net cash provided by operating activities: |
||||||||||||
|
Depreciation and amortization |
25,769 | 20,768 | 17,351 | |||||||||
|
Amortization of National Geographic fee |
2,907 | 2,907 | 2,907 | |||||||||
|
Amortization of deferred financing costs and other, net |
1,875 | 1,909 | 2,226 | |||||||||
|
Amortization of right-to-use lease assets |
95 | - | - | |||||||||
|
Stock-based compensation |
3,573 | 4,405 | 10,627 | |||||||||
|
Deferred income taxes |
1,486 | 343 | 8,336 | |||||||||
|
(Gain) loss on foreign currency |
(94 | ) | 2,175 | (1,144 | ) | |||||||
|
Write-off of unamortized issuance costs related to debt refinancing |
- | 359 | - | |||||||||
|
Loss on write-off of assets |
- | 129 | - | |||||||||
|
Changes in operating assets and liabilities |
||||||||||||
|
Marine operating supplies and inventories |
(1,557 | ) | 70 | (1,036 | ) | |||||||
|
Prepaid expenses and other current assets |
(8,250 | ) | (716 | ) | 575 | |||||||
|
Lease liabilities |
164 | - | - | |||||||||
|
Unearned passenger revenues |
15,336 | 11,134 | 20,709 | |||||||||
|
Other long-term assets |
(5,071 | ) | (698 | ) | 136 | |||||||
|
Other long-term liabilities |
2,764 | (129 | ) | 3 | ||||||||
|
Accounts payable and accrued expenses |
4,838 | 2,149 | (243 | ) | ||||||||
|
Net cash provided by operating activities |
62,583 | 56,357 | 52,918 | |||||||||
|
Cash Flows From Investing Activities |
||||||||||||
|
Purchases of property and equipment |
(96,002 | ) | (54,345 | ) | (80,485 | ) | ||||||
|
Loan issuance |
(4,083 | ) | - | - | ||||||||
|
Net cash used in investing activities |
(100,085 | ) | (54,345 | ) | (80,485 | ) | ||||||
|
Cash Flows From Financing Activities |
||||||||||||
|
Proceeds from long-term debt |
30,476 | 200,000 | - | |||||||||
|
Repayments of long-term debt |
(2,000 | ) | (171,625 | ) | (1,750 | ) | ||||||
|
Payment of deferred financing costs |
(2,372 | ) | (6,490 | ) | (418 | ) | ||||||
|
Repurchase under stock-based compensation plans and related tax impacts |
(1,786 | ) | (4,510 | ) | (5,034 | ) | ||||||
|
Warrants exercised |
314 | - | - | |||||||||
|
Repurchase of warrants and common stock |
(23 | ) | (854 | ) | (6,192 | ) | ||||||
|
Net cash provided by (used in) financing activities |
24,609 | 16,521 | (13,394 | ) | ||||||||
|
Effect of exchange rate changes on cash |
- | 118 | 30 | |||||||||
|
Net (decrease) increase in cash, cash equivalents and restricted cash |
(12,893 | ) | 18,651 | (40,931 | ) | |||||||
|
Cash, cash equivalents and restricted cash at beginning of period |
122,151 | 103,500 | 144,431 | |||||||||
|
Cash, cash equivalents and restricted cash at end of period |
$ | 109,258 | $ | 122,151 | $ | 103,500 | ||||||
|
Supplemental disclosures of cash flow information: |
||||||||||||
|
Cash paid during the period: |
||||||||||||
|
Interest |
$ | 14,330 | $ | 13,391 | $ | 10,478 | ||||||
|
Income taxes |
$ | 1,171 | $ | 522 | $ | 965 | ||||||
|
Non-cash investing and financing activities: |
||||||||||||
|
Additional paid-in capital exercise proceeds of option shares |
$ | 225 | $ | 1,682 | $ | 1,682 | ||||||
|
Additional paid-in capital exchange proceeds used for option shares |
$ | (225 | ) | $ | (1,682 | ) | $ | (1,682 | ) | |||
|
Non-cash deemed dividend to warrant holders |
$ | 2,654 | $ | - | $ | - | ||||||
The accompanying notes are an integral part of these consolidated financial statements.
Lindblad Expeditions Holdings, Inc.
Notes to the Consolidated Financial Statements
NOTE 1 – BUSINESS
Organization
Lindblad Expeditions Holdings, Inc. and its consolidated subsidiaries (the “Company” or “Lindblad”) currently operate a fleet of eight owned expedition ships and five seasonal charter vessels under the Lindblad brand and provide eco-conscious expeditions and nature focused, small-group tours under the Natural Habitat, Inc. (“Natural Habitat”) brand.
The Company operates the following reportable business segments:
Lindblad – primarily provides ship-based expeditions aboard customized, nimble and intimately-scaled vessels that are able to venture where larger cruise ships cannot, thus allowing Lindblad to offer up-close experiences in the planet’s wild and remote places and capitals of culture. Many of these expeditions involve travel to remote places with limited infrastructure and ports, such as Antarctica and the Arctic, or places that are best accessed by a ship, such as the Galápagos Islands, Alaska, Baja’s Sea of Cortez, Costa Rica and Panama, and foster active engagement by guests. Each expedition ship is designed with comfortable and inviting accommodations, while being fully equipped with state-of-the-art tools for in-depth exploration. The Company has an alliance with National Geographic Partners, LLC (“National Geographic”), which provides for lecturers and National Geographic experts, including photographers, writers, marine biologists, naturalists, field researchers and film crews, to join many of the Company’s expeditions.
Natural Habitat – primarily specializes in land-based nature adventure travel expeditions around the globe, as well as select itineraries on small chartered vessels for parts of the year, with unique itineraries designed to offer intimate encounters with nature and our planet's wild destinations and the animals and people who live there. Natural Habitat creates opportunities for adventure and discovery that transform lives with expeditions that include polar bear tours in Churchill, Canada, Alaskan grizzly bear adventures, small-group Galápagos tours and African safaris. Natural Habitat has partnered with World Wildlife Fund (“WWF”) to offer conservation travel, which is sustainable travel that contributes to the protection of nature and wildlife.
NOTE 2 – SUMMARY OF SIGNIFICANT ACCOUNTING POLICIES
Basis of Presentation
The consolidated financial statements include the accounts of Lindblad Expeditions Holdings, Inc. and its consolidated subsidiaries, after elimination of all intercompany accounts and transactions. The consolidated financial statements and accompanying footnotes have been prepared in accordance with accounting principles generally accepted in the United States of America (“U.S. GAAP”) and applicable rules and regulations of the Securities and Exchange Commission (the “SEC”).
The presentation of certain prior year items in the notes to the consolidated financial statements of the Company have been reclassified to conform to the 2019 presentation. The reclassifications had no effect on previously reported results of operations or retained earnings.
Use of Estimates
The preparation of consolidated financial statements requires management to make estimates and assumptions that affect the reported amounts of assets and liabilities and the disclosure of contingent assets, liabilities, revenues and expenses. Actual results could differ from such estimates. Management estimates include determining the estimated lives of long-lived assets, determining the fair value of assets acquired and liabilities assumed in business combinations, the fair value of the Company’s common stock, the valuation of securities underlying stock-based compensation, income tax expense, the valuation of deferred tax assets and liabilities, the fair value of derivative instruments, the value of contingent consideration and assessing its litigation, other legal claims and contingencies. Estimates and assumptions are reviewed periodically and the effects of revisions are reflected in the consolidated financial statements in the period that they are determined to be necessary.
Revenue Recognition
Revenues are measured based on consideration specified in the Company’s contracts with guests and are recognized as the related performance obligations are satisfied. The majority of the Company’s revenues are derived from guest ticket contracts which are reported as tour revenues in the consolidated statements of operations. The Company’s primary performance obligation under these contracts is to provide an expedition and may include pre- and post-expedition excursions, hotel accommodations, land-based expeditions and air transportation to and from the ships. Upon satisfaction of the Company’s primary performance obligation, revenue is recognized over the duration of each expedition.
Tour revenues also include revenues from the sale of goods and services onboard our ships, cancellation fees and trip insurance. Revenues from the sale of goods and services rendered onboard are recognized upon purchase. Guest cancellation fees are recognized as tour revenues at the time of the cancellation. The Company records a liability for estimated trip insurance claims based on the Company’s claims history. Proceeds received from trip insurance premiums in excess of this liability are recorded as revenue in the period in which they are received.
For the years ended December 31, 2019, 2018 and 2017, approximately 91%, 90% and 90%, respectively, of revenues were generated from guests in the United States. No single or group of customers account for a significant amount of revenues. The Company sources its guest bookings through a combination of direct selling and various agency networks and alliances. The following table disaggregates tour revenues by the sales channel it was derived from:
|
For the years ended December 31, |
||||||||||||
|
2019 |
2018 |
2017 |
||||||||||
|
Guest ticket revenue: |
||||||||||||
|
Direct |
45 | % | 45 | % | 45 | % | ||||||
|
National Geographic |
17 | % | 19 | % | 19 | % | ||||||
|
Agencies |
23 | % | 23 | % | 22 | % | ||||||
|
Affinity |
6 | % | 4 | % | 4 | % | ||||||
|
Guest ticket revenue |
91 | % | 91 | % | 90 | % | ||||||
|
Other tour revenue |
9 | % | 9 | % | 10 | % | ||||||
|
Tour revenues |
100 | % | 100 | % | 100 | % | ||||||
Customer Deposits and Contract Liabilities
The Company’s guests remit deposits in advance of tour embarkation. Guest deposits consist of guest ticket revenues as well as revenues from the sale of pre- and post-expedition excursions, hotel accommodations, land-based expeditions and air transportation to and from the ships. Guest deposits represent unearned revenues and are reported as unearned passenger revenues in the consolidated balance sheet when received and are subsequently recognized as tour revenue over the duration of the expedition. Accounting Standards Codification ("ASC"), Revenue from Contracts with Customers (Topic 606) defines a “contract liability” as an entity’s obligation to transfer goods or services to a customer for which the entity has received consideration from the customer. The Company does not consider guest deposits to be a contract liability until the guest no longer has the right, resulting from the passage of time, to cancel their reservation and receive a full refund. All of our contract liabilities as of December 31, 2018 were recognized and reported within tour revenues in our consolidated statement of operations for the year ended December 31, 2019.
The change in contract liabilities within unearned passenger revenues presented in the Company's consolidated balance sheets are as follows:
|
Contract Liabilities |
||||
|
(In thousands) |
||||
|
Balance as of January 1, 2019 |
$ | 70,903 | ||
|
Recognized in tour revenues during the period |
(263,767 | ) | ||
|
Additional contract liabilities in period |
264,915 | |||
|
Balance as of December 31, 2019 |
$ | 72,051 | ||
Cost of Tours
Cost of tours represents the direct costs associated with revenues during expeditions, including costs of pre- or post-expedition excursions, hotel accommodations, land-based expeditions, air and other transportation expenses and costs of goods and services rendered onboard, payroll and related expenses for shipboard and expedition personnel, food costs for guests and crew, fuel and related costs and other expenses such as land costs, port costs, repairs and maintenance, equipment expense, drydock, ship insurance and charter hire expenses.
Insurance
The Company maintains insurance to cover a number of risks including illness and injury to crew, guest injuries, pollution, other third-party claims in connections with its tour expedition activities, damages to hull and machinery for each of its vessels, war risks, workers’ compensation, employee health, directors’ and officers’ liability, property damages and general liabilities for third-party claims. The Company recognizes insurance recoverable from third-party insurers for incurred expenses at the time the recovery is probable and upon realization for amounts in excess of incurred expenses. All of the Company’s insurance policies are subject to coverage limits, exclusions and deductible levels.
As of December 31, 2019 and 2018, the Company self-insured for medical insurance claims up to $125,000. In addition, as of December 31, 2019 and 2018, the Company maintained Stop Loss coverage for medical claims in excess of the $125,000, which had an aggregate deductible of $57,500. As of December 31, 2019 and 2018, the Company recorded a liability for Incurred-But-Not-Recorded (“IBNR”) medical claims, which was determined based on claims experience over the prior four years.
The Company also extends cancellation insurance to guests. The Company uses an insurance company to manage passenger insurance purchased to cover a variety of insurable losses including cancellations, interruption, missed connections, travel delays, accidental death and dismemberment, medical coverage and baggage issues. In certain instances, the Company is self-insured for the claims only which cover cancellations, interruption, missed connections and travel delays. The required reserve was determined based on claims experience. While the Company believes its estimated IBNR and accrued claims reserves are adequate, the ultimate losses may differ from its estimates.
The Company participates in a traditional marine industry reinsurance solution for liability exposure through their Protection and Indemnity (“P&I Club”) Reinsurers, which are similar to mutual marine P&I Club’s that jointly and severally indemnify each other to provide discounted primary and excess Protection and Indemnity coverage to club members. The resulting aggregated surplus of the clubs combines to provide the Company with below market primary and high excess liability coverage for covered losses. For consideration of long-term below market Protection and Indemnity rates, the joint and several liability obligation requires the down-stream indemnification by their members, including the Company.
General and Administrative Expense
General and administrative expenses primarily represent the costs of our shore-side vessel support, reservations and other administrative functions, and includes salaries and related benefits, professional fees and occupancy costs.
Selling and Marketing Expense
Selling and marketing expenses include commissions, royalties and a broad range of advertising and marketing expenses. These include advertising costs of direct mail, email, digital media, traditional media, travel agencies and brand websites, as well as costs associated with website development and maintenance, social media and corporate sponsorship costs. Advertising is charged to expense as incurred. Advertising expenses totaled $22.4 million, $16.9 million and $16.4 million for the years ended December 31, 2019, 2018 and 2017, respectively. The largest component of advertising expense was direct mail, which totaled $6.0 million, $5.4 million and $6.3 million for the years ended December 31, 2019, 2018 and 2017, respectively.
Cash and Cash Equivalents
The Company considers all highly liquid instruments with an original maturity of six months or less, as well as deposits in financial institutions, to be cash and cash equivalents. The following table provides a reconciliation of cash, cash equivalents, and restricted cash reported within the statement of financial position that sum to the total of the same such amounts shown in the statement of cash flows:
|
For the years ended December 31, |
||||||||||||
|
2019 |
2018 |
2017 |
||||||||||
|
(In thousands) |
||||||||||||
|
Cash and cash equivalents |
$ | 101,579 | $ | 113,396 | $ | 96,443 | ||||||
|
Restricted cash |
7,679 | 8,755 | 7,057 | |||||||||
|
Total cash, cash equivalents and restricted cash as presented in the statement of cash flows |
$ | 109,258 | $ | 122,151 | $ | 103,500 | ||||||
Concentration of Credit Risk
The Company maintains cash in several financial institutions in the U.S. and other countries which, at times, may exceed the federally insured limits. Accounts held in the U.S. are guaranteed by the Federal Deposit Insurance Corporation up to certain limits. As of December 31, 2019 and 2018, the Company’s cash held in financial institutions outside of the U.S. amounted to $9.7 million and $6.4 million, respectively.
Restricted Cash and Marketable Securities
The amounts held in restricted cash on the accompanying consolidated balance sheets represent principally funds required to be held by certain vendors and regulatory agencies and are classified as restricted cash since such amounts cannot be used by the Company until the restrictions are removed by those vendors and regulatory agencies. These amounts are principally held in certificates of deposit and interest income is recognized when earned.
The Company has classified marketable securities, principally money market funds or other short-term investments, as trading securities which are recorded at market value. Unrealized gains and losses are included in current operations. Gains and losses on the disposition of securities are recognized by the specific identification method in the period in which they occur. Cost of these short-term investments approximates fair value.
In order to operate guest tour expedition vessels from U.S. ports, the Company is required to either post a performance bond with the Federal Maritime Commission or escrow all unearned guest deposits plus an additional 10% in restricted accounts, up to a maximum of $32 million. To satisfy this requirement, the Company entered into an agreement with a financial institution to escrow the required amounts.
Restricted cash and marketable securities consist of the following:
|
As of December 31, |
||||||||
|
2019 |
2018 |
|||||||
|
(In thousands) |
||||||||
|
Federal Maritime Commission escrow |
$ | 6,104 | $ | 5,823 | ||||
|
Certificates of deposit and other restricted securities |
1,575 | 1,402 | ||||||
|
Credit card processor reserves |
- | 1,530 | ||||||
|
Total restricted cash |
$ | 7,679 | $ | 8,755 | ||||
At December 31, 2018, a cash reserve of approximately $1.5 million was required for credit card deposits by third-party credit card processors and as of December 31, 2019, this reserve was on longer required.
Marine Operating Supplies and Inventories
Marine operating supplies consist primarily of fuel, provisions, spare parts, items required for maintenance and supplies used in the operation of marine expeditions. Marine operating supplies are stated at the lower of cost or net realizable value. Cost is determined using the first-in first-out method.
Inventories consist primarily of gift shop merchandise and other items for resale and are stated at the lower of cost or net realizable value. Cost is determined using the first-in, first-out method.
Prepaid Expenses and Other Current Assets
The Company records prepaid expenses and other current assets at cost and expenses them in the period the services are provided or the goods are delivered. The Company’s prepaid expenses and other current assets consist of the following:
|
As of December 31, |
||||||||
|
2019 |
2018 |
|||||||
|
(In thousands) |
||||||||
|
Prepaid tour expenses |
$ | 15,630 | $ | 10,617 | ||||
|
Prepaid air expense |
4,415 | 2,973 | ||||||
|
Prepaid marketing, commissions and other expenses |
4,026 | 2,622 | ||||||
|
Prepaid client insurance |
3,064 | 2,436 | ||||||
|
Prepaid corporate insurance |
1,376 | 1,158 | ||||||
|
Prepaid port agent fees |
491 | 1,433 | ||||||
|
Prepaid income taxes |
53 | 24 | ||||||
|
Total prepaid expenses |
$ | 29,055 | $ | 21,263 | ||||
Property and Equipment
Property and equipment, net is stated at cost less accumulated depreciation. Depreciation is computed using the straight-line method over the estimated useful lives of the assets, as follows:
|
|
|
Years |
|
||
|
Vessels and vessel improvements |
|
15 |
- |
25 |
|
|
Furniture & equipment |
|
|
5 |
|
|
|
Computer hardware and software |
|
|
5 |
|
|
|
Leasehold improvements, including expedition sites and port facilities |
|
Shorter of lease term or related asset life |
|
||
The ship-based tour and expedition industry is very capital intensive. As of December 31, 2019, the Company owned and operated eight expedition vessels. The Company has contracted for two polar ice-class vessels, the National Geographic Endurance and the National Geographic Resolution, scheduled to be delivered in the first quarter of 2020 and the fourth quarter of 2021, respectively. The Company has a capital program for the improvement of its vessels and for asset replacements in order to enhance the effectiveness and efficiency of its operations; comply with, or exceed all relevant legal and statutory requirements related to health, environment, safety, security and sustainability; and gain strategic benefits or provide newer improved product innovations to its guests.
Vessel improvement costs that add value to the Company’s vessels, such as those discussed above, are capitalized and depreciated over the shorter of the improvements, or the vessel’s, estimated remaining useful life, while costs of repairs and maintenance, including minor improvement costs and drydock expenses, are charged to expense as incurred and included in cost of tours. Drydock costs primarily represent planned maintenance activities that are incurred when a vessel is taken out of service. For U.S. flagged ships, the statutory requirement is an annual docking and U.S. Coast Guard inspections, normally conducted in drydock. Internationally flagged ships have scheduled dockings approximately every 12 months, for a period of up to three to six weeks.
Goodwill
In accordance with ASC 360, the Company tests for impairment annually as of September 30, or more frequently if warranted. The Company assesses qualitative factors to determine whether the existence of events or circumstances leads to a determination that it is more likely than not that the estimated fair value of goodwill is less than its carrying amount. The Company completed the annual impairment test as of September 30, 2019 with no indication of goodwill impairment. See Note 5 – Goodwill and Intangible Assets for further details on goodwill.
Intangible Assets
Intangible assets include tradenames, customer lists and operating rights. Tradenames are words, symbols, or other devices used in trade or business to indicate the source of products and to distinguish it from other products and are registered with government agencies and are protected legally by continuous use in commerce. Customer lists are established relationships with existing customers that resulted in repeat purchases and customer loyalty. Based on the Company’s analysis, amortization of the tradenames and customer lists were computed using the estimated useful lives of 15 and 5 years, respectively. See Note 5 – Goodwill and Intangible Assets for further information.
The Company operates two vessels year-round in the Galápagos National Park in Ecuador; the National Geographic Endeavour II with 95 berths and the National Geographic Islander with 47 berths. In order to operate these vessels within the park, the Company is required to have in its possession cupos (licenses) sufficient to cover the total available berths on each vessel.
In June 2015, the Special Law of Special Regimen for the Province of Galapagos was approved and subsequently updated in November 2015. The law established that cupos, which were in effect since July 2015, will have a validity of nine years. The Company’s operating rights are up for renewal in July 2024. The current “owners” of the cupos will have the opportunity to re-apply for them, but any other enterprise or individual will have the opportunity to bid for the cupos. All bidders must present proof that they fulfill the conditions to properly utilize the license (access to a vessel, experience in tourism, proven environmental behavior, marketing, etc.). While the Company believes that, based on the expected criteria to retain cupos and its past operating history in the Galápagos, there is a strong possibility that the Company will retain its cupos, from an accounting perspective, it assumes they retain no value after July 2024. Once the renewal process has begun and if it can be determined that the Company will be successful in its bid, then the Company will adjust its amortization prospectively. Operating rights are amortized over their remaining government mandated lives.
Upon the occurrence of a triggering event, the assessment of possible impairment of the Company’s intangible assets will be based on the Company’s ability to recover the carrying value of its asset, which is determined by using the asset’s estimated undiscounted future cash flows. If these estimated undiscounted future cash flows are less than the carrying value of the asset, an impairment charge is recognized for the excess, if any, of the asset’s carrying value over its estimated fair value. A significant amount of judgment is required in estimating the future cash flows and fair values of its tradenames, customer lists and operating rights. As of December 31, 2019 and 2018, there was no triggering event and the Company did not record impairment for its intangible assets.
Long-Lived Assets
The Company reviews its long-lived assets, principally its vessels, for impairment whenever events or changes in circumstances indicate that the carrying amounts of these assets may not be fully recoverable. Upon the occurrence of a triggering event, the assessment of possible impairment is based on the Company’s ability to recover the carrying value of its asset, which is determined by using the asset’s estimated undiscounted future cash flows. If these estimated undiscounted future cash flows are less than the carrying value of the asset, an impairment charge is recognized for the excess of the asset’s carrying value over its estimated fair value. A significant amount of judgment is required in estimating the future cash flows and fair values of its vessels. As of December 31, 2019 and 2018, there was no triggering event and the Company did not record an impairment of its long-lived assets.
Accounts Payable and Accrued Expenses
The Company records accounts payable and accrued expenses for the cost of such items when the service is provided or when the related product is delivered. The Company’s accounts payable and accrued expenses consist of the following:
|
As of December 31, |
||||||||
|
2019 |
2018 |
|||||||
|
(In thousands) |
||||||||
|
Accounts payable |
$ | 14,633 | $ | 9,326 | ||||
|
Accrued other expense |
8,348 | 11,464 | ||||||
|
Bonus compensation liability |
5,322 | 5,195 | ||||||
|
Employee liability |
3,712 | 2,943 | ||||||
|
Refunds and commissions payable |
1,873 | 1,533 | ||||||
|
Foreign currency forward contract liability |
1,300 | 387 | ||||||
|
Royalty payable |
1,075 | 1,005 | ||||||
|
Travel certificate liability |
888 | 1,088 | ||||||
|
Income tax liabilities |
603 | 576 | ||||||
|
Accrued travel insurance expense |
477 | 427 | ||||||
|
Total accounts payable and accrued expenses |
$ | 38,231 | $ | 33,944 | ||||
Leases
The Company leases office and warehousing space with lease terms ranging from one to ten years, and computer hardware and software and office equipment with lease terms ranging from three to six years.
The Company accounts for its various operating leases in accordance with ASC 842-Leases, as updated by Accounting Standards Update (“ASU”) 2016-02. At the inception of a lease, the Company recognizes right-of-use lease assets and related lease liabilities measured as the present value of future lease payments on its balance sheet. Lease expense is recognized on a straight-line basis over the term of the lease. The Company reviewed its contracts with vendors and customers, determining that its right-to-use lease assets consisted primarily of office space operating leases. In determining the right-to-use lease assets and related lease liabilities, the Company did not recognize any lease extension options and elected to exclude leases with terms of 12-months or less. Short-term leases are accounted for monthly over the lease term.
Fair Value Measurements
Fair value is defined as an exit price, representing the amount that would be received upon the sale of an asset or payment to transfer a liability in an orderly transaction between market participants. Fair value is a market-based measurement that is determined based on assumptions that market participants would use in pricing an asset or liability. A three-tier fair value hierarchy is used to prioritize the inputs in measuring fair value as follows:
|
Level 1 |
Quoted market prices (unadjusted) in active markets for identical assets or liabilities that the reporting entity has the ability to access at measurement date. |
|
|
|
|
Level 2 |
Quoted market prices for similar assets or liabilities in active markets, quoted prices for identical or similar assets or liabilities in markets that are not active, or other inputs that are observable, either directly or indirectly. Fair value is determined through the use of models or other valuation methodologies. |
|
|
|
|
Level 3 |
Significant unobservable inputs for assets or liabilities that cannot be corroborated by market data. Fair value is determined by the reporting entity’s own assumptions utilizing the best information available and includes situations where there is little market activity for the investment. |
Level 3 financial liabilities consist of obligations for which there is no current market for these securities such that the determination of fair value requires significant judgment or estimation. Changes in fair value measurements categorized within Level 3 of the fair value hierarchy are analyzed each period based on changes in estimates or assumptions and recorded as appropriate.
The carrying amounts of cash and cash equivalents, accounts payable and accrued expenses and unearned passenger revenue approximate fair value, due to the short-term nature of these instruments.
The carrying value of long-term debt approximates fair value given that the terms of the agreement were comparable to the market as of December 31, 2019 and 2018. As of December 31, 2019 and 2018, other than derivative instruments the Company had no other liabilities that were measured at fair value on a recurring basis.
The asset’s or liability’s fair value measurement within the fair value hierarchy is based upon the lowest level of any input that is significant to the fair value measurement.
Derivative Instruments and Hedging Activities
Currency Risk. The Company uses currency exchange contracts to manage its exposure to changes in currency exchange rates associated with certain of its non-U.S. dollar denominated receivables and payables. The Company primarily hedges a portion of its current-year currency exposure to the Canadian and New Zealand dollars, the Brazilian Real, South African Rand, Indian Rupee, the Euro and the British pound sterling. The fluctuations in the value of these forward contracts largely offset the impact of changes in the value of the underlying risk they economically hedge. The Company also uses foreign exchange forward contracts, designated as cash flow hedges, to manage its exposure to foreign denominated contracts, particularly the Norwegian Kroner ("NOK"),
Interest Rate Risk. The Company uses interest rate caps, designated as cash flow hedges, to manage the risk related to its floating rate corporate debt.
By entering into derivative instrument contracts, the Company exposes itself, from time to time, to counterparty credit risk. Counterparty credit risk is the failure of the counterparty to perform under the terms of the derivative contract. When the fair value of a derivative contract is in an asset position, the counterparty has a liability to the Company, which creates credit risk for the Company. The Company continues to monitor counterparty credit risk as part of its ongoing hedge assessments.
The Company’s derivative assets consist principally of interest rate caps and currency exchange contracts, which are carried at fair value based on significant observable inputs (Level 2 inputs). Derivatives entered into by the Company are typically executed over-the-counter and are valued using internal valuation techniques, as quoted market prices are not readily available. The valuation technique and inputs depend on the type of derivative and the nature of the underlying exposure. The Company principally uses discounted cash flows along with fair value models that primarily use market observable inputs. These models take into account a variety of factors including, where applicable, maturity, currency exchange rates, interest rate yield curves and counterparty credit risks.
The Company records derivatives on a gross basis in other long-term assets and other liabilities in the consolidated balance sheets at fair value. The accounting for changes in value of the derivative depends on whether or not the transaction has been designated and qualifies for hedge accounting. Derivatives that are not designated as hedges are reported and measured at fair value through earnings.
The Company applies hedge accounting to interest rate and foreign exchange rate derivatives entered into for risk management purposes. To qualify for hedge accounting, a derivative must be highly effective at reducing the risk associated with the exposure being hedged. In addition, key aspects of achieving hedge accounting are documentation of hedging strategy and hedge effectiveness at the hedge inception and substantiating hedge effectiveness on an ongoing basis. A derivative must be highly effective in accomplishing the hedge objective of offsetting changes in the cash flows of the hedged item for the risk being hedged. The effective portion of changes in the fair value of derivatives designated in a hedge relationship and that qualify as cash flow hedges is recorded in accumulated other comprehensive income, net of tax, and is subsequently reclassified into earnings in the period that the hedged transaction affects earnings.
The Company formally documents the relationship between derivatives and hedged items, as well as the risk-management objective and the strategy for undertaking hedge transactions at the inception of the hedging relationship. This documentation includes linking cash flow hedges to specific assets and liabilities on the balance sheet or to specific forecasted transactions. The Company also formally assesses, both at the hedge’s inception and on an ongoing basis, whether the derivative instruments that are used are highly effective in offsetting changes in fair values or cash flows of the hedged items.
Income Taxes
The Company is subject to income taxes in both the U.S. and the non-U.S. jurisdictions in which it operates. Significant management judgment is required in projecting ordinary income to determine the Company’s estimated effective tax rate.
The Company accounts for income taxes using the asset and liability method, under which it recognizes deferred income taxes for the tax consequences attributable to differences between the financial statement carrying amounts and the tax bases of existing assets and liabilities, as well as for tax loss carryforwards and tax credit carryforwards. The Company measures deferred tax assets and liabilities using enacted tax rates expected to apply to taxable income in the years in which those temporary differences are expected to be recoverable or settled. The Company provides a valuation allowance against deferred tax assets if, based upon the weight of available evidence, the Company does not believe it is “more-likely-than-not” that some or all of the deferred tax assets will be realized. The Company will continue to evaluate the deferred tax asset valuation allowance balances in all of our foreign and U.S. companies to determine the appropriate level of valuation allowances.
The Company regularly assesses the potential outcome of current and future examinations in each of the taxing jurisdictions when determining the adequacy of the provision for income taxes. The Company has only recorded financial statement benefits for tax positions which it believes reflect the “more-likely-than-not” criteria of the Financial Accounting Standards Board's ("FASB") authoritative guidance on accounting for uncertainty in income taxes, and it has established income tax reserves in accordance with this guidance where necessary. As of December 31, 2019, the Company had no unrecognized tax benefits and as of December 31, 2018, the Company had a liability for unrecognized tax benefits of $0.3 million, which was included in other long-term liabilities on the Company’s consolidated balance sheets. The guidance also discusses the classification of related interest and penalties on income taxes. The Company’s policy is to record interest and penalties on uncertain tax positions as a component of income tax expense. During the years ended December 31, 2019 and 2018, interest and penalties on uncertain tax positions included in income tax expense was insignificant.
The Company is subject to tax audits in all jurisdictions for which it files tax returns. Tax audits by their very nature are often complex and can require several years to complete. Currently, there are no U.S. federal, state or foreign jurisdiction tax audits pending. During 2018, the Company closed tax audits on its three Ecuadorian entities. The Company’s corporate U.S. federal and state tax returns for the current year and three prior years remain subject to examination by tax authorities and the Company’s foreign tax returns for the current year and four prior years remain subject to examination by tax authorities (except for the Ecuador entities, where the Company's foreign tax returns have been audited through 2017).
Other Long-Term Assets
In 2016, the Company recorded a $3.6 million tax asset for long-term prepaid value-added taxes related to the importation of the National Geographic Endeavour II and expects to earn tax credits that will reduce the asset over the next several years.
In 2015, the Company, Mr. Lindblad, the Chief Executive Officer and President of the Company, and National Geographic Society entered into an agreement where Mr. Lindblad agreed to grant National Geographic Society an option to purchase 2,387,499 of Mr. Lindblad’s shares in the Company as consideration for the assumption of the Tour Operator Agreement and an Alliance and License Agreement between the Company and National Geographic. The Company recorded a $13.8 million long-term asset for the license agreement to be amortized through March 2020. The balance of the license agreement asset as of December 31, 2019 and 2018 was $0.7 million and $3.6 million, respectively. During March 2019, National Geographic Society exercised its rights in full under the option agreement to acquire the shares, and in a cashless transaction acquired shares from Mr. Lindblad. See Note 9 – Commitments and Contingencies for more details.
Loan Receivable
During December 2019, the Company and Ulstein Verft AS (“Ulstein Verft”) amended the National Geographic Resolution construction agreement. The amended agreement provides for a $4.0 million loan to Ulstein Verft, with repayment to be 112% of the principle loan balance, due on maturity in December 2023. The agreement provides that, if the National Geographic Resolution is delivered early, as determined by the expedited delivery schedule per the agreement, that all or a portion of the loan will be considered as a delivery bonus and forgiven, as determined by the agreement. The Company incurred approximately $0.1 million in legal fees related to this loan that were capitalized and will be amortized to interest expense, net over the life of the loan. This receivable is recorded at amortized cost within other long-term assets.
Deferred Financing Costs
Deferred financing costs relate to the issuance costs of recognized debt liabilities and are presented in the consolidated balance sheets as direct deduction from the debt carrying amount. Deferred financing costs are amortized over the life of the debt or loan agreement through interest expense, net in the consolidated statements of operations. See Note 6 – Long-term Debt.
Foreign Currency Translation
The Company’s functional currency is the U.S. dollar. Any foreign operations and remeasurement adjustments and gains or losses resulting from foreign currency transactions are recorded as foreign exchange gains or losses in the consolidated statements of operations.
Stock-Based Compensation
The Company accounts for stock-based compensation issued to employees, non-employee directors or other service providers in accordance with ASC 718, Compensation - Stock Compensation, that requires awards to be recorded at their fair value on the date of grant and amortized over the service period of the award. The Company recognizes stock-based compensation costs on a straight-line basis over the requisite service period of the award, which is generally the vesting term of the equity instrument issued, within general and administrative expenses.
Recent Accounting Pronouncements
In December 2019, the FASB issued ASU 2019-12, Income Taxes (Topic 740)–Simplifying the Accounting for Income Taxes. The amendments of this ASU are intended to simplify the accounting for income taxes by removing certain exceptions to the general principles in Topic 740. The amendments also improve consistent application of and simplify GAAP for other areas of Topic 740 by clarifying and amending existing guidance. This ASU is effective for fiscal years, and interim periods within those fiscal years, beginning after December 15, 2020, and early adoption is permitted. The Company will adopt this ASU as required, and is currently reviewing the impact of the amendments of this update on its financial statements.
Accounting Pronouncements Recently Adopted
In February 2016, the FASB issued ASU 2016-02, Leases (Topic 842) and in July 2018 issued ASU 2018-11, Leases (Topic 842): Targeted Improvements. The guidance requires the recognition of lease right-of-use assets and lease liabilities by lessees for those leases previously classified as operating. This guidance was issued to increase transparency and comparability among organizations by disclosing key information about leasing arrangements and requiring the recognition of current and non-current right-of-use assets and lease liabilities on the balance sheet. Most prominent among the changes in the standard is the recognition of right-of-use assets and lease liabilities by lessees for those leases classified as operating leases. ASU 2016-02 was effective for fiscal years beginning after December 15, 2018. The Company adopted this guidance on January 1, 2019, as required, electing to apply retrospectively at the period of adoption with practical expedients. The adoption of this guidance had a material impact on the Company’s balance sheet by virtue of including the present value of its future operating lease payments as a liability of $6.2 million and related right-to-use lease assets, as of January 1, 2019.
In August 2018, the FASB issued ASU 2018-13, Fair Value Measurement (Topic 820): Disclosure Framework—Changes to the Disclosure Requirements for Fair Value Measurement. This amendment is intended to improve the effectiveness of fair value measurement disclosures by adding and modifying a few disclosure requirements, as well as eliminating several disclosures. ASU 2018-13 was effective for fiscal years beginning after December 15, 2018. The Company adopted this guidance on January 1, 2019, as required, and it did not have a material impact on the Company’s financial position or results of operations.
In August 2018, the FASB issued ASU 2018-15 Intangibles—Goodwill and Other—Internal-Use Software (Subtopic 350-40): Customer’s Accounting for Implementation Costs Incurred in a Cloud Computing Arrangement that is a Service Contract. The amendments in this ASU align the requirements for capitalizing implementation costs incurred in a hosting arrangement that is a service contract with the requirements for capitalizing implementation costs incurred to develop or obtain internal-use software, and hosting arrangements that include an internal-use software license. ASU 2018-15 was effective for fiscal years beginning after December 15, 2019 and early adoption was permitted. The Company adopted this guidance on January 1, 2019, and it did not have a material impact on the Company's financial statements.
NOTE 3 – EARNINGS PER SHARE
Earnings per common share is computed by dividing net income available to common shareholders, by the weighted average number of common shares outstanding during the period. Diluted earnings per share is computed using the weighted average number of common shares outstanding and, if dilutive, potential common shares outstanding during the period. Potential common shares consist of the dilutive incremental common shares issuable upon the exercise of stock options (if such option is an equity instrument, using the treasury stock method), unvested performance-based share units, unvested restricted share units, unvested restricted shares and previously outstanding warrants. For the year ended December 31, 2017, there were no dilutive shares because the Company incurred a net loss.
As of December 31, 2018 and 2017, 10,088,074 and 10,656,520 warrants, respectively, to purchase common stock at a price of $11.50 per share were outstanding. The Company determined these previously outstanding warrants were anti-dilutive for the year ended December 31, 2017 and were not considered in the calculation of diluted weighted average shares for that year.
For the years ended December 31, 2019, 2018 and 2017, the Company calculated earnings per share as follows:
|
For the years ended December 31, |
||||||||||||
|
2019 |
2018 |
2017 |
||||||||||
|
(In thousands, except share and per share data) |
||||||||||||
|
Net income (loss) attributable to Lindblad Expeditions Holdings, Inc. |
$ | 16,353 | $ | 11,352 | $ | (8,661 | ) | |||||
|
Non-cash deemed dividend to warrant holders |
2,654 | - | - | |||||||||
|
Net income (loss) available to common stockholders |
$ | 13,699 | $ | 11,352 | $ | (8,661 | ) | |||||
|
Weighted average shares outstanding: |
||||||||||||
|
Total weighted average shares outstanding, basic |
47,440,788 | 45,378,188 | 44,576,912 | |||||||||
|
Dilutive potential common shares |
245,141 | 313,908 | - | |||||||||
|
Dilutive potential options |
66,831 | 45,834 | - | |||||||||
|
Dilutive potential warrants |
1,673,803 | 602,124 | - | |||||||||
|
Total weighted average shares outstanding, diluted |
49,426,563 | 46,340,054 | 44,576,912 | |||||||||
|
Net income (loss) per share available to common stockholders |
||||||||||||
|
Basic |
$ | 0.29 | $ | 0.25 | $ | (0.19 | ) | |||||
|
Diluted |
$ | 0.28 | $ | 0.24 | $ | (0.19 | ) | |||||
NOTE 4 – PROPERTY AND EQUIPMENT
Property and equipment, net are as follows:
|
As of December 31, |
||||||||
|
2019 |
2018 |
|||||||
|
(In thousands) |
||||||||
|
Vessels and improvements |
$ | 494,282 | $ | 399,700 | ||||
|
Furniture and equipment |
14,322 | 12,902 | ||||||
|
Leasehold improvements |
1,425 | 1,425 | ||||||
|
Total property and equipment, gross |
510,029 | 414,027 | ||||||
|
Less: Accumulated depreciation |
(152,239 | ) | (128,048 | ) | ||||
|
Property and equipment, net |
$ | 357,790 | $ | 285,979 | ||||
Total depreciation expense of the Company’s property and equipment for the years ended December 31, 2019, 2018 and 2017 was $24.2 million, $19.0 million and $15.8 million, respectively.
For the year ended December 31, 2019, the Company had $96.0 million in capital expenditures, including capitalized interest, added to property and equipment. This amount primarily included $72.7 million for the two new polar ice-class vessels, the National Geographic Endurance and the National Geographic Resolution. For the year ended December 31, 2018, the Company had $54.3 million in capital expenditures, including capitalized interest, added to property and equipment, net. This amount primarily included $40.2 million for the National Geographic Venture, which was launched in the fourth quarter of 2018. The Company began to capitalize interest in January 2018 for the first of its two new polar ice-class vessels, the National Geographic Endurance, and in February 2019 for the National Geographic Resolution. The capitalized interest has been, and will continue to be, added to the historical cost of the assets and depreciated over their useful lives beginning upon the vessel’s completion. For the year ended December 31, 2019 and 2018, the Company recognized $3.7 million and $3.8 million, respectively, in capitalized interest in property and equipment, net on the accompanying consolidated balance sheets.
NOTE 5 – GOODWILL AND INTANGIBLE ASSETS
The Company's goodwill carrying value as of December 31, 2019 and 2018 was $22.1 million, and is related to the acquisition of Natural Habitat.
The carrying amounts and accumulated amortization of the Company’s intangibles, net are as follows:
|
As of December 31, |
||||||||||||||||||||||||||||
|
2019 |
2018 |
|||||||||||||||||||||||||||
|
(In thousands) |
Gross Carrying Amount |
Accumulated Amortization |
Net Carrying Amount |
Weighted Average Useful Life (years) |
Gross Carrying Amount |
Accumulated Amortization |
Net Carrying Amount |
|||||||||||||||||||||
|
Tradenames |
$ | 2,900 | $ | (709 | ) | $ | 2,191 | 11.3 | $ | 2,900 | $ | (515 | ) | $ | 2,385 | |||||||||||||
|
Customer Lists |
3,300 | (2,420 | ) | 880 | 1.3 | 3,300 | (1,760 | ) | 1,540 | |||||||||||||||||||
|
Operating rights |
6,529 | (3,204 | ) | 3,325 | 4.6 | 6,529 | (2,479 | ) | 4,050 | |||||||||||||||||||
|
Total intangibles, net |
$ | 12,729 | $ | (6,333 | ) | $ | 6,396 | 6.4 | $ | 12,729 | $ | (4,754 | ) | $ | 7,975 | |||||||||||||
The Company began amortizing operating rights with a gross carrying value of $6.5 million in July 2015, as a result of changes to the laws regarding cupos in the Galapagos National Park. See Note 2 – Summary of Significant Policies, Intangible Assets for a description of, and rationale for, amortizing operating rights. Amortization expense for each of the years ended December 31, 2019, 2018 and 2017 was $1.6 million.
Future expected amortization expense related to these intangibles are as follows:
|
Year |
Amount |
|||
|
(In thousands) |
||||
|
2020 |
$ | 1,579 | ||
|
2021 |
1,139 | |||
|
2022 |
919 | |||
|
2023 |
919 | |||
|
2024 |
617 | |||
|
Thereafter |
1,223 | |||
| $ | 6,396 | |||
NOTE 6 – LONG-TERM DEBT
Note Payable
On May 4, 2016, in connection with the Natural Habitat acquisition, Natural Habitat issued an unsecured promissory note to Mr. Bressler, the founder of Natural Habitat, with an outstanding principal amount of $2.5 million due at maturity on December 31, 2020. The promissory note accrues interest at a rate of 1.44% annually, with interest payable every six months.
Credit Facility
On March 27, 2018, the Company entered into the Third Amended and Restated Credit Agreement (the “Amended Credit Agreement”) providing for a refinancing and amendment of the terms of the Company’s prior secured credit facility, dated as of March 7, 2016 (the “Superseded Agreement”). The Amended Credit Agreement provided for a $200.0 million senior secured term facility (the “Term Facility”), which represented an increase of $25.0 million from the senior secured first lien term loan facility under the Superseded Agreement. The Term Facility matures March 27, 2025. The Amended Credit Agreement also provides for a $45.0 million senior secured incremental revolving credit facility (the “Revolving Facility”), which includes a $5.0 million letter of credit sub-facility. The Company’s obligations under the Amended Credit Agreement remain secured by substantially all of the assets of the Company.
In connection with the Amended Credit Agreement, the Company capitalized $4.2 million related to lender and third-party fees. In addition, the entry into the Amended Credit Agreement was considered a debt modification with a partial extinguishment, as a result the Company expensed $1.0 million of related costs during the year ended December 31, 2018, which is included in general and administrative expenses on the accompanying consolidated statements of operations.
Borrowings under the Term Facility bear interest at an adjusted Intercontinental Exchange (“ICE”) Benchmark administration LIBOR plus a spread of 3.25%, which stepped down from 3.50% during 2019 as the Company’s debt rating from Moody’s and S&P are both B1 (stable) or better and BB (negative) or better, respectively. The interest rate under the Term Facility at December 31, 2019 is 5.01%. Borrowings under the Revolving Facility will bear interest at an adjusted ICE Benchmark administration LIBOR plus a spread of 3.00%, or, at the option of the Company, an alternative base rate plus a spread of 2.00%. The Company is also required to pay a 0.5% annual commitment fee on undrawn amounts under the Revolving Facility, which matures on March 27, 2023.
The Amended Credit Agreement contains financial covenants that, among other things, (i) require the Company to maintain a total net leverage ratio (defined as on any date of determination, the ratio of total debt on such date, less up to $50.0 million of the unrestricted cash and cash equivalents to Adjusted EBITDA (as defined in the Amended Credit Agreement) for the trailing 12-month period) of 5.25 to 1.00 initially, with 0.25 equal reductions every two years thereafter until June 30, 2022 when the total net leverage ratio shall be 4.75 to 1.00 thereafter; (ii) limit the amount of indebtedness the Company may incur generally and specifically for intercompany debt, debt incurred to finance acquisitions and improvements, for capital and synthetic lease obligations, for standby letters of credit, and in connection with refinancing; (iii) limit the amount the Company may spend in connection with certain types of investments; and (iv) require the delivery of certain periodic financial statements and an operating budget. As of December 31, 2019, the Company was in compliance with the covenants.
Borrowings under the Revolving Facility will be used for general corporate and working capital purposes and related fees and expenses. As of December 31, 2019, the Company had no borrowings under the Revolving Facility.
Senior Secured Credit Agreements
On January 8, 2018, the Company entered into a senior secured credit agreement (the “Export Credit Agreement”) with Citibank, N.A., London Branch (“Citi”) and Eksportkreditt Norge AS (together with Citi, the “Lenders”). Pursuant to the Export Credit Agreement, the Lenders have agreed to make available to the Company, at the Company’s option and subject to certain conditions, a loan in an aggregate principal amount not to exceed $107.7 million for the purpose of providing financing for up to 80% of the purchase price of the Company’s new expedition ice-class cruise vessel, the National Geographic Endurance, scheduled to be delivered in the first quarter of 2020. Seventy percent of the loan will be guaranteed by Garantiinstituttet for Eksportkreditt, the official export credit agency of Norway. If drawn upon, the loan will be made at the time of delivery of the vessel.
At the Company’s election, the loan will bear interest either at a fixed interest rate effectively equal to 5.78% or a floating interest rate equal to three-month LIBOR plus a margin of 3.00% per annum. The loan will amortize quarterly based on a twelve-year profile, with 70% maturing over twelve years from drawdown, and 30% maturing over five years from drawdown. The loan will be secured by a first priority mortgage over the new vessel and the assignment of related insurances. The Export Credit Agreement also contains customary events of default and mandatory prepayment events for, among other things, non-payment, breach of covenants, default on certain other indebtedness, certain large judgments and a change of control of the Company. In addition to paying interest on any outstanding loans under the facility, the Company is required to pay customary coordination, arrangement, agency, collateral and commitment fees. Amounts drawn under the Export Credit Agreement may be voluntarily prepaid at any time subject to customary breakage costs.
On April 8, 2019, the Company entered into a senior secured credit agreement (the “Second Export Credit Agreement”) with the Lenders. Pursuant to the Second Export Credit Agreement, the Lenders have agreed to make available to the Company, at the Company's option and subject to certain conditions, a loan in an aggregate principal amount not to exceed $122.8 million for the purpose of providing pre- and post- delivery financing for up to 80% of the purchase price of the Company’s new expedition ice-class cruise vessel, the National Geographic Resolution, scheduled to be delivered in the fourth quarter of 2021. 30% of the borrowing will mature over five years from drawdown, and 70% of the borrowing will mature over twelve years from drawdown. Additionally, 70% percent of the loan will be guaranteed by Garantiinstituttet for Eksportkreditt, the official export credit agency of Norway. The Company incurred approximately $2.3 million in financing fees related to the Second Export Agreement, recorded as deferred financing costs as part of long-term debt. During September 2019, the Company drew approximately $30.5 million against the Second Export Credit Agreement for the second contracted installment payment on the National Geographic Resolution. The Second Export Credit Agreement bears a variable interest rate equal to three-month LIBOR plus a margin of 3.00% per annum, or 4.98% as of December 31, 2019. After completion of the vessel, the Second Export Credit Agreement, at the Company’s option, will bear an interest rate of either a fixed rate of 6.36% or a variable rate equal to three-month LIBOR plus a margin of 3.00% per annum.
The Export Credit Agreement and the Second Export Credit Agreement contain financial covenants that, among other things, require us to maintain a total net leverage ratio of 5.25 to 1.00 for the trailing 12-month period. The total net leverage ratio is defined under the covenants as on any date of determination, the ratio of total debt on such date, less up to $50.0 million of the unrestricted cash and cash equivalents to Adjusted EBITDA (as defined in the Export Credit Agreement and the Second Export Credit Agreement) for the trailing 12-month period. As of December 31, 2019, the Company was in compliance with the covenants.
Long-Term Debt Outstanding
As of December 31, 2019 and 2018, long-term debt and other borrowing arrangements consisted of:
|
As of December 31, |
||||||||||||||||||||||||
|
2019 |
2018 |
|||||||||||||||||||||||
|
(In thousands) |
Principal |
Deferred Financing Costs, net |
Balance |
Principal |
Deferred Financing Costs, net |
Balance |
||||||||||||||||||
|
Note payable |
$ | 2,525 | $ | - | $ | 2,525 | $ | 2,525 | $ | - | $ | 2,525 | ||||||||||||
|
Credit Facility |
197,000 | (9,704 | ) | 187,296 | 199,000 | (11,436 | ) | 187,564 | ||||||||||||||||
|
Senior Secured Credit Agreement |
30,476 | (2,229 | ) | 28,247 | - | - | - | |||||||||||||||||
|
Total long-term debt |
230,001 | (11,933 | ) | 218,068 | 201,525 | (11,436 | ) | 190,089 | ||||||||||||||||
|
Less current portion |
(4,525 | ) | - | (4,525 | ) | (2,000 | ) | - | (2,000 | ) | ||||||||||||||
|
Total long-term debt, non-current |
$ | 225,476 | $ | (11,933 | ) | $ | 213,543 | $ | 199,525 | $ | (11,436 | ) | $ | 188,089 | ||||||||||
Future minimum principal payments of long-term debt are as follows:
|
Year |
Amount |
|||
|
(In thousands) |
||||
|
2020 |
$ | 4,525 | ||
|
2021 |
2,000 | |||
|
2022 |
4,540 | |||
|
2023 |
4,540 | |||
|
2024 |
4,540 | |||
|
Thereafter |
209,856 | |||
| $ | 230,001 | |||
For the years ended December 31, 2019, 2018 and 2017, the Company recorded deferred financing costs of $2.4 million, $6.5 million and $0.4 million, respectively, in long-term debt, amortizing the costs over the term of the financing using the straight-line method.
For the years ended December 31, 2019, 2018 and 2017, deferred financing costs charged to interest expense were $1.9 million, $1.9 million and $2.2 million, respectively.
Letters of Credit
As of December 31, 2019 and 2018, the Company had $1.2 million in letters of credit outstanding with financial institutions. The annual fee for letters of credit is 1.0% of the outstanding balance. The letters of credit are secured by a certificate of deposit maintained at the financial institutions and that mature in November 2020.
NOTE 7 — FINANCIAL INSTRUMENTS AND FAIR VALUE MEASUREMENTS
The Company’s derivative assets and liabilities consist principally of foreign exchange forward contracts and interest rate caps and are carried at fair value based on significant observable inputs (Level 2 inputs).
The Company uses currency exchange contracts to manage its exposure to changes in currency exchange rates associated with certain of its non-U.S. dollar denominated receivables and payables. The Company primarily hedges a portion of its current-year currency exposure to the Canadian and New Zealand dollars, the Brazilian Real, South African Rand, Indian Rupee, the Euro and the British pound sterling. The fluctuations in the value of these forward contracts largely offset the impact of changes in the value of the underlying risk they economically hedge.
The Company entered into interest rate cap agreements to hedge its exposure to interest rate movements and to manage its interest expense related to the Term Facility and designated these interest rate caps as a cash flow hedge. The Company receives payments on the cap for any period that the one-month USD-LIBOR rate increases beyond the strike rate. The termination date of the cap agreement is May 31, 2023. The detailed terms of the interest rate caps and the portion of the corporate Term Facility that they hedge are as follows:
|
|
Interest Rate Caps |
Corporate Debt |
|
Trade date and borrowing date |
May 29, 2018 |
March 27, 2018 |
|
Effective date |
September 27, 2018 |
Not applicable |
|
Termination date |
May 31, 2023 |
March 31, 2025 |
|
Notional amount |
$100,000,000 |
$100,000,000 |
|
Fixed interest rate (plus spread) |
2.50% until November 30, 2018 |
Not applicable |
|
|
2.75% December 1, 2018 until April 30, 2019 |
|
|
|
3.00% May 1, 2019 until maturity |
|
|
Variable interest rate |
1 month LIBOR |
1 month LIBOR + 3.50% |
|
Settlement |
Monthly on last day of each month |
Monthly on last day of each month |
|
Interest payment dates |
Monthly on last day of each month |
Monthly on last day of each month |
|
Reset dates |
Last day of each month |
Last day of each month |
Changes in the fair value of this interest rate cap are recorded in accumulated other comprehensive income, pursuant to the guidelines of cash flow hedge accounting as outlined in ASC 815 and ASU 2017-12. The Company does not expect any gains currently recorded in accumulated other comprehensive income to be recognized in earnings over the next 12 months. The cost of the interest rate cap will be amortized to interest expense over its life, from the effective date through termination date.
In March 2019, the Company entered into foreign exchange forward contracts, designated as cash flow hedges, to hedge its exposure to the NOK, related to the Company’s contract to purchase the new polar ice-class vessel, the National Geographic Resolution (see Note 9 – Commitments and Contingencies). The cost of the foreign exchange forward contracts will be amortized to interest expense over their lives, from the effective date through settlement dates.
The Company records the effective portion of changes in the fair value of its cash flow hedges to other comprehensive income (loss), net of tax, and subsequently reclassifies these amounts into earnings in the period during which the hedged transaction is recognized. Any changes in fair values of hedges that are determined to be ineffective are immediately reclassified from accumulated other comprehensive income (loss) into earnings. No gains or losses of the Company’s cash flow hedges were considered to be ineffective and reclassified from other comprehensive income (loss) to earnings for the year ended December 31, 2019. The Company estimates that approximately $1.2 million of losses currently recorded in accumulated other comprehensive income (loss) will be recognized in earnings over the next 12 months due to the maturity of the cash flow hedge and the hedged item. The Company will continue to assess the effectiveness of the hedges on an ongoing basis. During the year ended December 31, 2019, a $1.6 million loss, net of tax, was reclassified from other comprehensive income and recognized as a loss on foreign currency due to the maturity of a foreign exchange forward contract that was designated as a cash flow hedge.
The Company held the following derivative instruments with absolute notional values as of December 31, 2019:
|
(in thousands) |
Absolute Notional Value |
|||
|
Interest rate caps |
$ | 100,000 | ||
|
Foreign exchange contracts |
127,488 | |||
Estimated fair values (Level 2) of derivative instruments were as follows:
|
As of December 31, |
||||||||||||||||
|
2019 |
2018 |
|||||||||||||||
|
(In thousands) |
Fair Value, Asset Derivatives |
Fair Value, Liability Derivatives |
Fair Value, Asset Derivatives |
Fair Value, Liability Derivatives |
||||||||||||
|
Derivative instruments designated as cash flow hedging instruments: |
||||||||||||||||
|
Foreign exchange forward (a) |
$ | - | $ | 4,459 | $ | - | $ | - | ||||||||
|
Interest rate cap (b) |
138 | - | 710 | - | ||||||||||||
|
Total |
$ | 138 | $ | 4,459 | $ | 710 | $ | - | ||||||||
|
Derivative instruments not designated as cash flow hedging instruments: |
||||||||||||||||
|
Foreign exchange forward (c) |
$ | 459 | $ | 70 | $ | - | $ | 1,328 | ||||||||
|
Total |
$ | 459 | $ | 70 | $ | - | $ | 1,328 | ||||||||
__________
|
|
(a) |
Recorded in accounts payable and accrued expenses and other long-term liabilities. |
| (b) | Recorded in prepaid expenses and other current assets, and other long-term assets. | |
| (c) | Recorded in prepaid expenses and other current assets, and accounts payable and accrued expenses. |
The effects of derivatives recognized in the Company’s condensed consolidated financial statements were as follows:
|
For the years ended December 31, |
||||||||||||
|
(In thousands) |
2019 |
2018 |
2017 |
|||||||||
|
Derivative instruments designated as cash flow hedging instruments: |
||||||||||||
|
Foreign exchange forward (a) |
$ | (5,062 | ) | $ | - | $ | - | |||||
|
Interest rate cap (b) |
(572 | ) | (671 | ) | - | |||||||
|
Derivative instruments not designated as cash flow hedging instruments: |
||||||||||||
|
Foreign exchange forward (c) |
1,718 | (2,175 | ) | 1,144 | ||||||||
|
Total |
$ | (3,916 | ) | $ | (2,846 | ) | $ | 1,144 | ||||
__________
| (a) | For the year ended December 31, 2019, $1.6 million was recognized as a loss on foreign currency in the condensed consolidated statements of income, and $3.4 million, was recognized, net of tax, as a component of other comprehensive income (loss) within stockholders’ equity. | |
|
|
(b) |
Recognized, net of tax, as a component of other comprehensive income (loss) within stockholders’ equity. |
|
|
(c) |
Gains (losses) related to derivative instruments are expected to be largely offset by (losses) gains on the underlying exposures being hedged. During the years ended December 31, 2019, 2018 and 2017, a gain of $1.7 million, a loss of $2.2 million and a gain of $1.1 million, respectively, was recognized in gain (loss) on foreign currency. |
NOTE 8 — INCOME TAXES
The Company (a “C” Corporation) provides for income taxes based on the Federal and state statutory rates on taxable income. U.S. and foreign components of income before incomes taxes are presented below:
|
For the years ended December 31, |
||||||||||||
|
(In thousands) |
2019 |
2018 |
2017 |
|||||||||
| Domestic | $ | 455 | $ | (13,015 | ) | $ | (10,423 | ) | ||||
| Foreign | 20,483 | 25,183 | 12,896 | |||||||||
|
Total |
$ | 20,938 | $ | 12,168 | $ | 2,473 | ||||||
The income tax provisions are comprised of the following:
|
For the years ended December 31, |
||||||||||||
|
(In thousands) |
2019 |
2018 |
2017 |
|||||||||
|
Current |
||||||||||||
| Federal | $ | - | $ | 191 | $ | (15 | ) | |||||
| State | 22 | (14 | ) | 529 | ||||||||
| Foreign - Other | 682 | 578 | 1,062 | |||||||||
|
Total current |
704 | 755 | 1,576 | |||||||||
|
Deferred |
||||||||||||
| Federal | 1,325 | 937 | 8,168 | |||||||||
| State | 379 | (1,161 | ) | 242 | ||||||||
| Foreign - Other | (218 | ) | 85 | 16 | ||||||||
|
Total deferred |
1,486 | (139 | ) | 8,426 | ||||||||
|
Income tax expense (benefit) |
$ | 2,190 | $ | 616 | $ | 10,002 | ||||||
A reconciliation of the U.S. federal statutory income tax (benefit) expense to the Company’s effective income tax provision is as follows:
|
For the years ended December 31, |
||||||||||||
|
2019 |
2018 |
2017 |
||||||||||
| Tax provision at statutory rate – federal | 21.0 | % | 21.0 | % | 35.0 | % | ||||||
| U.S. tax reform toll charge | 0.0 | % | 0.0 | % | 562.2 | % | ||||||
| Tax rate change deferred revaluation | 0.0 | % | 0.0 | % | (63.3 | %) | ||||||
| Tax provision at effective state and local rates | 1.9 | % | (9.6 | %) | 23.9 | % | ||||||
| Foreign tax rate differential | (16.5 | %) | (12.8 | %) | (158.3 | %) | ||||||
| Subpart F income | 3.4 | % | 22.7 | % | 0.0 | % | ||||||
| Nondeductible expenses | 0.4 | % | 0.2 | % | 6.5 | % | ||||||
| Uncertain tax provisions | (2.2 | %) | (0.4 | %) | 1.2 | % | ||||||
| Valuation allowance | 2.8 | % | (11.9 | %) | 2.8 | % | ||||||
| Prior period adjustments | (0.1 | %) | (3.2 | %) | 11.2 | % | ||||||
| Stock compensation | (0.2 | %) | (0.8 | %) | (9.5 | %) | ||||||
| Tax credits | 0.0 | % | (0.1 | %) | (7.3 | %) | ||||||
| Other | 0.0 | % | 0.0 | % | 0.0 | % | ||||||
|
Total effective income tax rate |
10.5 | % | 5.1 | % | 404.4 | % | ||||||
The Company, through its subsidiaries and affiliated entities in the U.S., the Cayman Islands, Ecuador and Australia are subject to US Federal, US state, Ecuadorian Federal and Australian Federal income taxes. The Cayman Islands do not impose federal or local income taxes.
Deferred tax (liabilities) assets, net, are comprised of the following:
|
As of December 31, |
||||||||
|
(In thousands) |
2019 |
2018 |
||||||
| Net operating loss carryforward | $ | 14,810 | $ | 15,235 | ||||
| Property and equipment | (18,546 | ) | (17,164 | ) | ||||
| Disallowed interest carryforward | 2,136 | 1,549 | ||||||
| Valuation allowance | (2,136 | ) | (1,549 | ) | ||||
| Stock-based compensation | 116 | 57 | ||||||
| Intangibles | (716 | ) | (949 | ) | ||||
| Other (a) | 63 | 34 | ||||||
|
Deferred tax (liabilities) assets |
$ | (4,273 | ) | $ | (2,787 | ) | ||
__________
(a) Other is net of a $0.2 million deferred tax asset.
The Company recognizes valuation allowances to reduce deferred tax assets to the amount that is more likely than not to be realized. In assessing the likelihood of realization, management considers: (i) future reversals of existing taxable temporary differences; (ii) future taxable income exclusive of reversing temporary differences and carryforwards; (iii) taxable income in prior carryback year(s) if carryback is permitted under applicable tax law; and (iv) tax planning strategies.
The U. S. Tax Cuts and Jobs Act (the “Tax Act”) introduced significant changes to U.S. income tax law that have a meaningful impact on our provision for income taxes in prior years. Due to the timing of the enactment and the complexity involved in applying the provisions of the Tax Act, we made reasonable estimates of the effects and recorded provisional amounts in our financial statements for the year ended December 31, 2017. As part of this effort, we recognized a provisional amount for our one-time transitional tax liability as a reduction of net operating loss carryforwards totaling $13.9 million and a deferred tax benefit of $1.8 million to reflect the reduced U.S. tax rate and other effects of the Tax Act. During 2018, we recorded tax charges for the impact of the Tax Act effects using the current available information and technical guidance on the interpretations of the Tax Act. As permitted by SEC Staff Accounting Bulletin 118, Income Tax Accounting Implications of the Tax Cuts and Jobs Act, we recorded provisional estimates and have subsequently finalized our accounting analysis based on the guidance, interpretations, and data available as of December 22, 2018. In the fourth quarter of 2018, we recorded a benefit of $0.6 million related to the state tax treatment of the one-time mandatory repatriation of foreign earnings. No other adjustments made during 2018 or 2019 were considered material.
The Company also had deferred tax assets related to U.S. loss carryforwards of $57.3 million as of December 31, 2019, which begin to expire in 2027. The timing and manner in which the Company will utilize the net operating loss carryforwards in any year, or in total, may be limited in the future as a result of changes in the Company’s ownership and any limitations imposed by the jurisdictions in which the Company operates. In 2018, the Company filed its final tax return in Australia. As a result, it no longer has Australian net operating or capital loss carryforwards, and no corresponding valuation allowance.
As a result of the transition to the territorial tax regime effectuated by the Tax Act described above, any potential dividends from our foreign subsidiaries would no longer be subject to Federal tax in the United States. We continue to assert our prior position regarding the repatriation of historical foreign earnings from our Ecuadorian and Australian subsidiaries. We currently have no intention to remit any additional undistributed earnings of our Ecuadorian and Australian subsidiaries in a taxable manner. We no longer remain permanently reinvested in the earnings of our Cayman subsidiary. No taxes have been accrued as a result of this change because no taxes are expected to be imposed by either the United States or the Cayman Islands upon such a remittance.
The Company is subject to income taxes in the U.S. and various state and foreign jurisdictions. Significant judgment is required in evaluating tax positions and determining the provision for income taxes. The Company establishes liabilities for tax-related uncertainties based on estimates of whether, and the extent to which, additional taxes may be due. These liabilities are established when the Company believes that certain positions might be challenged despite its belief that its tax return positions are fully supportable. The Company adjusts these liabilities in light of changing facts and circumstances, such as the outcome of a tax audit. The provision for income taxes includes the impact of changes to these liabilities.
The following is a tabular reconciliation of the total amounts of unrecognized tax benefits and does not include related interest and penalties:
|
For the years ended December 31, |
||||||||||||
|
(In thousands) |
2019 |
2018 |
2017 |
|||||||||
|
Beginning of year |
$ | 298 | $ | 421 | $ | 447 | ||||||
|
Current year positions |
- | - | - | |||||||||
| Prior year positions | (298 | ) | (123 | ) | (26 | ) | ||||||
|
End of year |
$ | - | $ | 298 | $ | 421 | ||||||
The Company has elected an accounting policy to classify interest and penalties related to unrecognized tax benefits as a component of income tax expense. As of December 31, 2019, 2018 and 2017, interest and penalties included in income tax expense were not significant.
The Company is subject to tax audits in all jurisdictions for which it files tax returns. Tax audits by their very nature are often complex and can require several years to complete. Currently, there are no U.S. federal, state or foreign jurisdiction tax audits pending. During 2018, the Company recently closed tax audits on its three Ecuadorian entities. The Company’s corporate U.S. federal and state tax returns for the current year and the three prior years remain subject to examination by tax authorities and the Company’s foreign tax returns for the current year and the four prior years remain subject to examination by tax authorities.
NOTE 9 – COMMITMENTS AND CONTINGENCIES
Natural Habitat Contingent Arrangement
Mr. Bressler, founder of Natural Habitat, retains a 19.9% noncontrolling interest in Natural Habitat, which is subject to a put/call arrangement. The arrangement between the Company and Mr. Bressler was established in order to provide a formal exit opportunity for Mr. Bressler and a path to 100% ownership for the Company. Mr. Bressler has a put option under certain conditions and subject to providing notice by October 31, 2020, that enables him, but does not obligate him, to sell his remaining interest in Natural Habitat to the Company on December 31, 2020. The Company has a call option, but not an obligation, with an expiration of December 31, 2025, under which it can buy Mr. Bressler’s remaining interest at a similar fair value measure as Mr. Bressler’s put option.
Since the redemption of the noncontrolling interest is not solely in the Company’s control, the Company is required to record the redeemable noncontrolling interest outside of stockholders’ equity but after its total liabilities. In addition, if it is probable that the instrument will become redeemable, as such solely due to the passage of time, the redeemable noncontrollable interest should be adjusted to the redemption value via one of two measurement methods.
The Company elected the income classification-excess adjustment and accretion methods for recognizing changes in the redemption value of Mr. Bressler’s put option. Under this methodology, a calculation of the present value of the redemption value is compared to the carrying value of the redeemable noncontrolling interest and the carrying value of the redeemable noncontrolling interest is adjusted to the redemption value’s present value. Any adjustments to the carrying value of the redeemable noncontrolling interest, up to the fair value of the of the noncontrolling interest, are classified to retained earnings. Adjustments in excess of the fair value of the of the noncontrolling interest, are treated as a decrease to net income available to common stockholders.
The fair value of Mr. Bressler’s put option was determined using a discounted cash flow model. The redemption value was adjusted to its present value using the Company’s weighted average cost of capital.
Prior to the year ended December 31, 2019, the fair value of the noncontrolling interest exceeded the present value of the put option redemption value, and the differences between the present value of the put option redemption value and the carrying amount of the redeemable noncontrolling interest had been deemed immaterial. At December 31, 2019, the fair value of the noncontrolling interest exceeded the present value of the put option redemption value, and the Company recorded a $7.2 million adjustment, which increased the carrying amount of redeemable noncontrolling interest and reduced the Company’s retained earnings.
In connection with the acquisition of Natural Habitat, Mr. Bressler has an equity incentive opportunity to earn an award of options based on the future financial performance of Natural Habitat, where if the Final Year Equity Value of Natural Habitat, as defined in Mr. Bressler's employment agreement, exceeds $25 million, effective as of December 31, 2020, Mr. Bressler will be granted options with a fair value equal to 10.1% of such excess, subject to certain conditions.
Lease Commitments
The Company leases office space and equipment under long-term leases, which are classified as operating leases. As of December 31, 2019, the Company’s remaining weighted average operating lease terms were approximately 64 months. A reconciliation of operating lease payments undiscounted cash flows to lease liabilities recognized as of December 31, 2019 is as follows:
|
(In thousands) |
Operating Lease Payments |
|||
|
2020 |
$ | 1,335 | ||
|
2021 |
1,372 | |||
|
2022 |
1,437 | |||
|
2023 |
1,324 | |||
|
2024 |
1,328 | |||
|
Thereafter |
592 | |||
|
Present value discount (6% weighted average) |
(1,024 | ) | ||
|
Total |
$ | 6,364 | ||
Lease expense was approximately $1.7 million, $1.5 million and $1.2 million for the years ended December 31, 2019, 2018 and 2017, respectively. These amounts are recorded within general and administrative expenses on the accompanying consolidated statements of operations.
Fleet Expansion
In November 2017, the Company entered into an agreement with Ulstein Verft to construct a polar ice-class vessel, the National Geographic Endurance, with a total purchase price of 1,066.0 million NOK. Subsequently, the Company exercised its right to make payments in United States Dollars, which resulted in a purchase price of $134.6 million, including hedging costs. The purchase price is subject to potential adjustments from contract specifications for variations in speed, deadweight, fuel consumption and delivery date, and is due in installments. The first twenty percent of the purchase price was paid shortly after execution of the agreement with the remaining eighty percent due upon delivery and acceptance of the vessel. The vessel is scheduled to be delivered in the first quarter of 2020. See Note 6 – Long-Term Debt for more information.
On February 25, 2019, the Company entered into an agreement with Ulstein Verft to construct a polar ice-class vessel, the National Geographic Resolution, with a contracted purchase price of 1,291.0 million NOK. The purchase price is subject to potential adjustments from contract specifications for variations in speed, deadweight, fuel consumption and delivery date. The purchase price is due in installments, with the first 20% paid shortly after execution of the agreement, 50% to be paid over the duration of the build and the final 30% due upon delivery and acceptance of the vessel. The vessel is scheduled to be delivered in the fourth quarter of 2021. During December 2019, the Company and Ulstein Verft amended the National Geographic Resolution construction agreement, providing for an expedited delivery schedule for the vessel and a loan agreement for which all or a portion may be considered as a delivery bonus and forgiven, as determined by the expedited delivery schedule per the agreement. See Note 2 – Summary of Significant Accounting Policies and Note 6 – Long-Term Debt for more information.
Royalty Agreement – National Geographic
The Company is engaged in an alliance and license agreement with National Geographic through 2025, which allows the Company to use the National Geographic name and logo. In return for these rights, the Company is charged a royalty fee. The royalty fee is included within selling and marketing expense on the accompanying consolidated statements of operations. The amount is calculated based upon a percentage of certain ticket revenues less travel agent commission, including the revenues received from cancellation fees and any revenues received from the sale of voyage extensions. A voyage extension occurs when a guest extends his or her trip with pre- or post-voyage hotel nights and is included within tour revenues on the accompanying consolidated statements of operations. The royalty expense is recognized at the time of revenue recognition. See Note 2 – Summary of Significant Accounting Policies for a description of the Company’s revenue recognition policy. Royalty expense for the years ended December 31, 2019, 2018 and 2017 totaled $5.8 million, $5.0 million and $4.5 million, respectively.
The royalty balances payable to National Geographic as of December 31, 2019 and 2018 was $2.2 and $1.0 million, respectively, and are included in accounts payable and accrued expenses on the accompanying consolidated balance sheets.
Royalty Agreement – World Wildlife Fund
Natural Habitat has a license agreement with World Wildlife Fund, which allows it to use the WWF name and logo. In return for these rights, Natural Habitat is charged a royalty fee and a fee based on annual gross sales. The fees are included within selling and marketing expense on the accompanying consolidated statements of operations. The annual royalty payment and gross sales fees are paid on a quarterly basis. For the years ended December 31, 2019, 2018 and 2017, these fees totaled $0.9 million, $0.8 million and $0.6 million, respectively.
Royalty Agreement – Islander
Under a perpetual royalty agreement, the Company is obligated to pay a third party, based upon net revenues generated through tours conducted on the National Geographic Islander. The related royalty payments are charged to cost of tours expenses. Royalty expense for the years ended December 31, 2019, 2018 and 2017 was $0.8 million, $0.7 million and $0.7 million, respectively.
Charter Commitments
From time to time, the Company enters into agreements to charter vessels onto which it holds its tours and expeditions. Future minimum payments on its charter agreements are as follows:
|
For the years ended December 31, |
Amount |
|||
|
(In thousands) |
||||
|
2020 |
$ | 12,769 | ||
|
2021 |
8,813 | |||
|
2022 |
1,850 | |||
|
Total |
$ | 23,432 | ||
Other Commitments
The Company participates, with other tour operators, in the Consumer Protection Insurance Plan sponsored by the United States Tour Operators Association (“USTOA”). The USTOA requires a $1.0 million performance bond, letter of credit or assigned certificate of deposit from its members to insure this plan. The Company has assigned a $1.0 million letter of credit to the USTOA to satisfy this requirement. This letter of credit will be used only if the Company becomes insolvent and cannot refund its customers’ deposits.
In certain instances when not fully covered through an insurance company, the Company self-insures cancellation insurance extended to guests. Further, the Company contracts with an unrelated insurance company to administer the guest insurance program, which includes additional guest-related insurance coverage purchased by guests. In connection with the program, the Company has provided a $150,000 letter of credit to the insurance company to cover unpaid premiums.
Operational Agreement
The Company maintains an agreement with a third party in the Galápagos who provides advisory and administrative services, and operational support for the Company’s vessels stationed there, the National Geographic Endeavour II and National Geographic Islander. This agreement is in effect through December 31, 2020 and renews annually.
Legal Proceedings
The Company is involved in various claims, legal actions and regulatory proceedings arising from time to time in the ordinary course of business. In the opinion of management, there are no outstanding proceedings that are expected to have a material adverse effect on our financial position, results of operations or cash flows.
NOTE 10 – EMPLOYEE BENEFIT PLAN
The Company has a 401(k)-profit sharing plan and trust for its employees. The Company matched 30% in 2019, 2018 and 2017, respectively, of employee contributions up to annual maximum of $2,400 for 2019 and $2,100 for 2018 and 2017. For the years ended December 31, 2019, 2018 and 2017, the Company’s benefit plan contributions amounted to $0.4 million, $0.3 million and $0.3 million, respectively. The benefit plan contributions are recorded within general and administrative expenses on the consolidated statements of operations.
NOTE 11 – STOCKHOLDERS’ EQUITY
Company Stock
The Company has 1,000,000 shares of preferred stock authorized, $0.0001 par value and 200,000,000 shares of common stock authorized, $0.0001 par value.
Initial Public Offering and Warrants
In connection with its initial public offering, on May 15, 2013, the Company sold 20,000,000 units at $10.00 per unit, including 2,000,000 units under the underwriters’ over-allotment option, generating gross proceeds of $200.0 million. Each unit consisted of one share of the Company’s common stock, $0.0001 par value and one half of one redeemable warrant to purchase one share of common stock. The shares of common stock and the warrants included in the units traded as a unit until July 1, 2013 when separate trading of common stock and warrants began. In connection with the merger with Lindblad Expeditions, Inc. in 2015, the Company forced the separation of the units into the separate components of common stock and warrants. Each whole warrant entitles its holder, upon exercise, to purchase one share of common stock for $11.50 subject to certain adjustments, during the period that commenced thirty days after the completion of the merger and terminating five years thereafter.
During the year ended December 31, 2019, 27,311 warrants to purchase the Company's common stock were exercised for cash.
Warrant Exchange
On June 14, 2019, the Company launched an offer to exchange all warrants to purchase common stock of the Company (the "Warrant Exchange"). The Warrant Exchange provided (i) an offer to each holder of the Company's outstanding warrants to receive 0.385 shares of common stock in exchange for each warrant tendered by the holder and exchanged pursuant to the Warrant Exchange, and (ii) the solicitation of consents (the "Consent Solicitation") from holders of the warrants to amend the warrant agreement that governs all of the warrants to permit the Company to require that each outstanding warrant not tendered in the Warrant Exchange be converted into 0.36575 shares of common stock. The Warrant Exchange and Consent Solicitation closed on July 17, 2019, with 9,935,000 warrants tendered via the Warrant Exchange for an aggregate of 3,824,959 shares of Company common stock, and approval was received for the Consent Solicitation. The remaining 125,763 warrants not tendered via the Warrant Exchange were converted, per the Consent Solicitation, into 45,981 shares of Company common stock. Following the Warrant Exchange and Consent Solicitation, no warrants remain outstanding.
As the fair value of the warrants tendered in the Warrant Exchange offer was less than the fair value of the common stock issued, the Company recorded a non-cash deemed dividend of approximately $2.7 million for the incremental fair value provided to the warrant holders. The fair value of the Company's common stock and warrants were determined using the closing market prices on August 17, 2019, Level 1 fair value inputs.
Stock and Warrant Repurchase Plan
In 2016, the Company’s Board of Directors approved a $15.0 million increase to the Company’s existing stock and warrant repurchase plan (“Repurchase Plan”), to $35.0 million. This Repurchase Plan authorizes the Company to purchase from time to time the Company’s outstanding common stock. Any shares purchased will be retired. The Repurchase Plan has no time deadline and will continue until otherwise modified or terminated at the sole discretion of the Company’s Board of Directors. The repurchases exclude shares repurchased to settle statutory employee tax withholding related to the vesting of stock awards. Pursuant to the Repurchase Plan, the Company (i) repurchased a total of 1,895 shares of common stock for approximately $23,000 during the year ended December 31, 2019, (ii) repurchased 568,446 warrants for $0.8 million and 9,030 shares of common stock for $0.1 million in 2018, (iii) repurchased a total of 529,867 warrants for $1.1 million and 547,058 shares of common stock for $5.1 million in 2017. Since the Repurchase Plan inception, the Company has cumulatively repurchased 866,701 shares of common stock for $8.2 million and 6,011,926 warrants for $14.7 million, as of December 31, 2019. All repurchases were made using cash resources. The balance available for the Repurchase Plan as of December 31, 2019 was $12.1 million.
NOTE 12 – STOCK-BASED COMPENSATION
In 2017, the Company’s compensation committee approved an employee incentive plan which authorizes awarding restricted stock units (“RSUs”) and performance share units (“PSUs”) to key employees under the Company’s 2015 Long-Term Incentive Plan.
The Company's stock-based compensation program is a long-term retention program that provides for the grant of options, restricted stock, RSUs and performance-based restricted shares or units in order to attract, retain and provide incentives for directors, officers and employees. The maximum number of shares reserved for the grant of awards under the plan is 2.5 million, with approximately 1.3 million shares available as of December 31, 2019. The Company typically settles stock-based awards with newly issued shares.
Restricted Shares and Restricted Share Units
Restricted shares are shares of stock granted to an employee, non-employee director or other service providers for which sale is prohibited for a specified period of time. Restricted shares typically vest ratably over a one or three-year period following the date of grant. RSUs represent a promise to deliver shares to the employee, non-employee director or other service providers at a future date if certain vesting conditions are met. RSUs typically vest ratably over a three-year period following the date of grant. The Company does not deliver the shares associated with the RSUs to the employee, non-employee director or other service providers until the vesting conditions are met. The number of shares granted were determined based upon the closing price of the Company's common stock on the date of the award.
Performance Share Units
PSUs represent a promise to deliver shares to an employee, non-employee director or other service providers for which sale is prohibited for a specified period of time. PSUs represent a promise to deliver shares to the employee, non-employee director or other service providers at a future date if certain performance and vesting conditions are met. PSUs generally vest three years following the date of grant based on the attainment of performance- or market-based goals, all of which are subject to a service condition. The Company does not deliver the shares associated with the PSUs to the employee, non-employee director or other service providers until the performance and vesting conditions are met.
For 2019 and 2018, the PSUs granted may be earned based on the Company's performance against metrics relating to annual Adjusted EBITDA and annual revenue. For 2017, the PSUs granted may be earned based on the Company’s performance against metrics relating to annual Adjusted EBITDA, annual revenue, and guest satisfaction. Awards, if earned, will vest after a three-year performance period and may be earned at a level ranging from 0%-200% of the number of PSUs granted, depending on performance. The number of shares were determined based upon the closing price of the Company's common stock on the date of the award. The Company assessed the applicable metrics related to the PSU grants, determined the blended probability of achieving the performance metrics and valued the awards based on the fair value at the date of grant with the amount of stock compensation expense determined based on the number of PSU’s expected to vest.
2016 CEO Share Allocation Plan
In April 2016, the Company’s Board of Directors adopted the 2016 CEO Share Allocation Plan and in June 2016, the Company’s shareholders approved the 2016 CEO Share Allocation Plan, pursuant to which the Company will grant awards covering up to 1,000,000 shares of the Company’s common stock in the form of restricted stock, restricted stock units, and/or other stock- or cash-based awards to eligible employees and other service providers of the Company. The 2016 CEO Share Allocation Plan was adopted in connection with a contribution agreement that the Company entered into with Sven-Olof Lindblad, Chief Executive Officer and President of the Company, pursuant to which Mr. Lindblad will transfer up to 1,000,000 shares from his holdings of the Company’s common stock (i.e., an equivalent number of shares as is reserved for issuance under the 2016 CEO Share Allocation Plan) (the “Contribution Shares”) to the Company as a contribution to the capital of the Company. Mr. Lindblad will not receive any consideration in exchange for the Contribution Shares. However, as a condition to the contribution of any Contribution Shares, the Company must grant awards under the 2016 CEO Share Allocation Plan, such that the number of Contribution Shares that Mr. Lindblad actually contributes to the Company will equal the number of shares corresponding to awards granted under the plan. The contribution of the Contribution Shares by Mr. Lindblad to the Company will effectively reduce the number of shares of the Company’s common stock that are outstanding by the same number of shares that would be issued under the 2016 CEO Share Allocation Plan (or a lesser number in the event awards are settled in cash). Such contributions will be effective as of the date the Company grants corresponding awards under the 2016 CEO Share Allocation Plan. The administrator may amend, suspend or terminate the 2016 CEO Share Allocation Plan at any time.
On January 10, 2017, Mr. Lindblad contributed to the Company and the Company thereafter granted, 716,550 restricted shares at a grant price of $9.65. The grants vested in three equal installments in January of 2017, 2018 and 2019.
Long-Term Incentive Compensation
See the following table for a summary of PSU, restricted share and RSU activity.
|
Performance-based Share Units |
Restricted Shares and Restricted Share Units |
|||||||||||||||
|
Number of Shares |
Weighted Average Grant Date Fair Value |
Number of Shares |
Weighted Average Grant Date Fair Value |
|||||||||||||
|
Balance, January 1, 2017 |
- | $ | - | 202,021 | $ | 9.90 | ||||||||||
|
Granted |
126,953 | 8.98 | 940,147 | 9.56 | ||||||||||||
|
Vested and released |
- | - | (299,951 | ) | 9.72 | |||||||||||
|
Forfeited |
(39,161 | ) | 8.98 | (63,945 | ) | 9.41 | ||||||||||
|
Balance, December 31, 2017 |
87,792 | 8.98 | 778,272 | 9.60 | ||||||||||||
|
Granted |
88,851 | 10.27 | 217,203 | 11.12 | ||||||||||||
|
Vested and released |
- | - | (352,116 | ) | 9.67 | |||||||||||
|
Forfeited |
(13,863 | ) | 8.98 | (23,633 | ) | 9.60 | ||||||||||
|
Balance, December 31, 2018 |
162,780 | 9.63 | 619,726 | 10.16 | ||||||||||||
|
Granted |
61,631 | 15.25 | 139,168 | 15.97 | ||||||||||||
|
Vested and released |
- | - | (413,661 | ) | 10.11 | |||||||||||
|
Forfeited |
(8,990 | ) | 8.98 | (3,187 | ) | 11.31 | ||||||||||
|
Balance, December 31, 2019 |
215,421 | 11.16 | 342,046 | 12.47 | ||||||||||||
Stock Options
Stock compensation expense related to options are recorded based on the fair value of stock option grants, amortized on a straight-line basis over the employee’s required service period. The Company estimated the fair value of employee stock options using the Black-Scholes option pricing model.
The following table is a summary of stock option activity:
|
Number of Options |
Weighted Average Exercise Price |
Weighted Average Contractual Live (Years) |
Aggregate Intrinsic Value |
|||||||||||||
|
Options outstanding as of January 1, 2017 |
2,130,848 | $ | 2.57 | 2.8 | $ | 146,542,221 | ||||||||||
|
Granted |
- | - | ||||||||||||||
|
Exercised |
(955,424 | ) | 1.76 | |||||||||||||
|
Forfeited |
- | - | ||||||||||||||
|
Options outstanding as of December 31, 2017 |
1,175,424 | 3.23 | 2.4 | 7,707,255 | ||||||||||||
|
Granted |
- | - | ||||||||||||||
|
Exercised |
(955,424 | ) | 1.76 | |||||||||||||
|
Forfeited |
- | - | ||||||||||||||
|
Options outstanding as of December 31, 2018 |
220,000 | 9.63 | 7.6 | 842,000 | ||||||||||||
|
Granted |
- | - | ||||||||||||||
|
Exercised |
(20,000 | ) | 11.26 | |||||||||||||
|
Forfeited |
- | - | ||||||||||||||
|
Options outstanding as of December 31, 2019 |
200,000 | 9.47 | 6.7 | 1,376,000 | ||||||||||||
|
As of December 31, 2019 |
||||||||||||||||
|
Number of Options |
Weighted Average Exercise Price |
Weighted Average Contractual Live (Years) |
Aggregate Intrinsic Value |
|||||||||||||
|
Options vested and/or expected to vest |
200,000 | $ | 9.47 | 6.7 | $ | 1,376,000 | ||||||||||
|
Options exercisable |
150,000 | 9.47 | 6.7 | 1,032,000 | ||||||||||||
During the year ended December 31, 2019, 20,000 stock options, net were exercised at a weighted average exercise price of $11.26 per share in cashless transactions, resulting in the issuance of 5,014 shares of common stock.
Stock-based Compensation Expense
Stock-based compensation expense for 2019, 2018 and 2017 was $3.6 million, $4.4 million and $10.6 million, respectively, and is included in general and administrative expenses. The total income tax benefit recognized for stock-based compensation plans for the years ended December 31, 2019, 2018 and 2017 was $0.1 million, $0.2 million and $0.1 million, respectively. As of December 31, 2019, unrecognized stock-based compensation expense was $4.0 million. This amount is expected to be recognized over a weighted average period of approximately 1.6 years.
NOTE 13 – RELATED PARTY TRANSACTIONS
The Company and National Geographic Society collaborate on exploration, research, technology and conservation in order to provide travel experiences and disseminate geographic knowledge around the globe. The Lindblad/National Geographic Society alliance is set forth in (i) an Alliance and License Agreement and (ii) a Tour Operator Agreement. The extension of the agreements, entered into July 2015, between the Company and National Geographic Society was contingent on the execution by Mr. Lindblad, the Company's Chief Executive Officer, of an option agreement granting National Geographic Society the right to purchase from Mr. Lindblad, for a per share price of $10.00 per share, five percent of the issued and outstanding shares of the Company’s common stock as of July 8, 2015, including all outstanding options, warrants or other derivative securities (excluding options granted under the 2015 Plan and shares issuable upon the exercise of warrants). During March 2019, National Geographic Society exercised its rights in full under the option agreement to acquire the shares, and in a cashless transaction acquired shares from Mr. Lindblad.
On May 4, 2016, in connection with the Company's acquisition of Natural Habitat, Natural Habitat issued an unsecured promissory note to Mr. Bressler, the founder of Natural Habitat, with an outstanding principal amount of $2.5 million due at maturity on December 31, 2020 (See Note 6 – Long-term Debt).
NOTE 14 – SEGMENT INFORMATION
The Company’s chief operating decision maker, or CODM, assesses performance and allocates resources based upon the separate financial information from the Company’s operating segments. In identifying its reportable segments, the Company considered the nature of services provided, the geographical areas in which the segments operated and other relevant factors.
The Company is primarily a specialty cruise operator with operations in two segments, Lindblad and Natural Habitat. While both segments have similar characteristics, the two operating and reporting segments cannot be aggregated because they fail to meet the requirements for aggregation. The Company evaluates the performance of the business based largely on the results of its operating segments. The CODM and management review operating results monthly, and base operating decisions on the total results at a consolidated level, as well as at a segment level. The reports provided to the Board of Directors are at a consolidated level and also contain information regarding the separate results of both segments.
The Company evaluates the performance of its business segments based largely on tour revenues and operating income, without allocating other income and expenses, net, income taxes and interest expense, net. For the full year ended December 31, 2019, 2018 and 2017, segment operating results were as follows:
|
For the years ended December 31, |
||||||||||||||||||||||||||||
|
2019 |
2018 |
Change |
% |
2017 |
Change |
% |
||||||||||||||||||||||
|
(In thousands) |
||||||||||||||||||||||||||||
|
Tour revenues: |
||||||||||||||||||||||||||||
|
Lindblad |
$ | 272,410 | $ | 246,334 | $ | 26,076 | 11 | % | $ | 216,815 | $ | 29,519 | 14 | % | ||||||||||||||
|
Natural Habitat |
70,681 | 63,400 | 7,281 | 11 | % | 49,689 | 13,711 | 28 | % | |||||||||||||||||||
|
Total tour revenues |
$ | 343,091 | $ | 309,734 | $ | 33,357 | 11 | % | $ | 266,504 | $ | 43,230 | 16 | % | ||||||||||||||
|
Operating Income: |
||||||||||||||||||||||||||||
|
Lindblad |
$ | 26,203 | $ | 19,798 | $ | 6,405 | 32 | % | $ | 7,292 | $ | 12,506 | 172 | % | ||||||||||||||
|
Natural Habitat |
6,995 | 5,540 | 1,455 | 26 | % | 3,452 | 2,088 | 60 | % | |||||||||||||||||||
|
Total operating income |
$ | 33,198 | $ | 25,338 | $ | 7,860 | 31 | % | $ | 10,744 | $ | 14,594 | 136 | % | ||||||||||||||
Intercompany tour revenues between the Lindblad and Natural Habitat segments eliminated in consolidation and in the presentation above for the years ended December 31, 2019, 2018 and 2017 were $5.6 million, $3.7 million and $2.0 million, respectively.
Depreciation and amortization are included in segment operating income as shown below:
|
For the years ended December 31, |
||||||||||||||||||||||||||||
|
2019 |
2018 |
Change |
% |
2017 |
Change |
% |
||||||||||||||||||||||
| (In thousands) | ||||||||||||||||||||||||||||
|
Depreciation and amortization: |
||||||||||||||||||||||||||||
|
Lindblad |
$ | 24,116 | $ | 19,277 | $ | 4,839 | 25 | % | $ | 15,969 | $ | 3,308 | 21 | % | ||||||||||||||
|
Natural Habitat |
1,653 | 1,491 | 162 | 11 | % | 1,382 | 109 | 8 | % | |||||||||||||||||||
|
Total depreciation and amortization |
$ | 25,769 | $ | 20,768 | $ | 5,001 | 24 | % | $ | 17,351 | $ | 3,417 | 20 | % | ||||||||||||||
The following table presents our total assets, intangibles, net and goodwill by segment:
|
As of December 31, |
||||||||
|
(In thousands) |
2019 |
2018 |
||||||
|
Total Assets: |
||||||||
|
Lindblad |
$ | 471,499 | $ | 409,622 | ||||
|
Natural Habitat |
77,159 | 63,787 | ||||||
|
Total assets |
$ | 548,658 | $ | 473,409 | ||||
|
Intangibles, net: |
||||||||
|
Lindblad |
$ | 3,325 | $ | 4,050 | ||||
|
Natural Habitat |
3,071 | 3,925 | ||||||
|
Total intangibles, net |
$ | 6,396 | $ | 7,975 | ||||
|
Goodwill: |
||||||||
|
Lindblad |
$ | - | $ | - | ||||
|
Natural Habitat |
22,105 | 22,105 | ||||||
|
Total goodwill |
$ | 22,105 | $ | 22,105 | ||||
NOTE 15 – QUARTERLY FINANCIAL DATA – UNAUDITED
Provided below are selected unaudited quarterly financial data for 2019 and 2018. The information has been derived from our unaudited condensed consolidated financial statements. In the opinion of management, the unaudited condensed consolidated financial statements have been prepared on a basis consistent with the consolidated financial statements which appear elsewhere in this Annual Report on Form 10-K and include all adjustments necessary for a fair statement of the financial position and results of operations for such unaudited periods. Historical results are not necessarily indicative of results to be expected in the future.
The earnings per share information is calculated independently for each quarter based on the weighted average common stock and common stock equivalents outstanding, which may fluctuate, based on factors such as the number of shares in a period that are issued, vest, or repurchased, our quarterly income levels and our stock’s market prices. Therefore, the sum of the quarters’ per share information may not equal the annual amount presented on the consolidated statements of operations.
The following is the quarterly financial data for the years ended December 31, 2019 and 2018:
|
2019 |
||||||||||||||||||||
|
(In thousands, except per share data) |
First Quarter |
Second Quarter |
Third Quarter |
Fourth Quarter |
Year |
|||||||||||||||
|
Tour revenues |
$ | 89,654 | $ | 76,658 | $ | 100,983 | $ | 75,796 | $ | 343,091 | ||||||||||
|
Net income |
$ | 15,079 | $ | 851 | $ | 2,726 | $ | 92 | $ | 18,748 | ||||||||||
|
Diluted earnings (loss) per share |
$ | 0.31 | $ | 0.02 | $ | (0.01 | ) | $ | (0.03 | ) | $ | 0.28 | ||||||||
|
2018 |
||||||||||||||||||||
|
(In thousands, except per share data) |
First Quarter |
Second Quarter |
Third Quarter |
Fourth Quarter |
Year |
|||||||||||||||
|
Tour revenues |
$ | 82,410 | $ | 69,473 | $ | 87,242 | $ | 70,609 | $ | 309,734 | ||||||||||
|
Net income (loss) |
$ | 10,917 | $ | (159 | ) | $ | 5,346 | $ | (4,552 | ) | $ | 11,552 | ||||||||
|
Diluted earnings (loss) per share |
$ | 0.24 | $ | - | $ | 0.11 | $ | (0.10 | ) | $ | 0.24 | |||||||||