Attached files
| file | filename |
|---|---|
| EX-32 - EX-32 - Bain Capital Specialty Finance, Inc. | a2240725zex-32.htm |
| EX-31.2 - EX-31.2 - Bain Capital Specialty Finance, Inc. | a2240725zex-31_2.htm |
| EX-31.1 - EX-31.1 - Bain Capital Specialty Finance, Inc. | a2240725zex-31_1.htm |
| EX-10.24 - EX-10.24 - Bain Capital Specialty Finance, Inc. | a2240725zex-10_24.htm |
| EX-10.23 - EX-10.23 - Bain Capital Specialty Finance, Inc. | a2240725zex-10_23.htm |
| EX-10.17 - EX-10.17 - Bain Capital Specialty Finance, Inc. | a2240725zex-10_17.htm |
Use these links to rapidly review the document
TABLE OF CONTENTS
INDEX TO CONSOLIDATED FINANCIAL STATEMENTS
UNITED STATES
SECURITIES AND EXCHANGE COMMISSION
Washington, D.C. 20549
FORM 10-K
| (Mark One) | ||
ý |
ANNUAL REPORT PURSUANT TO SECTION 13 OR 15(d) OF THE SECURITIES EXCHANGE ACT OF 1934 |
|
For the fiscal year ended December 31, 2019 |
||
| OR | ||
| o | TRANSITION REPORT PURSUANT TO SECTION 13 OR 15(d) OF THE SECURITIES EXCHANGE ACT OF 1934 |
|
Commission file number: 814-01175
BAIN CAPITAL SPECIALTY FINANCE, INC.
(Exact Name of Registrant as Specified in its Charter)
| Delaware (State or Other Jurisdiction of Incorporation or Organization) |
81-2878769 (I.R.S. Employer Identification No.) |
|
200 Clarendon Street, 37th Floor Boston, MA (Address of Principal Executive Office) |
02116 (Zip Code) |
(617) 516-2000
(Registrant's Telephone Number, Including Area Code)
Securities registered pursuant to Section 12(b) of the Act:
| Title of each class | Trading Symbol(s) | Name of each exchange on which registered | ||
|---|---|---|---|---|
| Common Stock, par value $0.001 per share | BCSF | New York Stock Exchange |
Securities registered pursuant to Section 12(g) of the Act: None
Indicate by check mark if the registrant is a well-known seasoned issuer, as defined in Rule 405 of the Securities Act. Yes o No ý
Indicate by check mark if the registrant is not required to file reports pursuant to Section 13 or Section 15(d) of the Act. Yes o No ý
Indicate by check mark whether the registrant: (1) has filed all reports required to be filed by Section 13 or 15(d) of the Securities Exchange Act of 1934 during the preceding 12 months (or for such shorter period that the registrant was required to file such reports), and (2) has been subject to such filing requirements for the past 90 days. Yes ý No o
Indicate by check mark whether the registrant has submitted electronically, and every Interactive Data File required to be submitted pursuant to Rule 405 of Regulation S-T (§232.405 of this chapter) during the preceding 12 months (or for such shorter period that the registrant was required to submit such files). Yes o No o
Indicate by check mark whether the registrant is a large accelerated filer, an accelerated filer, a non-accelerated filer, a smaller reporting company or an emerging growth company. See the definitions of "large accelerated filer," "accelerated filer," "smaller reporting company" and "emerging growth company" in Rule 12b-2 of the Exchange Act. (check one):
| Large accelerated filer ý | Accelerated filer o | |
| Non-accelerated filer o | Smaller reporting company o | |
| Emerging growth company o |
If an emerging growth company, indicate by check mark if the registrant has elected not to use the extended transition period for complying with any new or revised financial accounting standards provided pursuant to Section 13(a) of the Exchange Act. o
Indicate by check mark whether the registrant is a shell company (as defined in Rule 12b-2 of the Act). Yes o No ý
The aggregate market value of the voting and non-voting common equity held by non-affiliates of the registrant, was $738.5 million based on the number of shares held by non-affiliates of the registrant as of June 28, 2019 (the last business day of the registrant's mostly recently completed second fiscal quarter). Shares of the registrant's common stock held by each executive officer, director and holder of 5% or more of the outstanding common stock have been excluded in that such persons may be deemed to be affiliates. This calculation does not reflect a determination that certain persons are affiliates of the registrant for any other purpose. As of February 26, 2020, there were 51,649,812.27 shares of common stock outstanding.
Documents Incorporated by Reference
Portions of the registrant's definitive proxy statement to be filed with the Securities and Exchange Commission pursuant to Regulation 14A in connection with the registrant's 2020 Annual Meeting of Stockholders, which will be filed subsequent to the date hereof, are incorporated by reference into Part III of this Form 10-K where indicated. Such definitive proxy statement will be filed with the Securities and Exchange Commission not later than 120 days following the end of the registrant's fiscal year ended December 31, 2019.
2
Except as otherwise specified in this Annual Report on Form 10-K ("Annual Report"), the terms "we," "us," "our", and the "Company" refer to Bain Capital Specialty Finance, Inc.
Statements contained in this Annual Report (including those relating to current and future market conditions and trends in respect thereof) that are not historical facts are based on current expectations, estimates, projections, opinions and/or beliefs of the Company, BCSF Advisors, LP (the "Advisor") and/or Bain Capital Credit, LP and its affiliated advisers (collectively, "Bain Capital Credit"). Such statements involve known and unknown risks, uncertainties and other factors and undue reliance should not be placed thereon. Certain information contained in this Annual Report constitutes "forward-looking statements," which can be identified by the use of forward-looking terminology such as "may," "will," "should," "seek," "expect," "anticipate," "project," "estimate," "intend," "continue," "target," or "believe" or the negatives thereof or other variations thereon or comparable terminology. Due to various risks and uncertainties, actual events or results or the actual performance of the Company may differ materially from those reflected or contemplated in such forward-looking statements. These statements are not guarantees of future performance and are subject to risks, uncertainties, and other factors, some of which are beyond our control and are difficult to predict, that could cause actual results to differ materially from those expressed or forecasted in the forward-looking statements including, without limitation, the risks, uncertainties and other factors we identify in the section entitled "Item 1A. Risk Factors" and elsewhere in this Annual Report and in our filings with the Securities Exchange Commission (the "SEC").
Although we believe that the assumptions on which these forward-looking statements are based are reasonable, some of those assumptions may be based on the work of third parties and any of those assumptions could prove to be inaccurate; as a result, the forward-looking statements based on those assumptions also could prove to be inaccurate. In light of these and other uncertainties, the inclusion of a projection or forward-looking statement in this Annual Report should not be regarded as a representation by us that our plans and objectives will be achieved. These risks and uncertainties include those described or identified in the section entitled "Item 1A. Risk Factors" and elsewhere in this Annual Report. Investors should not place undue reliance on these forward-looking statements, which apply only as of the date of this Annual Report. We do not undertake any obligation to update or revise any forward-looking statements or any other information contained herein, except as required by applicable law. The safe harbor provisions of Section 21E of the Securities Exchange Act of 1934, as amended (the "Exchange Act"), which preclude civil liability for certain forward-looking statements, do not apply to the forward-looking statements in this Annual Report because we are an investment company.
3
Bain Capital Specialty Finance, Inc. (the "Company") was formed on October 5, 2015 ("Inception") as a Delaware corporation structured as an externally managed, closed-end, non-diversified management investment company. The Company commenced investment operations on October 13, 2016 ("Commencement"). The Company has elected to be treated as a business development company ("BDC") under the Investment Company Act of 1940, as amended (the "1940 Act"). In addition, the Company has elected to be treated for U.S. federal income tax purposes as a regulated investment company (a "RIC") under Subchapter M of the Internal Revenue Code of 1986, as amended (the "Code"). As a RIC, the Company will not be taxed on its income to the extent that it distributes such income each year and satisfies other applicable income tax requirements.
On October 6, 2016, the Company completed its initial closing of capital commitments (the "Initial Closing") and subsequently commenced substantial investment operations. On November 19, 2018, the Company closed its initial public offering (the "IPO") issuing 7,500,000 shares of its common stock at a public offering price of $20.25 per share. Shares of common stock of the Company began trading on the New York Stock Exchange under the symbol "BCSF" on November 15, 2018.
The Company is managed by the Advisor, an investment adviser that is registered with the SEC under the Investment Advisers Act of 1940, as amended (the "Advisers Act"). The Advisor also provides the administrative services necessary for the Company to operate (in such capacity, the "Administrator"). Company management consists of investment and administrative professionals from the Advisor and Administrator along with the Board of Directors (the "Board"). The Advisor directs and executes the investment operations and capital raising activities of the Company subject to oversight from the Board, which sets the broad policies of the Company. The Board has delegated investment management of the Company's investment assets to the Advisor. The Board consists of seven directors, five of whom are independent.
Our primary focus is capitalizing on opportunities within Bain Capital Credit's Senior Direct Lending Strategy, as defined below, which seeks to provide risk-adjusted returns and current income to investors by investing primarily in middle-market companies with between $10.0 million and $150.0 million in annual earnings before interest, taxes, depreciation and amortization ("EBITDA"). However, we may, from time to time, invest in larger or smaller companies. We focus on senior investments with a first or second lien on collateral and strong structures and documentation intended to protect the lender (including "unitranche" loans, which are loans that combine both senior and mezzanine debt). We generally seek to retain effective voting control in respect of the loans or particular class of securities in which we invest through maintaining affirmative voting positions or negotiating consent rights that allow us to retain a blocking position. We may also invest in mezzanine debt and other junior securities, including common and preferred equity, on an opportunistic basis, and in secondary purchases of assets or portfolios, but such investments are not the principal focus of our investment strategy. We may also invest, from time to time, in distressed debt, debtor-in-possession loans, structured products, structurally subordinate loans, investments with deferred interest features, zero-coupon securities and defaulted securities. Our investments are subject to a number of risks. See "Item 1A. Risk Factors—Risks Related to Our Investments." Leverage may be utilized to help the Company meet its investment objective. Any such leverage would be expected to increase the total capital available for investment by the Company.
4
We may invest in debt securities which are either rated below investment grade or not rated by any rating agency but, if they were rated, would be rated below investment grade. Below investment grade securities, which are often referred to as "junk," have predominantly speculative characteristics with respect to the issuer's capacity to pay interest and repay principal. They may also be illiquid and difficult to value.
We may borrow money from time to time within the levels permitted by the 1940 Act. On November 28, 2018, the Board approved the reduction of the Company's asset coverage requirements in Section 61(a)(2) of the 1940 Act to 150% and recommended the stockholders to vote in favor of the proposal at the special stockholder meeting on February 1, 2019. On February 1, 2019, the Company's stockholders approved the application of the reduced asset coverage. Effective February 2, 2019, the Company is permitted to borrow amounts such that its asset coverage ratio is at least 150% after such borrowing (if certain requirements are met), rather than 200%, as previously required. In determining whether to borrow money, we will analyze the maturity, covenant package and rate structure of the proposed borrowings as well as the risks of such borrowings compared to our investment outlook. The use of borrowed funds or the proceeds of preferred stock offerings to make investments would have its own specific set of benefits and risks, and all of the costs of borrowing funds or issuing preferred stock would be borne by holders of our common stock. See "Item 1A. Risk Factors—Risks Relating to Our Business and Structure—Our strategy involves a high degree of leverage. We intend to continue to finance our investments with borrowed money, which will magnify the potential for gain or loss on amounts invested and may increase the risk of investing in us. The risks of investment in a highly leverage fund include volatility and possible distribution restrictions."
The Investment Advisor
The Company's investment activities are managed by the Advisor, an investment adviser that is registered with the SEC under the Advisers Act. The Advisor is responsible for originating prospective investments, conducting research and due diligence investigations on potential investments, analyzing investment opportunities, negotiating and structuring our investments and monitoring our investments and portfolio companies on an ongoing basis. More information regarding the Advisor and its business activities can be found on its registration under Form ADV located on the Investment Adviser Registration Depository website of the SEC.
The Advisor has entered into a Resource Sharing Agreement (the "Resource Sharing Agreement") with Bain Capital Credit, LP ("Bain Capital Credit"), pursuant to which Bain Capital Credit provides the Advisor with experienced investment professionals (including the members of the Advisor's Credit Committee) and access to the resources of Bain Capital Credit so as to enable the Advisor to fulfill its obligations under the investment advisory agreement (the "Investment Advisory Agreement"). Through the Resource Sharing Agreement, the Advisor intends to capitalize on the significant deal origination, credit underwriting, due diligence, investment structuring, execution, portfolio management and monitoring experience of Bain Capital Credit's investment professionals. There can be no assurance that Bain Capital Credit will perform its obligations under the Resource Sharing Agreement. The Resource Sharing Agreement may be terminated by either party on 60 days' notice, which if terminated may have a material adverse consequence on the Company's operations. See "Item 13. Certain Relationships and Related Transactions, and Director Independence."
About Bain Capital Credit
Bain Capital Credit was established in 1998. Bain Capital Credit and its subsidiaries (including the credit vehicles managed by its Alternative Investment Fund Manager affiliate) had approximately $44.3 billion in assets under management as of December 31, 2019. To date, Bain Capital Credit has
5
invested across the credit products and fixed income universe, including performing and distressed bank loans, high yield bonds, debtor-in-possession loans, senior direct lending, mezzanine debt and other junior securities, structured products, credit-based equities and other investments. Bain Capital Credit has invested over $12.1 billion in the Senior Direct Lending Strategy since 1999 (of which approximately $2.7 billion has been invested within the 12-month period ended December 31, 2019) and has an extensive track record as a non-traditional lender in the middle market. The Senior Direct Lending Strategy is defined as primarily consisting of investments in secured debt in companies with EBITDA of $10.0 million to $150.0 million.
Bain Capital Credit is a wholly-owned subsidiary of Bain Capital, LP ("Bain Capital") and the Advisor is a majority-owned subsidiary of Bain Capital Credit. As a diversified private investment firm, Bain Capital and its affiliates, including Bain Capital Credit and the Advisor, engage in a broad range of activities, including investment activities for their own account and for the account of other investment funds or accounts, and provide investment banking, advisory, management and other services to funds and operating companies.
The Board of Directors
Our business and affairs are managed under the direction of the Board. The Board consists of seven members, five of whom are not "interested persons" of the Company, the Advisor or their respective affiliates as defined in Section 2(a)(19) of the 1940 Act. We refer to these individuals as our "Independent Directors." The Independent Directors compose a majority of the Board. The Board elects our officers, who serve at the discretion of the Board. The responsibilities of the Board include quarterly determinations of fair value of our assets, corporate governance activities, oversight of our financing arrangements and oversight of our investment activities.
Investment Decision Process
The Advisor's investment process can be broken into four processes: (1) Sourcing and Idea Generation, (2) Investment Diligence & Recommendation, (3) Credit Committee Approval and Portfolio Construction and (4) Portfolio & Risk Management.
Sourcing and Idea Generation
The investment decision-making process begins with sourcing ideas. Bain Capital Credit's Private Credit Group interacts with over 1,500 global contacts as a means to generate middle market investment opportunities. Our Advisor also seeks to leverage the contacts of Bain Capital Credit's industry groups, Trading Desk, Portfolio Group and Restructuring team, including private equity firms, banks and a variety of advisors and other intermediaries.
Investment Diligence & Recommendation
Our Advisor utilizes Bain Capital Credit's bottom-up approach to investing, and it starts with the due diligence performed by its Private Credit Group. The group works with the close support of Bain Capital Credit's industry groups. This diligence process typically begins with a detailed review of an offering memorandum as well as Bain Capital Credit's own independent diligence efforts, including in-house materials and expertise, third-party independent research and interviews, and hands-on field checks where appropriate. For deals that progress beyond an initial stage, the team will usually schedule one or more meetings with company management, facilities visits and also meetings with the sponsor in order to ask more detailed questions and to better understand the sponsor's view of the business and plans
6
for it going forward. The team's diligence work is summarized in investment memoranda and accompanying credit packs. Work product also includes full models and covenant analysis.
Credit Committee Approval and Portfolio Construction
If the reviewing team deems an investment worthy of serious consideration, it generally must be presented to the credit committee, which is comprised of at least three experienced credit professionals, who are selected based on strategy and geography. A portfolio manager leads the decision making process for each investment and engages the credit committee throughout the investment process in order to prioritize and direct the underwriting of each potential investment opportunity. For middle market holdings, the path to exit an investment is often discussed at credit committee meetings, including restructurings, acquisitions and sale to strategic buyers. Since most middle market investments are illiquid, exits are driven by a sale of the portfolio company or a refinancing of the portfolio company's debt.
Portfolio & Risk Management
Our Advisor utilizes Bain Capital Credit's Private Credit Group for the daily monitoring of its respective credits after an investment has been made. Our Advisor believes that the ongoing monitoring of financial performance and market developments of portfolio investments is critical to successful investment management. Accordingly, our Advisor is actively involved in an on-going portfolio review process and attends board meetings. To the extent a portfolio investment is not meeting our Advisor's expectations, our Advisor takes corrective action when it deems appropriate, which may include raising interest rates, gaining a more influential role on its board, taking warrants and, where appropriate, restructuring the balance sheet to take control of the company. Our Advisor will utilize the Bain Capital Credit Risk and Oversight Committee. The Risk and Oversight Committee is responsible for monitoring and reviewing risk management, including portfolio risk, counterparty risk and firm-wide risk issues. In addition to the methods noted above, there are a number of proprietary methods and tools used through all levels of Bain Capital Credit to manage portfolio risk.
Investment Strategy
The Advisor, through the resources and personnel provided by Bain Capital Credit through the Resource Sharing Agreement, uses detailed business, industry and competitive analyses to make investments. In evaluating potential opportunities, Bain Capital Credit's investment professionals typically complete market analyses to assess the attractiveness of a given industry and a specific investment and monitor, on an ongoing basis, financial performance and market developments. The Advisor's approach to making investments generally involves evaluating the following business characteristics: market definition, market size and growth prospects, competitive analysis, historical financial performance, margin analysis and cost structure, quality of earnings, capital structure, access to capital markets and regulatory, risk analysis, tax and legal matters. Additionally, the Advisor places significant emphasis on the quality and track record of the controlling stockholders and management team as well as careful consideration to the underlying deal structure and documentation. When considering an investment that meets the Company's return objectives, the Advisor seeks to mitigate downside risk.
We seek to create a broad and varied portfolio of investments across various industries as a method to manage risk and capitalize on specific sector trends, all concentrated in a small number of industries.
7
Investment Focus
Our primary focus is capitalizing on senior middle market lending opportunities. We seek to provide risk adjusted returns and current income to investors by investing primarily in middle market companies with between $10.0 million and $150.0 million in EBITDA. However, we may, from time to time, invest in larger or smaller companies. We focus on senior investments with a first or second lien on collateral and strong structures and documentation intended to protect the lender. We generally seek to retain effective voting control in respect of the loans or particular class of securities in which we invest through maintaining affirmative voting positions or negotiating consent rights that allow us to retain a blocking position. We may also invest in mezzanine debt and other junior securities, including common and preferred equity, on an opportunistic basis, and in secondary purchases of assets or portfolios, but such investments are not the principal focus of our investment strategy. We may also invest, from time to time, in distressed debt, debtor in possession loans, structured products, structurally subordinate loans, investments with deferred interest features, zero coupon securities and defaulted securities. The Company may also invest, from time to time, in equity securities, distressed debt, debtor in possession loans, structured products, structurally subordinate loans, investments with deferred interest features, zero coupon securities and defaulted securities. Leverage is expected to be utilized to help the Company meet its investment objective. Any such leverage, if incurred, is expected to increase the total capital available for investment by the Company. As a BDC, we may also invest up to 30% of our portfolio opportunistically in "non qualifying" portfolio investments, such as investments in non U.S. companies.
We may invest in securities that are rated below investment grade by rating agencies or that would be rated below investment grade if they were rated (i.e. junk bonds). See "Item 1A. Risk Factors—Risks Related to Our Investments—The lack of liquidity in our investments may adversely affect our business." Our investments also may include non-cash income features, including PIK interest and OID. See "Item 1A. Risk Factors—Risks Related to Our Investments—Our investments in OID and PIK interest income may expose us to risks associated with such income being required to be included in accounting income and taxable income prior to receipt of cash."
As of December 31, 2019, our portfolio consisted of the following (dollars in thousands):
| |
As of December 31, 2019 | ||||||||||||
|---|---|---|---|---|---|---|---|---|---|---|---|---|---|
| |
Amortized Cost | Percentage of Total Portfolio |
Fair Value | Percentage of Total Portfolio |
|||||||||
First Lien Senior Secured Loans |
$ | 2,167,932 | 85.4 | % | $ | 2,165,844 | 85.7 | % | |||||
First Lien Last Out Loans |
28,315 | 1.1 | 29,300 | 1.2 | |||||||||
Second Lien Senior Secured Loans |
187,565 | 7.4 | 175,670 | 7.0 | |||||||||
Subordinated Debt |
14,752 | 0.6 | 15,000 | 0.5 | |||||||||
Corporate Bonds |
22,412 | 0.9 | 17,508 | 0.7 | |||||||||
Equity Interests |
96,736 | 3.8 | 99,293 | 3.9 | |||||||||
Preferred Equity |
19,551 | 0.8 | 24,318 | 1.0 | |||||||||
Warrants |
— | 0.0 | 122 | 0.0 | |||||||||
| | | | | | | | | | | | | | |
Total |
$ | 2,537,263 | 100.0 | % | $ | 2,527,055 | 100.0 | % | |||||
| | | | | | | | | | | | | | |
| | | | | | | | | | | | | | |
| | | | | | | | | | | | | | |
8
As of December 31, 2018, our portfolio consisted of the following (dollars in thousands):
| |
As of December 31, 2018 | ||||||||||||
|---|---|---|---|---|---|---|---|---|---|---|---|---|---|
| |
Amortized Cost | Percentage of Total Portfolio |
Fair Value | Percentage of Total Portfolio |
|||||||||
First Lien Senior Secured Loans |
$ | 1,074,413 | 61.3 | % | $ | 1,058,839 | 61.3 | % | |||||
First Lien Last Out Loans |
27,325 | 1.5 | 27,488 | 1.6 | |||||||||
Second Lien Senior Secured Loans |
263,759 | 15.0 | 258,139 | 14.9 | |||||||||
Subordinated Debt |
39,711 | 2.3 | 39,625 | 2.3 | |||||||||
Corporate Bonds |
41,387 | 2.4 | 35,023 | 2.0 | |||||||||
Investment Vehicles (1) |
279,891 | 16.0 | 279,363 | 16.2 | |||||||||
Equity Interests |
24,078 | 1.4 | 26,522 | 1.5 | |||||||||
Preferred Equity |
2,553 | 0.1 | 2,807 | 0.2 | |||||||||
Warrants |
— | 0.0 | — | 0.0 | |||||||||
| | | | | | | | | | | | | | |
Total |
$ | 1,753,117 | 100.0 | % | $ | 1,727,806 | 100.0 | % | |||||
| | | | | | | | | | | | | | |
| | | | | | | | | | | | | | |
| | | | | | | | | | | | | | |
- (1)
- Represents equity investment in ABCS.
The Advisor monitors our portfolio companies on an ongoing basis. It monitors the financial trends of each portfolio company to determine if they are meeting their respective business plans and to assess the appropriate course of action for each company. The Advisor has several methods of evaluating and monitoring the performance and fair value of our investments, which may include the following:
- •
- assessment of success in adhering to the portfolio company's business plan and compliance with covenants;
- •
- periodic or regular contact with portfolio company management and, if appropriate, the financial or strategic sponsor to discuss
financial position, requirements and accomplishments;
- •
- comparisons to our other portfolio companies in the industry, if any;
- •
- attendance at and participation in board meetings or presentations by portfolio companies; and
- •
- review of monthly and quarterly consolidated financial statements and financial projections of portfolio companies.
The Advisor rates the investments in our portfolio at least quarterly and it is possible that the rating of a portfolio investment may be reduced or increased over time. For investments rated 3 or 4, the Advisor enhances its level of scrutiny over the monitoring of such portfolio company. Our internal performance ratings do not constitute any rating of investments by a nationally recognized statistical rating organization or represent or reflect any third-party assessment of any of our investments.
- •
- An investment is rated 1 if, in the opinion of the Advisor, it is performing above underwriting expectations, and the business trends and risk factors are generally favorable, which may include the performance of the portfolio company or the likelihood of a potential exit.
9
- •
- An investment is rated 2 if, in the opinion of the Advisor, it is performing as expected at the time of our underwriting and there
are generally no concerns about the portfolio company's performance or ability to meet covenant requirements, interest payments or principal amortization, if applicable. All new investments or
acquired investments in new portfolio companies are initially given a rating of 2.
- •
- An investment is rated 3 if, in the opinion of the Advisor, the investment is performing below underwriting expectations and there
may be concerns about the portfolio company's performance or trends in the industry, including as a result of factors such as declining performance, non-compliance with debt covenants or delinquency
in loan payments (but generally not more than 180 days past due).
- •
- An investment is rated 4 if, in the opinion of the Advisor, the investment is performing materially below underwriting expectations. For debt investments, most of or all of the debt covenants are out of compliance and payments are substantially delinquent. Investments rated 4 are not anticipated to be repaid in full, if applicable, and there is significant risk that we may realize a substantial loss on our investment.
The following table shows the composition of our portfolio on the 1 to 4 rating scale as of December 31, 2019 (dollars in thousands):
| |
As of December 31, 2019 | ||||||||||||
|---|---|---|---|---|---|---|---|---|---|---|---|---|---|
| Investment Performance Rating | Fair Value | Percentage of Total |
Number of Companies |
Percentage of Total |
|||||||||
1 |
$ | 140,892 | 5.6 | % | 4 | 3.5 | % | ||||||
2 |
2,355,401 | 93.2 | 106 | 93.0 | |||||||||
3 |
27,333 | 1.1 | 3 | 2.6 | |||||||||
4 |
3,429 | 0.1 | 1 | 0.9 | |||||||||
| | | | | | | | | | | | | | |
Total |
$ | 2,527,055 | 100.0 | % | 114 | 100.0 | % | ||||||
| | | | | | | | | | | | | | |
| | | | | | | | | | | | | | |
| | | | | | | | | | | | | | |
The following table shows the composition of our portfolio on the 1 to 4 rating scale as of December 31, 2018 (dollars in thousands):
| |
As of December 31, 2018 | ||||||||||||
|---|---|---|---|---|---|---|---|---|---|---|---|---|---|
| Investment Performance Rating | Fair Value | Percentage of Total |
Number of Companies |
Percentage of Total |
|||||||||
1 |
$ | 17,301 | 1.0 | % | 1 | 0.7 | % | ||||||
2 |
1,684,494 | 97.5 | 128 | 97.0 | |||||||||
3 |
26,011 | 1.5 | 3 | 2.3 | |||||||||
4 |
— | — | — | — | |||||||||
| | | | | | | | | | | | | | |
Total |
$ | 1,727,806 | 100.0 | % | 132 | 100.0 | % | ||||||
| | | | | | | | | | | | | | |
| | | | | | | | | | | | | | |
| | | | | | | | | | | | | | |
Competition
Our primary competitors in providing financing to middle-market companies include public and private funds, other business development companies, commercial and investment banks, commercial financing companies and, to the extent they provide an alternative form of financing, private equity and hedge funds. Some of our competitors are substantially larger and have considerably greater financial, technical and marketing resources than we do. For example, we believe some competitors may have access to funding sources that are not available to us. In addition, some of our competitors may have higher risk
10
tolerances or different risk assessments, which could allow them to consider a wider variety of investments and establish more relationships than us. Furthermore, many of our competitors are not subject to the regulatory restrictions that the 1940 Act imposes on us as a BDC or to the distribution and other requirements we must satisfy to maintain our qualification as a RIC.
We expect to use the expertise of the investment professionals of Bain Capital Credit to which we have access to assess investment risks and determine appropriate pricing for our investments in portfolio companies. In addition, we expect that the relationships of Bain Capital Credit will enable us to learn about, and compete effectively for, financing opportunities with attractive middle-market companies in the industries in which we seek to invest. For additional information concerning the competitive risks we face, see "Item 1A. Risk Factors—Risks Relating to Our Business and Structure—We operate in an increasingly competitive market for investment opportunities, which could reduce returns and result in losses."
Investment Advisory Agreement; Administration Agreement
Our investment activities are managed by the Advisor, which is responsible for originating prospective investments, conducting research and due diligence investigations on potential investments, analyzing investment opportunities, negotiating and structuring our investments and monitoring our investments and portfolio companies on an ongoing basis. We have entered into an Investment Advisory Agreement with the Advisor, pursuant to which we have agreed to pay the Advisor a base management fee and an incentive fee for its services. The cost of both the base management fee and the incentive fee will ultimately be borne by our stockholders.
The base management fee is calculated at an annual rate of 1.5% of our gross assets, including assets purchased with borrowed funds or other forms of leverage but excluding cash and cash equivalents. For services rendered under the Investment Advisory Agreement, the base management fee is payable quarterly in arrears. The base management fee is calculated based on the average value of our gross assets at the end of the two most recently completed calendar quarters, and appropriately adjusted for any share issuances or repurchases during the current calendar quarter. Base management fee for any partial month or quarter will be appropriately pro-rated. For purposes of the Investment Advisory Agreement, cash equivalents means U.S. government securities and commercial paper instruments maturing within one year of purchase. Effective February 1, 2019, the base management fee has been revised to a tiered management fee structure so that the base management fee of 1.5% (0.375% per quarter) of the average value of the Company's gross assets (excluding cash and cash equivalents, but including assets purchased with borrowed amounts) will continue to apply to assets held at an asset coverage ratio down to 200%, but a lower base management fee of 1.0% (0.25% per quarter) of the average value of the Company's gross assets (excluding cash and cash equivalents, but including assets purchased with borrowed amounts) will apply to any amount of assets attributable to leverage decreasing the Company's asset coverage ratio below 200%.
The Advisor contractually waived its right to receive the Base Management Fee in excess of 0.75% of the aggregate gross assets excluding cash (including capital drawn to pay the Company's expenses) during any period prior to the IPO. Additionally, for the period from the date of the IPO through December 31, 2018, the Advisor voluntarily waived its right to receive the Base Management Fee in excess of 0.75%. The Advisor was not permitted to recoup any waived amounts. In certain previous filings, management fees were presented on a net basis.
We will pay the Advisor an incentive fee. The incentive fee will consist of two parts—an incentive fee based on income and an incentive fee based on capital gains—which are described in more detail below.
11
Pre-incentive fee net investment income means interest income, dividend income and any other income (including any other fees such as commitment, origination, structuring, diligence and consulting fees or other fees that the Company receives from portfolio companies but excluding fees for providing managerial assistance) accrued during the calendar quarter, minus operating expenses for the quarter (including the Base Management Fee, any expenses payable under the Administration Agreement, and any interest expense and dividends paid on any outstanding preferred stock, but excluding the incentive fee). Pre-incentive fee net investment income includes, in the case of investments with a deferred interest feature such as market discount, original issue discount ("OID"), debt instruments with PIK interest, preferred stock with PIK dividends and zero-coupon securities, accrued income that the Company has not yet received in cash.
Pre-incentive fee net investment income does not include any realized or unrealized capital gains or losses or unrealized capital appreciation or depreciation. Because of the structure of the incentive fee, it is possible that the Company may pay an incentive fee in a quarter where the Company incurs a loss. For example, if the Company receives pre-incentive fee net investment income in excess of the Hurdle rate for a quarter, the Company will pay the applicable incentive fee even if the Company has incurred a loss in that quarter due to realized and unrealized capital losses.
Prior to the calendar quarter that commenced on January 1, 2019 the incentive on income was calculated as follows:
- (i)
- 15.0% of the pre-incentive fee net investment income for the current quarter prior to the IPO; or
- (ii)
- 17.5% of the pre-incentive fee net income for the current quarter after the IPO; and
- (i)
- 15.0% of all remaining pre-incentive fee net investment income above the "catch-up" prior to the IPO, or
- (ii)
- 17.5% of all remaining pre-incentive fee net investment income above the "catch-up" after the IPO.
Beginning with the calendar quarter that commenced on January 1, 2019, the incentive fee based on income is calculated and payable quarterly in arrears based on the aggregate pre-incentive fee net investment income in respect of the current calendar quarter and the eleven preceding calendar quarters beginning with the calendar quarter that commenced on January 1, 2019 (or the appropriate portion thereof in the case of any of the Company's first eleven calendar quarters that commence on or after January 1, 2019) (in either case, the "Trailing Twelve Quarters"). This calculation is referred to as the "Three-Year Lookback."
With respect to any calendar quarter that commences on or after January 1, 2019, pre-incentive fee net investment income in respect of the relevant Trailing Twelve Quarters is compared to a "Hurdle Amount" equal to the product of (i) the hurdle rate of 1.5% per quarter (6% annualized) and (ii) the sum of our net assets (defined as total assets less indebtedness and before taking into account any incentive fees payable during the period) at the beginning of each applicable calendar quarter comprising the relevant Trailing Twelve Quarters. The Hurdle Amount will be calculated after making appropriate adjustments to our NAV at the beginning of each applicable calendar quarter for our subscriptions (which shall include all issuances by us of shares of our Common Stock, including issuances pursuant to the Company's dividend reinvestment plan) and distributions during the applicable calendar quarter.
Commencing on January 1, 2019, the quarterly incentive fee based on income is calculated, subject to the Incentive Fee Cap (as defined below), based on the amount by which (A) aggregate pre-incentive fee net investment income in respect of the relevant Trailing Twelve Quarters exceeds (B) the Hurdle Amount for such Trailing Twelve Quarters. The amount of the excess of (A) over (B) described in this
12
paragraph for such Trailing Twelve Quarters is referred to as the "Excess Income Amount." The incentive fee based on income that is paid to the Advisor in respect of a particular calendar quarter will equal the Excess Income Amount less the aggregate incentive fees based on income that were paid to the Advisor in the preceding eleven calendar quarters (or portion thereof) comprising the relevant Trailing Twelve Quarters.
The incentive fee based on income for each calendar quarter is determined as follows:
- (i)
- No incentive fee based on income is payable to the Advisor for any calendar quarter for which there is no Excess Income Amount;
- (ii)
- 100% of the aggregate pre-incentive fee net investment income in respect of the Trailing Twelve Quarters with respect to that portion of such pre-incentive fee net investment income, if any, that exceeds the Hurdle Amount, but is less than or equal to an amount, which the Company refers to as the "Catch-up Amount," determined as the sum of 1.8182% multiplied by our NAV at the beginning of each applicable calendar quarter comprising the relevant Trailing Twelve Quarters; and
- (iii)
- 17.5% of the aggregate pre-incentive fee net investment income in respect of the Trailing Twelve Quarters that exceeds the Catch-up Amount.
Incentive Fee Cap
With respect to any calendar quarter that commences on or after January 1, 2019, the incentive fee based on income is subject to a cap (the "Incentive Fee Cap"). The Incentive Fee Cap in respect of any calendar quarter is an amount equal to 17.5% of the Cumulative Net Return (as defined below) during the relevant Trailing Twelve Quarters less the aggregate incentive fees based on income that were paid to the Advisor in the preceding eleven calendar quarters (or portion thereof) comprising the relevant Trailing Twelve Quarters.
"Cumulative Net Return" during the relevant Trailing Twelve Quarters means (x) the pre-incentive fee net investment income in respect of the relevant Trailing Twelve Quarters less (y) any Net Capital Loss, if any, in respect of the relevant Trailing Twelve Quarters. If, in any quarter, the Incentive Fee Cap is zero or a negative value, the Company will pay no incentive fee based on income to the Advisor in respect of that quarter. If, in any quarter, the Incentive Fee Cap for such quarter is a positive value but is less than the incentive fee based on income that is payable to the Advisor for such quarter calculated as described above, the Company will pay an incentive fee based on income to the Advisor equal to the Incentive Fee Cap in respect of such quarter. If, in any quarter, the Incentive Fee Cap for such quarter is equal to or greater than the incentive fee based on income that is payable to the Advisor for such quarter calculated as described above, the Company will pay an incentive fee based on income to the Advisor equal to the incentive fee calculated as described above for such quarter without regard to the Incentive Fee Cap.
"Net Capital Loss" in respect of a particular period means the difference, if positive, between (i) aggregate capital losses, whether realized or unrealized, in respect of such period and (ii) aggregate capital gains, whether realized or unrealized, in respect of such period.
Annual Incentive Fee Based on Capital Gains
The second part of the incentive fee is a capital gains incentive fee that will be determined and payable in arrears in cash as of the end of each fiscal year (or upon termination of the Investment Advisory Agreement, as of the termination date), and equals (i) 15% of our realized capital gains as of the end of the fiscal year prior to the IPO and (ii) 17.5% of our realized capital gains as of the end of the fiscal year after the IPO. In determining the capital gains incentive fee payable to the Advisor, we calculate the
13
cumulative aggregate realized capital gains and cumulative aggregate realized capital losses since our inception, and the aggregate unrealized capital depreciation as of the date of the calculation, as applicable, with respect to each of the investments in our portfolio. For this purpose, cumulative aggregate realized capital gains, if any, equals the sum of the differences between the net sales price of each investment, when sold, and the cost of such investment. Cumulative aggregate realized capital losses equals the sum of the amounts by which the net sales price of each investment, when sold, is less than the cost of such investment. Aggregate unrealized capital depreciation equals the sum of the difference, if negative, between the valuation of each investment as of the applicable calculation date and the cost of such investment. At the end of the applicable year, the amount of capital gains that serves as the basis for our calculation of the capital gains incentive fee equals the cumulative aggregate realized capital gains less cumulative aggregate realized capital losses, less aggregate unrealized capital depreciation, with respect to our portfolio of investments. If this number is positive at the end of such year, then the capital gains incentive fee for such year will equal 15% before the IPO or 17.5% after the IPO, as applicable, of such amount, less the aggregate amount of any capital gains incentive fees paid in respect of our portfolio in all prior years as calculated in accordance with the below after the IPO.
Because the IPO occurred on a date other than the first day of a fiscal year, a capital gains incentive fee shall be calculated as of the day before the IPO, with such capital gains incentive fee paid to the Advisor following the end of the 2018 fiscal year. For the avoidance of doubt, such capital gains incentive fee shall be equal to 15% of the Company's realized capital gains on a cumulative basis from inception through November 14, 2018, computed net of all realized capital losses and unrealized capital depreciation on a cumulative basis, less the aggregate amount of any previously paid capital gains incentive fees. Following the IPO, solely for the purposes of calculating the capital gains incentive fee, the Company will be deemed to have previously paid capital gains incentive fees prior to the IPO equal to the product obtained by multiplying (a) the actual aggregate amount of previously paid capital gains incentive fees for all periods prior to the IPO by (b) the percentage obtained by dividing (x) 17.5% by (y) 15%. In the event that the Investment Advisory Agreement shall terminate as of a date that is not a fiscal year end, the termination date shall be treated as though it were a fiscal year end for purposes of calculating and paying a capital gains incentive fee.
Income Related Portion of Incentive Examples
Examples of Quarterly Incentive Fee Calculation for Post-IPO Period Prior to January 1, 2019
Example 1: Income Related Portion of Incentive Fee: (*)
Alternative 1 - The Company is below the hurdle
Assumptions
Investment
income (including interest, dividends, fees, etc.) = 1.5%
Hurdle rate(1) = 1.5%
Management fee(1) = 0.375%
Other expenses (legal, accounting, custodian, transfer agent, etc.)(2) = 0.1525%
Pre-incentive fee net investment income
(investment income–(management fee + other expenses)) = 0.9725%
Pre-incentive net investment income does not exceed hurdle rate, therefore there is no
incentive fee.
14
Alternative 2 - The Company exceeds the hurdle
Assumptions
Investment
income (including interest, dividends, fees, etc.) = 2.25%
Hurdle rate(1) = 1.5%
Management fee(1) = 0.375%
Other expenses (legal, accounting, custodian, transfer agent, etc.)(2) = 0.1525%
Pre-incentive fee net investment income
(investment income–(management fee + other expenses)) = 1.7225%, which exceeds
the hurdle rate
Incentive fee
= 100% × "catch-up" + the greater of 0% and (17.5% × (pre-incentive fee net
investment income–1.8182%))
= 100% × (1.7225%–1.5%) + 0%
= 0.2225% of total net assets
Alternative 3—The Company exceeds the catch-up
Assumptions
Investment
income (including interest, dividends, fees, etc.) = 3.0%
Hurdle rate(1) = 1.5%
Management fee(1) = 0.375%
Other expenses (legal, accounting, custodian, transfer agent, etc.)(2) = 0.1525%
Pre-incentive fee net investment income
(investment income–(management fee + other expenses)) = 2.4725%
Incentive fee = 17.5% × pre-incentive fee net investment income, subject to "catch-up"(3)
=
100% × "catch-up" + the greater of 0% and (17.5% × (pre-incentive fee net
investment income–1.8182%))
Catch-up = 1.8182%–1.5% = 0.3182%
Incentive fee = (100% × 0.3182%) + (17.5% × (2.4725%–1.8182%))
=
0.3182% + (17.5% × 0.6543%)
= 0.3182% + 0.11450%
= 0.43270% of total net assets
(*) The hypothetical amount of pre-incentive fee net investment income shown is based on a percentage of total net assets.
(1) Represents 6.0% annualized hurdle rate and 1.5% annualized management fee.
(2) Excludes organizational and offering expenses.
(3) The "catch-up" provision is intended to provide our Advisor with an incentive fee of approximately 17.5% on all of our pre-incentive fee net investment income as if a hurdle rate did not apply when our net investment income exceeds 1.8182% in any calendar quarter.
15
Examples of Quarterly Incentive Fee Calculation for Post-IPO Period and After January 1, 2019
Example 1—Three Quarters under the Amended Advisory Agreement in which Pre-Incentive Fee Net Investment Income Exceeds the Hurdle Amount and Catch-up Amount
Assumptions
Stable net asset value (NAV) of $100 million across all quarters
Investment
income for each of the quarters (including interest, dividends, fees, etc.) = 4.5275%
Hurdle rate(1) = 1.5%
Management fee(1) = 0.375%
Other expenses (legal, accounting, custodian, transfer agent, etc.)(2) = 0.1525%
Pre-incentive fee net investment income for each quarter
(investment income–(management fee + other expenses)) = 4.0%
Realized capital gains of 1% each quarter
Assumes no other quarters in the applicable Trailing Twelve Quarters
Incentive fee for first quarter
Aggregate
pre-incentive fee net investment income during the relevant Trailing Twelve Quarters = $4,000,000
Hurdle Amount = Q1 NAV × 1.5% = $100,000,000 × 0.015 = $1,500,000
Excess Income Amount = pre-incentive fee net investment income during the relevant Trailing Twelve Quarters–Hurdle Amount = $4,000,000–$1,500,000 = $2,500,000
Catch-up Fee Amount = 100% of pre-incentive fee net investment income that is greater than $1,500,000 (the Hurdle Amount) but less than 1.8182% × Q1 NAV, or $1,818,200. This Catch-up Fee Amount equals $318,200
Post Catch-up Fee Amount = 17.5% of pre-incentive fee net investment income that exceeds the Catch-up Amount = 0.175 × ($4,000,000–$1,818,200) = $381,815
Catch-up
Fee Amount + Post Catch-up Fee Amount = income incentive fee payment = $700,015
No income incentive fee previously paid during the Trailing Twelve Quarters
Incentive Fee Cap = 17.5% of Cumulative Net Return during the relevant Trailing Twelve Quarters
Cumulative Net Return = pre-incentive fee net investment income during the relevant Trailing Twelve Quarters–Net Capital Loss in respect of the relevant Trailing Twelve Quarters
No Net Capital Loss
16
Therefore Incentive Fee Cap = 17.5% of aggregate pre-incentive fee net investment income during the relevant Trailing Twelve Quarters = income incentive fee and the cap is not applied
Incentive fee for second quarter
Aggregate pre-incentive fee net investment income during the relevant Trailing Twelve Quarters = $4,000,000 + $4,000,000 = $8,000,000 Hurdle Amount = (Q1 NAV + Q2 NAV) × 1.5% = $200,000,000 × 0.015 = $3,000,000
Excess Income Amount = aggregate pre-incentive fee net investment income during the relevant Trailing Twelve Quarters (e.g., Q1 and Q2)–Hurdle Amount = $8,000,000–$3,000,000 = $5,000,000
Catch-up Fee Amount = 100% of pre-incentive fee net investment income that is greater than $3,000,000 (the Hurdle Amount) but less than 1.8182% × (Q1 NAV + Q2 NAV), or $3,636,400. This Catch-up Fee Amount equals $636,400
Post Catch-up Fee Amount = 17.5% of pre-incentive fee net investment income that exceeds the Catch-up Amount = 0.175 × ($8,000,000–$3,636,400) = $763,630
Catch-up Fee Amount + Post Catch-up Fee Amount = income incentive fee payment = $1,400,030
$700,015 income incentive fee previously paid during the Trailing Twelve Quarters
Total income incentive fee payment for Q2 = income incentive fee payment–amount previously paid = $700,015
Incentive Fee Cap = 17.5% of Cumulative Net Return during the relevant Trailing Twelve Quarters Cumulative Net Return = aggregate pre-incentive fee net investment income during the relevant Trailing Twelve Quarters–Net Capital Loss in respect of the relevant Trailing Twelve Quarters
No Net Capital Loss
Therefore Incentive Fee Cap = 17.5% of aggregate pre-incentive fee net investment income during the relevant Trailing Twelve Quarters = income incentive fee and the cap is not applied
Incentive fee for third quarter
Aggregate pre-incentive fee net investment income during the relevant Trailing Twelve Quarters = $4,000,000 + $4,000,000 + $4,000,000 = $12,000,000
Hurdle Amount = (Q1 NAV + Q2 NAV + Q3 NAV) × 1.5% = $300,000,000 × 0.015 = $4,500,000
Excess Income Amount = aggregate pre-incentive fee net investment income during the relevant Trailing Twelve Quarters (e.g., Q1, Q2 and Q3)–Hurdle Amount = $12,000,000–$4,500,000 = $7,500,000
17
Catch-up Fee Amount = 100% of pre-incentive fee net investment income that is greater than $4,500,000 (the Hurdle Amount) but less than 1.8182% × (Q1 NAV + Q2 NAV + Q3 NAV), or $5,454,600. This Catch-up Fee Amount equals $954,600
Post Catch-up Fee Amount = 17.5% of pre-incentive fee net investment income that exceeds the Catch-up Amount = 0.175 × ($12,000,000–$5,454,600) = $1,145,445
Catch-up Fee Amount + Post Catch-up Fee Amount = income incentive fee payment = $2,100,045 $1,400,030 income incentive fee previously paid during the Trailing Twelve Quarters
Total income incentive fee payment for Q3 = income incentive fee payment–amount previously paid = $700,015
Incentive Fee Cap = 17.5% of Cumulative Net Return during the relevant Trailing Twelve Quarters
Cumulative Net Return = aggregate pre-incentive fee net investment income during the relevant Trailing Twelve Quarters–Net Capital Loss in respect of the relevant Trailing Twelve Quarters
No Net Capital Loss
Therefore Incentive Fee Cap = 17.5% of aggregate pre-incentive fee net investment income during the relevant Trailing Twelve Quarters = income incentive fee and the cap is not applied
Example 2—Three Quarters under the Amended Advisory Agreement, in which Pre-Incentive
Fee Net Investment Income does not meet the Hurdle Amount for one Quarter
Assumptions
Stable NAV of $100 million across all quarters
Investment income for Q1 (including interest, dividends, fees, etc.) = 0.5275%
Investment income for Q2 (including interest, dividends, fees, etc.) = 4.0275%
Investment income for Q3 (including interest, dividends, fees, etc.) = 5.0275%
Hurdle rate(1) = 1.5%
Management fee(1) = 0.375%
Other expenses (legal, accounting, custodian, transfer agent, etc.)(2) = 0.1525% for each quarter
Pre-incentive
fee net investment income for Q1
(investment income–(management fee + other expenses)) = 0.0%
18
Pre-incentive
fee net investment income for Q2
(investment income–(management fee + other expenses)) = 3.5%
Pre-incentive
fee net investment income for Q3
(investment income–(management fee + other expenses)) = 4.5%
Realized capital gains of 1% each quarter
Assumes no other quarters in the applicable Trailing Twelve Quarters
Incentive fee for first quarter
Aggregate pre-incentive fee net investment income during the relevant Trailing Twelve Quarters = $0
Hurdle Amount = Q1 NAV × 1.5% = $100,000,000 × 0.015 = $1,500,000
Aggregate pre-incentive fee net investment income < Hurdle Amount. Therefore, no income incentive fee is payable for the quarter
Incentive fee for second quarter
Aggregate pre-incentive fee net investment income during the relevant Trailing Twelve Quarters = $0 + $3,500,000 = $3,500,000
Hurdle Amount = (Q1 NAV + Q2 NAV) × 1.5% = $200,000,000 × 0.015 = $3,000,000
Excess
Income Amount = (aggregate pre-incentive fee net investment income during the relevant Trailing Twelve Quarters (e.g., Q1 and
Q2))–Hurdle Amount–
$3,500,000–$3,000,000 = $500,000
Catch-up Fee Amount = 100% of pre-incentive fee net investment income that is greater than $3,000,000 (the Hurdle Amount) but less than 1.8182% × (Q1 NAV + Q2 NAV), or $3,636,400. This Catch-up Fee Amount equals $3,500,000–$3,000,000, or $500,000
Aggregate pre-incentive fee net investment income during the relevant Trailing Twelve Quarters < the Catch-up Amount
Income
incentive fee payment = $500,000
$0 income incentive fee previously paid during the Trailing Twelve Quarters
Total income incentive fee payment for Q2 = income incentive fee payment–amount previously paid = $500,000
Incentive Fee Cap = 17.5% of Cumulative Net Return during the relevant Trailing Twelve Quarters Cumulative Net Return = aggregate pre-incentive fee net investment income during the relevant Trailing Twelve Quarters–Net Capital Loss in respect of the Trailing Twelve Quarters
No Net Capital Loss
Therefore Incentive Fee Cap = 17.5% of aggregate pre-incentive fee net investment income during the relevant Trailing Twelve Quarters = income incentive fee and the cap is not applied
19
Incentive fee for third quarter
Aggregate pre-incentive fee net investment income = $0 + $3,500,000 + $4,500,000 = $8,000,000
Hurdle Amount = (Q1 NAV + Q2 NAV +Q3 NAV) × 1.5% = $300,000,000 × 0.015 = $4,500,000
Excess Income Amount = (aggregate pre-incentive fee net investment income for Q1, Q2 and Q3)–Hurdle Amount = $8,000,000–$4,500,000 = $3,500,000
Catch-up Fee Amount = 100% of pre-incentive fee net investment income that is greater than $4,500,000 (the Hurdle Amount) but less than 1.8182% × (Q1 NAV + Q2 NAV + Q3 NAV), or $5,454,600. This Catch-up Fee Amount equals $954,600
Post Catch-up Fee Amount = 17.5% of pre-incentive fee net investment income that exceeds the Catch-up Amount = 0.175 × ($8,000,000–$5,454,600) = $445,445
Catch-up Fee Amount + Post Catch-up Fee Amount = income incentive fee payment = $1,400,045 $500,000 income incentive fee previously paid during the Trailing Twelve Quarters
Total income incentive fee payment for Q3 = income incentive fee payment–amount previously paid = $900,045
Incentive Fee Cap = 17.5% of Cumulative Net Return during the relevant Trailing Twelve Quarters
Cumulative Net Return = aggregate pre-incentive fee net investment income during the relevant Trailing Twelve Quarters–Net Capital Loss in respect of the Trailing Twelve Quarters
No Net Capital Loss
Therefore Incentive Fee Cap = 17.5% of aggregate pre-incentive fee net investment income during the relevant Trailing Twelve Quarters = income incentive fee and the cap is not applied
Example 3—Three Quarters under the Amended Advisory Agreement in which Pre-Incentive
Fee Net Investment Income Exceeds the Hurdle Rate with Net Capital Losses
Assumptions
Stable NAV of $100 million across all quarters
Investment income for each of the quarters (including interest, dividends, fees, etc.) =4.5275%
Hurdle rate(1) =1.5%
20
Management fee(1) = 0.375%
Other expenses (legal, accounting, custodian, transfer agent, etc.)(2) = 0.1525%
Pre-incentive fee net investment income (investment income–(management fee + other expenses)) = 4.0%
Unrealized capital losses of 1% each of Q1 and Q2 and a 3% unrealized loss in Q3
Assumes no other quarters in the applicable Trailing Twelve Quarters
Incentive fee for first quarter
Aggregate pre-incentive fee net investment income = $4,000,000 Hurdle Amount = Q1 NAV × 1.5% = $100,000,000 × 0.015 = $1,500,000
Excess Income Amount = aggregate pre-incentive fee net investment income during the relevant Trailing Twelve Quarters–Hurdle Amount = $4,000,000–$1,500,000 = $2,500,000
Catch-up Fee Amount = 100% of pre-incentive fee net investment income that is greater than $1,500,000 (the Hurdle Amount) but less than 1.8182% × Q1 NAV, or $1,818,200. This Catch-up Fee Amount equals $318,200
Post Catch-up Fee Amount = 17.5% of pre-incentive fee net investment income that exceeds the Catch-up Amount = 0.175 × ($4,000,000–$1,818,200) = $381,815
Catch-Up Fee Amount + Post Catch-up Fee Amount = income incentive fee payment = $700,015 No income incentive fee previously paid during the Trailing Twelve Quarters
Incentive Fee Cap = 17.5% of Cumulative Net Return during the Trailing Twelve Quarters Cumulative Net Return = aggregate pre-incentive fee net investment income during the relevant Trailing Twelve Quarters–Net Capital Loss during the relevant Trailing Twelve Quarters
Net Capital Loss = $1,000,000
Cumulative Net Return = $4,000,000–$1,000,000 = $3,000,000
Therefore Incentive Fee Cap = 17.5% × $3,000,000 = $525,000. Since the Incentive Fee Cap ($525,000) is less than the income incentive fee ($700,015), the Incentive Fee Cap is applied and a $525,000 income incentive fee is paid for the quarter
Incentive fee for second quarter
Aggregate pre-incentive fee net investment income = $4,000,000 + $4,000,000 = $8,000,000 Hurdle Amount = (Q1 NAV + Q2 NAV) × 1.5% = $200,000,000 × 0.015 = $3,000,000
21
Excess Income Amount = aggregate pre-incentive fee net investment income during the relevant Trailing Twelve Quarters (e.g., Q1 and Q2)–Hurdle Amount = $8,000,000–$3,000,000 = $5,000,000
Catch-up Fee Amount = 100% of pre-incentive fee net investment income that is greater than $3,000,000 (the Hurdle Amount) but less than 1.8182% × (Q1 NAV + Q2 NAV), or $3,636,400. This Catch-up Fee Amount equals $636,400
Post Catch-up Fee Amount = 17.5% of pre-incentive fee net investment income that exceeds the Catch-up Amount = 0.175 × ($8,000,000–$3,636,400) = $763,630
Catch-Up Fee Amount + Post Catch-up Fee Amount = income incentive fee payment = $1,400,030 $525,000 income incentive fee previously paid during the Trailing Twelve Quarters
Total income incentive fee payment for Q2 = income incentive fee payment–amount previously paid = $875,030
Incentive Fee Cap = 17.5% of Cumulative Net Return for the Trailing Twelve Quarters–income incentive fees previously paid for the Trailing Twelve Quarters Cumulative Net Return = aggregate pre-incentive fee net investment income during the relevant Trailing Twelve Quarters–Net Capital Loss in respect of the Trailing Twelve Quarters Net Capital Loss = $2,000,000 Cumulative Net Return = $8,000,000–$2,000,000 = $6,000,000
Therefore Incentive Fee Cap = (17.5% × $6,000,000)–$525,000 = $525,000. Since the Incentive Fee Cap ($525,000) is less than the income incentive fee ($875,030), the Incentive Fee Cap is applied and a $525,000 income incentive fee is paid for the quarter
Incentive fee for third quarter
Aggregate pre-incentive fee net investment income = $4,000,000 + $4,000,000 + $4,000,000 = $12,000,000 Hurdle Amount = (Q1 NAV + Q2 NAV + Q3 NAV) × 1.5% = $300,000,000 × 0.015 = $4,500,000 Excess Income Amount = aggregate pre-incentive fee net investment income during the relevant Trailing Twelve Quarters (e.g., Q1, Q2 and Q3)–Hurdle Amount = $12,000,000–$4,500,000 = $7,500,000
Catch-up Fee Amount = 100% of pre-incentive fee net investment income that is greater than $4,500,000 (the Hurdle Amount) but less than 1.8182% × (Q1 NAV + Q2 NAV + Q3 NAV), or $5,454,600. This Catch-up Fee Amount equals $954,600
Post Catch-up Fee Amount = 17.5% of pre-incentive fee net investment income that exceeds the Catch-up Amount = 0.175 × ($12,000,000–$5,454,600) = $1,145,445
Catch-up Fee Amount + Post Catch-up Fee Amount = income incentive fee payment = $2,100,045 $1,050,000 income incentive fee previously paid during the Trailing Twelve Quarters
22
Total income incentive fee payment for Q3 = income incentive fee payment–amount previously paid = $1,050,045
Incentive Fee Cap = 17.5% of Cumulative Net Return for the Trailing Twelve Quarters–income incentive fees previously paid for the Trailing Twelve Quarters Cumulative Net Return = aggregate pre-incentive fee net investment income during the relevant Trailing Twelve Quarters–Net Capital Loss in respect of the Trailing Twelve Quarters Net Capital Loss = $5,000,000 Cumulative Net Return = $12,000,000–$5,000,000 = $7,000,000
Therefore Incentive Fee Cap = (17.5% × $7,000,000)–$1,050,000 previously paid during the Trailing Twelve Quarters = $175,000. Since the Incentive Fee Cap ($175,000) is less than the income incentive fee ($1,050,045), the Incentive Fee Cap is applied and a $175,000 income incentive fee is paid for the quarter
- (*)
- The
hypothetical amount of each of management fees, other expenses, pre-incentive fee net investment income and realized capital gains or losses shown is based on a
percentage of total net assets.
- (1)
- Represents
6.0% annualized hurdle rate and 1.5% annualized management fee.
- (2)
- Excludes organizational and offering expenses.
Example of Capital Gains Portion of Incentive Fee:
Assumptions
| Year 1: | $25.0 million investment made in Company A ("Investment A"), $35.0 million investment made in Company B ("Investment B") and $30.0 million investment made in Company C ("Investment C") | ||
| Year 2: | Investment A sold for $35.0 million, fair value of Investment B determined to be $30.0 million and fair value of Investment C determined to be $32.0 million | ||
| Year 3: | Fair value of Investment B determined to be $34.0 million and Investment C sold for $35.0 million | ||
| Year 4: | Fair value of Investment B determined to be $45.0 million |
Determination of Incentive Fee based on capital gains
The Incentive Fee based on capital gains, if any, would be:
| Year 1: | None | ||
| Year 2: | $0.875 million | ||
| The portion of the incentive fee based on capital gains equals (A) 17.5% of our realized capital gains, if any, on a cumulative basis from inception through the end of the fiscal year, computed net of all realized capital losses and unrealized capital depreciation on a cumulative basis, minus (B) the aggregate amount of any previously paid capital gain incentive. Therefore, using the assumptions above, the incentive fee based on capital gains equals (A) 17.5% × ($10.0 million-$5.0 million) minus (B) $0. Therefore, the incentive fee based on capital gains equals $0.875 million. |
23
| Year 3: | $1.575 million, which is calculated as follows: The incentive fee based on capital gains equals (A) 17.5% × ($15.0 million-$1.0 million) minus (B) $0.875 million. Therefore, the incentive fee based on capital gains equals $1.575 million. | ||
| Year 4: | $0.175 million, which is calculated as follows: | ||
| The incentive fee based on capital gains equals (x) (A) 17.5% × ($15.0 million-$0.0 million) minus (B) $2.45 million. Therefore, the incentive fee based on capital gains equals $0.175 million. |
The Board will monitor the mix and performance of our investments over time and will seek to satisfy itself that the Advisor is acting in our interests and that our fee structure appropriately incentivizes the Advisor to do so.
We have also entered into an Administration Agreement with the Administrator, pursuant to which the Administrator will provide the administrative services necessary for us to operate, and we will utilize the Administrator's office facilities, equipment and recordkeeping services. Pursuant to the Administration Agreement, the Administrator has agreed to oversee our public reporting requirements and tax reporting and monitor our expenses and the performance of professional services rendered to us by others. The Administrator has also hired a sub-administrator to assist in the provision of administrative services. We may reimburse the Administrator for its costs and expenses and our allocable portion of overhead incurred by it in performing its obligations under the Administration Agreement, including compensation paid to or compensatory distributions received by our officers (including our Chief Compliance Officer and Chief Financial Officer) and any of their respective staff who provide services to us, operations staff who provide services to us, and internal audit staff, if any, to the extent internal audit performs a role in our Sarbanes-Oxley internal control assessment. Our allocable portion of overhead will be determined by the Administrator, which expects to use various methodologies such as allocation based on the percentage of time certain individuals devote, on an estimated basis, to the business and affairs of the Company, and will be subject to oversight by the Board. The sub-administrator will be paid its compensation for performing its sub-administrative services under the sub-administration agreement. The Company incurred expenses related to the sub-administrator of $0.6 million, $0.8 million and $0.5 million for the years ended December 31, 2019, 2018, and 2017, respectively, which is included in other general and administrative expenses on the consolidated statements of operations. The Administrator would not seek reimbursement in the event that any such reimbursements would cause any distributions to our stockholders to constitute a return of capital. See "Fees and Expenses." In addition, the Administrator is permitted to delegate its duties under the Administration Agreement to affiliates or third parties and we will reimburse the expenses of these parties incurred and paid by the Advisor on our behalf.
Both the Investment Advisory Agreement and the Administration Agreement have been approved by the Board. Unless earlier terminated as described below, both the Investment Advisory Agreement and the Administration Agreement will remain in effect for a period of two years from their effective date and will remain in effect from year to year thereafter if approved annually by (i) the vote of the Board, or by the vote of a majority of our outstanding voting securities, and (ii) the vote of a majority of our Independent Directors. The Investment Advisory Agreement and the Administration Agreement will automatically terminate in the event of assignment. Both the Investment Advisory Agreement and the Administration Agreement may be terminated by either party without penalty upon not less than 60 days' written notice to the other. Upon termination of the Investment Advisory Agreement, the Company will be required to change its name which may have a material adverse impact on the Company's operations. See "Item 1A. Risk Factors—Risks Relating to Our Business and Structure—We are dependent upon key personnel of Bain Capital Credit and our Advisor."
Under the Investment Advisory Agreement, the Advisor has not assumed any responsibility to us other than to render the services called for under that agreement. It will not be responsible for any action
24
of the Board in following or declining to follow the Advisor's advice or recommendations. Under the Investment Advisory Agreement, the Advisor, its officers, managers, partners, agents, employees, controlling persons, members and any other person or entity affiliated with the Advisor, and any person controlling or controlled by the Advisor will not be liable to us, any subsidiary of ours, our directors, our stockholders or any subsidiary's stockholders or partners for acts or omissions performed in accordance with and pursuant to the Investment Advisory Agreement, except those resulting from acts constituting gross negligence, willful misfeasance, bad faith or reckless disregard of the duties that the Advisor owes to us under the Investment Advisory Agreement. In addition, as part of the Investment Advisory Agreement, we have agreed to indemnify the Advisor and each of its officers, managers, partners, agents, employees, controlling persons, members and any other person or entity affiliated with the Advisor, from and against any claims or liabilities, including reasonable legal fees and other expenses reasonably incurred, arising out of or in connection with our business and operations or any action taken or omitted on our behalf pursuant to authority granted by the Investment Advisory Agreement, except where attributable to gross negligence, willful misfeasance, bad faith or reckless disregard of such person's duties under the Investment Advisory Agreement. These protections may lead the Advisor to act in a riskier manner when acting on our behalf than it would when acting for its own account.
United States federal and state securities laws may impose liability under certain circumstances on persons who act in good faith. Nothing in the Investment Advisory Agreement will constitute a waiver or limitation of any rights that the Company may have under any applicable federal or state securities laws.
Fees and Expenses
Our primary operating expenses include the payment of fees to the Advisor under the Investment Advisory Agreement, our allocable portion of overhead expenses under the Administration Agreement and other operating costs described below. We bear all other out-of-pocket costs and expenses of our operations and transactions, including:
- •
- our operational and organizational costs;
- •
- the costs of any public offerings of our common stock and other securities, including registration and listing fees;
- •
- cost of calculating our net asset value, including the cost and expenses of any third-party valuation services;
- •
- fees and expenses payable to third parties relating to evaluating, making and disposing of investments, including our Advisor's or its
affiliates' travel expenses, research costs and out-of-pocket fees and expenses associated with performing due diligence and reviews of prospective investments, monitoring our investments and, if
necessary, enforcing our rights;
- •
- interest payable on debt and other borrowing costs, if any, incurred to finance our investments;
- •
- costs of effecting sales and repurchases of our common stock and other securities;
- •
- the base management fee and any incentive fee;
- •
- distributions on our common stock;
- •
- transfer agent and custody fees and expenses;
25
- •
- the allocated costs incurred by the Administrator in providing managerial assistance to those portfolio companies that request it;
- •
- other expenses incurred by BCSF Advisors or us in connection with administering our business, including payments made to third-party providers
of goods or services;
- •
- brokerage fees and commissions;
- •
- federal and state registration fees;
- •
- U.S. federal, state and local taxes;
- •
- independent directors' fees and expenses;
- •
- costs associated with our reporting and compliance obligations under the 1940 Act and applicable U.S. federal and state securities laws;
- •
- costs of any reports, proxy statements or other notices to our stockholders, including printing costs;
- •
- costs of holding stockholder meetings;
- •
- our fidelity bond;
- •
- directors and officers' errors and omissions liability insurance, and any other insurance premiums;
- •
- litigation, indemnification and other non-recurring or extraordinary expenses;
- •
- direct costs and expenses of administration and operation, including printing, mailing, long distance telephone, staff, audit, compliance, tax
and legal costs;
- •
- fees and expenses associated with marketing efforts;
- •
- dues, fees and charges of any trade association of which we are a member; and
- •
- all other expenses reasonably incurred by us or the Administrator in connection with administering our business.
To the extent that expenses to be borne by us are paid by BCSF Advisors, we will generally reimburse BCSF Advisors for such expenses. To the extent the Administrator outsources any of its functions, we will pay the fees associated with such functions on a direct basis without profit to the Administrator. We also reimburse the Administrator for its costs and expenses and our allocable portion of overhead incurred by it in performing its obligations under the Administration Agreement, including rent and compensation paid to or compensatory distributions received by our officers (including our Chief Compliance Officer and Chief Financial Officer) and any of their respective staff who provide services to us, operations staff who provide services to us, internal audit staff, if any, to the extent internal audit performs a role in our Sarbanes-Oxley internal control assessment and fees paid to third-party providers for goods or services. Our allocable portion of overhead will be determined by the Administrator, which expects to use various methodologies such as allocation based on the percentage of time certain individuals devote, on an estimated basis, to our business and affairs, and will be subject to oversight by the Board. The sub-administrator is paid its compensation for performing its sub-administrative services under the sub-administration agreement. We incurred expenses related to the sub-administrator of $0.6 million,
26
$0.8 million and $0.5 million for the years ended December 31, 2019, 2018 and 2017, respectively, which is included in other general and administrative expenses on the consolidated statements of operations.
The fee we pay our Advisor is higher after the completion of the IPO. With respect to any period prior to the date of the IPO, pursuant to the Investment Advisory Agreement and a waiver agreement with our Advisor, all base management fees in excess of an annual rate of 0.75% of the aggregate gross assets excluding cash and cash equivalents were contractually waived by our Advisor and not subject to recoupment by our Advisor. As a result, upon completion of the IPO, the base management fee has increased to an annual rate of 1.5% of our gross assets. If the base management fee waivers, contractual and voluntary, had not been in place for the years ended December 31, 2019, 2018 and 2017, the base management fee charged would have increased by $8.2 million, $8.8 million and $2.9 million, respectively. Further, upon completion of the IPO, we pay our Advisor a 17.5% incentive fee based on pre-incentive fee net investment income and capital gains, an increase from 15.0% prior to the completion of the IPO. If the incentive fee waivers, contractual and voluntary, had not been in place for the years ended December 31, 2019 and 2018, the incentive fee charged would have increased by $2.7 million and $1.9 million, respectively. For the year ended December 31, 2017, there was no incentive fee waiver. In addition, prior to the completion of the IPO, our Administrator did not seek reimbursement for certain expenses payable by us under the Administration Agreement.
All of the foregoing expenses are ultimately borne by our stockholders.
From time to time, the Administrator or its affiliates may pay third-party providers of goods or services. We will reimburse the Administrator or such affiliates thereof for any such amounts paid on our behalf. The Administrator will waive its right to be reimbursed in the event that such reimbursements would cause any distributions to our stockholders to constitute a return of capital.
The Advisor is authorized to determine the broker to be used for each securities transaction. In selecting brokers to execute transactions, the Advisor need not solicit competitive bids and does not have an obligation to seek the lowest available commission cost. In selecting brokers, the Advisor may or may not negotiate "execution only" commission rates and thus we may be deemed to be paying for other services provided by the broker that are included in the commission rate. In negotiating commission rates, the Advisor will take into account the financial stability and reputation of the broker and the brokerage, research and other services provided to us, the Advisor and other customers of the Advisor and its affiliates by such broker, even though we may not, in any particular instance, be the direct or indirect beneficiaries of the research or other services provided and the base management fee payable to the Advisor is not reduced because it receives such services. In addition, the Advisor may direct commissions to certain brokers that on the foregoing basis may furnish other services to us, the Advisor and other customers of the Advisor and its affiliates, such as telephone lines, news and quotation equipment, electronic office equipment, account record keeping and clerical services, trading software, financial publications and economic consulting services. As a result of the brokerage practices described above, the levels of commission paid and prices paid or received by us in securities transactions may be less favorable than in securities transactions effected on a best price and execution basis.
The Advisor engaged placement agents to assist with the placement of the Company's shares, and may engage additional or different placement agents in the future. The Advisor and/or investors referred by a placement agent shall pay all compensation to the placement agents. The Company did not pay compensation to any placement agents in connection with the Company's initial private offering (the "Private Offering"). The prospect of receiving placement fees or other compensation may provide placement agents and/or their salespersons with an incentive to favor sales of the shares of the Company over the sale of interests of other investments with respect to which the placement agent does not receive such additional compensation, or receives lower levels of additional compensation.
27
Capital Resources and Borrowings
We anticipate cash to be generated from future offerings of securities and cash flows from operations, including interest earned from the temporary investment of cash in cash equivalents, U.S. government securities and other high-quality debt investments that mature in one year or less. Additionally, we are permitted, under specified conditions, to issue multiple classes of indebtedness and one class of stock senior to our common stock if our asset coverage, as defined in the 1940 Act, is at least equal to 200% immediately after each such issuance. Effective February 2, 2019, following shareholder approval of the reduce asset coverage proposal, the Company may maintain an asset coverage ratio of only 150%. Furthermore, while any indebtedness and senior securities remain outstanding, we must make provisions to prohibit any distribution to our stockholders or the repurchase of such securities or shares unless we meet the applicable asset coverage ratios at the time of the distribution or repurchase. In connection with borrowings, our lenders may require us to pledge assets, investor commitments to fund capital calls and/or the proceeds of those capital calls. In addition, the lenders may ask us to comply with positive or negative covenants that could have an effect on our operations.
SMBC Revolving Credit Agreement
On December 22, 2016, we entered into the revolving credit agreement (the "SMBC Revolving Credit Agreement"). The maximum commitment amount under the SMBC Revolving Credit Facility was $150.0 million, and may be increased up to $350.0 million ("Maximum Commitment") with the consent of SMBC or reduced upon our request. Effective July 31, 2018, we reduced the commitment amount under the SMBC Revolving Credit Facility to $85.0 million. On November 21, 2018, the SMBC Revolving Credit Facility was terminated. The proceeds from the initial public offering on November 15, 2018, were used to repay the total outstanding debt.
BCSF Revolving Credit Facility
On October 4, 2017, we entered into the revolving credit agreement (the "BCSF Revolving Credit Facility") with us, as equity holder, BCSF I, LLC, a Delaware limited liability company and a wholly owned and consolidated subsidiary of the Company, as borrower, and Goldman Sachs Bank USA, as sole lead arranger ("Goldman Sachs"). The BCSF Revolving Credit Facility was subsequently amended on May 15, 2018 to reflect certain clarifications regarding margin requirements and hedging currencies. The maximum commitment amount under the BCSF Revolving Credit Facility is $500.0 million, and may be increased up to $750.0 million. Proceeds of the loans under the BCSF Revolving Credit Facility may be used to acquire certain qualifying loans and such other uses as permitted under the BCSF Revolving Credit Facility. The BCSF Revolving Credit Facility includes customary affirmative and negative covenants, including certain limitations on the incurrence of additional indebtedness and liens, as well as usual and customary events of default for revolving credit facilities of this nature. As of December 31, 2019 and December 31, 2018, we were in compliance with these covenants.
Assets that are pledged as collateral for the BCSF Revolving Credit Facility are not directly available to the creditors of the Company to satisfy any obligations of the Company other than the Company's obligations under the BCSF Revolving Credit Facility
Borrowings under the BCSF Revolving Credit Facility bear interest at LIBOR plus a margin. As of December 31, 2019 and December 31, 2018, the BCSF Revolving Credit Facility was accruing interest expense at a rate of LIBOR plus 2.50%. We pay an unused commitment fee of 30 basis points (0.30%) per annum. Interest is payable quarterly in arrears. Any amounts borrowed under the BCSF Revolving Credit Facility, and all accrued and unpaid interest, will be due and payable, on the earliest of: (a) October 5, 2022
28
and (b) the date upon which all loans shall become due and payable in full, whether by acceleration or otherwise.
BCSF I, LLC is a wholly owned subsidiary of the Company and Borrower under the BCSF Revolving Credit Facility. BCSF I, LLC has entered into an investment management agreement with the Company as of October 4, 2017, pursuant to which the Company manages the BCSF I, LLC investment program and related activities. All intercompany transactions between BCSF I, LLC and the Company are eliminated in consolidation.
On September 28, 2018, (the "2018-1 Closing Date"), the Company, through BCC Middle Market CLO 2018-1 LLC (the "2018-1 Issuer"), a Delaware limited liability company and a wholly owned and consolidated subsidiary of the Company, completed its $451.2 million term debt securitization (the "CLO Transaction"). The notes issued in connection with the CLO Transaction (the "2018-1 Notes") are secured by a diversified portfolio of the Issuer consisting primarily of middle market loans and participation interests in middle market loans, the majority of which are senior secured loans (the "2018-1 Portfolio"). At the 2018-1 Closing Date, the 2018-1 Portfolio was comprised of assets transferred from the Company and its consolidated subsidiaries. All transfers were eliminated in consolidation and there were no realized gains or losses recognized in the CLO Transaction.
Citibank Revolving Credit Facility
On February 19, 2019, the Company entered into a credit and security agreement (the "Credit Agreement" or the "Citibank Revolving Credit Facility") with the Company as equity holder and servicer, BCSF II-C, LLC as Borrower, Citibank, N.A., as Administrative Agent, and Wells Fargo Bank, National Association as Collateral Administrator, Collateral Agent and Custodian. The Credit Agreement is effective as of February 19, 2019.
The facility amount under the Credit Agreement is $350.0 million. Proceeds of the loans under the Credit Agreement may be used to acquire certain qualifying loans and such other uses as permitted under the Credit Agreement. The period from the closing date until February 19, 2020 is referred to as the reinvestment period and during such reinvestment period, the Borrower may request drawdowns under the Credit Agreement. The final maturity date is the earliest of: (a) the business day designated by the Borrower as the final maturity date upon not less than three business days' prior written notice to the Administrative Agent, the Collateral Agent, the Lenders, the Custodian and the Collateral Administrator, (b) February 19, 2022 and (c) the date on which the Administrative Agent provides notice of the declaration of the final maturity date after the occurrence of an event of default. The Credit Agreement includes customary affirmative and negative covenants, including certain limitations on the incurrence of additional indebtedness and liens, as well as usual and customary events of default for revolving credit facilities of this nature.
Borrowings under the Citibank Revolving Credit Facility bear interest at the London Interbank Offered Rate ("LIBOR") plus a margin. During the period prior to the last day of the reinvestment period, borrowings under the Credit Agreement will bear interest at a rate equal to the three-month LIBOR plus 1.60%. Commencing on the last day of the reinvestment period, the interest rate on borrowings under the Credit Agreement will reset to three month LIBOR plus 2.60% for the remaining term of the Credit Agreement. The Company pays an unused commitment fee based on a corresponding utilization rate; (i) 0 basis points (0.00%) per annum when greater than or equal to 85.0% utilization, (ii) 25 basis points (0.25%) per annum when greater than or equal to 75.0% but less than 85.0% utilization, (iii) 50 basis points (0.50%) per annum when greater than or equal to 50.0% but less than 75.0% utilization, (iv) 75 basis points (0.75%) per annum when greater than or equal to 25.0% but less than 50% utilization, or (v) 100 basis points (1.00%) per annum when less than 25.0% utilization.
On August 28, 2019, the Citibank Revolving Credit Facility was terminated. The proceeds from the 2019-1 Debt (as defined below) were used to repay the total outstanding debt.
29
On April 30, 2019, the Company entered into a loan and security agreement (the "JPM Credit Agreement" or the "JPM Credit Facility") as Borrower, with JPMorgan Chase Bank, National Association, as Administrative Agent, and Wells Fargo Bank, National Association as Collateral Administrator, Collateral Agent, Securities Intermediary and Bank.
The facility amount under the JPM Credit Agreement is $666.6 million. Proceeds of the loans under the JPM Credit Facility may be used to acquire certain qualifying loans and such other uses as permitted under the JPM Credit Agreement. The period from the effective date until November 29, 2020 is referred to as the reinvestment period and during such reinvestment period, the Borrower may request drawdowns under the JPM Credit Facility.
The maturity date is the earliest of: (a) November 29, 2022, (b) the date on which the secured obligations become due and payable following the occurrence of an event of default, (c) the date on which the advances are repaid in full and (d) the date after a market value cure failure occurs on which all portfolio investments have been sold and proceeds therefrom have been received by the Borrower. The stated maturity date of November 29, 2022 may be extended for successive one year periods by mutual agreement of the Borrower and the Administrative Agent.
The JPM Credit Agreement includes customary affirmative and negative covenants, including certain limitations on the incurrence of additional indebtedness and liens, as well as usual and customary events of default for revolving credit facilities of this nature.
Borrowings under the JPM Credit Facility bear interest at LIBOR plus a margin. As of December 31, 2019, JPM Credit Facility was accruing interest expense at a rate of LIBOR plus 2.75%. The Company pays an unused commitment fee of 75 basis points (0.75%) per annum. Interest is payable quarterly in arrears.
On August 28, 2019, the Company, through BCC Middle Market CLO 2019-1 LLC (the "2019-1 Issuer"), a Cayman Islands limited liability company and a wholly-owned and consolidated subsidiary of the Company, and BCC Middle Market CLO 2019-1 Co-Issuer, LLC (the "Co-Issuer" and, together with the Issuer, the "Co-Issuers"), a Delaware limited liability company, completed its $501.0 million term debt securitization (the "2019-1 CLO Transaction"). The notes issued in connection with the 2019-1 CLO Transaction (the "2019-1 Notes") are secured by a diversified portfolio of the Co-Issuers consisting primarily of middle market loans and participation interests in middle market loans, the majority of which are senior secured loans (the "2019-1 Portfolio"). The Co-Issuers also issued Class A-1L Loans (the "Loans" and, together with the 2019-1 Notes, the "2019-1 Debt"). The Loans are also secured by the 2019-1 Portfolio. At the 2019-1 closing date, the 2019-1 Portfolio was comprised of assets transferred from the Company and its consolidated subsidiaries. All transfers were eliminated in consolidation and there were no realized gains or losses recognized in the 2019-1 CLO Transaction.
Dividend Reinvestment Plan
We have adopted a DRIP that provides for the reinvestment of dividends and other distributions on behalf of our stockholders, unless a stockholder elects to receive cash. As a result, if our Board declares a cash distribution, then our stockholders who acquire shares of our common stock after our listing and have not elected to "opt out" of our DRIP will have their cash distributions automatically reinvested in
30
additional shares of our common stock as described below. Any stockholders who held shares of our common stock prior to our listing had to opt in to the DRIP.
Administration
We do not currently have any employees. Each officer of the Company is also an employee of the Advisor or its affiliates. See "Item 10. Directors, Executive Officers and Corporate Governance."
Our day-to-day investment operations are managed by the Advisor. Pursuant to its Resource Sharing Agreement with Bain Capital Credit, the Advisor has access to the individuals who comprise the Advisor's Credit Committee, and a team of additional experienced investment professionals who, collectively, comprise the Advisor's investment team. The Advisor may hire additional investment professionals to provide services to us, based upon its needs. See "Item 1. Business-General—Investment Advisory Agreement; Administration Agreement."
Regulation as a Business Development Company
We have elected to be regulated as a BDC under the 1940 Act. A BDC must be organized in the United States for the purpose of investing in or lending to primarily private companies and making significant managerial assistance available to them. A BDC may use capital provided by public stockholders and from other sources to make long-term, private investments in businesses. A publicly-traded BDC provides stockholders the ability to retain the liquidity of a publicly-traded stock while sharing in the possible benefits, if any, of investing in primarily privately owned companies.
We may not change the nature of our business so as to cease to be, or withdraw our election as, a BDC unless authorized by vote of a majority of the outstanding voting securities, as required by the 1940 Act. A majority of the outstanding voting securities of a company is defined under the 1940 Act as the lesser of: (a) 67% or more of such company's voting securities present at a meeting if more than 50% of the outstanding voting securities of such company are present or represented by proxy, or (b) more than 50% of the outstanding voting securities of such company. We do not anticipate any substantial change in the nature of our business.
As with other companies regulated by the 1940 Act, a BDC must adhere to certain substantive regulatory requirements. A majority of our directors must be persons who are not interested persons, as that term is defined in the 1940 Act. Additionally, we are required to provide and maintain a bond issued by a reputable fidelity insurance company to protect the BDC. Furthermore, as a BDC, we are prohibited from protecting any director or officer against any liability to us or our stockholders arising from willful misfeasance, bad faith, gross negligence or reckless disregard of the duties involved in the conduct of such person's office.
As a BDC, we are required to meet an asset coverage ratio, defined under the 1940 Act as the ratio of our total assets (less all liabilities and indebtedness not represented by senior securities) to our outstanding senior securities, of at least 200% after each issuance of senior securities. Effective February 2, 2019, following stockholder approval of the reduced asset coverage requirements, the Company must maintain an asset coverage ratio of only 150%. We may also be prohibited under the 1940 Act from knowingly participating in certain transactions with our affiliates without the prior approval of our directors who are not interested persons and, in some cases, prior approval by the SEC. As a BDC, we are limited in our ability to invest in any portfolio company in which the Advisor or any of its affiliates currently has an investment or to make any co-investments with the Advisor or its affiliates without an exemptive order from the SEC, subject to certain exceptions.
31
We do not intend to acquire securities issued by any investment company that exceed the limits imposed by the 1940 Act. Under these limits, except for registered money market funds, we generally cannot acquire more than 3% of the voting stock of any investment company, invest more than 5% of the value of our total assets in the securities of one investment company or invest more than 10% of the value of our total assets in the securities of investment companies in the aggregate. The portion of our portfolio invested in securities issued by investment companies ordinarily will subject our stockholders to additional expenses. Our investment portfolio is also subject to diversification requirements by virtue of our intention to qualify as a RIC for U.S. tax purposes.
We will generally not be able to issue and sell our common stock at a price below net asset value per share. We may, however, sell our common stock, or warrants, options or rights to acquire our common stock, at a price below the then-current net asset value of our common stock if the Board determines that such sale is in our best interests and the best interests of our stockholders, and our stockholders approve such sale. In addition, we may generally issue new shares of our common stock at a price below net asset value in rights offerings to existing stockholders, in payment of distributions and in certain other limited circumstances.
As a BDC, we are subject to certain risks and uncertainties. See "Item 1A. Risk Factors."
Qualifying Assets
We may invest up to 30% of our portfolio opportunistically in "non-qualifying assets", which will be driven primarily through opportunities sourced through the Advisor. However, under the 1940 Act, a BDC may not acquire any asset other than assets of the type listed in Section 55(a) of the 1940 Act, which are referred to as "qualifying assets," unless, at the time the acquisition is made, qualifying assets represent at least 70% of the BDC's total assets. The principal categories of qualifying assets relevant to our proposed business are the following:
- (1)
- securities
purchased in transactions not involving any public offering from the issuer of such securities, which issuer (subject to certain limited exceptions) is an
eligible portfolio company, or from any person who is, or has been during the preceding 13 months, an affiliated person of an eligible portfolio company, or from any other person, subject to
such rules as may be prescribed by the SEC. An eligible portfolio company is defined in the 1940 Act as any issuer which:
- (a)
- is
organized under the laws of, and has its principal place of business in, the United States;
- (b)
- is
not an investment company (other than a small business investment company wholly owned by the BDC) or a company that would be an investment company but for
certain exclusions under the 1940 Act; and
- (c)
- satisfies
either of the following:
- i.
- does
not have any class of securities that is traded on a national securities exchange or has any class of securities listed on a national securities exchange
subject to a $250.0 million market capitalization maximum; or;
- ii.
- is controlled by a BDC or a group of companies including a BDC the BDC actually exercises a controlling influence over the management or
32
- (2)
- securities
of any eligible portfolio company which we control;
- (3)
- securities
purchased in a private transaction from a U.S. issuer that is not an investment company or from an affiliated person of the issuer, or in transactions
incident thereto, if the issuer is in bankruptcy and subject to reorganization or if the issuer, immediately prior to the purchase of its securities, was unable to meet its obligations as they came
due without material assistance other than conventional lending or financing arrangements;
- (4)
- securities
of an eligible portfolio company purchased from any person in a private transaction if there is no ready market for such securities and we already own 60%
of the outstanding equity of the eligible portfolio company;
- (5)
- securities
received in exchange for or distributed on or with respect to securities described in (1) through (4) above, or pursuant to the exercise of
warrants or rights relating to such securities; and
- (6)
- cash, cash equivalents, U.S. government securities or high-quality debt securities maturing in one year or less from the time of investment.
policies of the eligible portfolio company, and, as a result, the BDC has an affiliated person who is a director of the eligible portfolio company.
Limitations on Leverage
As a BDC, we are required to meet an asset coverage ratio, defined under the 1940 Act as the ratio of our total assets (less all liabilities and indebtedness not represented by senior securities) to our outstanding senior securities. On November 28, 2018, the Board approved the reduction of the Company's asset coverage requirements in Section 61(a)(2) of the 1940 Act to 150% and recommended the stockholders to vote in favor of the proposal at the special stockholder meeting on February 1, 2019. On February 1, 2019, the Company's stockholders approved the application of the reduced asset coverage. Effective February 2, 2019, the Company is permitted to borrow amounts such that its asset coverage ratio is at least 150% after such borrowing (if certain requirements are met), rather than 200%, as previously required.
Managerial Assistance to Portfolio Companies
A BDC must have been organized under the laws of, and have its principal place of business in, any state or states within the United States and must be operated for the purpose of making investments in the types of securities described in (1), (2) or (3) above. However, in order to count portfolio securities as qualifying assets for the purpose of the 70% test, the BDC must either control the issuer of the securities or must offer to make available to the issuer of the securities (other than small and solvent companies described above) significant managerial assistance; except that, where the BDC purchases such securities in conjunction with one or more other persons acting together, one of the other persons in the group may make available such managerial assistance. Making available managerial assistance means, among other things, any arrangement whereby the BDC, through its directors or officers, offers to provide, and, if accepted, does so provide, significant guidance and counsel concerning the management, operations or business objectives and policies of a portfolio company.
33
Monitoring Investments
In most cases, we will not have influence over the Board of Directors of our portfolio companies. In some instances, the Advisor's investment professionals may obtain board representation or observation rights in conjunction with our investments. In conjunction with the Advisor's Credit Committee and the Board, the Advisor will take an active approach in monitoring all investments, which includes reviews of financial performance on at least a quarterly basis and may include discussions with management and/or the equity sponsor. The monitoring process will begin with structuring terms and conditions which require the timely delivery and access to critical financial and business information regarding portfolio companies.
Temporary Investments
Pending investment in other types of "qualifying assets," as described above, our investments may consist of cash, cash equivalents, U.S. government securities or high-quality debt securities maturing in one year or less from the time of investment, which we refer to, collectively, as "temporary investments," so that 70% of our assets are qualifying assets. See "Item 1. Business—Certain U.S. Federal Income Tax Consequences—Election to be Subject to be Taxed as a RIC." Typically, we will invest in U.S. Treasury bills or in repurchase agreements, provided that such agreements are fully collateralized by cash or securities issued by the U.S. government or its agencies. A repurchase agreement involves the purchase by an investor, such as us, of a specified security and the simultaneous agreement by the seller to repurchase it at an agreed-upon future date and at a price which is greater than the purchase price by an amount that reflects an agreed-upon interest rate. There is no percentage restriction on the proportion of our assets that may be invested in such repurchase agreements. However, if more than 25% of our gross assets constitute repurchase agreements from a single counterparty, we may not satisfy the diversification tests in order to qualify as a RIC. Thus, we do not intend to enter into repurchase agreements with a single counterparty in excess of this limit. The Advisor will monitor the creditworthiness of the counterparties with which we enter into repurchase agreement transactions.
Senior Securities
Historically, the 1940 Act has permitted us to issue "senior securities," including borrowing money from banks or other financial institutions, only in amounts such that our asset coverage, as defined in the 1940 Act, equals at least 200% after such incurrence or issuance. In March 2018, the Small Business Credit Availability Act, or the SBCAA, was enacted into law. The SBCAA, among other things, amended the 1940 Act to reduce the asset coverage requirements applicable to business development companies from 200% to 150% so long as the business development company meets certain disclosure requirements and obtains certain approvals. On November 28, 2018, the Board approved the reduction of the Company's asset coverage requirements in Section 61(a)(2) of the 1940 Act to 150% and recommended the stockholders to vote in favor of the proposal at the special stockholder meeting on February 1, 2019. On February 1, 2019, the Company's stockholders approved the application of the reduced asset coverage. Effective February 2, 2019, the Company is permitted to borrow amounts such that its asset coverage ratio is at least 150% after such borrowing (if certain requirements are met), rather than 200%, as previously required.
While any senior securities remain outstanding, we must make provisions to prohibit any distribution to our stockholders or the repurchase of such securities or shares unless we meet the applicable asset coverage ratios at the time of the distribution or repurchase. We may also borrow amounts up to 5% of the value of our total assets for temporary or emergency purposes without regard to asset coverage. See "Item 1A. Risk Factors—Risks Relating to Our Business and Structure—Our strategy involves a high degree of leverage. We intend to continue to finance our investments with borrowed money, which will
34
magnify the potential for gain or loss on amounts invested and may increase the risk of investing in us. The risks of investment in a highly leverage fund include volatility and possible distribution restrictions."
The 1940 Act imposes limitations on a BDC's issuance of preferred shares, which are considered "senior securities" and thus are subject to the 150% asset coverage requirement described above. In addition, (i) preferred shares must have the same voting rights as the common stockholders (one share, one vote); and (ii) preferred stockholders must have the right, as a class, to appoint directors to the Board.
Code of Ethics
As required by Rule 17j-1 under the 1940 Act and Rule 204A-1 under the Advisers Act, respectively, we and the Advisor have adopted codes of ethics which apply to, among others, our and the Advisor's executive officers, including our Chief Executive Officer and Chief Financial Officer, as well as the Advisor's officers, directors and employees. Our codes of ethics generally will not permit investments by our and the Advisor's personnel in securities that may be purchased or sold by us.
We hereby undertake to provide a copy of the codes to any person, without charge, upon request. Requests for a copy of the codes may be made in writing addressed to Investor Relations, Bain Capital Specialty Finance, Inc., 200 Clarendon Street, 37th Floor, Boston, Massachusetts 02116, Attention: Bain Capital Specialty Finance, Inc. Investor Relations, or by emailing us at creditinfo@baincapital.com.
Compliance Policies and Procedures
We and the Advisor have adopted and implemented written policies and procedures reasonably designed to detect and prevent violation of the federal securities laws and we are required to review these compliance policies and procedures annually for their adequacy and the effectiveness of their implementation and designate a Chief Compliance Officer to be responsible for administering the policies and procedures.
Sarbanes-Oxley Act of 2002
The Sarbanes-Oxley Act of 2002, as amended (the "Sarbanes-Oxley Act") imposes a wide variety of regulatory requirements on publicly-held companies and their insiders. Many of these requirements affect us. For example:
- •
- pursuant to Rule 13a-14 under the Exchange Act, our President and Chief Financial Officer must certify the accuracy of the consolidated
financial statements contained in our periodic reports;
- •
- pursuant to Item 307 of Regulation S-K under the Securities Act of 1933, as amended (the "Securities Act"), our periodic reports
must disclose our conclusions about the effectiveness of our disclosure controls and procedures;
- •
- pursuant to Rule 13a-15 under the Exchange Act, our management must prepare an annual report regarding its assessment of our internal
control over financial reporting, which must be audited by our independent public accounting firm; and
- •
- pursuant to Item 308 under Regulation S-K under the Securities Act and Rule 13a-15 under the Exchange Act, our periodic reports must disclose whether there were significant changes in our internal controls over financial reporting or in other factors that could significantly affect these
35
controls subsequent to the date of their evaluation, including any corrective actions with regard to significant deficiencies and material weaknesses.
The Sarbanes-Oxley Act requires us to review our current policies and procedures to determine whether we comply with the Sarbanes-Oxley Act and the regulations promulgated thereunder. We will continue to monitor our compliance with all regulations that are adopted under the Sarbanes-Oxley Act and will take actions necessary to ensure that we are in compliance therewith.
Proxy Voting Policies and Procedures
We will delegate our proxy voting responsibility to the Advisor. The Proxy Voting Policies and Procedures of the Advisor are set forth below. The guidelines will be reviewed periodically by the Advisor and our non-interested directors will receive a copy annually, and, accordingly, are subject to change.
An investment adviser registered under the Advisers Act has a fiduciary duty to act solely in the best interests of its clients. As part of this duty, the Advisor recognizes that conflicts of interest may arise from time to time in relation to proxy voting requirements. A conflict between the Advisor and any client can arise in a number of situations. The following non-exclusive examples illustrate conflicts of interest that could arise:
- •
- A failure to vote in favor of a position supported by management may harm the relationship the Advisor or the Company has with the company;
- •
- A failure to vote in favor of a particular proposal may harm the relationship the Advisor or the Company has with the proponent of the
proposal;
- •
- A failure to vote for or against a particular proposal may adversely affect a business or personal relationship, such as when an officer of the
Advisor has a spouse or other relative who serves as a director of the company, is employed by the company or otherwise has an economic interest therein; or
- •
- Conflicts arising from investment positions held by affiliates of the Advisor.
These policies and procedures for voting proxies are intended to comply with Section 206 of, and Rule 206(4)-6 under, the Advisers Act.
The Advisor intends to vote proxies or similar corporate actions in accordance with the best interests of our shareholders, taking into account such factors as it deems relevant in its sole discretion. Upon receipt of a proxy request, the Advisor's Operations department contacts a senior investment professional responsible for the issuer. The senior investment professional communicates the proxy voting decision to Operations. The hard-copy documentation is completed by Operations and sent back to the appropriate party. Operations maintains a log of all proxy voting documentation received and the status thereof.
Privacy Principles
We are committed to maintaining the privacy of our stockholders and to safeguarding their non-public personal information. The following information is provided to help investors understand what personal information we collect, how we protect that information and why, in certain cases, we may share information with select other parties.
36
Pursuant to our privacy policy, we will not disclose any non-public personal information concerning any of our stockholders who are individuals unless the disclosure meets certain permitted exceptions under Regulation S-P under the Gramm — Leach Bliley Act, as amended. We generally will not use or disclose any stockholder information for any purpose other than as required by law.
We may collect non-public information about investors from our Subscription Agreements or other forms, such as name, address, account number and the types and amounts of investments, and information about transactions with us or our affiliates, such as participation in other investment programs, ownership of certain types of accounts or other account data and activity. We may disclose the information that we collect from our stockholders or former stockholders, as described above, only to our affiliates and service providers and only as allowed by applicable law or regulation. Any party that receives this information will use it only for the services required by us and as allowed by applicable law or regulation, and is not permitted to share or use this information for any other purpose. To protect the non-public personal information of individuals, we permit access only by authorized personnel who need access to that information to provide services to us and our stockholders.
In order to guard our stockholders' non-public personal information, we maintain physical, electronic and procedural safeguards that are designed to comply with applicable law. Non-public personal information that we collect about our stockholders will generally be stored on secured servers. An individual stockholder's right to privacy extends to all forms of contact with us, including telephone, written correspondence and electronic media, such as the Internet.
Pursuant to our privacy policy, we will provide a clear and conspicuous notice to each investor that details our privacy policies and procedures at the time of the investor's subscription.
Our address is 200 Clarendon Street, 37th Floor, Boston, MA 02116. Our phone number is (617) 516-2000, and our internet address is www.baincapitalbdc.com. We make available, free of charge, on our website our proxy statement, annual report on Form 10-K, quarterly reports on Form 10-Q, current reports on Form 8-K and amendments to those reports as soon as reasonably practicable after we electronically file such material with, or furnish it to, the U.S. Securities and Exchange Commission, or SEC. Information contained on our website is not incorporated by reference into this annual report on Form 10-K and you should not consider information contained on our website to be part of this annual report on Form 10-K or any other report we file with the SEC.
The SEC also maintains a website that contains reports, proxy and information statements and other information we file with the SEC at www.sec.gov.
Certain U.S. Federal Income Tax Consequences
The following discussion is a general summary of the material U.S. federal income tax considerations applicable to us and to an investment in shares of our common stock. This summary does not purport to be a complete description of the income tax considerations applicable to such an investment. For example, we have not described certain considerations that may be relevant to certain types of holders subject to special treatment under U.S. federal income tax laws, including stockholders subject to the alternative minimum tax, tax-exempt organizations, insurance companies, dealers in securities, traders in securities that elect to mark-to-market their securities holdings, pass-through entities (including S-corporations) pension plans and trusts, financial institutions, real estate investment trusts ("REITs"), RICs, persons that have a functional currency (as defined in Section 985 of the Code) other than the U.S. dollar and financial institutions. This summary assumes that investors hold shares of our
37
common stock as capital assets (within the meaning of Section 1221 of the Code). The discussion is based upon the Code, Treasury regulations, and administrative and judicial interpretations, each as of the date of the filing of this prospectus and all of which are subject to change, possibly retroactively, which could affect the continuing validity of this discussion. We have not sought and will not seek any ruling from the Internal Revenue Service (the "IRS"), regarding any offering of our securities. This summary does not discuss any aspects of U.S. estate or gift tax or foreign, state or local tax. It does not discuss the special treatment under U.S. federal income tax laws that could result if we were to invest in tax-exempt securities or certain other investment assets. For purposes of this discussion, a "U.S. stockholder" is a beneficial owner of shares of our common stock that is, for U.S. federal income tax purposes:
- •
- an individual who is a citizen or resident of the United States;
- •
- a corporation, or other entity treated as a corporation for U.S. federal income tax purposes, created or organized in or under the laws of the
United States or any state thereof, including, for this purpose, the District of Columbia;
- •
- a trust if (i) a court within the United States is able to exercise primary supervision over the administration of the trust and one or
more "United States persons" (as defined in the Code) have the authority to control all substantive decisions of the trust, or (ii) the trust has in effect a valid election to be treated as a
domestic trust for U.S. federal income tax purposes; or
- •
- an estate, the income of which is subject to U.S. federal income taxation regardless of its source.
For purposes of this discussion, a "Non-U.S. stockholder" is a beneficial owner of shares of our common stock that is not a U.S. stockholder or a partnership (or an entity or arrangement treated as a partnership) for U.S. federal income tax purposes.
If a partnership (including an entity treated as a partnership for U.S. federal income tax purposes) holds shares of our common stock, the tax treatment of a partner in the partnership will generally depend upon the status of the partner and the activities of the partnership. A prospective investor that is a partner in a partnership that will hold shares of our common stock should consult its tax advisors with respect to the purchase, ownership and disposition of shares of our common stock. Tax matters are very complicated and the tax consequences to each stockholder of the ownership and disposition of shares of our common stock will depend on the facts of his, her or its particular situation. You should consult your own tax adviser regarding the specific tax consequences of the ownership and disposition of shares of our common stock to you, including tax reporting requirements, the applicability of U.S. federal, state and local tax laws and non-U.S. tax laws, eligibility for the benefits of any applicable income tax treaty and the effect of any possible changes in the tax laws.
Election to be Subject to be Taxed as a RIC
We have elected to be treated as a RIC under Subchapter M of the Code, beginning with our taxable year ended December 31, 2016. As a RIC, we generally will not have to pay corporate-level U.S. federal income taxes on any net ordinary income or capital gains that we timely distribute to our stockholders as dividends. To qualify as a RIC, we must, among other things, meet certain source-of-income and asset diversification requirements (as described below). In addition, we must distribute to our stockholders, for each taxable year, dividends of an amount at least equal to 90% of our "investment company taxable income," which is generally our net ordinary income plus the excess of realized net short-term capital gains over realized net long-term capital losses and determined without regard to any deduction for dividends paid (the "Annual Distribution Requirement"). Although not required for us to maintain our RIC tax status, in order to preclude the imposition of a 4% nondeductible
38
federal excise tax imposed on RICs, we must distribute to our stockholders in respect of each calendar year dividends of an amount at least equal to the sum of (1) 98% of our net ordinary income (taking into account certain deferrals and elections) for the calendar year, (2) 98.2% of the excess (if any) of our realized capital gains over our realized capital losses, or capital gain net income (adjusted for certain ordinary losses), generally for the one-year period ending on October 31 of the calendar year and (3) the sum of any net ordinary income plus capital gains net income for preceding years that were not distributed during such years and on which we paid no federal income tax (the "Excise Tax Avoidance Requirement"). If we qualify as a RIC and satisfy the Annual Distribution Requirement, then we will not be subject to U.S. federal income tax on the portion of our investment company taxable income and net capital gain (generally, net long-term capital gain in excess of net short-term capital loss) that we timely distribute (or are deemed to timely distribute) as dividends to our stockholders. We will be subject to U.S. federal income tax at the regular corporate rates on any income or capital gain not distributed (or deemed distributed) to our stockholders.
In order to qualify as a RIC for U.S. federal income tax purposes, we must, among other things:
- •
- qualify and have in effect an election to be treated as a BDC under the 1940 Act at all times during each taxable year;
- •
- derive in each taxable year at least 90% of our gross income from dividends, interest, payments with respect to loans of certain securities,
gains from the sale of stock or other securities, net income derived from an interest in a "qualified publicly traded partnership" (as defined in the Code), or other income derived with respect to our
business of investing in such stock or securities (the "90% Income Test"); and
- •
- diversify our holdings so that at the end of each quarter of the taxable year (i) at least 50% of the value of our assets consists of cash, cash equivalents, U.S. government securities, securities of other RICs, and other securities if such other securities of any one issuer do not represent more than 5% of the value of our assets or more than 10% of the outstanding voting securities of the issuer; and (ii) no more than 25% of the value of our assets is invested in the securities, other than U.S. government securities or securities of other RICs, of one issuer or of two or more issuers that are controlled, as determined under applicable tax rules, by us and that are engaged in the same or similar or related trades or businesses or in the securities of one or more qualified publicly traded partnerships (collectively, the "Diversification Tests").
We may invest in partnerships, including qualified publicly traded partnerships, which may result in our being subject to state, local or foreign income, franchise or other tax liabilities. For the purpose of determining whether the Company satisfies the 90% Income Test and the Diversification Tests described above, the character of our distributive share of items of income, gain, losses, deductions and credits derived through any investments in companies that are treated as partnerships for U.S. federal income tax purposes (other than certain publicly traded partnerships), or are otherwise treated as disregarded from us for U.S. federal income tax purposes, generally will be determined as if we realized these tax items directly. Further, for purposes of calculating the value of our investment in the securities of an issuer for purposes of determining the 25% requirement described above, the Company's proper proportion of any investment in the securities of that issuer that are held by a member of our "controlled group" must be aggregated with our investment in that issuer. A controlled group is one or more chains of corporations connected through stock ownership with us if (a) at least 20% of the total combined voting power of all classes of voting stock of each of the corporations is owned directly by one or more of the other corporations, and (b) we directly own at least 20% or more of the combined voting stock of at least one of the other corporations.
39
In addition, as a RIC we are subject to ordinary income and capital gain distribution requirements under U.S. federal excise tax rules for each calendar year. If we do not meet the required distributions, we will be subject to a 4% nondeductible federal excise tax on the undistributed amount. The failure to meet U.S. federal excise tax distribution requirements will not cause us to lose our RIC status. Although we currently intend to make sufficient distributions each taxable year to satisfy the U.S. federal excise tax requirements, under certain circumstances, we may choose to retain taxable income or capital gains in excess of current year distributions into the next tax year in an amount less than what would trigger payments of federal income tax under Subchapter M of the Code. We may then be required to pay a 4% excise tax on such income or capital gains.
A RIC is limited in its ability to deduct expenses in excess of its investment company taxable income. If our deductible expenses in a given taxable year exceed our investment company taxable income, we may incur a net operating loss for that taxable year. However, a RIC is not permitted to carry forward net operating losses to subsequent taxable years and such net operating losses do not pass through to its stockholders. In addition, deductible expenses can be used only to offset investment company taxable income, not net capital gain. A RIC may not use any net capital losses (that is, the excess of realized capital losses over realized capital gains) to offset its investment company taxable income, but may carry forward such net capital losses, and use them to offset future capital gains, indefinitely. Any underwriting fees paid to us are not deductible. Due to these limits on deductibility of expenses and net capital losses, we may for tax purposes have aggregate taxable income for several taxable years that we are required to distribute and that is taxable to our stockholders even if such taxable income is greater than the net income we actually earn during those taxable years.
We may be required to recognize taxable income in circumstances in which we do not receive cash. For example, if we hold debt obligations that are treated under applicable tax rules as having OID (such as debt instruments with PIK interest or, in certain cases, with increasing interest rates or issued with warrants), we must include in income each year a portion of the OID that accrues over the life of the obligation, regardless of whether cash representing such income is received by us in the same taxable year. Because any OID accrued will be included in our investment company taxable income for the taxable year of accrual, we may be required to make a distribution to our stockholders in order to satisfy the Annual Distribution Requirement or the Excise Tax Avoidance Requirement, even though we will not have received any corresponding cash amount. Furthermore, a portfolio company in which we hold equity or debt instruments may face financial difficulty that requires us to work out, modify, or otherwise restructure such equity or debt instruments. Any such restructuring could, depending upon the terms of the restructuring, cause us to incur unusable or nondeductible losses or recognize future non-cash taxable income.
Certain of our investment practices may be subject to special and complex U.S. federal income tax provisions that may, among other things, produce income that will not be qualifying income for purposes of the 90% Income Test. We intend to monitor our transactions and may make certain tax elections that are intended to maintain our status as a RIC and avoid a fund-level tax.
Gain or loss realized by us from warrants acquired by us as well as any loss attributable to the lapse of such warrants generally will be treated as capital gain or loss. Such gain or loss generally will be long term or short term, depending on how long we held a particular warrant.
Although we do not presently expect to do so, we are authorized to borrow funds and to sell assets in order to satisfy distribution requirements. However, under the 1940 Act, we are not permitted to make distributions to our stockholders while our debt obligations and other senior securities are outstanding unless certain "asset coverage" tests are met. Moreover, our ability to dispose of assets to meet our distribution requirements may be limited by (1) the illiquid nature of our portfolio and/or (2) other
40
requirements relating to our qualification as a RIC, including the Diversification Tests. If we dispose of assets in order to meet the Annual Distribution Requirement or the Excise Tax Avoidance Requirement, we may make such dispositions at times that, from an investment standpoint, are not advantageous.
Some of the income and fees that we may recognize, such as fees for providing managerial assistance, certain fees earned with respect to our investments, income recognized in a work-out or restructuring of a portfolio investment, or income recognized from an equity investment in an operating partnership, will not satisfy the 90% Income Test. In order to manage the risk that such income and fees might disqualify us as a RIC for a failure to satisfy the 90% Income Test, we may be required to recognize such income and fees indirectly through one or more entities treated as corporations for U.S. federal income tax purposes. Such corporations will be required to pay U.S. corporate income tax on their earnings, which ultimately will reduce our return on such income and fees.
Failure to Qualify as a RIC
If we were unable to qualify for treatment as a RIC and are unable to cure the failure, for example, by disposing of certain investments quickly or raising additional capital to prevent the loss of RIC status, we would be subject to tax on all of our taxable income at regular corporate rates (and any applicable U.S. state and local taxes). The Code provides some relief from RIC disqualification due to failures to comply with the 90% Income Test and the Diversification Tests, although there may be additional taxes due in such cases. We cannot assure you that we would qualify for any such relief should we fail the 90% Income Test or the Diversification Tests.
Should failure occur, not only would all our taxable income be subject to tax at regular corporate rates (as well as any applicable U.S. state and local taxes), we would not be able to deduct dividend distributions to stockholders, nor would they be required to be made. Distributions, including distributions of net long-term capital gain, would generally be taxable to our stockholders as ordinary dividend income to the extent of our current and accumulated earnings and profits. Subject to certain limitations under the Code, certain corporate stockholders would be eligible to claim a dividends received deduction with respect to such dividends and non-corporate stockholders would generally be able to treat such dividends as "qualified dividend income," which is subject to reduced rates of U.S. federal income tax. Distributions in excess of our current and accumulated earnings and profits would be treated first as a return of capital to the extent of the stockholder's tax basis, and any remaining distributions would be treated as a capital gain. If we fail to qualify as a RIC, we may be subject to regular corporate tax on any net built-in gains with respect to certain of our assets (i.e., the excess of the aggregate gains, including items of income, over aggregate losses that would have been realized with respect to such assets if we had been liquidated) that we elect to recognize on requalification or when recognized over the next five taxable years.
Investing in our common stock involves a number of significant risks. The investor should be aware of various risks, including those described below. The investor should carefully consider these risk factors, together with all of the other information included in this Annual Report. The risks set out below are not the only risks we face. Additional risks and uncertainties not presently known to us or not presently deemed material by us may also impair our operations and performance. If any of the following events occur, our business, financial condition, results of operations and cash flows could be materially and adversely affected. In such case, the net asset value of our common stock could decline, and an investor may lose all or part of his or her investment.
41
Risks Relating to Our Business and Structure
We may be unable to meet our investment objectives or investment strategy.
Investing in us is intended for long-term investors who can accept the risks associated with investing primarily in potentially illiquid, privately negotiated (i) senior first lien, stretch senior (as further described hereinafter), senior second lien and unitranche loans, (ii) mezzanine debt and other junior investments and (iii) secondary purchases of assets or portfolios that primarily consist of middle market corporate debt. We may also invest, from time to time, in equity securities, distressed debt, debtor-in-possession loans, structured products, structurally subordinate loans, investments with deferred interest features, zero-coupon securities and defaulted securities. There can be no assurance that we will achieve our investment or performance objectives, including our targeted returns. Accordingly, the possibility of partial or total loss of our capital exists.
We are dependent upon key personnel of Bain Capital Credit and our Advisor.
Our ability to achieve our investment objectives will depend on our ability to manage our business and to grow our investments and earnings. This will depend, in turn, on the financial and managerial expertise of our Advisor, including with resources utilized from Bain Capital Credit. Although we have attempted to foster a team approach to investing, the loss of key individuals employed by Bain Capital Credit or our Advisor could have a material adverse effect on our financial condition, performance and ability to achieve our investment objectives. If these individuals do not maintain their employment or other existing relationships with Bain Capital Credit or our Advisor and do not develop new relationships with other sources of investment opportunities available to us, we may not be able to grow our investment portfolio.
Bain Capital Credit's and our Advisor's investment professionals have substantial responsibilities in connection with the management of other Bain Capital Credit Clients. The personnel of Bain Capital Credit may be called upon to provide managerial assistance to our portfolio companies. These demands on their time, which may increase as the number of investments grow, may distract them or slow our rate of investment. The employees of our Advisor and other Bain Capital Credit investment professionals expect to devote such time and attention to the conduct of our business as such business shall reasonably require. However, there can be no assurance, for example, that the members of our Advisor or such investment professionals will devote any minimum number of hours each week to our affairs or that they will continue to be employed by Bain Capital Credit. Subject to certain remedies, in the event that certain employees of our Advisor cease to be actively involved with us, we will be required to rely on the ability of Bain Capital Credit to identify and retain other investment professionals to conduct our business. The Board intends to evaluate the commitment and performance of our Advisor in conjunction with the annual approval of the Investment Advisory Agreement and Administration Agreement.
Under the Resource Sharing Agreement, Bain Capital Credit has agreed to provide our Advisor with experienced investment professionals necessary to fulfill its obligations under the Investment Advisory Agreement. The Resource Sharing Agreement, however, may be terminated by either party on 60 days' notice. We cannot assure stockholders that Bain Capital Credit will fulfill its obligations under the Resource Sharing Agreement. We also cannot assure stockholders that our Advisor will enforce the Resource Sharing Agreement if Bain Capital Credit fails to perform, that such agreement will not be terminated by either party or that we will continue to have access to the investment professionals of Bain Capital Credit and its affiliates or their information and deal flow.
Further, we depend upon Bain Capital Credit and our Advisor to maintain their relationships with private equity sponsors, placement agents, investment banks, management groups and other financial
42
institutions, and we expect to rely to a significant extent upon these relationships to provide us with potential investment opportunities. If they fail to maintain such relationships, or to develop new relationships with other sources of investment opportunities, we will not be able to grow our investment portfolio. In addition, individuals with whom the senior professionals of Bain Capital Credit and our Advisor have relationships are not obligated to provide us with investment opportunities, and we cannot assure you that these relationships will generate investment opportunities for us in the future.
We may not replicate the historical results achieved by Bain Capital Credit, or by our Advisor or its affiliates.
Our primary focus in making investments may differ from those of existing Bain Capital Credit Funds and Related Funds. Past performance should not be relied upon as an indication of future results. There can be no guarantee that we will replicate our own historical performance, the historical success of Bain Capital Credit or the historical performance of Bain Capital Credit Funds and/or Related Funds, and we caution stockholders that our investment returns could be substantially lower than the returns achieved by them in prior periods. We cannot assure you that we will be profitable in the future or that our Advisor will be able to continue to implement our investment objectives with the same degree of success as it has had in the past. Additionally, all or a portion of the prior results may have been achieved in particular market conditions that may never be repeated. Moreover, current or future market volatility and regulatory uncertainty may have an adverse impact on our future performance.
The due diligence process that our Advisor undertakes in connection with our investments may not reveal all the facts that may be relevant in connection with an investment.
Our Advisor's due diligence may not reveal all of a company's liabilities and may not reveal other weaknesses in its business. There can be no assurance that our due diligence process will uncover all relevant facts that would be material to an investment decision. Before making an investment in, or a loan to, a company, our Advisor will assess the strength and skills of the company's management team and other factors that it believes are material to the performance of the investment. In making the assessment and otherwise conducting customary due diligence, our Advisor will rely on the resources available to it and, in some cases, an investigation by third parties. This process is particularly important and highly subjective with respect to newly organized entities because there may be little or no information publicly available about the entities. We may make investments in, or loans to, companies, including middle market companies, which are not subject to public company reporting requirements, including requirements regarding preparation of financial statements, and will, therefore, depend upon the compliance by investment companies with their contractual reporting obligations and the ability of our Advisor's investment professionals to obtain adequate information to evaluate the potential returns from investing in these companies. If we are unable to uncover all material information about these companies, we may not make a fully informed investment decision, and we may lose money on our investments. As a result, the evaluation of potential investments and the ability to perform due diligence on and effective monitoring of investments may be impeded, and we may not realize the returns which we expect on any particular investment. In the event of fraud by any company in which we invest or with respect to which we make a loan, we may suffer a partial or total loss of the amounts invested in that company.
Global capital markets could enter a period of severe disruption and instability. These conditions have historically affected and could again materially and adversely affect debt and equity capital markets in the United States and around the world and our business.
From time to time, the global capital markets may experience periods of disruption and instability resulting in increasing spreads between the yields realized on riskier debt securities and those realized on risk-free securities, a lack of liquidity in parts of the debt capital markets, significant write-offs in the financial services sector or the re-pricing of credit risk in the broadly syndicated market. Deteriorating
43
market conditions could result in increasing volatility and illiquidity in the global credit, debt and equity markets generally. The duration and ultimate effect of such market conditions cannot be accurately forecasted. Deteriorating market conditions and uncertainty regarding economic markets generally could result in declines in the market values of potential investments or declines in the market values of investments after they are made or acquired by us and affect the potential for liquidity events involving such investments or portfolio companies. Such declines may be exacerbated by other events, such as the failure of significant financial institutions or hedge funds, dislocations in other investment markets or other extrinsic events. Applicable accounting standards require us to determine the fair value of our investments as the amount that would be received in an orderly transaction between market participants at the measurement date. While most of our investments are not publicly traded, as part of our valuation process we consider a number of measures, including comparison to publicly traded securities. As a result, volatility in the public capital markets can adversely affect our investment valuations.
During any such periods of market disruption and instability, we and other companies in the financial services sector may have limited access, if any, to alternative markets for debt and equity capital. Equity capital may be difficult to raise because, subject to some limited exceptions that will apply to us as a BDC, we will generally not be able to issue additional shares of our common stock at a price less than net asset value ("NAV") without first obtaining approval for such issuance from our stockholders and our Independent Directors. In addition, our ability to incur indebtedness (including by issuing preferred stock) is limited by applicable regulations such that our asset coverage, as defined in the 1940 Act, must equal at least 200% (or 150% if certain disclosure and approval requirements are met) immediately after each time we incur indebtedness. The debt capital that will be available, if any, may be at a higher cost and on less favorable terms and conditions in the future. Any inability to raise capital could have a negative effect on our business, financial condition and results of operations.
A prolonged period of market illiquidity may cause us to reduce the volume of loans and debt securities we originate and/or fund and adversely affect the value of our portfolio investments, which could have a material and adverse effect on our business, financial condition, results of operations and cash flows.
We may also invest a portion of our capital in debt securities issued by issuers domiciled in Europe, including issuers domiciled in the U.K. The government of the U.K. held an in-or-out referendum on the U.K.'s membership in the European Union ("EU") on June 23, 2016. The referendum resulted in a vote in favor of the exit of the U.K. from the EU ("Brexit"). In March 2017, the U.K. formally invoked Article 50 of the Treaty of Lisbon to begin the process under which the U.K. shall withdraw from the EU in due course. Upon invoking Article 50, the U.K. triggered a two-year period for negotiation of the terms of the withdrawal from the EU. On October 17, 2019, the U.K. and the EU agreed on the terms on which the former would withdraw from the latter, but the United Kingdom Parliament did not ratify this agreement. Following the results of the general election held on December 12, 2019 in the U.K., the United Kingdom Parliament voted in favor of the withdrawal agreement bill, thereby approving the U.K.'s exit from the EU on January 31, 2020. Subsequent to withdrawal, the U.K. and the EU will seek to negotiate and finalize rules and agreements regarding the U.K.'s exit from the EU. However, there is a significant degree of uncertainty about how these negotiations will be conducted and their outcome. During the negotiating period and beyond, the impact of Brexit on the U.K. and European economies and the broader global economy could be significant, resulting in negative impacts on currency and financial markets generally, such as increased volatility and illiquidity, and potentially lower economic growth in markets in the U.K., Europe and globally, which could adversely affect us.
44
Adverse developments in the credit markets may impair our ability to enter into new debt financing arrangements.
During the economic downturn in the United States that began in mid-2007, many commercial banks and other financial institutions stopped lending or significantly curtailed their lending activity. In addition, in an effort to stem losses and reduce their exposure to segments of the economy deemed to be high risk, some financial institutions limited refinancing and loan modification transactions and reviewed the terms of existing facilities to identify bases for accelerating the maturity of existing lending facilities. If these conditions recur, it may be difficult for us to enter into a new credit or other borrowing facility, obtain other financing to finance the growth of our investments, or refinance any outstanding indebtedness on acceptable economic terms, or at all.
Our executive officers and directors, our Advisor, Bain Capital Credit and their affiliates, officers, directors and employees may face certain conflicts of interest.
The executive officers and directors and other employees of Bain Capital Credit and our Advisor, including our portfolio managers, are, or may be, investors in, or serve, or may serve, as officers, directors, members, or principals of, entities that operate in the same or a related line of business as we do, or of Bain Capital Credit Clients. Similarly, Bain Capital Credit and Affiliated Advisors may have other clients with similar, different or competing investment objectives. Accordingly, the members of the professional staff of Bain Capital Credit and our Advisor will have demands on their time for the investment, monitoring and other functions of other funds advised by Bain Capital Credit.
In serving in these multiple capacities, they may have obligations to other clients or investors in those entities, the fulfillment of which may not be in the best interests of, or may be adverse to the interests of, us or our stockholders. Although the professional staff of Bain Capital Credit will devote as much time to our management as appropriate to enable our Advisor to perform its duties in accordance with the Investment Advisory Agreement, Bain Capital Credit has, and will continue to have management responsibilities for Bain Capital Credit Clients. There is a potential that we will compete with these Bain Capital Credit Clients, for capital and investment opportunities. As a result, Bain Capital Credit and our portfolio managers will face conflicts in the allocation of investment opportunities among us and the Bain Capital Credit Clients and may make certain investments that are appropriate for us but for which we receive a relatively small allocation of such investment or no allocation at all. Bain Capital Credit intends to allocate investment opportunities among eligible Bain Capital Credit Clients in a manner that is fair and equitable over time and consistent with its allocation policy. However, we can offer no assurance that such opportunities will be allocated to us fairly or equitably in the short-term or over time, and we may not be given the opportunity to participate in investments made by investment funds managed by our Advisor or an investment manager affiliated with our Advisor, including Bain Capital Credit. If our Advisor recommends a particular level of investment for us, and the aggregate amount recommended by our Advisor for us and for other participating Bain Capital Credit Clients exceeds the amount of the investment opportunity, subject to applicable law, investments made pursuant to exemptive relief will generally be allocated among the participants pro rata based on capital available for investment in the asset class being allocated and the respective governing documents of such Bain Capital Credit Clients. We expect that available capital for our investments will be determined based on the amount of cash on-hand, existing commitments and reserves, if any, the targeted leverage level, targeted asset mix and diversification requirements and other investment policies and restrictions set by the Board or as imposed by applicable laws, rules, regulations or interpretations. In instances when investments are not made pursuant to exemptive relief, allocations among us and other Bain Capital Credit Clients, subject to applicable law and regulation, will be done in accordance with our Advisor's trade allocation practice, which is generally pro rata based on order size. There can be no assurance that we will be able to participate in all investment opportunities that are suitable for us.
45
Further, to the extent permitted by applicable law, we and our affiliates may own investments at different levels of a portfolio company's capital structure or otherwise own different classes of a portfolio company's securities, which may give rise to conflicts of interest or perceived conflicts of interest. Conflicts may also arise because decisions regarding our portfolio may benefit our affiliates. Our affiliates may pursue or enforce rights with respect to one of our portfolio companies, and those activities may have an adverse effect on us.
Bain Capital Credit's Credit Committee, our Advisor or its affiliates may, from time to time, possess material non-public information, limiting our investment discretion.
The executive officers and directors, principals and other employees of Bain Capital Credit and our Advisor may serve as directors of, or in a similar capacity with, portfolio companies in which we invest, the securities of which are purchased or sold on our behalf, and may come into possession of material non-public information with respect to issuers in which we may be considering making an investment. In the event that material non-public information is obtained with respect to such companies, or we become subject to trading restrictions under the internal trading policies of those companies, the policies of Bain Capital, or as a result of applicable law or regulations, we could be prohibited for a period of time or indefinitely from purchasing or selling the securities of such companies, or we may be precluded from providing such information or other ideas to other funds affiliated with Bain Capital that may benefit from such information, and this prohibition may have an adverse effect on us.
Our management and incentive fee structure may create incentives for our Advisor that are not fully aligned with the interests of our stockholders and may induce our Advisor to make speculative investments.
In the course of our investing activities, we will pay management and incentive fees to our Advisor. We have entered into an Investment Advisory Agreement with our Advisor that provides that these fees will be based on the value of our gross assets (which includes assets purchased with borrowed amounts or other forms of leverage but excludes cash and cash equivalents), instead of our net assets (defined as total assets less indebtedness and before taking into account any incentive fees payable). As a result, investors in our common stock will invest on a "gross" basis and receive distributions on a "net" basis after expenses, including the costs of leverage, resulting in a lower rate of return than one might achieve if distributions were made on a gross basis. Because our management fees are based on the value of our gross assets, the incurrence of debt or the use of leverage will increase the management fees due to our Advisor. As such, our Advisor may have an incentive to use leverage to make additional investments. In addition, as additional leverage would magnify positive returns, if any, on our portfolio, our incentive fee would become payable to our Advisor (i.e., exceed the Hurdle Amount) at a lower average return on our portfolio. Thus, if we incur additional leverage, our Advisor may receive additional incentive fees without any corresponding increase (and potentially with a decrease) in our net performance. Additionally, under the incentive fee structure, our Advisor may benefit when capital gains are recognized and, because our Advisor will determine when to sell a holding, our Advisor will control the timing of the recognition of such capital gains. As a result of these arrangements, there may be times when the management team of our Advisor has interests that differ from those of our stockholders, giving rise to a conflict. Furthermore, there is a risk our Advisor will make more speculative investments in an effort to receive this payment. Payment-in-kind ("PIK") interest and original issue discount ("OID") would increase our pre-incentive fee net investment income by increasing the size of the loan balance of underlying loans and increasing our assets under management ("AUM") and makes it easier for our Advisor to surpass the Hurdle Amount and increase the amount of incentive fees payable to our Advisor.
In addition, under the incentive fee structure, our Advisor may benefit when capital gains are recognized and, because our Advisor will determine when to sell a holding, our Advisor will control the timing of the recognition of such capital gains. As a result of these arrangements, there may be times when
46
our Advisor has interests that differ from those of our stockholders, giving rise to a conflict. As a result, our Advisor may have an incentive to invest more in companies whose securities are likely to yield capital gains, as compared to income producing securities. Such a practice could result in our investing in more speculative securities than would otherwise be the case, which could result in higher investment losses, particularly during cyclical economic downturns. PIK interest and OID would increase our pre-incentive fee net investment income by increasing the size of the loan balance of underlying loans and increasing our AUM and makes it easier for our Advisor to surpass the Hurdle Amount and increase the amount of incentive fees payable to our Advisor. Our Advisor may thus have an incentive to invest in deferred interest securities in circumstances where it would not have done so but for the opportunity to continue to earn the incentive fee even when the issuers of the deferred interest securities would not be able to make actual cash payments to us on such securities. Under these investments, we accrue the interest over the life of the investment but do not receive the cash income from the investment until the end of the term. Our net investment income used to calculate the income portion of our incentive fee, however, includes accrued interest. Thus, a portion of this incentive fee is based on income that we have not yet received in cash. This risk could be increased because our Advisor is not obligated to reimburse us for any incentive fees received even if we subsequently incur losses or never receive in cash the accrued income (including accrued income with respect to OID, PIK interest and zero coupon securities).
Additionally, the fee we pay our Advisor increased after the completion of the IPO. With respect to any period prior to the IPO, pursuant to a waiver agreement with our Advisor, all base management fees in excess of an annual rate of 0.75% of the aggregate gross assets excluding cash and cash equivalents were contractually waived by our Advisor and not subject to recoupment by our Advisor. Upon completion of the IPO, the base management fee returned to an annual rate of 1.5% of our gross assets. Further, upon completion of the IPO, we pay our Advisor a 17.5% incentive fee based on pre-incentive fee net investment income and capital gains, an increase from 15.0% prior to the completion of the IPO. In addition, prior to the completion of the IPO, the Administrator did not seek reimbursement for certain expenses payable by us under the Administration Agreement.
The Board is charged with protecting our interests by monitoring how our Advisor addresses these and other conflicts of interests associated with its services and compensation. While they will not review or approve each investment decision or incurrence of leverage, our Independent Directors will periodically review our Advisor's services and fees as well as its portfolio management decisions and portfolio performance. In connection with these reviews, our Independent Directors will consider whether our fees and expenses (including those related to leverage) remain appropriate.
We may invest, to the extent permitted by law, in the securities and instruments of other investment companies, including private funds, and, to the extent we so invest, bear our ratable share of any such investment company's expenses, including management and performance fees. We also remain obligated to pay management and incentive fees to our Advisor with respect to the assets invested in the securities and instruments of other investment companies. With respect to each of these investments, each of our stockholders bears his or her share of the management and incentive fees of our Advisor as well as indirectly bearing the management and performance fees and other expenses of any investment companies in which we invest.
Conflicts created by valuation process for certain portfolio holdings.
We expect to make many of our portfolio investments in the form of loans and securities that are not publicly traded and for which no market based price quotation is available. As a result, the Board will determine the fair value of these loans and securities in good faith as described below in "—The majority of our portfolio investments are recorded at fair value as determined in good faith by the Board and, as a result, there may be uncertainty as to the value of our portfolio investments." Each of the interested members of the
47
Board has an indirect pecuniary interest in our Advisor. The participation of our Advisor's investment professionals in our valuation process, and the pecuniary interest in our Advisor by certain members of the Board, could result in a conflict of interest as our Advisor's management fee is based, in part, on the value of our gross assets, and our incentive fees will be based, in part, on realized gains and realized and unrealized losses.
Conflicts may arise related to other arrangements with Bain Capital Credit and our Advisor's other affiliates.
We have entered into an Administration Agreement with our Administrator pursuant to which we are required to pay to our Administrator our allocable portion of overhead and other expenses incurred by our Administrator in performing its obligations under such Administration Agreement, such as rent and our allocable portion of the cost of our chief financial officer and chief compliance officer and their respective staffs. In addition, our Advisor has entered into a Resource Sharing Agreement with Bain Capital Credit pursuant to which Bain Capital Credit provides our Advisor with the resources necessary to fulfill its obligations under the Investment Advisory Agreement. These agreements create conflicts of interest that the Independent Directors will monitor.
Our Advisor has limited liability and is entitled to indemnification under the Investment Advisory Agreement.
Under the Investment Advisory Agreement, our Advisor has not assumed any responsibility to us other than to render the services called for under that agreement. Our Advisor is not responsible for any action of the Board in following or declining to follow our Advisor's advice or recommendations. Under the Investment Advisory Agreement, our Advisor, its officers, managers, partners, agents, employees, controlling persons, members and any other person or entity affiliated with our Advisor, including without limitation our Administrator, will not be liable to us for any actions taken or omitted to be taken by our Advisor in connection with the performance of any of its duties or obligations under the Investment Advisory Agreement or otherwise as an investment adviser of us, except to the extent specified in Section 36(b) of the 1940 Act concerning loss resulting from a breach of fiduciary duty (as the same is finally determined by judicial proceedings) with respect to the receipt of compensation for services. In addition, as part of the Investment Advisory Agreement, we have agreed to indemnify our Advisor and each of its officers, managers, partners, agents, employees, controlling persons, members and any other person or entity affiliated with our Advisor, and hold them harmless from and against all damages, liabilities, costs and expenses (including reasonable attorneys' fees and amounts reasonably paid in settlement) incurred by such party in or by reason of any pending, threatened or completed action, suit, investigation or other proceeding (including an action or suit by or in the right of us or our security holders) arising out of or otherwise based upon the performance of any of our Advisor's duties or obligations under the Investment Advisory Agreement or otherwise as an investment adviser of us, except in respect of any liability to us or our security holders to which such party would otherwise be subject by reason of willful misfeasance, bad faith or gross negligence in the performance of our Advisor's duties or by reason of the reckless disregard of our Advisor's duties and obligations under the Investment Advisory Agreement. These protections may lead our Advisor to act in a riskier manner when acting on our behalf than it would when acting for its own account.
We operate in an increasingly competitive market for investment opportunities, which could reduce returns and result in losses.
The business of investing in assets meeting our investment objectives is highly competitive. Competition for investment opportunities includes a growing number of nontraditional participants, such as hedge funds, senior private debt funds, including BDCs, and other private investors, as well as more traditional lending institutions and competitors. Some of these competitors may have more experience than us and considerably greater resources than us and access to greater amounts of capital and to capital
48
that may be committed for longer periods of time or may have different return thresholds than ours, and thus these competitors may have advantages not shared by us. In addition, some of our competitors may have higher risk tolerances or different risk assessments, which could allow them to consider a wider variety of investments and establish more relationships than us. Furthermore, many of our competitors are not subject to the regulatory restrictions that the 1940 Act imposes on us as a BDC or the requirements we must satisfy to maintain our RIC qualification. Increased competition for, or a diminishment in the available supply of, investments suitable for us could result in lower returns on such investments and have a material adverse effect on our business, financial condition and results of operations. As a result of this competition, we may not be able to take advantage of attractive investment opportunities from time to time, and we can offer no assurance that we will be able to identify and make investments that are consistent with our investment objectives.
Moreover, the identification of attractive investment opportunities is difficult and involves a high degree of uncertainty. We may incur significant expenses in connection with identifying investment opportunities and investigating other potential investments that are ultimately not consummated, including expenses relating to due diligence, transportation, legal expenses and the fees of other third party advisors.
With respect to the investments we make, we will not seek to compete based primarily on the interest rates we will offer, and we believe that some of our competitors may make loans with interest rates that will be lower than the rates we offer. In the secondary market for acquiring existing loans, we expect to compete generally on the basis of pricing terms. With respect to all investments, we may lose some investment opportunities if we do not match our competitors' pricing, terms and structure. However, if we match our competitors' pricing, terms and structure, we may experience decreased net interest income, lower yields and increased risk of credit loss. We may also compete for investment opportunities with Bain Capital Credit Funds and Related Funds. See "—Our executive officers and directors, our Advisor, Bain Capital Credit and their affiliates, officers, directors and employees may face certain conflicts of interest."
We may need to raise additional capital.
We intend to access the capital markets periodically to issue debt or equity securities or borrow from financial institutions in order to obtain additional capital to fund new investments and grow our portfolio of investments. Unfavorable economic conditions could increase our funding costs, limit our access to the capital markets or result in a decision by lenders not to extend credit to us. A reduction in the availability of new capital could limit our ability to grow. In addition, we are required to distribute in respect of each taxable year dividends for U.S. federal income tax purposes of an amount generally at least equal to 90% of the sum of our net ordinary income and net short-term capital gains in excess of net long-term capital losses, if any, for such taxable year to our stockholders to maintain our ability to be eligible for treatment as a RIC. Amounts so distributed will not be available to fund new investments or repay maturing debt. An inability on our part to access the capital markets successfully could limit our ability to grow our business and execute our business strategy fully and could decrease our earnings, if any, which would have an adverse effect on the value of our securities.
Further, we may pursue growth through acquisitions or strategic investments in new businesses. Completion and timing of any such acquisitions or strategic investments may be subject to a number of contingencies and risks. There can be no assurance that the integration of an acquired business will be successful or that an acquired business will prove to be profitable or sustainable.
49
Our business could be adversely affected in the event we default under our debt agreements or any future credit or other borrowing agreements.
In the event we default on our debt agreements or any future credit or other borrowing facility, our business could be adversely affected as we may be forced to sell a portion of our investments quickly and prematurely at what may be disadvantageous prices to us in order to meet our outstanding payment obligations and/or support working capital requirements under such credit facility or such future credit or other borrowing facility, any of which would have a material adverse effect on our business, ability to pay dividends, financial condition, results of operations and cash flows. If we were unable to obtain a waiver of a default from the lenders or holders of that indebtedness, as applicable, those lenders or holders could accelerate repayment under that indebtedness, which may result in cross-acceleration of other indebtedness. An acceleration could have a material adverse impact on our business, financial condition and results of operations.
In addition, following any such default, the agent for the lenders under the relevant credit facility or such future credit or other borrowing facility could assume control of the disposition of any or all of our assets, including the selection of such assets to be disposed and the timing of such disposition, which could have a material adverse effect on our business, financial condition, results of operations and cash flows.
Lastly, as a result of any such default, we may be unable to obtain additional leverage, which could, in turn, affect our return on capital.
Our strategy involves a high degree of leverage. We intend to continue to finance our investments with borrowed money, which will magnify the potential for gain or loss on amounts invested and may increase the risk of investing in us. The risks of investment in a highly leverage fund include volatility and possible distribution restrictions.
The use of leverage magnifies the potential for gain or loss on amounts invested. The use of leverage is generally considered a speculative investment technique and increases the risks associated with investing in our securities. However, we currently borrow from, and may in the future issue debt securities to, banks, insurance companies and other lenders. Lenders of these funds will have fixed dollar claims on our assets that are superior to the claims of our common stockholders, and we would expect such lenders to seek recovery against our assets in the event of a default. We may pledge up to 100% of our assets and may grant a security interest in all of our assets under the terms of any debt instruments we may enter into with lenders. In addition, under the terms of our debt agreements and any future credit or other borrowing facility or other debt instrument we may enter into, we are likely to be required to use the net proceeds of any investments that we sell to repay a portion of the amount borrowed under such facility or instrument before applying such net proceeds to any other uses. If the value of our assets decreases, leveraging would cause NAV to decline more sharply than it otherwise would have had we not used leverage, thereby magnifying losses or eliminating our stake in a leveraged investment. Similarly, any decrease in our revenue or income will cause our net income to decline more sharply than it would have had we not borrowed. Such a decline would also negatively affect our ability to make dividend payments on our common stock or preferred stock. Our ability to service any debt will depend largely on our financial performance and will be subject to prevailing economic conditions and competitive pressures. In addition, our common stockholders will bear the burden of any increase in our expenses as a result of our use of leverage, including interest expenses and any increase in the base management fee payable to our Advisor.
We cannot assure you that our business will generate sufficient cash flow from operations or that future borrowings will be available to us under our debt agreements or otherwise in an amount sufficient to enable us to repay our indebtedness or to fund our other liquidity needs. We may need to refinance all or a portion of our indebtedness on or before it matures. We cannot assure you that we will be able to refinance any of our indebtedness on commercially reasonable terms or at all. If we cannot service our indebtedness,
50
we may have to take actions such as selling assets or seeking additional equity. We cannot assure you that any such actions, if necessary, could be affected on commercially reasonable terms or at all, or on terms that would not be disadvantageous to our stockholders or on terms that would not require us to breach the terms and conditions of our existing or future debt agreements.
As a BDC, we generally are required to meet a coverage ratio of total assets to total borrowings and other senior securities, which include all of our borrowings and any preferred stock that we may issue in the future, of at least 150%. If this ratio declines below 150%, we will not be able to incur additional debt and could be required to sell a portion of our investments to repay some debt when it is otherwise disadvantageous for us to do so. This could have a material adverse effect on our operations, and we may not be able to make distributions. The amount of leverage that we employ will depend on our Advisor's assessment of market and other factors at the time of any proposed borrowing. We cannot assure stockholders that we will be able to obtain credit at all or on terms acceptable to us. The Small Business Credit Availability Act (the "SBCAA"), which was signed into law in March 2018, modified the applicable section of the 1940 Act and decreases the asset coverage requirements applicable to BDCs from 200% to 150% (subject to either stockholder approval or approval of both a majority of the Board and a majority of directors who are not interested persons). On November 28, 2018, the Board approved the reduction of the Company's asset coverage requirements in Section 61(a)(2) of the 1940 Act to 150% and recommended the stockholders to vote in favor of the proposal at the special stockholder meeting on February 1, 2019. On February 1, 2019, the Company's stockholders approved the application of the reduced asset coverage. Effective February 2, 2019, the Company is permitted to borrow amounts such that its asset coverage ratio, as defined in the 1940 Act, is at least 150% after such borrowing (if certain requirements are met), rather than 200%, as previously required.
The following table illustrates the effect of leverage on returns from an investment in our common stock assuming that we employ (i) our actual asset coverage ratio as of December 31, 2019 and (ii) a hypothetical asset coverage ratio of 150%, each at various annual returns on our portfolio as of December 31, 2019, net of expenses. The calculations in the table below are hypothetical, and actual returns may be higher or lower than those appearing in the table below.
| Assumed Return on our Portfolio (Net of Expenses) |
(10.00%) | (5.00%) | 0.00% | 5.00% | 10.00% | |||||
|---|---|---|---|---|---|---|---|---|---|---|
Corresponding return to common stockholder assuming actual asset coverage as of December 31, 2019 (164%)(1) |
(33.23%) | (20.24%) | (7.25%) | 5.74% | 18.72% | |||||
Corresponding return to common stockholder assuming 150% asset coverage(2) |
(39.83%) | (24.59%) | (9.36%) | 5.88% | 21.12% |
- (1)
- Based
on (i) $2,645.6 million in total assets as of December 31, 2019, (ii) $1,579.2 million in outstanding
indebtedness as of December 31, 2019, (iii) $1,018.4 million in net assets as of December 31, 2019, and (iv) an annualized average interest rate on our indebtedness,
as of December 31, 2019, excluding fees (such as fees on undrawn amounts and amortization of financing costs), of 4.68%.
- (2)
- Based on (i) $3,103.1 million in total assets on a pro forma basis as of December 31, 2019, after giving effect of a hypothetical asset coverage ratio of 150%, (ii) $2,036.8 million in outstanding indebtedness on a pro forma basis as of December 31, 2019 after giving effect of a hypothetical asset coverage ratio of 150%, (iii) $1,018.4 million in net assets as of December 31, 2019, and (iv) an annualized average interest rate on our indebtedness, as of December 31, 2019, excluding fees (such as fees on undrawn amounts and amortization of financing costs), of 4.68%.
51
We are subject to risks associated with the current interest rate environment and to the extent we use debt to finance our investments, changes in interest rates will affect our cost of capital and net investment income.
An increase in interest rates from their present levels may make it more difficult for our portfolio companies to service their obligations under the debt investments that we hold. Rising interest rates could also cause portfolio companies to shift cash from other productive uses to the payment of interest, which may have a material adverse effect on their business and operations and could, over time, lead to increased defaults. In July 2017, the head of the United Kingdom Financial Conduct Authority announced the intention to phase out the use of the London Interbank Offered Rate ("LIBOR" or "L") by the end of 2021. Such announcement indicates that the continuation of LIBOR and other Reference Rates on the current basis cannot and will not be guaranteed after 2021. This announcement and any additional regulatory or market changes may have an adverse impact on our portfolio companies, our performance or our financial condition. Any replacement rate that is chosen may be less favorable than the current rates. Until the announcement of the replacement rate, our portfolio companies may continue to invest in instruments that reference LIBOR or otherwise use LIBOR due to favorable liquidity or pricing.
The expected discontinuation of LIBOR could have a significant impact on our business. We anticipate significant operational challenges for the transition away from LIBOR including, amending existing loan agreements with borrowers on investments that may have not been modified with fallback language and adding effective fallback language to new agreements in the event that LIBOR is discontinued before maturity. There may also be additional issues associated with our current processes and information systems that will need to be identified and evaluated by us. Due to the uncertainty of the replacement for LIBOR, the potential effect of any such event on our cost of capital and net investment income cannot yet be determined. Further changes or reforms to the determination or supervision of LIBOR may result in a sudden or prolonged increase or decrease in reported LIBOR, which could have an adverse impact on the market value for or value of any LIBOR-linked securities, loans, and other financial obligations or extensions of credit held by or due to us and could have a material adverse effect on our business, financial condition and results of operations.
In advance of 2021, regulators and market participants will seek to work together to identify or develop successor reference rates and how the calculation of associated spreads (if any) should be adjusted. The Federal Reserve Board, in conjunction with the Alternative Reference Rates Committee, a steering committee comprised of large U.S. financial institutions, is considering replacing U.S. dollar LIBOR with a new index calculated by short term repurchase agreements, backed by U.S. Treasury securities, called the Secured Overnight Financing Rate ("SOFR"). The first publication of SOFR was released in April 2018. Whether or not SOFR attains market traction as a LIBOR replacement remains a question and the future of LIBOR at this time is uncertain. Additionally, prior to 2021, it is expected that industry trade associations and participants will focus on the transition mechanisms by which the reference rates and spreads (if any) in existing contracts or instruments may be amended, whether through marketwide protocols, fallback contractual provisions, bespoke negotiations or amendments or otherwise. Nonetheless, the termination of LIBOR presents risks to us and our portfolio companies. At this time, it is not possible to exhaustively identify or predict the effect of any such changes, any establishment of alternative reference rates or any other reforms that may be enacted in the United Kingdom or elsewhere.
To the extent we borrow money to make investments, our net investment income will depend, in part, upon the difference between the rate at which we borrow funds and the rate at which we invest those funds. As a result, we can offer no assurance that a significant change in market interest rates would not have a material adverse effect on our net investment income in the event we use debt to finance our investments. In periods of rising interest rates, our cost of funds would increase, which could reduce our net investment income. Such techniques may include various interest rate hedging activities to the extent permitted by the 1940 Act. In addition, a rise in the general level of interest rates typically leads to higher
52
interest rates applicable to our debt investments. Accordingly, an increase in interest rates may result in an increase of the amount of our pre-incentive fee net investment income, which could make it easier for us to meet or exceed the Hurdle Amount and, as a result, increase the incentive fees payable to our Advisor.
We are and may be subject to restrictions under our Credit debt agreements and any future credit or other borrowing facility that could adversely impact our business.
Our debt agreements and any future credit or other borrowing facility, may be backed by all or a portion of our loans and securities on which the lenders may have a security interest. We may pledge up to 100% of our assets and may grant a security interest in all of our assets under the terms of any debt instrument we enter into with lenders. We expect that any security interests we grant will be set forth in a pledge and security agreement and evidenced by the filing of financing statements by the agent for the lenders. In addition, we expect that the custodian for our securities serving as collateral for such loan would include in its electronic systems notices indicating the existence of such security interests and, following notice of occurrence of an event of default, if any, and during its continuance, will only accept transfer instructions with respect to any such securities from the lender or its designee. If we were to default under the terms of any debt instrument, the agent for the applicable lenders would be able to assume control of the timing of disposition of any or all of our assets securing such debt, which would have a material adverse effect on our business, financial condition, results of operations and cash flows.
In addition, any security interests as well as negative covenants included in our debt agreements or any future credit or other borrowing facility may limit our ability to create liens on assets to secure additional debt and may make it difficult for us to restructure or refinance indebtedness at or prior to maturity or obtain additional debt or equity financing. In addition, if our borrowing base under our debt agreements or any future credit or other borrowing facility were to decrease, we would be required to secure additional assets in an amount equal to any borrowing base deficiency. In the event that all of our assets are secured at the time of such a borrowing base deficiency, we could be required to repay advances under the relevant credit facility or any other borrowing facility or make deposits to a collection account, either of which could have a material adverse impact on our ability to fund future investments and to pay distributions.
In addition, under our debt agreements and any future credit or other borrowing facilities, we may be subject to limitations as to how borrowed funds may be used, which may include restrictions on geographic and industry concentrations, loan size, payment frequency and status, average life, collateral interests and investment ratings, as well as restrictions on leverage, which may affect the amount of funding that may be obtained. For example, proceeds of the loans under the Credit Facilities may be used to acquire certain qualifying loans and such other uses as permitted under the Credit Facilities. There may also be certain requirements relating to portfolio performance, including required minimum portfolio yield and limitations on delinquencies and charge-offs, a violation of which could limit further advances and, in some cases, result in an event of default. An event of default under our debt agreements or any future credit or other borrowing facility could result in an accelerated maturity date for all amounts outstanding thereunder, which could have a material adverse effect on our business and financial condition. This could reduce our revenues and, by delaying any cash payment allowed to us under the relevant credit facility or any other borrowing facility until the lenders have been paid in full, reduce our liquidity and cash flow and impair our ability to grow our business and/or make distributions to stockholders required to maintain our ability to be eligible for treatment as a RIC.
We may be the target of litigation.
We may be the target of securities litigation in the future, particularly if the value of shares of our common stock fluctuates significantly. We could also generally be subject to litigation, including derivative
53
actions by our stockholders. In addition our investment activities subject us to litigation relating to the bankruptcy process and the normal risks of becoming involved in litigation by third parties. This risk is somewhat greater where we exercise control or significant influence over a portfolio company's direction. Any litigation could result in substantial costs and divert management's attention and resources from our business and cause a material adverse effect on our business, financial condition and results of operations.
The majority of our portfolio investments are recorded at fair value as determined in good faith by the Board and, as a result, there may be uncertainty as to the value of our portfolio investments.
We expect that many of our portfolio investments will take the form of loans and securities that are not publicly traded. The fair value of loans, securities and other investments that are not publicly traded may not have market quotations available and the fair value may not be readily determinable. If market quotations are not available or reliable, we will value these investments at fair value as determined in good faith by the Board, including to reflect significant events affecting the value of our investments. Many, if not all, of our investments (other than cash) may be classified as Level 3 under ASC Topic 820, Fair Value Measurement ("ASC 820"). This means that our portfolio valuations will be based on unobservable inputs and our own assumptions about how market participants would price the asset or liability in question. We expect that inputs into the determination of fair value of our portfolio investments will require significant management judgment or estimation. Even if observable market data are available, such information may be the result of consensus pricing information or broker quotes, which include a disclaimer that the broker would not be held to such a price in an actual transaction. The non-binding nature of consensus pricing and/or quotes accompanied by disclaimers materially reduces the reliability of such information. We retain the services of one or more independent service providers to review the valuation of these loans and securities. However, the ultimate determination of fair value will be made by the Board and not by such third-party valuation firm. The types of factors that the Board may take into account in determining the fair value of our investments generally include, as appropriate, comparison to publicly traded securities including such factors as yield, maturity and measures of credit quality, the enterprise value of a portfolio company, the nature and realizable value of any collateral, the portfolio company's ability to make payments and its earnings and discounted cash flow, the markets in which the portfolio company does business, changes in the interest rate environment and the credit markets generally that may affect the price at which similar investments may be made in the future, comparisons to publicly traded companies, relevant credit market indices and other relevant factors. When an external event such as a purchase transaction, public offering or subsequent equity sale occurs, we consider the pricing indicated by the external event to corroborate our valuation.
Because such valuations, and particularly valuations of private securities and private companies, are inherently uncertain, may fluctuate over short periods of time and may be based on estimates, our determinations of fair value may differ materially from the values that would have been used if a ready market for these loans and securities existed. Also, since these valuations are, to a large extent, based on estimates, comparisons and qualitative evaluations of private information, our fair valuation process could make it more difficult for investors to accurately value our investments and could lead to undervaluation or overvaluation of our securities. In addition, the valuation of these types of securities may result in substantial write-downs and earnings volatility. Also, privately held companies frequently have less diverse product lines and smaller market presence than larger public competitors.
Our NAV could be adversely affected if our determinations regarding the fair value of our investments were materially higher than the values that we ultimately realize upon the disposal of such loans and securities. Further, our NAV as of a particular date may be materially greater than or less than the value that would be realized if our assets were to be liquidated as of such date. For example, if we were required to sell a certain asset or all or a substantial portion of our assets on a particular date, the actual price that we would realize upon the disposition of such asset or assets could be materially less than the
54
value of such asset or assets as reflected in our NAV. Volatile market conditions could also cause reduced liquidity in the market for certain assets, which could result in liquidation values that are materially less than the values of such assets as reflected in our NAV.
We will adjust on a quarterly basis the valuation of our portfolio to reflect the Board's determination of the fair value of each investment in our portfolio. Any changes in fair value are recorded in our consolidated statements of operations as net change in unrealized appreciation or depreciation on investments.
We may experience fluctuations in our quarterly operating results.
We could experience fluctuations in our quarterly operating results due to a number of factors, including the interest rate payable on the loans and debt securities we acquire, the default rate on such loans and securities, the level of our expenses, variations in and the timing of the recognition of realized and unrealized gains or losses, the degree to which we encounter competition in our markets and general economic conditions. In light of these factors, results for any period should not be relied upon as being indicative of performance in future periods.
New or modified laws or regulations governing our operations may adversely affect our business.
We and our portfolio companies are subject to regulation by laws at the U.S. federal, state and local levels. These laws and regulations, as well as their interpretation, may change from time to time, including as the result of interpretive guidance or other directives from the U.S. President and others in the executive branch, and new laws, regulations and interpretations may also come into effect. Any such new or changed laws or regulations could have a material adverse effect on our business.
In particular, Dodd—Frank impacts many aspects of the financial services industry, and it requires the development and adoption of many implementing regulations over the next several years. The effects of Dodd-Frank on the financial services industry will depend, in large part, upon the extent to which regulators exercise the authority granted to them and the approaches taken in implementing regulations. President Trump has indicated that he may seek to amend or repeal portions of Dodd-Frank, among other federal laws, which may create regulatory uncertainty in the near term, and in March 2018 the U.S. Senate passed a bill that eased financial regulations and reduced oversight for certain entities. While the impact of Dodd-Frank on us and our portfolio companies may not be known for an extended period of time, Dodd-Frank, including future rules implementing its provisions and the interpretation of those rules, along with other legislative and regulatory proposals directed at the financial services industry or affecting taxation that are proposed or pending in the U.S. Congress, may negatively impact our operations, cash flows or financial condition or our portfolio companies, impose additional costs on us or our portfolio companies, intensify the regulatory supervision of us or our portfolio companies or otherwise adversely affect our business or the business of our portfolio companies. In addition, if we do not comply with applicable laws and regulations, we could lose any licenses that we then hold for the conduct of our business and may be subject to civil fines and criminal penalties.
Additionally, changes to the laws and regulations governing our operations, including those associated with RICs, may cause us to alter our investment strategy in order to avail ourselves of new or different opportunities or result in the imposition of corporate-level taxes on us. Such changes could result in material differences to our strategies and plans and may shift our investment focus from the areas of expertise of our Advisor to other types of investments in which our Advisor may have little or no expertise or experience. Any such changes, if they occur, could have a material adverse effect on our results of operations and the value of your investment. If we invest in commodity interests in the future, our Advisor may determine not to use investment strategies that trigger additional regulation by the U.S. Commodity Futures Trading Commission ("CFTC") or may determine to operate subject to CFTC regulation, if applicable. If we or our Advisor were to operate subject to CFTC regulation, we may incur additional expenses and would be subject to additional regulation.
55
On February 3, 2017, President Trump signed Executive Order 13772 announcing the Administration's policy to regulate the U.S. financial system in a manner consistent with certain "Core Principles," including regulation that is efficient, effective and appropriately tailored. The Executive Order directed the Secretary of the Treasury, in consultation with the heads of the member agencies of the Financial Stability Oversight Council, to report to the President on the extent to which existing laws, regulations and other government policies promote the Core Principles and to identify any laws, regulations or other government policies that inhibit federal regulation of the U.S. financial system. On June 12, 2017, the U.S. Department of the Treasury published the first of several reports in response to the Executive Order on the depository system covering banks and other savings institutions. On October 6, 2017, the Treasury released a second report outlining ways to streamline and reform the U.S. regulatory system for capital markets, followed by a third report, on October 26, 2017, examining the current regulatory framework for the asset management and insurance industries. On July 31, 2018, the Treasury released the fourth and final report identifying improvements to the regulatory landscape that would better support nonbank financial institutions, embrace financial technology, and foster innovation.
On December 22, 2017, the Tax Cuts and Jobs Act was enacted into law. The Tax Cuts and Jobs Act makes significant changes to the U.S. income tax rules applicable to both individuals and entities, including corporations. The Tax Cuts and Jobs Act includes provisions that, among other things, reduce the U.S. corporate tax rate, introduce a capital investment deduction, limit the interest deduction, limit the use of net operating losses to offset future taxable income and make extensive changes to the U.S. international tax system. The Tax Cuts and Jobs Act is complex and far-reaching, and we cannot predict the impact its enactment will have on us, our subsidiaries, our portfolio companies and the holders of our securities.
On March 23, 2018, the SBCAA was signed into law. The SBCAA, among other things, modifies the applicable provisions of the 1940 Act to reduce the required asset coverage ratio applicable to BDCs from 200% to 150% subject to certain approval, time and disclosure requirements (including either stockholder approval or approval of a majority of the directors who are not interested persons of the BDC and who have no financial interest in the proposal). On November 28, 2018, the Board approved the reduction of the Company's asset coverage requirements in Section 61(a)(2) of the 1940 Act to 150% and recommended the stockholders to vote in favor of the proposal at the special stockholder meeting on February 1, 2019. On February 1, 2019, the Company's stockholders approved the application of the reduced asset coverage. Effective February 2, 2019, the Company is permitted to borrow amounts such that its asset coverage ratio, as defined in the 1940 Act, is at least 150% after such borrowing (if certain requirements are met), rather than 200%, as previously required.
On May 24, 2018, President Trump signed into law the Economic Growth, Regulatory Relief, and Consumer Protection Act, which increased from $50 billion to $250 billion the asset threshold for designation of "systemically important financial institutions" or "SIFIs" subject to enhanced prudential standards set by the Federal Reserve Board, staggering application of this change based on the size and risk of the covered bank holding company. On May 30, 2018, the Federal Reserve Board voted to consider changes to the Volcker Rule that would loosen compliance requirements for all banks.
Further, there has been increasing commentary among regulators and intergovernmental institutions, including the Financial Stability Board and International Monetary Fund, on the topic of "shadow banking" (a term generally taken to refer to credit intermediation involving entities and activities outside the regulated banking system). We are an entity outside the regulated banking system and certain of our activities may be argued to fall within this definition and, in consequence, may be subject to regulatory developments. As a result, we and our Advisor could be subject to increased levels of oversight and regulation. This could increase costs and limit operations. In an extreme eventuality, it is possible that
56
such regulations could render our continued operation unviable and lead to its premature termination or restructuring.
Changes to U.S. tariff and import/export regulations may have a negative effect on our portfolio companies and, in turn, harm us.
There has been ongoing discussion and commentary regarding potential significant changes to U.S. trade policies, treaties and tariffs. The current administration, along with the U.S. Congress, has created significant uncertainty about the future relationship between the United States and other countries with respect to trade policies, treaties and tariffs. These developments, or the perception that any of them could occur, may have a material adverse effect on global economic conditions and the stability of global financial markets, and may significantly reduce global trade and, in particular, trade between the impacted nations and the United States. Any of these factors could depress economic activity and restrict our portfolio companies' access to suppliers or customers and have a material adverse effect on their business, financial condition and results of operations, which in turn would negatively impact us.
The Board may change our investment objectives, operating policies and strategies without prior notice or stockholder approval.
The Board has the authority, except as otherwise provided in the 1940 Act, to modify or waive certain of our investment objectives, operating policies and strategies without prior notice and without stockholder approval. However, absent stockholder approval, we may not change the nature of our business so as to cease to be, or withdraw our election as, a BDC. Under Delaware law, we also cannot be dissolved without prior stockholder approval. We cannot predict the effect any changes to our current operating policies and strategies would have on our business, operating results and the market price of our common stock. Nevertheless, any such changes could adversely affect our business and impair our ability to make distributions to our stockholders.
Provisions of the Delaware General Corporation Law and of our certificate of incorporation and bylaws could deter takeover attempts and have an adverse effect on the price of shares of our common stock.
The Delaware General Corporation Law, as amended (the "DGCL"), contains provisions that may discourage, delay or make more difficult a change in control of us or the removal of our directors. Our Amended and Restated Certificate of Incorporation ("Certificate of Incorporation") and bylaws ("Bylaws") contain provisions that limit liability and provide for indemnification of our directors and officers. These provisions and others which we may adopt also may have the effect of deterring hostile takeovers or delaying changes in control or management. We are subject to Section 203 of the DGCL, the application of which is subject to any applicable requirements of the 1940 Act. This section generally prohibits us from engaging in mergers and other business combinations with stockholders that beneficially own 15% or more of our voting stock, either individually or together with their affiliates, unless our directors or stockholders approve the business combination in the prescribed manner. Accordingly, Section 203 of the DGCL may discourage third parties from trying to acquire control of us and increase the difficulty of consummating such an offer.
We have also adopted measures that may make it difficult for a third party to obtain control of us, including provisions of our Certificate of Incorporation that classify the Board in three classes serving staggered three-year terms, and provisions of our Certificate of Incorporation authorizing our Board to classify or reclassify shares of our preferred stock in one or more classes or series and to cause the issuance of additional shares of our stock. These provisions, as well as other provisions we have adopted or may adopt in our Certificate of Incorporation and Bylaws, may delay, defer or prevent a transaction or a change in control that might otherwise be in the best interests of our stockholders.
57
Our Certificate of Incorporation requires, to the fullest extent permitted by law, that derivative actions brought in our name, actions against our directors, officers, other employees or stockholders for breach of fiduciary duty and other similar actions may be brought in a federal or state court located in the state of Delaware.
Our Certificate of Incorporation provides that, to the fullest extent permitted by law, unless we consent in writing to the selection of an alternative forum, the sole and exclusive forum for (i) any derivative action or proceeding brought on our behalf, (ii) any action asserting a claim of breach of a fiduciary duty owed by any of our directors, officers or other employees to us or our stockholders, (iii) any action asserting a claim arising pursuant to any provision of the DGCL, our Certificate of Incorporation or Bylaws or the securities, antifraud, unfair trade practices or similar laws of any international, national, state, provincial, territorial, local or other governmental or regulatory authority, including, in each case, the applicable rules and regulations promulgated thereunder, or (iv) any action asserting a claim governed by the internal affairs doctrine shall be a federal or state court located in the state of Delaware. Any person or entity purchasing or otherwise acquiring any interest in shares of our capital stock shall be deemed, to the fullest extent permitted by law, to have notice of and consented to these exclusive forum provisions and to have irrevocably submitted to, and waived any objection to, the exclusive jurisdiction of such courts in connection with any such action or proceeding and consented to process being served in any such action or proceeding, without limitation, by United States mail addressed to the stockholder at the stockholder's address as it appears on our records, with postage thereon prepaid.
This choice of forum provision may limit a stockholder's ability to bring a claim in a judicial forum that it finds favorable for disputes with us or any of our directors, officers, other employees or stockholders, which may discourage lawsuits with respect to such claims. Alternatively, if a court were to find the choice of forum provision contained in our Certificate of Incorporation to be inapplicable or unenforceable in an action, we may incur additional costs associated with resolving such action in other jurisdictions, which could harm our business, operating results and financial condition.
Our Advisor and Administrator each have the ability to resign on 60 days' notice, and we may not be able to find a suitable replacement within that time, resulting in a disruption in our operations that could adversely affect our financial condition, business and results of operations.
Our Advisor has the right under the Investment Advisory Agreement to resign as our Advisor at any time upon not less than 60 days' written notice, whether we have found a replacement or not. Similarly, our Administrator has the right under the Administration Agreement to resign at any time upon not less than 60 days' written notice, whether we have found a replacement or not. If our Advisor or our Administrator were to resign, we may not be able to find a new investment adviser or administrator, as applicable, or hire internal management with similar expertise and ability to provide the same or equivalent services on acceptable terms within 60 days, or at all. If we are unable to do so quickly, our operations are likely to experience a disruption, our financial condition, business and results of operations as well as our ability to pay distributions to our stockholders are likely to be adversely affected and the market price of our shares may decline. In addition, the coordination of our internal management and investment or administrative activities, as applicable, is likely to suffer if we are unable to identify and reach an agreement with a single institution or group of executives having the expertise possessed by our Advisor, or our Administrator, as applicable. Even if we are able to retain a comparable service provider or individuals performing such services are retained, whether internal or external, their integration and lack of familiarity with our investment objectives may result in additional costs and time delays that may adversely affect our business, financial condition, results of operations and cash flows.
In addition, if our Advisor resigns or is terminated, we would lose the benefits of our relationship with Bain Capital Credit, including the use of Bain Capital Credit's communication and information systems, insights into our existing portfolio, market expertise, sector and macroeconomic views and due
58
diligence capabilities, as well as any investment opportunities referred to us by Bain Capital Credit, and we would be required to change our name, which may have a material adverse impact on our operations.
We are highly dependent on information systems, and systems failures or cyber-attacks could significantly disrupt our business, which may, in turn, negatively affect the value of shares of our common stock and our ability to pay distributions.
Our business is highly dependent on the communications and information systems of Bain Capital Credit. In addition, certain of these systems are provided to Bain Capital Credit by third-party service providers. Any failure or interruption of such systems, including as a result of the termination of an agreement with any such third-party service provider, could cause delays or other problems in our activities. This, in turn, could have a material adverse effect on our business, financial condition and results of operations. In addition, these systems are subject to potential attacks, including through adverse events that threaten the confidentiality, integrity or availability of our information resources. These attacks, which may include cyber incidents, may involve a third party gaining unauthorized access to our communications or information systems for purposes of misappropriating assets, stealing confidential information, corrupting or destroying data, degrading or sabotaging our systems or causing other operational disruption. Any such attack could result in disruption to our business, misstated or unreliable financial data, liability for stolen assets or information, increased cybersecurity protection and insurance costs, litigation and damage to our business relationships, any of which could have a material adverse effect on our business, financial condition and results of operations.
We are subject to certain risks as a result of our interests in the membership interests in the 2018-1 Issuer and 2019-1 Issuer.
Under the terms of the master loan sale agreement governing the CLO Transaction, we sold and/or contributed to the 2018-1 Issuer and 2019-1 Issuer all of our ownership interest in our portfolio loans and participations for the purchase price and other consideration set forth in such master loan sale agreement (including an increase in the value of the "Membership Interests". As a result of the transactions, we hold all of the Membership Interests, which comprise 100% of the equity interests, in the 2018-1 Issuer and 2019-1 Issuer. As a result, we expect to consolidate the financial statements of the 2018-1 Issuer and 2019-1 Issuer, as well as our other subsidiaries, in our consolidated financial statements. However, once contributed to a CLO, the underlying loans and participation interests have been securitized and are no longer our direct investment, and the risk return profile has been altered. In general, rather than holding interests in the underlying loans and participation interests, the CLO Transaction resulted in us holding membership interests in a CLO issuer (i.e., the 2018-1 Issuer and 2019-1 Issuer), with the CLO holding the underlying loans. As a result, we are subject both to the risks and benefits associated with the equity interests of the CLO (i.e., the Membership Interests) and the risks and benefits associated with the underlying loans and participation interests held by the 2018-1 Issuer and 2019-1 Issuer.
We have limited experience managing CLOs.
The performance of the CLO Issuers will be largely dependent on the analytical and managerial expertise of our investment professionals. Although we and our investment professionals and affiliates have prior experience investing in loans and other debt obligations, the CLO Issuers are the only CLOs managed by us. Accordingly, we have limited performance history of managing CLOs for potential investors to consider in evaluating the potential impact of the CLO Transactions on our overall performance.
59
We are subject to significant restrictions on our ability to advise the CLO Issuers.
We will manage the assets of the CLO Issuers pursuant to portfolio management agreements with the CLO Issuers (the "Portfolio Management Agreements"). The indentures governing the 2018-1 Notes and the 2019-1 Notes (the "CLO Indentures") and the Portfolio Management Agreements place significant restrictions on our ability to advise the CLO Issuers to buy and sell Collateral Obligations, and we are subject to compliance with the CLO Indentures and the Portfolio Management Agreements. As a result of the restrictions contained in the CLO Indentures and the Portfolio Management Agreements, the CLO Issuers may be unable to buy or sell collateral obligations or to take other actions that we might consider in the interest of the CLO Issuers and the holders of CLO Notes, and we may be required to make investment decisions on behalf of the CLO Issuers that are different from those made for our other clients. In addition, we may pursue any strategy consistent with the CLO Indentures and the Portfolio Management Agreements, and there can be no assurance that such strategy will not change from time to time in the future. Further, for so long as we manage the assets of the CLO Issuers pursuant to the Portfolio Management Agreements, we will elect to not charge any portfolio management fee to which we may be entitled under such Portfolio Management Agreements.
In our role as portfolio manager of the CLO Issuers, we will be acting solely in the best interests of the CLO Issuers and not in the best interests of the Membership Interests of the CLO Issuers that we hold. As the interests of the holders of the applicable CLO Notes are senior in the respective CLO Issuer's capital structure to our Membership Interests, we may incur losses if we are required to dispose of a portion of the portfolio of the respective CLO Issuer at inopportune times in order to satisfy the outstanding obligations of the holders of the related CLO Note.
The subordination of the Membership Interests will affect our right to payment.
The Membership Interests are subordinated to the CLO Notes and certain fees and expenses. If any Coverage Test (defined below) is not satisfied as of a determination date, cash flows (if any) and proceeds otherwise payable to the CLO Issuers (which the CLO Issuers could have otherwise distributed with respect to the Membership Interests) will be diverted to the payment of principal on the CLO Notes. If the CLO Issuers have not received confirmation from S&P Global Ratings of its initial ratings of each class of the applicable CLO Notes, or if we fail to hold the required amount of Membership Interests as required by EU risk retention regulations ("Retention Deficiency"), proceeds will be diverted to pay principal on the applicable CLO Notes or to purchase additional collateral obligations (or, in the case of a Retention Deficiency, to the extent necessary to reduce such Retention Deficiency to zero). If during the period from and including the closing date of a CLO Transaction to and including the earliest of (i) October 20, 2022 for the 2018-1 Notes and October 15, 2023 for the 2019-1 Debt and (ii) the date of the acceleration of the maturity of the related CLO Notes in accordance with the applicable CLO Indenture the applicable Overcollateralization Ratio Test (defined below) is not satisfied, proceeds will be diverted to purchase additional collateral obligations.
Although these tests generally compare the principal balance of the collateral obligations to the aggregate outstanding principal amount of the applicable CLO Notes, certain reductions are applied to the principal balance of Collateral Obligations in connection with certain events, such as defaults or ratings downgrades to "CCC" levels or below, in each case that may increase the likelihood that one or more Overcollateralization Ratio Tests may not be satisfied.
On the scheduled maturity of the CLO Notes or if acceleration of the CLO Notes occurs after an event of default, proceeds available after the payment of certain administrative expenses) will be applied to pay both principal of and interest on the applicable CLO Notes until the applicable CLO Notes are paid in
60
full before any further payment will be made on the Membership Interests. As a result, the Membership Interests would not receive any payments until the applicable CLO Notes are paid in full.
In addition, if an event of default occurs and is continuing, the holders of the CLO Notes will be entitled to determine the remedies to be exercised under the applicable CLO Indenture. Remedies pursued by the holders of the CLO Notes could be adverse to our interests as the holder of the Membership Interests, and the holders of the CLO Notes will have no obligation to consider any possible adverse effect on such other interests. See "—The holders of certain of the CLO Notes will control many rights under the CLO Indentures and therefore, we will have limited rights in connection with an event of default or distributions thereunder."
The holders of certain CLO Notes will control many rights under the CLO Indentures and therefore, we will have limited rights in connection with an event of default or distributions thereunder.
Under the CLO Indentures, many of our rights as the holder of the Membership Interests will be controlled by the holders of certain of the CLO Notes. Remedies pursued by such holders upon an event of default could be adverse to our interests. If the CLO Notes are accelerated following an event of default, proceeds of any realization on the assets will be allocated to the applicable CLO Notes (in order of seniority) and certain other amounts owing by the applicable CLO Issuer will be paid in full before any allocation to us as the holder of the Membership Interests. Although we as the holder of the Membership Interests will have the right, subject to the conditions set forth in the applicable CLO Indenture, to purchase the assets in a sale by the trustee, if an event of default (or otherwise, an acceleration of the CLO Notes following an event of default) has occurred and is continuing, we will not have any creditors' rights against the CLO Issuers and will not have the right to determine the remedies to be exercised under the CLO Indentures. There is no guarantee that any funds will remain to make distributions to us as the holder of the Membership Interests following any liquidation of the assets and the application of the proceeds from the assets to pay the CLO Notes and the fees, expenses, and other liabilities payable by the CLO Issuers. The ability of the holders of the CLO Notes to direct the sale and liquidation of the assets is subject to certain limitations. As set forth in the CLO Indentures, notwithstanding any acceleration, if an event of default occurs and is continuing and the trustee has not commenced remedies under the CLO Indentures, we as the portfolio manager of the CLO Issuers may continue to direct dispositions and purchases of collateral obligations to the extent permitted under the CLO indentures.
If an event of default has occurred and is continuing (unless the trustee has commenced remedies pursuant to the CLO Indentures), then (x) we as the portfolio managers of the CLO Issuers may continue to direct sales and other dispositions, and purchases, of collateral obligations in accordance with and to the extent permitted pursuant to the CLO Indentures and (y) the trustee will retain the assets securing the CLO Notes intact, collect and cause the collection of the proceeds thereof and make and apply all payments and deposits and maintain all accounts in respect of the assets and the CLO Notes in accordance with the CLO Indentures, unless: (i) the trustee, pursuant to the CLO Indentures and in consultation with us as the portfolio manager of the CLO Issuers, determines that the anticipated proceeds of a sale or liquidation of the assets (after deducting the anticipated reasonable expenses of such sale or liquidation) would be sufficient to discharge in full the amounts then due (or, in the case of interest, accrued) and unpaid on the applicable CLO Notes for principal and interest (including accrued and unpaid deferred interest), and all other amounts payable pursuant to the priority of distributions prior to payment of principal on such applicable CLO Notes (including amounts due and owing, and amounts anticipated to be due and owing, as administrative expenses (without regard to any applicable limitation on such expenses)), and we as the portfolio managers of the CLO Issuers and the holders of at least 662/3% (a "Supermajority") of the most senior outstanding class of the respective CLO Notes agrees with such determination; (ii) in the case of certain events of default, a Supermajority of the most senior outstanding class of the respective
61
CLO Notes directs the sale and liquidation of the assets; or (iii) a Supermajority of each class of the respective CLO Notes (voting separately by class) directs the sale and liquidation of the assets.
The CLO Indentures require mandatory redemption of the CLO Notes for failure to satisfy applicable Coverage Tests.
Under the documents governing the CLO Transactions, there are two coverage tests (the "Coverage Tests") applicable to the CLO Notes.
The first such test (the "Interest Coverage Test") compares the amount of interest proceeds received on the portfolio loans held by each CLO Issuer to the amount of interest due and payable on the related CLO Notes. To meet this first test, for each class of the applicable CLO Notes in each such CLO Transaction, interest received on the portfolio loans must be equal to or greater than a certain threshold percentage with respect to each such class.
The second such test (the "Overcollateralization Ratio Test") compares the adjusted collateral principal amount of the portfolio of Collateral Obligations of each CLO Transaction to the aggregate outstanding principal amount of the applicable CLO Notes. To meet this second test at any time, for each class of the applicable CLO Notes, the adjusted collateral principal amount of such Collateral Obligations must satisfy a certain threshold percentage amount of the outstanding principal amount of the applicable class of the related CLO Notes.
If a Coverage Test is not met on any determination date on which such Coverage Test is applicable, the CLO Issuers will apply available amounts to redeem the applicable CLO Notes in an amount necessary to cause such tests to be satisfied. This could result in an elimination, deferral or reduction in the payments of distributions to the related CLO Issuer (and as such, to us as the holder of the Membership Interests and indirect beneficiary of any such payments to such CLO Issuer).
We may resign or be removed or terminated as portfolio manager of the CLO Issuers.
We may resign or be removed or terminated as portfolio manager of the CLO Issuers in a number of circumstances, including the breach of certain terms of the CLO Indentures and the Portfolio Management Agreements. In addition, because a new portfolio manager may not be able to manage the CLO Issuers according to the standards of the CLO Indentures and the Portfolio Management Agreements, any transfer of the portfolio management functions to another entity could result in reduced or delayed collections, delays in processing loan transfers and information regarding the loans and a failure to meet all of the applicable procedures required by the Portfolio Management Agreements. Consequently, the termination or removal of us as portfolio manager of the CLO Issuers could have material and adverse effects on our performance.
Risks Relating to the 1940 Act
We and our Advisor are subject to regulations and SEC oversight. If we or they fail to comply with applicable requirements, it may adversely impact our results relative to companies that are not subject to such regulations.
As a BDC, we are subject to a portion of the 1940 Act. In addition, we have elected to be treated, and intend to operate in a manner so as to continuously qualify, as a RIC in accordance with the requirements of Subchapter M of the Code. The 1940 Act and the Code impose various restrictions on the management of a BDC, including related to portfolio construction, asset selection, and tax. These restrictions may reduce the chances that the BDC will achieve results similar to those of other vehicles managed by Bain Capital Credit and/or our Advisor.
62
However, if we do not maintain our status as a BDC, we would be subject to regulation as a registered closed-end investment company under the 1940 Act. As a registered closed-end investment company, we would be subject to substantially more regulatory restrictions under the 1940 Act which would significantly decrease our operating flexibility.
In addition to these and other requirements applicable to us, our Advisor is subject to regulatory oversight by the SEC. To the extent the SEC raises concerns or has negative findings concerning the manner in which we or our Advisor operate, it could adversely affect our business.
Our ability to enter into transactions with our affiliates is restricted.
We are prohibited under the 1940 Act from participating in certain transactions with our affiliates without the prior approval of our Independent Directors and, in some cases, the SEC. We consider our Advisor and its affiliates, including Bain Capital Credit, to be our affiliates for such purposes. In addition, any person that owns, directly or indirectly, 5% or more of our outstanding voting securities will be our affiliate for purposes of the 1940 Act, and we are generally prohibited from buying or selling any security from or to such affiliate without the prior approval of our Independent Directors. The 1940 Act also prohibits certain "joint" transactions with certain of our affiliates, which could include investments in the same portfolio company, without prior approval of our Independent Directors and, in some cases, of the SEC. We are prohibited from buying or selling any security from or to any person who owns more than 25% of our voting securities or certain of that person's affiliates, or entering into prohibited joint transactions with such persons, absent the prior approval of the SEC.
We may, however, invest alongside Bain Capital Credit Clients in certain circumstances where doing so is consistent with our investment strategy as well as applicable law and SEC staff interpretations or exemptive orders. For example, we may invest alongside Bain Capital Credit Clients consistent with guidance promulgated by the SEC staff to purchase interests in a single class of privately placed securities so long as certain conditions are met, including that Bain Capital Credit and our Advisor, acting on our behalf and on behalf of such Bain Capital Credit Clients, negotiates no term other than price. We may also invest alongside Bain Capital Credit Clients as otherwise permissible under regulatory guidance, applicable regulations or exemptive orders and Bain Capital Credit's allocation policy. If we are prohibited by applicable law from investing alongside Bain Capital Credit Clients with respect to an investment opportunity, we may not be able to participate in such investment opportunity. If our Advisor recommends a particular level of investment to us, and the aggregate amount recommended to us by our Advisor and to other participating Bain Capital Credit Clients exceeds the amount of the investment opportunity, subject to applicable law, investments made pursuant to exemptive relief will generally be allocated among the participants pro rata based on capital available for investment in the asset class being allocated and the respective governing documents of the Bain Capital Credit Clients. We expect that available capital for our investments will be determined based on the amount of cash on-hand, existing commitments and reserves, if any, the targeted leverage level, targeted asset mix and diversification requirements and other investment policies and restrictions set by the Board or as imposed by applicable laws, rules, regulations or interpretations. In instances when investments are not made pursuant to exemptive relief, allocations among us and other Bain Capital Credit Clients, subject to applicable law and regulation, will be done in accordance with our Advisor's trade allocation practice, which is generally pro rata based on order size. However, there can be no assurance that we will be able to participate in all investment opportunities that are suitable to us.
In situations where co-investment with other Bain Capital Credit Clients is not permitted or appropriate, subject to the limitations described in the preceding paragraph, Bain Capital Credit will need to decide which client will proceed with the investment. Similar restrictions limit our ability to transact
63
business with our officers or directors or their affiliates. These restrictions will limit the scope of investment opportunities that would otherwise be available to us.
We, our Advisor and Bain Capital Credit have been granted exemptive relief from the SEC to permit greater flexibility to negotiate the terms of co-investments if the Board determines that it would be advantageous for us to co-invest with other Bain Capital Credit Clients in a manner consistent with our investment objectives, positions, policies, strategies and restrictions as well as regulatory requirements and other pertinent other Bain Capital Credit Clients funds, accounts and investment vehicles managed by Bain Capital Credit may afford us additional investment opportunities and an ability to achieve greater diversification. Accordingly, our exemptive order permits us to invest with Bain Capital Credit Clients in the same portfolio companies under circumstances in which such investments would otherwise not be permitted by the 1940 Act. Our exemptive relief permitting co-investment transactions generally applies only if our Independent Directors and Directors who have no financial interest in such transaction review and approve in advance each co-investment transaction. The exemptive relief imposes other conditions with which we must comply to engage in co-investment transactions.
Our ability to sell or otherwise exit investments also invested in by other Bain Capital Credit investment vehicles is restricted.
We may be considered affiliates with respect to certain of our portfolio companies because our affiliates, which may include other Bain Capital Credit Funds, also hold interests in these portfolio companies and as such these interests may be considered a joint enterprise under the 1940 Act. To the extent that our interests in these portfolio companies may need to be restructured in the future or to the extent that we choose to exit certain of these transactions, our ability to do so will be limited.
If we do not invest a sufficient portion of our assets in qualifying assets, we could fail to qualify as a BDC or be precluded from investing according to our current business strategy.
As a BDC, we may not acquire any assets other than qualifying assets unless, at the time of and after giving effect to such acquisition, at least 70% of our total assets are qualifying assets (with certain limited exceptions). Subject to certain exceptions for follow-on investments and investments in distressed companies, an investment in an issuer that has outstanding securities listed on a national securities exchange may be treated as qualifying assets only if such issuer has a common equity market capitalization that is less than $250.0 million at the time of such investment.
We may be precluded from investing in what we believe are attractive investments if such investments are not qualifying assets for purposes of the 1940 Act. If we do not invest a sufficient portion of our assets in qualifying assets, we could violate the 1940 Act provisions applicable to BDCs. As a result of such violation, specific rules under the 1940 Act could prevent us, for example, from making follow-on investments in existing portfolio companies (which could result in the dilution of our position) or could require us to dispose of investments at inappropriate times in order to come into compliance with the 1940 Act. If we need to dispose of such investments quickly, it could be difficult to dispose of such investments on favorable terms. We may not be able to find a buyer for such investments and, even if we do find a buyer, we may have to sell the investments at a substantial loss. Any such outcomes could have a material adverse effect on our business, financial condition, results of operations and cash flows. See "Item 1. Business—Regulation as a Business Development Company—Qualifying Assets."
64
Regulations governing our operation as a BDC affect our ability to, and the way in which we, raise additional capital.
We may issue debt securities or preferred stock and/or borrow money from banks or other financial institutions, which we refer to collectively as "senior securities," up to the maximum amount permitted by the 1940 Act. Under the provisions of the 1940 Act, we will be permitted as a BDC to issue senior securities in amounts such that our asset coverage ratio, as defined in the 1940 Act, equals at least 200% (or 150% if certain disclosure and approval requirements are met) of our gross assets less all liabilities and indebtedness not represented by senior securities, after each issuance of senior securities. If the value of our assets declines, we may be unable to satisfy this test. If that happens, we may be required to sell a portion of our investments at a time when such sales may be disadvantageous to us in order to repay a portion of our indebtedness.
Furthermore, equity capital may be difficult to raise because, subject to some limited exceptions we are not generally able to issue and sell our common stock at a price per share below NAV. We may, however, sell our common stock, or warrants, options, or rights to acquire shares of our common stock, at a price below the current NAV of shares of our common stock if the Board determines that such sale is in our best interests and the best interests of our stockholders, and our stockholders, including a majority of those stockholders that are not affiliated with us, approve such sale. In any such case, the price at which our securities are to be issued and sold may not be less than a price that, in the determination of the Board, closely approximates the market value of such securities (less any distributing commission or discount). We do not currently have authorization from our stockholders to issue common stock at a price below its then current NAV per share.
Certain investors are limited in their ability to make significant investments in us.
Private funds that are excluded from the definition of "investment company" either pursuant to Section 3(c)(1) or 3(c)(7) of the 1940 Act are restricted from acquiring directly or through a controlled entity more than 3% of our total outstanding voting stock (measured at the time of the acquisition). Investment companies registered under the 1940 Act and BDCs, such as us, are also subject to this restriction as well as other limitations under the 1940 Act that would restrict the amount that they are able to invest in our securities. As a result, certain investors will be limited in their ability to make significant investments in us at a time that they might desire to do so.
Risks Relating to Our Investments
Economic recessions or downturns could impair our portfolio companies, and defaults by our portfolio companies will harm our operating results.
Many of the portfolio companies in which we have invested or expect to make investments are likely to be susceptible to economic slowdowns or recessions and may be unable to repay our loans during such periods. Therefore, the number of our non-performing assets is likely to increase and the value of our portfolio is likely to decrease during such periods. Adverse economic conditions may also decrease the value of collateral securing some of our loans and debt securities and the value of our equity investments. If the value of collateral underlying our loan declines during the term of our loan, a portfolio company may not be able to obtain the necessary funds to repay our loan at maturity through refinancing. Decreasing collateral value may hinder a portfolio company's ability to refinance our loan because the underlying collateral cannot satisfy the debt service coverage requirements necessary to obtain new financing. Thus, economic slowdowns or recessions could lead to financial losses in our portfolio and a decrease in revenues, net income and assets. Unfavorable economic conditions also could increase our funding costs, limit our access to the capital markets or result in a decision by lenders not to extend credit to us. We
65
consider a number of factors in making our investment decisions, including, but not limited to, the financial condition and prospects of a portfolio company and its ability to repay our loan. Unfavorable economic conditions could negatively affect the valuations of our portfolio companies and, as a result, make it more difficult for such portfolio companies to repay or refinance our loan. Therefore, these events could prevent us from increasing our investments and harm our operating results.
A portfolio company's failure to satisfy financial or operating covenants imposed by us or other lenders could lead to defaults and, potentially, acceleration of the time when the loans are due, termination of its loans and foreclosure on its assets, which could trigger cross-defaults under other agreements and jeopardize such portfolio company's ability to meet its obligations under the loans and debt securities that we hold. We may incur expenses to the extent necessary to seek recovery upon default or to negotiate new terms with a defaulting portfolio company, which may include the waiver of certain financial covenants. Furthermore, if one of our portfolio companies were to file for bankruptcy protection, depending on the facts and circumstances, including the extent to which we actually provide significant managerial assistance to that portfolio company, a bankruptcy court might re-characterize our debt holding and subordinate all or a portion of our claim to claims of other creditors, even though we may have structured our investment as senior secured debt.
Our portfolio companies may be unable to repay or refinance outstanding principal on their loans at or prior to maturity, and rising interests rates may make it more difficult for portfolio companies to make periodic payments on their loans.
Our portfolio companies may be unable to repay or refinance outstanding principal on their loans at or prior to maturity. This risk and the risk of default is increased to the extent that the loan documents do not require the portfolio companies to pay down the outstanding principal of such debt prior to maturity. In addition, if general interest rates rise, there is a risk that our portfolio companies will be unable to pay escalating interest amounts, which could result in a default under their loan documents with us. Any failure of one or more portfolio companies to repay or refinance its debt at or prior to maturity or the inability of one or more portfolio companies to make ongoing payments following an increase in contractual interest rates could have a material adverse effect on our business, financial condition, results of operations and cash flows.
Our debt investments may be risky, and we could lose all or part of our investments.
Debt portfolios are subject to credit and interest rate risk. "Credit risk" refers to the likelihood that an issuer will default in the payment of principal and/or interest on an instrument. Financial strength and solvency of an issuer are the primary factors influencing credit risk. In addition, subordination, lack or inadequacy of collateral or credit enhancement for a debt instrument may affect its credit risk. Credit risk may change over the life of an instrument, and securities which are rated by rating agencies are often reviewed and may be subject to downgrade. "Interest rate risk" refers to the risks associated with market changes in interest rates. Factors that may affect market interest rates include, without limitation, inflation, slow or stagnant economic growth or recession, unemployment, money supply and the monetary policies of the Federal Reserve Board and central banks throughout the world, international disorders and instability in domestic and foreign financial markets. The Federal Reserve Board raised the federal funds rate from 2015 to 2018, but cut the rate three times in August, September and October of 2019. These developments, along with domestic and international debt and credit concerns, could cause interest rates to be volatile, which may negatively impact our ability to access the debt markets on favorable terms. Interest rate changes may also affect the value of a debt instrument indirectly (especially in the case of fixed rate securities) and directly (especially in the case of instruments whose rates are adjustable). In general, rising interest rates will negatively impact the price of a fixed rate debt instrument and falling interest rates will have a positive effect on price. Adjustable rate instruments may also react to interest rate changes in a
66
similar manner although generally to a lesser degree (depending, however, on the characteristics of the reset terms, including, among other factors, the index chosen, frequency of reset and reset caps or floors). Interest rate sensitivity is generally more pronounced and less predictable in instruments with uncertain payment or prepayment schedules. We expect that we will periodically experience imbalances in the interest rate sensitivities of our assets and liabilities and the relationships of various interest rates to each other. In a changing interest rate environment, we may not be able to manage this risk effectively, which in turn could adversely affect our performance.
We may hold the debt securities of leveraged companies.
Portfolio companies may face intense competition, including competition from companies with greater financial resources, more extensive development, manufacturing, marketing and other capabilities, or a larger number of qualified managerial and technical personnel. As a result, portfolio companies which our Advisor expects to be stable may operate at a loss or have significant variations in operating results, may require substantial additional capital to support their operations or to maintain their competitive position or may otherwise have a weak financial condition or be experiencing financial distress.
Portfolio companies may issue certain types of debt, such as senior loans, mezzanine or high yield in connection with leveraged acquisitions or recapitalizations in which the portfolio company incurs a substantially higher amount of indebtedness than the level at which it had previously operated. Leverage may have important consequences to these portfolio companies and us as an investor. For example, the substantial indebtedness of a portfolio company could (i) limit its ability to borrow money for its working capital, capital expenditures, debt service requirements, strategic initiatives or other purposes, (ii) require it to dedicate a substantial portion of its cash flow from operations to the repayment of its indebtedness, thereby reducing funds available to it for other purposes, (iii) make it more highly leveraged than some of its competitors, which may place it at a competitive disadvantage, and (iv) subject it to restrictive financial and operating covenants, which may preclude it from favorable business activities or the financing of future operations or other capital needs. As a result, the ability of these leveraged companies to respond to changing business and economic conditions and to take advantage of business opportunities may be limited.
A leveraged portfolio company's income and net assets will tend to increase or decrease at a greater rate than if borrowed money were not used. In addition, a portfolio company with a leveraged capital structure will be subject to increased exposure to adverse economic factors, such as a significant rise in interest rates, a severe downturn in the economy or deterioration in the condition of that portfolio company or its industry. Leveraged companies in which we invest may have limited financial resources and may be unable to meet their obligations under their loans and debt securities that we hold. Such developments may be accompanied by a deterioration in the value of any collateral and a reduction in the likelihood of our realizing any guarantees that we may have obtained in connection with our investment. If a portfolio company is unable to generate sufficient cash flow to meet all of its obligations, it may take alternative measures (e.g., reduce or delay capital expenditures, sell assets, seek additional capital, or seek to restructure, extend or refinance indebtedness). These actions may negatively affect our investment in such a portfolio company. Accordingly, leveraged companies may enter into bankruptcy proceedings at higher rates than companies that are not leveraged.
We expect to invest in middle market companies, which involve higher risks than investments in larger companies.
We invest, and expect to invest in middle market companies, which companies often involve higher risks because they lack the management experience, financial resources, product diversification and competitive strength of larger corporations, all of which may contribute to illiquidity, and may, in turn, adversely affect the price and timing of liquidation of our investments.
67
Middle market companies are more likely to depend on the management talents and efforts of a small group of persons. Therefore, the death, disability, resignation or termination of one or more of these persons could have a material adverse impact on one or more of the portfolio companies we invest in and, in turn, on us. Middle market companies also may be parties to litigation and may be engaged in rapidly changing businesses with products subject to a substantial risk of obsolescence. In addition, our executive officers, directors and our Advisor may, in the ordinary course of business, be named as defendants in litigation arising from our investments in portfolio companies.
In addition, investment in middle market companies involves a number of other significant risks, including:
- •
- they typically have shorter operating histories, narrower product lines and smaller market shares than larger businesses, which
tend to render them more vulnerable to competitors' actions and market conditions, as well as general economic downturns;
- •
- they generally have less predictable operating results, may from time to time be parties to litigation, may be engaged in rapidly
changing businesses with products subject to a substantial risk of obsolescence, and may require substantial additional capital to support their operations, finance expansion or maintain their
competitive position;
- •
- changes in laws and regulations, as well as their interpretations, may adversely affect their business, financial structure or
prospects; and
- •
- they may have difficulty accessing the capital markets to meet future capital needs, which may limit their ability to grow or to repay their outstanding indebtedness upon maturity.
The lack of liquidity in our investments may adversely affect our business.
The lack of an established, liquid secondary market for a large portion of our investments may have an adverse effect on the market value of our investments and on our ability to dispose of them. Additionally, our investments may be subject to certain transfer restrictions that may also contribute to illiquidity. Further, our assets that are typically traded in a liquid market may become illiquid if the applicable trading market tightens. Therefore, no assurance can be given that we can dispose of a particular investment at its prevailing fair value.
A portion of our investments may consist of securities that are subject to restrictions on resale by us because they were acquired in a "private placement" or similar transaction or because we are deemed to be an affiliate of the issuer of such securities. We will be able to sell such securities only under applicable securities laws, which may permit only limited sales under specified conditions or subject us to additional potential liability.
Price declines and illiquidity in the corporate debt markets may adversely affect the fair value of our portfolio investments, reducing our NAV through increased net unrealized depreciation.
As a BDC, we are required to carry our investments at market value or, if no market value is ascertainable, at fair value as determined in good faith by the Board as described above in "—The majority of our portfolio investments are recorded at fair value as determined in good faith by the Board and, as a result, there may be uncertainty as to the value of our portfolio investments."
When an external event such as a purchase transaction, public offering or subsequent equity sale occurs, we use the pricing indicated by the external event to corroborate our valuation. While most of our
68
investments are not publicly traded, applicable accounting standards require us to assume as part of our valuation process that our investments are sold in a principal market to market participants (even if we plan on holding an investment through its maturity). As a result, volatility in the capital markets can also adversely affect our investment valuations. We record decreases in the market values or fair values of our investments as unrealized depreciation. Declines in prices and liquidity in the corporate debt markets may result in significant net unrealized depreciation in our portfolio. The effect of all of these factors on our portfolio may reduce our NAV by increasing net unrealized depreciation in our portfolio. Depending on market conditions, we could incur substantial realized losses and may suffer additional unrealized losses in future periods, which could have a material adverse effect on our business, financial condition, results of operations and cash flows.
Our investments in secured loans may nonetheless expose us to losses from default and foreclosure.
While we may invest in secured loans, we may nonetheless be exposed to losses resulting from default and foreclosure. Therefore, the value of the underlying collateral, the creditworthiness of the borrower and the priority of the lien are each of great importance. In some circumstances, our lien could be subordinated to claims of other creditors, such as trade creditors. In addition, deterioration in a portfolio company's financial condition and prospects, including its inability to raise additional capital, may be accompanied by deterioration in the value of the collateral for the debt investment. We cannot guarantee the adequacy of the protection of our interests, including the validity or enforceability of the loan and the maintenance of the anticipated priority and perfection of the applicable security interests. There is a risk that the collateral securing our debt investment may decrease in value over time, may be difficult to sell in a timely manner, may be difficult to appraise and may fluctuate in value based upon the success of the business and market conditions, including as a result of the inability of the portfolio company to raise additional capital. Furthermore, we cannot assure that claims may not be asserted that might interfere with enforcement of our rights. In addition, in the event of any default under a secured loan held directly by us, we will bear a risk of loss of principal to the extent of any deficiency between the value of the collateral and the principal and accrued interest of the secured loan, which could have a material adverse effect on our cash flow from operations.
In the event of a foreclosure, we may assume direct ownership of the underlying asset. The liquidation proceeds upon sale of such asset may not satisfy the entire outstanding balance of principal and interest on the loan, resulting in a loss to us. Any costs or delays involved in the effectuation of a foreclosure of the loan or a liquidation of the underlying property will further reduce the proceeds and thus increase the loss.
These risks are magnified for stretch senior loans. Stretch senior loans are senior loans that have a greater loan-to-value ratio than traditional senior loans and typically carry a higher interest rate to compensate for the additional risk. Because stretch senior loans have a greater loan-to-value ratio, there is potentially less over-collateralization available to cover the entire principal of the stretch senior loan.
Our investments in mezzanine debt and other junior securities are subordinate to senior indebtedness of the applicable company and are subject to greater risk.
The mezzanine debt and other junior securities in which we may invest are typically contractually or structurally subordinate to senior indebtedness of the applicable company, or effectively subordinated as a result of being unsecured debt and therefore subject to the prior repayment of secured indebtedness to the extent of the value of the assets pledged as security. In some cases, the subordinated debt held by us may be subject to the prior repayment of different classes of senior debt that may be in priority ahead of the debt held by us. In the event of financial difficulty on the part of a portfolio company, such class or classes of senior indebtedness ranking prior to the debt held by us, and interest thereon and related
69
expenses, must first be repaid in full before any recovery may be had on our mezzanine or other subordinated investments. Subordinated investments are characterized by greater credit risks than those associated with the senior or senior secured obligations of the same issuer. In addition, under certain circumstances the holders of the senior indebtedness will have the right to block the payment of interest and principal on our mezzanine debt and other junior securities and to prevent us from pursuing its remedies on account of such non-payment against the issuer. Further, in the event of any debt restructuring or workout of the indebtedness of any issuer, the holders of the senior indebtedness will likely control the creditor side of such negotiations.
Many issuers of mezzanine debt and other junior securities are highly leveraged, and their relatively high debt-to-equity ratios create increased risks that their operations might not generate sufficient cash flow to service their debt obligations. In addition, many issuers of mezzanine debt and other junior securities may be in poor financial condition, experiencing poor operating results, having substantial capital needs or negative net worth or be facing special competitive or product obsolescence problems, and may include companies involved in bankruptcy or other reorganizations or liquidation proceedings. Adverse changes in the financial condition of an issuer, general economic conditions, or both, may impair the ability of such issuer to make payments on the subordinated securities and result in defaults on such securities more quickly than in the case of the senior obligations of such issuer. Mezzanine debt and other junior securities may not be publicly traded, and therefore it may be difficult to obtain information as to the true condition of the issuer. Finally, the market values of certain of mezzanine debt and other junior securities may reflect individual corporate developments.
Investments in mezzanine debt and other junior securities may also be in the form of zero-coupon or deferred interest bonds, which are bonds which are issued at a significant discount from face value. The original discount approximates the total amount of interest the bonds will accrue and compound over the period until maturity or the first interest accrual date at a rate of interest reflecting the market rate of the security at the time of issuance. While zero-coupon bonds do not require the periodic payment of interest, deferred interest bonds generally provide for a period of delay before the regular payment of interest begins. These investments typically experience greater volatility in market value due to changes in the interest rates than bonds that provide for regular payments of interest. We may make subordinated investments that rank below other obligations of the obligor in right of payment. Subordinated investments are subject to greater risk of default than senior obligations as a result of adverse changes in the financial condition of the obligor or in general economic conditions. If we make a subordinated investment in a portfolio company, the portfolio company may be highly leveraged, and its relatively high debt-to-equity ratio may create increased risks that its operations might not generate sufficient cash flow to service all of its debt obligations.
Our prospective portfolio companies may prepay loans, which may reduce our yields if capital returned cannot be invested in transactions with equal or greater expected yields.
The terms of loans acquired or originated by us may be subject to early prepayment options or similar provisions which, in each case, could result in us realizing repayments of such loans earlier than expected, sometimes with no or a nominal prepayment premium. This may happen when there is a decline in interest rates, when the portfolio company's improved credit or operating or financial performance allows the refinancing of certain classes of debt with lower cost debt or when the general credit market conditions improve. Prepayments could also negatively impact our ability to pay, or the amount of, distributions on our common stock, which could result in a decline in the market price of our shares. Further, in the case of some of these loans, having the loan paid early may have the effect of reducing our actual investment income below our expected investment income if the capital returned cannot be invested in transactions with equal or greater yields. Our inability to reinvest such proceeds may materially affect our overall performance.
70
We are generally unable to predict the rate and frequency of such prepayments. Whether a loan is prepaid will depend both on the continued positive performance of the portfolio company and the existence of favorable financing market conditions that allow such portfolio company the ability to replace existing financing with less expensive capital. In periods of rising interest rates, the risk of prepayment of floating rate loans may increase if other financing sources are available. As market conditions change frequently, we will often be unable to predict when, and if, this may be possible for each of our portfolio companies.
Our loans may have limited amortization requirements.
We may invest in debt that has limited mandatory amortization and interim repayment requirements. A low level of amortization of any debt, over the life of the investment, may increase the risk that a portfolio company will not be able to repay or refinance the debt held by us when it comes due at its final stated maturity.
We may invest in high yield debt, or junk bonds, which has greater credit and liquidity risk than more highly rated debt obligations.
We may invest in high yield debt, a substantial portion of which may be rated below investment-grade by one or more nationally recognized statistical rating organizations or is unrated but of comparable credit quality to obligations rated below investment-grade, and has greater credit and liquidity risk than more highly rated debt obligations. High yield debt is generally unsecured and may be subordinate to other obligations of the obligor. The lower rating of high yield debt reflects a greater possibility that adverse changes in the financial condition of the obligor or in general economic conditions (including, for example, a substantial period of rising interest rates or declining earnings) or both may impair the ability of the obligor to make payment of principal and interest. Many issuers of high yield debt are highly leveraged, and their relatively high debt-to-equity ratios create increased risks that their operations might not generate sufficient cash flow to service their debt obligations. In addition, many issuers of high yield debt may be in poor financial condition, experiencing poor operating results, having substantial capital needs or negative net worth or be facing special competitive or product obsolescence problems, and may include companies involved in bankruptcy or other reorganizations or liquidation proceedings. High yield debt generally experiences greater default rates than is the case for investment-grade securities. Certain of these securities may not be publicly traded, and therefore it may be difficult to obtain information as to the true condition of the issuer. Overall declines in the below investment-grade bond and other markets may adversely affect such issuers by inhibiting their ability to refinance their debt at maturity. High yield debt is often less liquid than higher rated securities, and the market for high yield debt has recently experienced periods of volatility. The market values of certain of this high yield debt may reflect individual corporate developments.
For a description of zero-coupon or deferred interest bonds, see "—Our investments in mezzanine debt and other junior securities are subordinate to senior indebtedness of the applicable company and are subject to greater risk."
We may invest in equity securities, which generally have greater price volatility than fixed income securities.
We may in certain limited circumstances invest in equity securities, including equity securities issued by entities with unrated or below investment-grade debt. As with other investments that we may make, the value of equity securities held by us may be adversely affected by actual or perceived negative events relating to the issuer of such securities, the industry or geographic areas in which such issuer operates or the financial markets generally. However, equity securities may be even more susceptible to such events given their subordinate position in the issuer's capital structure. As such, equity securities
71
generally have greater price volatility than fixed income securities, and the market price of equity securities owned by us is more susceptible to moving up or down in a rapid or unpredictable manner. The equity securities we acquire may fail to appreciate and may decline in value or become worthless, and our ability to recover our investment will depend on our portfolio company's success. Accordingly, we may not be able to realize gains from our equity interests, and any gains that we do realize on the disposition of any equity interests may not be sufficient to offset any other losses we experience.
Even if the portfolio company is successful, our ability to realize the value of our investment may be dependent on the occurrence of a liquidity event, such as a public offering or the sale of the portfolio company. It is likely to take a significant amount of time before a liquidity event occurs or we can otherwise sell our investment. In addition, the equity securities we receive or invest in may be subject to restrictions on resale during periods in which it could be advantageous to sell them.
There are special risks associated with investing in preferred securities, including:
- •
- preferred securities may include provisions that permit the issuer, at its discretion, to defer distributions for a stated period
without any adverse consequences to the issuer. If we own a preferred security that is deferring its distributions, we may be required to report income for tax purposes before we receive such
distributions;
- •
- preferred securities are subordinated to debt in terms of priority to income and liquidation payments, and therefore will be
subject to greater credit risk than debt;
- •
- preferred securities may be substantially less liquid than many other securities, such as common stock or U.S. government
securities; and
- •
- generally, preferred security holders have no voting rights with respect to the issuing company, subject to limited exceptions.
The prices of the financial instruments in which we invest may be highly volatile.
Price movements of instruments in which our assets may be invested are influenced by, among other things, interest rates, changing supply and demand relationships, trade, fiscal, monetary and exchange control programs and policies of governments and national and international political and economic events and policies. In addition, governments, from time to time, intervene, directly and by regulation, in certain markets, particularly those in currencies and financial instrument options. Such intervention is intended to influence prices directly and may, together with other factors, cause all of such markets to move rapidly in the same direction because of, among other things, interest rate fluctuations.
Our investment in entire portfolios may not be as successful as acquiring the assets individually.
We may invest in entire portfolios of assets sold by hedge funds, other BDCs, regional commercial banks, specialty finance companies and other types of financial firms. The performance of individual assets in such a portfolio will vary, and the return on our investment in an entire portfolio may not exceed the returns we would have received had we purchased some, but not all, of the assets contained in such portfolio.
72
Investments in financially troubled companies involve significantly greater risk than investments in non-troubled companies.
We may invest in the obligations of companies that are financially troubled and that are either engaged in a reorganization or expect to file for bankruptcy. Although the terms of such financing may result in significantly greater returns to us, investments in financially troubled companies also involve significantly greater risk than investments in non-troubled companies, and the repayment of obligations of financially troubled companies is subject to significant uncertainties. The level of analytical sophistication, both financial and legal, necessary for successful financing to companies experiencing significant business and financial difficulties is unusually high. There is no assurance that we will correctly evaluate the value of the assets collateralizing our loans or the prospects for a successful reorganization or similar action. We may make investments that become distressed due to factors outside the control of our Advisor. There is also no assurance that there will be sufficient collateral to cover the value of the loans and/or other investments purchased by us or that there will be a successful reorganization or similar action of the company or investment which becomes distressed. In any reorganization or liquidation proceeding relating to a company in which we invest, we may lose all or part of our investment, may be required to accept collateral, cash or securities with a value less than our original investment and/or may be required to accept payment over an extended period of time. Additionally, we may invest in the securities of financially troubled companies that are non-U.S. issuers. Such non-U.S. issuers may be subject to bankruptcy and reorganization processes and proceedings that are not comparable to those in the United States and that may be less favorable to the rights of lenders.
Investments in "event-driven" special situations may not fully insulate us from risks inherent in our planned activities.
Our strategies, from time to time, involve investments in "event-driven" special situations such as recapitalizations, spinoffs, corporate and financial restructurings, litigation or other catalyst-orientated situations. Investments in such securities are often difficult to analyze, and we could be incorrect in our assessment of the downside risk associated with an investment, thus resulting in a significant loss. Although we intend to utilize appropriate risk management strategies, such strategies cannot fully insulate us from the risks inherent in our planned activities. Moreover, in certain situations, we may be unable to, or may choose not to, implement risk management strategies because of the costs involved or other relevant circumstances.
We may be subject to lender liability and equitable subordination.
In recent years, a number of judicial decisions in the United States have upheld the right of borrowers to sue lending institutions on the basis of various evolving legal theories (collectively termed "lender liability"). Generally, lender liability is founded upon the premise that an institutional lender has violated a duty (whether implied or contractual) of good faith and fair dealing owed to the borrower or has assumed a degree of control over the borrower resulting in creation of a fiduciary duty owed to the borrower or its other creditors or stockholders. Because of the nature of certain of our investments, we could be subject to allegations of lender liability.
In addition, under common law principles that in some cases form the basis for lender liability claims, if a lending institution (i) intentionally takes an action that results in the undercapitalization of a borrower to the detriment of other creditors of such borrower, (ii) engages in other inequitable conduct to the detriment of such other creditors, (iii) engages in fraud with respect to, or makes misrepresentations to, such other creditors or (iv) uses its influence as a stockholder to dominate or control a borrower to the detriment of the other creditors of such borrower, a court may elect to subordinate the claim of the offending lending institution to the claims of the disadvantaged creditor or creditors, a remedy called
73
"equitable subordination." Because of the nature of certain of our investments, we could be subject to claims from creditors of an obligor that our investments issued by such obligor should be equitably subordinated. A significant number of our investments will involve investments in which we will not be the lead creditor. It is, accordingly, possible that lender liability or equitable subordination claims affecting our investments could arise without our direct involvement.
If we purchase debt securities of an affiliate of a portfolio company in the secondary market at a discount, (i) a court might require us to disgorge profit it realizes if the opportunity to purchase such securities at a discount should have been made available to the issuer of such securities or (ii) we might be prevented from enforcing such securities at their full face value if the issuer of such securities becomes bankrupt.
Participation on creditors' committees may expose our Advisor to liability.
Our Advisor may participate on committees formed by creditors to negotiate the management of financially troubled companies that may or may not be in bankruptcy or our Advisor may seek to negotiate directly with the debtors with respect to restructuring issues. If our Advisor does join a creditors' committee, the participants of the committee would be interested in obtaining an outcome that is in their respective individual best interests and there can be no assurance of obtaining results most favorable to us in such proceedings. By participating on such committees, our Advisor may be deemed to have duties to other creditors represented by the committees, which might expose our Advisor to liability to such other creditors who disagree with our Advisor's actions.
While our Advisor intends to comply with all applicable securities laws and to make judgments concerning restrictions on trading in good faith, our Advisor may trade in a portfolio company's securities while engaged in the portfolio company's restructuring activities. Such trading creates a risk of litigation and liability that may cause our Advisor and/or us to incur significant legal fees and potential losses.
We cannot assure the accuracy of projections and forecasts used by our Advisor.
Our Advisor may rely upon projections, forecasts or estimates developed by us or a portfolio company in which we are invested concerning the portfolio company's future performance and cash flow. Projections, forecasts and estimates are forward-looking statements and are based upon certain assumptions. Actual events are difficult to predict and beyond our control. Actual events may differ from those assumed. Some important factors that could cause actual results to differ materially from those in any forward-looking statements include changes in interest rates, domestic and foreign business, market, financial or legal conditions, differences in the actual allocation of our investments among asset groups from that described herein, the degree to which our investments are hedged and the effectiveness of such hedges, among others. Accordingly, there can be no assurance that estimated returns or projections can be realized or that actual returns or results will not be materially lower than those estimated therein.
We are a non-diversified investment company within the meaning of the 1940 Act, and therefore we are not limited by the 1940 Act with respect to the proportion of our assets that may be invested in securities of a single issuer or industry.
We are classified as a non-diversified investment company within the meaning of the 1940 Act, which means that we are not limited by the 1940 Act with respect to the proportion of our assets that we may invest in securities of a single issuer. Beyond the Diversification Tests (as defined above in "Item 1. Business – Certain U.S. Federal Income Tax Consequences—Election to be Taxed as a RIC") associated with our qualification as a RIC under the Code, we do not have fixed guidelines for diversification. As such, our assets may not be diversified. Any such non-diversification would increase the risk of loss to us if there was
74
a decline in the market value of any loan in which we had invested a large percentage of its assets. If a large portion of our assets is held in cash or similarly liquid form, our performance might be adversely affected. Investment in a non-diversified fund will generally entail greater risks than investment in a "diversified" fund. We may have a more concentrated or less broad and varied portfolio than a "diversified" fund. A more concentrated portfolio can cause a portfolio such as ours to have higher volatility. We may also be more susceptible to any single economic or regulatory occurrence than a diversified investment company. Our portfolio may be concentrated in a limited number of portfolio companies and industries, which will subject us to a risk of significant loss if any of these companies defaults on its obligations under any of its debt instruments or if there is a downturn in a particular industry.
Our failure to make follow-on investments in our portfolio companies could impair the value of our portfolio.
Following our initial investment in a portfolio company, we may decide to provide additional funds to such portfolio company, seeking to:
- •
- increase or maintain in whole or in part our position as a creditor or equity ownership percentage in a portfolio company;
- •
- exercise warrants, options or convertible securities that were acquired in the original or subsequent financing; or
- •
- preserve or enhance the value of our investment.
There is no assurance that we will make follow-on investments or that we will have sufficient funds to make all or any of such investments. Even if we have sufficient capital to make a desired follow-on investment, we may elect not to make a follow-on investment because we may not want to increase our level of risk, because we prefer other opportunities or because we are inhibited by compliance with BDC requirements of the 1940 Act or the desire to maintain our qualification as a RIC. Our ability to make follow-on investments may also be limited by Bain Capital Credit and our Advisor's allocation policy or our ability to comply with our exemptive relief. Any decision by us not to make follow-on investments or its inability to make such investments may have a substantial adverse effect on a portfolio company in need of such an investment. Additionally, a failure to make such investments may result in a lost opportunity for us to increase its participation in a successful portfolio company or the dilution of our ownership in a portfolio company if a third party invests in the portfolio company.
Our portfolio companies may incur debt that ranks equally with, or senior to, our investments in such companies, and such portfolio companies may not generate sufficient cash flow to service their debt obligations to us.
The characterization of certain of our investments as senior debt or senior secured debt does not mean that such debt will necessarily be repaid in priority to all other obligations of the businesses in which we invest. Furthermore, debt and other liabilities incurred by non-guarantor subsidiaries of the borrowers of senior secured loans made by us may be structurally senior to the debt held by us. In the event of insolvency, liquidation, dissolution, reorganization or bankruptcy of a portfolio company, the debt and other liabilities of such subsidiaries could be repaid in full before any distribution can be made to an obligor of the senior secured loans held by us. Further, portfolio companies will typically incur trade credit and other liabilities or indebtedness, which by their terms may provide that their holders are entitled to receive principal payments on or before the dates payments are due in respect of the senior secured loans held by us.
Where we hold a first lien to secure senior indebtedness, the portfolio companies may be permitted to issue other senior loans with liens that rank junior to the first liens granted to us. The
75
intercreditor rights of the holders of such other junior lien debt may, in any liquidation, reorganization, insolvency, dissolution or bankruptcy of such a portfolio company, affect the recovery that we would have been able to achieve in the absence of such other debt.
Additionally, certain loans that we may make to portfolio companies may be secured on a second priority basis by the same collateral securing senior secured debt of such companies. The first priority liens on the collateral will secure the portfolio company's obligations under any outstanding senior debt and may secure certain other future debt that may be permitted to be incurred by the portfolio company under the agreements governing the loans. The holders of obligations secured by first priority liens on the collateral will generally control the liquidation of, and be entitled to receive proceeds from, any realization of the collateral to repay their obligations in full before us. In addition, the value of the collateral in the event of liquidation will depend on market and economic conditions, the availability of buyers and other factors. There can be no assurance that the proceeds, if any, from sales of all of the collateral would be sufficient to satisfy the loan obligations secured by the second priority liens after payment in full of all obligations secured by the first priority liens on the collateral. If such proceeds were not sufficient to repay amounts outstanding under the loan obligations secured by the second priority liens, then we, to the extent not repaid from the proceeds of the sale of the collateral, will only have an unsecured claim against the portfolio company's remaining assets, if any.
Even where the senior loans held by us are secured by a perfected lien over a substantial portion of the assets of a portfolio company and its subsidiaries, the portfolio company and its subsidiaries will often be able to incur a substantial amount of additional indebtedness, which may have an exclusive lien over particular assets. For example, debt and other liabilities incurred by non-guarantor subsidiaries of portfolio companies will be structurally senior to the debt held by us. Accordingly, any such debt and other liabilities of such subsidiaries would, in the event of liquidation, dissolution, insolvency, reorganization or bankruptcy of such subsidiary, be repaid in full before any distributions to an obligor of the loans held by us. Furthermore, these other assets over which other lenders have a lien may be substantially more liquid or valuable than the assets over which we have a lien.
The rights we may have with respect to the collateral securing the loans we make to our portfolio companies with senior debt outstanding may also be limited pursuant to the terms of one or more intercreditor agreements that we enter into with the holders of such senior debt. Under a typical intercreditor agreement, at any time that obligations that have the benefit of the first priority liens are outstanding, any of the following actions that may be taken in respect of the collateral will be at the direction of the holders of the obligations secured by the first priority liens:
- •
- the ability to cause the commencement of enforcement proceedings against the collateral;
- •
- the ability to control the conduct of such proceedings;
- •
- the approval of amendments to collateral documents;
- •
- releases of liens on the collateral; and
- •
- waivers of past defaults under collateral documents.
We may not have the ability to control or direct such actions, even if our rights are adversely affected.
76
The disposition of our investments may result in contingent liabilities.
We may, from time to time, incur contingent liabilities in connection with an investment. For example, we may acquire a revolving credit or delayed draw term facility that has not yet been fully drawn or may originate or make a secondary purchase of a revolving credit facility. If the borrower subsequently draws down on the facility, we will be obligated to fund the amounts due. In connection with the disposition of an investment in loans and private securities, we may be required to make representations about the business and financial affairs of the portfolio company typical of those made in connection with the sale of a business. We may also be required to indemnify the purchasers of such investment to the extent that any such representations turn out to be inaccurate or with respect to potential liabilities. We may incur numerous other types of contingent liabilities. There can be no assurance that we will adequately reserve for its contingent liabilities and that such liabilities will not have an adverse effect on us.
We may be subject to risks under hedging transactions and may become subject to risk if we invest in non-U.S. securities.
Our investment strategy contemplates potential investments in securities of non-U.S. companies to the extent permissible under the 1940 Act. Investing in loans and securities of non-U.S. issuers involves additional risks not typically associated with investing in U.S. companies. These risks include changes in exchange control regulations, political and social instability, nationalization and expropriation, imposition of tariffs and foreign taxes (potentially at confiscatory levels), less liquid markets, less available information than is generally the case in the United States, higher transaction costs, less government supervision of exchanges, brokers and issuers, less developed bankruptcy laws, difficulty in enforcing contractual obligations, lack of uniform accounting and auditing standards and greater price volatility. There may be less information publicly available about a non-U.S. issuer than about a U.S. issuer, and non-U.S. issuers may not be subject to accounting, auditing and financial reporting standards and practices comparable to those in the United States. These risks are likely to be more pronounced for investments in companies located in emerging markets and particularly for middle-market companies in these economies. Further, our investments that are denominated in a non-U.S. currency will be subject to the risk that the value of a particular currency will change in relation to the U.S. dollar. The rates of exchange between the U.S. dollar and other currencies are affected by many factors, including forces of supply and demand in the foreign exchange markets. These rates are also affected by the international balance of payments and other economic and financial conditions, government intervention, speculation and other factors. We are not obligated to engage in any currency hedging operations, and there can be no assurance as to the success of any hedging operations that we may implement. We may employ hedging techniques to minimize these risks, but we cannot assure you that such strategies will be effective or without risk to us. The values and relative yields of investments in the securities markets of different countries, and their associated risks, are expected to change independently of each other.
We are authorized to use various investment strategies to hedge interest rate or currency exchange risks. These strategies are generally accepted as portfolio management techniques and are regularly used by many investment funds and other institutional investors. Techniques and instruments may change over time as new instruments and strategies are developed or regulatory changes occur. We may use any or all such types of interest rate hedging transactions and currency hedging transactions at any time and no particular strategy will dictate the use of one transaction rather than another. The choice of any particular interest rate hedging transactions and currency hedging transactions will be a function of numerous variables, including market conditions. Our investments or liabilities may be denominated in currencies other than the U.S. dollar, and hence the value of such investments, or the amount of such liabilities, will depend in part on the relative strength of the U.S. dollar. We may be affected favorably or unfavorably by exchange control regulations or changes in the exchange rate between foreign currencies and the U.S. dollar.
77
Changes in foreign currency exchange rates may also affect the value of distributions and interest earned as well as the level of gains and losses realized on the sale of securities. Although we intend to engage in any interest rate hedging transactions and currency hedging transactions only for hedging purposes and not for speculation, use of interest rate hedging transactions and currency hedging transactions involves certain inherent risks. These risks include (i) the possibility that the market will move in a manner or direction that would have resulted in gain for us had an interest rate hedging transaction or currency hedging transaction not been utilized, in which case it would have been better had we not engaged in the interest rate hedging transaction or currency hedging transaction, (ii) the risk of imperfect correlation between the risk sought to be hedged and the interest rate hedging transaction or currency hedging transaction utilized, (iii) potential illiquidity for the hedging instrument utilized, which may make it difficult for us to close-out or unwind an interest rate hedging transaction or currency hedging transaction and (iv) credit risk with respect to the counterparty to the interest rate hedging transaction or currency hedging transaction. In addition, it might not be possible for us to hedge fully or perfectly against currency fluctuations affecting the value of securities denominated in non-U.S. currencies because the value of those loans and securities would likely fluctuate as a result of factors not related to currency fluctuations.
Our investments in OID and PIK interest income may expose us to risks associated with such income being required to be included in accounting income and taxable income prior to receipt of cash.
Our investments may include OID and PIK instruments. To the extent OID and PIK interest income constitute a portion of our income, we will be exposed to risks associated with such income being required to be included in accounting income and taxable income prior to receipt of cash, including the following:
- •
- OID instruments and PIK securities may have unreliable valuations because the accretion of OID as interest income and the
continuing accruals of PIK securities require judgments about their collectability and the collectability of deferred payments and the value of any associated collateral;
- •
- OID income may also create uncertainty about the source of our cash dividends;
- •
- OID instruments may create heightened credit risks because the inducement to the borrower to accept higher interest rates in
exchange for the deferral of cash payments typically represents, to some extent, speculation on the part of the borrower;
- •
- for accounting purposes, cash distributions to stockholders that include a component of accreted OID income do not come from
paid-in capital, although they may be paid from the offering proceeds. Thus, although a distribution of accreted OID income may come from the cash invested by the stockholders, the 1940 Act does not
require that stockholders be given notice of this fact;
- •
- generally, we need to recognize income for income tax purposes no later than when we recognize such income for accounting
purposes;
- •
- the higher interest rates on PIK securities reflects the payment deferral and increased credit risk associated with such
instruments and PIK securities generally represent a significantly higher credit risk than coupon loans;
- •
- the presence of accreted OID income and PIK interest income create the risk of non-refundable cash payments to our Advisor in the form of incentive fees on income based
78
- •
- even if accounting conditions are met, borrowers on such securities could still default when our actual collection is expected to
occur at the maturity of the obligation;
- •
- OID and PIK create the risk that incentive fees will be paid to our Advisor based on non-cash accruals that ultimately may not be
realized, while our Advisor will be under no obligation to reimburse us for these fees; and
- •
- PIK interest has the effect of generating investment income and increasing the incentive fees payable at a compounding rate. In addition, the deferral of PIK interest also reduces the loan-to-value ratio at a compounding rate.
on non-cash accreted OID income and PIK interest income accruals that may never be realized;
We are subject to risks associated with investing alongside other third parties, including our joint venture.
We invested in a joint venture, ABC Complete Financing Solution LLC, that terminated April 30, 2019, and may invest in additional or different joint ventures alongside third parties through partnerships, joint ventures or other entities in the future. Such investments may involve risks not present in investments where a third party is not involved, including the possibility that such third party may at any time have economic or business interests or goals which are inconsistent with ours, or may be in a position to take action contrary to our investment objectives. In addition, we may in certain circumstances be liable for actions of such third party.
More specifically, joint ventures involve a third party that has approval rights over activity of the joint venture. The third party may take actions that are inconsistent with our interests. For example, the third party may decline to approve an investment for the joint venture that we otherwise want the joint venture to make. A joint venture may also use investment leverage which magnifies the potential for gain or loss on amounts invested. Generally, the amount of borrowing by the joint venture is not included when calculating our total borrowing and related leverage ratios and is not subject to asset coverage requirements imposed by the 1940 Act. If the activities of the joint venture were required to be consolidated with our activities because of a change in GAAP rules or SEC staff interpretations, it is likely that we would have to reorganize any such joint venture.
Federal Income Tax and Other Tax Risks
We will be subject to corporate-level income tax if we are unable to qualify as a RIC.
In order to qualify and be eligible for taxation as a RIC under the Code, we must meet certain source-of-income, asset diversification and distribution requirements. The distribution requirement for a RIC is satisfied if we distribute dividends in respect of each taxable year of an amount equal to at least 90% of our investment company taxable income, determined without regard to any deduction for dividends paid, to our stockholders. We will be subject, to the extent we use debt financing, to certain asset coverage ratio requirements under the 1940 Act and financial covenants under loan and credit agreements that could, under certain circumstances, restrict us from making distributions necessary to enable us to be eligible for taxation as a RIC. If we are unable to obtain cash from other sources, we may fail to be eligible for taxation as a RIC and, thus, may be subject to corporate-level income tax. To qualify and be eligible for taxation as a RIC, we must also meet certain asset diversification requirements at the end of each quarter of our taxable year. These tests may result in our having to dispose of certain investments quickly in order to prevent the loss of our qualifications as a RIC. Because most of our investments will be in private or thinly traded public companies, any such dispositions could be made at disadvantageous prices and may
79
result in substantial losses. If we fail to qualify to be eligible for taxation as a RIC for any reason and become subject to corporate income tax, the resulting corporate taxes could substantially reduce our net assets, the amount of income available for distributions to our stockholders and the amount of funds available for new investments. Such a failure would have a material adverse effect on us and our stockholders. See "Item 1. Business – Certain U.S. Federal Income Tax Consequences—Election to be Taxed as a RIC"
Shareholders may be required to pay tax in excess of the cash they receive.
Under the DRIP, if a stockholder owns shares of our common stock, the stockholder will have all cash distributions automatically reinvested in additional shares of that stockholder's common stock unless such stockholder, or his, her or its nominee on such stockholder's behalf, specifically "opts out" of the DRIP by delivering a written notice to the plan administrator prior to the record date of the next distribution. If a stockholder does not "opt out" of the DRIP, that stockholder will be deemed to have received, and for U.S. federal income tax purposes will be taxed on, the amount reinvested in our common stock to the extent the amount reinvested was not a tax-free return of capital. As a result, a stockholder may have to use funds from other sources to pay U.S. federal income tax liability on the value of the common stock received. Even if a stockholder chooses to "opt out" of the DRIP, we will have the ability to declare a large portion of a dividend in shares of our common stock instead of in cash in order to satisfy the Annual Distribution Requirement (as defined above "Item 1. Business – Certain U.S. Federal Income Tax Consequences—Election to be Taxed as a RIC"). As long as a portion of this dividend is paid in cash and certain requirements are met, the entire distribution will be treated as a dividend for U.S. federal income tax purposes. As a result, a stockholder generally will be subject to tax on 100% of the fair market value of the dividend on the date the dividend is received by the stockholder in the same manner as a cash dividend, even though most of the dividend was paid in shares of common stock.
We may have difficulty paying our required distributions if we recognize income before, or without, receiving cash representing such income.
For U.S. federal income tax purposes, we will include in income certain amounts that we have not yet received in cash, such as amounts accrued as OID. OID may arise if we receive warrants in connection with the making of a loan and in other circumstances, or through contracted PIK interest, which represents contractual interest added to the loan balance and due at the end of the loan term. Such OID, which could be significant relative to our overall investment activities, or increases in loan balances as a result of contracted PIK arrangements, will be included in income regardless of whether we concurrently receive any corresponding cash payments. We also may be required to include in income certain other amounts that we will not receive in cash concurrently with such inclusion.
Since in certain cases we may recognize income before or without receiving cash representing such income, we may have difficulty meeting the requirement in a given taxable year to distribute at least 90% of our investment company taxable income, determined without regard to any deduction for distributions paid, as distributions to our stockholders in order to maintain our ability to be eligible for treatment as a RIC. In such a case, we may have to sell some of our investments at times we would not consider advantageous, raise additional debt or equity capital or reduce new investment originations to meet these distribution requirements. If we are not able to obtain such cash from other sources, we may fail to qualify to be eligible for treatment as a RIC and thus be subject to corporate-level income tax.
80
We may experience potential adverse tax consequences as a result of not being treated as a "publicly offered regulated investment company."
We will be treated as a "publicly offered regulated investment company" (within the meaning of Section 67 of the Code) if either (i) shares of our common stock and our preferred stock (if any) collectively are held by at least 500 persons at all times during a taxable year, (ii) shares of our common stock are treated as regularly traded on an established securities market or (iii) shares of our common stock are continuously offered pursuant to a public offering (within the meaning of Section 4 of the Securities Act). We cannot assure you that we will be treated as a publicly offered regulated investment company for all years. If we are not treated as a publicly offered regulated investment company for any calendar year, each U.S. stockholder that is an individual, trust or estate will be treated as having received a distribution from us in the amount of such U.S. stockholder's allocable share of the management and incentive fees paid to our Advisor and certain of our other expenses for the calendar year, and these fees and expenses will be treated as miscellaneous itemized deductions of such U.S. stockholder. For taxable years beginning before 2026, miscellaneous itemized deductions generally are not deductible by a U.S. stockholder that is an individual, trust or estate. For taxable years beginning in 2026 or later, miscellaneous itemized deductions generally are deductible by a U.S. stockholder that is an individual, trust or estate only to the extent that the aggregate of such U.S. stockholder's miscellaneous itemized deductions exceeds 2% of such U.S. stockholder's adjusted gross income for U.S. federal income tax purposes, are not deductible for purposes of the alternative minimum tax and are subject to the overall limitation on itemized deductions under Section 68 of the Code.
We may be subject to withholding of U.S. federal income tax on distributions for non-U.S. stockholders.
Distributions by a BDC generally are treated as dividends for U.S. tax purposes, and will be subject to U.S. income or withholding tax unless the stockholder receiving the distribution qualifies for an exemption from U.S. tax, or the distribution is subject to one of the special look-through rules described below. Distributions paid out of net capital gains can qualify for a reduced rate of taxation in the hands of an individual U.S. stockholder, and an exemption from U.S. tax in the hands of a non-U.S. stockholder.
However, if properly reported by a RIC as such, dividend distributions by the RIC derived from certain interest income (such distributions, "interest-related dividends") and certain net short-term capital gains (such distributions, "short-term capital gain dividends") generally are exempt from U.S. withholding tax otherwise imposed on non-U.S. stockholders. Interest-related dividends are dividends that are attributable to "qualified net interest income" (i.e., "qualified interest income," which generally consists of certain interest and OID on obligations "in registered form" as well as interest on bank deposits earned by a RIC, less allocable deductions) from sources within the United States. Short-term capital gain dividends are dividends that are attributable to net short-term capital gains, other than short-term capital gains recognized on the disposition of U.S. real property interests, earned by a RIC. However, no assurance can be given as to whether any of our distributions will be eligible for this exemption from U.S. withholding tax or, if eligible, will be reported as such by us. Furthermore, in the case of shares of our stock held through an intermediary, the intermediary may have withheld U.S. federal income tax even if we reported the payment as an interest-related dividend or short-term capital gain dividend. Since our common stock will be subject to significant transfer restrictions, and an investment in our common stock will generally be illiquid, non-U.S. stockholders whose distributions on our common stock are subject to U.S. withholding tax may not be able to transfer their shares of our common stock easily or quickly or at all.
A failure of any portion of our distributions to qualify for the exemption for interest-related dividends or short-term capital gain dividends would not affect the treatment of non-U.S. stockholders that qualify for an exemption from U.S. withholding tax on dividends by reason of their special status (for
81
example, foreign government-related entities and certain pension funds resident in favorable treaty jurisdictions).
We may retain income and capital gains in excess of what is permissible for excise tax purposes and such amounts will be subject to 4% U.S. federal excise tax, reducing the amount available for distribution to taxpayers.
We may retain some income and capital gains in the future, including for purposes of providing us with additional liquidity, which amounts would be subject to the 4% U.S. federal excise tax. In that event, we will be liable for the tax on the amount by which we do not meet the foregoing distribution requirement. See Item 1. Business – Certain U.S. Federal Income Tax Consequences.
Our business may be adversely affected if we fail to maintain our qualification as a RIC.
To maintain RIC tax treatment under the Code, we must meet the Annual Distribution Requirement, 90% Income Test and Diversification Tests described below and defined and further described in Item 1. Business – "Certain U.S. Federal Income Tax Consequences." The Annual Distribution Requirement will be satisfied if we distribute dividends to our stockholders in respect of each taxable year of an amount generally at least equal to 90% of our investment company taxable income, determined without regard to any deduction for distributions paid. In this regard, a RIC may, in certain cases, satisfy the Annual Distribution Requirement by distributing dividends relating to a taxable year after the close of such taxable year under the "spillback dividend" provisions of Subchapter M of the Code. We will be subject to tax, at regular corporate rates, on any retained income and/or gains, including any short-term capital gains or long-term capital gains. We must also satisfy the Excise Tax Avoidance Requirement, which is an additional distribution requirement with respect to each calendar year in order to avoid the imposition of a 4% excise tax on the amount of any under-distribution. Because we may use debt financing, we are subject to (i) an asset coverage ratio requirement under the 1940 Act and may, in the future, be subject to (ii) certain financial covenants under loan and credit agreements that could, under certain circumstances, restrict us from making distributions necessary to satisfy the distribution requirements. If we are unable to obtain cash from other sources, or chose or be required to retain a portion of our taxable income or gains, we could (i) be required to pay excise tax and (ii) fail to qualify for RIC tax treatment, and thus become subject to corporate-level income tax on our taxable income (including gains).
The 90% Income Test will be satisfied if we earn at least 90% of our gross income each taxable year from distributions, interest, gains from the sale of stock or securities, or other income derived from the business of investing in stock or securities. The Diversification Tests will be satisfied if we meet certain asset diversification requirements at the end of each quarter of our taxable year. To satisfy the Diversification Tests, at least 50% of the value of our assets at the close of each quarter of each taxable year must consist of cash, cash equivalents (including receivables), U.S. government securities, securities of other RICs, and other acceptable securities, and no more than 25% of the value of our assets can be invested in the securities, other than U.S. government securities or securities of other RICs, of one issuer, of two or more issuers that are controlled, as determined under applicable Code rules, by us and that are engaged in the same or similar or related trades or businesses or of certain "qualified publicly traded partnerships." Failure to meet these requirements may result in our having to dispose of certain investments quickly in order to prevent the loss of RIC status. Because most of our investments will be in private companies, and therefore will be relatively illiquid, any such dispositions could be made at disadvantageous prices and could result in substantial losses.
We may invest in certain debt and equity investments through taxable subsidiaries and the net taxable income of these taxable subsidiaries will be subject to federal and state corporate income taxes. We also may invest in certain foreign debt and equity investments which could be subject to foreign taxes (such as income tax, withholding, and value added taxes). If we fail to maintain RIC tax treatment for any reason
82
and are subject to corporate income tax, the resulting corporate taxes could substantially reduce our net assets, the amount of income available for distribution, and the amount of our distributions.
We may be impacted by recently enacted federal tax legislation.
Significant U.S. federal tax reform legislation was recently enacted that, among other things, permanently reduces the maximum federal corporate income tax rate, reduces the maximum individual income tax rate (effective for taxable years 2018 through 2025), restricts the deductibility of business interest expense, changes the rules regarding the calculation of net operating loss deductions that may be used to offset taxable income, expands the circumstances in which a foreign corporation will be treated as a "controlled foreign corporation" and, under certain circumstances, requires accrual method taxpayers to recognize income for U.S. federal income tax purposes no later than the income is taken into account as revenue in an applicable financial statement. The impact of this new legislation on us, our stockholders and entities in which we may invest is uncertain. Prospective investors are urged to consult their tax advisors regarding the effects of the new legislation on an investment in us.
Risks Relating to Our Common Stock
Investing in our common stock involves an above average degree of risk.
The investments we make in accordance with our investment objectives may result in a higher amount of risk than alternative investment options and a higher risk of volatility or loss of principal. Therefore, an investment in shares of our common stock may not be suitable for someone with lower risk tolerance. In addition, our common stock is intended for long-term investors who can accept the risks of investing primarily in illiquid loans and other debt or debt-like instruments and should not be treated as a trading vehicle.
The market price of our common stock may fluctuate significantly.
The market price and liquidity of the market for shares of our common stock that will prevail in the market may be higher or lower than the price you pay and may be significantly affected by numerous factors, some of which are beyond our control and may not be directly related to our operating performance. These factors include:
- •
- significant volatility in the market price and trading volume of securities of BDCs or other companies in our sector, which are
not necessarily related to the operating performance of these companies;
- •
- price and volume fluctuations in the overall stock market from time to time;
- •
- the inclusion or exclusion of our stock from certain indices;
- •
- changes in regulatory policies or tax guidelines, particularly with respect to RICs or BDCs;
- •
- any loss of RIC or BDC status;
- •
- changes in earnings or perceived changes or variations in operating results;
- •
- changes or perceived changes in the value of our portfolio of investments;
- •
- changes in accounting guidelines governing valuation of our investments;
83
- •
- any shortfall in revenue or net income or any increase in losses from levels expected by investors or securities analysts;
- •
- the inability of our Advisor to employ additional experienced investment professionals or the departure of any of our Advisor's
key personnel;
- •
- short-selling pressure with respect to shares of our common stock or BDCs generally;
- •
- future sales of our securities convertible into or exchangeable or exercisable for our common stock or the conversion of such
securities;
- •
- uncertainty surrounding the strength of the U.S. economy;
- •
- concerns regarding European sovereign debt and economic activity generally;
- •
- operating performance of companies comparable to us;
- •
- general economic trends and other external factors; and
- •
- loss of a major funding source.
In the past, following periods of volatility in the market price of a company's securities, securities class action litigation has often been brought against that company. If our stock price fluctuates significantly, we may be the target of securities litigation in the future. Securities litigation could result in substantial costs and divert management's attention and resources from our business.
We cannot assure you that a market for shares of our common stock will be maintained or the market price of our shares will trade close to NAV.
We cannot assure you that a trading market for our common stock can be sustained. In addition, we cannot predict the prices at which our common stock will trade, whether at, above or below NAV. Shares of closed-end investment companies, including BDCs, frequently trade at a discount from NAV, and our common stock may also be discounted in the market. In addition, if our common stock trades below its NAV, we will generally not be able to sell additional shares of our common stock to the public at its market price without, among other things, the requisite stockholders approve such a sale.
Sales of substantial amounts of our common stock in the public market may have an adverse effect on the market price of our common stock.
We have 51,649,812.27 shares of common stock outstanding. Sales of substantial amounts of our common stock, or the availability of such shares for sale, could adversely affect the prevailing market prices for our common stock. If this occurs and continues, it could impair our ability to raise additional capital through the sale of equity securities should we desire to do so.
Our stockholders will experience dilution in their ownership percentage if they opt out of our DRIP.
We have adopted a DRIP, pursuant to which we will reinvest all cash distributions declared by the Board on behalf of stockholders who do not elect to receive their distributions in cash. As a result, if the Board authorizes, and we declare, a cash distribution, then our stockholders who have not opted out of our DRIP will have their cash distributions automatically reinvested in additional common stock, rather than
84
receiving the cash distribution. See Item 1. Business "Dividend Reinvestment Plan" for a description of our dividend policy and obligations.
If on the payment date for any distribution, the most recently computed NAV per share is equal to or less than the closing market price plus estimated per share fees (which include any applicable brokerage commissions the plan agent is required to pay), the plan agent will invest the distribution amount in newly issued shares on behalf of the participants. The number of newly issued shares to be credited to a participant's account will be determined by dividing the dollar amount of the distribution by the most recently computed NAV per share provided that, if the NAV is less than or equal to 95% of the then current market price per share, the dollar amount of the distribution will be divided by 95% of the market price on the payment date. Accordingly, participants in the DRIP may receive a greater number shares of our common stock than the number of shares associated with the market price of our common stock, resulting in dilution for other stockholders. Stockholders that opt out of our DRIP will experience dilution in their ownership percentage of our common stock over time.
We may in the future determine to issue preferred stock, which could adversely affect the market value of our common stock.
The issuance of shares of preferred stock with dividend or conversion rights, liquidation preferences or other economic terms more favorable to the holders of preferred stock than to our common stockholders could adversely affect the market price for our common stock by making an investment in the common stock less attractive. In addition, the dividends on any preferred stock we issue must be cumulative. Payment of dividends and repayment of the liquidation preference of preferred stock must take preference over any distributions or other payments to our common stockholders, and holders of preferred stock are not subject to any of our expenses or losses and are not entitled to participate in any income or appreciation in excess of their stated preference (other than convertible preferred stock that converts into common stock). In addition, under the 1940 Act, participating preferred stock and preferred stock constitutes a "senior security" for purposes of the asset coverage test.
There is a risk that you may not receive distributions or that our distributions may not grow over time and a portion of our distributions may be a return of capital.
We intend to make distributions on a quarterly basis to our stockholders out of assets legally available for distribution. We cannot assure you that we will achieve investment results that will allow us to make a specified level of cash distributions or year-to-year increases in cash distributions. Our ability to pay distributions might be adversely affected by the impact of one or more of the risk factors described in this prospectus. If we are unable to satisfy the asset coverage test applicable to us as a BDC, or if we violate certain covenants under our debt agreements or any future credit or other borrowing facility, our ability to pay distributions to our stockholders could be limited because we may be required by its terms to use all payments of interest and principal that we receive from our current investments as well as any proceeds received from the sale of our current investments to repay amounts outstanding thereunder. All distributions will be paid at the discretion of our Board and will depend on our earnings, financial condition, maintenance of our RIC status, compliance with applicable BDC regulations, compliance with covenants under our debt agreements or any future credit or other borrowing facility and such other factors as our Board may deem relevant from time to time.
Furthermore, the tax treatment and characterization of our distributions may vary significantly from time to time due to the nature of our investments. The ultimate tax characterization of our distributions made during a taxable year may not finally be determined until after the end of that taxable year. The distributions we pay to our stockholders in a year may exceed our net ordinary income and capital gains for that year and, accordingly, a portion of such distributions may constitute a return of
85
capital for U.S. federal income tax purposes that would reduce a stockholder's adjusted tax basis in its shares of our common stock or preferred stock and correspondingly increase such stockholder's gain, or reduce such stockholder's loss, on disposition of such shares. Distributions in excess of a stockholder's adjusted tax basis in its shares of our common stock or preferred stock will generally constitute capital gains to such stockholder.
A distribution from a RIC consisting of a return of capital for U.S. federal income tax purposes is not a distribution of the RIC's net ordinary income or capital gains. Accordingly, stockholders should carefully read any written disclosure accompanying a distribution from us and the information about the specific tax characteristics of our distributions provided to stockholders after the end of each calendar year, and should not assume that the source of any distribution is our net ordinary income or capital gains.
Our stockholders may experience dilution in their ownership percentage.
Our stockholders do not have preemptive rights to any shares of our common stock we issue in the future. To the extent that we issue additional equity interests at or below NAV your percentage ownership interest in us may be diluted. In addition, depending upon the terms and pricing of any future and the value of our investments, you may also experience dilution in the book value and fair value of your shares of our common stock.
Under the 1940 Act, we generally are prohibited from issuing or selling shares of our common stock at a price below NAV per share, which may be a disadvantage as compared with certain public companies. We may, however, sell up to 25% of our then outstanding shares of our common stock, or warrants, options, or rights to acquire shares of our common stock, at a price below the current NAV of shares of our common stock if the Board determines that such sale is in our best interests and the best interests of our stockholders, and our stockholders, including a majority of those stockholders that are not affiliated with us, approve such sale. In any such case, the price at which our securities are to be issued and sold may not be less than a price that, in the determination of the Board, closely approximates the fair value of such securities (less any distributing commission or discount). If we raise additional funds by issuing shares of our common stock or senior securities convertible into, or exchangeable for, shares of our common stock, then the percentage ownership of our stockholders at that time will decrease and you will experience dilution.
We may incur significant costs as a result of being a public company.
Public companies incur legal, accounting and other expenses, including costs associated with the periodic reporting requirements applicable to a company whose securities are registered under the Exchange Act, as well as additional corporate governance requirements, including requirements under the Sarbanes-Oxley Act. Accordingly, we may incur significant additional costs as a result of being a public company. These requirements may place a strain on our systems and resources. The Sarbanes-Oxley Act requires that we maintain effective disclosure controls and procedures and internal controls over financial reporting, which are discussed below. In order to maintain and improve the effectiveness of our disclosure controls and procedures and internal controls, significant resources and management oversight may be required. We may be implementing additional procedures, processes, policies and practices for the purpose of addressing the standards and requirements applicable to public companies. These activities may divert management's attention from other business concerns, which could have a material adverse effect on our business, financial condition, results of operations and cash flows. We may incur significant additional annual expenses related to these steps and, among other things, directors' and officers' liability insurance, director fees, reporting requirements of the SEC, transfer agent fees, additional administrative expenses payable to our Administrator to compensate it for hiring additional accounting, legal and administrative personnel, increased auditing and legal fees and similar expenses.
86
We are obligated to maintain proper and effective internal control over financial reporting. We may not complete our analysis of our internal control over financial reporting in a timely manner, or our internal controls may not be determined to be effective, which may adversely affect investor confidence in our company and, as a result, the value of our common stock.
As of December 31, 2019, we are no longer an "emerging growth company," as defined in the Jumpstart Our Business Startups Act of 2012, or the JOBS Act. As a result, we are now required to comply with the independent auditor attestation requirements of Section 404 of the Sarbanes-Oxley Act beginning with this Annual Report on Form 10-K. Complying with Section 404 requires a rigorous compliance program as well as adequate time and resources. We may not be able to complete our internal control evaluation, testing and any required remediation in a timely fashion. Additionally, if we identify one or more material weaknesses in our internal control over financial reporting, we will be unable to assert that our internal controls are effective. If we are unable to assert that our internal control over financial reporting is effective, or if our auditors are unable to attest to management's report on the effectiveness of our internal controls, we could lose investor confidence in the accuracy and completeness of our financial reports, which would have a material adverse effect on the price of our common stock.
Item 1B. Unresolved Staff Comments
None.
We maintain our principal executive office at 200 Clarendon Street, 37th Floor, Boston, Massachusetts 02116. We do not own any real estate. We believe that our present facilities are adequate to meet our current needs. If new or additional space is required, we believe that adequate facilities are available at competitive prices in the same area.
We are not currently subject to any material legal proceedings, nor, to our knowledge, is any material legal proceeding threatened against us. From time to time, we may be a party to certain legal proceedings in the ordinary course of business, including proceedings relating to the enforcement of our rights under loans to or other contracts with our portfolio companies.
Item 4. Mine Safety Disclosures
Not applicable.
87
Item 5. Market for Registrant's Common Equity, Related Stockholder Matters and Issuer Purchases of Equity Securities
Our common stock is traded on the New York Stock Exchange under the symbol "BCSF." Prior to the completion of the IPO our outstanding common stock was offered and sold in transactions exempt from registration under the Securities Act under Section 4(a)(2) and Regulation D, as well as under Regulation S under the Securities Act.
Our common stock has historically traded below our NAV per share and may in the future trade at levels above NAV that may prove to be unsustainable. It is not possible to predict whether our common stock will trade at, above or below NAV.
As of February 19, 2020, there were approximately 120 holders of record of our common stock.
To the extent that we have income available, we intend to distribute quarterly distributions to our stockholders. Our quarterly distributions, if any, will be determined by the Board. Any distributions to our stockholders will be declared out of assets legally available for distribution.
The Company has elected to be treated as a RIC under Subchapter M of the Code. To qualify for and maintain RIC tax treatment, among other things, the Company must distribute dividends to our stockholders in respect of each taxable year of an amount at least equal to 90% of the sum of our net ordinary income and net short-term capital gains in excess of our net long-term capital losses ("investment company taxable income"), determined without regard to any deduction for distributions paid. In order to avoid 4% excise taxes imposed on RICs, the Company is required to distribute dividends to its stockholders in respect of each calendar year of an amount at least equal to the sum of: (1) 98% of our net ordinary income (taking into account certain deferrals and elections) for such calendar year; (2) 98.2% of our capital gains in excess of capital losses ("capital gain net income"), adjusted for certain ordinary losses, generally for the one-year period ending on October 31 of such calendar year; and (3) any net ordinary income and capital gain net income for preceding years that were not distributed during such years and on which the Company previously did not incur any U.S. federal income tax.
We currently intend to distribute net capital gains (i.e., net long-term capital gains in excess of net short-term capital losses), if any, at least annually out of the assets legally available for such distributions. However, we may decide in the future to retain such capital gains for investment, incur a corporate-level tax on such capital gains, and elect to treat such capital gains as deemed distributions to you. If this happens, stockholders will be treated for U.S. federal income tax purposes as if stockholders had received an actual distribution of the capital gains that we retain and reinvested the net after tax proceeds in us. In this situation, stockholders would be eligible to claim a tax credit equal to their allocable share of the tax the Company paid on the capital gains deemed distributed to stockholders. We cannot offer assurance that we will achieve results that will permit us to pay any cash distributions, and if we issue senior securities, we will be prohibited from making distributions if doing so would cause us to fail to maintain the asset coverage ratios stipulated by the 1940 Act or if such distributions are limited by the terms of any of our borrowings.
88
We have adopted a DRIP that provides for the reinvestment of dividends and other distributions on behalf of our stockholders, unless a stockholder elects to receive cash as provided below. As a result, if our Board declares a cash distribution, then our stockholders who acquire shares of our common stock after our listing and have not elected to "opt out" of our DRIP will have their cash distributions automatically reinvested in additional shares of our common stock as described below. Any stockholders who held shares of our common stock prior to our listing had to opt in to the DRIP.
No action is required on the part of a registered stockholder who acquired shares of our common stock after our listing on the New York Stock Exchange to have his or her cash distribution reinvested in shares of our common stock. A registered stockholder may elect to receive an entire distribution in cash by notifying the plan administrator and our transfer agent and registrar in writing so that such notice is received by the plan administrator no later than the record date for distributions to stockholders. The plan administrator will set up an account for each stockholder to acquire shares in non-certificated form through the plan if such stockholders have not elected to receive their distributions in cash. Those stockholders who hold shares through a broker or other financial intermediary may receive distributions in cash by notifying their broker or other financial intermediary of their election.
The following graph compares the return on our common stock with that of the S&P BDC Index and the Standard & Poor's 500 Stock Index, for the period from November 15, 2018, the date our common stock began trading, through December 31, 2019. The graph assumes that, on November 15, 2018, a person invested $100 in each of our common stock, the Standard & Poor's 500 Stock Index and the Standard & Poor's BDC Index. The graph measures total shareholder return, which takes into account both changes in stock price and dividends. It assumes that dividends paid are reinvested in like securities. The graph also assumes the reinvestment of all cash distributions prior to any tax effect. The graph and other information furnished under this Part II Item 5 of this annual report on Form 10-K shall not be deemed to be "soliciting material" or to be "filed" with the SEC or subject to Regulation 14A or 14C under, or to the
89
liabilities of Section 18 of, the Exchange Act. The stock price performance included in the below graph is not necessarily indicative of future stock performance.
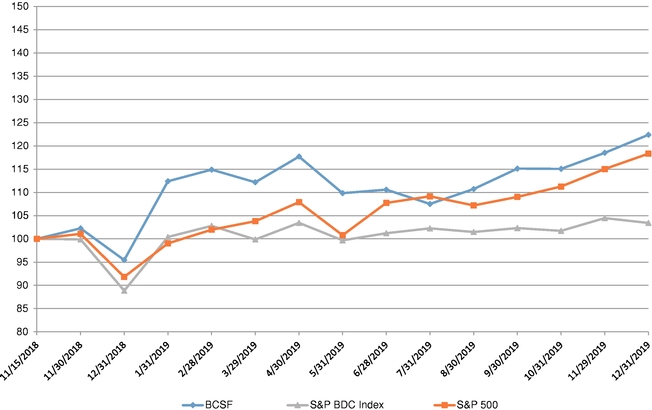
Recent Sales of Unregistered Securities and Use of Proceeds
Except as previously reported by the Company on its current reports on Form 8-K, we did not sell any securities during the period covered by this Annual Report that were not registered under the Securities Act.
90
Purchases of Equity Securities by the Issuer and Affiliated Purchasers
Share Purchases under the 10b5-1 Plan
The following table provides information regarding purchases of our common stock by certain individuals affiliated with the Company pursuant to the 10b5-1 Plan for each month from November 2018 (beginning November 15, 2018) through February 2019 (dollars in thousands).
| Period | Total Number of Shares Purchased |
Average Price Paid Per Share |
Total Number of Shares Purchased as Part of Publicly Announced Plans or Programs(1) |
Maximum (or Approximate Dollar Value) of Shares that May Yet Be Purchased Under the Plans or Programs |
|||||||||
|---|---|---|---|---|---|---|---|---|---|---|---|---|---|
November 15, 2018 through November 30, 2018 |
- | - | - | $20,000 | |||||||||
December 1, 2018 through December 31, 2018 |
265,754 | $15.28 | 265,754 | $15,545 | |||||||||
January 1, 2019 through February, 28, 2019 |
827,933 | $18.78 | 827,933 | $- | |||||||||
| | | | | | | | | | | | | | |
Total |
1,093,687 | 1,093,687 | |||||||||||
| | | | | | | | | | | | | | |
| | | | | | | | | | | | | | |
| | | | | | | | | | | | | | |
- (1)
- Shares purchased by certain individuals affiliated with the Company pursuant to the 10b5-1 Plan, which was entered into on November 28, 2018. Under the 10b5-1 Plan, the participants will buy up to $20.0 million in the aggregate of our common stock in the open market during the period beginning December 17, 2018 and ending on the earlier of the date on which the capital committed to the 10b5-1 Plan has been exhausted or November 19, 2019, subject to certain conditions. As of February 28, 2019, zero dollars remain under the 10b5-1 Plan and no further purchases are intended under the 10b5-1 Plan.
Item 6. Selected Consolidated Financial Data
The tables below set forth our selected consolidated historical financial data for the periods indicated. The selected consolidated historical financial data as of and for the years ended December 31, 2019, 2018, 2017 and 2016 have been derived from our audited consolidated financial statements, which are included in the consolidated financial statements and related notes thereto included elsewhere in this Annual Report. Our historical results are not necessarily indicative of future results. The selected financial data in this section is not intended to replace the financial statements and is qualified in its entirety by the financial statements and related notes included in this filing.
The following selected consolidated financial data as of and for the years ended December 31, 2019, 2018, 2017 and 2016 should be read in conjunction with "Management's Discussion and Analysis of
91
Financial Condition and Results of Operations," and the consolidated financial statements and related notes thereto included elsewhere in this Annual Report (dollars in thousands):
| |
As of and for the Year Ended December 31, 2019 |
As of and for the Year Ended December 31, 2018 |
As of and for the Year Ended December 31, 2017 |
As of and for the Year Ended December 31, 2016 |
|||||||||
|---|---|---|---|---|---|---|---|---|---|---|---|---|---|
Consolidated Statements of operations data: |
|||||||||||||
Total investment income |
$197,945 | $99,294 | $24,605 | $868 | |||||||||
Total expenses, net of waivers |
113,078 | 43,364 | 10,396 | 1,950 | |||||||||
| | | | | | | | | | | | | | |
Net investment income (loss) before taxes |
84,867 | 55,930 | 14,209 | (1,082) | |||||||||
Excise tax expense |
— | — | 5 | — | |||||||||
| | | | | | | | | | | | | | |
Net investment income (loss) after taxes |
84,867 | 55,930 | 14,204 | (1,082) | |||||||||
Net realized and unrealized gain (loss) |
13,218 | (29,285) | 5,096 | 1,691 | |||||||||
| | | | | | | | | | | | | | |
Net increase in net assets resulting from operations |
$98,085 | $26,645 | $19,300 | $609 | |||||||||
| | | | | | | | | | | | | | |
| | | | | | | | | | | | | | |
| | | | | | | | | | | | | | |
Per share data: |
|||||||||||||
Net investment income (loss) |
$1.64 | $1.45 | $0.73 | $(0.90) | |||||||||
Net increase in net assets resulting from operations |
$1.90 | $0.69 | $0.99 | $0.51 | |||||||||
Distributions declared(1) |
$1.64 | $1.52 | $0.70 | $0.015 | |||||||||
Consolidated Statements of assets and liabilities data (at period end): |
|||||||||||||
Total assets |
$2,645,554 | $1,791,014 | $988,251 | $176,855 | |||||||||
Total investments, at fair value |
2,527,055 | 1,727,806 | 831,578 | 107,942 | |||||||||
Total liabilities |
1,627,154 | 789,385 | 481,288 | 66,511 | |||||||||
Total debt, net of unamortized debt issuance costs |
1,574,635 | 634,925 | 451,000 | 59,100 | |||||||||
Total net assets |
1,018,400 | 1,001,629 | 506,963 | 110,344 | |||||||||
- (1)
- The per share data for distributions reflects the actual amount of distributions declared during the period.
Item 7. Management's Discussion and Analysis of Financial Condition and Results of Operations
The following discussion and other parts of this report contain forward-looking information that involves risks and uncertainties. The discussion and analysis contained in this section refers to our financial condition, results of operations and cash flows. The information contained in this section should be read in conjunction with the consolidated financial statements and notes thereto appearing elsewhere in this report. Please see "Forward-Looking Statements" for a discussion of the uncertainties, risks and assumptions associated with this discussion and analysis. Our actual results could differ materially from those anticipated by such forward-looking information due to factors discussed under "Forward-Looking Statements" appearing elsewhere in this report.
Bain Capital Specialty Finance, Inc. (the "Company", "we", "our" and "us") is an externally managed specialty finance company focused on lending to middle market companies. We have elected to be regulated as a business development company (a "BDC") under the Investment Company Act of 1940, as amended (together with the rules and regulations promulgated thereunder, the "1940 Act"). We are managed by BCSF Advisors, LP (our "Advisor" or "BCSF Advisors"), a subsidiary of Bain Capital
92
Credit, LP ("Bain Capital Credit"). Our Advisor is registered as an investment adviser with the SEC under the Investment Advisers Act of 1940, as amended (the "Advisers Act"). Our Advisor also provides the administrative services necessary for us to operate (in such capacity, our "Administrator" or "BCSF Advisors"). Since we commenced operations on October 13, 2016 through December 31, 2019, we have invested approximately $3,546.4 million in aggregate principal amount of debt and equity investments prior to any subsequent exits or repayments. We seek to generate current income and, to a lesser extent, capital appreciation through direct originations of secured debt, including first lien, first lien/last-out, unitranche and second lien debt, investments in strategic joint ventures, equity investments and, to a lesser extent, corporate bonds.
On November 19, 2018, we closed our initial public offering (the "IPO") issuing 7,500,000 shares of our common stock at a public offering price of $20.25 per share. Shares of common stock of the Company began trading on the New York Stock Exchange under the symbol "BCSF" on November 15, 2018.
Our primary focus is capitalizing on opportunities within our Senior Direct Lending strategy, which seeks to provide risk-adjusted returns and current income to our stockholders by investing primarily in middle-market companies with between $10.0 million and $150.0 million in annual earnings before interest, taxes, depreciation and amortization ("EBITDA"). However, we may, from time to time, invest in larger or smaller companies. We generally seek to retain effective voting control in respect of the loans or particular classes of securities in which we invest through maintaining affirmative voting positions or negotiating consent rights that allow us to retain a blocking position. We focus on senior investments with a first or second lien on collateral and strong structures and documentation intended to protect the lender. We may also invest in mezzanine debt and other junior securities, including common and preferred equity, on an opportunistic basis, and in secondary purchases of assets or portfolios but such investments are not the principal focus of our investment strategy. In addition, we may invest, from time to time, in distressed debt, debtor-in-possession loans, structured products, structurally subordinate loans, investments with deferred interest features, zero-coupon securities and defaulted securities.
We generate revenues primarily through receipt of interest income from the investments we hold. In addition, we generate income from various loan origination and other fees, dividends on direct equity investments and capital gains on the sales of investments. The companies in which we invest use our capital for a variety of reasons, including to support organic growth, to fund changes of control, to fund acquisitions, to make capital investments and for refinancing and recapitalizations.
Investments
We expect that our level of investment activity may vary substantially from period to period depending on many factors, including the amount of debt and equity capital available to middle-market companies, the level of merger and acquisition activity for such companies, the level of investment and capital expenditures of such companies, the general economic environment, the amount of capital we have available to us and the competitive environment for the type of investments we make.
As a BDC, we may not acquire any assets other than "qualifying assets" specified in the 1940 Act, unless, at the time the acquisition is made, at least 70% of our total assets are qualifying assets (with certain limited exceptions). Qualifying assets include investments in "eligible portfolio companies." Pursuant to rules adopted by the SEC, "eligible portfolio companies" include certain companies that do not have any securities listed on a national securities exchange and public companies whose securities are listed on a national securities exchange but whose market capitalization is less than $250 million.
93
As a BDC, we may also invest up to 30% of our portfolio opportunistically in "non-qualifying" portfolio investments, such as investments in non-U.S. companies.
Revenues
We primarily generate revenue in the form of interest income on debt investments and distributions on equity investments and, to a lesser extent, capital gains, if any, on equity securities that we may acquire in portfolio companies. Some of our investments may provide for deferred interest payments or payment-in-kind ("PIK") interest. The principal amount of the debt investments and any accrued but unpaid interest generally becomes due at the maturity date. In addition, we may generate revenue in the form of commitment, origination, structuring or diligence fees, fees for providing managerial assistance and consulting fees. Loan origination fees, original issue discount and market discount or premium are capitalized, and we accrete or amortize such amounts into or against income over the life of the loan. We record contractual prepayment premiums on loans and debt securities as interest income.
Our debt investment portfolio consists of primarily floating rate loans. As of December 31, 2019 and December 31, 2018, 99.0% and 95.5%, respectively, of our debt investments, based on fair value, bore interest at floating rates, which may be subject to interest rate floors. Variable-rate investments subject to a floor generally reset periodically to the applicable floor, only if the floor exceeds the index. Trends in base interest rates, such as LIBOR, may affect our net investment income over the long term. In addition, our results may vary from period to period depending on the interest rates of new investments made during the period compared to investments that were sold or repaid during the period; these results reflect the characteristics of the particular portfolio companies that we invested in or exited during the period and not necessarily any trends in our business or macroeconomic trends.
Dividend income on preferred equity investments is recorded on an accrual basis to the extent that such amounts are payable by the portfolio company and are expected to be collected. Dividend income on common equity investments is recorded on the record date for private portfolio companies and on the ex-dividend date for publicly traded portfolio companies.
Expenses
Our primary operating expenses may include the payment of fees to our Advisor under the investment advisory agreement (the "Investment Advisory Agreement"), our allocable portion of overhead expenses under the administration agreement (the "Administration Agreement") and other operating costs, including those described below. The Base Management Fee and Incentive Fee compensate our Advisor for its work in identifying, evaluating, negotiating, closing and monitoring our investments. We bear all other out-of-pocket costs and expenses of our operations and transactions, including:
- •
- our operational and organizational cost;
- •
- the costs of any public offerings of our common stock and other securities, including registration and listing fees;
- •
- costs of calculating our net asset value (including the cost and expenses of any third-party valuation services);
- •
- fees and expenses payable to third parties relating to evaluating, making and disposing of investments, including our Advisor's or its affiliates' travel expenses, research costs and out-of-pocket fees and expenses associated with performing due diligence and reviews of prospective investments, monitoring our investments and, if necessary, enforcing our rights;
94
- •
- interest payable on debt and other borrowing costs, if any, incurred to finance our investments;
- •
- costs of effecting sales and repurchases of our common stock and other securities;
- •
- the base management fee and any incentive fee;
- •
- distributions on our common stock;
- •
- transfer agent and custody fees and expenses;
- •
- the allocated costs incurred by the Administrator in providing managerial assistance to those portfolio companies that request it;
- •
- other expenses incurred by BCSF Advisors or us in connection with administering our business, including payments made to
third-party providers of goods or services;
- •
- brokerage fees and commissions;
- •
- federal and state registration fees;
- •
- U.S. federal, state and local taxes;
- •
- Independent Director fees and expenses;
- •
- costs associated with our reporting and compliance obligations under the 1940 Act and applicable U.S. federal and state securities
laws;
- •
- costs of any reports, proxy statements or other notices to our stockholders, including printing costs;
- •
- costs of holding stockholder meetings;
- •
- our fidelity bond;
- •
- directors' and officers' errors and omissions liability insurance, and any other insurance premiums;
- •
- litigation, indemnification and other non-recurring or extraordinary expenses;
- •
- direct costs and expenses of administration and operation, including printing, mailing, long distance telephone, staff, audit,
compliance, tax and legal costs;
- •
- fees and expenses associated with marketing efforts;
- •
- dues, fees and charges of any trade association of which we are a member; and
- •
- all other expenses reasonably incurred by us or the Administrator in connection with administering our business.
95
To the extent that expenses to be borne by us are paid by BCSF Advisors, we will generally reimburse BCSF Advisors for such expenses. To the extent the Administrator outsources any of its functions, the Company will pay the fees associated with such functions on a direct basis without profit to the Administrator. We will also reimburse the Administrator for its costs and expenses and our allocable portion of overhead incurred by it in performing its obligations under the Administration Agreement, including certain rent and compensation paid to or compensatory distributions received by our officers (including our Chief Compliance Officer and Chief Financial Officer) and any of their respective staff who provide services to us, operations staff who provide services to us, internal audit staff, if any, to the extent internal audit performs a role in our Sarbanes-Oxley internal control assessment and fees paid to third-party providers for goods or services. Our allocable portion of overhead will be determined by the Administrator, which expects to use various methodologies such as allocation based on the percentage of time certain individuals devote, on an estimated basis, to our business and affairs, and will be subject to oversight by our Board of Directors (our "Board"). The sub-administrator is paid its compensation for performing its sub-administrative services under the sub-administration agreement. We incurred expenses related to the sub-administrator of $0.6 million, $0.8 million and $0.5 million for the years ended December 31, 2019, 2018 and 2017 respectively, which is included in other general and administrative expenses on the consolidated statements of operations. BCSF Advisors will not be reimbursed to the extent that such reimbursements would cause any distributions to our stockholders to constitute a return of capital. All of the foregoing expenses are ultimately borne by our stockholders.
We may borrow money from time to time. However, our ability to incur indebtedness (including by issuing preferred stock), is limited by applicable regulations such that our asset coverage, as defined in the 1940 Act, must equal at least 150%. In determining whether to borrow money, we will analyze the maturity, covenant package and rate structure of the proposed borrowings as well as the risks of such borrowings compared to our investment outlook.
Portfolio and Investment Activity
During the year ended December 31, 2019, we invested $1,295.2 million, including PIK, in 89 portfolio companies, and had $1,088.0 million in aggregate amount of principal repayments and sales, resulting in a net increase in investments of $207.2 million for the year.
During the year ended December 31, 2018, we invested $1,168.7 million in 110 portfolio companies, including ABCS as a single portfolio company, and had $235.2 million in aggregate amount of principal repayments and sales, resulting in a net increase in investments of $933.5 million for the year.
During the year ended December 31, 2017, we invested $789.6 million in 73 portfolio companies, including ABCS as a single portfolio company, and had $75.6 million in aggregate amount of principal repayments and sales, resulting in a net increase in net investments of $714.0 million for the year.
96
The following table shows the composition of the investment portfolio and associated yield data as of December 31, 2019 (dollars in thousands):
| |
|
As of December 31, 2019 | |||||||||||||||||
|---|---|---|---|---|---|---|---|---|---|---|---|---|---|---|---|---|---|---|---|
| |
|
|
|
|
Weighted Average Yield (1) at |
||||||||||||||
| |
Amortized Cost | Percentage of Total Portfolio |
Fair Value | Percentage of Total Portfolio |
Amortized Cost |
Market Value |
|||||||||||||
First Lien Senior Secured Loans |
$ | 2,167,932 | 85.4 | % | $ | 2,165,844 | 85.7 | % | 7.5 | % | 7.5 | % | |||||||
First Lien Last Out Loans |
28,315 | 1.1 | 29,300 | 1.2 | 9.9 | 9.5 | |||||||||||||
Second Lien Senior Secured Loans |
187,565 | 7.4 | 175,670 | 7.0 | 9.7 | 10.0 | |||||||||||||
Subordinated Debt |
14,752 | 0.6 | 15,000 | 0.5 | 13.5 | 13.3 | |||||||||||||
Corporate Bonds |
22,412 | 0.9 | 17,508 | 0.7 | 8.5 | 10.8 | |||||||||||||
Equity Interests |
96,736 | 3.8 | 99,293 | 3.9 | 7.7 | 7.5 | |||||||||||||
Preferred Equity |
19,551 | 0.8 | 24,318 | 1.0 | 15.1 | 15.1 | |||||||||||||
Warrants |
— | 0.0 | 122 | 0.0 | N/A | N/A | |||||||||||||
| | | | | | | | | | | | | | | | | | | | |
Total |
$ | 2,537,263 | 100.0 | % | $ | 2,527,055 | 100.0 | % | 7.8 | % | 7.8 | % | |||||||
| | | | | | | | | | | | | | | | | | | | |
| | | | | | | | | | | | | | | | | | | | |
| | | | | | | | | | | | | | | | | | | | |
- (1)
- Weighted average yields are computed as (a) the annual stated interest rate or yield earned on the relevant accruing debt and other income producing securities, divided by (b) the total relevant investments at amortized cost or at fair value, as applicable. The weighted average yield does not represent the total return to our stockholders.
The following table shows the composition of the investment portfolio and associated yield data as of December 31, 2018 (dollars in thousands):
| |
|
As of December 31, 2018 | |||||||||||||||||
|---|---|---|---|---|---|---|---|---|---|---|---|---|---|---|---|---|---|---|---|
| |
|
|
|
|
Weighted Average Yield (1) at |
||||||||||||||
| |
Amortized Cost | Percentage of Total Portfolio |
Fair Value | Percentage of Total Portfolio |
Amortized Cost |
Market Value |
|||||||||||||
First Lien Senior Secured Loans |
$ | 1,074,413 | 61.3 | % | $ | 1,058,839 | 61.3 | % | 7.1 | % | 7.2 | % | |||||||
First Lien Last Out Loans |
27,325 | 1.5 | 27,488 | 1.6 | 8.8 | 8.8 | |||||||||||||
Second Lien Senior Secured Loans |
263,759 | 15.0 | 258,139 | 14.9 | 9.8 | 10.0 | |||||||||||||
Subordinated Debt |
39,711 | 2.3 | 39,625 | 2.3 | 11.3 | 11.3 | |||||||||||||
Corporate Bonds |
41,387 | 2.4 | 35,023 | 2.0 | 8.5 | 10.0 | |||||||||||||
Investment Vehicles (2) |
279,891 | 16.0 | 279,363 | 16.2 | 14.0 | 14.0 | |||||||||||||
Equity Interest |
24,078 | 1.4 | 26,522 | 1.5 | N/A | N/A | |||||||||||||
Preferred Equity |
2,553 | 0.1 | 2,807 | 0.2 | N/A | N/A | |||||||||||||
Warrants |
— | 0.0 | — | 0.0 | N/A | N/A | |||||||||||||
| | | | | | | | | | | | | | | | | | | | |
Total |
$ | 1,753,117 | 100.0 | % | $ | 1,727,806 | 100.0 | % | 8.8 | % | 8.9 | % | |||||||
| | | | | | | | | | | | | | | | | | | | |
| | | | | | | | | | | | | | | | | | | | |
| | | | | | | | | | | | | | | | | | | | |
- (1)
- Weighted
average yields are computed as (a) the annual stated interest rate or yield earned on the relevant accruing debt and other income
producing securities, divided by (b) the total relevant investments at amortized cost or at fair value, as applicable. The weighted average yield does not represent the total return to our
stockholders.
- (2)
- Represents equity investment in ABCS.
97
The following table presents certain selected information regarding our investment portfolio as of December 31, 2019:
| |
As of December 31, 2019 |
|
|---|---|---|
Number of portfolio companies |
114 | |
Percentage of debt bearing a floating rate (1) |
99.0% | |
Percentage of debt bearing a fixed rate (1) |
1.0% |
- (1)
- Measured on a fair value basis.
The following table presents certain selected information regarding our investment portfolio as of December 31, 2018:
| |
As of December 31, 2018 |
|
|---|---|---|
Number of portfolio companies (2) |
132 | |
Percentage of debt bearing a floating rate (1) |
95.5% | |
Percentage of debt bearing a fixed rate (1) |
4.5% |
- (1)
- Measured on a fair value basis.
- (2)
- Includes ABCS as a single portfolio company. For details of portfolio companies held within ABCS, refer to the selected financial data of ABCS.
The following table shows the amortized cost and fair value of our performing and non-accrual investments as of December 31, 2019 (dollars in thousands):
| |
As of December 31, 2019 | ||||||||||||
|---|---|---|---|---|---|---|---|---|---|---|---|---|---|
| |
Amortized Cost | Percentage at Amortized Cost |
Fair Value | Percentage at Fair Value |
|||||||||
Performing |
$ | 2,523,110 | 99.4 | % | $ | 2,523,626 | 99.9 | % | |||||
Non-accrual |
14,153 | 0.6 | 3,429 | 0.1 | |||||||||
| | | | | | | | | | | | | | |
Total |
$ | 2,537,263 | 100 | % | $ | 2,527,055 | 100 | % | |||||
| | | | | | | | | | | | | | |
| | | | | | | | | | | | | | |
| | | | | | | | | | | | | | |
The following table shows the amortized cost and fair value of our performing and non-accrual investments as of December 31, 2018 (dollars in thousands):
| |
As of December 31, 2018 | ||||||||||||
|---|---|---|---|---|---|---|---|---|---|---|---|---|---|
| |
Amortized Cost | Percentage at Amortized Cost |
Fair Value | Percentage at Fair Value |
|||||||||
Performing |
$ | 1,753,117 | 100.0 | % | $ | 1,727,806 | 100.0 | % | |||||
Non-accrual |
— | — | — | — | |||||||||
| | | | | | | | | | | | | | |
Total |
$ | 1,753,117 | 100.0 | % | $ | 1,727,806 | 100.0 | % | |||||
| | | | | | | | | | | | | | |
| | | | | | | | | | | | | | |
| | | | | | | | | | | | | | |
Loans or debt securities are placed on non-accrual status when there is reasonable doubt that principal or interest will be collected. Accrued interest generally is reversed when a loan or debt security is placed on non-accrual status. Interest payments received on non-accrual loans or debt securities may be recognized as income or applied to principal depending upon management's judgment. Non-accrual loans and debt securities are restored to accrual status when past due principal and interest is paid and, in
98
management's judgment, are likely to remain current. We may make exceptions to this treatment if the loan has sufficient collateral value and is in the process of collection.
The following table shows the amortized cost and fair value of the investment portfolio, cash and cash equivalents, foreign cash and restricted cash as of December 31, 2019 (dollars in thousands):
| |
As of December 31, 2019 | ||||||||||||
|---|---|---|---|---|---|---|---|---|---|---|---|---|---|
| |
Amortized Cost | Percentage of Total |
Fair Value | Percentage of Total |
|||||||||
Cash and cash equivalents |
$ | 36,531 | 1.4 | % | $ | 36,531 | 1.4 | % | |||||
Foreign cash |
854 | 0.0 | 810 | 0.0 | |||||||||
Restricted cash and cash equivalents |
31,505 | 1.2 | 31,505 | 1.3 | |||||||||
First Lien Senior Secured Loans |
2,167,932 | 83.2 | 2,165,844 | 83.4 | |||||||||
First Lien Last Out Loans |
28,315 | 1.1 | 29,300 | 1.1 | |||||||||
Second Lien Senior Secured Loans |
187,565 | 7.2 | 175,670 | 6.8 | |||||||||
Subordinated Debt |
14,752 | 0.5 | 15,000 | 0.6 | |||||||||
Corporate Bonds |
22,412 | 0.9 | 17,508 | 0.7 | |||||||||
Equity Interests |
96,736 | 3.7 | 99,293 | 3.8 | |||||||||
Preferred Equity |
19,551 | 0.8 | 24,318 | 0.9 | |||||||||
Warrants |
— | 0.0 | 122 | 0.0 | |||||||||
| | | | | | | | | | | | | | |
Total |
$ | 2,606,153 | 100.0 | % | $ | 2,595,901 | 100.0 | % | |||||
| | | | | | | | | | | | | | |
| | | | | | | | | | | | | | |
| | | | | | | | | | | | | | |
The following table shows the amortized cost and fair value of the investment portfolio, cash and cash equivalents and foreign cash as of December 31, 2018 (dollars in thousands):
| |
As of December 31, 2018 | ||||||||||||
|---|---|---|---|---|---|---|---|---|---|---|---|---|---|
| |
Amortized Cost | Percentage of Total |
Fair Value | Percentage of Total |
|||||||||
Cash and cash equivalents |
$ | 14,693 | 0.8 | % | $ | 14,693 | 0.8 | % | |||||
Foreign cash |
589 | 0.0 | 591 | 0.0 | |||||||||
Restricted cash |
17,987 | 1.0 | 17,987 | 1.0 | |||||||||
First Lien Senior Secured Loans |
1,074,413 | 60.1 | 1,058,839 | 60.1 | |||||||||
First Lien Last Out Loans |
27,325 | 1.5 | 27,488 | 1.6 | |||||||||
Second Lien Senior Secured Loans |
263,759 | 14.8 | 258,139 | 14.6 | |||||||||
Subordinated Debt |
39,711 | 2.2 | 39,625 | 2.3 | |||||||||
Corporate Bonds |
41,387 | 2.4 | 35,023 | 2.0 | |||||||||
Investment Vehicles (1) |
279,891 | 15.8 | 279,363 | 15.9 | |||||||||
Equity Interests |
24,078 | 1.3 | 26,522 | 1.5 | |||||||||
Preferred Equity |
2,553 | 0.1 | 2,807 | 0.2 | |||||||||
Warrants |
— | 0.0 | — | 0.0 | |||||||||
| | | | | | | | | | | | | | |
Total |
$ | 1,786,386 | 100.0 | % | $ | 1,761,077 | 100.0 | % | |||||
| | | | | | | | | | | | | | |
| | | | | | | | | | | | | | |
| | | | | | | | | | | | | | |
- (1)
- Represents equity investment in ABCS.
99
The following table shows the composition of the investment portfolio by industry, at amortized cost and fair value as of December 31, 2019 (with corresponding percentage of total portfolio investments) (dollars in thousands):
| |
As of December 31, 2019 | ||||||||||||
|---|---|---|---|---|---|---|---|---|---|---|---|---|---|
| |
Amortized Cost | Percentage of Total Portfolio |
Fair Value | Percentage of Total Portfolio |
|||||||||
High Tech Industries |
$ | 356,086 | 14.0 | % | $ | 356,073 | 14.1 | % | |||||
Aerospace & Defense |
305,111 | 12.0 | 307,863 | 12.2 | |||||||||
Healthcare & Pharmaceuticals |
255,579 | 10.1 | 254,014 | 10.1 | |||||||||
Consumer Goods: Non-Durable |
195,602 | 7.7 | 196,653 | 7.8 | |||||||||
Capital Equipment |
183,618 | 7.2 | 186,913 | 7.4 | |||||||||
Services: Business |
165,286 | 6.5 | 165,862 | 6.5 | |||||||||
Transportation: Cargo |
116,074 | 4.6 | 116,237 | 4.6 | |||||||||
Construction & Building |
107,413 | 4.2 | 108,176 | 4.3 | |||||||||
Wholesale |
79,542 | 3.1 | 78,225 | 3.1 | |||||||||
Energy: Oil & Gas |
77,264 | 3.0 | 77,979 | 3.1 | |||||||||
Automotive |
66,522 | 2.6 | 67,374 | 2.7 | |||||||||
Consumer Goods: Durable |
63,712 | 2.5 | 63,394 | 2.5 | |||||||||
Transportation: Consumer |
62,473 | 2.5 | 61,662 | 2.3 | |||||||||
Media: Advertising, Printing & Publishing |
59,419 | 2.3 | 54,765 | 2.2 | |||||||||
FIRE: Insurance (1) |
52,367 | 2.1 | 54,086 | 2.1 | |||||||||
Hotel, Gaming & Leisure |
52,866 | 2.1 | 53,074 | 2.1 | |||||||||
Media: Broadcasting & Subscription |
43,165 | 1.7 | 44,247 | 1.8 | |||||||||
Media: Diversified & Production |
35,670 | 1.4 | 36,403 | 1.4 | |||||||||
Retail |
34,774 | 1.4 | 34,827 | 1.4 | |||||||||
Chemicals, Plastics & Rubber |
32,288 | 1.3 | 32,446 | 1.3 | |||||||||
Services: Consumer |
30,458 | 1.2 | 30,794 | 1.2 | |||||||||
Banking |
25,656 | 1.0 | 25,466 | 1.0 | |||||||||
Energy: Electricity |
22,172 | 0.9 | 22,134 | 0.9 | |||||||||
Telecommunications |
21,323 | 0.8 | 21,343 | 0.8 | |||||||||
Beverage, Food & Tobacco |
30,687 | 1.2 | 19,531 | 0.8 | |||||||||
Environmental Industries |
16,814 | 0.7 | 17,612 | 0.7 | |||||||||
Containers, Packaging, & Glass |
11,637 | 0.5 | 11,633 | 0.5 | |||||||||
FIRE: Real Estate (1) |
10,786 | 0.4 | 10,443 | 0.4 | |||||||||
Forest Products & Paper |
10,301 | 0.4 | 9,700 | 0.4 | |||||||||
Utilities: Electric |
12,598 | 0.6 | 8,126 | 0.3 | |||||||||
| | | | | | | | | | | | | | |
Total |
$ | 2,537,263 | 100.0 | % | $ | 2,527,055 | 100.0 | % | |||||
| | | | | | | | | | | | | | |
| | | | | | | | | | | | | | |
| | | | | | | | | | | | | | |
- (1)
- Finance, Insurance and Real Estate ("FIRE").
100
The following table shows the composition of the investment portfolio by industry, at amortized cost and fair value as of December 31, 2018 (with corresponding percentage of total portfolio investments) (dollars in thousands):
| |
As of December 31, 2018 | ||||||||||||
|---|---|---|---|---|---|---|---|---|---|---|---|---|---|
| |
Amortized Cost | Percentage of Total Portfolio |
Fair Value | Percentage of Total Portfolio |
|||||||||
Investment Vehicles (1) |
$ | 279,891 | 16.0 | % | $ | 279,363 | 16.2 | % | |||||
High Tech Industries |
205,845 | 11.7 | 202,999 | 11.7 | |||||||||
Services: Business |
137,816 | 7.9 | 135,398 | 7.8 | |||||||||
Healthcare & Pharmaceuticals |
127,105 | 7.3 | 125,745 | 7.3 | |||||||||
Aerospace & Defense |
120,070 | 6.8 | 121,411 | 7.0 | |||||||||
Transportation: Cargo |
85,198 | 4.9 | 83,513 | 4.8 | |||||||||
Hotel, Gaming & Leisure |
81,487 | 4.6 | 80,683 | 4.7 | |||||||||
Consumer Goods: Non-Durable |
73,809 | 4.2 | 71,439 | 4.1 | |||||||||
Wholesale |
64,530 | 3.7 | 63,053 | 3.6 | |||||||||
Capital Equipment |
44,054 | 2.5 | 42,796 | 2.5 | |||||||||
Construction & Building |
41,240 | 2.4 | 41,582 | 2.4 | |||||||||
Retail |
43,263 | 2.5 | 41,384 | 2.4 | |||||||||
FIRE: Insurance (2) |
43,287 | 2.5 | 41,106 | 2.4 | |||||||||
Services: Consumer |
41,328 | 2.4 | 41,023 | 2.4 | |||||||||
Containers, Packaging & Glass |
40,212 | 2.3 | 38,694 | 2.2 | |||||||||
Beverage, Food & Tobacco |
38,154 | 2.2 | 35,613 | 2.1 | |||||||||
Energy: Oil & Gas |
31,541 | 1.8 | 31,195 | 1.8 | |||||||||
Media: Diversified & Production |
30,364 | 1.7 | 30,491 | 1.8 | |||||||||
Automotive |
29,482 | 1.7 | 29,337 | 1.7 | |||||||||
Energy: Electricity |
22,368 | 1.3 | 22,283 | 1.3 | |||||||||
Forest Products & Paper |
22,515 | 1.3 | 21,903 | 1.3 | |||||||||
Media: Broadcasting & Subscription |
21,868 | 1.2 | 20,945 | 1.2 | |||||||||
Media: Advertising, Printing & Publishing |
19,635 | 1.1 | 19,731 | 1.1 | |||||||||
Chemicals, Plastics & Rubber |
19,147 | 1.1 | 19,511 | 1.1 | |||||||||
Consumer Goods: Durable |
17,098 | 0.9 | 17,248 | 1.0 | |||||||||
Environmental Industries |
16,489 | 0.9 | 16,482 | 1.0 | |||||||||
Telecommunications |
15,240 | 0.9 | 15,122 | 0.9 | |||||||||
Banking |
13,260 | 0.7 | 13,235 | 0.8 | |||||||||
FIRE: Real Estate (2) |
10,714 | 0.6 | 10,650 | 0.6 | |||||||||
Utilities: Electric |
12,483 | 0.7 | 10,311 | 0.6 | |||||||||
FIRE: Finance (2) |
3,624 | 0.2 | 3,560 | 0.2 | |||||||||
| | | | | | | | | | | | | | |
Total |
$ | 1,753,117 | 100.0 | % | $ | 1,727,806 | 100.0 | % | |||||
| | | | | | | | | | | | | | |
| | | | | | | | | | | | | | |
| | | | | | | | | | | | | | |
- (1)
- Represents equity investment in ABCS.
- (2)
- Finance, Insurance and Real Estate ("FIRE").
101
Our Advisor monitors our portfolio companies on an ongoing basis. It monitors the financial trends of each portfolio company to determine if they are meeting their respective business plans and to assess the appropriate course of action for each company. The Advisor has several methods of evaluating and monitoring the performance and fair value of our investments, which may include the following:
- •
- assessment of success in adhering to the portfolio company's business plan and compliance with covenants;
- •
- periodic or regular contact with portfolio company management and, if appropriate, the financial or strategic sponsor to discuss
financial position, requirements and accomplishments;
- •
- comparisons to our other portfolio companies in the industry, if any;
- •
- attendance at and participation in board meetings or presentations by portfolio companies; and
- •
- review of monthly and quarterly financial statements and financial projections of portfolio companies.
Our Advisor rates the investments in our portfolio at least quarterly and it is possible that the rating of a portfolio investment may be reduced or increased over time. For investments rated 3 or 4, Advisor enhances its level of scrutiny over the monitoring of such portfolio company. Our internal performance ratings do not constitute any rating of investments by a nationally recognized statistical rating organization or represent or reflect any third-party assessment of any of our investments.
- •
- An investment is rated 1 if, in the opinion of our Advisor, it is performing above underwriting expectations, and the business
trends and risk factors are generally favorable, which may include the performance of the portfolio company or the likelihood of a potential exit.
- •
- An investment is rated 2 if, in the opinion of our Advisor, it is performing as expected at the time of our underwriting and there
are generally no concerns about the portfolio company's performance or ability to meet covenant requirements, interest payments or principal amortization, if applicable. All new investments or
acquired investments in new portfolio companies are initially given a rating of 2.
- •
- An investment is rated 3 if, in the opinion of our Advisor, the investment is performing below underwriting expectations and there
may be concerns about the portfolio company's performance or trends in the industry, including as a result of factors such as declining performance, non-compliance with debt covenants or delinquency
in loan payments (but generally not more than 180 days past due).
- •
- An investment is rated 4 if, in the opinion of our Advisor, the investment is performing materially below underwriting expectations. For debt investments, most of or all of the debt covenants are out of compliance and payments are substantially delinquent. Investments rated 4 are not anticipated to be repaid in full, if applicable, and there is significant risk that we may realize a substantial loss on our investment.
102
The following table shows the composition of our portfolio on the 1 to 4 rating scale as of December 31, 2019 (dollars in thousands):
| |
As of December 31, 2019 | ||||||||||||
|---|---|---|---|---|---|---|---|---|---|---|---|---|---|
| Investment Performance Rating | Fair Value | Percentage of Total |
Number of Companies |
Percentage of Total |
|||||||||
1 |
$ | 140,892 | 5.6 | % | 4 | 3.5 | % | ||||||
2 |
2,355,401 | 93.2 | 106 | 93.0 | |||||||||
3 |
27,333 | 1.1 | 3 | 2.6 | |||||||||
4 |
3,429 | 0.1 | 1 | 0.9 | |||||||||
| | | | | | | | | | | | | | |
Total |
$ | 2,527,055 | 100.0 | % | 114 | 100.0 | % | ||||||
| | | | | | | | | | | | | | |
| | | | | | | | | | | | | | |
| | | | | | | | | | | | | | |
The following table shows the composition of our portfolio on the 1 to 4 rating scale as of December 31, 2018 (dollars in thousands):
| |
As of December 31, 2018 | ||||||||||||
|---|---|---|---|---|---|---|---|---|---|---|---|---|---|
| Investment Performance Rating | Fair Value | Percentage of Total |
Number of Companies |
Percentage of Total |
|||||||||
1 |
$ | 17,301 | 1.0 | % | 1 | 0.7 | % | ||||||
2 |
1,684,494 | 97.5 | 128 | 97.0 | |||||||||
3 |
26,011 | 1.5 | 3 | 2.3 | |||||||||
4 |
— | — | — | — | |||||||||
| | | | | | | | | | | | | | |
Total |
$ | 1,727,806 | 100.0 | % | 132 | 100.0 | % | ||||||
| | | | | | | | | | | | | | |
| | | | | | | | | | | | | | |
| | | | | | | | | | | | | | |
Antares Bain Capital Complete Financing Solution
Prior to April 30, 2019, the Company was party to a limited liability company agreement with Antares Midco Inc. ("Antares") pursuant to which it invested in ABC Complete Financing Solution LLC, which made investments through its subsidiary, Antares Bain Capital Complete Financing Solution LLC (together with ABC Complete Financing Solution LLC, "ABCS"). ABCS, an unconsolidated Delaware limited liability company, was formed on September 27, 2017 and commenced operations on November 29, 2017. ABCS' principal purpose was to make investments, primarily in senior secured unitranche loans. The Company recorded its investment in ABCS at fair value. Distributions of income received from ABCS, if any, were recorded as dividend income from controlled affiliate investments in the consolidated statements of operations. Distributions received from ABCS in excess of income earned at ABCS, if any, were recorded as a return of capital and reduced the amortized cost of controlled affiliate investments.
We and Antares, as members of ABCS, agreed to contribute capital up to (subject to the terms of their agreement) $950.0 million in aggregate to purchase equity interests in ABCS, with us and Antares contributing up to $425.0 million and $525.0 million, respectively. Funding of such commitments generally required the consent of both Antares Credit Opportunities Manager LLC and the Advisor on behalf of Antares and us, respectively. ABCS was capitalized with capital contributions from its members on a pro-rata basis based on their maximum capital contributions as transactions were funded after they had been approved.
Investment decisions of ABCS required the consent of both the Advisor and Antares Credit Opportunities Manager LLC, as representatives of us and Antares, respectively. Each of the Advisor and Antares sourced investments for ABCS.
103
On April 30, 2019, we formed BCSF Complete Financing Solution Holdco, LLC ("BCSF CFSH, LLC") and BCSF Complete Financing Solution, LLC ("BCSF Unitranche" or "BCSF CFS, LLC"), wholly-owned, newly-formed, subsidiaries. We received our proportionate share of all assets which represented 44.737% of ABCS. The portfolio of investments that was distributed comprised of 25 senior secured unitranche loans with a fair value of $919.0 million and cash of $3.2 million. We also assumed the obligation to fund outstanding unfunded commitments of $31.4 million. In connection with the distribution, we recognized a realized gain of $0.3 million. We are no longer a member of ABCS. The assets we received from ABCS have been included in the Company's consolidated financial statements and notes thereto.
In conjunction with the distribution from ABCS, on April 30, 2019, BCSF CFS, LLC entered into a loan and security agreement (the "JPM Credit Agreement" or the "JPM Credit Facility") as borrower, with JPMorgan Chase Bank, National Association, as Administrative Agent, and Wells Fargo Bank, National Association as Collateral Administrator, Collateral Agent, Securities Intermediary and Bank. On the date of the ABCS distribution, the Company had $577.5 million outstanding on the JPM Credit Facility.
Below is selected balance sheet information for ABCS as of December 31, 2018:
Selected Balance Sheet Information
| |
As of December 31, 2018 |
|
|---|---|---|
Loans, net of allowance of $17,616 (1) |
$1,616,795 | |
Cash, restricted cash and other assets |
52,240 | |
| | | |
Total assets |
$1,669,035 | |
| | | |
| | | |
| | | |
Debt (2) |
$1,027,615 | |
Other liabilities |
30,762 | |
| | | |
Total liabilities |
$1,058,377 | |
| | | |
Members' equity |
610,658 | |
| | | |
Total liabilities and members' equity |
$1,669,035 | |
| | | |
| | | |
| | | |
- (1)
- ABCS is not considered an investment company and does not follow the accounting and reporting guidelines in ASC 946. ABCS applies an allowance for loan loss methodology prescribed by FASB ASC 310, Receivables, and FASB ASC 450 Contingencies. The allowance for loan loss as of December 31, 2018 is a general allowance, there was no specific allowance for loan losses during the period. The Company estimates a fair value for each loan in the ABCS portfolio, which is presented in the Antares Bain Capital Complete Financing Solution schedule of investments below, which is an input to the Company's valuation of ABCS as a whole.
- (2)
- Net of $3.6 million deferred financing costs for the ABCS Facility, as of December 31 2018.
104
Selected Statement of Operations Information
Below are selected statements of operations information for the years ended December 31, 2019, December 31, 2018 and for the period from November 29, 2017 through December 31, 2017:
| |
For the Year Ended | For the Year Ended | For the Period From November 29, 2017 through |
|||
|---|---|---|---|---|---|---|
| |
December 31, 2019 (2) |
December 31, 2018 |
December 31, 2017 |
|||
Interest income |
$53,494 | $104,548 | $6,816 | |||
Fee income |
217 | 1,201 | 19 | |||
| | | | | | | |
Total revenues |
53,711 | 105,749 | 6,835 | |||
Credit facility expenses (1) |
22,008 | 45,635 | 3,192 | |||
Other fees and expenses |
6,661 | 22,231 | 3,101 | |||
| | | | | | | |
Total expenses |
28,669 | 67,866 | 6,293 | |||
| | | | | | | |
Net investment income |
25,042 | 37,883 | 542 | |||
Net realized gains |
— | — | — | |||
Net change in unrealized appreciation (depreciation) on investments |
— | — | — | |||
| | | | | | | |
Net increase in members' capital from operations |
$25,042 | $37,883 | $542 | |||
| | | | | | | |
| | | | | | | |
| | | | | | | |
- (1)
- As of December 31, 2018 and December 31, 2017, the ABCS Facility had $1,031.2 million and $592.1 million of outstanding debt, respectively.
- (2)
- The ABCS distribution was effective April 30, 2019.
105
Antares Bain Capital Complete Financing Solution
Schedule of Investments
As of December 31, 2018
| Portfolio Company | Spread Above Index (1) | Interest Rate |
Maturity Date |
Principal/ Par Amount |
Carrying Value |
Fair Value (2) |
||||||||||||
|---|---|---|---|---|---|---|---|---|---|---|---|---|---|---|---|---|---|---|
Investments |
||||||||||||||||||
Corporate Debt |
||||||||||||||||||
Delayed Draw Term Loan |
||||||||||||||||||
Chemicals, Plastics & Rubber |
||||||||||||||||||
PRCC Holdings, Inc. |
L+ 6.50% | 9.02% | 2/1/2021 | $ | 11,878 | $ | 11,878 | $ | 11,878 | |||||||||
| | | | | | | | | | | | | | | | | | | |
Total Chemicals, Plastics & Rubber |
11,878 | 11,878 | ||||||||||||||||
Consumer Goods: Non-Durable |
||||||||||||||||||
Solaray, LLC |
L+ 5.75% | 8.49% | 9/9/2023 | $ | 26,680 | 26,389 | 26,547 | |||||||||||
Solaray, LLC (3) |
— | — | 9/9/2023 | $ | — | — | (33 | ) | ||||||||||
| | | | | | | | | | | | | | | | | | | |
Total Consumer Goods: Non-Durable |
26,389 | 26,514 | ||||||||||||||||
FIRE: Insurance |
||||||||||||||||||
Margaux Acquisition Inc. (3) |
— | — | 12/19/2024 | $ | — | — | (417 | ) | ||||||||||
| | | | | | | | | | | | | | | | | | | |
Total FIRE: Insurance |
— | (417 | ) | |||||||||||||||
High Tech Industries |
||||||||||||||||||
Element Buyer, Inc. (3) |
— | — | 7/19/2025 | $ | — | — | (133 | ) | ||||||||||
Element Buyer, Inc. |
L+ 5.25% | 7.76% | 7/19/2025 | $ | 7,600 | 7,473 | 7,543 | |||||||||||
| | | | | | | | | | | | | | | | | | | |
Total High Tech Industries |
7,473 | 7,410 | ||||||||||||||||
Media: Advertising, Printing & Publishing |
||||||||||||||||||
Ansira Holdings, Inc. |
L+ 5.75% | 8.27% | 12/20/2022 | $ | 2,478 | 2,472 | 2,459 | |||||||||||
Ansira Holdings, Inc. (3) |
— | — | 12/20/2022 | $ | — | — | (56 | ) | ||||||||||
| | | | | | | | | | | | | | | | | | | |
Total Media: Advertising, Printing & Publishing |
2,472 | 2,403 | ||||||||||||||||
Services: Consumer |
||||||||||||||||||
McKissock, LLC |
L+ 5.75% | 8.55% | 8/5/2021 | $ | 2,605 | 2,583 | 2,605 | |||||||||||
| | | | | | | | | | | | | | | | | | | |
Total Services: Consumer |
2,583 | 2,605 | ||||||||||||||||
Transportation: Consumer |
||||||||||||||||||
Direct Travel, Inc. |
L+ 6.50% | 9.12% | 12/1/2021 | $ | 1,672 | 1,669 | 1,672 | |||||||||||
Direct Travel, Inc. |
— | — | 12/1/2021 | $ | — | — | — | |||||||||||
| | | | | | | | | | | | | | | | | | | |
Total Transportation: Consumer |
1,669 | 1,672 | ||||||||||||||||
| | | | | | | | | | | | | | | | | | | |
Total Delayed Draw Term Loan |
$ | 52,464 | $ | 52,065 | ||||||||||||||
| | | | | | | | | | | | | | | | | | | |
| | | | | | | | | | | | | | | | | | | |
| | | | | | | | | | | | | | | | | | | |
First lien senior secured loan |
||||||||||||||||||
Aerospace & Defense |
||||||||||||||||||
API Technologies Corp. |
L+ 5.75% | 8.27% | 4/20/2024 | $ | 117,861 | 116,559 | 117,566 | |||||||||||
| | | | | | | | | | | | | | | | | | | |
Total Aerospace & Defense |
116,559 | 117,566 | ||||||||||||||||
Capital Equipment |
||||||||||||||||||
Tidel Engineering, L.P. |
L+ 6.25% | 9.05% | 3/1/2024 | $ | 86,442 | 86,415 | 86,442 | |||||||||||
| | | | | | | | | | | | | | | | | | | |
Total Capital Equipment |
86,415 | 86,442 | ||||||||||||||||
Chemicals, Plastics & Rubber |
||||||||||||||||||
AP Plastics Group, LLC |
L+ 5.25% | 7.60% | 8/1/2022 | $ | 48,398 | 48,348 | 47,914 | |||||||||||
PRCC Holdings, Inc. |
L+ 6.50% | 9.02% | 2/1/2021 | $ | 73,813 | 73,813 | 73,813 | |||||||||||
| | | | | | | | | | | | | | | | | | | |
Total Chemicals, Plastics & Rubber |
122,161 | 121,727 | ||||||||||||||||
Construction & Building |
||||||||||||||||||
Profile Products LLC |
L+ 5.75% | 8.54% | 12/20/2024 | $ | 78,832 | 77,614 | 77,256 | |||||||||||
| | | | | | | | | | | | | | | | | | | |
Total Construction & Building |
77,614 | 77,256 | ||||||||||||||||
Consumer Goods: Durable |
||||||||||||||||||
Home Franchise Concepts, Inc. |
L+ 5.00% | 7.43% | 7/9/2024 | $ | 69,091 | 68,773 | 68,400 | |||||||||||
Stanton Carpet Corp. (7) |
L+ 5.50% | 8.04% | 11/21/2022 | $ | 60,231 | 60,179 | 59,629 | |||||||||||
| | | | | | | | | | | | | | | | | | | |
Total Consumer Goods: Durable |
128,952 | 128,029 | ||||||||||||||||
Consumer Goods: Non-Durable |
||||||||||||||||||
Solaray, LLC |
L+ 5.75% | 8.49% | 9/9/2023 | $ | 96,230 | 95,175 | 95,749 | |||||||||||
| | | | | | | | | | | | | | | | | | | |
Total Consumer Goods: Non-Durable |
95,175 | 95,749 | ||||||||||||||||
Energy: Oil & Gas |
||||||||||||||||||
Amspec Services, Inc. |
L+ 5.75% | 8.55% | 7/2/2024 | $ | 90,025 | 88,986 | 86,874 | |||||||||||
| | | | | | | | | | | | | | | | | | | |
Total Energy: Oil & Gas |
88,986 | 86,874 | ||||||||||||||||
106
| Portfolio Company | Spread Above Index (1) | Interest Rate |
Maturity Date |
Principal/ Par Amount |
Carrying Value |
Fair Value (2) |
||||||||||||
|---|---|---|---|---|---|---|---|---|---|---|---|---|---|---|---|---|---|---|
FIRE: Insurance |
||||||||||||||||||
Margaux Acquisition Inc. |
L+ 6.00% | 8.80% | 12/19/2024 | $ | 65,125 | 63,766 | 63,822 | |||||||||||
Margaux UK Finance Limited |
GBP LIBOR+ 6.00% | 7.00% | 12/19/2024 | £ | 17,356 | 21,651 | 21,665 | |||||||||||
| | | | | | | | | | | | | | | | | | | |
Total FIRE: Insurance |
85,417 | 85,487 | ||||||||||||||||
High Tech Industries |
||||||||||||||||||
Caliper Software, Inc. |
L+ 5.50% | 8.02% | 11/28/2025 | $ | 68,182 | 67,509 | 67,159 | |||||||||||
Element Buyer, Inc. |
L+ 5.25% | 7.78% | 7/19/2025 | $ | 85,287 | 83,863 | 84,647 | |||||||||||
| | | | | | | | | | | | | | | | | | | |
Total High Tech Industries |
151,372 | 151,806 | ||||||||||||||||
Media: Advertising, Printing & Publishing |
||||||||||||||||||
Ansira Holdings, Inc. |
L+ 5.75% | 8.27% | 12/20/2022 | $ | 81,011 | 80,874 | 80,404 | |||||||||||
Cruz Bay Publishing, Inc. (5) |
L+ 5.75% | 8.30% | 6/6/2019 | $ | 11,418 | 11,418 | 11,418 | |||||||||||
Cruz Bay Publishing, Inc. (6) |
L+ 6.75% | 9.57% | 6/6/2019 | $ | 3,813 | 3,813 | 3,813 | |||||||||||
| | | | | | | | | | | | | | | | | | | |
Total Media: Advertising, Printing & Publishing |
96,105 | 95,635 | ||||||||||||||||
Media: Diversified & Production |
||||||||||||||||||
Efficient Collaborative Retail Marketing Company, LLC |
L+ 6.75% | 9.55% | 6/15/2022 | $ | 22,800 | 22,722 | 22,572 | |||||||||||
Efficient Collaborative Retail Marketing Company, LLC |
L+ 6.75% | 9.56% | 6/15/2022 | $ | 33,741 | 33,241 | 33,404 | |||||||||||
| | | | | | | | | | | | | | | | | | | |
Total Media: Diversified & Production |
55,963 | 55,976 | ||||||||||||||||
Retail |
||||||||||||||||||
Batteries Plus Holding Corporation |
L+ 6.75% | 9.27% | 7/6/2022 | $ | 68,156 | 68,156 | 68,156 | |||||||||||
| | | | | | | | | | | | | | | | | | | |
Total Retail |
68,156 | 68,156 | ||||||||||||||||
Services: Business |
||||||||||||||||||
TEI Holdings Inc. |
L+ 6.00% | 8.80% | 12/20/2023 | $ | 118,589 | 117,726 | 117,403 | |||||||||||
| | | | | | | | | | | | | | | | | | | |
Total Services: Business |
117,726 | 117,403 | ||||||||||||||||
Services: Consumer |
||||||||||||||||||
McKissock, LLC |
L+ 5.75% | 8.55% | 8/5/2021 | $ | 8,071 | 8,004 | 8,071 | |||||||||||
McKissock, LLC |
L+ 5.75% | 8.55% | 8/5/2021 | $ | 42,144 | 41,792 | 42,460 | |||||||||||
| | | | | | | | | | | | | | | | | | | |
Total Services: Consumer |
49,796 | 50,531 | ||||||||||||||||
Transportation: Consumer |
||||||||||||||||||
Direct Travel, Inc. |
L+ 6.50% | 9.30% | 12/1/2021 | $ | 112,153 | 111,789 | 112,153 | |||||||||||
| | | | | | | | | | | | | | | | | | | |
Total Transportation: Consumer |
111,789 | 112,153 | ||||||||||||||||
Wholesale |
||||||||||||||||||
Abracon Group Holding, LLC. (4) |
L+ 5.75% | 8.56% | 7/18/2024 | $ | 81,497 | 80,367 | 80,682 | |||||||||||
Aramsco, Inc. |
L+ 5.25% | 7.77% | 8/28/2024 | $ | 50,343 | 49,394 | 48,958 | |||||||||||
| | | | | | | | | | | | | | | | | | | |
Total Wholesale |
129,761 | 129,640 | ||||||||||||||||
| | | | | | | | | | | | | | | | | | | |
Total First Lien Senior Secured |
$ | 1,581,947 | $ | 1,580,430 | ||||||||||||||
| | | | | | | | | | | | | | | | | | | |
| | | | | | | | | | | | | | | | | | | |
| | | | | | | | | | | | | | | | | | | |
Total Corporate Debt |
$ | 1,634,411 | $ | 1,632,495 | ||||||||||||||
| | | | | | | | | | | | | | | | | | | |
| | | | | | | | | | | | | | | | | | | |
| | | | | | | | | | | | | | | | | | | |
Total Investments |
$ | 1,634,411 | $ | 1,632,495 | ||||||||||||||
| | | | | | | | | | | | | | | | | | | |
| | | | | | | | | | | | | | | | | | | |
| | | | | | | | | | | | | | | | | | | |
| (1) The investments bear interest at a rate that may be determined by reference to the London Interbank Offered Rate ("LIBOR" or "L") which reset daily, monthly, quarterly or semiannually. For each, the Company has provided the spread over LIBOR and the current weighted average interest rate in effect at December 31, 2018. Certain investments are subject to a LIBOR interest rate floor. | ||
| (2) Fair Value determined by the Advisor. | ||
| (3) The negative fair value is the result of the capitalized discount on the loan or the unfunded commitment being valued below par. | ||
| (4) $204 of the total par amount for this security is at P + 4.75%. | ||
| (5) $158 of the total par amount for this security is at P + 4.75%. | ||
| (6) $53 of the total par amount for this security is at P + 5.75%. | ||
| (7) $391 of the total par amount for this security is at P + 4.50%. |
107
Our operating results for the years ended December 31, 2019, 2018 and 2017 were as follows (dollars in thousands):
| |
For the Year Ended December 31, | |||||
|---|---|---|---|---|---|---|
| |
2019 | 2018 | 2017 | |||
Total investment income |
$197,945 | $99,294 | $24,605 | |||
Total expenses, net of fee waivers |
113,078 | 43,364 | 10,396 | |||
| | | | | | | |
Net investment income before taxes |
84,867 | 55,930 | 14,209 | |||
Less Income taxes, including excise tax |
— | — | 5 | |||
| | | | | | | |
Net investment income |
84,867 | 55,930 | 14,204 | |||
Net realized gain (loss) |
7,785 | (6,485) | (52) | |||
Net unrealized appreciation (depreciation) |
5,433 | (22,800) | 5,148 | |||
| | | | | | | |
Net increase in net assets resulting from operations |
$98,085 | $26,645 | $19,300 | |||
| | | | | | | |
| | | | | | | |
| | | | | | | |
Net increase in net assets resulting from operations can vary from period to period as a result of various factors, including additional financing, new investment commitments, the recognition of realized gains and losses and changes in unrealized appreciation and depreciation on the investment portfolio. Due to these factors, comparisons may not be meaningful.
Investment Income
| |
For the Year Ended December 31, | |||||
|---|---|---|---|---|---|---|
| |
2019 | 2018 | 2017 | |||
Interest income |
$180,395 | $73,363 | $24,435 | |||
Dividend income |
16,741 | 25,386 | — | |||
Other income |
809 | 545 | 170 | |||
| | | | | | | |
Total investment income |
$197,945 | $99,294 | $24,605 | |||
| | | | | | | |
| | | | | | | |
| | | | | | | |
Interest income from investments, which includes interest and accretion of discounts and fees, increased to $180.4 million for the year ended December 31, 2019 from $73.4 million for the year ended December 31, 2018, primarily due to the growth of our investment portfolio. Our investment portfolio at amortized cost increased to $2,537.3 million from $1,753.1 million for the years ended December 31, 2019 and 2018, respectively. Dividend income decreased to $16.7 million for the year ended December 31, 2019 from $25.4 million for the year ended December 31, 2018, primarily due to the closing of the ABCS distribution transaction on April 30, 2019. As of December 31, 2019, the weighted average yield of our investment portfolio decreased to 7.8% from 8.8% as of December 31, 2018, at amortized cost. Interest income from investments, which includes interest and accretion of discounts and fees, increased to $73.4 million for the year ended December 31, 2018 from $24.4 million for the year ended December 31, 2017, primarily due to the growth of our investment portfolio. Our investment portfolio at amortized cost increased to $1,753.1 million from $821.3 million for the years ended December 31, 2018 and 2017, respectively. Dividend income increased to $25.4 million for the year ended December 31, 2018, primarily due to the growth in our joint venture, ABCS. As of December 31, 2018, the weighted average yield of our investment portfolio increased to 8.8% from 8.3% as of December 31, 2017, at amortized cost.
108
Operating Expenses
The composition of our operating expenses for the years ended December 31, 2019, 2018 and 2017 were as follows (dollars in thousands):
| |
For the Year Ended December 31, | |||||
|---|---|---|---|---|---|---|
| |
2019 | 2018 | 2017 | |||
Interest and debt financing expenses |
$66,330 | $24,011 | $3,615 | |||
Amortization of deferred offering costs |
— | — | 330 | |||
Base management fee |
32,702 | 17,544 | 5,898 | |||
Incentive fee |
17,418 | 8,670 | 764 | |||
Professional fees |
2,297 | 2,639 | 1,777 | |||
Directors fees |
546 | 278 | 275 | |||
Other general and administrative expenses |
4,772 | 902 | 686 | |||
| | | | | | | |
Total expenses, before fee waivers |
$124,065 | $54,044 | $13,345 | |||
Base management fee waiver |
(8,242) | (8,772) | (2,949) | |||
Incentive fee waiver |
(2,745) | (1,908) | — | |||
| | | | | | | |
Total expenses, net of fee waivers |
$113,078 | $43,364 | $10,396 | |||
| | | | | | | |
| | | | | | | |
| | | | | | | |
Interest and Debt Financing Expenses
Interest and debt financing expenses on our borrowings totaled approximately $66.3 million and $24.0 million for the years ended December 31, 2019 and 2018, respectively. Interest and debt financing expense for the year ended December 31, 2019 as compared to December 31, 2018, increased primarily due to higher principal balances outstanding on our revolving credit facilities throughout 2019 and the issuance of our 2019-1 Debt in August 2019. On April 30, 2019, the Company entered into a new loan and security agreement with JPMorgan Chase Bank, N.A., and Wells Fargo Bank, N.A., the JPM Credit Facility.
Interest and debt financing expenses on our borrowings totaled approximately $24.0 million and $3.6 million for the years ended December 31, 2018 and 2017, respectively. Interest and debt financing expense for the year ended December 31, 2018 as compared to December 31, 2017, increased primarily due to higher principal balances outstanding of our revolving credit facilities, the issuance of our 2018-1 Notes, and an increase in the average LIBOR rate. Our SMBC Revolving Credit Facility was terminated on November 21, 2018.
The weighted average interest rate (excluding deferred upfront financing costs and unused fees) on our debt outstanding was 4.7% and 4.3% as of December 31, 2019 and 2018, respectively.
Management Fees
Management fee (net of waivers) increased to $24.5 million for the year ended December 31, 2019 from $8.8 million for the year ended December 31, 2018. Management fees increased to $32.7 million for the year ended December 31, 2019 from $17.5 million for the year ended December 31, 2018, primarily due to an increase in assets to $2.6 billion as of December 31, 2019 from $1.8 billion as of December 31, 2018. Management fees waived for the years ended December 31, 2019 and 2018, were $8.2 million and $8.8 million, respectively.
Management fee (net of waivers) increased to $8.8 million for the year ended December 31, 2018 from $2.9 million for the year ended December 31, 2017. Management fees increased to $17.5 million for
109
the year ended December 31, 2018 from $5.9 million for the year ended December 31, 2017, primarily due to an increase in assets to $1.8 billion as of December 31, 2018 from $1.0 billion as of December 31, 2017. Management fees waived for the years ended December 31, 2018 and 2017, were $8.8 million and $2.9 million, respectively.
Incentive Fees
Incentive fee (net of waivers) increased to $14.7 million for the year ended December 31, 2019 from $6.8 million for the year ended December 31, 2018. Incentive fee waivers related to pre-incentive fee net investment income consisted of voluntary waivers of $2.7 million for the year ended December 31, 2019 and $1.9 million for the year ended December 31, 2018. For the year ended December 31, 2019 there were no incentive fees related to the GAAP Incentive Fee.
Incentive fee (net of waivers) increased to $6.8 million for the year ended December 31, 2018 from $0.8 million for the year ended December 31, 2017. Incentive Fee waivers related to pre-Incentive fee net investment income consisted of voluntary waivers of $1.9 million for the year ended December 31, 2018 and $0.0 million for December 31, 2017. For the year ended December 31, 2018 there was a reduction of $1.0 million in incentive fees related to the GAAP incentive fee, which is included in incentive fees on the consolidated statements of operations.
Professional Fees and Other General and Administrative Expenses
Professional fees and other general and administrative expenses increased to $7.6 million for the year ended December 31, 2019 from $3.8 million for the year ended December 31, 2018, due to an increase in costs associated with servicing our investment portfolio.
Professional fees and other general and administrative expenses increased to $3.8 million for the year ended December 31, 2018 from $2.7 million for the year ended December 31, 2017, due to an increase in costs associated with servicing our investment portfolio.
110
Net Realized and Unrealized Gains and Losses
The following table summarizes our net realized and unrealized gains (losses) for the years ended December 31, 2019, 2018, and 2017 (dollars in thousands):
| |
Year ended December 31, | |||||
|---|---|---|---|---|---|---|
| |
2019 | 2018 | 2017 | |||
Net realized gains on investments |
$2,682 | $2,033 | $176 | |||
Net realized losses on investments |
(5,904) | (5,378) | (121) | |||
Net realized gains on foreign currency transactions |
119 | 135 | 679 | |||
Net realized losses on foreign currency transactions |
(155) | (624) | (564) | |||
Net realized gains on forward currency exchange contracts |
11,043 | — | — | |||
Net realized losses on forward currency exchange contracts |
— | (2,651) | (222) | |||
| | | | | | | |
Net realized gains (losses) |
$7,785 | $(6,485) | $(52) | |||
| | | | | | | |
| | | | | | | |
| | | | | | | |
Change in unrealized gains on investments |
$47,990 |
$4,210 |
$10,415 |
|||
Change in unrealized losses on investments |
(32,887) | (39,836) | (1,790) | |||
| | | | | | | |
Net change in unrealized gains (losses) on investments |
15,103 | (35,626) | 8,625 | |||
Unrealized appreciation (depreciation) on foreign currency translation |
(130) | — | 28 | |||
Unrealized appreciation (depreciation) on forward currency exchange contracts |
(9,540) | 12,826 | (3,505) | |||
| | | | | | | |
Net change in unrealized gains (losses) on foreign currency and forward currency exchange contracts |
(9,670) | 12,826 | (3,477) | |||
| | | | | | | |
Net change in unrealized gains (losses) |
$5,433 | $(22,800) | $5,148 | |||
| | | | | | | |
| | | | | | | |
| | | | | | | |
For the years ended December 31, 2019, 2018 and 2017, we had net realized gains (losses) on investments of ($3.2) million, ($3.3) million and $0.1 million, respectively. For the years ended December 31, 2019, 2018 and 2017, we had net realized gains (losses) on foreign currency transactions of ($0.0) million, ($0.5) million and $0.1 million, respectively. For the years ended December 31, 2019, 2018 and 2017, we had net realized gains (losses) on forward currency contracts of $11.0 million, ($2.7) million and ($0.2) million, respectively, primarily as a result of settling GBP, AUD, DKK, EUR and NOK forward contracts.
For the year ended December 31, 2019, we had $48.0 million in unrealized appreciation on 98 portfolio company investments, which was offset by $32.9 million in unrealized depreciation on 57 portfolio company investments. Unrealized appreciation for the year ended December 31, 2019 resulted from an increase in fair value, primarily due to reversal of prior period unrealized depreciation and positive valuation adjustments.
For the year ended December 31, 2018, we had $4.2 million in unrealized appreciation on 24 portfolio company investments, which was offset by $39.8 million in unrealized depreciation on 108 portfolio company investments. Unrealized depreciation for the year ended December 31, 2018 resulted from a decrease in fair value, primarily due to reversal of prior period unrealized appreciation and widening credit spreads.
For the year ended December 31, 2017, we had $10.4 million in unrealized appreciation on 52 portfolio company investments, which was offset by $1.8 million in unrealized depreciation on 20 portfolio
111
company investments. Unrealized appreciation for the year ended December 31, 2017 resulted from an increase in fair value, primarily due to positive valuation adjustments.
For the years ended December 31, 2019, 2018 and 2017, we had unrealized appreciation (depreciation) on forward currency exchange contracts of ($9.5) million, $12.8 million and ($3.5) million, respectively. For the year ended December 31, 2019, unrealized depreciation on forward currency exchange contracts was due to EUR, GBP, DKK, NOK and AUD forward contracts. For the year ended December 31, 2018, unrealized depreciation on forward currency exchange contracts was due to EUR, GBP, DKK, NOK and AUD forward contracts. For the year ended December 31, 2017, unrealized depreciation on forward currency exchange contracts were due to EUR and GBP forward contracts.
The following table summarizes the impact of foreign currency for the years ended December 31, 2019, 2018, and 2017 (dollars in thousands):
| |
For the Year ended December 31, | |||||
|---|---|---|---|---|---|---|
| |
2019 | 2018 | 2017 | |||
Net change in unrealized appreciation (depreciation) on investments due to foreign currency |
$2,760 | $(7,404) | $4,024 | |||
Net realized gain on investments due to foreign currency |
91 | 40 | 9 | |||
Net change in unrealized appreciation (depreciation) on foreign currency translation |
(130) | — | 28 | |||
Net realized gain (loss) on foreign currency transactions |
(36) | (489) | 115 | |||
Net change in unrealized appreciation (depreciation) on forward currency exchange contracts |
(9,540) | 12,826 | (3,505) | |||
Net realized gain (loss) on forward currency exchange contracts |
11,043 | (2,651) | (222) | |||
| | | | | | | |
Foreign currency impact to net increase in net assets resulting from operations |
$4,188 | $2,322 | $449 | |||
| | | | | | | |
| | | | | | | |
| | | | | | | |
Included in total net gains (losses) on the consolidated statements of operations is net gains (losses) of $2.7 million, ($7.9) million and $4.2 million related to realized and unrealized gains and losses on investments, foreign currency holdings and non-investment assets and liabilities attributable to the changes in foreign currency exchange rates for the years ended December 31, 2019, 2018 and 2017, respectively. Including the total net realized and unrealized gains (losses) on forward currency exchange contracts of $1.5 million, $10.2 million and ($3.7) million, respectively, included in the above table, the net impact of foreign currency on total net gains (losses) on the consolidated statements of operations is $4.2 million, $2.3 million and $0.4 million for the years ended December 31, 2019, 2018 and 2017, respectively.
Net Increase (Decrease) in Net Assets Resulting from Operations
For the years ended December 31, 2019, 2018 and 2017, the net increase in net assets resulting from operations was $98.1 million, $26.6 million and $19.3 million, respectively. Based on the weighted average shares of common stock outstanding for the years ended December 31, 2019, 2018 and 2017, our per share net increase in net assets resulting from operations was $1.90, $0.69, and $0.99, respectively.
Financial Condition, Liquidity and Capital Resources
Our liquidity and capital resources are derived primarily from proceeds from equity issuances, advances from our credit facilities, 2018-1 Notes, 2019-1 Debt, and cash flows from operations. The
112
primary uses of our cash are for (1) investments in portfolio companies and other investments and to comply with certain portfolio diversification requirements; (2) the cost of operations (including payments to the Advisor under the Investment Advisory and Administration Agreements); (3) debt service, repayment, and other financing costs; and, (4) cash distributions to the holders of our common shares.
We intend to continue to generate cash primarily from cash flows from operations, future borrowings and future offerings of securities. We may from time to time enter into additional debt facilities, increase the size of existing facilities or issue debt securities. Any such incurrence or issuance would be subject to prevailing market conditions, our liquidity requirements, contractual and regulatory restrictions and other factors. We are required to meet an asset coverage ratio, defined under the 1940 Act as the ratio of our total assets (less all liabilities and indebtedness not represented by senior securities) to our outstanding senior securities, of at least 150% after each issuance of senior securities. As of December 31, 2019 and 2018, our asset coverage ratio was 164% and 257%, respectively.
At December 31, 2019 and December 31, 2018, we had $68.8 million and $33.3 million in cash, foreign cash, restricted cash and cash equivalents, respectively.
At December 31, 2019 we had approximately $232.0 million of availability on our BCSF Revolving Credit Facility and $119.8 million of availability on our JPM Credit Facility, subject to existing terms and regulatory requirements. At December 31, 2018 we had approximately $228.7 million of availability on our BCSF Revolving Credit Facility, subject to existing terms and regulatory requirements.
For the year ended December 31, 2019, cash, foreign cash, restricted cash, and cash equivalents increased by $35.6 million. During the year ended December 31, 2019, we used $242.8 million in cash for operating activities, primarily to purchase investments of $1,413.7 million, which was offset by proceeds from principal payments and sales of investments of $1,069.5 million, and a net increase in net assets resulting from operations of $98.1 million. During the year ended December 31, 2019, we generated $278.2 million from financing activities, primarily from borrowings on our debt totaling $1,249.0 million from BCSF Revolving Credit Facility, Citibank Revolving Credit Facility, JPM Credit Facility, and the issuance of our 2019-1 Debt, offset by repayments on our debt of $884.5 million and distributions paid during the period of $81.2 million.
For the year ended December 31, 2018, cash, foreign cash, restricted cash, and cash equivalents decreased by $107.6 million. During the year ended December 31, 2018, we used $774.2 million in cash for operating activities, primarily to purchase investments of $1,064.3 million, offset by a net increase in net assets resulting from operations of $26.6 million, proceeds from principal payments and sales of investments of $236.1 million, and net change in unrealized activity of ($22.8) million. During the year ended December 31, 2018, we generated $667.1 million from financing activities, primarily from borrowings on our SMBC Revolving Credit Facility and our BCSF Revolving Credit Facility, together referred to as the "Revolving Credit Facilities", of $453.0 million, issuance of our 2018-1 Notes of $365.7 million and the issuance of common stock of $524.3 million, offset by repayments on our Revolving Credit Facilities of $632.7 million and distributions paid during the year of $41.0 million.
For the year ended December 31, 2017, cash, foreign cash and cash equivalents increased by $74.2 million. During the year ended December 31, 2017, we used $697.4 million in cash for operating activities, primarily to purchases investments of $781.2, offset by a net increase in net assets resulting from operations of $19.3 million and proceeds from principal payments and sales of investments of $73.1 million. During the year ended December 31, 2017, we generated $770.9 million from financing activities, primarily from borrowings on our Revolving Credit Facilities of $545.9 million and the issuance of common stock of $392.7 million, offset by repayments on our Revolving Credit Facilities of $154.6 million.
113
Equity
On November 19, 2018, we closed our initial public offering (the "IPO") issuing 7,500,000 shares of its common stock at a public offering price of $20.25 per share. Shares of common stock of the Company began trading on the New York Stock Exchange under the symbol "BCSF" on November 15, 2018. The offering generated net proceeds, after expenses, of $145.4 million. All outstanding capital commitments from the Company's Private Offering, were cancelled as of the completion of the IPO.
BCSF Investments, LLC and certain individuals adopted the 10b5-1 Plan in accordance with Rules 10b5-1 and 10b-18 under the Exchange Act, under which such parties will buy up to $20 million in the aggregate of our common stock in the open market during the period beginning after four full calendar weeks after the closing of the IPO and ending on the earlier of the date on which the capital committed to the 10b5-1 has been exhausted or one year after the closing of the IPO. For the year ended December 31, 2019, 827,933 shares have been purchased under the 10b5-1 Plan at a weighted average price of $18.78, for a total cost of $15.6 million, inclusive of commissions. As of December 31, 2019, zero dollars remain under the 10b5-1 Plan and no further purchases are intended under the 10b5-1 Plan.
During the year ended December 31, 2019, we issued 167,674.81 shares of our common stock to investors who have opted into our dividend reinvestment plan. During the year ended December 31, 2018, we issued 436,914.94 shares of our common stock to investors who have opted into our dividend reinvestment plan. During the year ended December 31, 2017, we issued 72,700.50 shares of our common stock to investors who have opted into our dividend reinvestment plan.
On May 7, 2019, the Company's Board of Directors authorized the Company to repurchase up to $50 million of its outstanding common stock in accordance with safe harbor rules under the Securities Exchange Act of 1934. Any such repurchases will depend upon market conditions and there is no guarantee that the Company will repurchase any particular number of shares or any shares at all. As of December 31, 2019, there have been no repurchases of common stock.
Debt
Debt consisted of the following as of December 31, 2019, and December 31, 2018 (dollars in thousands):
| |
As of December 31, 2019 | As of December 31, 2018 | |||||||||||||||||
|---|---|---|---|---|---|---|---|---|---|---|---|---|---|---|---|---|---|---|---|
| |
Total Aggregate Principal Amount Committed |
Principal Amount Outstanding |
Carrying Value (1) |
Total Aggregate Principal Amount Committed |
Principal Amount Outstanding |
Carrying Value (1) |
|||||||||||||
BCSF Revolving Credit Facility |
$ | 500,000 | $ | 268,015 | $ | 268,015 | $ | 500,000 | $ | 271,265 | $ | 271,265 | |||||||
2018-1 Notes |
365,700 | 365,700 | 363,832 | 365,700 | 365,700 | 363,660 | |||||||||||||
JPM Credit Facility |
666,581 | 546,754 | 546,754 | — | — | — | |||||||||||||
2019-1 Debt |
398,750 | 398,750 | 396,034 | — | — | — | |||||||||||||
| | | | | | | | | | | | | | | | | | | | |
Total Debt |
$ | 1,931,031 | $ | 1,579,219 | $ | 1,574,635 | $ | 865,700 | $ | 636,965 | $ | 634,925 | |||||||
| | | | | | | | | | | | | | | | | | | | |
| | | | | | | | | | | | | | | | | | | | |
| | | | | | | | | | | | | | | | | | | | |
- (1)
- Carrying value represents aggregate principal amount outstanding less unamortized debt issuance costs
SMBC Revolving Credit Agreement
On November 21, 2018, the SMBC Revolving Credit Facility was terminated. The proceeds from the initial public offering on November 15, 2018, were used to repay the total outstanding debt.
114
For the years ended December 31, 2019, 2018 and 2017, the components of interest expense related to the SMBC Revolving Credit Facility were as follows (dollars in thousands):
| |
For the Year Ended December 31, | |||||||||
|---|---|---|---|---|---|---|---|---|---|---|
| |
2019 | 2018 | 2017 | |||||||
Borrowing interest expense |
$ | — | $ | 3,334 | $ | 673 | ||||
Unused facility fee |
— | 22 | 254 | |||||||
Amortization of deferred financing costs and upfront commitment fees |
— | 723 | 366 | |||||||
| | | | | | | | | | | |
Total interest and debt financing expenses |
$ | — | $ | 4,079 | $ | 1,293 | ||||
| | | | | | | | | | | |
| | | | | | | | | | | |
| | | | | | | | | | | |
BCSF Revolving Credit Facility
On October 4, 2017, we entered into the revolving credit agreement (the "BCSF Revolving Credit Facility") with us, as equity holder, BCSF I, LLC, a Delaware limited liability company and a wholly owned and consolidated subsidiary of the Company, as borrower, and Goldman Sachs Bank USA, as sole lead arranger ("Goldman Sachs"). The BCSF Revolving Credit Facility was subsequently amended on May 15, 2018 to reflect certain clarifications regarding margin requirements and hedging currencies. The maximum commitment amount under the BCSF Revolving Credit Facility is $500.0 million and may be increased up to $750.0 million. Proceeds of the loans under the BCSF Revolving Credit Facility may be used to acquire certain qualifying loans and such other uses as permitted under the BCSF Revolving Credit Facility. The BCSF Revolving Credit Facility includes customary affirmative and negative covenants, including certain limitations on the incurrence of additional indebtedness and liens, as well as usual and customary events of default for revolving credit facilities of this nature.
Assets that are pledged as collateral for the BCSF Revolving Credit Facility are not directly available to the creditors of the Company to satisfy any obligations of the Company other than the Company's obligations under the BCSF Revolving Credit Facility.
Borrowings under the BCSF Revolving Credit Facility bear interest at LIBOR plus a margin. As of December 31, 2019 and December 31, 2018, the BCSF Revolving Credit Facility was accruing interest expense at a rate of LIBOR plus 2.50%. We pay an unused commitment fee of 30 basis points (0.30%) per annum. Interest is payable quarterly in arrears. Any amounts borrowed under the BCSF Revolving Credit Facility, and all accrued and unpaid interest, will be due and payable, on the earliest of: (a) October 5, 2022 and (b) the date upon which all loans shall become due and payable in full, whether by acceleration or otherwise.
As of December 31, 2019 and December 31, 2018 there were $268.0 million and $271.3 million borrowings under the BCSF Revolving Credit Facility, respectively and we were in compliance with the terms of the BCSF Revolving Credit Facility.
115
For the years ended December 31, 2019, 2018 and 2017, the components of interest expense related to the BCSF Revolving Credit Facility were as follows (dollars in thousands):
| |
For the Year Ended December 31, | |||||
|---|---|---|---|---|---|---|
| |
2019 | 2018 | 2017 | |||
Borrowing interest expense |
$17,566 | $13,975 | $1,705 | |||
Unused facility fee |
456 | 624 | 241 | |||
Amortization of deferred financing costs and upfront commitment fees |
1,067 | 1,068 | 376 | |||
| | | | | | | |
Total interest and debt financing expenses |
$19,089 | $15,667 | $2,322 | |||
| | | | | | | |
| | | | | | | |
| | | | | | | |
2018-1 Notes
On September 28, 2018, (the "2018-1 Closing Date"), we, through BCC Middle Market CLO 2018-1 LLC (the "2018-1 Issuer"), a Delaware limited liability company and a wholly owned and consolidated subsidiary of us, completed its $451.2 million term debt securitization (the "CLO Transaction"). The notes issued in connection with the CLO Transaction (the "2018-1 Notes") are secured by a diversified portfolio of the 2018-1 Issuer consisting primarily of middle market loans and participation interests in middle market loans, the majority of which are senior secured loans (the "2018-1 Portfolio"). At the 2018-1 Closing Date, the 2018-1 Portfolio was comprised of assets transferred from the Company and its consolidated subsidiaries. All transfers were eliminated in consolidation and there were no realized gains or losses recognized in the CLO Transaction.
The CLO Transaction was executed through a private placement of the following 2018-1 Notes (dollars in thousands):
| 2018-1 Notes | Principal Amount |
Spread above Index | Interest rate at December 31, 2019 |
||||||
|---|---|---|---|---|---|---|---|---|---|
Class A-1 A |
$ | 205,900 | 1.55% + 3 Month LIBOR | 3.52 | % | ||||
Class A-1 B |
45,000 | 1.50% + 3 Month LIBOR (first 24 months) | 3.47 | % | |||||
|
1.80% + 3 Month LIBOR (thereafter) | ||||||||
Class A-2 |
55,100 | 2.15% + 3 Month LIBOR | 4.12 | % | |||||
Class B |
29,300 | 3.00% + 3 Month LIBOR | 4.97 | % | |||||
Class C |
30,400 | 4.00% + 3 Month LIBOR | 5.97 | % | |||||
| | | | | | | | | | |
Total 2018-1 Notes |
365,700 | ||||||||
| | | | | | | | | | |
Membership Interests |
85,450 | Non-interest bearing | Not applicable | ||||||
| | | | | | | | | | |
Total |
$ | 451,150 | |||||||
| | | | | | | | | | |
| | | | | | | | | | |
| | | | | | | | | | |
The Class A-1 A, A-1 B, A-2, B and C 2018-1 Notes were issued at par and are scheduled to mature on October 20, 2030. The Company received 100% of the membership interests (the "Membership Interests") in the 2018-1 Issuer in exchange for its sale to the 2018-1 Issuer of the initial closing date loan portfolio. The Membership Interests do not bear interest.
The Class A-1 A, A-1 B, A-2, B and C 2018-1 Notes are included in the consolidated financial statements. The Membership Interests are eliminated in consolidation.
The Company serves as portfolio manager of the 2018-1 Issuer pursuant to a portfolio management agreement between the Company and the 2018-1 Issuer. For so long as the Company serves
116
as portfolio manager, the Company will not charge any management fee or subordinated interest to which it may be entitled.
During the reinvestment period (four years from the closing date of the CLO Transaction), pursuant to the indenture governing the 2018-1 Notes, all principal collections received on the underlying collateral may be used by the 2018-1 Issuer to purchase new collateral under the direction of the Company in its capacity as portfolio manager of the 2018-1 Issuer and in accordance with the 2018-1 Issuer's investment strategy and the terms of the indenture.
The Company has agreed to hold on an ongoing basis the Membership Interests with an aggregate dollar purchase price of at least equal to 5% of the aggregate amount of all obligations issued by the 2018-1 Issuer for so long as the 2018-1 Notes remain outstanding.
The 2018-1 Issuer pays ongoing administrative expenses to the trustee, independent accountants, legal counsel, rating agencies and independent managers in connection with developing and maintaining reports, and providing required services in connection with the administration of the 2018-1 Issuer.
As of December 31, 2019, there were 61 first lien and second lien senior secured loans with a total fair value of approximately $435.8 million and cash of $9.1 million securing the 2018-1 Notes. As of December 31, 2018, there were 75 first lien and second lien senior secured loans with a total fair value of approximately $437.2 million and cash of $18.0 million securing the 2018-1 Notes. Assets that are pledged as collateral for the 2018-1 Notes are not directly available to the creditors of the Company to satisfy any obligations of the Company other than the Company's obligations under the indenture governing the 2018-1 Notes. Such assets are included in the Company's consolidated financial statements. The creditors of the 2018-1 Issuer have received security interests in such assets and such assets are not intended to be available to the creditors of the Company (or an affiliate of the Company). The 2018-1 Portfolio must meet certain requirements, including asset mix and concentration, term, agency rating, collateral coverage, minimum coupon, minimum spread and sector diversity requirements in the indenture governing the 2018-1 Notes. As of December 31, 2019 and December 31, 2018, the Company was in compliance with its covenants related to the 2018-1 Notes.
Costs of $2.1 million were incurred in connection with debt securitization of the 2018-1 Notes by the 2018-1 Issuer which have been recorded as debt issuance costs and presented as a reduction to the outstanding principal amount of the 2018-1 Notes on the consolidated statements of assets and liabilities and are being amortized over the life of the 2018-1 Issuer using the effective interest method. The balance of the unamortized deferred financing costs related to the 2018-1 Issuer was $1.9 million and $2.0 million as of December 31, 2019 and December 31, 2018, respectively.
For the years ended December 31, 2019, 2018 and 2017, the components of interest expense related to the 2018-1 Issuer were as follows (dollars in thousands):
| |
For the Year Ended December 31, | |||||
|---|---|---|---|---|---|---|
| |
2019 | 2018 | 2017 | |||
Borrowing interest expense |
$16,226 | $4,221 | $— | |||
Amortization of deferred financing costs and upfront commitment fees |
174 | 44 | — | |||
| | | | | | | |
Total interest and debt financing expenses |
$16,400 | $4,265 | $— | |||
| | | | | | | |
| | | | | | | |
| | | | | | | |
117
Citibank Revolving Credit Facility
On February 19, 2019, the Company entered into a credit and security agreement (the "Credit Agreement" or the "Citibank Revolving Credit Facility") with the Company as equity holder and servicer, BCSF II-C, LLC as Borrower, Citibank, N.A., as Administrative Agent, and Wells Fargo Bank, National Association as Collateral Administrator, Collateral Agent and Custodian. The Credit Agreement is effective as of February 19, 2019.
The facility amount under the Credit Agreement is $350.0 million. Proceeds of the loans under the Credit Agreement may be used to acquire certain qualifying loans and such other uses as permitted under the Credit Agreement. The period from the closing date until February 19, 2020 is referred to as the reinvestment period and during such reinvestment period, the Borrower may request drawdowns under the Credit Agreement. The final maturity date is the earliest of: (a) the business day designated by the Borrower as the final maturity date upon not less than three business days' prior written notice to the Administrative Agent, the Collateral Agent, the Lenders, the Custodian and the Collateral Administrator, (b) February 19, 2022 and (c) the date on which the Administrative Agent provides notice of the declaration of the final maturity date after the occurrence of an event of default. The Credit Agreement includes customary affirmative and negative covenants, including certain limitations on the incurrence of additional indebtedness and liens, as well as usual and customary events of default for revolving credit facilities of this nature.
Borrowings under the Citibank Revolving Credit Facility bear interest at the London Interbank Offered Rate ("LIBOR") plus a margin. During the period prior to the last day of the reinvestment period, borrowings under the Credit Agreement will bear interest at a rate equal to the three-month LIBOR plus 1.60%. Commencing on the last day of the reinvestment period, the interest rate on borrowings under the Credit Agreement will reset to three month LIBOR plus 2.60% for the remaining term of the Credit Agreement. We pay an unused commitment fee based on a corresponding utilization rate; (i) 0 basis points (0.00%) per annum when greater than or equal to 85.0% utilization, (ii) 25 basis points (0.25%) per annum when greater than or equal to 75.0% but less than 85.0% utilization, (iii) 50 basis points (0.50%) per annum when greater than or equal to 50.0% but less than 75.0% utilization, (iv) 75 basis points (0.75%) per annum when greater than or equal to 25.0% but less than 50% utilization, or (v) 100 basis points (1.00%) per annum when less than 25.0% utilization.
On August 28, 2019, the Citibank Revolving Credit Facility was terminated. The proceeds from the 2019-1 Debt were used to repay the total outstanding debt.
For the years ended December 31, 2019, 2018 and 2017, the components of interest expense related to the Citibank Revolving Credit Facility were as follows (dollars in thousands):
| |
For the Year Ended December 31, | |||||
|---|---|---|---|---|---|---|
| |
2019 | 2018 | 2017 | |||
Borrowing interest expense |
$4,104 | $— | $— | |||
Unused facility fee |
357 | — | — | |||
Amortization of deferred financing costs and upfront commitment fees |
124 | — | — | |||
| | | | | | | |
Total interest and debt financing expenses |
$4,585 | $— | $— | |||
| | | | | | | |
| | | | | | | |
| | | | | | | |
118
On April 30, 2019, the Company entered into a loan and security agreement (the "JPM Credit Agreement" or the "JPM Credit Facility") as Borrower, with JPMorgan Chase Bank, National Association, as Administrative Agent, and Wells Fargo Bank, National Association as Collateral Administrator, Collateral Agent, Securities Intermediary and Bank.
The facility amount under the JPM Credit Agreement is $666.6 million. Proceeds of the loans under the JPM Credit Facility may be used to acquire certain qualifying loans and such other uses as permitted under the JPM Credit Agreement. The period from the effective date until November 29, 2020 is referred to as the reinvestment period and during such reinvestment period, the Borrower may request drawdowns under the JPM Credit Facility.
The maturity date is the earliest of: (a) November 29, 2022, (b) the date on which the secured obligations become due and payable following the occurrence of an event of default, (c) the date on which the advances are repaid in full and (d) the date after a market value cure failure occurs on which all portfolio investments have been sold and proceeds therefrom have been received by the Borrower. The stated maturity date of November 29, 2022 may be extended for successive one year periods by mutual agreement of the Borrower and the Administrative Agent.
The JPM Credit Agreement includes customary affirmative and negative covenants, including certain limitations on the incurrence of additional indebtedness and liens, as well as usual and customary events of default for revolving credit facilities of this nature. As of December 31, 2019, the Company was in compliance with its covenants related to the JPM Credit Facility.
Borrowings under the JPM Credit Facility bear interest at LIBOR plus a margin. As of December 31, 2019, JPM Credit Facility was accruing interest expense at a rate of LIBOR plus 2.75%. We pay an unused commitment fee of 75 basis points (0.75%) per annum. Interest is payable quarterly in arrears.
As of December 31, 2019, there were $546.8 million borrowings under the JPM Credit Facility.
For the years ended December 31, 2019, 2018 and 2017, the components of interest expense related to the JPM Credit Facility were as follows (dollars in thousands):
| |
For the Year Ended December 31, | |||||
|---|---|---|---|---|---|---|
| |
2019 | 2018 | 2017 | |||
Borrowing interest expense |
$19,679 | $— | $— | |||
Unused facility fee |
464 | — | — | |||
Amortization of deferred financing costs and upfront commitment fees |
53 | — | — | |||
| | | | | | | |
Total interest and debt financing expenses |
$20,196 | $— | $— | |||
| | | | | | | |
| | | | | | | |
| | | | | | | |
On August 28, 2019, the Company, through BCC Middle Market CLO 2019-1 LLC (the "2019-1 Issuer"), a Cayman Islands limited liability company and a wholly-owned and consolidated subsidiary of the Company, and BCC Middle Market CLO 2019-1 Co-Issuer, LLC (the "Co-Issuer" and, together with the Issuer, the "Co-Issuers"), a Delaware limited liability company, completed its $501.0 million term debt securitization (the "2019-1 CLO Transaction"). The notes issued in connection with the 2019-1 CLO
119
Transaction (the "2019-1 Notes") are secured by a diversified portfolio of the Co-Issuers consisting primarily of middle market loans and participation interests in middle market loans, the majority of which are senior secured loans (the "2019-1 Portfolio"). The Co-Issuers also issued Class A-1L Loans (the "Loans" and, together with the 2019-1 Notes, the "2019-1 Debt"). The Loans are also secured by the 2019-1 Portfolio. At the 2019-1 closing date, the 2019-1 Portfolio was comprised of assets transferred from the Company and its consolidated subsidiaries. All transfers were eliminated in consolidation and there were no realized gains or losses recognized in the 2019-1 CLO Transaction.
The 2019-1 CLO Transaction was executed through a private placement of the following 2019-1 Debt:
| 2019-1 Debt | Principal Amount |
Spread above Index | Interest rate at December 31, 2019 | ||||||
|---|---|---|---|---|---|---|---|---|---|
Class A-1L |
$ | 50,000 | 1.70% + 3 Month LIBOR | 3.70 | % | ||||
Class A-1 |
222,500 | 1.70% + 3 Month LIBOR | 3.70 | % | |||||
Class A-2A |
50,750 | 2.70% + 3 Month LIBOR | 4.70 | % | |||||
Class A-2B |
13,000 | 4.23% (Fixed) | 4.23 | % | |||||
Class B |
30,000 | 3.60% + 3 Month LIBOR | 5.60 | % | |||||
Class C |
32,500 | 4.75% + 3 Month LIBOR | 6.75 | % | |||||
| | | | | | | | | | |
Total 2019-1 Debt |
398,750 | ||||||||
| | | | | | | | | | |
Membership Interests |
102,250 | Non-interest bearing | Not applicable | ||||||
| | | | | | | | | | |
Total |
$ | 501,000 | |||||||
| | | | | | | | | | |
| | | | | | | | | | |
| | | | | | | | | | |
The Loans and the Class A-1, A-2A, A-2B, and B Notes were issued at par. The Class C Notes were issued at a discount. The Notes are scheduled to mature on October 15, 2031. The Company received 100% of the membership interests (the "Membership Interests") in the 2019-1 Issuer in exchange for its sale to the 2019-1 Issuer of the initial closing date loan portfolio. The Membership Interests do not bear interest.
The Loans and Class A-1, A-2A, A-2B, B, and C Notes are included in the consolidated financial statements of the Company. The Membership Interests are eliminated in consolidation.
The Company serves as portfolio manager of the 2019-1 Issuer pursuant to a portfolio management agreement between the Company and the 2019-1 Issuer. For so long as the Company serves as portfolio manager, the Company will not charge any management fee or subordinated interest to which it may be entitled.
During the reinvestment period, pursuant to the indenture and loan agreement governing the 2019-1 Notes and Loans, respectively, all principal collections received on the underlying collateral may be used by the 2019-1 Issuer to purchase new collateral under the direction of the Company in its capacity as portfolio manager of the 2019-1 Issuer and in accordance with the 2019-1 Issuer investment strategy and the terms of the indenture and loan agreement, as applicable.
The Company has agreed to hold on an ongoing basis the Membership Interests with an aggregate dollar purchase price at least equal to 5% of the aggregate amount of all obligations issued by the 2019-1 Co-Issuers for so long as the 2019-1 Debt remains outstanding.
The 2019-1 Issuer pays ongoing administrative expenses to the trustee, independent accountants, legal counsel, rating agencies and independent managers in connection with developing and maintaining reports, and providing required services in connection with the administration of the 2019-1 Issuer.
120
As of December 31, 2019, there were 65 first lien and second lien senior secured loans with a total fair value of approximately $471.3 million and cash of $22.4 million securing the 2019-1 Debt. Assets that are pledged as collateral for the 2019-1 Debt are not directly available to the creditors of the Company to satisfy any obligations of the Company other than the Company's obligations under the indenture and loan agreement governing the 2019-1 Debt. The creditors of the 2019-1 Co-Issuers have received security interests in such assets and such assets are not intended to be available to the creditors of the Company (or an affiliate of the Company). The 2019-1 Portfolio must meet certain requirements, including asset mix and concentration, term, agency rating, collateral coverage, minimum coupon, minimum spread and sector diversity requirements in the indenture and loan agreement governing the 2019-1 Debt. As of December 31, 2019, the Company was in compliance with its covenants related to the 2019-1 Debt.
Costs of the offering, including the discount of the Class C Notes, of $2.8 million were incurred in connection with debt securitization of the 2019-1 Debt by the 2019-1 Co-Issuers which have been recorded as debt issuance costs and presented as a reduction to the outstanding principal amount of the 2019-1 Debt on the consolidated statements of assets and liabilities and are being amortized over the life of the 2019-1 Issuer using the effective interest method. The balance of the unamortized deferred financing costs related to the 2019-1 Issuer was $2.7 million as of December 31, 2019. The 2019-1 issuer was not in existence as of December 31, 2018 and the 2019-1 Debt were not outstanding.
For the years ended December 31, 2019, 2018 and 2017, the components of interest expense related to the 2019-1 Co-Issuers were as follows (dollars in thousands):
| |
For the Year Ended December 31, | |||||
|---|---|---|---|---|---|---|
| |
2019 | 2018 | 2017 | |||
Borrowing interest expense |
$5,981 | $— | $— | |||
Amortization of deferred financing costs and upfront commitment fees |
79 | — | — | |||
| | | | | | | |
Total interest and debt financing expenses |
$6,060 | $— | $— | |||
| | | | | | | |
| | | | | | | |
| | | | | | | |
Distribution Policy
The following table summarizes distributions declared during the years ended December 31, 2019, 2018, and 2017:
| Date Declared | Record Date | Payment Date | Amount Per Share |
Total Distributions |
||||
|---|---|---|---|---|---|---|---|---|
May 9, 2017 |
May 12, 2017 | May 19, 2017 | $0.07 | $1,174 | ||||
June 21, 2017 |
June 29, 2017 | August 11, 2017 | $0.11 | $2,740 | ||||
September 27, 2017 |
September 28, 2017 | November 14, 2017 | $0.21 | $5,236 | ||||
December 26, 2017 |
December 28, 2017 | January 24, 2018 | $0.31 | $7,742 | ||||
March 28, 2018 |
March 28, 2018 | May 17, 2018 | $0.34 | $10,610 | ||||
June 28, 2018 |
June 28, 2018 | August 10, 2018 | $0.36 | $13,484 | ||||
September 26, 2018 |
September 26, 2018 | October 19, 2018 | $0.41 | $17,967 | ||||
December 19, 2018 |
December 31, 2018 | January 14, 2019 | $0.41 | $21,108 | ||||
February 21, 2019 |
March 29, 2019 | April 12, 2019 | $0.41 | $21,108 | ||||
May 7, 2019 |
June 28, 2019 | July 29, 2019 | $0.41 | $21,176 | ||||
August 1, 2019 |
September 30, 2019 | October 30, 2019 | $0.41 | $21,176 | ||||
October 31, 2019 |
December 31, 2019 | January 30, 2020 | $0.41 | $21,176 | ||||
| | | | | | | | | |
Total distributions declared |
$3.86 | $164,697 | ||||||
| | | | | | | | | |
| | | | | | | | | |
| | | | | | | | | |
121
Distributions to common stockholders are recorded on the record date. To the extent that we have income available, we intend to distribute quarterly distributions to our stockholders. Our quarterly distributions, if any, will be determined by the Board. Any distributions to our stockholders will be declared out of assets legally available for distribution.
We have elected to be treated, and intend to operate in a manner so as to continuously qualify, as a regulated investment company (a "RIC) under Subchapter M of the Internal Revenue Code of 1986, as amended (the "Code"), beginning with our taxable year ended December 31, 2016. To qualify for and maintain RIC tax treatment, among other things, we must distribute dividends to our stockholders in respect of each taxable year of an amount generally at least equal to 90% of the sum of our net ordinary income and net short-term capital gains in excess of our net long-term capital losses. In order to avoid the imposition of certain excise taxes imposed on RICs, we must distribute dividends to our stockholders in respect of each calendar year of an amount at least equal to the sum of: (1) 98% of our net ordinary income (taking into account certain deferrals and elections) for such calendar year; (2) 98.2% of our capital gains in excess of capital losses, adjusted for certain ordinary losses, generally for the one-year period ending on October 31 of such calendar year; and (3) the sum of any net ordinary income plus capital gains net income for preceding years that were not distributed during such years and on which we paid no federal income tax.
We intend to distribute net capital gains (i.e., net long-term capital gains in excess of net short-term capital losses), if any, at least annually out of the assets legally available for such distributions. However, we may decide in the future to retain all or a portion of our net capital gains for investment, incur a corporate-level tax on such capital gains, and elect to treat such capital gains as deemed distributions to our stockholders.
We have adopted a dividend reinvestment plan that provides for the reinvestment of cash dividends and distributions. Prior to the IPO, stockholders who "opted in" to our dividend reinvestment plan had their cash dividends and distributions automatically reinvested in additional shares of our common stock, rather than receiving cash dividends and distributions. Subsequent to the IPO, stockholders who do not "opt out" of our dividend reinvestment plan will have their cash dividends and distributions automatically reinvested in additional shares of our common stock, rather than receiving cash dividends and distributions. Stockholders could elect to "opt in" or "opt out" of our dividend reinvestment plan in their subscription agreements, through the private offering. The elections of stockholders that make an election prior to the IPO shall remain effective after the IPO.
The U.S. federal income tax characterization of distributions declared and paid for the fiscal year will be determined at fiscal year-end based upon our investment company taxable income for the full fiscal year and distributions paid during the full year.
Commitments and Off-Balance Sheet Arrangements
We may become a party to financial instruments with off-balance sheet risk in the normal course of our business to fund investments and to meet the financial needs of our portfolio companies. These instruments may include commitments to extend credit and involve, to varying degrees, elements of liquidity and credit risk in excess of the amount recognized on the statements of assets and liabilities.
122
As of December 31, 2019, the Company had $215.8 million of unfunded commitments under loan and financing agreements as follows (dollars in thousands):
| |
Expiration Date (1) | Unfunded Commitments (2) | ||||
|---|---|---|---|---|---|---|
First Lien Senior Secured Loans |
||||||
A&R Logistics, Inc. - Revolver |
5/5/2025 | $ | 5,043 | |||
Abracon Group Holding, LLC. - Revolver |
7/18/2024 | 2,833 | ||||
AMI US Holdings Inc. - Revolver |
4/1/2024 | 977 | ||||
Amspec Services, Inc. - Revolver |
7/2/2024 | 3,542 | ||||
Ansira Holdings, Inc. - Delayed Draw |
12/20/2022 | 1,509 | ||||
AP Plastics Group, LLC - Revolver |
8/2/2021 | 8,500 | ||||
Appriss Holdings, Inc. - Revolver |
5/30/2025 | 4,711 | ||||
Aramsco, Inc. - Revolver |
8/28/2024 | 2,766 | ||||
Batteries Plus Holding Corporation - Revolver |
7/6/2022 | 4,250 | ||||
Captain D's LLC - Revolver |
12/15/2023 | 577 | ||||
CB Nike Intermediate Co Ltd - Revolver |
10/31/2025 | 2,878 | ||||
Clinical Innovations, LLC - Revolver |
10/17/2022 | 380 | ||||
CMI Marketing Inc. - Revolver |
5/24/2023 | 2,112 | ||||
CPS Group Holdings, Inc. - Revolver |
3/3/2025 | 4,933 | ||||
Cruz Bay Publishing, Inc. - Delayed Draw |
2/28/2020 | 1,098 | ||||
Cruz Bay Publishing, Inc. - Revolver |
2/28/2020 | 535 | ||||
CST Buyer Company - Revolver |
10/3/2025 | 2,190 | ||||
Datix Bidco Limited - Revolver |
10/28/2024 | 1,290 | ||||
Direct Travel, Inc. - Delayed Draw |
12/1/2021 | 7,030 | ||||
Direct Travel, Inc. - Revolver |
12/1/2021 | 4,250 | ||||
Dorner Manufacturing Corp - Revolver |
3/15/2022 | 1,099 | ||||
Efficient Collaborative Retail Marketing Company, LLC - Revolver |
6/15/2022 | 3,542 | ||||
Element Buyer, Inc. - Delayed Draw |
7/18/2025 | 7,933 | ||||
Element Buyer, Inc. - Revolver |
7/19/2024 | 2,833 | ||||
FFI Holdings I Corp - Delayed Draw |
1/24/2025 | 677 | ||||
FFI Holdings I Corp - Revolver |
1/24/2025 | 1,994 | ||||
Fineline Technologies, Inc. - Revolver |
11/4/2022 | 655 | ||||
Grammer Purchaser, Inc. - Revolver |
9/30/2024 | 998 | ||||
Great Expressions Dental Center PC - Revolver |
9/28/2022 | 150 | ||||
Green Street Parent, LLC - Revolver |
8/27/2025 | 2,419 | ||||
GSP Holdings, LLC - Revolver |
11/6/2025 | 4,307 | ||||
Hightower Holding, LLC - Delayed Draw |
1/31/2025 | 6,640 | ||||
Horizon Telcom, Inc. - Delayed Draw |
6/15/2023 | 1,256 | ||||
Horizon Telcom, Inc. - Revolver |
6/15/2023 | 116 | ||||
Ivy Finco Limited - First Lien Senior Secured Loan |
5/19/2025 | 5,817 | ||||
JHCC Holdings, LLC - Delayed Draw |
9/9/2025 | 8,500 | ||||
JHCC Holdings, LLC - Revolver |
9/9/2025 | 1,820 | ||||
Kellstrom Commercial Aerospace, Inc. - Delayed Draw |
7/1/2025 | 3,838 | ||||
Kellstrom Commercial Aerospace, Inc. - Revolver |
7/1/2025 | 640 | ||||
Margaux Acquisition Inc. - Delayed Draw |
12/19/2024 | 7,139 | ||||
Margaux Acquisition Inc. - Revolver |
12/19/2024 | 2,872 | ||||
Margaux UK Finance Limited - Revolver |
12/19/2024 | 662 | ||||
Mertus 522. GmbH - Delayed Draw |
5/28/2026 | 13,761 | ||||
Profile Products LLC - Revolver |
12/20/2024 | 3,833 | ||||
RoC Opco LLC - Revolver |
2/25/2025 | 10,241 | ||||
123
| |
Expiration Date (1) | Unfunded Commitments (2) | ||||
|---|---|---|---|---|---|---|
Solaray, LLC - Revolver |
9/9/2022 | 1,077 | ||||
SumUp Holdings Luxembourg S.à.r.l. - First Lien Senior Secured Loan |
8/1/2024 | 10,638 | ||||
Symplr Software, Inc. - Revolver |
11/30/2023 | 466 | ||||
TCFI Aevex LLC - Revolver |
5/13/2025 | 138 | ||||
TEI Holdings Inc. - Revolver |
12/23/2025 | 3,018 | ||||
Tidel Engineering, L.P. - Revolver |
3/1/2023 | 4,250 | ||||
TLC Purchaser, Inc. - Delayed Draw |
10/13/2025 | 7,119 | ||||
TLC Purchaser, Inc. - Revolver |
10/13/2025 | 4,984 | ||||
Ventiv Holdco, Inc. - Revolver |
9/3/2025 | 3,407 | ||||
WCI-HSG Purchaser, Inc. - Revolver |
2/24/2025 | 2,284 | ||||
WU Holdco, Inc. - Delayed Draw |
3/26/2026 | 4,801 | ||||
WU Holdco, Inc. - Revolver |
3/26/2025 | 3,944 | ||||
YLG Holdings, Inc. - Delayed Draw |
10/31/2025 | 5,127 | ||||
YLG Holdings, Inc. - Revolver |
10/31/2025 | 8,545 | ||||
Zywave, Inc. - Revolver |
11/17/2022 | 851 | ||||
| | | | | | | |
Total First Lien Senior Secured Loans |
$ | 215,795 | ||||
| | | | | | | |
| | | | | | | |
| | | | | | | |
- (1)
- Commitments are generally subject to borrowers meeting certain criteria such as compliance with covenants and certain operational metrics. These amounts may remain outstanding until the commitment period of an applicable loan expires, which may be shorter than its maturity.
- (2)
- Unfunded commitments denominated in currencies other than U.S. dollars have been converted to U.S. dollars using the applicable foreign currency exchange rate as of December 31, 2019.
124
As of December 31, 2018, the Company had $110.2 million of unfunded commitments under loan and financing agreements as follows (dollars in thousands):
| |
Expiration Date (1) | Unfunded Commitments (2) (3) | ||||
|---|---|---|---|---|---|---|
First Lien Senior Secured Loans |
||||||
Abracon Group Holding, LLC — Revolver |
7/18/2024 | $ | 2,833 | |||
Aimbridge Hospitality LP — Revolver |
6/22/2022 | 1,177 | ||||
AMCP Clean Acquisition Company, LLC — Delayed Draw Term Loan |
6/16/2025 | 2,315 | ||||
Amspec Services, Inc. — Revolver |
7/2/2024 | 4,735 | ||||
Ansira Holdings, Inc. — Revolver |
12/20/2022 | 5,440 | ||||
AP Plastics Group, LLC — Revolver |
8/1/2021 | 8,500 | ||||
API Technologies Corp. — Revolver |
4/22/2024 | 4,183 | ||||
Aramsco, Inc. — Revolver |
8/28/2024 | 3,161 | ||||
Batteries Plus Holding Corporation — Revolver |
7/6/2022 | 4,250 | ||||
Caliper Corporation — Revolver |
11/30/2023 | 2,358 | ||||
Captain D's LLC — Revolver |
12/15/2023 | 1,074 | ||||
Chase Industries, Inc. — Delayed Draw Term Loan |
5/12/2025 | 3,544 | ||||
Clinical Innovations, LLC — Revolver |
10/17/2022 | 1,113 | ||||
CMI Marketing Inc. — Revolver |
5/24/2023 | 2,112 | ||||
Cruz Bay Publishing, Inc. — Revolver |
6/6/2019 | 567 | ||||
CST Buyer Company — Revolver |
3/1/2023 | 897 | ||||
Datix Bidco Limited — Revolver |
10/28/2024 | 1,240 | ||||
Direct Travel, Inc. — Revolver |
12/1/2021 | 4,250 | ||||
Dorner Manufacturing Corp. — Revolver |
3/15/2022 | 1,044 | ||||
Drilling Info Holdings, Inc. — Delayed Draw Term Loan |
7/30/2025 | 1,663 | ||||
Efficient Collaborative Retail Marketing Company, LLC — Revolver |
6/15/2022 | 3,542 | ||||
Element Buyer, Inc. — Revolver |
7/19/2024 | 4,250 | ||||
ENC Holding Corporation — Delayed Draw Term Loan |
5/30/2025 | 595 | ||||
FineLine Technologies, Inc. — Revolver |
11/2/2021 | 2,162 | ||||
Grammer Purchaser, Inc. — Revolver |
9/30/2024 | 945 | ||||
Great Expressions Dental Centers PC — Revolver |
9/28/2022 | 213 | ||||
Home Franchise Concepts, Inc. — Revolver |
7/9/2024 | 2,530 | ||||
Horizon Telcom, Inc. — Delayed Draw Term Loan |
6/15/2023 | 1,738 | ||||
Horizon Telcom, Inc. — Revolver |
6/15/2023 | 1,159 | ||||
Margaux UK Finance — Revolver |
12/19/2024 | 636 | ||||
Margaux Acquisition Inc. — Revolver |
12/19/2024 | 2,257 | ||||
McKissock, LLC — Revolver |
8/5/2021 | 1,842 | ||||
PRCC Holdings, Inc. — Revolver |
2/1/2021 | 3,542 | ||||
Profile Products LLC — Revolver |
12/20/2024 | 3,833 | ||||
Solaray, LLC — Revolver |
9/9/2022 | 7,084 | ||||
Sovos Compliance, LLC — Delayed Draw Term Loan |
3/1/2022 | 871 | ||||
Sovos Compliance, LLC — Revolver |
3/1/2022 | 1,452 | ||||
Stanton Carpet Corp. — Revolver |
11/21/2022 | 4,250 | ||||
TEI Holdings Inc. — Revolver |
12/20/2022 | 3,542 | ||||
Tidel Engineering, L.P. — Revolver |
3/1/2023 | 4,250 | ||||
Zywave, Inc. — Revolver |
11/17/2022 | 512 | ||||
| | | | | | | |
Total First Lien Senior Secured Loans |
$ | 107,661 | ||||
| | | | | | | |
Other Unfunded Commitments |
||||||
BCC Jetstream Holdings Aviation (On II), LLC |
2,562 | |||||
| | | | | | | |
Total Other Unfunded Commitments |
$ | 2,562 | ||||
| | | | | | | |
Total |
$ | 110,223 | ||||
| | | | | | | |
| | | | | | | |
| | | | | | | |
- (1)
- Commitments are generally subject to borrowers meeting certain criteria such as compliance with covenants and certain operational metrics. These amounts may remain outstanding until the commitment period of an applicable loan expires, which may be shorter than its maturity.
125
- (2)
- Unfunded commitments denominated in currencies other than U.S. dollars have been converted to U.S. dollars using the applicable foreign currency exchange rate as of December 31, 2018.
- (3)
- Unfunded commitments represent unfunded commitments to fund investments, excluding our investment in ABCS as of December 31, 2018.
Significant Accounting Estimates and Critical Accounting Policies
Basis of Presentation
The Company's consolidated financial statements have been prepared in accordance with generally accepted accounting principles in the United States of America ("US GAAP"). The Company's consolidated financial statements and related financial information have been prepared pursuant to the requirements for reporting on Form 10-K and Article 6 of Regulation S-X. We have determined we meet the definition of an investment company and follow the accounting and reporting guidance in the Financial Accounting Standards Board ("FASB") Accounting Standards Codification ("ASC") Topic 946 — Financial Services — Investment Companies ("ASC 946"). Our financial currency is U.S. dollars and these consolidated financial statements have been prepared in that currency.
Use of Estimates
The preparation of the consolidated financial statements in conformity with US GAAP requires us to make estimates and assumptions that affect the reported amounts of assets and liabilities and disclosure of contingent assets and liabilities at the date of the consolidated financial statements and the reported amounts of increases and decreases in net assets from operations during the reporting period. Actual results could differ from those estimates and such differences could be material.
Revenue Recognition
We record our investment transactions on a trade date basis. We record realized gains and losses based on the specific identification method. We record interest income, adjusted for amortization of premium and accretion of discount, on an accrual basis. Discount and premium to par value on investments acquired are accreted and amortized, respectively, into interest income over the life of the respective investment using the effective interest method. Loan origination fees, original issue discount and market discount or premium are capitalized and amortized into or against interest income using the effective interest method or straight-line method, as applicable. We record any prepayment premiums, unamortized upfront loan origination fees and unamortized discounts received upon prepayment of a loan or debt security as interest income.
Dividend income on preferred equity investments is recorded on an accrual basis to the extent that such amounts are payable by the portfolio company and are expected to be collected. Dividend income on common equity investments is recorded on the record date for such distributions in the case of private portfolio companies, and on the ex-dividend date for publicly traded portfolio companies. Distributions received from a limited liability company or limited partnership investment are evaluated to determine if the distribution should be recorded as dividend income or a return of capital.
Certain investments may have contractual PIK interest or dividends. PIK represents accrued interest or accumulated dividends that are added to the loan principal of the investment on the respective interest or dividend payment dates rather than being paid in cash and generally becomes due at maturity or upon being called by the issuer. We record PIK as interest or dividend income, as applicable. If at any point we believe PIK may not be realized, we place the investment generating PIK on non-accrual status. When a PIK investment is placed on non-accrual status, the accrued, uncapitalized interest or dividends are generally reversed through interest or dividend income, as applicable.
126
Certain structuring fees and amendment fees are recorded as other income when earned. We record administrative agent fees received as other income when the services are rendered.
Valuation of Portfolio Investments
Investments for which market quotations are readily available are typically valued at such market quotations. Market quotations are obtained from an independent pricing service, where available. If we cannot obtain a price from an independent pricing service or if the independent pricing service is not deemed to be representative with the market, we value certain investments held by us on the basis of prices provided by principal market makers. Generally investments marked in this manner will be marked at the mean of the bid and ask of the independent broker quotes obtained, in some cases, primarily illiquid securities, multiple quotes may not be available and the mid of the bid/ask from one broker will be used. To validate market quotations, we utilize a number of factors to determine if the quotations are representative of fair value, including the source and number of quotations. Debt and equity securities that are not publicly traded or whose market prices are not readily available are valued at fair value, subject at all times to the oversight and approval of the Board, based on the input of our Advisor, our Audit Committee and one or more independent third party valuation firms engaged by our Board.
With respect to unquoted securities, we value each investment considering, among other measures, discounted cash flow models, comparisons of financial ratios of peer companies that are public and other factors. When an external event such as a purchase transaction, public offering or subsequent equity sale occurs, we use the pricing indicated by the external event to corroborate and/or assist us in our valuation. Due to the inherent uncertainty of determining the fair value of investments that do not have a readily available market value, the fair value of our investments may differ significantly from the values that would have been used had a readily available market value existed for such investments, and the differences could be material.
With respect to investments for which market quotations are not readily available, the Advisor will undertake a multi-step valuation process, which includes among other things, the below:
- •
- Our quarterly valuation process begins with each portfolio company or investment being initially valued by the investment
professionals of our Advisor responsible for the portfolio investment or by an independent valuation firm;
- •
- Preliminary valuation conclusions are then documented and discussed with our senior management and our Advisor. Agreed upon
valuation recommendations are presented to our Audit Committee;
- •
- Our Audit Committee of our Board reviews the valuations presented and recommends values for each of the investments to our Board;
- •
- At least once annually, the valuation for each portfolio investment constituting a material portion of the Company's portfolio
will be reviewed by an independent valuation firm; and
- •
- Our Board discusses valuations and determines the fair value of each investment in good faith based upon, among other things, the input of our Advisor, independent valuation firms, where applicable, and our Audit Committee.
In following this approach, the types of factors that are taken into account in the fair value pricing of investments include, as relevant, but are not limited to: comparison to publicly traded securities, including factors such as yield, maturity and measures of credit quality; the enterprise value of a portfolio
127
company; the nature and realizable value of any collateral; the portfolio companies ability to make payments and its earnings and discounted cash flows; and the markets in which the portfolio company does business. In cases where an independent valuation firm provides fair valuations for investments, the independent valuation firm provides a fair valuation report, a description of the methodology used to determine the fair value and their analysis and calculations to support their conclusion. We determine the fair value of its investment in ABCS giving consideration to the assets and liabilities of ABCS, at fair value, including consideration of any necessary adjustments. We conduct this valuation process on a quarterly basis.
Recent Accounting Pronouncements
In August 2018, the FASB issued ASU 2018-13, "Fair Value Measurement (Topic 820): Disclosure Framework — Changes to the Disclosure Requirements for Fair Value Measurement." ASU 2018-13 is part of the disclosure framework project and eliminates certain disclosure requirements for fair value measurements, requires entities to disclose new information, and modifies existing disclosure requirements. The new guidance is effective after December 15, 2019. Early adoption is permitted. We do not believe this change will have a material effect on our consolidated financial statements and disclosures.
We have entered into the Amended Advisory Agreement with our Advisor (which supersedes the Investment Advisory Agreement dated November 14, 2018 we had previously entered into). Our Advisor has agreed to serve as our investment adviser in accordance with the terms of the Amended Advisory Agreement. Under the Amended Advisory Agreement, we have agreed to pay an annual base management fee as well as an incentive fee based on our investment performance.
On October 11, 2018 the Board approved, subject to completion of the IPO, the Investment Advisory Agreement. Beginning with the calendar quarter that commences January 1, 2019, this Investment Advisory Agreement incorporates (i) a three-year lookback provision and (ii) a cap on quarterly income incentive fee payments based on net realized or unrealized capital loss, if any, during the applicable three-year lookback period.
On November 28, 2018, our Board, including a majority of our Independent Directors, approved the Amended Advisory Agreement. On February 1, 2019 the Company's stockholders approved the Amended Advisory Agreement. Pursuant to this Agreement, effective February 1, 2019, the base management fee of 1.5% (0.375% per quarter) of the average value of the Company's gross assets (excluding cash and cash equivalents, but including assets purchased with borrowed amounts) will continue to apply to assets held at an asset coverage ratio of 200%, but a lower base management fee of 1.0% (0.25% per quarter) of the average value of the Company's gross assets (excluding cash and cash equivalents, but including assets purchased with borrowed amounts) will apply to any amount of assets attributable to leverage decreasing the Company's asset coverage ratio below 200%.
We have entered into an Administration Agreement with the Administrator pursuant to which the Administrator will furnish us with administrative services necessary to conduct our day-to-day operations. We reimburse the Administrator for its costs and expenses and our allocable portion of overhead incurred by it in performing its obligations under the Administration Agreement, including certain compensation paid to or compensatory distributions received by our officers (including our Chief Compliance Officer and Chief Financial Officer) and any of their respective staff who provide services to us, operations staff who provide services to us, and internal audit staff, if any, to the extent internal audit performs a role in our Sarbanes-Oxley internal control assessment.
128
If any of our contractual obligations discussed above are terminated, our costs may increase under any new agreements that we enter into as replacements. We would also likely incur expenses in locating alternative parties to provide the services we expect to receive under our Amended Advisory Agreement and Administration Agreement.
A summary of the maturities of our principal amounts of debt and other contractual payment obligations as of December 31, 2019 are as follows (dollars in thousands):
| |
Payments Due by Period | |||||||||||||||
|---|---|---|---|---|---|---|---|---|---|---|---|---|---|---|---|---|
| |
Total | Less than 1 year |
1 — 3 years | 3 — 5 years | More than 5 years |
|||||||||||
BCSF Revolving Credit Facility |
$ | 268,015 | $ | — | $ | 268,015 | $ | — | $ | — | ||||||
2018-1 Notes |
365,700 | — | — | — | 365,700 | |||||||||||
JPM Credit Facility |
546,754 | — | 546,754 | — | — | |||||||||||
2019-1 Debt |
398,750 | — | — | — | 398,750 | |||||||||||
| | | | | | | | | | | | | | | | | |
Total Debt Obligations |
$ | 1,579,219 | $ | — | $ | 814,769 | $ | — | $ | 764,450 | ||||||
| | | | | | | | | | | | | | | | | |
| | | | | | | | | | | | | | | | | |
| | | | | | | | | | | | | | | | | |
On January 8, 2020, the Company entered into an amended and restated credit agreement (the "Amendment"), of its BCSF Revolving Credit Facility with Goldman Sachs Bank USA, as Sole Lead Arranger, Syndication Agent and Administrative Agent, and U.S. Bank National Association as Collateral Administrator, Collateral Agent and Collateral Custodian (collectively, the "Credit Facility Parties"), which amended and restated the terms of the Existing Credit Facility. The Amendment amends the Existing Credit Facility to, among other things, modify various financial covenants, including removing a liquidity covenant and adding a net asset value covenant with respect to the Company, as sponsor.
On January 29, 2020, the Company entered into an amended and restated loan and security agreement (the "JPM Credit Agreement" or the "JPM Credit Facility") as Borrower, with JPMorgan Chase Bank, National Association, as Administrative Agent, and Wells Fargo Bank, National Association as Collateral Administrator, Collateral Agent, Securities Intermediary and Bank. The Amended and Restated Loan and Security Agreement amends the Existing Loan and Security Agreement to, among other things, (1) decrease the financing limit under the agreement from $666.6 million to $500.0 million; (2) decrease the minimum facility amount from $466.6 million to $300.0 million period from January 29, 2020 to July 29, 2020 (the minimum facility amount will increase to $350.0 million after July 29, 2020 until the end of the reinvestment period); (3) decrease the interest rate on financing from 2.75% per annum over the applicable London Interbank Offered Rate ("LIBOR") to 2.375% per annum over the applicable LIBOR; (4) extend the scheduled termination date of the agreement from November 29, 2022 to January 29, 2025; and (5) increase the advance rate from 62.5% to 63.5%.
Item 7A. Quantitative and Qualitative Disclosures About Market Risk
We are subject to financial market risks, including changes in interest rates. We will generally invest in illiquid loans and securities including debt and equity securities of middle-market companies. Because we expect that there will not be a readily available market for many of the investments in our portfolio, we expect to value many of our portfolio investments at fair value as determined in good faith by the Board using a documented valuation policy and a consistently applied valuation process. Due to the inherent uncertainty of determining the fair value of investments that do not have a readily available market value, the fair value of our investments may differ significantly from the values that would have
129
been used had a readily available market value existed for such investments, and the differences could be material.
Assuming that the statement of financial condition as of December 31, 2019 were to remain constant and that we took no actions to alter our existing interest rate sensitivity, the following table shows the annualized impact of hypothetical base rate changes in interest rates.
| Change in Interest Rates | Increase (Decrease) in Interest Income |
Increase (Decrease) in Interest Expense |
Net Increase (Decrease) in Net Investment Income |
|||||||
|---|---|---|---|---|---|---|---|---|---|---|
| Down 25 basis points | $ | (5,721 | ) | $ | (3,916 | ) | $ | (1,805 | ) | |
| Up 100 basis points | 23,413 | 15,662 | 7,751 | |||||||
| Up 200 basis points | 47,489 | 31,324 | 16,165 | |||||||
| Up 300 basis points | 71,736 | 46,986 | 24,750 | |||||||
From time to time, we may make investments that are denominated in a foreign currency. These investments are translated into U.S. dollars at the balance sheet date, exposing us to movements in foreign exchange rates. We may employ hedging techniques to minimize these risks, but we cannot assure you that such strategies will be effective or without risk to us. We may seek to utilize instruments such as, but not limited to, forward contracts to seek to hedge against fluctuations in the relative values of our portfolio positions from changes in currency exchange rates.
Item 8. Consolidated Financial Statements and Supplementary Data
Our consolidated financial statements and supplementary data are annexed to this Annual Report beginning on page 135.
130
INDEX TO CONSOLIDATED FINANCIAL STATEMENTS
131
Report of Independent Registered Public Accounting Firm
To the Board of Directors and Shareholders of Bain Capital Specialty Finance, Inc.
Opinions on the Financial Statements and Internal Control over Financial Reporting
We have audited the accompanying consolidated statements of assets and liabilities, including the consolidated schedules of investments, of Bain Capital Specialty Finance, Inc. and its subsidiaries (the "Company") as of December 31, 2019 and 2018, and the related consolidated statements of operations, changes in net assets and cash flows for each of the three years in the period ended December 31, 2019, including the related notes (collectively referred to as the "consolidated financial statements"). We also have audited the Company's internal control over financial reporting as of December 31, 2019, based on criteria established in Internal Control—Integrated Framework (2013) issued by the Committee of Sponsoring Organizations of the Treadway Commission (COSO).
In our opinion, the consolidated financial statements referred to above present fairly, in all material respects, the financial position of the Company as of December 31, 2019 and 2018, and the results of its operations, changes in its net assets and its cash flows for each of the three years in the period ended December 31, 2019 in conformity with accounting principles generally accepted in the United States of America. Also in our opinion, the Company maintained, in all material respects, effective internal control over financial reporting as of December 31, 2019, based on criteria established in Internal Control—Integrated Framework (2013) issued by the COSO.
Basis for Opinions
The Company's management is responsible for these consolidated financial statements, for maintaining effective internal control over financial reporting, and for its assessment of the effectiveness of internal control over financial reporting, included in Management's Report on Internal Control Over Financial Reporting appearing under Item 9A. Our responsibility is to express opinions on the Company's consolidated financial statements and on the Company's internal control over financial reporting based on our audits. We are a public accounting firm registered with the Public Company Accounting Oversight Board (United States) (PCAOB) and are required to be independent with respect to the Company in accordance with the U.S. federal securities laws and the applicable rules and regulations of the Securities and Exchange Commission and the PCAOB.
We conducted our audits in accordance with the standards of the PCAOB. Those standards require that we plan and perform the audits to obtain reasonable assurance about whether the consolidated financial statements are free of material misstatement, whether due to error or fraud, and whether effective internal control over financial reporting was maintained in all material respects.
Our audits of the consolidated financial statements included performing procedures to assess the risks of material misstatement of the consolidated financial statements, whether due to error or fraud, and performing procedures that respond to those risks. Such procedures included examining, on a test basis, evidence regarding the amounts and disclosures in the consolidated financial statements. Our audits also included evaluating the accounting principles used and significant estimates made by management, as well as evaluating the overall presentation of the consolidated financial statements. Our procedures included confirmation of securities owned as of December 31, 2019 and 2018 by correspondence with the custodian, agent banks, portfolio company investees and brokers; when replies were not received, we performed other auditing procedures. Our audit of internal control over financial reporting included obtaining an understanding of internal control over financial reporting, assessing the risk that a material weakness exists, and testing and evaluating the design and operating effectiveness of internal control based on the
132
assessed risk. Our audits also included performing such other procedures as we considered necessary in the circumstances. We believe that our audits provide a reasonable basis for our opinions.
Definition and Limitations of Internal Control over Financial Reporting
A company's internal control over financial reporting is a process designed to provide reasonable assurance regarding the reliability of financial reporting and the preparation of financial statements for external purposes in accordance with generally accepted accounting principles. A company's internal control over financial reporting includes those policies and procedures that (i) pertain to the maintenance of records that, in reasonable detail, accurately and fairly reflect the transactions and dispositions of the assets of the company; (ii) provide reasonable assurance that transactions are recorded as necessary to permit preparation of financial statements in accordance with generally accepted accounting principles, and that receipts and expenditures of the company are being made only in accordance with authorizations of management and directors of the company; and (iii) provide reasonable assurance regarding prevention or timely detection of unauthorized acquisition, use, or disposition of the company's assets that could have a material effect on the financial statements.
Because of its inherent limitations, internal control over financial reporting may not prevent or detect misstatements. Also, projections of any evaluation of effectiveness to future periods are subject to the risk that controls may become inadequate because of changes in conditions, or that the degree of compliance with the policies or procedures may deteriorate.
Critical Audit Matters
The critical audit matter communicated below is a matter arising from the current period audit of the consolidated financial statements that was communicated or required to be communicated to the audit committee and that (i) relates to accounts or disclosures that are material to the consolidated financial statements and (ii) involved our especially challenging, subjective, or complex judgments. The communication of critical audit matters does not alter in any way our opinion on the consolidated financial statements, taken as a whole, and we are not, by communicating the critical audit matter below, providing a separate opinion on the critical audit matter or on the accounts or disclosures to which it relates.
Valuation of Portfolio Investments—Level 3 Portfolio Investments in Loans and Subordinated Debt Valued Using a Significant Unobservable Input Developed by Management
As described in Notes 2 and 4 to the consolidated financial statements, 65% of the Company's $2,527 million total investments as of December 31, 2019 represent Level 3 portfolio investments in loans and subordinated debt for which a significant unobservable input was developed by management. For these investments, management used the income approach to determine fair value. With respect to unquoted portfolio investments, management values each investment considering, among other measures, discounted cash flow models. Management applied significant judgment in determining the fair value of these investments, which involved the development and use of a significant unobservable input. The significant unobservable input used in the income approach is the comparative yield.
The principal considerations for our determination that performing procedures relating to the valuation of Level 3 portfolio investments in loans and subordinated debt for which a significant unobservable input was developed by management is a critical audit matter are there was significant judgment by management to determine the fair value of these investments which included the development and use of a significant unobservable input, the comparative yield. This in turn led to a high degree of auditor subjectivity, judgment and effort in performing procedures to evaluate the audit evidence obtained related to the valuation of Level 3 portfolio investments in loans and subordinated debt for which comparative yields
133
were developed by management, and the audit effort involved the use of professionals with specialized skill and knowledge to assist with evaluating the comparative yields.
Addressing the matter involved performing procedures and evaluating audit evidence in connection with forming our overall opinion on the consolidated financial statements. These procedures included testing the effectiveness of controls relating to the valuation of Level 3 portfolio investments in loans and subordinated debt for which a significant unobservable input was developed by management, including controls over the Company's methods, data and comparative yields. These procedures also included, among others, evaluating the appropriateness of management's discounted cash flow models, testing the completeness, accuracy, and relevance of data used in the models and provided by management, and evaluating the reasonableness of the comparative yields used in the models. These procedures also included the involvement of professionals with specialized skill and knowledge solely to assist with developing an independent estimate of comparative yields inputs. Evaluating the reasonableness of management's comparative yields involved evaluating whether the comparative yields used by management considered company specific information, market information and subordination of the debt.
/s/ PricewaterhouseCoopers LLP
Boston, Massachusetts
February 26, 2020
We have served as the Company's auditor since 2016.
134
Bain Capital Specialty Finance, Inc.
Consolidated Statements of Assets and Liabilities
(in thousands, except share and per share data)
| |
As of | As of | |||||
|---|---|---|---|---|---|---|---|
| |
December 31, 2019 | December 31, 2018 | |||||
| Assets | |||||||
Investments at fair value: |
|||||||
Non-controlled/non-affiliate investments (amortized cost of $2,416,854 and $1,449,749, respectively) |
$ | 2,403,250 | $ | 1,422,837 | |||
Non-controlled/affiliate investment (amortized cost of $6,720 and $6,720, respectively) |
6,720 | 6,720 | |||||
Controlled affiliate investment (amortized cost of $113,689 and $296,648, respectively) |
117,085 | 298,249 | |||||
Cash and cash equivalents |
36,531 | 14,693 | |||||
Foreign cash (cost of $854 and $589, respectively) |
810 | 591 | |||||
Restricted cash and cash equivalents |
31,505 | 17,987 | |||||
Collateral on forward currency exchange contracts |
- | 4 | |||||
Deferred financing costs |
3,182 | 4,018 | |||||
Interest receivable on investments |
22,482 | 6,249 | |||||
Prepaid insurance |
- | 1 | |||||
Receivable for sales and paydowns of investments |
21,994 | 1,634 | |||||
Unrealized appreciation on forward currency exchange contracts |
1,034 | 9,322 | |||||
Dividend receivable |
961 | 8,709 | |||||
| | | | | | | | |
Total Assets |
$ | 2,645,554 | $ | 1,791,014 | |||
| | | | | | | | |
| | | | | | | | |
| | | | | | | | |
| Liabilities | |||||||
Debt (net of unamortized debt issuance costs of $4,584 and $2,040, respectively) |
$ | 1,574,635 | $ | 634,925 | |||
Offering costs payable |
- | 1,820 | |||||
Interest payable |
15,534 | 4,835 | |||||
Payable for investments purchased |
293 | 119,166 | |||||
Collateral payable on forward currency exchange contracts |
331 | - | |||||
Unrealized depreciation on forward currency exchange contracts |
1,252 | - | |||||
Base management fee payable |
7,265 | 2,950 | |||||
Incentive fee payable |
4,513 | 3,300 | |||||
Accounts payable and accrued expenses |
2,155 | 1,281 | |||||
Distributions payable |
21,176 | 21,108 | |||||
| | | | | | | | |
Total Liabilities |
1,627,154 | 789,385 | |||||
| | | | | | | | |
| Commitments and Contingencies (See Note 11) | |||||||
Net Assets |
|||||||
Preferred stock, $0.001 par value per share, 10,000,000,000 shares authorized, none issued and outstanding as of December 31, 2019 and December 31, 2018, respectively |
$ | - | $ | - | |||
Common stock, par value $0.001 per share, 100,000,000,000 and 100,000,000,000 shares authorized, 51,649,812 and 51,482,137 shares issued and outstanding as of December 31, 2019 and December 31, 2018, respectively |
52 | 51 | |||||
Paid in capital in excess of par value |
1,038,343 | 1,034,255 | |||||
Total distributable earnings (loss) |
(19,995 | ) | (32,677 | ) | |||
| | | | | | | | |
Total Net Assets |
1,018,400 | 1,001,629 | |||||
| | | | | | | | |
| Total Liabilities and Total Net assets | $ | 2,645,554 | $ | 1,791,014 | |||
| | | | | | | | |
| | | | | | | | |
| | | | | | | | |
| Net asset value per share | $ | 19.72 | $ | 19.46 | |||
| | | | | | | | |
| | | | | | | | |
| | | | | | | | |
See Notes to Consolidated Financial Statements
135
Bain Capital Specialty Finance, Inc.
Consolidated Statements of Operations
(in thousands, except share and per share data)
| |
For the Year Ended December |
For the Year Ended December |
For the Year Ended December |
|||||||
|---|---|---|---|---|---|---|---|---|---|---|
| |
2019 | 2018 | 2017 | |||||||
Income |
||||||||||
Investment income from non-controlled/non-affiliate investments: |
||||||||||
Interest from investments |
$ | 178,586 | $ | 73,049 | $ | 24,380 | ||||
Dividend income |
62 | - | - | |||||||
Other income |
805 | 545 | 129 | |||||||
| | | | | | | | | | | |
Total investment income from non-controlled/non-affiliate investments |
179,453 | 73,594 | 24,509 | |||||||
Investment income from controlled affiliate investments: |
||||||||||
Interest from investments |
1,809 | 314 | 55 | |||||||
Dividend income |
16,679 | 25,386 | - | |||||||
Other income |
4 | - | 41 | |||||||
| | | | | | | | | | | |
Total investment income from controlled affiliate investments |
18,492 | 25,700 | 96 | |||||||
| | | | | | | | | | | |
Total investment income |
197,945 | 99,294 | 24,605 | |||||||
| | | | | | | | | | | |
Expenses |
||||||||||
Interest and debt financing expenses |
66,330 | 24,011 | 3,615 | |||||||
Amortization of deferred offering costs |
- | - | 330 | |||||||
Base management fee |
32,702 | 17,544 | 5,898 | |||||||
Incentive fee |
17,418 | 8,670 | 764 | |||||||
Professional fees |
2,297 | 2,639 | 1,777 | |||||||
Directors fees |
546 | 278 | 275 | |||||||
Other general and administrative expenses |
4,772 | 902 | 686 | |||||||
| | | | | | | | | | | |
Total expenses before fee waivers |
124,065 | 54,044 | 13,345 | |||||||
Base management fee waiver |
(8,242 | ) | (8,772 | ) | (2,949 | ) | ||||
Incentive fee waiver |
(2,745 | ) | (1,908 | ) | - | |||||
| | | | | | | | | | | |
Total expenses, net of fee waivers |
113,078 | 43,364 | 10,396 | |||||||
| | | | | | | | | | | |
Net investment income before taxes |
84,867 | 55,930 | 14,209 | |||||||
Excise tax expense |
- | - | 5 | |||||||
| | | | | | | | | | | |
Net investment income |
84,867 | 55,930 | 14,204 | |||||||
| | | | | | | | | | | |
Net realized and unrealized gains (losses) |
||||||||||
Net realized gain (loss) on non-controlled/non-affiliate investments |
(3,487 | ) | (3,345 | ) | 55 | |||||
Net realized gain on controlled affiliate investments |
265 | - | - | |||||||
Net realized gain (loss) on foreign currency transactions |
(36 | ) | (489 | ) | 115 | |||||
Net realized gain (loss) on forward currency exchange contracts |
11,043 | (2,651 | ) | (222 | ) | |||||
Net change in unrealized appreciation (depreciation) on foreign currency translation |
(130 | ) | - | 28 | ||||||
Net change in unrealized appreciation (depreciation) on forward currency exchange contracts |
(9,540 | ) | 12,826 | (3,505 | ) | |||||
Net change in unrealized appreciation (depreciation) on non-controlled/non-affiliate investments |
13,308 | (36,334 | ) | 7,732 | ||||||
Net change in unrealized appreciation on controlled affiliate investments |
1,795 | 708 | 893 | |||||||
| | | | | | | | | | | |
Total net gains (losses) |
13,218 | (29,285 | ) | 5,096 | ||||||
| | | | | | | | | | | |
Net increase in net assets resulting from operations |
$ | 98,085 | $ | 26,645 | $ | 19,300 | ||||
| | | | | | | | | | | |
| | | | | | | | | | | |
| | | | | | | | | | | |
Per Common Share Data |
||||||||||
Basic and diluted net investment income per common share |
$ | 1.64 | $ | 1.45 | $ | 0.73 | ||||
Basic and diluted increase in net assets resulting from operations per common share |
$ | 1.90 | $ | 0.69 | $ | 0.99 | ||||
Basic and diluted weighted average common shares outstanding |
51,603,415 | 38,567,001 | 19,548,037 | |||||||
See Notes to Consolidated Financial Statements
136
Bain Capital Specialty Finance, Inc.
Consolidated Statements of Changes in Net Assets
(in thousands, except share and per share data)
| |
For the Year Ended December | For the Year Ended December | For the Year Ended December | |||||||
|---|---|---|---|---|---|---|---|---|---|---|
| |
2019 | 2018 | 2017 | |||||||
Operations: |
||||||||||
Net investment income |
$ | 84,867 | $ | 55,930 | $ | 14,204 | ||||
Net realized gain (loss) |
7,785 | (6,485 | ) | (52 | ) | |||||
Net change in unrealized appreciation (depreciation) |
5,433 | (22,800 | ) | 5,148 | ||||||
| | | | | | | | | | | |
Net increase in net assets resulting from operations |
98,085 | 26,645 | 19,300 | |||||||
| | | | | | | | | | | |
Stockholder distributions: |
||||||||||
Distributions from distributable earnings |
(84,636 | ) | (63,169 | ) | (16,892 | ) | ||||
| | | | | | | | | | | |
Net decrease in net assets resulting from stockholder distributions |
(84,636 | ) | (63,169 | ) | (16,892 | ) | ||||
| | | | | | | | | | | |
Capital share transactions: |
||||||||||
Issuance of common stock, net |
— | 522,358 | 392,735 | |||||||
Reinvestment of stockholder distributions |
3,322 | 8,832 | 1,476 | |||||||
| | | | | | | | | | | |
Net increase in net assets resulting from capital share transactions |
3,322 | 531,190 | 394,211 | |||||||
| | | | | | | | | | | |
Total increase in net assets |
16,771 | 494,666 | 396,619 | |||||||
Net assets at beginning of year |
1,001,629 | 506,963 | 110,344 | |||||||
| | | | | | | | | | | |
Net assets at end of year |
$ | 1,018,400 | $ | 1,001,629 | $ | 506,963 | ||||
| | | | | | | | | | | |
| | | | | | | | | | | |
| | | | | | | | | | | |
Net asset value per common share |
$ | 19.72 | $ | 19.46 | $ | 20.30 | ||||
| | | | | | | | | | | |
| | | | | | | | | | | |
| | | | | | | | | | | |
Common stock outstanding at end of year |
51,649,812 | 51,482,137 | 24,975,812 | |||||||
| | | | | | | | | | | |
| | | | | | | | | | | |
| | | | | | | | | | | |
See Notes to Consolidated Financial Statements
137
Bain Capital Specialty Finance, Inc.
Consolidated Statements of Cash Flows
(in thousands, except share and per share data)
| |
For the Year Ended December |
For the Year Ended December |
For the Year Ended December |
|||||||
|---|---|---|---|---|---|---|---|---|---|---|
| |
2019 | 2018 | 2017 | |||||||
| Cash flows from operating activities | ||||||||||
| Net increase in net assets resulting from operations | $ | 98,085 | $ | 26,645 | $ | 19,300 | ||||
Adjustments to reconcile net increase in net assets from operations to net cash used in operating activities: |
||||||||||
Purchases of investments |
(1,413,662 | ) | (1,064,335 | ) | (781,183 | ) | ||||
Proceeds from principal payments and sales of investments |
1,069,492 | 236,107 | 73,112 | |||||||
Net realized (gain) loss from investments |
3,222 | 3,345 | (55 | ) | ||||||
Net realized (gain) loss on foreign currency transactions |
36 | 489 | (115 | ) | ||||||
Net change in unrealized (appreciation) depreciation on forward currency exchange contracts |
9,540 | (12,826 | ) | 3,505 | ||||||
Net change in unrealized (appreciation) depreciation on investments |
(15,103 | ) | 35,626 | (8,625 | ) | |||||
Net change in unrealized (appreciation) depreciation on foreign currency translation |
130 | - | (28 | ) | ||||||
Increase in investments due to PIK |
(479 | ) | - | - | ||||||
Accretion of discounts and amortization of premiums |
(4,476 | ) | (1,756 | ) | (815 | ) | ||||
Amortization of deferred financing costs and debt issuance costs |
1,497 | 1,835 | 742 | |||||||
Amortization of deferred offering costs |
- | - | 330 | |||||||
Changes in operating assets and liabilities: |
||||||||||
Collateral on forward currency exchange contracts |
4 | 4,418 | (4,422 | ) | ||||||
Interest receivable on investments |
(16,233 | ) | (3,362 | ) | (2,293 | ) | ||||
Prepaid insurance |
1 | 136 | 2 | |||||||
Dividend receivable |
7,748 | (8,709 | ) | - | ||||||
Other assets |
- | - | 6 | |||||||
Interest payable |
10,699 | 4,020 | 798 | |||||||
Collateral payable on forward currency exchange contracts |
331 | - | - | |||||||
Base management fee payable |
4,315 | 1,706 | 1,066 | |||||||
Incentive fee payable |
1,213 | 2,282 | 764 | |||||||
Accounts payable and accrued expenses |
874 | 137 | 532 | |||||||
Excise tax payable |
- | (5 | ) | 5 | ||||||
| | | | | | | | | | | |
Net cash used in operating activities |
(242,766 | ) | (774,247 | ) | (697,374 | ) | ||||
| | | | | | | | | | | |
| Cash flows from financing activities | ||||||||||
Borrowings on debt |
1,249,048 | 818,700 | 545,900 | |||||||
Repayments on debt |
(884,529 | ) | (632,735 | ) | (154,564 | ) | ||||
Payments of financing costs |
(409 | ) | - | (5,462 | ) | |||||
Payments of offering costs |
(1,820 | ) | (89 | ) | - | |||||
Payments of debt issuance costs |
(2,795 | ) | (2,085 | ) | - | |||||
Proceeds from issuance of common stock |
- | 524,267 | 392,735 | |||||||
Stockholder distributions paid |
(81,246 | ) | (40,971 | ) | (7,756 | ) | ||||
| | | | | | | | | | | |
Net cash provided by financing activities |
278,249 | 667,087 | 770,853 | |||||||
| | | | | | | | | | | |
| Net increase (decrease) in cash, foreign cash, restricted cash and cash equivalents | 35,483 | (107,160 | ) | 73,479 | ||||||
Effect of foreign currency exchange rates |
92 | (487 | ) | 707 | ||||||
| Cash, foreign cash, restricted cash and cash equivalents, beginning of year | 33,271 | 140,918 | 66,732 | |||||||
| | | | | | | | | | | |
| Cash, foreign cash, restricted cash and cash equivalents, end of year | $ | 68,846 | $ | 33,271 | $ | 140,918 | ||||
| | | | | | | | | | | |
| | | | | | | | | | | |
| | | | | | | | | | | |
| Supplemental disclosure of cash flow information: | ||||||||||
| Cash interest paid during the year | $ | 54,134 | $ | 18,156 | $ | 2,075 | ||||
| Cash paid for excise taxes during the year | $ | - | $ | 5 | $ | - | ||||
| Supplemental disclosure of non-cash information: | ||||||||||
| Reinvestment of stockholder distributions | $ | 3,322 | $ | 8,832 | $ | 1,476 | ||||
| Distribution to owner from ABCS JV | $ | 346,329 | $ | - | $ | - | ||||
| |
For the Year Ended December |
For the Year Ended December |
For the Year Ended December |
|||||||
|---|---|---|---|---|---|---|---|---|---|---|
| |
2019 | 2018 | 2018 | |||||||
| Cash | $ | 36,531 | $ | 14,693 | $ | 139,506 | ||||
| Restricted cash | 31,505 | 17,987 | - | |||||||
| Foreign cash | 810 | 591 | 1,412 | |||||||
| | | | | | | | | | | |
| Total cash, foreign cash, restricted cash, and cash equivalents shown in the consolidated statements of cash flows | $ | 68,846 | $ | 33,271 | $ | 140,918 | ||||
| | | | | | | | | | | |
| | | | | | | | | | | |
| | | | | | | | | | | |
See Notes to Consolidated Financial Statements
138
Bain Capital Specialty Finance, Inc.
Consolidated Schedule of Investments
As of December 31, 2019
(In thousands)
| Control Type | Industry | Portfolio Company | Investment Type | Spread Above Index (1) | Interest Rate | Maturity Date | Principal/Shares (9) | Cost | Market Value | % of NAV (4) | |||||||||||||||
|---|---|---|---|---|---|---|---|---|---|---|---|---|---|---|---|---|---|---|---|---|---|---|---|---|---|
Non-Controlled/Non-Affiliate Investments |
|||||||||||||||||||||||||
|
Aerospace & Defense | Forming & Machining Industries Inc. (18) (19) (21) | Second Lien Senior Secured Loan | L+ 8.25% | 10.19% | 10/9/2026 | $ | 6,540 | 6,480 | 6,278 | |||||||||||||||
|
Forming & Machining Industries Inc. (12) (18) (19) (29) | First Lien Senior Secured Loan | L+ 4.00% | 5.94% | 10/9/2025 | $ | 16,778 | 16,648 | 16,275 | ||||||||||||||||
|
GSP Holdings, LLC (7) (12) (15) (19) (29) | First Lien Senior Secured Loan | L+ 5.50% | 7.39% | 11/6/2025 | $ | 36,268 | 35,917 | 35,542 | ||||||||||||||||
|
GSP Holdings, LLC (3) (15) (19) | First Lien Senior Secured Loan - Revolver | L+ 5.50% | 7.29% | 11/6/2025 | $ | 227 | 182 | 136 | ||||||||||||||||
|
Kellstrom Aerospace Group, Inc (14) (19) (25) | Equity Interest | - | - | - | 1 | 1,963 | 1,911 | |||||||||||||||||
|
Kellstrom Commercial Aerospace, Inc. (2) (3) (5) (18) (19) | First Lien Senior Secured Loan - Delayed Draw | - | - | 7/1/2025 | $ | - | (35 | ) | (77 | ) | ||||||||||||||
|
Kellstrom Commercial Aerospace, Inc. (3) (18) (19) (26) | First Lien Senior Secured Loan - Revolver | L+ 5.00% | 8.35% | 7/1/2025 | $ | 5,758 | 5,639 | 5,630 | ||||||||||||||||
|
Kellstrom Commercial Aerospace, Inc. (12) (18) (19) (21) (29) | First Lien Senior Secured Loan | L+ 5.00% | 7.10% | 7/1/2025 | $ | 33,949 | 33,304 | 33,270 | ||||||||||||||||
|
Novetta, LLC (12) (15) (29) | First Lien Senior Secured Loan | L+ 5.00% | 6.80% | 10/17/2022 | $ | 6,581 | 6,497 | 6,484 | ||||||||||||||||
|
Precision Ultimate Holdings, LLC (14) (19) (25) | Equity Interest | - | - | - | 1,417 | 1,417 | 1,417 | |||||||||||||||||
|
Salient CRGT, Inc. (12) (15) (29) | First Lien Senior Secured Loan | L+ 6.50% | 8.29% | 2/28/2022 | $ | 12,723 | 12,770 | 12,087 | ||||||||||||||||
|
TCFI Aevex LLC (3) (15) (19) | First Lien Senior Secured Loan - Revolver | L+ 6.25% | 8.20% | 5/13/2025 | $ | 2,627 | 2,571 | 2,627 | ||||||||||||||||
|
TCFI Aevex LLC (12) (15) (19) (21) (29) | First Lien Senior Secured Loan | L+ 6.25% | 8.24% | 5/13/2025 | $ | 38,515 | 37,854 | 38,515 | ||||||||||||||||
|
WCI-HSG HOLDCO, LLC (14) (19) (25) | Preferred equity | - | - | - | 675 | 675 | 968 | |||||||||||||||||
|
WCI-HSG Purchaser, Inc. (3) (15) (19) | First Lien Senior Secured Loan - Revolver | L+ 4.25% | 6.04% | 2/24/2025 | $ | 403 | 369 | 396 | ||||||||||||||||
|
WCI-HSG Purchaser, Inc. (12) (15) (19) (29) | First Lien Senior Secured Loan | L+ 4.50% | 6.30% | 2/24/2025 | $ | 17,779 | 17,551 | 17,735 | ||||||||||||||||
|
WP CPP Holdings, LLC. (12) (15) (21) (29) | Second Lien Senior Secured Loan | L+ 7.75% | 9.68% | 4/30/2026 | $ | 11,724 | 11,620 | 11,584 | ||||||||||||||||
| | | | | | | | | | | | | | | | | | | | | | | | | | |
|
Aerospace & Defense Total | $ | 191,422 | $ | 190,778 | 18.7 | % | ||||||||||||||||||
| | | | | | | | | | | | | | | | | | | | | | | | | | |
|
Automotive | CST Buyer Company (3) (5) (15) (19) | First Lien Senior Secured Loan - Revolver | - | - | 10/3/2025 | $ | - | (31 | ) | - | ||||||||||||||
|
CST Buyer Company (12) (15) (19) (21) (29) | First Lien Senior Secured Loan | L+ 5.75% | 7.55% | 10/3/2025 | $ | 36,890 | 36,286 | 36,890 | ||||||||||||||||
|
JHCC Holdings, LLC (2) (3) (5) (18) (19) (28) | First Lien Senior Secured Loan - Delayed Draw | - | - | 9/9/2025 | $ | - | (40 | ) | (43 | ) | ||||||||||||||
|
JHCC Holdings, LLC (3) (18) (19) | First Lien Senior Secured Loan - Revolver | P+ 4.50% | 10.00% | 9/9/2025 | $ | 1,013 | 972 | 999 | ||||||||||||||||
|
JHCC Holdings, LLC (7) (18) (19) | First Lien Senior Secured Loan | L+ 5.50% | 7.21% | 9/9/2025 | $ | 29,676 | 29,335 | 29,528 | ||||||||||||||||
| | | | | | | | | | | | | | | | | | | | | | | | | | |
|
Automotive Total | $ | 66,522 | $ | 67,374 | 6.6 | % | ||||||||||||||||||
| | | | | | | | | | | | | | | | | | | | | | | | | | |
|
Banking | Green Street Parent, LLC (2) (3) (5) (18) (19) | First Lien Senior Secured Loan - Revolver | - | - | 8/27/2025 | $ | - | (46 | ) | (48 | ) | |||||||||||||
|
Green Street Parent, LLC (12) (18) (19) (29) | First Lien Senior Secured Loan | L+ 5.25% | 7.05% | 8/27/2026 | $ | 14,480 | 14,201 | 14,190 | ||||||||||||||||
|
Transaction Network Services, Inc. (12) (15) (19) (21) (29) | First Lien Senior Secured Loan | L+ 4.00% | 5.93% | 8/15/2022 | $ | 11,630 | 11,501 | 11,324 | ||||||||||||||||
| | | | | | | | | | | | | | | | | | | | | | | | | | |
|
Banking Total | $ | 25,656 | $ | 25,466 | 2.5 | % | ||||||||||||||||||
| | | | | | | | | | | | | | | | | | | | | | | | | | |
|
Beverage, Food & Tobacco | Hearthside Food Solutions, LLC | Corporate Bond | - | 8.50% | 6/1/2026 | $ | 10,000 | 9,814 | 9,382 | |||||||||||||||
|
NPC International, Inc. (12) (15) (21) (33) | Second Lien Senior Secured Loan | L+ 7.50% | 9.43% | 4/18/2025 | $ | 9,159 | 9,190 | 1,101 | ||||||||||||||||
|
NPC International, Inc. (15) (33) | First Lien Senior Secured Loan | L+ 3.50% | 5.42% | 4/19/2024 | $ | 4,937 | 4,963 | 2,328 | ||||||||||||||||
| | | | | | | | | | | | | | | | | | | | | | | | | | |
|
Beverage, Food & Tobacco Total | $ | 23,967 | $ | 12,811 | 1.3 | % | ||||||||||||||||||
| | | | | | | | | | | | | | | | | | | | | | | | | | |
139
|
Capital Equipment | Dorner Manufacturing Corp. (3) (5) (15) (19) | First Lien Senior Secured Loan - Revolver | - | - | 3/15/2022 | $ | - | (12 | ) | - | ||||||||||||||
|
Dorner Manufacturing Corp. (12) (15) (19) | First Lien Senior Secured Loan | L+ 5.75% | 7.71% | 3/15/2023 | $ | 7,890 | 7,766 | 7,890 | ||||||||||||||||
|
East BCC Coinvest II,LLC (14) (19) (25) | Equity Interest | - | - | - | 1,419 | 1,419 | 1,419 | |||||||||||||||||
|
Electronics For Imaging, Inc. (18) (19) (21) | Second Lien Senior Secured Loan | L+ 9.00% | 10.94% | 7/23/2027 | $ | 13,070 | 12,253 | 12,220 | ||||||||||||||||
|
Engineered Controls International, LLC (12) (19) (21) (29) (32) | First Lien Senior Secured Loan | L+ 7.00% | 8.70% | 11/5/2024 | $ | 33,599 | 32,861 | 32,843 | ||||||||||||||||
|
EXC Holdings III Corp. (12) (15) (21) (29) | Second Lien Senior Secured Loan | L+ 7.50% | 9.59% | 12/1/2025 | $ | 8,240 | 8,252 | 7,993 | ||||||||||||||||
|
FCG Acquisitions, Inc. (14) (19) (25) | Preferred equity | - | - | - | 4 | 4,251 | 7,263 | |||||||||||||||||
|
FFI Holdings I Corp (3) (5) (15) (19) (28) | First Lien Senior Secured Loan - Delayed Draw | - | - | 1/24/2025 | $ | - | (9 | ) | 3 | |||||||||||||||
|
FFI Holdings I Corp (3) (15) (19) (30) | First Lien Senior Secured Loan - Revolver | L+ 5.75% | 7.95% | 1/24/2025 | $ | 3,438 | 3,368 | 3,465 | ||||||||||||||||
|
FFI Holdings I Corp (7) (12) (15) (19) (29) | First Lien Senior Secured Loan | L+ 5.75% | 7.60% | 1/24/2025 | $ | 68,421 | 67,842 | 68,763 | ||||||||||||||||
|
Tidel Engineering, L.P. (3) (15) (19) | First Lien Senior Secured Loan - Revolver | - | - | 3/1/2023 | $ | - | - | - | ||||||||||||||||
|
Tidel Engineering, L.P. (7) (15) (19) | First Lien Senior Secured Loan | L+ 6.25% | 8.19% | 3/1/2024 | $ | 38,302 | 38,302 | 38,302 | ||||||||||||||||
|
Velvet Acquisition B.V. (6) (18) (19) (21) | Second Lien Senior Secured Loan | EURIBOR+ 8.00% | 8.00% | 4/17/2026 | € | 6,013 | 7,325 | 6,752 | ||||||||||||||||
| | | | | | | | | | | | | | | | | | | | | | | | | | |
|
Capital Equipment Total | $ | 183,618 | $ | 186,913 | 18.4 | % | ||||||||||||||||||
| | | | | | | | | | | | | | | | | | | | | | | | | | |
|
Chemicals, Plastics & Rubber | AP Plastics Group, LLC (3) (15) (19) | First Lien Senior Secured Loan - Revolver | - | - | 8/2/2021 | $ | - | - | - | |||||||||||||||
|
AP Plastics Group, LLC (7) (15) (19) | First Lien Senior Secured Loan | L+ 5.25% | 6.94% | 8/1/2022 | $ | 19,856 | 19,566 | 19,756 | ||||||||||||||||
|
Niacet b.v. (15) (19) (21) | First Lien Senior Secured Loan | EURIBOR+ 4.50% | 5.50% | 2/1/2024 | € | 3,684 | 3,949 | 4,126 | ||||||||||||||||
|
Plaskolite, Inc. (15) (29) | First Lien Senior Secured Loan | L+ 4.25% | 6.04% | 12/15/2025 | $ | 8,933 | 8,773 | 8,564 | ||||||||||||||||
| | | | | | | | | | | | | | | | | | | | | | | | | | |
|
Chemicals, Plastics & Rubber Total | $ | 32,288 | $ | 32,446 | 3.2 | % | ||||||||||||||||||
| | | | | | | | | | | | | | | | | | | | | | | | | | |
|
Construction & Building | Chase Industries, Inc. (15) (19) (29) | First Lien Senior Secured Loan - Delayed Draw | L+ 4.00% | 5.94% | 5/12/2025 | $ | 1,115 | 1,115 | 1,111 | |||||||||||||||
|
Chase Industries, Inc. (12) (15) (19) (29) | First Lien Senior Secured Loan | L+ 4.00% (1.5% PIK) | 7.44% | 5/12/2025 | $ | 11,812 | 11,762 | 11,753 | ||||||||||||||||
|
Crown Subsea (12) (18) (29) | First Lien Senior Secured Loan | L+ 6.00% | 7.69% | 11/3/2025 | $ | 9,696 | 9,566 | 9,675 | ||||||||||||||||
|
Elk Parent Holdings, LP (14) (19) (25) | Equity Interest | - | - | - | 1 | 12 | 12 | |||||||||||||||||
|
Elk Parent Holdings, LP (14) (19) (25) | Preferred Equity | - | - | - | 120 | 1,202 | 1,202 | |||||||||||||||||
|
PP Ultimate Holdings B, LLC (14) (19) (25) | Equity Interest | - | - | - | 1 | 1,352 | 1,613 | |||||||||||||||||
|
Profile Products LLC (2) (3) (5) (15) (19) | First Lien Senior Secured Loan - Revolver | - | - | 12/20/2024 | $ | - | (64 | ) | (10 | ) | ||||||||||||||
|
Profile Products LLC (7) (15) (19) | First Lien Senior Secured Loan | L+ 5.50% | 7.44% | 12/20/2024 | $ | 35,003 | 34,367 | 34,915 | ||||||||||||||||
|
Regan Development Holdings Limited (6) (17) (19) | First Lien Senior Secured Loan | EURIBOR+ 6.50% | 7.00% | 4/18/2022 | € | 2,051 | 2,235 | 2,303 | ||||||||||||||||
|
Regan Development Holdings Limited (6) (17) (19) | First Lien Senior Secured Loan | EURIBOR+ 6.50% | 7.00% | 4/18/2022 | € | 665 | 755 | 747 | ||||||||||||||||
|
Regan Development Holdings Limited (6) (17) (19) | First Lien Senior Secured Loan | EURIBOR+ 6.50% | 7.00% | 4/18/2022 | € | 6,226 | 6,710 | 6,992 | ||||||||||||||||
|
YLG Holdings, Inc. (2) (3) (15) (19) (28) | First Lien Senior Secured Loan - Delayed Draw | - | - | 10/31/2025 | € | - | - | (51 | ) | |||||||||||||||
|
YLG Holdings, Inc. (2) (3) (5) (15) (19) | First Lien Senior Secured Loan - Revolver | L+ 5.75% | - | 10/31/2025 | € | - | (83 | ) | (171 | ) | ||||||||||||||
|
YLG Holdings, Inc. (7) (12) (15) (19) (29) | First Lien Senior Secured Loan | L+ 5.75% | 7.66% | 10/31/2025 | € | 38,862 | 38,484 | 38,085 | ||||||||||||||||
| | | | | | | | | | | | | | | | | | | | | | | | | | |
|
Construction & Building Total | $ | 107,413 | $ | 108,176 | 10.6 | % | ||||||||||||||||||
| | | | | | | | | | | | | | | | | | | | | | | | | | |
140
|
Consumer Goods: Durable | New Milani Group LLC (12) (15) (19) (29) | First Lien Senior Secured Loan | L+ 5.00% | 6.94% | 6/6/2024 | $ | 17,100 | 16,968 | 16,672 | |||||||||||||||
|
TLC Holdco LP (14) (19) (25) | Equity Interest | - | - | - | 1,188 | 1,186 | 1,188 | |||||||||||||||||
|
TLC Purchaser, Inc. (2) (3) (5) (19) | First Lien Senior Secured Loan - Delayed Draw | - | - | 10/13/2025 | $ | - | (69 | ) | (71 | ) | ||||||||||||||
|
TLC Purchaser, Inc. (3) (19) | First Lien Senior Secured Loan - Revolver | P+ 4.75% | 9.50% | 10/13/2025 | $ | 3,916 | 3,745 | 3,738 | ||||||||||||||||
|
TLC Purchaser, Inc. (12) (19) (21) (29) | First Lien Senior Secured Loan | L+ 5.75% | 7.49% | 10/13/2025 | $ | 42,721 | 41,882 | 41,867 | ||||||||||||||||
| | | | | | | | | | | | | | | | | | | | | | | | | | |
|
Consumer Goods: Durable Total | $ | 63,712 | $ | 63,394 | 6.2 | % | ||||||||||||||||||
| | | | | | | | | | | | | | | | | | | | | | | | | | |
|
Consumer Goods: Non-Durable | FineLine Technologies, Inc. (3) (15) (19) | First Lien Senior Secured Loan - Revolver | P+ 3.25% | 8.00% | 11/4/2022 | $ | 1,966 | 1,944 | 1,952 | |||||||||||||||
|
FineLine Technologies, Inc. (12) (15) (19) (21) (29) | First Lien Senior Secured Loan | L+ 4.25% | 6.05% | 11/4/2022 | $ | 31,384 | 31,217 | 31,228 | ||||||||||||||||
|
Kronos Acquisition Holdings Inc. (18) (19) (21) | First Lien Senior Secured Loan | L+ 7.00% | 8.80% | 5/15/2023 | $ | 2,647 | 2,605 | 2,627 | ||||||||||||||||
|
MND Holdings III Corp (15) (19) (21) (29) | First Lien Senior Secured Loan | L+ 3.50% | 5.44% | 6/19/2024 | $ | 11,642 | 11,667 | 10,944 | ||||||||||||||||
|
RoC Opco LLC (3) (5) (15) (19) | First Lien Senior Secured Loan - Revolver | - | - | 2/25/2025 | $ | - | (176 | ) | - | |||||||||||||||
|
RoC Opco LLC (12) (15) (19) (21) (29) | First Lien Senior Secured Loan | L+ 7.25% | 9.19% | 2/25/2025 | $ | 40,793 | 39,888 | 40,793 | ||||||||||||||||
|
Solaray, LLC (7) (15) (19) | First Lien Senior Secured Loan - Delayed Draw | L+ 6.00% | 7.85% | 9/11/2023 | $ | 14,573 | 14,573 | 14,501 | ||||||||||||||||
|
Solaray, LLC (3) (15) (19) | First Lien Senior Secured Loan - Revolver | L+ 4.50% | 6.40% | 9/9/2022 | $ | 11,674 | 11,629 | 11,674 | ||||||||||||||||
|
Solaray, LLC (7) (15) (19) | First Lien Senior Secured Loan | L+ 6.00% | 7.82% | 9/11/2023 | $ | 42,610 | 42,610 | 42,397 | ||||||||||||||||
|
WU Holdco, Inc. (3) (7) (15) (19) | First Lien Senior Secured Loan - Delayed Draw | L+ 5.50% | 7.44% | 3/26/2026 | $ | 832 | 778 | 832 | ||||||||||||||||
|
WU Holdco, Inc. (3) (5) (18) (19) | First Lien Senior Secured Loan - Revolver | - | - | 3/26/2025 | $ | - | (56 | ) | - | |||||||||||||||
|
WU Holdco, Inc. (7) (15) (19) | First Lien Senior Secured Loan | L+ 5.50% | 7.44% | 3/26/2026 | $ | 39,705 | 38,923 | 39,705 | ||||||||||||||||
| | | | | | | | | | | | | | | | | | | | | | | | | | |
|
Consumer Goods: Non-Durable Total | $ | 195,602 | $ | 196,653 | 19.3 | % | ||||||||||||||||||
| | | | | | | | | | | | | | | | | | | | | | | | | | |
|
Containers, Packaging, & Glass | Automate Intermediate Holdings II S.à r.l. (6) (18) (19) (21) | Second Lien Senior Secured Loan | L+ 7.75% | 9.55% | 7/22/2027 | $ | 11,870 | 11,637 | 11,633 | |||||||||||||||
| | | | | | | | | | | | | | | | | | | | | | | | | | |
|
Containers, Packaging, & Glass Total | $ | 11,637 | $ | 11,633 | 1.1 | % | ||||||||||||||||||
| | | | | | | | | | | | | | | | | | | | | | | | | | |
|
Energy: Electricity | Infinite Electronics International Inc. (12) (18) (19) (29) | First Lien Senior Secured Loan | L+ 4.00% | 5.80% | 7/2/2025 | $ | 19,752 | 19,739 | 19,654 | |||||||||||||||
|
Infinite Electronics International Inc. (18) (19) (21) | Second Lien Senior Secured Loan | L+ 8.00% | 9.80% | 7/2/2026 | $ | 2,480 | 2,433 | 2,480 | ||||||||||||||||
| | | | | | | | | | | | | | | | | | | | | | | | | | |
|
Energy: Electricity Total | $ | 22,172 | $ | 22,134 | 2.2 | % | ||||||||||||||||||
| | | | | | | | | | | | | | | | | | | | | | | | | | |
|
Energy: Oil & Gas | Amspec Services, Inc. (3) (15) (19) | First Lien Senior Secured Loan - Revolver | P+ 3.75% | 9.00% | 7/2/2024 | $ | 2,125 | 2,071 | 2,125 | |||||||||||||||
|
Amspec Services, Inc. (7) (15) (19) | First Lien Senior Secured Loan | L+ 6.25% | 8.19% | 7/2/2024 | $ | 44,100 | 43,605 | 44,100 | ||||||||||||||||
|
Blackbrush Oil & Gas, L.P. (12) (15) (19) (21) (29) | First Lien Senior Secured Loan | L+ 8.00% | 9.89% | 2/9/2024 | $ | 32,075 | 31,588 | 31,754 | ||||||||||||||||
| | | | | | | | | | | | | | | | | | | | | | | | | | |
|
Energy: Oil & Gas Total | $ | 77,264 | $ | 77,979 | 7.7 | % | ||||||||||||||||||
| | | | | | | | | | | | | | | | | | | | | | | | | | |
|
Environmental Industries | Adler & Allan Group Limited (6) (17) (19) (21) (22) | First Lien Last Out | GBP LIBOR+ 8.25% (2% PIK) | 11.04% | 9/30/2022 | £ | 13,279 | 16,814 | 17,612 | |||||||||||||||
| | | | | | | | | | | | | | | | | | | | | | | | | | |
|
Environmental Industries Total | $ | 16,814 | $ | 17,612 | 1.7 | % | ||||||||||||||||||
| | | | | | | | | | | | | | | | | | | | | | | | | | |
141
|
FIRE: Insurance | Ivy Finco Limited (6) (18) (19) (21) | First Lien Senior Secured Loan | GBP LIBOR+ 5.00% | 5.70% | 5/19/2025 | £ | 7,217 | 8,950 | 9,381 | |||||||||||||||
|
Ivy Finco Limited (3) (6) (18) (19) | First Lien Senior Secured Loan | GBP LIBOR+ 5.00% | 5.70% | 5/19/2025 | £ | 2,691 | 3,194 | 3,382 | ||||||||||||||||
|
Margaux Acquisition Inc. (3) (7) (15) (19) | First Lien Senior Secured Loan - Delayed Draw | L+ 6.00% | 8.10% | 12/19/2024 | $ | 2,186 | 2,020 | 2,186 | ||||||||||||||||
|
Margaux Acquisition, Inc. (3) (5) (15) (19) | First Lien Senior Secured Loan - Revolver | - | - | 12/19/2024 | $ | - | (48 | ) | - | |||||||||||||||
|
Margaux Acquisition Inc. (7) (15) (19) (29) | First Lien Senior Secured Loan | L+ 5.50% | 7.60% | 12/19/2024 | $ | 28,916 | 28,392 | 28,916 | ||||||||||||||||
|
Margaux UK Finance Limited (3) (5) (6) (15) (19) | First Lien Senior Secured Loan - Revolver | - | - | 12/19/2024 | £ | - | (10 | ) | - | |||||||||||||||
|
Margaux UK Finance Limited (6) (7) (15) (19) | First Lien Senior Secured Loan | GBP LIBOR+ 5.50% | 6.50% | 12/19/2024 | £ | 7,706 | 9,869 | 10,221 | ||||||||||||||||
| | | | | | | | | | | | | | | | | | | | | | | | | | |
|
FIRE: Insurance Total | $ | 52,367 | $ | 54,086 | 5.3 | % | ||||||||||||||||||
| | | | | | | | | | | | | | | | | | | | | | | | | | |
|
FIRE: Real Estate | Spectre (Carrisbrook House) Limited (6) (15) (19) | First Lien Senior Secured Loan | EURIBOR+ 7.50% | 8.50% | 8/9/2021 | € | 9,300 | 10,786 | 10,443 | |||||||||||||||
| | | | | | | | | | | | | | | | | | | | | | | | | | |
|
FIRE: Real Estate Total | $ | 10,786 | $ | 10,443 | 1.0 | % | ||||||||||||||||||
| | | | | | | | | | | | | | | | | | | | | | | | | | |
|
Forest Products & Paper | Solenis International LLC (18) (21) | Second Lien Senior Secured Loan | L+ 8.50% | 10.41% | 6/26/2026 | $ | 10,601 | 10,301 | 9,700 | |||||||||||||||
| | | | | | | | | | | | | | | | | | | | | | | | | | |
|
Forest Products & Paper Total | $ | 10,301 | $ | 9,700 | 1.0 | % | ||||||||||||||||||
| | | | | | | | | | | | | | | | | | | | | | | | | | |
|
Healthcare & Pharmaceuticals | CB Titan Holdings, Inc. (14) (19) (25) | Preferred equity | - | - | - | 1,953 | 1,953 | 3,378 | ||||||||||||||||
|
Clarkson Eyecare, LLC (12) (15) (19) (21) (29) | First Lien Senior Secured Loan | L+ 6.25% | 8.05% | 4/2/2021 | $ | 23,118 | 22,747 | 23,118 | ||||||||||||||||
|
Clarkson Eyecare, LLC (12) (15) (19) (21) (29) | First Lien Senior Secured Loan | L+ 6.25% | 8.05% | 4/2/2021 | $ | 15,284 | 15,031 | 15,284 | ||||||||||||||||
|
Clinical Innovations, LLC (3) (15) (19) (22) | First Lien Last Out - Revolver | L+ 5.50% | 7.21% | 10/17/2022 | $ | 772 | 757 | 772 | ||||||||||||||||
|
Clinical Innovations, LLC (12) (15) (19) (22) (29) | First Lien Last Out | L+ 5.50% | 7.30% | 10/17/2023 | $ | 10,916 | 10,744 | 10,916 | ||||||||||||||||
|
Clinical Innovations (12) (15) (19) (29) | First Lien Senior Secured Loan | L+ 5.50% | 7.30% | 10/17/2023 | $ | 511 | 500 | 511 | ||||||||||||||||
|
CPS Group Holdings, Inc. (3) (5) (15) (19) | First Lien Senior Secured Loan - Revolver | - | - | 3/3/2025 | $ | - | (64 | ) | - | |||||||||||||||
|
CPS Group Holdings, Inc. (7) (15) (19) | First Lien Senior Secured Loan | L+ 5.25% | 7.19% | 3/3/2025 | $ | 55,905 | 55,390 | 55,905 | ||||||||||||||||
|
Datix Bidco Limited (3) (5) (6) (18) (19) | First Lien Senior Secured Loan - Revolver | - | - | 10/28/2024 | £ | - | (21 | ) | - | |||||||||||||||
|
Datix Bidco Limited (6) (18) (19) (21) | Second Lien Senior Secured Loan | GBP LIBOR+ 7.75% | 8.63% | 4/27/2026 | £ | 12,134 | 16,314 | 16,093 | ||||||||||||||||
|
Datix Bidco Limited (6) (18) (19) (21) | First Lien Senior Secured Loan | BBSW+ 4.50% | 5.50% | 4/28/2025 | AUD | 4,212 | 3,205 | 2,958 | ||||||||||||||||
|
Golden State Buyer, Inc. (12) (18) (19) (29) | First Lien Senior Secured Loan | L+ 4.75% | 6.55% | 6/22/2026 | $ | 15,230 | 15,084 | 14,887 | ||||||||||||||||
|
Great Expressions Dental Centers PC (3) (15) (19) (34) | First Lien Senior Secured Loan - Revolver | L+ 4.75% (0.5% PIK) | 7.22% | 9/28/2022 | $ | 1,017 | 1,009 | 789 | ||||||||||||||||
|
Great Expressions Dental Centers PC (12) (15) (19) | First Lien Senior Secured Loan | L+ 5.25% | 7.17% | 9/28/2023 | $ | 7,609 | 7,540 | 6,125 | ||||||||||||||||
|
Island Medical Management Holdings, LLC (15) (19) (29) | First Lien Senior Secured Loan | L+ 6.50% | 8.30% | 9/1/2022 | $ | 9,160 | 9,071 | 8,428 | ||||||||||||||||
|
Medical Depot Holdings, Inc. (12) (15) (21) | First Lien Senior Secured Loan | L+ 7.50% | 9.44% | 1/3/2023 | $ | 16,189 | 14,935 | 12,293 | ||||||||||||||||
|
Mendel Bidco, Inc. (18) (19) (21) | First Lien Senior Secured Loan | EURIBOR+ 4.50% | 4.50% | 6/17/2027 | € | 10,033 | 11,134 | 10,985 | ||||||||||||||||
|
Mendel Bidco, Inc. (12) (18) (19) (29) | First Lien Senior Secured Loan | L+ 4.50% | 6.45% | 6/17/2027 | $ | 19,966 | 19,492 | 19,467 | ||||||||||||||||
|
Mertus 522. GmbH (3) (6) (18) (19) | First Lien Senior Secured Loan - Delayed Draw | EURIBOR+ 5.75% | 5.75% | 5/28/2026 | € | 875 | 602 | 946 | ||||||||||||||||
|
Mertus 522. GmbH (6) (18) (19) (21) | First Lien Senior Secured Loan | EURIBOR+ 5.75% | 5.75% | 5/28/2026 | € | 22,468 | 24,540 | 25,167 | ||||||||||||||||
|
TecoStar Holdings, Inc. (12) (15) (19) (21) | Second Lien Senior Secured Loan | L+ 8.50% | 10.24% | 11/1/2024 | $ | 9,472 | 9,282 | 9,472 | ||||||||||||||||
|
U.S. Anesthesia Partners, Inc. (12) (15) (19) (21) | Second Lien Senior Secured Loan | L+ 7.25% | 9.05% | 6/23/2025 | $ | 16,520 | 16,334 | 16,520 | ||||||||||||||||
| | | | | | | | | | | | | | | | | | | | | | | | | | |
|
Healthcare & Pharmaceuticals Total | $ | 255,579 | $ | 254,014 | 24.9 | % | ||||||||||||||||||
| | | | | | | | | | | | | | | | | | | | | | | | | | |
142
|
High Tech Industries | AMI US Holdings Inc. (3) (6) (15) (19) | First Lien Senior Secured Loan - Revolver | L+ 5.50% | 7.25% | 4/1/2024 | $ | 767 | 737 | 767 | |||||||||||||||
|
AMI US Holdings Inc. (6) (12) (15) (19) (29) | First Lien Senior Secured Loan | L+ 5.50% | 7.19% | 4/1/2025 | $ | 13,157 | 12,916 | 13,157 | ||||||||||||||||
|
Appriss Holdings, Inc. (3) (5) (18) (19) | First Lien Senior Secured Loan - Revolver | - | - | 5/30/2025 | $ | - | (61 | ) | - | |||||||||||||||
|
Appriss Holdings, Inc. (7) (18) (19) | First Lien Senior Secured Loan | L+ 5.50% | 7.44% | 5/29/2026 | $ | 48,876 | 48,272 | 48,876 | ||||||||||||||||
|
CB Nike IntermediateCo Ltd (3) (6) (15) (19) | First Lien Senior Secured Loan - Revolver | L+ 5.00% | 6.93% | 10/31/2025 | $ | 1,550 | 1,464 | 1,461 | ||||||||||||||||
|
CB Nike IntermediateCo Ltd (6) (12) (15) (19) (21) (29) | First Lien Senior Secured Loan | L+ 5.00% | 6.93% | 10/31/2025 | $ | 35,422 | 34,729 | 34,714 | ||||||||||||||||
|
CMI Marketing Inc (3) (5) (15) (19) | First Lien Senior Secured Loan - Revolver | - | - | 5/24/2023 | $ | - | (14 | ) | - | |||||||||||||||
|
CMI Marketing Inc (12) (15) (19) (29) | First Lien Senior Secured Loan | L+ 4.50% | 6.30% | 5/24/2024 | $ | 15,256 | 15,136 | 15,256 | ||||||||||||||||
|
Drilling Info Holdings, Inc (12) (18) (21) (29) | First Lien Senior Secured Loan | L+ 4.25% | 6.05% | 7/30/2025 | $ | 22,609 | 22,532 | 22,496 | ||||||||||||||||
|
Element Buyer, Inc. (3) (7) (15) (19) | First Lien Senior Secured Loan - Delayed Draw | L+ 5.25% | 7.05% | 7/18/2025 | $ | 3,366 | 3,466 | 3,366 | ||||||||||||||||
|
Element Buyer, Inc. (3) (15) (19) | First Lien Senior Secured Loan - Revolver | L+ 5.25% | 7.05% | 7/19/2024 | $ | 1,417 | 1,368 | 1,417 | ||||||||||||||||
|
Element Buyer, Inc. (7) (15) (19) | First Lien Senior Secured Loan | L+ 5.25% | 7.05% | 7/18/2025 | $ | 37,772 | 38,104 | 37,772 | ||||||||||||||||
|
Elo Touch Solutions, Inc. (18) (29) | First Lien Senior Secured Loan | L+ 6.50% | 8.24% | 12/15/2025 | $ | 3,261 | 3,168 | 3,244 | ||||||||||||||||
|
Everest Bidco (6) (15) (19) (21) | Second Lien Senior Secured Loan | GBP LIBOR+ 7.50% | 8.50% | 7/3/2026 | £ | 10,216 | 13,098 | 13,076 | ||||||||||||||||
|
MeridianLink, Inc. (15) (29) | First Lien Senior Secured Loan | L+ 4.00% | 5.80% | 5/30/2025 | $ | 1,825 | 1,804 | 1,798 | ||||||||||||||||
|
Netsmart Technologies, Inc. (15) (19) (21) | Second Lien Senior Secured Loan | L+ 7.50% | 9.30% | 10/19/2023 | $ | 2,749 | 2,749 | 2,735 | ||||||||||||||||
|
nThrive, Inc. (15) (19) (21) | Second Lien Senior Secured Loan | L+ 9.75% | 11.55% | 4/20/2023 | $ | 8,000 | 7,986 | 7,080 | ||||||||||||||||
|
Park Place Technologies (15) (21) | Second Lien Senior Secured Loan | L+ 8.00% | 9.80% | 3/30/2026 | $ | 6,733 | 6,688 | 6,682 | ||||||||||||||||
|
Symplr Software, Inc. (3) (18) (19) | First Lien Senior Secured Loan - Revolver | L+ 6.00% | 7.95% | 11/30/2023 | $ | 4,499 | 4,445 | 4,499 | ||||||||||||||||
|
Symplr Software, Inc. (7) (18) (19) | First Lien Senior Secured Loan | L+ 6.00% | 7.94% | 11/28/2025 | $ | 61,060 | 60,211 | 61,060 | ||||||||||||||||
|
Utimaco, Inc. (6) (18) (19) (21) (29) | First Lien Senior Secured Loan | L+ 4.50% | 6.42% | 8/9/2027 | $ | 14,849 | 14,490 | 14,775 | ||||||||||||||||
|
Ventiv Topco, Inc. (14) (19) (25) | Equity Interest | - | - | - | 28 | 2,833 | 2,886 | |||||||||||||||||
|
Ventiv Holdco, Inc. (2) (3) (5) (18) (19) | First Lien Senior Secured Loan - Revolver | L+ 5.50% | - | 9/3/2025 | $ | - | (49 | ) | (17 | ) | ||||||||||||||
|
Ventiv Holdco, Inc. (7) (15) (19) | First Lien Senior Secured Loan | L+ 5.50% | 7.44% | 9/3/2025 | $ | 24,299 | 23,948 | 24,178 | ||||||||||||||||
|
VPARK BIDCO AB (6) (19) (21) | First Lien Senior Secured Loan | CIBOR+ 4.00% | 4.75% | 3/10/2025 | DKK | 56,999 | 9,160 | 8,566 | ||||||||||||||||
|
VPARK BIDCO AB (6) (16) (19) (21) | First Lien Senior Secured Loan | NIBOR+ 4.00% | 5.86% | 3/10/2025 | NOK | 74,020 | 9,197 | 8,430 | ||||||||||||||||
|
Zywave, Inc. (3) (15) (19) | First Lien Senior Secured Loan - Revolver | L+ 5.00% | 6.80% | 11/17/2022 | $ | 428 | 419 | 429 | ||||||||||||||||
|
Zywave, Inc. (12) (15) (19) (29) | First Lien Senior Secured Loan | L+ 5.00% | 6.93% | 11/17/2022 | $ | 17,370 | 17,290 | 17,370 | ||||||||||||||||
| | | | | | | | | | | | | | | | | | | | | | | | | | |
|
High Tech Industries Total | $ | 356,086 | $ | 356,073 | 35.0 | % | ||||||||||||||||||
| | | | | | | | | | | | | | | | | | | | | | | | | | |
|
Hotel, Gaming & Leisure | Aimbridge Acquisition Co., Inc. (12) (18) (19) (21) (29) | Second Lien Senior Secured Loan | L+ 7.50% | 9.19% | 2/1/2027 | $ | 20,193 | 19,649 | 19,688 | |||||||||||||||
|
Captain D's LLC (3) (15) (19) (35) | First Lien Senior Secured Loan - Revolver | P+ 3.50% | 7.45% | 12/15/2023 | $ | 1,285 | 1,273 | 1,266 | ||||||||||||||||
|
Captain D's LLC (12) (15) (19) (29) | First Lien Senior Secured Loan | L+ 4.50% | 6.44% | 12/15/2023 | $ | 13,037 | 12,940 | 12,907 | ||||||||||||||||
|
Quidditch Acquisition, Inc. (12) (15) (19) (29) | First Lien Senior Secured Loan | L+ 7.00% | 8.80% | 3/21/2025 | $ | 19,023 | 19,004 | 19,213 | ||||||||||||||||
| | | | | | | | | | | | | | | | | | | | | | | | | | |
|
Hotel, Gaming & Leisure Total | $ | 52,866 | $ | 53,074 | 5.2 | % | ||||||||||||||||||
| | | | | | | | | | | | | | | | | | | | | | | | | | |
|
Media: Advertising, Printing & Publishing | A-L Parent LLC (12) (15) (21) | Second Lien Senior Secured Loan | L+ 7.25% | 9.05% | 12/2/2024 | $ | 4,050 | 4,020 | 3,594 | |||||||||||||||
|
Ansira Holdings, Inc. (3) (7) (15) (19) | First Lien Senior Secured Loan - Delayed Draw | L+ 5.75% | 7.51% | 12/20/2022 | $ | 2,936 | 2,926 | 2,458 | ||||||||||||||||
|
Ansira Holdings, Inc. (15) (19) (24) | First Lien Senior Secured Loan - Revolver | L+ 5.00% | 7.22% | 12/20/2022 | $ | 7,084 | 7,084 | 7,084 | ||||||||||||||||
|
Ansira Holdings, Inc. (7) (15) (19) | First Lien Senior Secured Loan | L+ 5.75% | 7.55% | 12/20/2022 | $ | 35,877 | 35,791 | 32,020 | ||||||||||||||||
|
Cruz Bay Publishing, Inc. (3) (15) (19) | First Lien Senior Secured Loan - Delayed Draw | P+ 5.00% | 9.75% | 2/28/2020 | $ | 876 | 865 | 876 | ||||||||||||||||
|
Cruz Bay Publishing (3) (15) (19) | First Lien Senior Secured Loan - Revolver | P+ 3.00% | 7.75% | 2/28/2020 | $ | 2,298 | 2,298 | 2,298 | ||||||||||||||||
|
Cruz Bay Publishing, Inc. (7) (15) (19) (27) | First Lien Senior Secured Loan | L+ 5.75% | 7.70% | 2/28/2020 | $ | 4,824 | 4,824 | 4,824 | ||||||||||||||||
|
Cruz Bay Publishing, Inc. (7) (15) (19) | First Lien Senior Secured Loan | L+ 6.75% | 8.46% | 2/28/2020 | $ | 1,611 | 1,611 | 1,611 | ||||||||||||||||
| | | | | | | | | | | | | | | | | | | | | | | | | | |
|
Media: Advertising, Printing & Publishing Total | $ | 59,419 | $ | 54,765 | 5.4 | % | ||||||||||||||||||
| | | | | | | | | | | | | | | | | | | | | | | | | | |
143
|
Media: Broadcasting & Subscription | Vital Holdco Limited (6) (12) (15) (19) (21) (29) | First Lien Senior Secured Loan | L+ 5.25% | 7.05% | 5/29/2026 | $ | 35,357 | 34,552 | 35,357 | |||||||||||||||
|
Vital Holdco Limited (6) (18) (19) (21) | First Lien Senior Secured Loan | EURIBOR+ 5.25% | 5.25% | 5/29/2026 | € | 7,917 | 8,613 | 8,890 | ||||||||||||||||
| | | | | | | | | | | | | | | | | | | | | | | | | | |
|
Media: Broadcasting & Subscription Total | $ | 43,165 | $ | 44,247 | 4.3 | % | ||||||||||||||||||
| | | | | | | | | | | | | | | | | | | | | | | | | | |
|
Media: Diversified & Production | Efficient Collaborative Retail Marketing Company, LLC (3) (15) (19) | First Lien Senior Secured Loan - Revolver | - | - | 6/15/2022 | $ | - | - | - | |||||||||||||||
|
Efficient Collaborative Retail Marketing Company, LLC (7) (15) (19) | First Lien Senior Secured Loan | L+ 6.75% | 8.69% | 6/15/2022 | $ | 15,095 | 15,185 | 15,095 | ||||||||||||||||
|
Efficient Collaborative Retail Marketing Company, LLC (7) (15) (19) | First Lien Senior Secured Loan | L+ 6.75% | 8.69% | 6/15/2022 | $ | 9,788 | 9,847 | 9,788 | ||||||||||||||||
|
International Entertainment Investments Limited (6) (18) (19) (21) | First Lien Senior Secured Loan | GBP LIBOR+ 4.00% | 4.86% | 5/31/2023 | £ | 8,686 | 10,638 | 11,520 | ||||||||||||||||
| | | | | | | | | | | | | | | | | | | | | | | | | | |
|
Media: Diversified & Production Total | $ | 35,670 | $ | 36,403 | 3.6 | % | ||||||||||||||||||
| | | | | | | | | | | | | | | | | | | | | | | | | | |
|
Retail | Batteries Plus Holding Corporation (3) (15) (19) | First Lien Senior Secured Loan - Revolver | - | - | 7/6/2022 | $ | - | - | - | |||||||||||||||
|
Batteries Plus Holding Corporation (7) (15) (19) | First Lien Senior Secured Loan | L+ 6.75% | 8.55% | 7/6/2022 | $ | 28,827 | 28,827 | 28,827 | ||||||||||||||||
|
Calceus Acquisition, Inc. (12) (18) (29) | First Lien Senior Secured Loan | L+ 5.50% | 7.30% | 2/12/2025 | $ | 5,997 | 5,947 | 6,000 | ||||||||||||||||
| | | | | | | | | | | | | | | | | | | | | | | | | | |
|
Retail Total | $ | 34,774 | $ | 34,827 | 3.4 | % | ||||||||||||||||||
| | | | | | | | | | | | | | | | | | | | | | | | | | |
|
Services: Business | AMCP Clean Acquisition Company, LLC (12) (18) (29) | First Lien Senior Secured Loan - Delayed Draw | L+ 4.25% | 6.19% | 6/16/2025 | $ | 3,894 | 3,886 | 3,806 | |||||||||||||||
|
AMCP Clean Acquisition Company, LLC (12) (18) (29) | First Lien Senior Secured Loan | L+ 4.25% | 6.19% | 6/16/2025 | $ | 16,093 | 16,062 | 15,731 | ||||||||||||||||
|
Comet Bidco Limited (6) (18) (21) | First Lien Senior Secured Loan | GBP LIBOR+ 5.00% | 5.70% | 9/30/2024 | £ | 7,362 | 9,488 | 9,605 | ||||||||||||||||
|
Elevator Holdco Inc. (14) (19) (25) | Equity Interest | - | - | - | 2 | 2,448 | 2,448 | |||||||||||||||||
|
Hightower Holding, LLC (2) (3) (5) (15) (19) | First Lien Senior Secured Loan - Delayed Draw | - | - | 1/31/2025 | $ | - | (15 | ) | (17 | ) | ||||||||||||||
|
Hightower Holding, LLC (12) (15) (19) (21) (29) (31) | First Lien Senior Secured Loan | L+ 5.00% | 6.80% | 1/31/2025 | $ | 34,589 | 34,432 | 34,503 | ||||||||||||||||
|
SumUp Holdings Luxembourg S.à.r.l. (6) (15) (19) (21) | First Lien Senior Secured Loan | EURIBOR+ 8.00% | 9.00% | 8/1/2024 | € | 15,957 | 17,658 | 17,873 | ||||||||||||||||
|
SumUp Holdings Luxembourg S.à.r.l. (3) (6) (15) (19) (21) | First Lien Senior Secured Loan | EURIBOR+ 8.00% | 9.00% | 8/1/2024 | € | 7,480 | 7,823 | 8,351 | ||||||||||||||||
|
TEI Holdings Inc. (3) (15) (19) | First Lien Senior Secured Loan - Revolver | L+ 6.00% | 7.83% | 12/23/2025 | $ | 1,509 | 1,464 | 1,464 | ||||||||||||||||
|
TEI Holdings Inc. (7) (12) (15) (19) (29) | First Lien Senior Secured Loan | L+ 6.00% | 7.93% | 12/23/2026 | $ | 49,050 | 48,340 | 48,559 | ||||||||||||||||
|
Valet Waste Holdings, Inc (12) (18) (21) (29) | First Lien Senior Secured Loan | L+ 3.75% | 5.55% | 9/29/2025 | $ | 23,747 | 23,700 | 23,539 | ||||||||||||||||
| | | | | | | | | | | | | | | | | | | | | | | | | | |
|
Services: Business Total | $ | 165,286 | $ | 165,862 | 16.3 | % | ||||||||||||||||||
| | | | | | | | | | | | | | | | | | | | | | | | | | |
|
Services: Consumer | Pearl Intermediate Parent LLC (18) (29) | Second Lien Senior Secured Loan | L+ 6.25% | 8.05% | 2/13/2026 | $ | 2,571 | 2,587 | 2,545 | |||||||||||||||
|
Surrey Bidco Limited (6) (17) (19) (21) | First Lien Senior Secured Loan | GBP LIBOR+ 6.00% | 6.78% | 5/11/2026 | £ | 5,000 | 6,138 | 6,466 | ||||||||||||||||
|
Trafalgar Bidco Limited (6) (18) (19) (21) | First Lien Senior Secured Loan | GBP LIBOR+ 5.00% | 5.70% | 9/11/2024 | £ | 6,011 | 7,727 | 7,733 | ||||||||||||||||
|
Zeppelin BidCo Pty Limited (6) (18) (19) (21) | First Lien Senior Secured Loan | BBSY+ 6.00% | 6.90% | 6/28/2024 | AUD | 20,621 | 14,006 | 14,050 | ||||||||||||||||
| | | | | | | | | | | | | | | | | | | | | | | | | | |
|
Services: Consumer Total | $ | 30,458 | $ | 30,794 | 3.0 | % | ||||||||||||||||||
| | | | | | | | | | | | | | | | | | | | | | | | | | |
144
|
Telecommunications | Conterra Ultra Broadband Holdings, Inc. (18) (29) | First Lien Senior Secured Loan | L+ 4.50% | 6.30% | 4/30/2026 | $ | 6,451 | 6,420 | 6,448 | |||||||||||||||
|
Horizon Telcom, Inc. (3) (12) (15) (19) (29) | First Lien Senior Secured Loan - Delayed Draw | L+ 4.75% | 6.46% | 6/15/2023 | $ | 481 | 465 | 464 | ||||||||||||||||
|
Horizon Telcom, Inc. (2) (3) (5) (15) (19) | First Lien Senior Secured Loan - Revolver | - | - | 6/15/2023 | $ | - | (2 | ) | (1 | ) | ||||||||||||||
|
Horizon Telcom, Inc. (12) (15) (19) (29) | First Lien Senior Secured Loan | L+ 4.75% | 6.44% | 6/15/2023 | $ | 13,730 | 13,577 | 13,592 | ||||||||||||||||
|
Masergy Holdings, Inc. (15) (29) | Second Lien Senior Secured Loan | L+ 7.50% | 9.46% | 12/16/2024 | $ | 857 | 863 | 840 | ||||||||||||||||
| | | | | | | | | | | | | | | | | | | | | | | | | | |
|
Telecommunications Total | $ | 21,323 | $ | 21,343 | 2.1 | % | ||||||||||||||||||
| | | | | | | | | | | | | | | | | | | | | | | | | | |
|
Transportation: Cargo | A&R Logistics, Inc. (3) (15) (19) | First Lien Senior Secured Loan - Revolver | L+ 5.75% | 7.85% | 5/5/2025 | $ | 1,053 | 940 | 1,053 | |||||||||||||||
|
A&R Logistics, Inc. (7) (12) (15) (19) (29) | First Lien Senior Secured Loan | L+ 5.75% | 7.85% | 5/5/2025 | $ | 43,976 | 43,130 | 43,976 | ||||||||||||||||
|
A&R Logistics, Inc. (7) (15) (19) | First Lien Senior Secured Loan | L+ 5.75% | 7.85% | 5/5/2025 | $ | 2,473 | 2,424 | 2,473 | ||||||||||||||||
|
A&R Logistics, Inc. (7) (15) (19) | First Lien Senior Secured Loan | L+ 5.75% | 7.66% | 5/5/2025 | $ | 6,096 | 6,004 | 6,096 | ||||||||||||||||
|
ARL Holdings, LLC. (14) (19) (25) | Equity Interest | - | - | - | - | 445 | 448 | |||||||||||||||||
|
ARL Holdings, LLC. (14) (19) (25) | Equity Interest | - | - | - | 9 | 9 | 8 | |||||||||||||||||
|
ENC Holding Corporation (12) (18) (29) | First Lien Senior Secured Loan | L+ 4.00% | 5.94% | 5/30/2025 | $ | 10,272 | 10,259 | 10,041 | ||||||||||||||||
|
Grammer Investment Holdings LLC (14) (19) (25) | Equity Interest | - | - | - | 1,011 | 1,011 | 1,021 | |||||||||||||||||
|
Grammer Investment Holdings LLC (19) (25) | Preferred Equity | 10% PIK | 10.00% | - | 6 | 646 | 679 | |||||||||||||||||
|
Grammer Investment Holdings LLC (14) (19) (25) | Warrants | - | - | - | 122 | - | 122 | |||||||||||||||||
|
Grammer Purchaser, Inc. (3) (15) (19) | First Lien Senior Secured Loan - Revolver | L+ 4.50% | 6.30% | 9/30/2024 | $ | 52 | 56 | 42 | ||||||||||||||||
|
Grammer Purchaser, Inc. (12) (15) (19) (29) | First Lien Senior Secured Loan - Revolver | L+ 4.50% | 6.31% | 9/30/2024 | $ | 10,206 | 10,043 | 10,104 | ||||||||||||||||
|
Omni Logistics, LLC (15) (19) | Subordinated Debt | L+ 11.50% | 13.30% | 1/19/2024 | $ | 15,000 | 14,752 | 15,000 | ||||||||||||||||
|
PS HoldCo, LLC (12) (15) (29) | First Lien Senior Secured Loan | L+ 4.75% | 6.55% | 3/13/2025 | $ | 23,277 | 23,265 | 22,084 | ||||||||||||||||
|
Toro Private Investments II, L.P. (6) (14) (19) (25) | Equity Interest | - | - | - | 3,090 | 3,090 | 3,090 | |||||||||||||||||
| | | | | | | | | | | | | | | | | | | | | | | | | | |
|
Transportation: Cargo Total | $ | 116,074 | $ | 116,237 | 11.4 | % | ||||||||||||||||||
| | | | | | | | | | | | | | | | | | | | | | | | | | |
|
Transportation: Consumer | Direct Travel, Inc. (3) (7) (15) (19) | First Lien Senior Secured Loan - Delayed Draw | L+ 6.50% | 8.44% | 12/1/2021 | $ | 1,471 | 1,382 | 1,471 | |||||||||||||||
|
Direct Travel, Inc. (7) (15) (19) | First Lien Senior Secured Loan - Delayed Draw | L+ 6.50% | 8.45% | 12/1/2021 | $ | 2,920 | 2,920 | 2,920 | ||||||||||||||||
|
Direct Travel, Inc. (3) (15) (19) | First Lien Senior Secured Loan - Revolver | - | - | 12/1/2021 | $ | - | - | - | ||||||||||||||||
|
Direct Travel, Inc. (7) (15) (19) (23) | First Lien Senior Secured Loan | L+ 6.50% | 8.40% | 12/1/2021 | $ | 49,667 | 49,667 | 49,667 | ||||||||||||||||
|
Toro Private Holdings III, Ltd (6) (12) (18) (29) | Second Lien Senior Secured Loan | L+ 9.00% | 10.94% | 5/28/2027 | $ | 8,998 | 8,504 | 7,604 | ||||||||||||||||
| | | | | | | | | | | | | | | | | | | | | | | | | | |
|
Transportation: Consumer Total | $ | 62,473 | $ | 61,662 | 6.1 | % | ||||||||||||||||||
| | | | | | | | | | | | | | | | | | | | | | | | | | |
|
Utilities: Electric | CSVC Acquisition Corp | Corporate Bond | - | 7.75% | 6/15/2025 | $ | 13,478 | 12,598 | 8,126 | |||||||||||||||
| | | | | | | | | | | | | | | | | | | | | | | | | | |
|
Utilities: Electric Total | $ | 12,598 | $ | 8,126 | 0.8 | % | ||||||||||||||||||
| | | | | | | | | | | | | | | | | | | | | | | | | | |
145
|
Wholesale | Abracon Group Holding, LLC. (14) (19) (25) | Equity Interest | - | - | - | 2 | 1,833 | 1,294 | ||||||||||||||||
|
Abracon Group Holding, LLC. (2) (3) (5) (15) (19) | First Lien Senior Secured Loan - Revolver | - | - | 7/18/2024 | $ | - | (32 | ) | (28 | ) | ||||||||||||||
|
Abracon Group Holding, LLC. (7) (13) (15) (19) | First Lien Senior Secured Loan | L+ 5.75% | 7.70% | 7/18/2024 | $ | 36,094 | 35,929 | 35,733 | ||||||||||||||||
|
Aramsco, Inc. (3) (18) (19) | First Lien Senior Secured Loan - Revolver | L+ 5.25% | 7.05% | 8/28/2024 | $ | 621 | 579 | 553 | ||||||||||||||||
|
Aramsco, Inc. (7) (18) (19) | First Lien Senior Secured Loan | L+ 5.25% | 7.05% | 8/28/2024 | $ | 24,288 | 23,902 | 23,802 | ||||||||||||||||
|
Armor Group, LP (14) (19) (25) | Equity Interest | - | - | - | 10 | 1,012 | 1,085 | |||||||||||||||||
|
PetroChoice Holdings, Inc. (12) (15) (19) (29) | First Lien Senior Secured Loan | L+ 5.00% | 6.93% | 8/19/2022 | $ | 9,948 | 9,867 | 9,500 | ||||||||||||||||
|
PetroChoice Holdings, Inc. (12) (15) (19) (29) | First Lien Senior Secured Loan | L+ 5.00% | 6.93% | 8/19/2022 | $ | 6,582 | 6,452 | 6,286 | ||||||||||||||||
| | | | | | | | | | | | | | | | | | | | | | | | | | |
|
Wholesale Total | $ | 79,542 | $ | 78,225 | 7.7 | % | ||||||||||||||||||
| | | | | | | | | | | | | | | | | | | | | | | | | | |
|
Non-Controlled/Non-Affiliate Investments Total | $ | 2,416,854 | $ | 2,403,250 | 236.0 | % | ||||||||||||||||||
| | | | | | | | | | | | | | | | | | | | | | | | | | |
Non-Controlled/Affiliate Investments |
|||||||||||||||||||||||||
|
Beverage, Food & Tobacco | ADT Pizza, LLC (10) (14) (19) (25) | Equity Interest | - | - | - | 6,720 | 6,720 | 6,720 | ||||||||||||||||
| | | | | | | | | | | | | | | | | | | | | | | | | | |
|
Beverage, Food & Tobacco Total | $ | 6,720 | $ | 6,720 | 0.6 | % | ||||||||||||||||||
| | | | | | | | | | | | | | | | | | | | | | | | | | |
|
Non-Controlled/Affiliate Investments Total | $ | 6,720 | $ | 6,720 | 0.6 | % | ||||||||||||||||||
| | | | | | | | | | | | | | | | | | | | | | | | | | |
Controlled Affiliate Investments |
|||||||||||||||||||||||||
|
Aerospace & Defense | ACC Holdco, LLC (10) (11) (19) (25) | Preferred equity | - | 16.00% | - | 10,828 | 10,824 | 10,828 | ||||||||||||||||
|
Air Comm Corporation LLC (10) (11) (12) (18) (19) (21) (29) | First Lien Senior Secured Loan | L+ 6.50% | 8.44% | 6/30/2025 | $ | 27,298 | 26,516 | 27,161 | ||||||||||||||||
|
BCC Jetstream Holdings Aviation (Off I), LLC (6) (10) (11) (19) (20) (25) | Equity Interest | - | - | - | 11,863 | 11,863 | 13,091 | |||||||||||||||||
|
BCC Jetstream Holdings Aviation (On II), LLC (10) (11) (19) (20) (25) | Equity Interest | - | - | - | 1,116 | 1,116 | 1,869 | |||||||||||||||||
|
BCC Jetstream Holdings Aviation (On II), LLC (10) (11) (19) (20) | First Lien Senior Secured Loan | - | 10.00% | 6/2/2022 | $ | 6,363 | 6,363 | 6,363 | ||||||||||||||||
|
Gale Aviation (Offshore) Co (6) (10) (11) (19) (25) | Equity Interest | - | - | - | 57,007 | 57,007 | 57,773 | |||||||||||||||||
| | | | | | | | | | | | | | | | | | | | | | | | | | |
|
Aerospace & Defense Total | $ | 113,689 | $ | 117,085 | 11.5 | % | ||||||||||||||||||
| | | | | | | | | | | | | | | | | | | | | | | | | | |
|
Controlled Affiliate Investments Total | $ | 113,689 | $ | 117,085 | 11.5 | % | ||||||||||||||||||
| | | | | | | | | | | | | | | | | | | | | | | | | | |
|
Investments Total | $ | 2,537,263 | $ | 2,527,055 | 248.1 | % | ||||||||||||||||||
| | | | | | | | | | | | | | | | | | | | | | | | | | |
Cash Equivalents |
|||||||||||||||||||||||||
|
Cash Equivalents | Goldman Sachs Financial Square Government Fund Institutional Share Class (36) | Cash Equivalents | - | 1.64% | - | $ | 66,965 | 66,965 | 66,965 | |||||||||||||||
| | | | | | | | | | | | | | | | | | | | | | | | | | |
|
Cash Equivalents Total | $ | 66,965 | $ | 66,965 | 6.6 | % | ||||||||||||||||||
| | | | | | | | | | | | | | | | | | | | | | | | | | |
|
Investments and Cash Equivalents Total | $ | 2,604,228 | $ | 2,594,020 | 254.7 | % | ||||||||||||||||||
| | | | | | | | | | | | | | | | | | | | | | | | | | |
146
Forward Foreign Currency Exchange Contracts
| |
Currency Purchased | Currency Sold | Counterparty | Settlement Date | Unrealized Appreciation (Depreciation) (8) |
|||||||
|---|---|---|---|---|---|---|---|---|---|---|---|---|
|
US DOLLARS 8,720 |
POUND STERLING 6,400 | Bank of New York Mellon | 9/21/2020 | $ | 288 | ||||||
|
POUND STERLING 6,220 |
US DOLLARS 8,192 | Bank of New York Mellon | 9/21/2020 | - | |||||||
|
US DOLLARS 12,177 |
EURO 10,370 | Bank of New York Mellon | 1/10/2020 | 552 | |||||||
|
EURO 3,270 |
US DOLLARS 2,930 | Bank of New York Mellon | 1/10/2020 | - | |||||||
|
US DOLLARS 11,874 |
EURO 10,300 | Bank of New York Mellon | 6/15/2020 | 194 | |||||||
|
US DOLLARS 412 |
POUND STERLING 310 | Citibank | 9/23/2020 | (1) | |||||||
|
US DOLLARS 25,257 |
POUND STERLING 19,410 | Goldman Sachs | 1/10/2020 | (465) | |||||||
|
US DOLLARS 68,701 |
POUND STERLING 53,430 | Goldman Sachs | 6/15/2020 | (2,399) | |||||||
|
US DOLLARS 83,784 |
EURO 72,370 | Goldman Sachs | 6/15/2020 | 1,716 | |||||||
|
US DOLLARS 16,897 |
AUSTRALIAN DOLLARS 24,180 | Goldman Sachs | 6/15/2020 | (167) | |||||||
|
US DOLLARS 8,885 |
DANISH KRONE 57,000 | Goldman Sachs | 6/15/2020 | 225 | |||||||
|
US DOLLARS 8,257 |
NORWEGIAN KRONE 74,020 | Goldman Sachs | 3/20/2020 | (161) | |||||||
| | | | | | | | | | | | | |
|
$ | (218) | ||||||||||
| | | | | | | | | | | | | |
| | | | | | | | | | | | | |
| | | | | | | | | | | | | |
| (1) The investments bear interest at a rate that may be determined by reference to the London Interbank Offered Rate ("LIBOR" or "L"), the Euro Interbank Offered Rate ("EURIBOR" or "E"), British Pound Sterling LIBOR Rate ("GBP LIBOR"), the Norwegian Interbank Offered Rate ("NIBOR" or "N"), the Copenhagen Interbank Offered Rate ("CIBOR" or "C"), the Bank Bill Swap Rate ("BBSW"), the Bank Bill Swap Bid Rate ("BBSY"), or the Prime Rate ("Prime" or "P") and which reset daily, monthly, quarterly or semiannually. Investments or a portion thereof may bear Payment-in-Kind ("PIK"). For each, the Company has provided the PIK or the spread over LIBOR, EURIBOR, GBP LIBOR, NIBOR, CIBOR, BBSW, BBSY, or Prime and the current weighted average interest rate in effect at December 31, 2019. Certain investments are subject to a LIBOR, EURIBOR, GBP LIBOR, NIBOR, CIBOR, BBSW, or Prime interest rate floor. | ||||||||||||
| (2) The negative fair value is the result of the capitalized discount on the loan or the unfunded commitment being valued below par. | ||||||||||||
| (3) Position or portion thereof is an unfunded loan commitment, and no interest is being earned on the unfunded portion. The investment may be subject to an unused/letter of credit facility fee. | ||||||||||||
| (4) Percentages are based on the Company's net assets of $1,018,400 as of December 31, 2019. | ||||||||||||
| (5) The negative amortized cost is the result of the capitalized discount being greater than the principal amount outstanding on the loan. | ||||||||||||
| (6) The investment is not a qualifying asset under Section 55(a) of the Investment Company Act of 1940. The Company may not acquire any non-qualifying asset unless, at the time of acquisition, qualifying assets represent at least 70% of the Company's total assets. As of December 31, 2019, non-qualifying assets totaled 15.6% of the Company's total assets. | ||||||||||||
| (7) Assets or a portion thereof are pledged as collateral for the BCSF Complete Financing Solution LLC. See Note 6 "Debt". | ||||||||||||
| (8) Unrealized appreciation/(depreciation) on forward currency exchange contracts. | ||||||||||||
| (9) The principal amount (par amount) for all debt securities is denominated in U.S. dollars, unless otherwise noted. £ represents Pound Sterling, € represents Euro, NOK represents Norwegian krone, AUD represents Australian and DKK represents Kroner. | ||||||||||||
| (10) As defined in the 1940 Act, the Company is deemed to be an "Affiliated Investment" of the Company as the Company owns 5% or more of the portfolio company's securities. | ||||||||||||
| (11) As defined in the 1940 Act, the Company is deemed to "Control" this portfolio company as the Company either owns more than 25% of the portfolio company's outstanding voting securities or has the power to exercise control over management or policies of such portfolio company. | ||||||||||||
| (12) Assets or a portion thereof are pledged as collateral for the 2018-1 Issuer. See Note 6 "Debt". | ||||||||||||
| (13) $91 of the total par amount for this security is at P+ 4.75%. | ||||||||||||
| (14) Non-Income Producing. | ||||||||||||
| (15) Loan includes interest rate floor of 1.00%. | ||||||||||||
| (16) Loan includes interest rate floor of 0.75%. | ||||||||||||
| (17) Loan includes interest rate floor of 0.50%. | ||||||||||||
| (18) Loan includes interest rate floor of 0.00%. | ||||||||||||
| (19) Security valued using unobservable inputs (Level 3). | ||||||||||||
| (20) The Company holds non-controlling, affiliate interest in an aircraft-owning special purpose vehicle through this investment. | ||||||||||||
| (21) Assets or a portion thereof are pledged as collateral for the BCSF Revolving Credit Facility. See Note 6 "Debt". | ||||||||||||
| (22) The Company generally earns a higher interest rate on the "last out" tranche of debt, to the extent the debt has been allocated to "first out" and "last out" tranches, whereby the "first out" tranche will have priority as to the "last out" tranche with respect to payments of principal, interest and any other amounts due thereunder. | ||||||||||||
| (23) $127 of the total par amount for this security is at P+ 5.50%. | ||||||||||||
147
| (24) $1,643 of the total par amount for this security is at P+ 4.00%. | ||||||||||||
| (25) Security exempt from registration under the Securities Act of 1933 (the "Securities Act"), and may be deemed to be "restricted securities" under the Securities Act. As of December 31, 2019, the aggregate fair value of these securities is $123,733 or 12.15% of the Company's net assets. The acquisition dates of the restricted securities are as follows: | ||||||||||||
| |
Investment | Acquisition Date | ||||
|---|---|---|---|---|---|---|
| BCC Jetstream Holdings Aviation (On II), LLC - Equity Interest | 6/1/2017 | |||||
| BCC Jetstream Holdings Aviation (Off I), LLC - Equity Interest | 6/1/2017 | |||||
| CB Titan Holdings, Inc. - Preferred Equity | 11/14/2017 | |||||
| Impala Private Investments, LLC - Equity Interest | 11/10/2017 | |||||
| Abracon Group Holding, LLC. - Equity Interest | 7/18/2018 | |||||
| Armor Group, LP - Equity Interest | 8/28/2018 | |||||
| Grammer Investment Holdings LLC - Warrants | 10/1/2018 | |||||
| Grammer Investment Holdings LLC - Equity Interest | 10/1/2018 | |||||
| Grammer Investment Holdings LLC - Preferred Equity | 10/1/2018 | |||||
| ADT Pizza, LLC - Equity Interest | 10/29/2018 | |||||
| PP Ultimate Holdings B, LLC - Equity Interest | 12/20/2018 | |||||
| FCG Acquisitions, Inc. - Preferred equity | 1/24/2019 | |||||
| WCI-HSG HOLDCO, LLC - Preferred equity | 2/22/2019 | |||||
| Toro Private Investments II, L.P. - Equity Interest | 3/19/2019 | |||||
| ARL Holdings, LLC. - Equity Interest | 5/3/2019 | |||||
| ARL Holdings, LLC. - Equity Interest | 5/3/2019 | |||||
| ACC Holdco, LLC. - Equity Interest | 6/28/2019 | |||||
| Kellstrom Aerospace Group, Inc - Equity Interest | 7/1/2019 | |||||
| East BCC Coinvest II,LLC - Equity Interest | 7/23/2019 | |||||
| Gale Aviation (Offshore) Co - Equity Interest | 8/2/2019 | |||||
| Ventiv Topco, Inc. - Equity Interest | 9/3/2019 | |||||
| TLC Holdco LP - Equity Interest | 10/11/2019 | |||||
| Elk Parent Holdings, LP - Equity Interest | 11/1/2019 | |||||
| Elk Parent Holdings, LP - Preferred equity | 11/1/2019 | |||||
| Precision Ultimate Holdings, LLC - Equity Interest | 11/6/2019 | |||||
| Elevator Holdco Inc. - Equity Interest | 12/23/2019 | |||||
(26) $4,606 of the total par amount for this security is at P+ 4.00%. |
||||||
| (27) $71 of the total par amount for this security is at P+ 4.75%. | ||||||
| (28) Assets or a portion thereof are pledged as collateral for the BCSF Complete Financing Solution Holdco LLC. See Note 6 "Debt". | ||||||
| (29) Assets or a portion thereof are pledged as collateral for the 2019-1 Issuer. See Note 6 "Debt". | ||||||
| (30) $747 of the total par amount for this security is at P+ 4.75%. | ||||||
| (31) $87 of the total par amount for this security is at P+ 4.00%. | ||||||
| (32) Loan includes interest rate floor of 1.50%. | ||||||
| (33) Asset has been placed on non-accrual | ||||||
| (34) $350 of the total par amount for this security is at P+ 3.75%. | ||||||
| (35) $540 of the total par amount for this security is at L+ 4.50% | ||||||
| (36) Cash equivalents include $31,434 of restricted cash. | ||||||
See Notes to Consolidated Financial Statements
148
Bain Capital Specialty Finance, Inc.
Consolidated Schedule of Investments
As of December 31, 2018
(In thousands)
| Control Type | Industry | Portfolio Company | Investment Type | Spread Above Index (1) |
Interest Rate | Maturity Date |
Principal/Shares (9) | Cost | Market Value |
% of NAV (4) |
|||||||||||||||
|---|---|---|---|---|---|---|---|---|---|---|---|---|---|---|---|---|---|---|---|---|---|---|---|---|---|
Non-Controlled/Non-Affiliate Investments |
|||||||||||||||||||||||||
|
Aerospace & Defense | API Technologies Corp. (2) (3) (5) (15) (19) | First Lien Senior Secured Loan - Revolver | — | — | 4/22/2024 | $ | — | (46 | ) | (11 | ) | |||||||||||||
|
Forming & Machining Industries Inc. (18) (19) (21) | Second Lien Senior Secured Loan | L+ 8.25% | 10.85% | 10/9/2026 | $ | 6,540 | 6,475 | 6,475 | ||||||||||||||||
|
Forming & Machining Industries Inc. (12) (18) (21) | First Lien Senior Secured Loan | L+ 4.25% | 6.85% | 10/9/2025 | $ | 14,937 | 14,863 | 14,713 | ||||||||||||||||
|
Jazz Acquisition, Inc. (15) (21) | Second Lien Senior Secured Loan | L+ 6.75% | 9.55% | 6/20/2022 | $ | 15,000 | 14,396 | 14,136 | ||||||||||||||||
|
Novetta, LLC (12) (15) | First Lien Senior Secured Loan | L+ 5.00% | 7.53% | 10/17/2022 | $ | 3,815 | 3,750 | 3,738 | ||||||||||||||||
|
Salient CRGT, Inc. (12) (15) (19) (21) | First Lien Senior Secured Loan | L+ 5.75% | 8.27% | 2/28/2022 | $ | 13,086 | 13,155 | 12,890 | ||||||||||||||||
|
StandardAero Aviation Holdings, Inc. (12) (15) (21) | First Lien Senior Secured Loan | L+ 3.75% | 6.27% | 7/7/2022 | $ | 19,771 | 19,870 | 19,583 | ||||||||||||||||
|
TECT Power Holdings, LLC (15) (19) (21) | Second Lien Senior Secured Loan | L+ 8.50% | 11.02% | 12/27/2021 | $ | 14,758 | 14,538 | 14,906 | ||||||||||||||||
|
WP CPP Holdings, LLC. (12) (15) (21) | First Lien Senior Secured Loan | L+ 3.75% | 6.28% | 4/30/2025 | $ | 4,715 | 4,704 | 4,562 | ||||||||||||||||
|
WP CPP Holdings, LLC. (12) (15) (21) | Second Lien Senior Secured Loan | L+ 7.75% | 10.28% | 4/30/2026 | $ | 11,724 | 11,608 | 11,533 | ||||||||||||||||
| | | | | | | | | | | | | | | | | | | | | | | | | | |
|
Aerospace & Defense Total | $ | 103,313 | $ | 102,525 | 10.2 | % | ||||||||||||||||||
| | | | | | | | | | | | | | | | | | | | | | | | | | |
|
Automotive | CST Buyer Company (3) (5) (15) (19) | First Lien Senior Secured Loan - Revolver | — | — | 3/1/2023 | $ | — | (9 | ) | — | ||||||||||||||
|
CST Buyer Company (12) (15) (19) | First Lien Senior Secured Loan | L+ 5.00% | 7.52% | 3/1/2023 | $ | 9,310 | 9,208 | 9,310 | ||||||||||||||||
|
OEConnection LLC (12) (15) (21) | First Lien Senior Secured Loan | L+ 4.00% | 6.53% | 11/22/2024 | $ | 14,079 | 14,009 | 13,762 | ||||||||||||||||
|
OEConnection LLC (15) (19) (21) | Second Lien Senior Secured Loan | L+ 8.00% | 10.53% | 11/24/2025 | $ | 6,313 | 6,274 | 6,265 | ||||||||||||||||
| | | | | | | | | | | | | | | | | | | | | | | | | | |
|
Automotive Total | $ | 29,482 | $ | 29,337 | 2.9 | % | ||||||||||||||||||
| | | | | | | | | | | | | | | | | | | | | | | | | | |
|
Banking | Transaction Network Services, Inc. (15) (21) | First Lien Senior Secured Loan | L+ 4.00% | 6.71% | 8/14/2022 | $ | 13,394 | 13,260 | 13,235 | |||||||||||||||
| | | | | | | | | | | | | | | | | | | | | | | | | | |
|
Banking Total | $ | 13,260 | $ | 13,235 | 1.3 | % | ||||||||||||||||||
| | | | | | | | | | | | | | | | | | | | | | | | | | |
|
Beverage, Food & Tobacco | GOBP Holdings, Inc. (12) (18) (21) | First Lien Senior Secured Loan | L+ 3.75% | 6.55% | 10/22/2025 | $ | 16,632 | 16,621 | 16,217 | |||||||||||||||
|
Hearthside Food Solutions, LLC | Corporate Bond | — | 8.50% | 6/1/2026 | $ | 10,000 | 9,793 | 8,000 | ||||||||||||||||
|
NPC International, Inc. (15) (21) | First Lien Senior Secured Loan | L+ 3.50% | 6.02% | 4/19/2024 | $ | 4,987 | 5,020 | 4,676 | ||||||||||||||||
| | | | | | | | | | | | | | | | | | | | | | | | | | |
|
Beverage, Food & Tobacco Total | $ | 31,434 | $ | 28,893 | 2.9 | % | ||||||||||||||||||
| | | | | | | | | | | | | | | | | | | | | | | | | | |
|
Capital Equipment | Dorner Manufacturing Corp. (3) (15) (19) | First Lien Senior Secured Loan - Revolver | P+ 4.75% | 10.00% | 3/15/2022 | $ | 55 | 37 | 55 | |||||||||||||||
|
Dorner Manufacturing Corp. (12) (15) (19) | First Lien Senior Secured Loan | L+ 5.75% | 8.55% | 3/15/2023 | $ | 7,986 | 7,878 | 7,986 | ||||||||||||||||
|
DXP Enterprises, Inc. (6) (12) (15) | First Lien Senior Secured Loan | L+ 4.75% | 7.27% | 8/29/2023 | $ | 5,178 | 5,134 | 5,158 | ||||||||||||||||
|
EXC Holdings III Corp. (12) (15) (21) | Second Lien Senior Secured Loan | L+ 7.50% | 9.85% | 12/1/2025 | $ | 8,240 | 8,254 | 7,870 | ||||||||||||||||
|
Tidel Engineering, L.P. (3) (15) (19) | First Lien Senior Secured Loan - Revolver | — | — | 3/1/2023 | $ | — | — | — | ||||||||||||||||
|
Velvet Acquisition B.V. (6) (18) (19) (21) | Second Lien Senior Secured Loan | EURIBOR+ 8.00% | 8.00% | 4/17/2026 | € | 6,013 | 7,313 | 6,949 | ||||||||||||||||
|
Wilsonart LLC (12) (15) (21) | First Lien Senior Secured Loan | L+ 3.25% | 6.06% | 12/19/2023 | $ | 15,393 | 15,438 | 14,778 | ||||||||||||||||
| | | | | | | | | | | | | | | | | | | | | | | | | | |
|
Capital Equipment Total | $ | 44,054 | $ | 42,796 | 4.3 | % | ||||||||||||||||||
| | | | | | | | | | | | | | | | | | | | | | | | | | |
|
Chemicals, Plastics & Rubber | AP Plastics Group, LLC (3) (15) (19) | First Lien Senior Secured Loan - Revolver | — | — | 8/1/2021 | $ | — | — | — | |||||||||||||||
|
ASP Chromaflo Intermediate Holdings, Inc. (15) (21) | First Lien Senior Secured Loan | L+ 3.50% | 6.02% | 11/20/2023 | $ | 505 | 503 | 493 | ||||||||||||||||
|
ASP Chromaflo Intermediate Holdings, Inc. (6) (15) (21) | First Lien Senior Secured Loan | L+ 3.50% | 6.02% | 11/20/2023 | $ | 656 | 654 | 642 | ||||||||||||||||
|
Niacet b.v. (6) (15) (19) (21) | First Lien Senior Secured Loan | EURIBOR+ 4.50% | 5.50% | 2/1/2024 | € | 3,777 | 4,044 | 4,304 | ||||||||||||||||
|
Niacet Corporation (12) (15) (19) | First Lien Senior Secured Loan | L+ 4.50% | 7.02% | 2/1/2024 | $ | 2,173 | 2,156 | 2,162 | ||||||||||||||||
|
Plaskolite, Inc. (15) (19) (21) | First Lien Senior Secured Loan | L+ 4.25% | 6.69% | 12/15/2025 | $ | 12,030 | 11,790 | 11,910 | ||||||||||||||||
|
PRCC Holdings, Inc. (3) (15) (19) | First Lien Senior Secured Loan - Revolver | — | — | 2/1/2021 | $ | — | — | — | ||||||||||||||||
| | | | | | | | | | | | | | | | | | | | | | | | | | |
|
Chemicals, Plastics & Rubber Total | $ | 19,147 | $ | 19,511 | 1.9 | % | ||||||||||||||||||
| | | | | | | | | | | | | | | | | | | | | | | | | | |
149
|
Construction & Building | Bolt Infrastructure Merger Sub, Inc. (12) (15) | First Lien Senior Secured Loan | L+ 3.50% | 6.02% | 6/21/2024 | $ | 2,670 | 2,662 | 2,617 | |||||||||||||||
|
Chase Industries, Inc. (3) (15) (21) | First Lien Senior Secured Loan - Delayed Draw Term Loan | L+ 4.00% | 6.82% | 5/12/2025 | $ | 199 | 182 | 169 | ||||||||||||||||
|
Chase Industries, Inc. (12) (15) (21) | First Lien Senior Secured Loan | L+ 4.00% | 6.61% | 5/11/2025 | $ | 11,921 | 11,863 | 11,826 | ||||||||||||||||
|
Crown Subsea (12) (18) (21) | First Lien Senior Secured Loan | L+ 6.00% | 8.35% | 11/2/2025 | $ | 13,400 | 13,201 | 12,931 | ||||||||||||||||
|
PP Ultimate Holdings B, LLC (14) (19) (25) | Equity Interest | — | — | — | $ | 1 | 1,352 | 1,352 | ||||||||||||||||
|
Profile Products LLC (2) (3) (5) (15) (19) | First Lien Senior Secured Loan - Revolver | — | — | 12/20/2024 | $ | — | (76 | ) | (77 | ) | ||||||||||||||
|
Regan Development Holdings Limited (6) (17) (19) | First Lien Senior Secured Loan | EURIBOR+ 7.00% | 7.50% | 4/18/2022 | € | 2,557 | 2,785 | 2,928 | ||||||||||||||||
|
Regan Development Holdings Limited (6) (17) (19) | First Lien Senior Secured Loan | EURIBOR+ 7.00% | 7.50% | 4/18/2022 | € | 829 | 941 | 949 | ||||||||||||||||
|
Regan Development Holdings Limited (6) (17) (19) | First Lien Senior Secured Loan | EURIBOR+ 7.00% | 7.50% | 4/18/2022 | € | 7,760 | 8,330 | 8,887 | ||||||||||||||||
| | | | | | | | | | | | | | | | | | | | | | | | | | |
|
Construction & Building Total | $ | 41,240 | $ | 41,582 | 4.2 | % | ||||||||||||||||||
| | | | | | | | | | | | | | | | | | | | | | | | | | |
|
Consumer Goods: Durable | Home Franchise Concepts, Inc. (2) (3) (5) (15) (19) | First Lien Senior Secured Loan - Revolver | — | — | 7/9/2024 | $ | — | (16 | ) | (25 | ) | |||||||||||||
|
New Milani Group LLC (12) (15) (19) (21) | First Lien Senior Secured Loan | L+ 4.25% | 6.77% | 6/6/2024 | $ | 17,273 | 17,114 | 17,273 | ||||||||||||||||
|
Stanton Carpet Corp. (3) (15) (19) | First Lien Senior Secured Loan - Revolver | — | — | 11/21/2022 | $ | — | — | — | ||||||||||||||||
| | | | | | | | | | | | | | | | | | | | | | | | | | |
|
Consumer Goods: Durable Total | $ | 17,098 | $ | 17,248 | 1.7 | % | ||||||||||||||||||
| | | | | | | | | | | | | | | | | | | | | | | | | | |
|
Consumer Goods: Non-Durable | FineLine Technologies, Inc. (3) (15) (19) | First Lien Senior Secured Loan - Revolver | L+ 4.25% | 6.79% | 11/2/2021 | $ | 459 | 425 | 445 | |||||||||||||||
|
FineLine Technologies, Inc. (12) (15) (19) (21) | First Lien Senior Secured Loan | L+ 4.25% | 7.06% | 11/2/2022 | $ | 31,703 | 31,466 | 31,545 | ||||||||||||||||
|
Kronos Acquisition Holdings Inc. | Corporate Bond | — | 9.00% | 8/15/2023 | $ | 10,000 | 9,356 | 7,700 | ||||||||||||||||
|
Kronos Acquisition Holdings Inc. (12) (15) (21) | First Lien Senior Secured Loan | L+ 4.00% | 6.52% | 5/15/2023 | $ | 13,181 | 13,142 | 12,522 | ||||||||||||||||
|
MND Holdings III Corp (15) (19) (21) | First Lien Senior Secured Loan | L+ 3.50% | 6.30% | 6/19/2024 | $ | 13,767 | 13,815 | 13,560 | ||||||||||||||||
|
Solaray, LLC (3) (15) (19) (23) | First Lien Senior Secured Loan - Revolver | L+ 4.50% | 7.69% | 9/9/2022 | $ | 5,667 | 5,605 | 5,667 | ||||||||||||||||
| | | | | | | | | | | | | | | | | | | | | | | | | | |
|
Consumer Goods: Non-Durable Total | $ | 73,809 | $ | 71,439 | 7.1 | % | ||||||||||||||||||
| | | | | | | | | | | | | | | | | | | | | | | | | | |
|
Containers, Packaging & Glass | BWAY Holding Company | Corporate Bond | — | 7.25% | 4/15/2025 | $ | 10,000 | 9,755 | 9,012 | |||||||||||||||
|
BWAY Holding Company (12) (18) (21) | First Lien Senior Secured Loan | L+ 3.25% | 5.66% | 4/3/2024 | $ | 12,812 | 12,836 | 12,100 | ||||||||||||||||
|
Technimark LLC (12) (18) | First Lien Senior Secured Loan | L+ 3.75% | 6.27% | 8/8/2025 | $ | 2,826 | 2,823 | 2,784 | ||||||||||||||||
|
Terminator Bidco AS (6) (18) (19) (21) | First Lien Senior Secured Loan | L+ 5.00% | 7.80% | 5/22/2022 | $ | 15,100 | 14,798 | 14,798 | ||||||||||||||||
| | | | | | | | | | | | | | | | | | | | | | | | | | |
|
Containers, Packaging & Glass Total | $ | 40,212 | $ | 38,694 | 3.9 | % | ||||||||||||||||||
| | | | | | | | | | | | | | | | | | | | | | | | | | |
|
Energy: Electricity | Infinite Electronics International Inc. (12) (18) (19) (21) | First Lien Senior Secured Loan | L+ 4.00% | 6.52% | 7/2/2025 | $ | 19,953 | 19,938 | 19,853 | |||||||||||||||
|
Infinite Electronics International Inc. (18) (19) (21) | Second Lien Senior Secured Loan | L+ 8.00% | 10.52% | 7/2/2026 | $ | 2,480 | 2,430 | 2,430 | ||||||||||||||||
| | | | | | | | | | | | | | | | | | | | | | | | | | |
|
Energy: Electricity Total | $ | 22,368 | $ | 22,283 | 2.2 | % | ||||||||||||||||||
| | | | | | | | | | | | | | | | | | | | | | | | | | |
|
Energy: Oil & Gas | Amspec Services, Inc. (3) (15) (19) | First Lien Senior Secured Loan - Revolver | P+ 3.75% | 9.25% | 7/2/2024 | $ | 931 | 866 | 931 | |||||||||||||||
|
Blackbrush Oil & Gas, L.P. (12) (15) (21) | First Lien Senior Secured Loan | L+ 8.00% | 10.89% | 2/9/2024 | $ | 31,200 | 30,675 | 30,264 | ||||||||||||||||
| | | | | | | | | | | | | | | | | | | | | | | | | | |
|
Energy: Oil & Gas Total | $ | 31,541 | $ | 31,195 | 3.1 | % | ||||||||||||||||||
| | | | | | | | | | | | | | | | | | | | | | | | | | |
|
Environmental Industries | Adler & Allan Group Limited (6) (17) (19) (21) (22) | First Lien Last Out | GBP LIBOR+ 8.25% (2% PIK) | 9.14% | 9/30/2022 | £ | 13,062 | 16,489 | 16,482 | |||||||||||||||
| | | | | | | | | | | | | | | | | | | | | | | | | | |
|
Environmental Industries Total | $ | 16,489 | $ | 16,482 | 1.6 | % | ||||||||||||||||||
| | | | | | | | | | | | | | | | | | | | | | | | | | |
|
FIRE: Finance | Badger Merger Sub, Inc. (12) (18) | First Lien Senior Secured Loan | L+ 3.75% | 6.54% | 9/12/2025 | $ | 3,642 | 3,624 | 3,560 | |||||||||||||||
| | | | | | | | | | | | | | | | | | | | | | | | | | |
|
FIRE: Finance Total | $ | 3,624 | $ | 3,560 | 0.4 | % | ||||||||||||||||||
| | | | | | | | | | | | | | | | | | | | | | | | | | |
150
|
FIRE: Insurance | Alliant Holdings Intermediate, LLC (12) (18) (21) | First Lien Senior Secured Loan | L+ 2.75% | 5.21% | 5/9/2025 | $ | 16,598 | 16,650 | 15,735 | |||||||||||||||
|
Margaux Acquisition, Inc. (3) (15) (19) | First Lien Senior Secured Loan - Revolver | P+ 5.00% | 10.50% | 12/19/2024 | $ | 616 | 558 | 558 | ||||||||||||||||
|
Margaux UK Finance Limited (2) (3) (5) (6) (19) | First Lien Senior Secured Loan - Revolver | — | — | 12/19/2024 | £ | — | (13 | ) | (13 | ) | ||||||||||||||
|
Wink Holdco, Inc. (15) (21) | Second Lien Senior Secured Loan | L+ 6.75% | 9.28% | 12/1/2025 | $ | 13,638 | 13,578 | 12,887 | ||||||||||||||||
|
Wink Holdco, Inc. (12) (15) (21) | First Lien Senior Secured Loan | L+ 3.00% | 5.52% | 12/2/2024 | $ | 12,568 | 12,514 | 11,939 | ||||||||||||||||
| | | | | | | | | | | | | | | | | | | | | | | | | | |
|
FIRE: Insurance Total | $ | 43,287 | $ | 41,106 | 4.1 | % | ||||||||||||||||||
| | | | | | | | | | | | | | | | | | | | | | | | | | |
|
FIRE: Real Estate | Spectre (Carrisbrook House) Limited (6) (15) (19) | First Lien Senior Secured Loan | EURIBOR+ 7.50% | 8.50% | 8/9/2021 | € | 9,300 | 10,714 | 10,650 | |||||||||||||||
| | | | | | | | | | | | | | | | | | | | | | | | | | |
|
FIRE: Real Estate Total | $ | 10,714 | $ | 10,650 | 1.1 | % | ||||||||||||||||||
| | | | | | | | | | | | | | | | | | | | | | | | | | |
|
Forest Products & Paper | Solenis International LLC (18) (21) | Second Lien Senior Secured Loan | L+ 8.50% | 11.21% | 6/26/2026 | $ | 15,601 | 15,235 | 14,821 | |||||||||||||||
|
Solenis International LLC (12) (18) (21) | First Lien Senior Secured Loan | L+ 4.00% | 6.80% | 6/26/2025 | $ | 7,335 | 7,280 | 7,082 | ||||||||||||||||
| | | | | | | | | | | | | | | | | | | | | | | | | | |
|
Forest Products & Paper Total | $ | 22,515 | $ | 21,903 | 2.2 | % | ||||||||||||||||||
| | | | | | | | | | | | | | | | | | | | | | | | | | |
|
Healthcare & Pharmaceuticals | Clinical Innovations, LLC (3) (15) (19) (22) | First Lien Last Out - Revolver | L+ 5.50% | 7.93% | 10/17/2022 | $ | 38 | 19 | 33 | |||||||||||||||
|
Clinical Innovations, LLC (12) (15) (19) (21) (22) | First Lien Last Out | L+ 5.50% | 8.02% | 10/17/2023 | $ | 11,028 | 10,817 | 10,973 | ||||||||||||||||
|
CB Titan Holdings, Inc. (14) (19) (25) | Preferred equity | — | — | — | $ | 1,953 | 1,953 | 2,207 | ||||||||||||||||
|
Concentra Inc. (12) (15) (21) | Second Lien Senior Secured Loan | L+ 6.50% | 8.88% | 6/1/2023 | $ | 14,105 | 13,861 | 14,052 | ||||||||||||||||
|
Datix Bidco Limited (2) (3) (5) (6) (18) (19) | First Lien Senior Secured Loan - Revolver | — | — | 10/28/2024 | £ | — | (25 | ) | (19 | ) | ||||||||||||||
|
Datix Bidco Limited (6) (18) (19) (21) | Second Lien Senior Secured Loan | GBP LIBOR+ 7.75% | 8.68% | 4/27/2026 | £ | 12,134 | 16,272 | 15,311 | ||||||||||||||||
|
Datix Bidco Limited (6) (19) (21) | First Lien Senior Secured Loan | BBSW+ 4.50% | 6.57% | 4/28/2025 | AUD | 4,212 | 3,197 | 2,922 | ||||||||||||||||
|
Drive DeVilbiss (12) (15) (21) | First Lien Senior Secured Loan | L+ 5.50% | 8.30% | 1/3/2023 | $ | 8,529 | 7,867 | 7,399 | ||||||||||||||||
|
Genesis Supply Acquisition Co. (19) | Subordinated Debt | — | 9.50% | 4/23/2021 | $ | 25,000 | 25,000 | 25,000 | ||||||||||||||||
|
Great Expressions Dental Centers PC (3) (13) (15) (19) | First Lien Senior Secured Loan - Revolver | L+ 4.75% | 8.70% | 9/28/2022 | $ | 954 | 943 | 936 | ||||||||||||||||
|
Great Expressions Dental Centers PC (12) (15) (19) | First Lien Senior Secured Loan | L+ 4.75% | 7.63% | 9/28/2023 | $ | 7,982 | 7,894 | 7,862 | ||||||||||||||||
|
Island Medical Management Holdings, LLC (15) (19) (21) | First Lien Senior Secured Loan | L+ 6.50% | 9.02% | 9/1/2022 | $ | 9,268 | 9,158 | 8,619 | ||||||||||||||||
|
TecoStar Holdings, Inc. (12) (15) (19) (21) | Second Lien Senior Secured Loan | L+ 8.50% | 10.89% | 11/1/2024 | $ | 9,472 | 9,263 | 9,472 | ||||||||||||||||
|
U.S. Anesthesia Partners, Inc. (12) (15) (19) (21) | Second Lien Senior Secured Loan | L+ 7.25% | 9.77% | 6/23/2025 | $ | 16,520 | 16,313 | 16,520 | ||||||||||||||||
|
U.S. Anesthesia Partners, Inc. (12) (15) (21) | First Lien Senior Secured Loan | L+ 3.00% | 5.52% | 6/24/2024 | $ | 4,641 | 4,573 | 4,458 | ||||||||||||||||
| | | | | | | | | | | | | | | | | | | | | | | | | | |
|
Healthcare & Pharmaceuticals Total | $ | 127,105 | $ | 125,745 | 12.6 | % | ||||||||||||||||||
| | | | | | | | | | | | | | | | | | | | | | | | | | |
|
High Tech Industries | Caliper Software, Inc. (3) (18) (19) | First Lien Senior Secured Loan - Revolver | L+ 5.50% | 8.04% | 11/30/2023 | $ | 124 | 88 | 87 | |||||||||||||||
|
CMI Marketing Inc (3) (5) (15) (19) | First Lien Senior Secured Loan - Revolver | — | — | 5/24/2023 | $ | — | (19 | ) | — | |||||||||||||||
|
CMI Marketing Inc (12) (15) (19) (21) | First Lien Senior Secured Loan | L+ 4.75% | 7.27% | 5/24/2024 | $ | 15,411 | 15,271 | 15,411 | ||||||||||||||||
|
Drilling Info Holdings, Inc (2) (3) (5) (12) (18) (21) | First Lien Senior Secured Loan - Delayed Draw Term Loan | — | — | 7/30/2025 | $ | — | (7 | ) | (13 | ) | ||||||||||||||
|
Drilling Info Holdings, Inc (12) (18) (21) | First Lien Senior Secured Loan | L+ 4.25% | 6.77% | 7/30/2025 | $ | 20,178 | 20,094 | 20,102 | ||||||||||||||||
|
Element Buyer, Inc. (2) (3) (5) (15) (19) | First Lien Senior Secured Loan - Revolver | — | — | 7/19/2024 | $ | — | (59 | ) | (32 | ) | ||||||||||||||
|
Elo Touch Solutions, Inc. (18) (21) | First Lien Senior Secured Loan | L+ 6.50% | 9.28% | 12/7/2025 | $ | 18,943 | 17,996 | 18,256 | ||||||||||||||||
|
Everest Bidco (6) (15) (19) (21) | Second Lien Senior Secured Loan | GBP LIBOR+ 7.50% | 8.50% | 7/3/2026 | £ | 10,216 | 13,060 | 12,631 | ||||||||||||||||
|
Impala Private Investments, LLC (14) (19) (25) | Equity Interest | — | — | — | $ | 1,500 | — | 126 | ||||||||||||||||
|
Lighthouse Network, LLC (12) (15) (19) (21) | First Lien Senior Secured Loan | L+ 4.50% | 7.03% | 12/2/2024 | $ | 16,088 | 16,024 | 16,008 | ||||||||||||||||
|
Netsmart Technologies, Inc. (12) (15) (21) | First Lien Senior Secured Loan | L+ 3.75% | 6.27% | 4/19/2023 | $ | 21,623 | 21,657 | 21,352 | ||||||||||||||||
|
Netsmart Technologies, Inc. (15) (19) (21) | Second Lien Senior Secured Loan | L+ 7.50% | 10.03% | 10/19/2023 | $ | 2,749 | 2,749 | 2,735 | ||||||||||||||||
|
Park Place Technologies (15) (21) | Second Lien Senior Secured Loan | L+ 8.00% | 10.52% | 3/30/2026 | $ | 6,733 | 6,684 | 6,598 | ||||||||||||||||
|
Park Place Technologies (12) (15) (21) | First Lien Senior Secured Loan | L+ 4.00% | 6.52% | 3/31/2025 | $ | 10,324 | 10,293 | 10,118 | ||||||||||||||||
|
nThrive, Inc. (15) (19) (21) | Second Lien Senior Secured Loan | L+ 9.75% | 12.27% | 4/20/2023 | $ | 8,000 | 7,982 | 7,760 | ||||||||||||||||
|
Qlik Technologies (12) (15) (21) | First Lien Senior Secured Loan | L+ 3.50% | 5.94% | 4/26/2024 | $ | 22,725 | 22,666 | 22,015 | ||||||||||||||||
|
SolarWinds Holdings, Inc. (18) (21) | First Lien Senior Secured Loan | L+ 2.75% | 5.27% | 2/5/2024 | $ | 14,763 | 14,845 | 14,228 |
151
|
VPARK BIDCO AB (6) (16) (19) (21) | First Lien Senior Secured Loan | CIBOR+ 5.00% | 5.75% | 3/8/2025 | DKK | 56,999 | 9,134 | 8,743 | ||||||||||||||||
|
VPARK BIDCO AB (6) (16) (19) (21) | First Lien Senior Secured Loan | NIBOR+ 5.00% | 6.28% | 3/8/2025 | NOK | 74,020 | 9,174 | 8,558 | ||||||||||||||||
|
Zywave, Inc. (3) (15) (19) | First Lien Senior Secured Loan - Revolver | L+ 5.00% | 7.52% | 11/17/2022 | $ | 767 | 755 | 767 | ||||||||||||||||
|
Zywave, Inc. (12) (15) (19) (21) | First Lien Senior Secured Loan | L+ 5.00% | 7.52% | 11/17/2022 | $ | 17,549 | 17,458 | 17,549 | ||||||||||||||||
| | | | | | | | | | | | | | | | | | | | | | | | | | |
|
High Tech Industries Total | $ | 205,845 | $ | 202,999 | 20.3 | % | ||||||||||||||||||
| | | | | | | | | | | | | | | | | | | | | | | | | | |
|
Hotel, Gaming & Leisure | Aimbridge Hospitality LP (12) (15) (19) (21) | First Lien Senior Secured Loan | L+ 5.00% | 7.52% | 6/22/2022 | $ | 4,264 | 4,206 | 4,264 | |||||||||||||||
|
Aimbridge Hospitality LP (3) (5) (15) (19) | First Lien Senior Secured Loan - Revolver | — | — | 6/22/2022 | $ | — | (15 | ) | — | |||||||||||||||
|
Aimbridge Hospitality LP (15) (19) (21) | First Lien Senior Secured Loan | L+ 5.00% | 7.52% | 6/22/2022 | $ | 25,584 | 25,251 | 25,584 | ||||||||||||||||
|
Captain D's LLC (3) (15) (19) (24) | First Lien Senior Secured Loan - Revolver | L+ 4.50% | 8.15% | 12/15/2023 | $ | 788 | 773 | 756 | ||||||||||||||||
|
Captain D's LLC (12) (15) (19) (21) | First Lien Senior Secured Loan | L+ 4.50% | 7.30% | 12/15/2023 | $ | 13,389 | 13,269 | 13,154 | ||||||||||||||||
|
K-Mac Holdings Corp. (12) (18) | Second Lien Senior Secured Loan | L+ 6.75% | 9.25% | 3/16/2026 | $ | 3,200 | 3,193 | 3,024 | ||||||||||||||||
|
NPC International, Inc. (12) (15) (21) | Second Lien Senior Secured Loan | L+ 7.50% | 10.02% | 4/18/2025 | $ | 9,159 | 9,194 | 8,655 | ||||||||||||||||
|
Quidditch Acquisition, Inc. (12) (15) (19) (21) | First Lien Senior Secured Loan | L+ 7.00% | 9.47% | 3/21/2025 | $ | 15,903 | 15,859 | 15,824 | ||||||||||||||||
|
Tacala Investment Corp. (18) (21) | Second Lien Senior Secured Loan | L+ 7.00% | 9.52% | 1/30/2026 | $ | 6,323 | 6,306 | 6,039 | ||||||||||||||||
|
Tacala Investment Corp. (12) (18) (21) | First Lien Senior Secured Loan | L+ 3.25% | 5.77% | 1/31/2025 | $ | 3,504 | 3,451 | 3,383 | ||||||||||||||||
| | | | | | | | | | | | | | | | | | | | | | | | | | |
|
Hotel, Gaming & Leisure Total | $ | 81,487 | $ | 80,683 | 8.1 | % | ||||||||||||||||||
| | | | | | | | | | | | | | | | | | | | | | | | | | |
|
Media: Advertising, Printing & Publishing | Ansira Holdings, Inc. (3) (15) (19) | First Lien Senior Secured Loan - Revolver | P+ 4.00% | 9.50% | 12/20/2022 | $ | 1,643 | 1,643 | 1,643 | |||||||||||||||
|
Cambium Learning Group, Inc. (12) (18) (21) | First Lien Senior Secured Loan | L+ 4.50% | 7.02% | 12/18/2025 | $ | 12,325 | 11,709 | 11,771 | ||||||||||||||||
|
Cruz Bay Publishing (3) (15) (19) | First Lien Senior Secured Loan - Revolver | P+ 3.00% | 8.50% | 6/6/2019 | $ | 2,267 | 2,267 | 2,267 | ||||||||||||||||
|
Learfield Communications LLC (12) (15) (19) (21) | Second Lien Senior Secured Loan | L+ 7.25% | 9.78% | 12/2/2024 | $ | 4,050 | 4,016 | 4,050 | ||||||||||||||||
| | | | | | | | | | | | | | | | | | | | | | | | | | |
|
Media: Advertising, Printing & Publishing Total | $ | 19,635 | $ | 19,731 | 2.0 | % | ||||||||||||||||||
| | | | | | | | | | | | | | | | | | | | | | | | | | |
|
Media: Broadcasting & Subscription | Micro Holding Corp. (12) (18) (21) | First Lien Senior Secured Loan | L+ 3.75% | 6.25% | 9/13/2024 | $ | 21,931 | 21,868 | 20,945 | |||||||||||||||
| | | | | | | | | | | | | | | | | | | | | | | | | | |
|
Media: Broadcasting & Subscription Total | $ | 21,868 | $ | 20,945 | 2.1 | % | ||||||||||||||||||
| | | | | | | | | | | | | | | | | | | | | | | | | | |
|
Media: Diversified & Production | Efficient Collaborative Retail Marketing Company, LLC (3) (15) (19) | First Lien Senior Secured Loan - Revolver | — | — | 6/15/2022 | $ | — | — | — | |||||||||||||||
|
Getty Images, Inc. (21) (26) | First Lien Senior Secured Loan | L+ 3.50% | 6.02% | 10/18/2019 | $ | 19,947 | 19,744 | 19,420 | ||||||||||||||||
|
International Entertainment Investments Limited (6) (18) (19) (21) | First Lien Senior Secured Loan | GBP LIBOR+ 4.75% | 5.65% | 5/31/2023 | £ | 8,686 | 10,620 | 11,071 | ||||||||||||||||
| | | | | | | | | | | | | | | | | | | | | | | | | | |
|
Media: Diversified & Production Total | $ | 30,364 | $ | 30,491 | 3.0 | % | ||||||||||||||||||
| | | | | | | | | | | | | | | | | | | | | | | | | | |
|
Retail | Batteries Plus Holding Corporation (3) (15) (19) | First Lien Senior Secured Loan - Revolver | — | — | 7/6/2022 | $ | — | — | — | |||||||||||||||
|
CH Hold Corp. (12) (15) | First Lien Senior Secured Loan | L+ 3.00% | 5.52% | 2/1/2024 | $ | 1,498 | 1,495 | 1,485 | ||||||||||||||||
|
CH Hold Corp. (12) (15) | Second Lien Senior Secured Loan | L+ 7.25% | 9.77% | 2/3/2025 | $ | 1,215 | 1,211 | 1,209 | ||||||||||||||||
|
CVS Holdings I, LP (12) (15) (21) | First Lien Senior Secured Loan | L+ 2.75% | 5.28% | 2/6/2025 | $ | 14,912 | 14,893 | 14,167 | ||||||||||||||||
|
CVS Holdings I, LP (15) (19) (21) | Second Lien Senior Secured Loan | L+ 6.75% | 9.28% | 2/6/2026 | $ | 14,110 | 14,120 | 13,334 | ||||||||||||||||
|
Eyemart Express LLC (12) (15) (21) | First Lien Senior Secured Loan | L+ 3.00% | 5.46% | 8/5/2024 | $ | 11,506 | 11,544 | 11,189 | ||||||||||||||||
| | | | | | | | | | | | | | | | | | | | | | | | | | |
|
Retail Total | $ | 43,263 | $ | 41,384 | 4.1 | % | ||||||||||||||||||
| | | | | | | | | | | | | | | | | | | | | | | | | | |
152
|
Services: Business | Advantage Sales & Marketing Inc. (12) (15) (21) | First Lien Senior Secured Loan | L+ 3.25% | 5.77% | 7/23/2021 | $ | 15,743 | 15,500 | 13,972 | |||||||||||||||
|
AMCP Clean Acquisition Company, LLC (3) (12) (18) (21) | First Lien Senior Secured Loan - Delayed Draw Term Loan | L+ 4.25% | 6.93% | 6/16/2025 | $ | 1,489 | 1,483 | 1,432 | ||||||||||||||||
|
AMCP Clean Acquisition Company, LLC (12) (18) (21) | First Lien Senior Secured Loan | L+ 4.25% | 7.05% | 6/16/2025 | $ | 15,773 | 15,725 | 15,537 | ||||||||||||||||
|
Comet Bidco Limited (6) (18) (21) | First Lien Senior Secured Loan | GBP LIBOR+ 5.25% | 5.98% | 9/30/2024 | £ | 10,261 | 13,081 | 12,719 | ||||||||||||||||
|
Lakeland Tours, LLC (12) (15) | First Lien Senior Secured Loan | L+ 4.00% | 6.79% | 12/16/2024 | $ | 2,887 | 2,878 | 2,820 | ||||||||||||||||
|
LegalZoom.com, Inc. (18) (19) (21) | First Lien Senior Secured Loan | L+ 4.50% | 7.00% | 11/21/2024 | $ | 15,839 | 15,735 | 15,601 | ||||||||||||||||
|
New Insight Holdings, Inc. (12) (15) (21) | First Lien Senior Secured Loan | L+ 5.50% | 8.02% | 12/20/2024 | $ | 20,529 | 20,041 | 20,349 | ||||||||||||||||
|
Sovos Compliance, LLC (3) (15) (19) | First Lien Senior Secured Loan - Delayed Draw Term Loan | L+ 6.00% | 8.52% | 3/1/2022 | $ | 3,958 | 3,958 | 3,910 | ||||||||||||||||
|
Sovos Compliance, LLC (2) (3) (5) (15) (19) | First Lien Senior Secured Loan - Revolver | — | — | 3/1/2022 | $ | — | (10 | ) | (15 | ) | ||||||||||||||
|
Sovos Compliance, LLC (12) (15) (19) | First Lien Senior Secured Loan | L+ 6.00% | 8.52% | 3/1/2022 | $ | 8,601 | 8,541 | 8,515 | ||||||||||||||||
|
TEI Holdings Inc. (3) (15) (19) | First Lien Senior Secured Loan - Revolver | P+ 5.00% | 10.50% | 12/20/2022 | $ | 708 | 708 | 666 | ||||||||||||||||
|
Valet Waste Holdings, Inc (12) (18) (21) | First Lien Senior Secured Loan | L+ 4.00% | 6.52% | 9/29/2025 | $ | 28,761 | 28,686 | 28,402 | ||||||||||||||||
|
XO Management Holding Inc. (18) (19) (21) | First Lien Senior Secured Loan | L+ 5.75% | 8.49% | 12/4/2021 | $ | 12,355 | 11,490 | 11,490 | ||||||||||||||||
| | | | | | | | | | | | | | | | | | | | | | | | | | |
|
Services: Business Total | $ | 137,816 | $ | 135,398 | 13.5 | % | ||||||||||||||||||
| | | | | | | | | | | | | | | | | | | | | | | | | | |
|
Services: Consumer | GI Chill Acquisition LLC (12) (18) (19) (21) | First Lien Senior Secured Loan | L+ 4.00% | 6.80% | 8/6/2025 | $ | 11,464 | 11,441 | 11,464 | |||||||||||||||
|
McKissock, LLC (3) (15) (19) | First Lien Senior Secured Loan - Revolver | P+ 2.25% | 7.68% | 8/5/2021 | $ | 992 | 992 | 992 | ||||||||||||||||
|
Pearl Intermediate Parent LLC (18) (21) | Second Lien Senior Secured Loan | L+ 6.25% | 8.75% | 2/13/2026 | $ | 2,571 | 2,590 | 2,544 | ||||||||||||||||
|
Trident LS Merger Sub Corp (12) (18) | First Lien Senior Secured Loan | L+ 3.00% | 5.52% | 5/1/2025 | $ | 4,186 | 4,177 | 4,102 | ||||||||||||||||
|
Trident LS Merger Sub Corp (12) (18) | Second Lien Senior Secured Loan | L+ 7.50% | 10.02% | 5/1/2026 | $ | 2,246 | 2,225 | 2,221 | ||||||||||||||||
|
Travel Leaders Group, LLC (12) (18) | First Lien Senior Secured Loan | L+ 4.00% | 6.46% | 1/25/2024 | $ | 528 | 527 | 524 | ||||||||||||||||
|
WeddingWire, Inc. (18) (21) | Second Lien Senior Secured Loan | L+ 8.25% | 11.04% | 12/21/2026 | $ | 6,187 | 6,125 | 6,156 | ||||||||||||||||
|
WeddingWire, Inc. (18) (21) | First Lien Senior Secured Loan | L+ 4.50% | 7.29% | 12/19/2025 | $ | 13,218 | 13,251 | 13,020 | ||||||||||||||||
| | | | | | | | | | | | | | | | | | | | | | | | | | |
|
Services: Consumer Total | $ | 41,328 | $ | 41,023 | 4.1 | % | ||||||||||||||||||
| | | | | | | | | | | | | | | | | | | | | | | | | | |
|
Telecommunications | Horizon Telcom, Inc. (2) (3) (5) (12) (15) (19) (21) | First Lien Senior Secured Loan - Delayed Draw Term Loan | — | — | 6/15/2023 | $ | — | (19 | ) | (26 | ) | |||||||||||||
|
Horizon Telcom, Inc. (12) (15) (19) (21) | First Lien Senior Secured Loan | L+ 4.50% | 6.85% | 6/15/2023 | $ | 13,869 | 13,712 | 13,661 | ||||||||||||||||
|
Horizon Telcom, Inc. (2) (3) (15) (19) | First Lien Senior Secured Loan - Revolver | — | — | 6/15/2023 | $ | — | — | (17 | ) | |||||||||||||||
|
Masergy Holdings, Inc. (15) | Second Lien Senior Secured Loan | L+ 7.50% | 10.31% | 12/16/2024 | $ | 857 | 863 | 840 | ||||||||||||||||
|
Masergy Holdings, Inc. (15) (21) | First Lien Senior Secured Loan | L+ 3.25% | 6.05% | 12/15/2023 | $ | 686 | 684 | 664 | ||||||||||||||||
| | | | | | | | | | | | | | | | | | | | | | | | | | |
|
Telecommunications Total | $ | 15,240 | $ | 15,122 | 1.5 | % | ||||||||||||||||||
| | | | | | | | | | | | | | | | | | | | | | | | | | |
|
Transportation: Cargo | Direct ChassisLink, Inc. (12) (18) (19) (21) | Second Lien Senior Secured Loan | L+ 6.00% | 8.53% | 6/15/2023 | $ | 27,685 | 27,631 | 26,716 | |||||||||||||||
|
ENC Holding Corporation (2) (3) (5) (18) | First Lien Senior Secured Loan - Delayed Draw Term Loan | — | — | 5/30/2025 | $ | — | (1 | ) | (9 | ) | ||||||||||||||
|
ENC Holding Corporation (12) (18) (27) | First Lien Senior Secured Loan | L+ 4.00% | 6.80% | 5/30/2025 | $ | 9,775 | 9,761 | 9,628 | ||||||||||||||||
|
Grammer Investment Holdings LLC (14) (19) (25) | Equity Interest | — | — | — | $ | 600 | 600 | 600 | ||||||||||||||||
|
Grammer Investment Holdings LLC (14) (19) (25) | Preferred Equity | 10% PIK | 10.00% | — | $ | 6 | 600 | 600 | ||||||||||||||||
|
Grammer Investment Holdings LLC (14) (19) (25) | Warrants | — | — | — | $ | 122 | — | — | ||||||||||||||||
|
Grammer Purchaser, Inc. (3) (15) (18) (19) | First Lien Senior Secured Loan - Revolver | L+ 4.75% | 7.27% | 9/30/2024 | $ | 105 | 106 | 89 | ||||||||||||||||
|
Grammer Purchaser, Inc. (12) (15) (19) (21) | First Lien Senior Secured Loan | L+ 4.75% | 7.27% | 9/30/2024 | $ | 10,500 | 10,332 | 10,342 | ||||||||||||||||
|
Omni Logistics, LLC (15) (19) (21) | Subordinated Debt | L+ 11.50% | 14.02% | 1/19/2024 | $ | 15,000 | 14,711 | 14,625 | ||||||||||||||||
|
PS HoldCo, LLC (12) (15) (21) | First Lien Senior Secured Loan | L+ 4.75% | 7.28% | 3/13/2025 | $ | 21,459 | 21,458 | 20,922 | ||||||||||||||||
| | | | | | | | | | | | | | | | | | | | | | | | | | |
|
Transportation: Cargo Total | $ | 85,198 | $ | 83,513 | 8.3 | % | ||||||||||||||||||
| | | | | | | | | | | | | | | | | | | | | | | | | | |
|
Transportation: Consumer | Direct Travel, Inc. (3) (15) (19) | First Lien Senior Secured Loan - Revolver | — | — | 12/1/2021 | $ | — | — | — | |||||||||||||||
| | | | | | | | | | | | | | | | | | | | | | | | | | |
|
Transportation: Consumer Total | $ | — | $ | — | 0.0 | % | ||||||||||||||||||
| | | | | | | | | | | | | | | | | | | | | | | | | | |
|
Utilities: Electric | CSVC Acquisition Corp | Corporate Bond | — | 7.75% | 6/15/2025 | $ | 13,478 | 12,483 | 10,311 | |||||||||||||||
| | | | | | | | | | | | | | | | | | | | | | | | | | |
|
Utilities: Electric Total | $ | 12,483 | $ | 10,311 | 1.0 | % | ||||||||||||||||||
| | | | | | | | | | | | | | | | | | | | | | | | | | |
153
|
Wholesale | Abracon Group Holding, LLC. (14) (19) (25) | Equity Interest | — | — | — | $ | 2 | 1,800 | 1,992 | |||||||||||||||
|
Abracon Group Holding, LLC. (2) (3) (5) (15) (19) | First Lien Senior Secured Loan - Revolver | — | — | 7/18/2024 | $ | — | (39 | ) | (28 | ) | ||||||||||||||
|
Aramsco, Inc. (3) (15) (19) | First Lien Senior Secured Loan - Revolver | L+ 5.25% | 7.77% | 8/28/2024 | $ | 226 | 177 | 133 | ||||||||||||||||
|
Armor Group, LP (14) (19) (25) | Equity Interest | — | — | — | $ | 10 | 1,012 | 1,009 | ||||||||||||||||
|
PetroChoice Holdings, Inc. (15) (19) (21) | First Lien Senior Secured Loan | L+ 5.00% | 7.53% | 8/22/2022 | $ | 3,638 | 3,603 | 3,602 | ||||||||||||||||
|
PT Holdings, LLC (12) (15) (21) | First Lien Senior Secured Loan | L+ 4.00% | 6.80% | 12/9/2024 | $ | 21,671 | 21,631 | 21,184 | ||||||||||||||||
|
Specialty Building Products Holdings, LLC (12) (18) (19) (21) | First Lien Senior Secured Loan | L+ 5.75% | 8.27% | 10/1/2025 | $ | 16,944 | 16,841 | 16,436 | ||||||||||||||||
|
SRS Distribution Inc. (18) (21) | First Lien Senior Secured Loan | L+ 3.25% | 5.77% | 5/23/2025 | $ | 20,000 | 19,505 | 18,725 | ||||||||||||||||
| | | | | | | | | | | | | | | | | | | | | | | | | | |
|
Wholesale Total | $ | 64,530 | $ | 63,053 | 6.3 | % | ||||||||||||||||||
| | | | | | | | | | | | | | | | | | | | | | | | | | |
|
Non-Controlled/Non-Affiliate Investments Total | $ | 1,449,749 | $ | 1,422,837 | 142.0 | % | ||||||||||||||||||
| | | | | | | | | | | | | | | | | | | | | | | | | | |
| | | | | | | | | | | | | | | | | | | | | | | | | | |
| | | | | | | | | | | | | | | | | | | | | | | | | | |
Non-Controlled/Affiliate Investments |
|||||||||||||||||||||||||
|
Beverage, Food & Tobacco | ADT Pizza, LLC (10) (14) (19) (25) | Equity Interest | — | — | — | $ | 6,720 | 6,720 | 6,720 | |||||||||||||||
| | | | | | | | | | | | | | | | | | | | | | | | | | |
|
Beverage, Food & Tobacco Total | $ | 6,720 | $ | 6,720 | 0.7 | % | ||||||||||||||||||
| | | | | | | | | | | | | | | | | | | | | | | | | | |
|
Non-Controlled/Affiliate Investments Total | $ | 6,720 | $ | 6,720 | 0.7 | % | ||||||||||||||||||
| | | | | | | | | | | | | | | | | | | | | | | | | | |
| | | | | | | | | | | | | | | | | | | | | | | | | | |
| | | | | | | | | | | | | | | | | | | | | | | | | | |
Controlled Affiliate Investments |
|||||||||||||||||||||||||
|
Aerospace & Defense | BCC Jetstream Holdings Aviation (Off I), LLC (6) (10) (11) (19) (20) (25) | Equity Interest | — | — | — | $ | 11,863 | 11,863 | 13,480 | |||||||||||||||
|
BCC Jetstream Holdings Aviation (On II), LLC (10) (11) (19) (20) (25) | Equity Interest | — | — | — | $ | 731 | 731 | 1,243 | ||||||||||||||||
|
BCC Jetstream Holdings Aviation (On II), LLC (10) (11) (19) (20) | First Lien Senior Secured Loan | — | 10.00% | 6/2/2022 | $ | 4,163 | 4,163 | 4,163 | ||||||||||||||||
|
BCC Jetstream Holdings Aviation (On II), LLC (7) (10) (11) (14) (19) (20) | First Lien Senior Secured Loan - Unfunded Commitment | — | — | 6/2/2022 | $ | — | — | — | ||||||||||||||||
| | | | | | | | | | | | | | | | | | | | | | | | | | |
|
Aerospace & Defense Total | $ | 16,757 | $ | 18,886 | 1.9 | % | ||||||||||||||||||
| | | | | | | | | | | | | | | | | | | | | | | | | | |
|
Investment Vehicles | Antares Bain Capital Complete Financing Solution LLC (6) (10) (11) (19) (25) | Investment Vehicle | — | — | — | $ | 279,891 | 279,891 | 279,363 | |||||||||||||||
| | | | | | | | | | | | | | | | | | | | | | | | | | |
|
Investment Vehicles Total | $ | 279,891 | $ | 279,363 | 27.9 | % | ||||||||||||||||||
| | | | | | | | | | | | | | | | | | | | | | | | | | |
|
Controlled Affiliate Investments Total | $ | 296,648 | $ | 298,249 | 29.8 | % | ||||||||||||||||||
| | | | | | | | | | | | | | | | | | | | | | | | | | |
| | | | | | | | | | | | | | | | | | | | | | | | | | |
| | | | | | | | | | | | | | | | | | | | | | | | | | |
|
Investments Total | $ | 1,753,117 | $ | 1,727,806 | 172.5 | % | ||||||||||||||||||
| | | | | | | | | | | | | | | | | | | | | | | | | | |
| | | | | | | | | | | | | | | | | | | | | | | | | | |
| | | | | | | | | | | | | | | | | | | | | | | | | | |
Cash Equivalents |
|||||||||||||||||||||||||
|
Cash Equivalents | Goldman Sachs Financial Square Government Fund Institutional Share Class | Cash Equivalents | — | 2.52% | — | $ | 877 | 877 | 877 | |||||||||||||||
| | | | | | | | | | | | | | | | | | | | | | | | | | |
|
Cash Equivalents Total | $ | 877 | $ | 877 | 0.1 | % | ||||||||||||||||||
| | | | | | | | | | | | | | | | | | | | | | | | | | |
|
Investments and Cash Equivalents Total | $ | 1,753,994 | $ | 1,728,683 | 172.6 | % | ||||||||||||||||||
| | | | | | | | | | | | | | | | | | | | | | | | | | |
| | | | | | | | | | | | | | | | | | | | | | | | | | |
| | | | | | | | | | | | | | | | | | | | | | | | | | |
154
Forward Foreign Currency Exchange Contracts
| |
Currency Purchased | Currency Sold | Counterparty | Settlement Date | Unrealized Appreciation (Depreciation) (8) |
|||||||
|---|---|---|---|---|---|---|---|---|---|---|---|---|
|
U.S. DOLLARS 8,720 |
POUND STERLING 6,400 | Bank of New York Mellon | 9/21/2020 | $ | 355 | ||||||
|
U.S. DOLLARS 27,914 |
EURO 22,118 | Bank of New York Mellon | 1/18/2019 | 2,185 | |||||||
|
U.S. DOLLARS 11,541 |
POUND STERLING 8,262 | Bank of New York Mellon | 1/18/2019 | 445 | |||||||
|
U.S. DOLLARS 12,042 |
EURO 10,080 | Bank of New York Mellon | 6/21/2019 | 344 | |||||||
|
U.S. DOLLARS 10,065 |
DANISH KRONE 59,805 | Citibank | 1/18/2019 | 568 | |||||||
|
U.S. DOLLARS 9,957 |
NORWEGIAN KRONE 77,560 | Citibank | 1/18/2019 | 335 | |||||||
|
U.S. DOLLARS 3,169 |
AUSTRALIAN DOLLARS 4,127 | Citibank | 4/11/2019 | 82 | |||||||
|
U.S. DOLLARS 13,192 |
POUND STERLING 9,260 | Citibank | 4/11/2019 | 699 | |||||||
|
U.S. DOLLARS 412 |
POUND STERLING 310 | Citibank | 9/21/2020 | (7) | |||||||
|
U.S. DOLLARS 3,578 |
POUND STERLING 2,630 | Goldman Sachs | 4/11/2019 | 214 | |||||||
|
U.S. DOLLARS 3,091 |
AUSTRALIAN DOLLARS 4,130 | Goldman Sachs | 6/14/2019 | 176 | |||||||
|
U.S. DOLLARS 8,938 |
DANISH KRONE 55,570 | Goldman Sachs | 6/14/2019 | 291 | |||||||
|
U.S. DOLLARS 11,719 |
EURO 9,790 | Goldman Sachs | 6/14/2019 | 365 | |||||||
|
U.S. DOLLARS 60,094 |
POUND STERLING 44,750 | Goldman Sachs | 6/14/2019 | 2,679 | |||||||
|
U.S. DOLLARS 8,994 |
NORWEGIAN KRONE 72,170 | Goldman Sachs | 6/14/2019 | 591 | |||||||
| | | | | | | | | | | | | |
|
$ | 9,322 | ||||||||||
| | | | | | | | | | | | | |
| | | | | | | | | | | | | |
| | | | | | | | | | | | | |
| (1) The investments bear interest at a rate that may be determined by reference to the London Interbank Offered Rate ("LIBOR" or "L"), the Euro Interbank Offered Rate ("EURIBOR" or "E"),British Pound Sterling LIBOR Rate ("GBP LIBOR"), the Norwegian Interbank Offered Rate ("NIBOR" or "N"), the Copenhagen Interbank Offered Rate ("CIBOR" or "C"), the Bank Bill Swap Rate ("BBSW"), or the Prime Rate ("Prime" or "P") and which reset daily, monthly, quarterly or semiannually. Investments or a portion thereof may bear Payment-in-Kind ("PIK"). For each, the Company has provided the PIK or the spread over LIBOR, EURIBOR, GBP LIBOR, NIBOR, CIBOR, BBSW, or Prime and the current weighted average interest rate in effect at December 31, 2018. Certain investments are subject to a LIBOR, EURIBOR, GBP LIBOR, NIBOR, CIBOR, BBSW, or Prime interest rate floor. | ||||||||||||
| (2) The negative fair value is the result of the capitalized discount on the loan or the unfunded commitment being valued below par. | ||||||||||||
| (3) Position or portion thereof is an unfunded loan commitment, and no interest is being earned on the unfunded portion. The investment may be subject to an unused/letter of credit facility fee. | ||||||||||||
| (4) Percentages are based on the Company's net assets of $1,001,629 as of December 31, 2018. | ||||||||||||
| (5) The negative amortized cost is the result of the capitalized discount being greater than the principal amount outstanding on the loan. | ||||||||||||
| (6) The investment is not a qualifying asset under Section 55(a) of the Investment Company Act of 1940. The Company may not acquire any non-qualifying asset unless, at the time of acquisition, qualifying assets represent at least 70% of the Company's total assets. As of December 31, 2018, non-qualifying assets totaled 24.4% of the Company's total assets. | ||||||||||||
| (7) The assets to be issued will be determined at the time the funds are called. | ||||||||||||
| (8) Unrealized appreciation/(depreciation) on forward currency exchange contracts. | ||||||||||||
| (9) The principal amount (par amount) for all debt securities is denominated in U.S. dollars, unless otherwise noted. £ represents Pound Sterling, € represents Euro, NOK represents Norwegian krone, AUD represents Australian and DKK represents Kroner. | ||||||||||||
| (10) As defined in the 1940 Act, the Company is deemed to be an "Affiliated Investment" of the Company as the Company owns five percent or more of the portfolio company's securities. | ||||||||||||
| (11) As defined in the 1940 Act, the Company is deemed to "Control" this portfolio company as the Company either owns more than 25% of the portfolio company's outstanding voting securities or has the power to exercise control over management or policies of such portfolio company. | ||||||||||||
| (12) Assets or a portion thereof are pledged as collateral for the 2018-1 Issuer. See Note 6 "Debt". | ||||||||||||
| (13) $690 of the total par amount for this security is at P+ 3.75%. | ||||||||||||
| (14) Non-Income Producing. | ||||||||||||
| (15) Loan includes interest rate floor of 1.00%. | ||||||||||||
| (16) Loan includes interest rate floor of 0.75%. | ||||||||||||
| (17) Loan includes interest rate floor of 0.50%. | ||||||||||||
| (18) Loan includes interest rate floor of 0.00%. | ||||||||||||
| (19) Security valued using unobservable inputs (Level 3). | ||||||||||||
155
| (20) The Company holds non-controlling, affiliate interest in an aircraft-owning special purpose vehicle through this investment. | ||||||||||||
| (21) Assets or a portion thereof are pledged as collateral for the BCSF Revolving Credit Facility. See Note 6 "Debt". | ||||||||||||
| (22) The Company generally earns a higher interest rate on the "last out" tranche of debt, to the extent the debt has been allocated to "first out" and "last out" tranches, whereby the "first out" tranche will have priority as to the "last out" tranche with respect to payments of principal, interest and any other amounts due thereunder. | ||||||||||||
| (23) $2,267 of the total par amount for this security is at P+ 3.50%. | ||||||||||||
| (24) $472 of the total par amount for this security is at P+ 3.50%. | ||||||||||||
| (25) Security exempt from registration under the Securities Act of 1933 (the "Securities Act"), and may be deemed to be "restricted securities" under the Securities Act. As of December 31, 2018, the aggregate fair value of these securities is $308,692 or 30.8% of the Company's net assets. The acquisition dates of the restricted securities are as follows: | ||||||||||||
| |
Investment | Acquisition Date | ||
|---|---|---|---|---|
| BCC Jetstream Holdings Aviation (On II), LLC - Equity Interest | 6/1/2017 | |||
| BCC Jetstream Holdings Aviation (Off I), LLC - Equity Interest | 6/1/2017 | |||
| Antares Bain Capital Complete Financing Solution LLC - Investment Vehicle | 11/29/2017 | |||
| CB Titan Holdings, Inc. - Equity Interest | 11/14/2017 | |||
| Impala Private Investments, LLC - Equity Interest | 11/10/2017 | |||
| Abracon Group Holding, LLC. - Equity Interest | 7/18/2018 | |||
| Armor Group, LP - Equity Interest | 8/28/2018 | |||
| Grammer Investment Holdings LLC - Warrants | 10/1/2018 | |||
| Grammer Investment Holdings LLC - Equity Interest | 10/1/2018 | |||
| Grammer Investment Holdings LLC - Preferred Equity | 10/1/2018 | |||
| ADT Pizza, LLC - Equity Interest | 10/29/2018 | |||
| PP Ultimate Holdings B, LLC - Equity Interest | 12/20/2018 | |||
(26) Loan includes interest rate floor of 1.25%. |
||||
See Notes to Consolidated Financial Statements
156
BAIN CAPITAL SPECIALTY FINANCE, INC.
NOTES TO CONSOLIDATED FINANCIAL STATEMENTS
(in thousands, except share and per share data)
Bain Capital Specialty Finance, Inc. (the "Company") was formed on October 5, 2015 and commenced investment operations on October 13, 2016. The Company has elected to be treated and is regulated as a business development company (a "BDC") under the Investment Company Act of 1940, as amended (the "1940 Act"). In addition, for tax purposes the Company has elected to be treated and intends to operate in a manner so as to continuously qualify as a regulated investment company (a "RIC") under Subchapter M of the Internal Revenue Code of 1986, as amended (the "Code"), commencing concurrently with its election to be treated as a BDC. The Company is externally managed by BCSF Advisors, LP (the "Advisor" or "BCSF Advisors"), our investment adviser that is registered with the Securities and Exchange Commission (the "SEC") under the Investment Advisers Act of 1940, as amended (the "Advisers Act"). The Advisor also provides the administrative services necessary for the Company to operate (in such capacity, the "Administrator" or "BCSF Advisors").
On November 19, 2018, the Company closed its initial public offering (the "IPO"), which was a Qualified IPO, issuing 7,500,000 shares of its common stock at a public offering price of $20.25 per share. Shares of common stock of the Company began trading on the New York Stock Exchange under the symbol "BCSF" on November 15, 2018.
The Company's primary focus is capitalizing on opportunities within its Advisor's Senior Direct Lending Strategy, which seeks to provide risk-adjusted returns and current income to its stockholders by investing primarily in middle-market companies with between $10.0 million and $150.0 million in EBITDA. The Company focuses on senior investments with a first or second lien on collateral and strong structures and documentation intended to protect the lender. The Company generally seeks to retain voting control in respect of the loans or particular classes of securities in which the Company invests through maintaining affirmative voting positions or negotiating consent rights that allow the Company to retain a blocking position. The Company may also invest in mezzanine debt and other junior securities and in secondary purchases of assets or portfolios, as described below. Investments are likely to include, among other things, (i) senior first lien, stretch senior, senior second lien, unitranche, (ii) mezzanine debt and other junior investments and (iii) secondary purchases of assets or portfolios that primarily consist of middle-market corporate debt. The Company may also invest, from time to time, in equity securities, distressed debt, debtor-in-possession loans, structured products, structurally subordinate loans, investments with deferred interest features, zero-coupon securities and defaulted securities.
Our operations comprise only a single reportable segment.
Note 2. Summary of Significant Accounting Policies
The Company's consolidated financial statements have been prepared in accordance with generally accepted accounting principles in the United States of America ("US GAAP"). The Company's consolidated financial statements and related financial information have been prepared pursuant to the requirements for reporting on Form 10-K and Regulation S-X. These consolidated financial statements reflect adjustments that in the opinion of the Company are necessary for the fair statement of the financial position and results of operations for the periods presented herein. The Company has determined it meets
157
the definition of an investment company and follows the accounting and reporting guidance in the Financial Accounting Standards Board ("FASB") Accounting Standards Codification ("ASC") Topic 946 — Financial Services — Investment Companies. The functional currency of the Company is U.S. dollars and these consolidated financial statements have been prepared in that currency. Certain prior period information has been reclassified to conform to the current period presentation. The reclassification has no effect on the Company's consolidated financial position or the consolidated results of operations as previously reported.
The Company will generally consolidate any wholly, or substantially, owned subsidiary when the design and purpose of the subsidiary is to act as an extension of the Company's investment operations and to facilitate the execution of the Company's investment strategy. Accordingly, the Company consolidated the results of its subsidiaries BCSF I, LLC, BCSF II-C, LLC, BCSF CFSH, LLC, BCSF CFS, LLC, BCC Middle Market CLO 2018-1, LLC, and BCC Middle Market CLO 2019-1, LLC in its consolidated financial statements. All intercompany transactions and balances have been eliminated in consolidation. Since the Company is an investment company, portfolio investments held by the Company are not consolidated into the consolidated financial statements. The portfolio investments held by the Company (including its investments held by consolidated subsidiaries) are included on the consolidated statements of assets and liabilities as investments at fair value.
The preparation of the consolidated financial statements in conformity with US GAAP requires the Company to make estimates and assumptions that affect the reported amounts of assets and liabilities and disclosure of contingent assets and liabilities at the date of the consolidated financial statements and the reported amounts of increases and decreases in net assets from operations during the reporting period. Actual results could differ from those estimates and such differences could be material.
Valuation of Portfolio Investments
Investments for which market quotations are readily available are typically valued at such market quotations. Market quotations are obtained from an independent pricing service, where available. If a price cannot be obtained from an independent pricing service or if the independent pricing service is not deemed to be current with the market, certain investments held by the Company will be valued on the basis of prices provided by principal market makers. Generally, investments marked in this manner will be marked at the mean of the bid and ask of the independent broker quotes obtained. To validate market quotations, the Company utilizes a number of factors to determine if the quotations are representative of fair value, including the source and number of quotations. Debt and equity securities that are not publicly traded or whose market prices are not readily available are valued at fair value, subject at all times to the oversight and approval of the Board of Directors of the Company (the "Board"), based on, among other things, the input of the Advisor, the Company's audit committee of the Board (the "Audit Committee) and one or more independent third party valuation firms engaged by the Board.
With respect to unquoted portfolio investments, the Company will value each investment considering, among other measures, discounted cash flow models, comparisons of financial ratios of peer companies that are public and other factors. When an external event such as a purchase transaction, public offering or subsequent equity sale occurs, the Company will use the pricing indicated by the external event to corroborate and/or assist us in our valuation. Due to the inherent uncertainty of determining the fair value of investments that do not have a readily available market value, the fair value of our investments
158
may differ significantly from the values that would have been used had a readily available market value existed for such investments, and the differences could be material.
With respect to investments for which market quotations are not readily available, the Advisor will undertake a multi-step valuation process, which includes among other things, the below:
- •
- The Company's quarterly valuation process begins with each portfolio company or investment being initially valued by the
investment professionals of the Advisor responsible for the portfolio investment or by an independent valuation firm;
- •
- Preliminary valuation conclusions are then documented and discussed with the Company's senior management and the Advisor. Agreed
upon valuation recommendations are presented to the Audit Committee;
- •
- The Audit Committee of the Board reviews the valuations presented and recommends values for each of the investments to the Board;
and
- •
- The Board will discuss valuations and determine the fair value of each investment in good faith based upon, among other things, the input of the Advisor, independent valuation firms, where applicable, and the Audit Committee.
In following this approach, the types of factors that are taken into account in the fair value pricing of investments include, as relevant, but are not limited to: comparison to publicly traded securities, including factors such as yield, maturity and measures of credit quality; the enterprise value of a portfolio company; the nature and realizable value of any collateral; the portfolio company's ability to make payments and its earnings and discounted cash flows; and the markets in which the portfolio company does business. In cases where an independent valuation firm provides fair valuations for investments, the independent valuation firm provides a fair valuation report, a description of the methodology used to determine the fair value and their analysis and calculations to support their conclusion.
The Company applies ASC Topic 820, Fair Value Measurement ("ASC 820"), which establishes a framework for measuring fair value in accordance with US GAAP and required disclosures of fair value measurements. The fair value of a financial instrument is the amount that would be received in an orderly transaction between market participants at the measurement date. The Company determines the fair value of investments consistent with its valuation policy. The Company discloses the fair value of its investments in a hierarchy which prioritizes and ranks the level of market observability used in the determination of fair value. In accordance with ASC 820, these levels are summarized below:
- •
- Level 1 — Valuations based on quoted prices (unadjusted) in active markets for identical assets or
liabilities at the measurement date.
- •
- Level 2 — Valuations based on quoted prices in markets that are not active or for which all significant
inputs are observable, either directly or indirectly.
- •
- Level 3 — Valuations based on inputs that are unobservable and significant to the fair value measurement.
A financial instrument's level within the hierarchy is based on the lowest level of any input that is significant to the fair value measurement. Valuations of Level 2 investments are generally based on quotations received from pricing services, dealers or brokers. Consideration is given to the source and nature of the quotations and the relationship of recent market activity to the quotations provided.
159
Transfers between levels, if any, are recognized at the beginning of the reporting period in which the transfers occur. The Company evaluates the source of inputs used in the determination of fair value, including any markets in which the investments, or similar investments, are trading. When the fair value of an investment is determined using inputs from a pricing service (or principal market makers), the Company considers various criteria in determining whether the investment should be classified as a Level 2 or Level 3 investment. Criteria considered includes the pricing methodologies of the pricing services (or principal market makers) to determine if the inputs to the valuation are observable or unobservable, as well as the number of prices obtained and an assessment of the quality of the prices obtained. The level of an investment within the fair value hierarchy is based on the lowest level of any input that is significant to the fair value measurement. However, the determination of what constitutes "observable" requires significant judgment.
The fair value assigned to these investments is based upon available information and may fluctuate from period to period. In addition, it does not necessarily represent the amount that might ultimately be realized upon sale. Due to inherent uncertainty of valuation, the estimated fair value of investments may differ from the value that would have been used had a ready market for the security existed, and the difference could be material.
Securities Transactions, Revenue Recognition and Expenses
The Company records its investment transactions on a trade date basis. The Company measures realized gains or losses by the difference between the net proceeds from the repayment or sale and the amortized cost basis of the investment, using the specified identification method. Interest income, adjusted for amortization of premium and accretion of discount, is recorded on an accrual basis. Discount and premium to par value on investments acquired are accreted and amortized, respectively, into interest income over the life of the respective investment using the effective interest method. Commitment fees are recorded on an accrual basis and recognized as interest income. Loan origination fees, original issue discount and market discount or premium are capitalized and amortized against or accreted into interest income using the effective interest method or straight-line method, as applicable. For the Company's investments in revolving bank loans, the cost basis of the investment purchased is adjusted for the cash received for the discount on the total balance committed. The fair value is also adjusted for price appreciation or depreciation on the unfunded portion. As a result, the purchase of commitments not completely funded may result in a negative value until it is offset by the future amounts called and funded. Upon prepayment of a loan or debt security, any prepayment premium, unamortized upfront loan origination fees and unamortized discount are recorded as interest income.
Dividend income on preferred equity investments is recorded on an accrual basis to the extent that such amounts are payable by the portfolio company and are expected to be collected. Dividend income on common equity investments is recorded on the record date for private portfolio companies and on the ex-dividend date for publicly traded portfolio companies. Distributions received from an equity interest, limited liability company or a limited partnership investment are evaluated to determine if the distribution should be recorded as dividend income or a return of capital.
Certain investments may have contractual payment-in-kind ("PIK") interest or dividends. PIK represents accrued interest or accumulated dividends that are added to the loan principal of the investment on the respective interest or dividend payment dates rather than being paid in cash and generally becomes due at maturity or upon being called by the issuer. PIK is recorded as interest or dividend income, as applicable. If at any point the Company believes PIK is not expected to be realized, the investment generating PIK will be placed on non-accrual status. Accrued PIK interest or dividends are generally reversed through interest or dividend income, respectively, when an investment is placed on non-accrual status.
160
Certain structuring fees and amendment fees are recorded as other income when earned. Administrative agent fees received by the Company are recorded as other income when the services are rendered.
Expenses are recorded on an accrual basis.
Loans or debt securities are placed on non-accrual status when there is reasonable doubt that principal or interest will be collected. Accrued interest generally is reversed when a loan or debt security is placed on non-accrual status. Interest payments received on non-accrual loans or debt securities may be recognized as income or applied to principal depending upon management's judgment. Non-accrual loans and debt securities are restored to accrual status when past due principal and interest are paid and, in management's judgment, principal and interest payments are likely to remain current. The Company may make exceptions to this treatment if a loan has sufficient collateral value and is in the process of collection. As of December 31, 2019 two loans have been placed on non-accrual status. As of December 31, 2018, no loans or debt securities had been placed on non-accrual status.
Distributions to common stockholders are recorded on the record date. The amount to be distributed, if any, is determined by the Board each quarter, and is generally based upon the earnings estimated by the Advisor. Distributions from net investment income and net realized capital gains are determined in accordance with U.S. federal income tax regulations, which may differ from those amounts determined in accordance with US GAAP. The Company may pay distributions to its stockholders in a year in excess of its investment company taxable income and net capital gain for that year and, accordingly, a portion of such distributions may constitute a return of capital for U.S. federal income tax purposes. This excess generally would be a tax-free return of capital in the period and generally would reduce the stockholder's tax basis in its shares. These book/tax differences are either temporary or permanent in nature. To the extent these differences are permanent; they are charged or credited to paid-in capital in excess of par, accumulated undistributed net investment income or accumulated net realized gain (loss), as appropriate, in the period that the differences arise. Temporary and permanent differences are primarily attributable to differences in the tax treatment of certain loans and the tax characterization of income and non-deductible expenses.
The Company intends to timely distribute to its stockholders substantially all of its annual taxable income for each year, except that the Company may retain certain net capital gains for reinvestment and, depending upon the level of the Company's taxable income earned in a year, the Company may choose to carry forward taxable income for distribution in the following year and incur applicable U.S. federal excise tax. The specific tax characteristics of the Company's distributions will be reported to stockholders after the end of the calendar year. All distributions will be subject to available funds, and no assurance can be given that the Company will be able to declare such distributions in future periods.
The Company distributes net capital gains (i.e., net long-term capital gains in excess of net short-term capital losses), if any, at least annually out of the assets legally available for such distributions. However, the Company may decide in the future to retain such capital gains for investment, incur a corporate-level tax on such capital gains, and elect to treat such capital gains as deemed distributions to stockholders.
161
The Company has adopted a dividend reinvestment plan that provides for the reinvestment of cash dividends and distributions. Prior to the IPO, stockholders who elected to "opt in" to the Company's dividend reinvestment plan had their cash dividends and distributions automatically reinvested in additional shares of the Company's common stock, rather than receiving cash dividends and distributions.
Subsequent to the IPO, stockholders who do not "opt out" of the Company's dividend reinvestment plan will have their cash dividends and distributions automatically reinvested in additional shares of the Company's common stock, rather than receiving cash dividends and distributions.
Offering costs consist primarily of fees and expenses incurred in connection with the offering of shares, legal, printing and other costs associated with the preparation and filing of applicable registration statements. Offering costs of the Company incurred prior to the commencement of operations have been recognized as a deferred charge and are amortized on a straight line basis over 12 months beginning on the date of commencement of operations and are shown in the Company's consolidated statements of operations. To the extent such expenses relate to equity offerings, these expenses are charged as a reduction of paid-in-capital upon each such offering.
Cash, Restricted Cash, and Cash Equivalents
Cash and cash equivalents consist of deposits held at custodian banks, and highly liquid investments, such as money market funds, with original maturities of three months or less. Cash and cash equivalents are carried at cost or amortized cost, which approximates fair value. The Company may deposit its cash and cash equivalents in financial institutions and, at certain times, such balances may exceed the Federal Deposit Insurance Corporation insurance limits. Cash equivalents are presented separately on the consolidated schedules of investments. Restricted cash is collected and held by the trustee who has been appointed as custodian of the assets securing certain of the Company's financing transactions.
The accounting records of the Company are maintained in U.S. dollars. The fair values of foreign securities, foreign cash and other assets and liabilities denominated in foreign currency are translated to U.S. dollars based on the current exchange rates at the end of each business day. Income and expenses denominated in foreign currencies are translated at current exchange rates when accrued or incurred. Unrealized gains and losses on foreign currency holdings and non-investment assets and liabilities attributable to the changes in foreign currency exchange rates are included in the net change in unrealized appreciation (depreciation) on foreign currency translation on the consolidated statements of operations. Net realized gains and losses on foreign currency holdings and non-investment assets and liabilities attributable to changes in foreign currency exchange rates are included in net realized gain (loss) on foreign currency transactions on the consolidated statements of operations. The portion of both realized and unrealized gains and losses on investments that result from changes in foreign currency exchange rates is not separately disclosed, but is included in net realized gain (loss) on investments and net change in unrealized appreciation (depreciation) on investments, respectively, on the consolidated statements of operations.
162
Forward Currency Exchange Contracts
The Company may enter into forward currency exchange contracts to reduce the Company's exposure to foreign currency exchange rate fluctuations in the value of foreign currencies. A forward currency exchange contract is an agreement between two parties to buy and sell a currency at a set price on a future date. The Company does not utilize hedge accounting and as such the Company recognizes the value of its derivatives at fair value on the consolidated statements of assets and liabilities with changes in the net unrealized appreciation (depreciation) on forward currency exchange contracts recorded on the consolidated statements of operations. Forward currency exchange contracts are valued using the prevailing forward currency exchange rate of the underlying currencies. Unrealized appreciation (depreciation) on forward currency exchange contracts are recorded on the consolidated statements of assets and liabilities by counterparty on a net basis, not taking into account collateral posted which is recorded separately, if applicable. Cash collateral maintained in accounts held by counterparties is included in collateral on forward currency exchange contracts on the consolidated statements of assets and liabilities. Notional amounts and the gross fair value of forward currency exchange contracts assets and liabilities are presented separately on the consolidated schedules of investments.
Changes in net unrealized appreciation (depreciation) are recorded on the consolidated statements of operations in net change in unrealized appreciation (depreciation) on forward currency exchange contracts. Net realized gains and losses are recorded on the consolidated statements of operations in net realized gain (loss) on forward currency exchange contracts. Realized gains and losses on forward currency exchange contracts are determined using the difference between the fair market value of the forward currency exchange contract at the time it was opened and the fair market value at the time it was closed or covered. Additionally, losses, up to the fair value, may arise if the counterparties do not perform under the contract terms.
Deferred Financing Costs and Debt Issuance Costs
The Company records costs related to issuance of revolving debt obligations as deferred financing costs. These costs are deferred and amortized using the straight-line method over the stated maturity life of the obligation. The Company records costs related to the issuance of term debt obligations as debt issuance costs. These costs are deferred and amortized using the effective interest method. These costs are presented as a reduction to the outstanding principal amount of the term debt obligations on the consolidated statements of assets and liabilities.
The Company has elected to be treated for U.S. federal income tax purposes as a RIC under the Code. So long as the Company maintains its status as a RIC, it will generally not be subject to corporate-level U.S. federal income taxes on any ordinary income or capital gains that it distributes at least annually as dividends to its stockholders. As a result, any tax liability related to income earned and distributed by the Company represents obligations of the Company's stockholders and will not be reflected in the consolidated financial statements of the Company.
The Company intends to comply with the applicable provisions of the Code pertaining to RICs and to make distributions of taxable income sufficient to relieve it from substantially all federal income taxes. Accordingly, no provision for income taxes is required in the consolidated financial statements. For income tax purposes, distributions made to stockholders are reported as ordinary income, capital gains, non-taxable return of capital, or a combination thereof. The tax character of distributions paid to stockholders through December 31, 2019 may include return of capital, however, the exact amount cannot be determined at this point. The final determination of the tax character of distributions will not be made
163
until we file our tax return for the tax year ending December 31, 2019. The character of income and gains that we will distribute is determined in accordance with income tax regulations that may differ from GAAP. BCSF I, LLC; BCSF II-C, LLC; BCSF CFSH, LLC; BCSF CFS, LLC, BCC Middle Market CLO 2018-1, LLC; and BCC Middle Market CLO 2019-1, LLC are disregarded entities for tax purposes and are consolidated with the tax return of the Company.
The Company evaluates tax positions taken or expected to be taken in the course of preparing its consolidated financial statements to determine whether the tax positions are "more-likely-than-not" to be sustained by the applicable tax authority. Tax positions not deemed to meet the "more-likely-than-not" threshold are reversed and recorded as a tax benefit or expense in the current year. All penalties and interest associated with income taxes, if any, are included in income tax expense. Conclusions regarding tax positions are subject to review and may be adjusted at a later date based on factors including, but not limited to, on-going analyses of tax laws, regulations and interpretations thereof. Management has analyzed the Company's tax positions, and has concluded that no liability for unrecognized tax benefits related to uncertain tax positions on returns to be filed by the Company for all open tax years should be recorded. The Company identifies its major tax jurisdiction as the United States, and the Company is not aware of any tax positions for which it is reasonably possible that the total amounts of unrecognized tax benefits will change materially in the next 12 months. As of December 31, 2019, the tax years that remain subject to examination are from 2016 forward.
Recent Accounting Pronouncements
In August 2018, the FASB issued ASU 2018-13, "Fair Value Measurement (Topic 820): Disclosure Framework — Changes to the Disclosure Requirements for Fair Value Measurement." ASU 2018-13 is part of the disclosure framework project and eliminates certain disclosure requirements for fair value measurements, requires entities to disclose new information, and modifies existing disclosure requirements. The new guidance is effective for fiscal years and interim periods beginning after December 15, 2019. Early adoption is permitted. The Company does not believe this change will have a material effect on its consolidated financial statements and disclosures.
The following table shows the composition of the investment portfolio, at amortized cost and fair value as of December 31, 2019 (with corresponding percentage of total portfolio investments):
| |
As of December 31, 2019 | ||||||||||||
|---|---|---|---|---|---|---|---|---|---|---|---|---|---|
| |
Amortized Cost | Percentage of Total Portfolio |
Fair Value | Percentage of Total Portfolio |
|||||||||
First Lien Senior Secured Loans |
$ | 2,167,932 | 85.4 | % | $ | 2,165,844 | 85.7 | % | |||||
First Lien Last Out Loans |
28,315 | 1.1 | 29,300 | 1.2 | |||||||||
Second Lien Senior Secured Loans |
187,565 | 7.4 | 175,670 | 7.0 | |||||||||
Subordinated Debt |
14,752 | 0.6 | 15,000 | 0.5 | |||||||||
Corporate Bonds |
22,412 | 0.9 | 17,508 | 0.7 | |||||||||
Equity Interests |
96,736 | 3.8 | 99,293 | 3.9 | |||||||||
Preferred Equity |
19,551 | 0.8 | 24,318 | 1.0 | |||||||||
Warrants |
— | 0.0 | 122 | 0.0 | |||||||||
| | | | | | | | | | | | | | |
Total |
$ | 2,537,263 | 100.0 | % | $ | 2,527,055 | 100.0 | % | |||||
| | | | | | | | | | | | | | |
| | | | | | | | | | | | | | |
| | | | | | | | | | | | | | |
164
The following table shows the composition of the investment portfolio, at amortized cost and fair value as of December 31, 2018 (with corresponding percentage of total portfolio investments):
| |
As of December 31, 2018 | ||||||||||||
|---|---|---|---|---|---|---|---|---|---|---|---|---|---|
| |
Amortized Cost | Percentage of Total Portfolio |
Fair Value | Percentage of Total Portfolio |
|||||||||
First Lien Senior Secured Loans |
$ | 1,074,413 | 61.3 | % | $ | 1,058,839 | 61.3 | % | |||||
First Lien Last Out Loans |
27,325 | 1.5 | 27,488 | 1.6 | |||||||||
Second Lien Senior Secured Loans |
263,759 | 15.0 | 258,139 | 14.9 | |||||||||
Subordinated Debt |
39,711 | 2.3 | 39,625 | 2.3 | |||||||||
Corporate Bonds |
41,387 | 2.4 | 35,023 | 2.0 | |||||||||
Investment Vehicles (1) |
279,891 | 16.0 | 279,363 | 16.2 | |||||||||
Equity Interests |
24,078 | 1.4 | 26,522 | 1.5 | |||||||||
Preferred Equity |
2,553 | 0.1 | 2,807 | 0.2 | |||||||||
Warrants |
— | 0.0 | — | 0.0 | |||||||||
| | | | | | | | | | | | | | |
Total |
$ | 1,753,117 | 100.0 | % | $ | 1,727,806 | 100.0 | % | |||||
| | | | | | | | | | | | | | |
| | | | | | | | | | | | | | |
| | | | | | | | | | | | | | |
- (1)
- Represents equity investment in ABCS.
The following table shows the composition of the investment portfolio by geographic region, at amortized cost and fair value as of December 31, 2019 (with corresponding percentage of total portfolio investments):
| |
As of December 31, 2019 | ||||||||||||
|---|---|---|---|---|---|---|---|---|---|---|---|---|---|
| |
Amortized Cost | Percentage of Total Portfolio |
Fair Value | Percentage of Total Portfolio |
|||||||||
United States |
$ | 2,160,607 | 85.2 | % | $ | 2,146,830 | 85.0 | % | |||||
United Kingdom |
123,327 | 4.9 | 126,455 | 5.0 | |||||||||
Cayman Islands |
57,007 | 2.2 | 57,773 | 2.3 | |||||||||
Luxembourg |
45,622 | 1.8 | 45,461 | 1.8 | |||||||||
Israel |
36,193 | 1.4 | 36,175 | 1.4 | |||||||||
Germany |
25,142 | 1.0 | 26,113 | 1.0 | |||||||||
Ireland |
20,486 | 0.8 | 20,485 | 0.8 | |||||||||
Sweden |
18,357 | 0.7 | 16,996 | 0.7 | |||||||||
Australia |
14,006 | 0.6 | 14,050 | 0.6 | |||||||||
France |
13,098 | 0.5 | 13,076 | 0.5 | |||||||||
Jersey |
12,144 | 0.5 | 12,763 | 0.5 | |||||||||
Netherlands |
11,274 | 0.4 | 10,878 | 0.4 | |||||||||
| | | | | | | | | | | | | | |
Total |
$ | 2,537,263 | 100.0 | % | $ | 2,527,055 | 100.0 | % | |||||
| | | | | | | | | | | | | | |
| | | | | | | | | | | | | | |
| | | | | | | | | | | | | | |
165
The following table shows the composition of the investment portfolio by geographic region, at amortized cost and fair value as of December 31, 2018 (with corresponding percentage of total portfolio investments):
| |
As of December 31, 2018 | ||||||||||||
|---|---|---|---|---|---|---|---|---|---|---|---|---|---|
| |
Amortized Cost | Percentage of Total Portfolio |
Fair Value | Percentage of Total Portfolio |
|||||||||
United States (1) |
$ | 1,613,203 | 92.0 | % | $ | 1,589,936 | 92.0 | % | |||||
United Kingdom |
59,621 | 3.4 | 58,473 | 3.4 | |||||||||
Ireland |
22,770 | 1.3 | 23,414 | 1.4 | |||||||||
Sweden |
18,308 | 1.0 | 17,301 | 1.0 | |||||||||
Norway |
14,798 | 0.9 | 14,798 | 0.9 | |||||||||
France |
13,060 | 0.7 | 12,631 | 0.7 | |||||||||
Netherlands |
11,357 | 0.7 | 11,253 | 0.6 | |||||||||
| | | | | | | | | | | | | | |
Total |
$ | 1,753,117 | 100.0 | % | $ | 1,727,806 | 100.0 | % | |||||
| | | | | | | | | | | | | | |
| | | | | | | | | | | | | | |
| | | | | | | | | | | | | | |
- (1)
- Includes equity investment in ABCS.
166
The following table shows the composition of the investment portfolio by industry, at amortized cost and fair value as of December 31, 2019 (with corresponding percentage of total portfolio investments):
| |
As of December 31, 2019 | ||||||||||||
|---|---|---|---|---|---|---|---|---|---|---|---|---|---|
| |
Amortized Cost | Percentage of Total Portfolio |
Fair Value | Percentage of Total Portfolio |
|||||||||
| High Tech Industries | $ | 356,086 | 14.0 | % | $ | 356,073 | 14.1 | % | |||||
| Aerospace & Defense | 305,111 | 12.0 | 307,863 | 12.2 | |||||||||
| Healthcare & Pharmaceuticals | 255,579 | 10.1 | 254,014 | 10.1 | |||||||||
| Consumer Goods: Non-Durable | 195,602 | 7.7 | 196,653 | 7.8 | |||||||||
| Capital Equipment | 183,618 | 7.2 | 186,913 | 7.4 | |||||||||
| Services: Business | 165,286 | 6.5 | 165,862 | 6.5 | |||||||||
| Transportation: Cargo | 116,074 | 4.6 | 116,237 | 4.6 | |||||||||
| Construction & Building | 107,413 | 4.2 | 108,176 | 4.3 | |||||||||
| Wholesale | 79,542 | 3.1 | 78,225 | 3.1 | |||||||||
| Energy: Oil & Gas | 77,264 | 3.0 | 77,979 | 3.1 | |||||||||
| Automotive | 66,522 | 2.6 | 67,374 | 2.7 | |||||||||
| Consumer Goods: Durable | 63,712 | 2.5 | 63,394 | 2.5 | |||||||||
| Transportation: Consumer | 62,473 | 2.5 | 61,662 | 2.3 | |||||||||
| Media: Advertising, Printing & Publishing | 59,419 | 2.3 | 54,765 | 2.2 | |||||||||
| FIRE: Insurance (1) | 52,367 | 2.1 | 54,086 | 2.1 | |||||||||
| Hotel, Gaming & Leisure | 52,866 | 2.1 | 53,074 | 2.1 | |||||||||
| Media: Broadcasting & Subscription | 43,165 | 1.7 | 44,247 | 1.8 | |||||||||
| Media: Diversified & Production | 35,670 | 1.4 | 36,403 | 1.4 | |||||||||
| Retail | 34,774 | 1.4 | 34,827 | 1.4 | |||||||||
| Chemicals, Plastics & Rubber | 32,288 | 1.3 | 32,446 | 1.3 | |||||||||
| Services: Consumer | 30,458 | 1.2 | 30,794 | 1.2 | |||||||||
| Banking | 25,656 | 1.0 | 25,466 | 1.0 | |||||||||
| Energy: Electricity | 22,172 | 0.9 | 22,134 | 0.9 | |||||||||
| Telecommunications | 21,323 | 0.8 | 21,343 | 0.8 | |||||||||
| Beverage, Food & Tobacco | 30,687 | 1.2 | 19,531 | 0.8 | |||||||||
| Environmental Industries | 16,814 | 0.7 | 17,612 | 0.7 | |||||||||
| Containers, Packaging, & Glass | 11,637 | 0.5 | 11,633 | 0.5 | |||||||||
| FIRE: Real Estate (1) | 10,786 | 0.4 | 10,443 | 0.4 | |||||||||
| Forest Products & Paper | 10,301 | 0.4 | 9,700 | 0.4 | |||||||||
| Utilities: Electric | 12,598 | 0.6 | 8,126 | 0.3 | |||||||||
| | | | | | | | | | | | | | |
| Total | $ | 2,537,263 | 100.0 | % | $ | 2,527,055 | 100.0 | % | |||||
| | | | | | | | | | | | | | |
| | | | | | | | | | | | | | |
| | | | | | | | | | | | | | |
- (1)
- Finance, Insurance, and Real Estate ("FIRE").
167
The following table shows the composition of the investment portfolio by industry, at amortized cost and fair value as of December 31, 2018 (with corresponding percentage of total portfolio investments):
| |
As of December 31, 2018 | ||||||||||||
|---|---|---|---|---|---|---|---|---|---|---|---|---|---|
| |
Amortized Cost | Percentage of Total Portfolio |
Fair Value | Percentage of Total Portfolio |
|||||||||
| Investment Vehicles (1) | $ | 279,891 | 16.0 | % | $ | 279,363 | 16.2 | % | |||||
| High Tech Industries | 205,845 | 11.7 | 202,999 | 11.7 | |||||||||
| Services: Business | 137,816 | 7.9 | 135,398 | 7.8 | |||||||||
| Healthcare & Pharmaceuticals | 127,105 | 7.3 | 125,745 | 7.3 | |||||||||
| Aerospace & Defense | 120,070 | 6.8 | 121,411 | 7.0 | |||||||||
| Transportation: Cargo | 85,198 | 4.9 | 83,513 | 4.8 | |||||||||
| Hotel, Gaming & Leisure | 81,487 | 4.6 | 80,683 | 4.7 | |||||||||
| Consumer Goods: Non-Durable | 73,809 | 4.2 | 71,439 | 4.1 | |||||||||
| Wholesale | 64,530 | 3.7 | 63,053 | 3.6 | |||||||||
| Capital Equipment | 44,054 | 2.5 | 42,796 | 2.5 | |||||||||
| Construction & Building | 41,240 | 2.4 | 41,582 | 2.4 | |||||||||
| Retail | 43,263 | 2.5 | 41,384 | 2.4 | |||||||||
| FIRE: Insurance (2) | 43,287 | 2.5 | 41,106 | 2.4 | |||||||||
| Services: Consumer | 41,328 | 2.4 | 41,023 | 2.4 | |||||||||
| Containers, Packaging & Glass | 40,212 | 2.3 | 38,694 | 2.2 | |||||||||
| Beverage, Food & Tobacco | 38,154 | 2.2 | 35,613 | 2.1 | |||||||||
| Energy: Oil & Gas | 31,541 | 1.8 | 31,195 | 1.8 | |||||||||
| Media: Diversified & Production | 30,364 | 1.7 | 30,491 | 1.8 | |||||||||
| Automotive | 29,482 | 1.7 | 29,337 | 1.7 | |||||||||
| Energy: Electricity | 22,368 | 1.3 | 22,283 | 1.3 | |||||||||
| Forest Products & Paper | 22,515 | 1.3 | 21,903 | 1.3 | |||||||||
| Media: Broadcasting & Subscription | 21,868 | 1.2 | 20,945 | 1.2 | |||||||||
| Media: Advertising, Printing & Publishing | 19,635 | 1.1 | 19,731 | 1.1 | |||||||||
| Chemicals, Plastics & Rubber | 19,147 | 1.1 | 19,511 | 1.1 | |||||||||
| Consumer Goods: Durable | 17,098 | 0.9 | 17,248 | 1.0 | |||||||||
| Environmental Industries | 16,489 | 0.9 | 16,482 | 1.0 | |||||||||
| Telecommunications | 15,240 | 0.9 | 15,122 | 0.9 | |||||||||
| Banking | 13,260 | 0.7 | 13,235 | 0.8 | |||||||||
| FIRE: Real Estate (2) | 10,714 | 0.6 | 10,650 | 0.6 | |||||||||
| Utilities: Electric | 12,483 | 0.7 | 10,311 | 0.6 | |||||||||
| FIRE: Finance (2) | 3,624 | 0.2 | 3,560 | 0.2 | |||||||||
| | | | | | | | | | | | | | |
| Total | $ | 1,753,117 | 100.0 | % | $ | 1,727,806 | 100.0 | % | |||||
| | | | | | | | | | | | | | |
| | | | | | | | | | | | | | |
| | | | | | | | | | | | | | |
- (1)
- Represents equity investment in ABCS.
- (2)
- Finance, Insurance, and Real Estate ("FIRE").
Antares Bain Capital Complete Financing Solution
Prior to April 30, 2019, the Company was party to a limited liability company agreement with Antares Midco Inc. ("Antares") pursuant to which it invested in ABC Complete Financing Solution LLC, which made investments through its subsidiary, Antares Bain Capital Complete Financing Solution LLC (together with ABC Complete Financing Solution LLC, "ABCS"). ABCS, an unconsolidated Delaware limited liability company, was formed on September 27, 2017 and commenced operations on November 29,
168
2017. ABCS' principal purpose was to make investments, primarily in senior secured unitranche loans. The Company recorded its investment in ABCS at fair value. Distributions of income received from ABCS, if any, were recorded as dividend income from controlled affiliate investments in the consolidated statements of operations. Distributions received from ABCS in excess of income earned at ABCS, if any, were recorded as a return of capital and reduced the amortized cost of controlled affiliate investments.
The Company and Antares, as members of ABCS, agreed to contribute capital up to (subject to the terms of their agreement) $950.0 million in aggregate to purchase equity interests in ABCS, with the Company and Antares contributing up to $425.0 million and $525.0 million, respectively. Funding of such commitments generally required the consent of both Antares Credit Opportunities Manager LLC and the Advisor on behalf of Antares and the Company, respectively. ABCS was capitalized with capital contributions from its members on a pro-rata basis based on their maximum capital contributions as transactions were funded after they had been approved.
Investment decisions of ABCS required the consent of both the Advisor and Antares Credit Opportunities Manager LLC, as representatives of the Company and Antares, respectively. Each of the Advisor and Antares sourced investments for ABCS.
On April 30, 2019, the Company formed BCSF Complete Financing Solution Holdco, LLC ("BCSF CFSH, LLC") and BCSF Complete Financing Solution, LLC ("BCSF Unitranche" or "BCSF CFS, LLC"), wholly-owned, newly-formed, subsidiaries. The Company received its proportionate share of all assets which represented 44.737% of ABCS. The portfolio of investments that was distributed comprised of 25 senior secured unitranche loans with a fair value of $919.0 million and cash of $3.2 million. The Company also assumed the obligation to fund outstanding unfunded commitments of $31.4 million. In connection with the distribution, the Company recognized a realized gain of $0.3 million. The Company is no longer a member of ABCS. The assets we received from ABCS have been included in the Company's consolidated financial statements and notes thereto.
In conjunction with the distribution from ABCS, on April 30, 2019, BCSF CFS, LLC entered into a loan and security agreement (the "JPM Credit Agreement" or the "JPM Credit Facility") as borrower, with JPMorgan Chase Bank, National Association, as Administrative Agent, and Wells Fargo Bank, National Association as Collateral Administrator, Collateral Agent, Securities Intermediary and Bank. On the date of the ABCS distribution, the Company had $577.5 million outstanding on the JPM Credit Facility. See Note 6 for additional information on the JPM Credit Facility.
169
Below is selected balance sheet information for ABCS as of December 31, 2018:
Selected Balance Sheet Information
| |
As of December 31, 2018 |
|
|---|---|---|
Loans, net of allowance of $17,616 (1) |
$1,616,795 | |
Cash, restricted cash and other assets |
52,240 | |
| | | |
Total assets |
$1,669,035 | |
| | | |
| | | |
| | | |
Debt (2) |
$1,027,615 | |
Other liabilities |
30,762 | |
| | | |
Total liabilities |
$1,058,377 | |
| | | |
| | | |
| | | |
Members' equity |
610,658 | |
| | | |
Total liabilities and members' equity |
$1,669,035 | |
| | | |
| | | |
| | | |
- (1)
- ABCS is not considered an investment company and does not follow the accounting and reporting guidelines in ASC 946. ABCS applies an allowance for loan loss methodology prescribed by FASB ASC 310, Receivables, and FASB ASC 450 Contingencies. The allowance for loan loss as of December 31, 2018 is a general allowance, there was no specific allowance for loan losses during the period. The Company estimates a fair value for each loan in the ABCS portfolio, which is presented in the Antares Bain Capital Complete Financing Solution schedule of investments below, which is an input to the Company's valuation of ABCS as a whole.
- (2)
- Net of $3.6 million deferred financing costs for the ABCS Facility, as of December 31, 2018.
Selected Statement of Operations Information
Below is selected statements of operations information for the years ended December 31, 2019, December 31, 2018 and for the period from November 29, 2017 through December 31, 2017:
| |
For the Year Ended |
For the Year Ended |
For the Period From November 29, 2017 through |
|||
|---|---|---|---|---|---|---|
| |
December 31, 2019 (2) | December 31, 2018 | December 31, 2017 | |||
Interest income |
$53,494 | $104,548 | $6,816 | |||
Fee income |
217 | 1,201 | 19 | |||
| | | | | | | |
Total revenues |
53,711 | 105,749 | 6,835 | |||
Credit facility expenses (1) |
22,008 | 45,635 | 3,192 | |||
Other fees and expenses |
6,661 | 22,231 | 3,101 | |||
| | | | | | | |
Total expenses |
28,669 | 67,866 | 6,293 | |||
| | | | | | | |
Net investment income |
25,042 | 37,883 | 542 | |||
Net realized gains |
— | — | — | |||
Net change in unrealized appreciation (depreciation) on investments |
— | — | — | |||
| | | | | | | |
Net increase in members' capital from operations |
$25,042 | $37,883 | $542 | |||
| | | | | | | |
| | | | | | | |
| | | | | | | |
- (1)
- As of December 31, 2018 and December 31 2017, the ABCS Facility had $1,031.2 million and $592.1 million of outstanding debt, respectively.
- (2)
- The ABCS distribution was effective April 30, 2019.
170
Antares Bain Capital Complete Financing Solution
Schedule of Investments
As of December 31, 2018
| Portfolio Company | Spread Above Index (1) |
Interest Rate | Maturity Date | Principal/ Par Amount |
Carrying Value | Fair Value (2) | |||||||||||||
|---|---|---|---|---|---|---|---|---|---|---|---|---|---|---|---|---|---|---|---|
Investments |
|||||||||||||||||||
Corporate Debt |
|||||||||||||||||||
Delayed Draw Term Loan |
|||||||||||||||||||
Chemicals, Plastics & Rubber |
|||||||||||||||||||
PRCC Holdings, Inc. |
L+ 6.50% | 9.02 | % | 2/1/2021 | $ | 11,878 | $ | 11,878 | $ | 11,878 | |||||||||
| | | | | | | | | | | | | | | | | | | | |
Total Chemicals, Plastics & Rubber |
11,878 | 11,878 | |||||||||||||||||
Consumer Goods: Non-Durable |
|||||||||||||||||||
Solaray, LLC |
L+ 5.75% | 8.49 | % | 9/9/2023 | $ | 26,680 | 26,389 | 26,547 | |||||||||||
Solaray, LLC (3) |
— | — | 9/9/2023 | $ | — | — | (33) | ||||||||||||
| | | | | | | | | | | | | | | | | | | | |
Total Consumer Goods: Non-Durable |
26,389 | 26,514 | |||||||||||||||||
FIRE: Insurance |
|||||||||||||||||||
Margaux Acquisition Inc. (3) |
— | — | 12/19/2024 | $ | — | — | (417) | ||||||||||||
| | | | | | | | | | | | | | | | | | | | |
Total FIRE: Insurance |
— | (417) | |||||||||||||||||
High Tech Industries |
|||||||||||||||||||
Element Buyer, Inc. (3) |
— | — | 7/19/2025 | $ | — | — | (133) | ||||||||||||
Element Buyer, Inc. |
L+ 5.25% | 7.76 | % | 7/19/2025 | $ | 7,600 | 7,473 | 7,543 | |||||||||||
| | | | | | | | | | | | | | | | | | | | |
Total High Tech Industries |
7,473 | 7,410 | |||||||||||||||||
Media: Advertising, Printing & Publishing |
|||||||||||||||||||
Ansira Holdings, Inc. |
L+ 5.75% | 8.27 | % | 12/20/2022 | $ | 2,478 | 2,472 | 2,459 | |||||||||||
Ansira Holdings, Inc. (3) |
— | — | 12/20/2022 | $ | — | — | (56) | ||||||||||||
| | | | | | | | | | | | | | | | | | | | |
Total Media: Advertising, Printing & Publishing |
2,472 | 2,403 | |||||||||||||||||
Services: Consumer |
|||||||||||||||||||
McKissock, LLC |
L+ 5.75% | 8.55 | % | 8/5/2021 | $ | 2,605 | 2,583 | 2,605 | |||||||||||
| | | | | | | | | | | | | | | | | | | | |
Total Services: Consumer |
2,583 | 2,605 | |||||||||||||||||
Transportation: Consumer |
|||||||||||||||||||
Direct Travel, Inc. |
L+ 6.50% | 9.12 | % | 12/1/2021 | $ | 1,672 | 1,669 | 1,672 | |||||||||||
Direct Travel, Inc. |
— | — | 12/1/2021 | $ | — | — | — | ||||||||||||
| | | | | | | | | | | | | | | | | | | | |
Total Transportation: Consumer |
1,669 | 1,672 | |||||||||||||||||
| | | | | | | | | | | | | | | | | | | | |
Total Delayed Draw Term Loan |
$ | 52,464 | $ | 52,065 | |||||||||||||||
| | | | | | | | | | | | | | | | | | | | |
| | | | | | | | | | | | | | | | | | | | |
| | | | | | | | | | | | | | | | | | | | |
First lien senior secured loan |
|||||||||||||||||||
Aerospace & Defense |
|||||||||||||||||||
API Technologies Corp. |
L+ 5.75% | 8.27 | % | 4/20/2024 | $ | 117,861 | 116,559 | 117,566 | |||||||||||
| | | | | | | | | | | | | | | | | | | | |
Total Aerospace & Defense |
116,559 | 117,566 | |||||||||||||||||
Capital Equipment |
|||||||||||||||||||
Tidel Engineering, L.P. |
L+ 6.25% | 9.05 | % | 3/1/2024 | $ | 86,442 | 86,415 | 86,442 | |||||||||||
| | | | | | | | | | | | | | | | | | | | |
Total Capital Equipment |
86,415 | 86,442 | |||||||||||||||||
Chemicals, Plastics & Rubber |
|||||||||||||||||||
AP Plastics Group, LLC |
L+ 5.25% | 7.60 | % | 8/1/2022 | $ | 48,398 | 48,348 | 47,914 | |||||||||||
PRCC Holdings, Inc. |
L+ 6.50% | 9.02 | % | 2/1/2021 | $ | 73,813 | 73,813 | 73,813 | |||||||||||
| | | | | | | | | | | | | | | | | | | | |
Total Chemicals, Plastics & Rubber |
122,161 | 121,727 | |||||||||||||||||
Construction & Building |
|||||||||||||||||||
Profile Products LLC |
L+ 5.75% | 8.54 | % | 12/20/2024 | $ | 78,832 | 77,614 | 77,256 | |||||||||||
| | | | | | | | | | | | | | | | | | | | |
Total Construction & Building |
77,614 | 77,256 | |||||||||||||||||
Consumer Goods: Durable |
|||||||||||||||||||
Home Franchise Concepts, Inc. |
L+ 5.00% | 7.43 | % | 7/9/2024 | $ | 69,091 | 68,773 | 68,400 | |||||||||||
Stanton Carpet Corp. (7) |
L+ 5.50% | 8.04 | % | 11/21/2022 | $ | 60,231 | 60,179 | 59,629 | |||||||||||
| | | | | | | | | | | | | | | | | | | | |
Total Consumer Goods: Durable |
128,952 | 128,029 | |||||||||||||||||
Consumer Goods: Non-Durable |
|||||||||||||||||||
Solaray, LLC |
L+ 5.75% | 8.49 | % | 9/9/2023 | $ | 96,230 | 95,175 | 95,749 | |||||||||||
| | | | | | | | | | | | | | | | | | | | |
171
| Portfolio Company | Spread Above Index (1) |
Interest Rate | Maturity Date | Principal/ Par Amount |
Carrying Value | Fair Value (2) | |||||||||||||
|---|---|---|---|---|---|---|---|---|---|---|---|---|---|---|---|---|---|---|---|
Total Consumer Goods: Non-Durable |
95,175 | 95,749 | |||||||||||||||||
Energy: Oil & Gas |
|||||||||||||||||||
Amspec Services, Inc. |
L+ 5.75% | 8.55 | % | 7/2/2024 | $ | 90,025 | 88,986 | 86,874 | |||||||||||
| | | | | | | | | | | | | | | | | | | | |
Total Energy: Oil & Gas |
88,986 | 86,874 | |||||||||||||||||
FIRE: Insurance |
|||||||||||||||||||
Margaux Acquisition Inc. |
L+ 6.00% | 8.80 | % | 12/19/2024 | $ | 65,125 | 63,766 | 63,822 | |||||||||||
Margaux UK Finance Limited |
GBP LIBOR+ 6.00% | 7.00 | % | 12/19/2024 | £17,356 | 21,651 | 21,665 | ||||||||||||
| | | | | | | | | | | | | | | | | | | | |
Total FIRE: Insurance |
85,417 | 85,487 | |||||||||||||||||
High Tech Industries |
|||||||||||||||||||
Caliper Software, Inc. |
L+ 5.50% | 8.02 | % | 11/28/2025 | $ | 68,182 | 67,509 | 67,159 | |||||||||||
Element Buyer, Inc. |
L+ 5.25% | 7.78 | % | 7/19/2025 | $ | 85,287 | 83,863 | 84,647 | |||||||||||
| | | | | | | | | | | | | | | | | | | | |
Total High Tech Industries |
151,372 | 151,806 | |||||||||||||||||
Media: Advertising, Printing & Publishing |
|||||||||||||||||||
Ansira Holdings, Inc. |
L+ 5.75% | 8.27 | % | 12/20/2022 | $ | 81,011 | 80,874 | 80,404 | |||||||||||
Cruz Bay Publishing, Inc. (5) |
L+ 5.75% | 8.30 | % | 6/6/2019 | $ | 11,418 | 11,418 | 11,418 | |||||||||||
Cruz Bay Publishing, Inc. (6) |
L+ 6.75% | 9.57 | % | 6/6/2019 | $ | 3,813 | 3,813 | 3,813 | |||||||||||
| | | | | | | | | | | | | | | | | | | | |
Total Media: Advertising, Printing & Publishing |
96,105 | 95,635 | |||||||||||||||||
Media: Diversified & Production |
|||||||||||||||||||
Efficient Collaborative Retail Marketing Company, LLC |
L+ 6.75% | 9.55 | % | 6/15/2022 | $ | 22,800 | 22,722 | 22,572 | |||||||||||
Efficient Collaborative Retail Marketing Company, LLC |
L+ 6.75% | 9.56 | % | 6/15/2022 | $ | 33,741 | 33,241 | 33,404 | |||||||||||
| | | | | | | | | | | | | | | | | | | | |
Total Media: Diversified & Production |
55,963 | 55,976 | |||||||||||||||||
Retail |
|||||||||||||||||||
Batteries Plus Holding Corporation |
L+ 6.75% | 9.27 | % | 7/6/2022 | $ | 68,156 | 68,156 | 68,156 | |||||||||||
| | | | | | | | | | | | | | | | | | | | |
Total Retail |
68,156 | 68,156 | |||||||||||||||||
Services: Business |
|||||||||||||||||||
TEI Holdings Inc. |
L+ 6.00% | 8.80 | % | 12/20/2023 | $ | 118,589 | 117,726 | 117,403 | |||||||||||
| | | | | | | | | | | | | | | | | | | | |
Total Services: Business |
117,726 | 117,403 | |||||||||||||||||
Services: Consumer |
|||||||||||||||||||
McKissock, LLC |
L+ 5.75% | 8.55 | % | 8/5/2021 | $ | 8,071 | 8,004 | 8,071 | |||||||||||
McKissock, LLC |
L+ 5.75% | 8.55 | % | 8/5/2021 | $ | 42,144 | 41,792 | 42,460 | |||||||||||
| | | | | | | | | | | | | | | | | | | | |
Total Services: Consumer |
49,796 | 50,531 | |||||||||||||||||
Transportation: Consumer |
|||||||||||||||||||
Direct Travel, Inc. |
L+ 6.50% | 9.30 | % | 12/1/2021 | $ | 112,153 | 111,789 | 112,153 | |||||||||||
| | | | | | | | | | | | | | | | | | | | |
Total Transportation: Consumer |
111,789 | 112,153 | |||||||||||||||||
Wholesale |
|||||||||||||||||||
Abracon Group Holding, LLC. (4) |
L+ 5.75% | 8.56 | % | 7/18/2024 | $ | 81,497 | 80,367 | 80,682 | |||||||||||
Aramsco, Inc. |
L+ 5.25% | 7.77 | % | 8/28/2024 | $ | 50,343 | 49,394 | 48,958 | |||||||||||
| | | | | | | | | | | | | | | | | | | | |
Total Wholesale |
129,761 | 129,640 | |||||||||||||||||
| | | | | | | | | | | | | | | | | | | | |
Total First Lien Senior Secured |
$ | 1,581,947 | $ | 1,580,430 | |||||||||||||||
| | | | | | | | | | | | | | | | | | | | |
| | | | | | | | | | | | | | | | | | | | |
| | | | | | | | | | | | | | | | | | | | |
Total Corporate Debt |
$ | 1,634,411 | $ | 1,632,495 | |||||||||||||||
| | | | | | | | | | | | | | | | | | | | |
| | | | | | | | | | | | | | | | | | | | |
| | | | | | | | | | | | | | | | | | | | |
Total Investments |
$ | 1,634,411 | $ | 1,632,495 | |||||||||||||||
| | | | | | | | | | | | | | | | | | | | |
| | | | | | | | | | | | | | | | | | | | |
| | | | | | | | | | | | | | | | | | | | |
| (1) The investments bear interest at a rate that may be determined by reference to the London Interbank Offered Rate ("LIBOR" or "L") which reset daily, monthly, quarterly or semiannually. For each, the Company has provided the spread over LIBOR and the current weighted average interest rate in effect at December 31, 2018. Certain investments are subject to a LIBOR interest rate floor. | ||
| (2) Fair Value determined by the Advisor. | ||
| (3) The negative fair value is the result of the capitalized discount on the loan or the unfunded commitment being valued below par. | ||
| (4) $204 of the total par amount for this security is at P + 4.75%. | ||
| (5) $158 of the total par amount for this security is at P + 4.75%. | ||
| (6) $53 of the total par amount for this security is at P + 5.75%. | ||
| (7) $391 of the total par amount for this security is at P + 4.50%. |
172
Note 4. Fair Value Measurements
The following table presents fair value measurements of investments, by major class, cash equivalents and derivatives as of December 31, 2019, according to the fair value hierarchy:
| |
Fair Value Measurements | ||||||||||||
|---|---|---|---|---|---|---|---|---|---|---|---|---|---|
| |
Level 1 | Level 2 | Level 3 | Total | |||||||||
Investments: |
|||||||||||||
First Lien Senior Secured Loans |
$ | — | $ | 176,223 | $ | 1,989,621 | $ | 2,165,844 | |||||
First Lien Last Out Loans |
— | — | 29,300 | 29,300 | |||||||||
Second Lien Senior Secured Loans |
— | 51,643 | 124,027 | 175,670 | |||||||||
Subordinated Debt |
— | — | 15,000 | 15,000 | |||||||||
Corporate Bonds |
— | 17,508 | — | 17,508 | |||||||||
Equity Interests |
— | — | 99,293 | 99,293 | |||||||||
Preferred Equity |
— | — | 24,318 | 24,318 | |||||||||
Warrants |
— | — | 122 | 122 | |||||||||
| | | | | | | | | | | | | | |
Total Investments |
$ | — | $ | 245,374 | $ | 2,281,681 | $ | 2,527,055 | |||||
| | | | | | | | | | | | | | |
| | | | | | | | | | | | | | |
| | | | | | | | | | | | | | |
Cash equivalents |
$ | 66,965 | $ | — | $ | — | $ | 66,965 | |||||
| | | | | | | | | | | | | | |
| | | | | | | | | | | | | | |
| | | | | | | | | | | | | | |
Forward currency exchange contracts (asset) |
$ | — | $ | 1,034 | $ | — | $ | 1,034 | |||||
| | | | | | | | | | | | | | |
| | | | | | | | | | | | | | |
| | | | | | | | | | | | | | |
Forward currency exchange contracts (liability) |
$ | — | $ | 1,252 | $ | — | $ | 1,252 | |||||
| | | | | | | | | | | | | | |
| | | | | | | | | | | | | | |
| | | | | | | | | | | | | | |
The following table presents fair value measurements of investments, by major class, cash equivalents and derivatives as of December 31, 2018, according to the fair value hierarchy:
| |
Fair Value Measurements | ||||||||||||
|---|---|---|---|---|---|---|---|---|---|---|---|---|---|
| |
Level 1 | Level 2 | Level 3 | Total | |||||||||
Investments: |
|||||||||||||
First Lien Senior Secured Loans |
$ | — | $ | 619,352 | $ | 439,487 | $ | 1,058,839 | |||||
First Lien Last Out Loans |
— | — | 27,487 | 27,487 | |||||||||
Second Lien Senior Secured Loans |
— | 112,586 | 145,555 | 258,141 | |||||||||
Subordinated Debt |
— | — | 39,625 | 39,625 | |||||||||
Corporate Bonds |
— | 35,023 | — | 35,023 | |||||||||
Investment Vehicles (1) |
— | — | 279,363 | 279,363 | |||||||||
Equity Interests |
— | — | 26,521 | 26,521 | |||||||||
Preferred Equity |
— | — | 2,807 | 2,807 | |||||||||
Warrants |
— | — | — | — | |||||||||
| | | | | | | | | | | | | | |
Total Investments |
$ | — | $ | 766,961 | $ | 960,845 | $ | 1,727,806 | |||||
| | | | | | | | | | | | | | |
| | | | | | | | | | | | | | |
| | | | | | | | | | | | | | |
Cash equivalents |
$ | 877 | $ | — | $ | — | $ | 877 | |||||
| | | | | | | | | | | | | | |
| | | | | | | | | | | | | | |
| | | | | | | | | | | | | | |
Forward currency exchange contracts (asset) |
$ | — | $ | 9,322 | $ | — | $ | 9,322 | |||||
| | | | | | | | | | | | | | |
| | | | | | | | | | | | | | |
| | | | | | | | | | | | | | |
- (1)
- Represents equity investment in ABCS.
173
The following table provides a reconciliation of the beginning and ending balances for investments that use Level 3 inputs for the year ended December 31, 2019:
| |
First Lien Senior Secured Loans |
First Lien Last Out Loans |
Second Lien Senior Secured Loans |
Subordinated Debt |
Investment Vehicles |
Equity Interest |
Preferred Equity |
Warrants | Total Investments |
|||||||||||||||||||
|---|---|---|---|---|---|---|---|---|---|---|---|---|---|---|---|---|---|---|---|---|---|---|---|---|---|---|---|---|
Balance as of January 1, 2019 |
$ | 439,487 | $ | 27,487 | $ | 145,555 | $ | 39,625 | $ | 279,363 | $ | 26,521 | $ | 2,807 | $ | — | $ | 960,845 | ||||||||||
Purchases of investments and other adjustments to cost |
987,615 | 1,137 | 50,795 | — | 64,741 | 73,279 | 17,860 | — | 1,195,427 | |||||||||||||||||||
Distribution to Company from ABCS |
918,870 | — | — | — | (346,329 | ) | — | — | — | 572,541 | ||||||||||||||||||
Paid-in-kind interest |
55 | 329 | — | — | — | — | 15 | — | 399 | |||||||||||||||||||
Net accretion of discounts (amortization of premiums) |
2,875 | 101 | 285 | 41 | — | — | — | — | 3,302 | |||||||||||||||||||
Proceeds from principal repayments and sales of investments |
(410,882 | ) | (575 | ) | (62,244 | ) | (25,000 | ) | 1,432 | (814 | ) | (878 | ) | — | (498,961 | ) | ||||||||||||
Net change in unrealized appreciation (depreciation) on investments |
7,187 | 822 | 584 | 334 | 528 | 112 | 4,514 | 122 | 14,203 | |||||||||||||||||||
Net realized gains (losses) on investments |
49 | (1 | ) | 280 | — | 265 | 195 | — | — | 788 | ||||||||||||||||||
Transfers out of Level 3 |
(72,845 | ) | — | (17,384 | ) | — | — | — | — | — | (90,229 | ) | ||||||||||||||||
Transfers to Level 3 |
117,210 | — | 6,156 | — | — | — | — | — | 123,366 | |||||||||||||||||||
| | | | | | | | | | | | | | | | | | | | | | | | | | | | | |
Balance as of December 31, 2019 |
$ | 1,989,621 | $ | 29,300 | $ | 124,027 | $ | 15,000 | $ | — | $ | 99,293 | $ | 24,318 | $ | 122 | $ | 2,281,681 | ||||||||||
| | | | | | | | | | | | | | | | | | | | | | | | | | | | | |
| | | | | | | | | | | | | | | | | | | | | | | | | | | | | |
| | | | | | | | | | | | | | | | | | | | | | | | | | | | | |
Change in unrealized appreciation (depreciation) attributable to investments still held at December 31, 2019 |
$ | 6,387 | $ | 822 | $ | 60 | $ | 334 | $ | — | $ | 238 | $ | 4,510 | $ | 122 | $ | 12,473 | ||||||||||
| | | | | | | | | | | | | | | | | | | | | | | | | | | | | |
| | | | | | | | | | | | | | | | | | | | | | | | | | | | | |
| | | | | | | | | | | | | | | | | | | | | | | | | | | | | |
Transfers between levels, if any, are recognized at the beginning of the quarter in which transfers occur. For the year ended December 31, 2019, transfers from Level 2 to Level 3 were primarily due to decreased price transparency. For the year ended December 31, 2019, transfers from Level 3 to Level 2 were primarily due to increased price transparency.
The following table provides a reconciliation of the beginning and ending balances for investments that use Level 3 inputs for the year ended December 31, 2018:
| |
First Lien Senior Secured Loans |
First Lien Last Out Loans |
Second Lien Senior Secured Loans |
Subordinated Debt |
Investment Vehicles (1) |
Equity Interest |
Preferred Equity |
Total Investments |
|||||||||||||||||
|---|---|---|---|---|---|---|---|---|---|---|---|---|---|---|---|---|---|---|---|---|---|---|---|---|---|
Balance as of January 1, 2018 |
$ | 215,339 | $ | 30,516 | $ | 84,722 | $ | — | $ | 178,410 | $ | 9,763 | $ | 1,964 | $ | 520,714 | |||||||||
Purchases of investments and other adjustments to cost |
340,358 | 1,179 | 83,801 | 39,700 | 103,149 | 16,350 | 600 | 585,137 | |||||||||||||||||
Net accretion of discounts (amortization of premiums) |
808 | 82 | 169 | 11 | — | — | — | 1,070 | |||||||||||||||||
Proceeds from principal repayments and sales of investments |
(122,601 | ) | (3,305 | ) | (18,763 | ) | — | (1,310 | ) | (2,753 | ) | — | (148,732 | ) | |||||||||||
Net change in unrealized appreciation (depreciation) on investments |
(5,695 | ) | (1,024 | ) | (4,419 | ) | (86 | ) | (886 | ) | 1,908 | 243 | (9,959 | ) | |||||||||||
Net realized gains on investments |
229 | 39 | 45 | — | — | 1,253 | — | 1,566 | |||||||||||||||||
Transfers out of Level 3 |
(5,283 | ) | — | — | — | — | — | — | (5,283 | ) | |||||||||||||||
Transfers to Level 3 |
16,332 | — | — | — | — | — | — | 16,332 | |||||||||||||||||
| | | | | | | | | | | | | | | | | | | | | | | | | | |
Balance as of December 31, 2018 |
$ | 439,487 | $ | 27,487 | $ | 145,555 | $ | 39,625 | $ | 279,363 | $ | 26,521 | $ | 2,807 | $ | 960,845 | |||||||||
| | | | | | | | | | | | | | | | | | | | | | | | | | |
| | | | | | | | | | | | | | | | | | | | | | | | | | |
| | | | | | | | | | | | | | | | | | | | | | | | | | |
Change in unrealized appreciation (depreciation) attributable to investments still held at December 31, 2018 |
$ | (5,014 | ) | $ | (1,024 | ) | $ | (4,040 | ) | $ | (86 | ) | $ | (886 | ) | $ | 1,908 | $ | 243 | $ | (8,899 | ) | |||
| | | | | | | | | | | | | | | | | | | | | | | | | | |
| | | | | | | | | | | | | | | | | | | | | | | | | | |
| | | | | | | | | | | | | | | | | | | | | | | | | | |
- (1)
- Represents equity investment in ABCS.
174
Transfers between levels, if any, are recognized at the beginning of the quarter in which transfers occur. For the year ended December 31, 2018, transfers from Level 2 to Level 3 were primarily due to decreased price transparency. For the year ended December 31, 2018, the transfer from Level 3 to Level 2 was primarily due to increased price transparency.
Significant Unobservable Inputs
ASC 820 requires disclosure of quantitative information about the significant unobservable inputs used in the valuation of assets and liabilities classified as Level 3 within the fair value hierarchy. Disclosure of this information is not required in circumstances where a valuation (unadjusted) is obtained from a third-party pricing service and the information regarding the unobservable inputs is not reasonably available to the Company and as such, the disclosures provided below exclude those investments valued in that manner.
| |
As of December 31, 2019 | ||||||||
|---|---|---|---|---|---|---|---|---|---|
| |
Fair Value of Level 3 Assets (1) |
Valuation Technique | Significant Unobservable Inputs |
Range of Significant Unobservable Inputs (Weighted Average (2)) |
|||||
First Lien Senior Secured Loans |
$ | 1,475,477 | Discounted Cash Flows | Comparative Yields | 4.4%-15.8% (7.7%) | ||||
First Lien Senior Secured Loans |
6,363 | Discounted Cash Flows | Discount Rate | 10.0%-10.0% (10.0%) | |||||
First Lien Senior Secured Loans |
23,181 | Collateral Analysis | Recovery Rate | 100% | |||||
First Lien Last Out |
29,300 | Discounted Cash Flows | Comparative Yields | 7.1%-12.5% (10.3%) | |||||
Second Lien Senior Secured Loans |
115,014 | Discounted Cash Flows | Comparative Yields | 6.1%-17.0% (10.4%) | |||||
Subordinated Debt |
15,000 | Discounted Cash Flows | Comparative Yields | 15.3% | |||||
Equity Interest |
21,495 | Comparable Company Multiple | EBITDA Multiple | 6.8x-17.5x (9.8x) | |||||
Equity Interest |
24,514 | Discounted Cash Flows | Discount Rate | 10.0%-18.8% (13.4%) | |||||
Preferred Equity |
23,116 | Comparable Company Multiple | EBITDA Multiple | 7.3x-12.5x (11.0x) | |||||
Warrants |
122 | Comparable Company Multiple | EBITDA Multiple | 7.3x | |||||
| | | | | | | | | | |
Total investments |
$ | 1,733,582 | |||||||
| | | | | | | | | | |
| | | | | | | | | | |
| | | | | | | | | | |
- (1)
- Included within the Level 3 assets of $2,281,681 is an amount of $548,099 for which the Advisor did not develop the unobservable inputs for the determination of fair value (examples include single source quotation and prior or pending transactions).
- (2)
- Weighted average is calculated by weighing the significant unobservable input by the relative fair value of each investment in the category.
The Company used the income approach and market approach to determine the fair value of certain Level 3 assets as of December 31, 2019. The significant unobservable inputs used in the income approach are the comparative yield and discount rate. The comparative yield and discount rate are used to discount the estimated future cash flows expected to be received from the underlying investment. An increase/decrease in the comparative yield or discount rate would result in a decrease/increase, respectively, in the fair value. The significant unobservable inputs used in the market approach is the comparable company multiple and the recovery rate. The multiple is used to estimate the enterprise value of the underlying investment. An increase/decrease in the multiple would result in an increase/decrease, respectively, in the fair value. The recovery rate represents the extent to which proceeds can be recovered. An increase/decrease in the recovery rate would result in an increase/decrease, respectively, in the fair value.
175
The valuation techniques and significant unobservable inputs used in Level 3 fair value measurements of assets as of December 31, 2018 were as follows:
| |
As of December 31, 2018 | ||||||||
|---|---|---|---|---|---|---|---|---|---|
| |
Fair Value of Level 3 Assets (1) |
Valuation Technique | Significant Unobservable Inputs |
Range of Significant Unobservable Inputs (Weighted Average(2)) |
|||||
First Lien Senior Secured Loans |
$ | 248,967 | Discounted Cash Flows | Comparative Yields | 5.4%-12.8% (8.1%) | ||||
First Lien Senior Secured Loans |
4,163 | Comparable Company Multiple | Book Value Multiple | 1x-1x (1x) | |||||
First Lien Senior Secured Loans |
11,500 | Collateral Analysis | Recovery Rate | 100% | |||||
First Lien Last Out Loans |
27,454 | Discounted Cash Flows | Comparative Yields | 8.6%-14.5% (12.1%) | |||||
Second Lien Senior Secured Loans |
85,980 | Discounted Cash Flows | Comparative Yields | 6.6%-14.5% (10.6%) | |||||
Subordinated Debt |
39,625 | Discounted Cash Flows | Comparative Yields | 10.0%-16.2% (12.3%) | |||||
Investment Vehicles (3) |
279,363 | Other | — | — | |||||
Equity Interest |
3,000 | Comparable Company Multiple | EBITDA Multiple | 13.3x-13.5x (13.4x) | |||||
Equity Interest |
14,723 | Comparable Company Multiple | Book Value Multiple | 1x-1x (1x) | |||||
Preferred Equity |
2,207 | Comparable Company Multiple | EBITDA Multiple | 10.5x-10.5x (10.5x) | |||||
| | | | | | | | | | |
Total investments |
$ | 716,982 | |||||||
| | | | | | | | | | |
| | | | | | | | | | |
| | | | | | | | | | |
- (1)
- Included within the Level 3 assets of $960,846 is an amount of $243,864 for which the Advisor did not develop the unobservable inputs for the determination of fair value (examples include single source quotation and prior or pending transactions).
- (2)
- Weighted average is calculated by weighing the significant unobservable input by the relative fair value of each investment in the category.
- (3)
- Represents equity investment in ABCS. The Company determines the fair value of its investment in ABCS giving consideration to the assets and liabilities of ABCS, at fair value, including consideration of any necessary adjustments. The fair value of the loans held by ABCS were determined based upon recent transactions or the use of discounted cash flows, with comparative yields ranging from 7.7% to 10.9% and a weighted average of 8.9%. The carrying value of the ABCS Facility approximates fair value.
The Company used the income approach and market approach to determine the fair value of certain Level 3 assets as of December 31, 2018. The significant unobservable input used in the income approach is the comparative yield. The comparative yield is used to discount the estimated future cash flows expected to be received from the underlying investment. An increase/decrease in the comparative yield would result in a decrease/increase, respectively, in the fair value. The significant unobservable input used in the market approach is the comparable company multiple. The multiple is used to estimate the enterprise value of the underlying investment. An increase/decrease in the multiple would result in an increase/decrease, respectively, in the fair value.
The fair value of the BCSF Revolving Credit Facility (as defined in Note 6), which is categorized as Level 3 within the fair value hierarchy as of December 31, 2019 and December 31, 2018, approximates the carrying value of such facility. The fair values of the 2018-1 Notes (as defined in Note 6), which are categorized as Level 3 within the fair value hierarchy as of December 31, 2019, and December 31, 2018, approximate the carrying value of such facilities. The fair value of the JPM Credit Facility (as defined in Note 6), which is categorized as Level 3 within the fair value hierarchy as of December 31, 2019, approximates the carrying value of such facility. The fair values of the 2019-1 Debt (as defined in Note 6), which are categorized as Level 3 within the fair value hierarchy as of December 31, 2019, approximate the carrying value of such facilities.
176
Note 5. Related Party Transactions
The Company has entered into the first amended and restated investment advisory agreement as of November 14, 2018 (the "Investment Advisory Agreement") with the Advisor, pursuant to which the Advisor manages the Company's investment program and related activities. On November 28, 2018, the Board, including a majority of the Independent Directors, approved a second amended and restated advisory agreement (the "Amended Advisory Agreement") between the Company and BCSF Advisors, LP ("the Advisor"). On February 1, 2019, Shareholders approved the Amended Advisory Agreement which replaced the existing Investment Advisory Agreement.
The Company pays the Advisor a base management fee (the "Base Management Fee"), accrued and payable quarterly in arrears. The Base Management Fee is calculated at an annual rate of 1.5% (0.375% per quarter) of the average value of the Company's gross assets (excluding cash and cash equivalents, but including assets purchased with borrowed amounts) at the end of each of the two most recently completed calendar quarters (and, in the case of our first quarter, our gross assets as of such quarter-end). Such amount shall be appropriately adjusted (based on the actual number of days elapsed relative to the total number of days in such calendar quarter) for any share issuance or repurchases by the Company during a calendar quarter. The Base Management Fee for any partial quarter will be appropriately prorated. Effective February 1, 2019, the base management fee has been revised to a tiered management fee structure so that the base management fee of 1.5% (0.375% per quarter) of the average value of the Company's gross assets (excluding cash and cash equivalents, but including assets purchased with borrowed amounts) will continue to apply to assets held at an asset coverage ratio down to 200%, but a lower base management fee of 1.0% (0.25% per quarter) of the average value of the Company's gross assets (excluding cash and cash equivalents, but including assets purchased with borrowed amounts) will apply to any amount of assets attributable to leverage decreasing the Company's asset coverage ratio below 200%.
The Advisor, however, contractually waived its right to receive the Base Management Fee in excess of 0.75% of the aggregate gross assets excluding cash (including capital drawn to pay the Company's expenses) during any period prior to the IPO. Additionally, for the period from the date of the IPO through December 31, 2018, the Advisor voluntarily waived its right to receive the Base Management Fee in excess of 0.75%. The Advisor was not permitted to recoup any waived amounts. In certain previous filings, management fees were presented on a net basis.
For the years ended December 31, 2019, 2018, and 2017 Management fees were $32.7 million, $17.5 million, and $5.9 million, respectively. For the year ended December 31, 2019, $0.0 million was contractually waived and $8.2 million was voluntarily waived. For the year ended December 31, 2018, $7.3 million was contractually waived and $1.5 million was voluntarily waived. For the year ended December 31, 2017, $2.9 million was contractually waived.
As of December 31, 2019 and December 31, 2018, $7.3 million and $3.0 million remained payable, respectively.
177
For the years ended December 31, 2019, 2018 and 2017, the incentive fee consists of two parts that are determined independently of each other such that one component may be payable even if the other is not.
The first part, the Incentive Fee based on income (the "Income Fee"), is calculated and payable quarterly in arrears as detailed below.
The second part, the capital gains incentive fee, is determined and payable in arrears as detailed below.
Incentive Fee on Pre-Incentive Fee Net Investment Income
Pre-incentive fee net investment income means interest income, dividend income and any other income (including any other fees such as commitment, origination, structuring, diligence and consulting fees or other fees that the Company receives from portfolio companies but excluding fees for providing managerial assistance) accrued during the calendar quarter, minus operating expenses for the quarter (including the Base Management Fee, any expenses payable under the Administration Agreement, and any interest expense and dividends paid on any outstanding preferred stock, but excluding the incentive fee). Pre-incentive fee net investment income includes, in the case of investments with a deferred interest feature such as market discount, original issue discount ("OID"), debt instruments with PIK interest, preferred stock with PIK dividends and zero-coupon securities, accrued income that the Company has not yet received in cash.
Pre-incentive fee net investment income does not include any realized or unrealized capital gains or losses or unrealized capital appreciation or depreciation. Because of the structure of the incentive fee, it is possible that the Company may pay an incentive fee in a quarter where the Company incurs a loss. For example, if the Company receives pre-incentive fee net investment income in excess of the Hurdle rate for a quarter, the Company will pay the applicable incentive fee even if the Company has incurred a loss in that quarter due to realized and unrealized capital losses.
Prior to the calendar quarter that commenced on January 1, 2019 the incentive on income was calculated as follows:
- (i)
- 15.0% of the pre-incentive fee net investment income for the current quarter prior to the IPO; or
- (ii)
- 17.5% of the pre-incentive fee net income for the current quarter after the IPO; and
- (i)
- 15.0% of all remaining pre-incentive fee net investment income above the "catch-up" prior to the IPO, or
- (ii)
- 17.5% of all remaining pre-incentive fee net investment income above the "catch-up" after the IPO.
Beginning with the calendar quarter that commenced on January 1, 2019, the incentive fee based on income is calculated and payable quarterly in arrears based on the aggregate pre-incentive fee net investment income in respect of the current calendar quarter and the eleven preceding calendar quarters beginning with the calendar quarter that commenced on January 1, 2019 (or the appropriate portion thereof in the case of any of the Company's first eleven calendar quarters that commence on or after January 1, 2019) (in either case, the "Trailing Twelve Quarters"). This calculation is referred to as the "Three-Year Lookback."
178
With respect to any calendar quarter that commences on or after January 1, 2019, pre-incentive fee net investment income in respect of the relevant Trailing Twelve Quarters is compared to a "Hurdle Amount" equal to the product of (i) the hurdle rate of 1.5% per quarter (6% annualized) and (ii) the sum of our net assets (defined as total assets less indebtedness and before taking into account any incentive fees payable during the period) at the beginning of each applicable calendar quarter comprising the relevant Trailing Twelve Quarters. The Hurdle Amount will be calculated after making appropriate adjustments to our NAV at the beginning of each applicable calendar quarter for our subscriptions (which shall include all issuances by us of shares of our Common Stock, including issuances pursuant to the Company's dividend reinvestment plan) and distributions during the applicable calendar quarter.
Commencing on January 1, 2019, the quarterly incentive fee based on income is calculated, subject to the Incentive Fee Cap (as defined below), based on the amount by which (A) aggregate pre-incentive fee net investment income in respect of the relevant Trailing Twelve Quarters exceeds (B) the Hurdle Amount for such Trailing Twelve Quarters. The amount of the excess of (A) over (B) described in this paragraph for such Trailing Twelve Quarters is referred to as the "Excess Income Amount." The incentive fee based on income that is paid to the Advisor in respect of a particular calendar quarter will equal the Excess Income Amount less the aggregate incentive fees based on income that were paid to the Advisor in the preceding eleven calendar quarters (or portion thereof) comprising the relevant Trailing Twelve Quarters.
The incentive fee based on income for each calendar quarter is determined as follows:
- (i)
- No incentive fee based on income is payable to the Advisor for any calendar quarter for which there is no Excess Income Amount;
- (ii)
- 100% of the aggregate pre-incentive fee net investment income in respect of the Trailing Twelve Quarters with respect to that portion of such pre-incentive fee net investment income, if any, that exceeds the Hurdle Amount, but is less than or equal to an amount, which the Company refers to as the "Catch-up Amount," determined as the sum of 1.8182% multiplied by our NAV at the beginning of each applicable calendar quarter comprising the relevant Trailing Twelve Quarters; and
- (iii)
- 17.5% of the aggregate pre-incentive fee net investment income in respect of the Trailing Twelve Quarters that exceeds the Catch-up Amount.
Incentive Fee Cap
With respect to any calendar quarter that commences on or after January 1, 2019, the incentive fee based on income is subject to a cap (the "Incentive Fee Cap"). The Incentive Fee Cap in respect of any calendar quarter is an amount equal to 17.5% of the Cumulative Net Return (as defined below) during the relevant Trailing Twelve Quarters less the aggregate incentive fees based on income that were paid to the Advisor in the preceding eleven calendar quarters (or portion thereof) comprising the relevant Trailing Twelve Quarters.
"Cumulative Net Return" during the relevant Trailing Twelve Quarters means (x) the pre-incentive fee net investment income in respect of the relevant Trailing Twelve Quarters less (y) any Net Capital Loss, if any, in respect of the relevant Trailing Twelve Quarters. If, in any quarter, the Incentive Fee Cap is zero or a negative value, the Company will pay no incentive fee based on income to the Advisor in respect of that quarter. If, in any quarter, the Incentive Fee Cap for such quarter is a positive value but is less than the incentive fee based on income that is payable to the Advisor for such quarter calculated as described above, the Company will pay an incentive fee based on income to the Advisor equal to the Incentive Fee Cap in respect of such quarter. If, in any quarter, the Incentive Fee Cap for such quarter is equal to or greater than the incentive fee based on income that is payable to the Advisor for such quarter
179
calculated as described above, the Company will pay an incentive fee based on income to the Advisor equal to the incentive fee calculated as described above for such quarter without regard to the Incentive Fee Cap.
"Net Capital Loss" in respect of a particular period means the difference, if positive, between (i) aggregate capital losses, whether realized or unrealized, in respect of such period and (ii) aggregate capital gains, whether realized or unrealized, in respect of such period.
For the years ended December 31, 2019 and 2018 the Company incurred $17.4 million and $9.7 million, respectively, of income incentive fees (before waivers), which are included in incentive fees on the consolidated statements of operations. The Advisor has voluntarily waived $2.7 million and $1.9 million of the income incentive fees earned by the Advisor during the years ended December 31, 2019 and 2018, respectively. Such income incentive fee waiver is irrevocable and such waived income incentive fees will not be subject to recoupment in future periods. This income incentive fee waiver does not impact any income incentive fees earned by the Advisor in future periods.
As a result of the income incentive fee waivers, the Company incurred $14.7 million and $7.8 million of income incentive fees (after waivers) for the years ended December 31, 2019 and 2018, respectively. The Company did not incur income incentive fees for the year ended December 31, 2017.
As of December 31, 2019 and December 31, 2018, there was $4.5 million and $3.3 million, respectively, related to the income incentive fee accrued in incentive fee payable on the consolidated statements of assets and liabilities.
On October 11, 2018, the Board approved, subject to completion of the IPO, the Investment Advisory Agreement. Beginning with the calendar quarter that commenced on January 1, 2019, this Investment Advisory Agreement incorporates (i) a three-year lookback provision and (ii) a cap on quarterly income incentive fee payments based on net realized or unrealized capital loss, if any, during the applicable three-year lookback period. The Amended Advisory Agreement approved by Stockholders on February 1, 2019 contains the same provisions.
Annual Incentive Fee Based on Capital Gains
The second part of the incentive fee is a capital gains incentive fee that will be determined and payable in arrears in cash as of the end of each fiscal year (or upon termination of the Amended Advisory Agreement, as of the termination date), and equals (i) 15% of our realized capital gains as of the end of the fiscal year prior to the IPO, and (ii) 17.5% of our realized capital gains as of the end of the fiscal year after the IPO. In determining the capital gains incentive fee payable to the Advisor, the Company calculates the cumulative aggregate realized capital gains and cumulative aggregate realized capital losses since our inception, and the aggregate unrealized capital depreciation as of the date of the calculation, as applicable, with respect to each of the investments in our portfolio. For this purpose, cumulative aggregate realized capital gains, if any, equals the sum of the differences between the net sales price of each investment, when sold, and the cost of such investment. Cumulative aggregate realized capital losses equals the sum of the amounts by which the net sales price of each investment, when sold, is less than the cost of such investment. Aggregate unrealized capital depreciation equals the sum of the difference, if negative, between the valuation of each investment as of the applicable calculation date and the cost of such investment. At the end of the applicable year, the amount of capital gains that serves as the basis for our calculation of the capital gains incentive fee equals the cumulative aggregate realized capital gains less cumulative aggregate realized capital losses, less aggregate unrealized capital depreciation, with respect to our portfolio of investments. If this number is positive at the end of such year, then the capital gains incentive fee for such year will equal 15% before the IPO or 17.5% after the IPO, as applicable, of such
180
amount, less the aggregate amount of any capital gains incentive fees paid in respect of our portfolio in all prior years.
Because the IPO occurred on a date other than the first day of a fiscal year, a capital gains incentive fee was calculated as of the day before the IPO, with such capital gains incentive fee paid to the Advisor following the end of the fiscal year in which the IPO occurred. For the avoidance of doubt, such capital gains incentive fee was equal to 15% of the Company's realized capital gains on a cumulative basis from inception through the day before the IPO, computed net of all realized capital losses and unrealized capital depreciation on a cumulative basis, less the aggregate amount of any previously paid capital gains incentive fees. Following the IPO, solely for the purposes of calculating the capital gains incentive fee, the Company will be deemed to have previously paid capital gains incentive fees prior to the IPO equal to the product obtained by multiplying (a) the actual aggregate amount of previously paid capital gains incentive fees for all periods prior to the IPO by (b) the percentage obtained by dividing (x) 17.5% by (y) 15%. In the event that the Investment Advisory Agreement shall terminate as of a date that is not a fiscal year end, the termination date shall be treated as though it were a fiscal year end for purposes of calculating and paying a capital gains incentive fee.
There was no capital gains incentive fee payable to the Advisor under the Amended Advisory Agreement as of December 31, 2019 and December 31, 2018.
US GAAP requires that the incentive fee accrual consider the cumulative aggregate unrealized capital appreciation of investments or other financial instruments in the calculation, as an incentive fee would be payable if such unrealized capital appreciation were realized, even though such unrealized capital appreciation is not permitted to be considered in calculating the fee actually payable under the Amended Advisory Agreement ("GAAP Incentive Fee"). There can be no assurance that such unrealized appreciation will be realized in the future. Accordingly, such fee, as calculated and accrued, would not necessarily be payable under the Amended Advisory Agreement, and may never be paid based upon the computation of incentive fees in subsequent period.
For the year ended December 31, 2019, the Company accrued $0.0 million of incentive fees related to the GAAP Incentive Fee, which is included in incentive fees on the consolidated statements of operations. For the year ended December 31, 2018 there was a reduction of $1.0 million of incentive fees related to the GAAP Incentive Fee which is included in incentive fee on the consolidated statements of operations. For the year ended December 31, 2017, the Company accrued $0.8 million of incentive fees related to the GAAP Incentive Fee which is included in incentive fee on the consolidated statements of operations. As of December 31, 2019 and December 31, 2018, there was $0.0 million and $0.0 million related to the GAAP Incentive Fee accrued in incentive fee payable on the consolidated statements of assets and liabilities.
The Company has entered into an administration agreement (the "Administration Agreement") with the advisor (in such capacity, the "Administrator"), pursuant to which the Administrator will provide the administrative services necessary for us to operate, and the Company will utilize the Administrator's office facilities, equipment and recordkeeping services. Pursuant to the Administration Agreement, the Administrator has agreed to oversee our public reporting requirements and tax reporting and monitor our expenses and the performance of professional services rendered to us by others. The Administrator has also hired a sub-administrator to assist in the provision of administrative services. The Company will reimburse the Administrator for its costs and expenses and our allocable portion of overhead incurred by it in performing its obligations under the Administration Agreement, including certain compensation paid to or compensatory distributions received by our officers (including our Chief Compliance Officer and Chief
181
Financial Officer) and any of their respective staff who provide services to us, operations staff who provide services to us, and internal audit staff, if any, to the extent internal audit performs a role in our Sarbanes-Oxley internal control assessment. Our allocable portion of overhead will be determined by the Administrator, which expects to use various methodologies such as allocation based on the percentage of time certain individuals devote, on an estimated basis, to the business and affairs of the Company, and will be subject to oversight by the Board. The Company incurred expenses related to the Administrator of $0.8 million, $0.0 million and $0.0 million for the years ended December 31, 2019, 2018 and 2017, respectively, which is included in other general and administrative expenses on the consolidated statements of operations. As of December 31, 2019, and December 31, 2018, respectively, there were no outstanding expenses related to the Administrator that were payable and included in "accounts payable and accrued expenses" in the consolidated statements of assets and liabilities. The sub-administrator is paid its compensation for performing its sub-administrative services under the sub-administration agreement. The Company incurred expenses related to the sub-administrator of $0.6 million, $0.8 million and 0.5 million for the years ended December 31, 2019, 2018 and 2017, respectively, which is included in other general and administrative expenses on the consolidated statements of operations. The Administrator will not seek reimbursement in the event that any such reimbursements would cause any distributions to our stockholders to constitute a return of capital. In addition, the Administrator is permitted to delegate its duties under the Administration Agreement to affiliates or third parties and the Company will reimburse the expenses of these parties incurred and paid by the Advisor on our behalf.
The Company's investment activities are managed by the Advisor, an investment adviser that is registered with the SEC under the Advisers Act. The Advisor is responsible for originating prospective investments, conducting research and due diligence investigations on potential investments, analyzing investment opportunities, negotiating and structuring our investments and monitoring our investments and portfolio companies on an ongoing basis.
The Advisor has entered into a Resource Sharing Agreement (the "Resource Sharing Agreement") with Bain Capital Credit, LP ("Bain Capital Credit"), pursuant to which Bain Capital Credit provides the Advisor with experienced investment professionals (including the members of the Advisor's Credit Committee) and access to the resources of Bain Capital Credit so as to enable the Advisor to fulfill its obligations under the Amended Advisory Agreement. Through the Resource Sharing Agreement, the Advisor intends to capitalize on the significant deal origination, credit underwriting, due diligence, investment structuring, execution, portfolio management and monitoring experience of Bain Capital Credit's investment professionals. There can be no assurance that Bain Capital Credit will perform its obligations under the Resource Sharing Agreement. The Resource Sharing Agreement may be terminated by either party on 60 days' notice, which if terminated may have a material adverse consequence on the Company's operations.
The Company will invest alongside our affiliates, subject to compliance with applicable regulations and our allocation procedures. Certain types of negotiated co-investments will be made only in accordance with the terms of the exemptive order the Company received from the SEC initially on August 23, 2016, as amended on March 23, 2018 (the "Order"). Under the terms of the Order, a "required majority" (as defined in Section 57(o) of the 1940 Act) of our independent directors must be able to reach certain conclusions in connection with a co-investment transaction, including that (1) the terms of the proposed transaction are reasonable and fair to us and our stockholders and do not involve overreaching of our or its stockholders on the part of any person concerned, and (2) the transaction is consistent with the interests of our stockholders and is consistent with our Board's approved criteria. In certain situations where
182
co-investment with one or more funds managed by the Advisor or its affiliates is not covered by the Order, the personnel of the Advisor or its affiliates will need to decide which funds will proceed with the investment. Such personnel will make these determinations based on policies and procedures, which are designed to reasonably ensure that investment opportunities are allocated fairly and equitably among affiliated funds over time and in a manner that is consistent with applicable laws, rules and regulations.
Prior to the IPO, the Advisor made commitments of $10.8 million to the Company as of December 31, 2018, of which $7.8 million had been called by the Company as of December 31, 2018. As of December 31, 2019 and December 31, 2018, the Advisor held 389,695.20 and 389,476.18 shares of the Company's common stock, respectively. An affiliate of the Advisor is the investment manager to certain pooled investment vehicles which are investors in the Company. Collectively, these investors had made commitments to the Company of $555.3 million as of December 31, 2018 of which $388.7 million, had been called by the Company. These investors held 9,539,043.66 and 19,306,284.66 shares of the Company at December 31, 2019 and December 31, 2018, respectively.
All outstanding commitments were cancelled due the completion of the IPO on November 15, 2018.
Controlled Affiliate Investments
Transactions during the year ended December 31, 2019 in which the issuer was either a non-controlled Affiliated Person, as defined in the 1940 Act or an Affiliated Person that the Company is deemed to Control were as follows:
| Portfolio Company | Principal/ Par Amount |
Fair Value as of December 31, 2018 |
Gross Addition |
Gross Reductions |
Change in Unrealized Gains (Losses) |
Realized Gains (Losses) |
Fair Value as of December 31, 2019 |
Dividend and Interest Income |
Other Income |
|||||||||||||||||||
|---|---|---|---|---|---|---|---|---|---|---|---|---|---|---|---|---|---|---|---|---|---|---|---|---|---|---|---|---|
Non-Controlled/affiliate investment |
||||||||||||||||||||||||||||
ADT Pizza, LLC, Equity Interest (1) |
$ | 6,720 | $ | 6,720 | $ | — | $ | — | $ | — | $ | — | $ | 6,720 | $ | — | $ | — | ||||||||||
| | | | | | | | | | | | | | | | | | | | | | | | | | | | | |
Total Non-Controlled/affiliate investment |
$ | 6,720 | $ | 6,720 | $ | — | $ | — | $ | — | $ | — | $ | 6,720 | $ | — | $ | — | ||||||||||
| | | | | | | | | | | | | | | | | | | | | | | | | | | | | |
Controlled affiliate investment |
||||||||||||||||||||||||||||
ACC Holdco, LLC, Preferred Equity |
$ | 10,828 | $ | — | $ | 11,707 | $ | (882 | ) | $ | 3 | $ | — | $ | 10,828 | $ | 955 | $ | 4 | |||||||||
Air Comm Corporation LLC, First Lien Senior Secured Loan |
27,298 | — | 26,653 | (137 | ) | 645 | — | 27,161 | 1,266 | — | ||||||||||||||||||
Antares Bain Capital Complete Financing Solution LLC, Investment Vehicle |
— | 279,363 | 1,432 | (281,589 | ) | 529 | 265 | — | 13,875 | — | ||||||||||||||||||
BCC Jetstream Holdings Aviation (On II), LLC, Equity Interest |
1,116 | 1,243 | 384 | — | 242 | — | 1,869 | 107 | — | |||||||||||||||||||
BCC Jetstream Holdings Aviation (On II), LLC, First Lien Senior Secured Loan |
6,363 | 4,163 | 2,219 | (19 | ) | — | — | 6,363 | 543 | — | ||||||||||||||||||
BCC Jetstream Holdings Aviation (Off I), LLC, Equity Interest |
11,863 | 13,479 | — | — | (388 | ) | — | 13,091 | 1,115 | — | ||||||||||||||||||
Gale Aviation (Offshore) Co, Equity Interest |
57,007 | — | 57,626 | (617 | ) | 764 | — | 57,773 | 627 | — | ||||||||||||||||||
| | | | | | | | | | | | | | | | | | | | | | | | | | | | | |
Total Controlled affiliate investment |
$ | 114,475 | $ | 298,248 | $ | 100,021 | $ | (283,244 | ) | $ | 1,795 | $ | 265 | $ | 117,085 | $ | 18,488 | $ | 4 | |||||||||
| | | | | | | | | | | | | | | | | | | | | | | | | | | | | |
Total |
$ | 121,195 | $ | 304,968 | $ | 100,021 | $ | (283,244 | ) | $ | 1,795 | $ | 265 | $ | 123,805 | $ | 18,488 | $ | 4 | |||||||||
| | | | | | | | | | | | | | | | | | | | | | | | | | | | | |
| | | | | | | | | | | | | | | | | | | | | | | | | | | | | |
| | | | | | | | | | | | | | | | | | | | | | | | | | | | | |
(1) Non-income producing.
183
Transactions during the year ended December 31, 2018 in which the issuer was either a non-controlled Affiliated Person, as defined in the 1940 Act or an Affiliated Person that the Company is deemed to Control were as follows:
| Portfolio Company | Principal/ Par Amount |
Fair Value as of December 31, 2017 |
Gross Addition |
Gross Reductions |
Change in Unrealized Gains (Losses) |
Realized Gains (Losses) |
Fair Value as of December 31, 2018 |
Dividend and Interest Income |
Other Income |
|||||||||||||||||||
|---|---|---|---|---|---|---|---|---|---|---|---|---|---|---|---|---|---|---|---|---|---|---|---|---|---|---|---|---|
Non-Controlled/affiliate investment |
||||||||||||||||||||||||||||
ADT Pizza, LLC, Equity Interest (1) |
$ | 6,720 | $ | — | $ | 6,720 | $ | — | $ | — | $ | — | $ | 6,720 | $ | — | $ | — | ||||||||||
| | | | | | | | | | | | | | | | | | | | | | | | | | | | | |
Total Non-Controlled/affiliate investment |
$ | 6,720 | $ | — | $ | 6,720 | $ | — | $ | — | $ | — | $ | 6,720 | $ | — | $ | — | ||||||||||
| | | | | | | | | | | | | | | | | | | | | | | | | | | | | |
Controlled affiliate investment |
||||||||||||||||||||||||||||
Antares Bain Capital Complete Financing Solution LLC, Investment Vehicle |
$ | 279,891 | $ | 178,410 | $ | 103,148 | $ | (1,310 | ) | $ | (885 | ) | $ | — | $ | 279,363 | $ | 24,492 | $ | — | ||||||||
BCC Jetstream Holdings Aviation (On II), LLC, Unfunded Commitment (1) |
— | — | — | — | — | — | — | — | — | |||||||||||||||||||
BCC Jetstream Holdings Aviation (On II), LLC, Equity Interest |
731 | 424 | 407 | — | 412 | — | 1,243 | 30 | — | |||||||||||||||||||
BCC Jetstream Holdings Aviation (On II), LLC, First Lien Senior Secured Loan |
4,163 | 1,837 | 2,326 | — | — | — | 4,163 | 312 | — | |||||||||||||||||||
BCC Jetstream Holdings Aviation (Off I), LLC, Equity Interest |
11,863 | 7,839 | 4,459 | — | 1,181 | — | 13,479 | 866 | — | |||||||||||||||||||
| | | | | | | | | | | | | | | | | | | | | | | | | | | | | |
Total Controlled affiliate investment |
$ | 296,648 | $ | 188,510 | $ | 110,340 | $ | (1,310 | ) | $ | 708 | $ | — | $ | 298,248 | $ | 25,700 | $ | — | |||||||||
| | | | | | | | | | | | | | | | | | | | | | | | | | | | | |
Total |
$ | 303,368 | $ | 188,510 | $ | 117,060 | $ | (1,310 | ) | $ | 708 | $ | — | $ | 304,968 | $ | 25,700 | $ | — | |||||||||
| | | | | | | | | | | | | | | | | | | | | | | | | | | | | |
| | | | | | | | | | | | | | | | | | | | | | | | | | | | | |
| | | | | | | | | | | | | | | | | | | | | | | | | | | | | |
(1) Non-income producing.
In accordance with applicable SEC staff guidance and interpretations, as a BDC, with certain exceptions, effective February 2, 2019, the Company is permitted to borrow amounts such that its asset coverage ratio is at least 150% after such borrowing (if certain requirements are met), rather than 200%, as previously required. As of December 31, 2019 and December 31, 2018, the Company's asset coverage ratio based on aggregated borrowings outstanding was 164% and 257%, respectively.
The Company's outstanding borrowings as of December 31, 2019 and December 31, 2018 were as follows:
| |
As of December 31, 2019 | As of December 31, 2018 | |||||||||||||||||
|---|---|---|---|---|---|---|---|---|---|---|---|---|---|---|---|---|---|---|---|
| |
Total Aggregate Principal Amount Committed |
Principal Amount Outstanding |
Carrying Value (1) |
Total Aggregate Principal Amount Committed |
Principal Amount Outstanding |
Carrying Value (1) |
|||||||||||||
BCSF Revolving Credit Facility |
$ | 500,000 | $ | 268,015 | $ | 268,015 | $ | 500,000 | $ | 271,265 | $ | 271,265 | |||||||
2018-1 Notes |
365,700 | 365,700 | 363,832 | 365,700 | 365,700 | 363,660 | |||||||||||||
JPM Credit Facility |
666,581 | 546,754 | 546,754 | — | — | — | |||||||||||||
2019-1 Debt |
398,750 | 398,750 | 396,034 | — | — | — | |||||||||||||
| | | | | | | | | | | | | | | | | | | | |
Total Debt |
$ | 1,931,031 | $ | 1,579,219 | $ | 1,574,635 | $ | 865,700 | $ | 636,965 | $ | 634,925 | |||||||
| | | | | | | | | | | | | | | | | | | | |
| | | | | | | | | | | | | | | | | | | | |
| | | | | | | | | | | | | | | | | | | | |
- (1)
- Carrying value represents aggregate principal amount outstanding less unamortized debt issuance costs
The combined weighted average interest rate (excluding deferred upfront financing costs and unused fees) of the aggregate borrowings outstanding for the years ended December 31, 2019 and year ended December 31, 2018 were 4.7% and 4.3%, respectively.
184
The following table shows the contractual maturities of our debt obligations as of December 31, 2019:
| |
Payments Due by Period | |||||||||||||||
|---|---|---|---|---|---|---|---|---|---|---|---|---|---|---|---|---|
| |
Total | Less than 1 year |
1 — 3 years | 3 — 5 years | More than 5 years |
|||||||||||
BCSF Revolving Credit Facility |
$ | 268,015 | $ | — | $ | 268,015 | $ | — | $ | — | ||||||
2018-1 Notes |
365,700 | — | — | — | 365,700 | |||||||||||
JPM Credit Facility |
546,754 | — | 546,754 | — | — | |||||||||||
2019-1 Debt |
398,750 | — | — | — | 398,750 | |||||||||||
| | | | | | | | | | | | | | | | | |
Total Debt Obligations |
$ | 1,579,219 | $ | — | $ | 814,769 | $ | — | $ | 764,450 | ||||||
| | | | | | | | | | | | | | | | | |
| | | | | | | | | | | | | | | | | |
| | | | | | | | | | | | | | | | | |
SMBC Revolving Credit Agreement
On November 21, 2018, the SMBC Revolving Credit Facility was terminated. The proceeds from the initial public offering on November 15, 2018, were used to repay the total outstanding debt.
For the years ended December 31, 2019, 2018 and 2017, the components of interest expense related to the SMBC Revolving Credit Facility were as follows:
| |
For the Year Ended December 31, | |||||||||
|---|---|---|---|---|---|---|---|---|---|---|
| |
2019 | 2018 | 2017 | |||||||
Borrowing interest expense |
$ | — | $ | 3,334 | $ | 673 | ||||
Unused facility fee |
— | 22 | 254 | |||||||
Amortization of deferred financing costs and upfront commitment fees |
— | 723 | 366 | |||||||
| | | | | | | | | | | |
Total interest and debt financing expenses |
$ | — | $ | 4,079 | $ | 1,293 | ||||
| | | | | | | | | | | |
| | | | | | | | | | | |
| | | | | | | | | | | |
BCSF Revolving Credit Facility
On October 4, 2017, we entered into the revolving credit agreement (the "BCSF Revolving Credit Facility") with us, as equity holder, BCSF I, LLC, a Delaware limited liability company and a wholly owned and consolidated subsidiary of the Company, as borrower, and Goldman Sachs Bank USA, as sole lead arranger ("Goldman Sachs"). The BCSF Revolving Credit Facility was subsequently amended on May 15, 2018 to reflect certain clarifications regarding margin requirements and hedging currencies. The maximum commitment amount under the BCSF Revolving Credit Facility is $500.0 million and may be increased up to $750.0 million. Proceeds of the loans under the BCSF Revolving Credit Facility may be used to acquire certain qualifying loans and such other uses as permitted under the BCSF Revolving Credit Facility. The BCSF Revolving Credit Facility includes customary affirmative and negative covenants, including certain limitations on the incurrence of additional indebtedness and liens, as well as usual and customary events of default for revolving credit facilities of this nature.
Assets that are pledged as collateral for the BCSF Revolving Credit Facility are not directly available to the creditors of the Company to satisfy any obligations of the Company other than the Company's obligations under the BCSF Revolving Credit Facility.
Borrowings under the BCSF Revolving Credit Facility bear interest at LIBOR plus a margin. As of December 31, 2019 and December 31, 2018, the BCSF Revolving Credit Facility was accruing interest expense at a rate of LIBOR plus 2.50%. We pay an unused commitment fee of 30 basis points (0.30%) per annum. Interest is payable quarterly in arrears. Any amounts borrowed under the BCSF Revolving Credit Facility, and all accrued and unpaid interest, will be due and payable, on the earliest of: (a) October 5, 2022
185
and (b) the date upon which all loans shall become due and payable in full, whether by acceleration or otherwise.
As of December 31, 2019 and December 31, 2018 there were $268.0 million and $271.3 million borrowings under the BCSF Revolving Credit Facility, respectively and we were in compliance with the terms of the BCSF Revolving Credit Facility.
For the years ended December 31, 2019, 2018 and 2017, the components of interest expense related to the BCSF Revolving Credit Facility were as follows:
| |
For the Year Ended December 31, | ||||||
|---|---|---|---|---|---|---|---|
| |
2019 | 2018 | 2017 | ||||
Borrowing interest expense |
$17,566 | $13,975 | $1,705 | ||||
Unused facility fee |
456 | 624 | 241 | ||||
Amortization of deferred financing costs and upfront commitment fees |
1,067 | 1,068 | 376 | ||||
| | | | | | | | |
Total interest and debt financing expenses |
$19,089 | $15,667 | $2,322 | ||||
| | | | | | | | |
| | | | | | | | |
| | | | | | | | |
On September 28, 2018, (the "2018-1 Closing Date"), we, through BCC Middle Market CLO 2018-1 LLC (the "2018-1 Issuer"), a Delaware limited liability company and a wholly owned and consolidated subsidiary of us, completed its $451.2 million term debt securitization (the "CLO Transaction"). The notes issued in connection with the CLO Transaction (the "2018-1 Notes") are secured by a diversified portfolio of the 2018-1 Issuer consisting primarily of middle market loans and participation interests in middle market loans, the majority of which are senior secured loans (the "2018-1 Portfolio"). At the 2018-1 Closing Date, the 2018-1 Portfolio was comprised of assets transferred from the Company and its consolidated subsidiaries. All transfers were eliminated in consolidation and there were no realized gains or losses recognized in the CLO Transaction.
The CLO Transaction was executed through a private placement of the following 2018-1 Notes:
| 2018-1 Notes | Principal Amount | Spread above Index | Interest rate at December 31, 2019 |
||||||
|---|---|---|---|---|---|---|---|---|---|
Class A-1 A |
$ | 205,900 | 1.55% + 3 Month LIBOR | 3.52 | % | ||||
Class A-1 B |
45,000 | 1.50% + 3 Month LIBOR (first 24 months) | 3.47 | % | |||||
|
1.80% + 3 Month LIBOR (thereafter) | ||||||||
Class A-2 |
55,100 | 2.15% + 3 Month LIBOR | 4.12 | % | |||||
Class B |
29,300 | 3.00% + 3 Month LIBOR | 4.97 | % | |||||
Class C |
30,400 | 4.00% + 3 Month LIBOR | 5.97 | % | |||||
| | | | | | | | | | |
Total 2018-1 Notes |
365,700 | ||||||||
| | | | | | | | | | |
Membership Interests |
85,450 | Non-interest bearing | Not applicable | ||||||
| | | | | | | | | | |
Total |
$ | 451,150 | |||||||
| | | | | | | | | | |
| | | | | | | | | | |
| | | | | | | | | | |
The Class A-1 A, A-1 B, A-2, B and C 2018-1 Notes were issued at par and are scheduled to mature on October 20, 2030. The Company received 100% of the membership interests (the "Membership Interests") in the 2018-1 Issuer in exchange for its sale to the 2018-1 Issuer of the initial closing date loan portfolio. The Membership Interests do not bear interest.
186
The Class A-1 A, A-1 B, A-2, B and C 2018-1 Notes are included in the consolidated financial statements. The Membership Interests are eliminated in consolidation.
The Company serves as portfolio manager of the 2018-1 Issuer pursuant to a portfolio management agreement between the Company and the 2018-1 Issuer. For so long as the Company serves as portfolio manager, the Company will not charge any management fee or subordinated interest to which it may be entitled.
During the reinvestment period (four years from the closing date of the CLO Transaction), pursuant to the indenture governing the 2018-1 Notes, all principal collections received on the underlying collateral may be used by the 2018-1 Issuer to purchase new collateral under the direction of the Company in its capacity as portfolio manager of the 2018-1 Issuer and in accordance with the 2018-1 Issuer's investment strategy and the terms of the indenture.
The Company has agreed to hold on an ongoing basis the Membership Interests with an aggregate dollar purchase price of at least equal to 5% of the aggregate amount of all obligations issued by the 2018-1 Issuer for so long as the 2018-1 Notes remain outstanding.
The 2018-1 Issuer pays ongoing administrative expenses to the trustee, independent accountants, legal counsel, rating agencies and independent managers in connection with developing and maintaining reports and providing required services in connection with the administration of the 2018-1 Issuer.
As of December 31, 2019, there were 61 first lien and second lien senior secured loans with a total fair value of approximately $435.8 million and cash of $9.1 million securing the 2018-1 Notes. As of December 31, 2018, there were 75 first lien and second lien senior secured loans with a total fair value of approximately $437.2 million and cash of $18.0 million securing the 2018-1 Notes. Assets that are pledged as collateral for the 2018-1 Notes are not directly available to the creditors of the Company to satisfy any obligations of the Company other than the Company's obligations under the indenture governing the 2018-1 Notes. Such assets are included in the Company's consolidated financial statements. The creditors of the 2018-1 Issuer have received security interests in such assets and such assets are not intended to be available to the creditors of the Company (or an affiliate of the Company). The 2018-1 Portfolio must meet certain requirements, including asset mix and concentration, term, agency rating, collateral coverage, minimum coupon, minimum spread and sector diversity requirements in the indenture governing the 2018-1 Notes. As of December 31, 2019 and December 31, 2018, the Company was in compliance with its covenants related to the 2018-1 Notes.
Costs of $2.1 million were incurred in connection with debt securitization of the 2018-1 Notes by the 2018-1 Issuer which have been recorded as debt issuance costs and presented as a reduction to the outstanding principal amount of the 2018-1 Notes on the consolidated statements of assets and liabilities and are being amortized over the life of the 2018-1 Issuer using the effective interest method. The balance of the unamortized deferred financing costs related to the 2018-1 Issuer was $1.9 million and $2.0 million as of December 31, 2019 and December 31, 2018, respectively. For the years ended December 31, 2019, 2018 and 2017, the components of interest expense related to the 2018-1 Issuer were as follows:
| |
For the Year Ended December 31, | ||||||
|---|---|---|---|---|---|---|---|
| |
2019 | 2018 | 2017 | ||||
Borrowing interest expense |
$16,226 | $4,221 | $— | ||||
Amortization of deferred financing costs and upfront commitment fees |
174 | 44 | — | ||||
| | | | | | | | |
Total interest and debt financing expenses |
$16,400 | $4,265 | $— | ||||
| | | | | | | | |
| | | | | | | | |
| | | | | | | | |
187
Citibank Revolving Credit Facility
On February 19, 2019, the Company entered into a credit and security agreement (the "Credit Agreement" or the "Citibank Revolving Credit Facility") with the Company as equity holder and servicer, BCSF II-C, LLC as Borrower, Citibank, N.A., as Administrative Agent, and Wells Fargo Bank, National Association as Collateral Administrator, Collateral Agent and Custodian. The Credit Agreement is effective as of February 19, 2019.
The facility amount under the Credit Agreement is $350.0 million. Proceeds of the loans under the Credit Agreement may be used to acquire certain qualifying loans and such other uses as permitted under the Credit Agreement. The period from the closing date until February 19, 2020 is referred to as the reinvestment period and during such reinvestment period, the Borrower may request drawdowns under the Credit Agreement. The final maturity date is the earliest of: (a) the business day designated by the Borrower as the final maturity date upon not less than three business days' prior written notice to the Administrative Agent, the Collateral Agent, the Lenders, the Custodian and the Collateral Administrator, (b) February 19, 2022 and (c) the date on which the Administrative Agent provides notice of the declaration of the final maturity date after the occurrence of an event of default. The Credit Agreement includes customary affirmative and negative covenants, including certain limitations on the incurrence of additional indebtedness and liens, as well as usual and customary events of default for revolving credit facilities of this nature.
Borrowings under the Citibank Revolving Credit Facility bear interest at the London Interbank Offered Rate ("LIBOR") plus a margin. During the period prior to the last day of the reinvestment period, borrowings under the Credit Agreement will bear interest at a rate equal to the three-month LIBOR plus 1.60%. Commencing on the last day of the reinvestment period, the interest rate on borrowings under the Credit Agreement will reset to three month LIBOR plus 2.60% for the remaining term of the Credit Agreement. We pay an unused commitment fee based on a corresponding utilization rate; (i) 0 basis points (0.00%) per annum when greater than or equal to 85.0% utilization, (ii) 25 basis points (0.25%) per annum when greater than or equal to 75.0% but less than 85.0% utilization, (iii) 50 basis points (0.50%) per annum when greater than or equal to 50.0% but less than 75.0% utilization, (iv) 75 basis points (0.75%) per annum when greater than or equal to 25.0% but less than 50% utilization, or (v) 100 basis points (1.00%) per annum when less than 25.0% utilization.
On August 28, 2019, the Citibank Revolving Credit Facility was terminated. The proceeds from the 2019-1 Debt were used to repay the total outstanding debt.
For the years ended December 31, 2019, 2018 and 2017, the components of interest expense related to the Citibank Revolving Credit Facility were as follows:
| |
For the Year Ended December 31, | ||||||
|---|---|---|---|---|---|---|---|
| |
2019 | 2018 | 2017 | ||||
Borrowing interest expense |
$4,104 | $— | $— | ||||
Unused facility fee |
357 | — | — | ||||
Amortization of deferred financing costs and upfront commitment fees |
124 | — | — | ||||
| | | | | | | | |
Total interest and debt financing expenses |
$4,585 | $— | $— | ||||
| | | | | | | | |
| | | | | | | | |
| | | | | | | | |
188
On April 30, 2019, the Company entered into a loan and security agreement (the "JPM Credit Agreement" or the "JPM Credit Facility") as Borrower, with JPMorgan Chase Bank, National Association, as Administrative Agent, and Wells Fargo Bank, National Association as Collateral Administrator, Collateral Agent, Securities Intermediary and Bank.
The facility amount under the JPM Credit Agreement is $666.6 million. Proceeds of the loans under the JPM Credit Facility may be used to acquire certain qualifying loans and such other uses as permitted under the JPM Credit Agreement. The period from the effective date until November 29, 2020 is referred to as the reinvestment period and during such reinvestment period, the Borrower may request drawdowns under the JPM Credit Facility.
The maturity date is the earliest of: (a) November 29, 2022, (b) the date on which the secured obligations become due and payable following the occurrence of an event of default, (c) the date on which the advances are repaid in full and (d) the date after a market value cure failure occurs on which all portfolio investments have been sold and proceeds therefrom have been received by the Borrower. The stated maturity date of November 29, 2022 may be extended for successive one year periods by mutual agreement of the Borrower and the Administrative Agent.
The JPM Credit Agreement includes customary affirmative and negative covenants, including certain limitations on the incurrence of additional indebtedness and liens, as well as usual and customary events of default for revolving credit facilities of this nature.
Borrowings under the JPM Credit Facility bear interest at LIBOR plus a margin. As of December 31, 2019, JPM Credit Facility was accruing interest expense at a rate of LIBOR plus 2.75%. We pay an unused commitment fee of 75 basis points (0.75%) per annum. Interest is payable quarterly in arrears.
As of December 31, 2019, there were $546.8 million borrowings under the JPM Credit Facility and we were in compliance with the terms of the JPM Credit Facility.
For the years ended December 31, 2019, 2018 and 2017, the components of interest expense related to the JPM Credit Facility were as follows:
| |
For the Year Ended December 31, | ||||||
|---|---|---|---|---|---|---|---|
| |
2019 | 2018 | 2017 | ||||
Borrowing interest expense |
$19,679 | $— | $— | ||||
Unused facility fee |
464 | — | — | ||||
Amortization of deferred financing costs and upfront commitment fees |
53 | — | — | ||||
| | | | | | | | |
Total interest and debt financing expenses |
$20,196 | $— | $— | ||||
| | | | | | | | |
| | | | | | | | |
| | | | | | | | |
On August 28, 2019, the Company, through BCC Middle Market CLO 2019-1 LLC (the "2019-1 Issuer"), a Cayman Islands limited liability company and a wholly-owned and consolidated subsidiary of the Company, and BCC Middle Market CLO 2019-1 Co-Issuer, LLC (the "Co-Issuer" and, together with the Issuer, the "Co-Issuers"), a Delaware limited liability company, completed its $501.0 million term debt securitization (the "2019-1 CLO Transaction"). The notes issued in connection with the 2019-1 CLO
189
Transaction (the "2019-1 Notes") are secured by a diversified portfolio of the Co-Issuers consisting primarily of middle market loans and participation interests in middle market loans, the majority of which are senior secured loans (the "2019-1 Portfolio"). The Co-Issuers also issued Class A-1L Loans (the "Loans" and, together with the 2019-1 Notes, the "2019-1 Debt"). The Loans are also secured by the 2019-1 Portfolio. At the 2019-1 closing date, the 2019-1 Portfolio was comprised of assets transferred from the Company and its consolidated subsidiaries. All transfers were eliminated in consolidation and there were no realized gains or losses recognized in the 2019-1 CLO Transaction.
The 2019-1 CLO Transaction was executed through a private placement of the following 2019-1 Debt:
| 2019-1 Debt | Principal Amount | Spread above Index | Interest rate at December 31, 2019 |
||||||
|---|---|---|---|---|---|---|---|---|---|
Class A-1L |
$ | 50,000 | 1.70% + 3 Month LIBOR | 3.70 | % | ||||
Class A-1 |
222,500 | 1.70% + 3 Month LIBOR | 3.70 | % | |||||
Class A-2A |
50,750 | 2.70% + 3 Month LIBOR | 4.70 | % | |||||
Class A-2B |
13,000 | 4.23% (Fixed) | 4.23 | % | |||||
Class B |
30,000 | 3.60% + 3 Month LIBOR | 5.60 | % | |||||
Class C |
32,500 | 4.75% + 3 Month LIBOR | 6.75 | % | |||||
| | | | | | | | | | |
Total 2019-1 Debt |
398,750 | ||||||||
| | | | | | | | | | |
Membership Interests |
102,250 | Non-interest bearing | Not applicable | ||||||
| | | | | | | | | | |
Total |
$ | 501,000 | |||||||
| | | | | | | | | | |
| | | | | | | | | | |
| | | | | | | | | | |
The Loans and the Class A-1, A-2A, A-2B, and B Notes were issued at par. The Class C Notes were issued at a discount. The Notes are scheduled to mature on October 15, 2031. The Company received 100% of the membership interests (the "Membership Interests") in the 2019-1 Issuer in exchange for its sale to the 2019-1 Issuer of the initial closing date loan portfolio. The Membership Interests do not bear interest.
The Loans and Class A-1, A-2A, A-2B, B, and C Notes are included in the consolidated financial statements of the Company. The Membership Interests are eliminated in consolidation.
The Company serves as portfolio manager of the 2019-1 Issuer pursuant to a portfolio management agreement between the Company and the 2019-1 Issuer. For so long as the Company serves as portfolio manager, the Company will not charge any management fee or subordinated interest to which it may be entitled.
During the reinvestment period, pursuant to the indenture and loan agreement governing the 2019-1 Notes and Loans, respectively, all principal collections received on the underlying collateral may be used by the 2019-1 Issuer to purchase new collateral under the direction of the Company in its capacity as portfolio manager of the 2019-1 Issuer and in accordance with the 2019-1 Issuer investment strategy and the terms of the indenture and loan agreement, as applicable.
The Company has agreed to hold on an ongoing basis the Membership Interests with an aggregate dollar purchase price at least equal to 5% of the aggregate amount of all obligations issued by the 2019-1 Co-Issuers for so long as the 2019-1 Debt remains outstanding.
190
The 2019-1 Issuer pays ongoing administrative expenses to the trustee, independent accountants, legal counsel, rating agencies and independent managers in connection with developing and maintaining reports, and providing required services in connection with the administration of the 2019-1 Issuer.
As of December 31, 2019, there were 65 first lien and second lien senior secured loans with a total fair value of approximately $471.3 million and cash of $22.4 million securing the 2019-1 Debt. Assets that are pledged as collateral for the 2019-1 Debt are not directly available to the creditors of the Company to satisfy any obligations of the Company other than the Company's obligations under the indenture and loan agreement governing the 2019-1 Debt. The creditors of the 2019-1 Co-Issuers have received security interests in such assets and such assets are not intended to be available to the creditors of the Company (or an affiliate of the Company). The 2019-1 Portfolio must meet certain requirements, including asset mix and concentration, term, agency rating, collateral coverage, minimum coupon, minimum spread and sector diversity requirements in the indenture and loan agreement governing the 2019-1 Debt. As of December 31, 2019, the Company was in compliance with its covenants related to the 2019-1 Debt.
Costs of the offering, including the discount of the Class C Notes, of $2.8 million were incurred in connection with debt securitization of the 2019-1 Debt by the 2019-1 Co-Issuers which have been recorded as debt issuance costs and presented as a reduction to the outstanding principal amount of the 2019-1 Debt on the consolidated statements of assets and liabilities and are being amortized over the life of the 2019-1 Issuer using the effective interest method. The balance of the unamortized deferred financing costs related to the 2019-1 Issuer was $2.7 million as of December 31, 2019. The 2019-1 issuer was not in existence as of December 31, 2019 and the 2019-1 Debt were not outstanding.
For the years ended December 31, 2019, 2018 and 2017, the components of interest expense related to the 2019-1 Co-Issuers were as follows:
| |
For the Year Ended December 31, | ||||||
|---|---|---|---|---|---|---|---|
| |
2019 | 2018 | 2017 | ||||
Borrowing interest expense |
$5,981 | $— | $— | ||||
Amortization of deferred financing costs and upfront commitment fees |
79 | — | — | ||||
| | | | | | | | |
Total interest and debt financing expenses |
$6,060 | $— | $— | ||||
| | | | | | | | |
| | | | | | | | |
| | | | | | | | |
The Company is subject to foreign currency exchange rate risk in the normal course of pursuing its investment objectives. The value of foreign investments held by the Company may be significantly affected by changes in foreign currency exchange rates. The dollar value of a foreign security generally decreases when the value of the dollar rises against the foreign currency in which the security is denominated and tends to increase when the value of the dollar declines against such foreign currency.
The Company may enter into forward currency exchange contracts to reduce the Company's exposure to foreign currency exchange rate fluctuations in the value of foreign currencies, as described in Note 2. The fair value of derivative contracts open as of December 31, 2019 and December 31, 2018 is included on the consolidated schedule of investments by contract. The Company had collateral payable of $0.3 million for December 31, 2019 and posted collateral of $0.0 million for December 31, 2018 with the counterparties on foreign currency exchange contracts. Collateral amounts posted are included in collateral on forward currency exchange contracts on the consolidated statements of assets and liabilities. Collateral payable is included in collateral payable on forward currency exchange contracts on the consolidated statements of assets and liabilities.
191
For the years ended December 31, 2019, 2018 and 2017, the Company's average U.S. dollar notional exposure to forward currency exchange contracts were $179.2 million, $97.8 million and $43.2 million, respectively.
By using derivative instruments, the Company is exposed to the counterparty's credit risk—the risk that derivative counterparties may not perform in accordance with the contractual provisions offset by the value of any collateral received. The Company's exposure to credit risk associated with counterparty non-performance is limited to collateral posted and the unrealized gains inherent in such transactions that are recognized in the consolidated statements of assets and liabilities. The Company minimizes counterparty credit risk through credit monitoring procedures, executing master netting arrangements and managing margin and collateral requirements, as appropriate.
The Company presents forward currency exchange contracts on a net basis by counterparty on the consolidated statements of assets and liabilities. The Company has elected not to offset assets and liabilities in the consolidated statements of assets and liabilities that may be received or paid as part of collateral arrangements, even when an enforceable master netting arrangement or other arrangement is in place that provides the Company, in the event of counterparty default, the right to liquidate collateral and the right to offset a counterparty's rights and obligations.
The following table presents both gross and net information about derivative instruments eligible for offset in the consolidated statements of assets and liabilities as of December 31, 2019.
| Counterparty | Account in the consolidated statements of assets and liabilities |
Gross amount of assets on the consolidated statements of assets and liabilities |
Gross amount of (liabilities) on the consolidated statements of assets and liabilities |
Net amount of assets or (liabilities) presented on the consolidated statements of assets and liabilities |
Cash Collateral paid (received) (1) |
Net Amounts (2) |
||||||||||||
|---|---|---|---|---|---|---|---|---|---|---|---|---|---|---|---|---|---|---|
Bank of New York |
Unrealized appreciation on forward currency contracts |
$ | 1,034 | $ | — | $ | 1,034 | $ | (341 | ) | $ | 693 | ||||||
Citibank |
Unrealized appreciation on forward currency contracts |
$ | — | $ | (1) | $ | (1) | $ | 1 | $ | — | |||||||
Goldman Sachs |
Unrealized appreciation on forward currency contracts |
$ | — | $ | (1,251) | $ | (1,251) | $ | — | $ | (1,251) | |||||||
- (1)
- Amount excludes excess cash collateral paid.
- (2)
- Net amount represents the net amount due (to) from counterparty in the event of default based on the contractual set-off rights under the agreement. Net amount excludes any over-collateralized amounts.
The following table presents both gross and net information about derivative instruments eligible for offset in the consolidated statements of assets and liabilities as of December 31, 2018.
| Counterparty | Account in the consolidated statements of assets and liabilities |
Gross amount of assets on the consolidated statements of assets and liabilities |
Gross amount of (liabilities) on the consolidated statements of assets and liabilities |
Net amount of assets or (liabilities) presented on the consolidated statements of assets and liabilities |
Cash Collateral paid (received) (1) |
Net Amounts (2) |
||||||||||||
|---|---|---|---|---|---|---|---|---|---|---|---|---|---|---|---|---|---|---|
Bank of New York |
Unrealized appreciation on forward currency contracts | $ | 3,329 | $ | — | $ | 3,329 | $ | — | $ | 3,329 | |||||||
Citibank |
Unrealized appreciation on forward currency contracts | $ | 1,676 | $ | — | $ | 1,676 | $ | — | $ | 1,676 | |||||||
Goldman Sachs |
Unrealized appreciation on forward currency contracts | $ | 4,317 | $ | — | $ | 4,317 | $ | — | $ | 4,317 | |||||||
- (1)
- Amount excludes excess cash collateral paid.
- (2)
- Net amount represents the net amount due (to) from counterparty in the event of default based on the contractual set-off rights under the agreement. Net amount excludes any over-collateralized amounts.
192
The effect of transactions in derivative instruments to the consolidated statements of operations during the years ended December 31, 2019, 2018 and 2017 was as follows:
| |
For the Years Ended December 31, | |||||
|---|---|---|---|---|---|---|
| |
2019 | 2018 | 2017 | |||
Net realized gain (loss) on forward currency exchange contracts |
$11,043 | $(2,651) | $(222) | |||
Net change in unrealized appreciation (depreciation) on forward currency exchange contracts |
(9,540) | 12,826 | (3,505) | |||
| | | | | | | |
Total net realized and unrealized gain (losses) on forward currency exchange contracts |
$1,503 | $10,175 | $(3,727) | |||
| | | | | | | |
| | | | | | | |
| | | | | | | |
Included in total net gains (losses) on the consolidated statements of operations is net gains (losses) of 2.7 million, ($7.9) million and $4.2 million related to realized and unrealized gains and losses on investments, foreign currency holdings and non-investment assets and liabilities attributable to the changes in foreign currency exchange rates for the years ended December 31, 2019, 2018 and 2017, respectively. Including the total net realized and unrealized gains (losses) on forward currency exchange contracts of $1.5 million, $10.2 million and ($3.7) million, respectively, included in the above table, the net impact of foreign currency on total net gains (losses) on the consolidated statements of operations is $4.2 million, $2.3 million and $0.4 million for the years ended December 31, 2019, 2018 and 2017 respectively.
The Company's distributions are recorded on the record date. The following table summarizes distributions declared during the years ended December 31, 2019, 2018, and 2017:
| Date Declared | Record Date | Payment Date | Amount Per Share |
Total Distributions |
||||
|---|---|---|---|---|---|---|---|---|
| May 9, 2017 | May 12, 2017 | May 19, 2017 | $0.07 | $1,174 | ||||
| June 21, 2017 | June 29, 2017 | August 11, 2017 | $0.11 | $2,740 | ||||
| September 27, 2017 | September 28, 2017 | November 14, 2017 | $0.21 | $5,236 | ||||
| December 26, 2017 | December 28, 2017 | January 24, 2018 | $0.31 | $7,742 | ||||
| March 28, 2018 | March 28, 2018 | May 17, 2018 | $0.34 | $10,610 | ||||
| June 28, 2018 | June 28, 2018 | August 10, 2018 | $0.36 | $13,484 | ||||
| September 26, 2018 | September 26, 2018 | October 19, 2018 | $0.41 | $17,967 | ||||
| December 19, 2018 | December 31, 2018 | January 14, 2019 | $0.41 | $21,108 | ||||
| February 21, 2019 | March 29, 2019 | April 12, 2019 | $0.41 | $21,108 | ||||
| May 7, 2019 | June 28, 2019 | July 29, 2019 | $0.41 | $21,176 | ||||
| August 1, 2019 | September 30, 2019 | October 30, 2019 | $0.41 | $21,176 | ||||
| October 31, 2019 | December 31, 2019 | January 30, 2020 | $0.41 | $21,176 | ||||
| | | | | | | | | |
| Total distributions declared | $3.86 | $164,697 | ||||||
| | | | | | | | | |
| | | | | | | | | |
| | | | | | | | | |
The distributions declared during the years ended December 31, 2019, 2018 and 2017 were derived from investment company taxable income and net capital gain, if any.
The federal income tax characterization of distributions declared and paid for the fiscal year will be determined at fiscal year-end based upon our investment company taxable income for the full fiscal year and distributions paid during the full year.
193
The Company has authorized 100,000,000,000 shares of its common stock with a par value of $0.001 per share. The Company has authorized 10,000,000,000 shares of its preferred stock with a par value of $0.001 per share. Shares of preferred stock have not been issued.
Prior to the IPO, the Company had issued 43,982,137.46 shares in the private placement of the Company's common shares (the "Private Offering"). Each investor had entered into a separate subscription agreement relating to the Company's common stock (the "Subscription Agreements"). Each investor had made a capital commitment to purchase shares of the Company's common stock pursuant to the Subscription Agreements. Investors were required to make capital contributions to purchase shares of the Company's common stock each time the Company delivered a drawdown notice, which were delivered at least 10 business days prior to the required funding date in an aggregate amount not to exceed their respective capital commitments. The number of shares to be issued to a stockholder was determined by dividing the total dollar amount of the contribution by a stockholder by the net asset value per share of the common stock as of the last day of the Company's fiscal quarter or such other date and price per share as determined by the Board in accordance with the requirements of the 1940 Act. As of December 31, 2018, aggregate commitments relating to the Private Offering were $1.3 billion. All outstanding commitments related to these Subscription Agreements were cancelled due to the completion of the IPO on November 15, 2018. As of December 31, 2019 and December 31, 2018, BCSF Advisors, LP contributed in aggregate $7.8 million to the Company and received 389,695.20 shares of the Company and contributed $7.8 million to the Company and received 389,476.18 shares of the Company, respectively. At December 31, 2019 and December 31, 2018, BCSF Advisors, LP owned 0.75% and 0.76%, respectively, of the outstanding common stock of the Company.
On November 19, 2018, the Company closed its initial public offering (the "IPO") issuing 7,500,000 shares of its common stock at a public offering price of $20.25 per share. Shares of common stock of the Company began trading on the New York Stock Exchange under the symbol "BCSF" on November 15, 2018. The offering generated proceeds, before expenses, of $147.3 million. All outstanding commitments were cancelled due to the completion of the initial public offering.
The following table summarizes the total shares issued and amount received related to capital drawdowns delivered pursuant to the Subscription Agreements and shares issued pursuant to the dividend reinvestment plan during the years ended December 31, 2019, 2018 and 2017:
| |
For the Year Ended December 31, | |||||||||||
|---|---|---|---|---|---|---|---|---|---|---|---|---|
| |
2019 | 2018 | 2017 | |||||||||
| |
Shares | Amount | Shares | Amount | Shares | Amount | ||||||
Total capital drawdowns |
— | $— | 18,569,410.12 | $376,949 | 19,412,229.60 | $392,735 | ||||||
Issuance of common stock, net |
— | — | 7,500,000.00 | 145,409 | — | — | ||||||
Dividend reinvestment |
167,674.81 | 3,322 | 436,914.94 | 8,832 | 72,700.50 | 1,476 | ||||||
| | | | | | | | | | | | | |
Total capital drawdowns and dividend reinvestment |
167,674.81 | $3,322 | 26,506,325.06 | $531,190 | 19,484,930.10 | $394,211 | ||||||
| | | | | | | | | | | | | |
| | | | | | | | | | | | | |
| | | | | | | | | | | | | |
BCSF Investments, LLC and certain individuals, including Michael A. Ewald, the Company's Chief Executive Officer and a Managing Director of Bain Capital Credit; Jonathan S. Lavine, Co-Managing Partner of Bain Capital, LP and Founder and Chief Investment Officer of Bain Capital Credit; John Connaughton, Co-Managing Partner of Bain Capital, LP; Jeffrey B. Hawkins, Chairman of the Company's Board of Directors and a Managing Director of Bain Capital Credit; and Michael J. Boyle,
194
the Company's Vice President and Treasurer and a Managing Director of Bain Capital Credit, adopted the 10b5-1 Plan in accordance with Rules 10b5-1 and 10b-18 under the Exchange Act, under which such parties will buy up to $20 million in the aggregate of the Company's common stock in the open market during the period beginning after four full calendar weeks after the closing of the IPO and ending on the earlier of the date on which the capital committed to the 10b5-1 has been exhausted or one year after the closing of the IPO. For the year ended December 31, 2019, 827,933 shares were purchased at a weighted average price of $18.78, inclusive of commissions, for a total cost of $15.6 million. As of February 28, 2019, zero dollars remain under the 10b5-1 Plan and no further purchases are intended under the 10b5-1 Plan.
On May 7, 2019, the Company's Board of Directors authorized the Company to repurchase up to $50 million of its outstanding common stock in accordance with safe harbor rules under the Securities Exchange Act of 1934. Any such repurchases will depend upon market conditions and there is no guarantee that the Company will repurchase any particular number of shares or any shares at all. As of December 31, 2019, there have been no repurchases of common stock.
For income tax purposes, dividends paid and distributions made to the Company's stockholders are reported by the Company to the stockholders as ordinary income, capital gains, or a combination thereof. The tax character of distributions during the years ended December 31, 2019, 2018 and 2017 were as follows:
| |
For the Year Ended December 31, | |||||
|---|---|---|---|---|---|---|
| |
2019 | 2018 | 2017 | |||
Distributions paid from: |
||||||
Ordinary Income |
$84,636 | $63,169 | $16,892 | |||
Net Long-Term Capital Gains |
— | — | — | |||
| | | | | | | |
Total Taxable Distributions |
$84,636 | $63,169 | $16,892 | |||
| | | | | | | |
| | | | | | | |
| | | | | | | |
The following reconciles net increase in net assets resulting from operations to taxable income for the years ended December 31, 2019, 2018 and 2017:
| |
For the Year Ended December 31, | |||||
|---|---|---|---|---|---|---|
| |
2019 | 2018 | 2017 | |||
Net increase in net assets resulting from operations |
$98,085 | $26,645 | $19,300 | |||
Net change in unrealized appreciation (depreciation) |
(5,433) | 22,800 | (5,148) | |||
Expenses not currently deductible |
— | 6,762 | 1,094 | |||
Income for tax but not book |
(26,327) | 4,715 | 2,144 | |||
| | | | | | | |
Taxable/Distributable Income (1) |
$66,325 | $60,922 | $17,390 | |||
| | | | | | | |
| | | | | | | |
| | | | | | | |
- (1)
- The calculation of estimated 2019 taxable income includes a number of estimated inputs, including information received from third parties and, as a result, actual 2019 taxable income will not be finally determined until the Company's 2019 tax return is filed in 2020 (and, therefore, such estimate is subject to change).
Taxable income generally differs from net increase in net assets resulting from operations for financial reporting purposes due to temporary and permanent differences in the recognition of income and
195
expenses, and generally excludes net unrealized gains or losses, as unrealized gains or losses are generally not included in taxable income until they are realized.
Capital losses in excess of capital gains earned in a tax year may generally be carried forward and used to offset capital gains, subject to certain limitations. Under the Regulated Investment Company Modernization Act of 2010, capital losses incurred after September 30, 2011 will not be subject to expiration. As of December 31, 2019, the Company has a short-term capital loss carryforward of $2.4 million and a long-term capital loss carryforward of $4.9 million.
As of December 31, 2019, 2018 and 2017, the Company's aggregate unrealized appreciation and depreciation on investments and forward currency exchange contracts based on cost for U.S. federal income tax purposes was as follows:
| |
As of December 31, | |||||
|---|---|---|---|---|---|---|
| |
2019 | 2018 | 2017 | |||
Tax cost |
$2,536,466 | $1,753,256 | $821,850 | |||
Gross unrealized appreciation |
35,500 | 19,610 | 14,857 | |||
Gross unrealized depreciation |
(45,494) | (35,739) | (8,018) | |||
| | | | | | | |
Net unrealized appreciation (depreciation) on investments and forward currency exchange contracts |
$(9,994) | $(16,129) | $6,839 | |||
| | | | | | | |
| | | | | | | |
| | | | | | | |
ASC Topic 740 ((Accounting for Uncertainty in Income Taxes ("ASC 740")) provides guidance on the accounting for and disclosure of uncertainty in tax position. ASC 740 requires the evaluation of tax positions taken or expected to be taken in the course of preparing the Company's tax returns to determine whether the tax positions are "more-likely-than-not" of being sustained by the applicable tax authority. Tax positions not deemed to meet the more-likely-than-not threshold are recorded as a tax benefit or expense in the current year. Based on its analysis of its tax position for all open tax years (the current and prior years, as applicable), the Company has concluded that it does not have any uncertain tax positions that met the recognition or measurement criteria of ASC 740. Such open tax years remain subject to examination and adjustment by tax authorities. As of December 31, 2019, all tax filings of the Company since 2016 remain subject to examination by tax authorities.
The Company has determined that there were no tax positions which met the recognition and measurement requirements of the relevant accounting standards and therefore, the Company did not record an expense related to uncertain positions on the Company's consolidated statements of operations for the years ended December 31, 2019, 2018 and 2017.
Note 11. Commitments and Contingencies
Commitments
The Company's investment portfolio may contain debt investments that are in the form of lines of credit and unfunded delayed draw commitments, which require the Company to provide funding when requested by portfolio companies in accordance with the terms of the underlying loan agreements.
196
As of December 31, 2019, the Company had $215.8 million of unfunded commitments under loan and financing agreements as follows:
| |
Expiration Date (1) | Unfunded Commitments (2) |
|||||
|---|---|---|---|---|---|---|---|
First Lien Senior Secured Loans |
|||||||
A&R Logistics, Inc. - Revolver |
5/5/2025 | $ | 5,043 | ||||
Abracon Group Holding, LLC. - Revolver |
7/18/2024 | 2,833 | |||||
AMI US Holdings Inc. - Revolver |
4/1/2024 | 977 | |||||
Amspec Services, Inc. - Revolver |
7/2/2024 | 3,542 | |||||
Ansira Holdings, Inc. - Delayed Draw |
12/20/2022 | 1,509 | |||||
AP Plastics Group, LLC - Revolver |
8/2/2021 | 8,500 | |||||
Appriss Holdings, Inc. - Revolver |
5/30/2025 | 4,711 | |||||
Aramsco, Inc. - Revolver |
8/28/2024 | 2,766 | |||||
Batteries Plus Holding Corporation - Revolver |
7/6/2022 | 4,250 | |||||
Captain D's LLC - Revolver |
12/15/2023 | 577 | |||||
CB Nike Intermediate Co Ltd - Revolver |
10/31/2025 | 2,878 | |||||
Clinical Innovations, LLC - Revolver |
10/17/2022 | 380 | |||||
CMI Marketing Inc. - Revolver |
5/24/2023 | 2,112 | |||||
CPS Group Holdings, Inc. - Revolver |
3/3/2025 | 4,933 | |||||
Cruz Bay Publishing, Inc. - Delayed Draw |
2/28/2020 | 1,098 | |||||
Cruz Bay Publishing, Inc. - Revolver |
2/28/2020 | 535 | |||||
CST Buyer Company - Revolver |
10/3/2025 | 2,190 | |||||
Datix Bidco Limited - Revolver |
10/28/2024 | 1,290 | |||||
Direct Travel, Inc. - Delayed Draw |
12/1/2021 | 7,030 | |||||
Direct Travel, Inc. - Revolver |
12/1/2021 | 4,250 | |||||
Dorner Manufacturing Corp - Revolver |
3/15/2022 | 1,099 | |||||
Efficient Collaborative Retail Marketing Company, LLC - Revolver |
6/15/2022 | 3,542 | |||||
Element Buyer, Inc. - Delayed Draw |
7/18/2025 | 7,933 | |||||
Element Buyer, Inc. - Revolver |
7/19/2024 | 2,833 | |||||
FFI Holdings I Corp - Delayed Draw |
1/24/2025 | 677 | |||||
FFI Holdings I Corp - Revolver |
1/24/2025 | 1,994 | |||||
Fineline Technologies, Inc. - Revolver |
11/4/2022 | 655 | |||||
Grammer Purchaser, Inc. - Revolver |
9/30/2024 | 998 | |||||
Great Expressions Dental Center PC - Revolver |
9/28/2022 | 150 | |||||
Green Street Parent, LLC - Revolver |
8/27/2025 | 2,419 | |||||
GSP Holdings, LLC - Revolver |
11/6/2025 | 4,307 | |||||
Hightower Holding, LLC - Delayed Draw |
1/31/2025 | 6,640 | |||||
Horizon Telcom, Inc. - Delayed Draw |
6/15/2023 | 1,256 | |||||
Horizon Telcom, Inc. - Revolver |
6/15/2023 | 116 | |||||
Ivy Finco Limited - First Lien Senior Secured Loan |
5/19/2025 | 5,817 | |||||
JHCC Holdings, LLC - Delayed Draw |
9/9/2025 | 8,500 | |||||
JHCC Holdings, LLC - Revolver |
9/9/2025 | 1,820 | |||||
Kellstrom Commercial Aerospace, Inc. - Delayed Draw |
7/1/2025 | 3,838 | |||||
Kellstrom Commercial Aerospace, Inc. - Revolver |
7/1/2025 | 640 | |||||
Margaux Acquisition Inc. - Delayed Draw |
12/19/2024 | 7,139 | |||||
Margaux Acquisition Inc. - Revolver |
12/19/2024 | 2,872 | |||||
Margaux UK Finance Limited - Revolver |
12/19/2024 | 662 | |||||
Mertus 522. GmbH - Delayed Draw |
5/28/2026 | 13,761 | |||||
Profile Products LLC - Revolver |
12/20/2024 | 3,833 | |||||
197
| |
Expiration Date (1) | Unfunded Commitments (2) |
|||||
|---|---|---|---|---|---|---|---|
RoC Opco LLC - Revolver |
2/25/2025 | 10,241 | |||||
Solaray, LLC - Revolver |
9/9/2022 | 1,077 | |||||
SumUp Holdings Luxembourg S.à.r.l. - First Lien Senior Secured Loan |
8/1/2024 | 10,638 | |||||
Symplr Software, Inc. - Revolver |
11/30/2023 | 466 | |||||
TCFI Aevex LLC - Revolver |
5/13/2025 | 138 | |||||
TEI Holdings Inc. - Revolver |
12/23/2025 | 3,018 | |||||
Tidel Engineering, L.P. - Revolver |
3/1/2023 | 4,250 | |||||
TLC Purchaser, Inc. - Delayed Draw |
10/13/2025 | 7,119 | |||||
TLC Purchaser, Inc. - Revolver |
10/13/2025 | 4,984 | |||||
Ventiv Holdco, Inc. - Revolver |
9/3/2025 | 3,407 | |||||
WCI-HSG Purchaser, Inc. - Revolver |
2/24/2025 | 2,284 | |||||
WU Holdco, Inc. - Delayed Draw |
3/26/2026 | 4,801 | |||||
WU Holdco, Inc. - Revolver |
3/26/2025 | 3,944 | |||||
YLG Holdings, Inc. - Delayed Draw |
10/31/2025 | 5,127 | |||||
YLG Holdings, Inc. - Revolver |
10/31/2025 | 8,545 | |||||
Zywave, Inc. - Revolver |
11/17/2022 | 851 | |||||
| | | | | | | | |
Total First Lien Senior Secured Loans |
$ | 215,795 | |||||
| | | | | | | | |
| | | | | | | | |
| | | | | | | | |
- (1)
- Commitments are generally subject to borrowers meeting certain criteria such as compliance with covenants and certain operational metrics. These amounts may remain outstanding until the commitment period of an applicable loan expires, which may be shorter than its maturity.
- (2)
- Unfunded commitments denominated in currencies other than U.S. dollars have been converted to U.S. dollars using the applicable foreign currency exchange rate as of December 31, 2019.
198
As of December 31, 2018, the Company had $110.2 million of unfunded commitments under loan and financing agreements as follows:
| |
Expiration Date (1) | Unfunded Commitments (2) (3) |
|||||
|---|---|---|---|---|---|---|---|
First Lien Senior Secured Loans |
|||||||
Abracon Group Holding, LLC — Revolver |
7/18/2024 | $ | 2,833 | ||||
Aimbridge Hospitality LP — Revolver |
6/22/2022 | 1,177 | |||||
AMCP Clean Acquisition Company, LLC — Delayed Draw Term Loan |
6/16/2025 | 2,315 | |||||
Amspec Services, Inc. — Revolver |
7/2/2024 | 4,735 | |||||
Ansira Holdings, Inc. — Revolver |
12/20/2022 | 5,440 | |||||
AP Plastics Group, LLC — Revolver |
8/1/2021 | 8,500 | |||||
API Technologies Corp. — Revolver |
4/22/2024 | 4,183 | |||||
Aramsco, Inc. — Revolver |
8/28/2024 | 3,161 | |||||
Batteries Plus Holding Corporation — Revolver |
7/6/2022 | 4,250 | |||||
Caliper Corporation — Revolver |
11/30/2023 | 2,358 | |||||
Captain D's LLC — Revolver |
12/15/2023 | 1,074 | |||||
Chase Industries, Inc. — Delayed Draw Term Loan |
5/12/2025 | 3,544 | |||||
Clinical Innovations, LLC — Revolver |
10/17/2022 | 1,113 | |||||
CMI Marketing Inc. — Revolver |
5/24/2023 | 2,112 | |||||
Cruz Bay Publishing, Inc. — Revolver |
6/6/2019 | 567 | |||||
CST Buyer Company — Revolver |
3/1/2023 | 897 | |||||
Datix Bidco Limited — Revolver |
10/28/2024 | 1,240 | |||||
Direct Travel, Inc. — Revolver |
12/1/2021 | 4,250 | |||||
Dorner Manufacturing Corp. — Revolver |
3/15/2022 | 1,044 | |||||
Drilling Info Holdings, Inc. — Delayed Draw Term Loan |
7/30/2025 | 1,663 | |||||
Efficient Collaborative Retail Marketing Company, LLC — Revolver |
6/15/2022 | 3,542 | |||||
Element Buyer, Inc. — Revolver |
7/19/2024 | 4,250 | |||||
ENC Holding Corporation — Delayed Draw Term Loan |
5/30/2025 | 595 | |||||
FineLine Technologies, Inc. — Revolver |
11/2/2021 | 2,162 | |||||
Grammer Purchaser, Inc. — Revolver |
9/30/2024 | 945 | |||||
Great Expressions Dental Centers PC — Revolver |
9/28/2022 | 213 | |||||
Home Franchise Concepts, Inc. — Revolver |
7/9/2024 | 2,530 | |||||
Horizon Telcom, Inc. — Delayed Draw Term Loan |
6/15/2023 | 1,738 | |||||
Horizon Telcom, Inc. — Revolver |
6/15/2023 | 1,159 | |||||
Margaux UK Finance — Revolver |
12/19/2024 | 636 | |||||
Margaux Acquisition Inc. — Revolver |
12/19/2024 | 2,257 | |||||
McKissock, LLC — Revolver |
8/5/2021 | 1,842 | |||||
PRCC Holdings, Inc. — Revolver |
2/1/2021 | 3,542 | |||||
Profile Products LLC — Revolver |
12/20/2024 | 3,833 | |||||
Solaray, LLC — Revolver |
9/9/2022 | 7,084 | |||||
Sovos Compliance, LLC — Delayed Draw Term Loan |
3/1/2022 | 871 | |||||
Sovos Compliance, LLC — Revolver |
3/1/2022 | 1,452 | |||||
Stanton Carpet Corp. — Revolver |
11/21/2022 | 4,250 | |||||
TEI Holdings Inc. — Revolver |
12/20/2022 | 3,542 | |||||
Tidel Engineering, L.P. — Revolver |
3/1/2023 | 4,250 | |||||
Zywave, Inc. — Revolver |
11/17/2022 | 512 | |||||
| | | | | | | | |
Total First Lien Senior Secured Loans |
$ | 107,661 | |||||
| | | | | | | | |
Other Unfunded Commitments |
|||||||
BCC Jetstream Holdings Aviation (On II), LLC |
2,562 | ||||||
| | | | | | | | |
Total Other Unfunded Commitments |
$ | 2,562 | |||||
| | | | | | | | |
Total |
$ | 110,223 | |||||
| | | | | | | | |
| | | | | | | | |
| | | | | | | | |
- (1)
- Commitments are generally subject to borrowers meeting certain criteria such as compliance with covenants and certain operational metrics. These amounts may remain outstanding until the commitment period of an applicable loan expires, which may be shorter than its maturity.
199
- (2)
- Unfunded commitments denominated in currencies other than U.S. dollars have been converted to U.S. dollars using the applicable foreign currency exchange rate as of December 31, 2018.
- (3)
- Unfunded commitments represent unfunded commitments to fund investments, excluding the Company's investment in ABCS as of December 31, 2018.
Contingencies
In the normal course of business, the Company may enter into certain contracts that provide a variety of indemnities. The Company's maximum exposure under these indemnities is unknown as it would involve future claims that may be made against the Company. Currently, the Company is not aware of any such claims and no such claims are expected to occur. As such, the Company does not consider it necessary to record a liability in this regard.
The following is a schedule of financial highlights for the years ended December 31, 2019, 2018, 2017 and 2016:
| |
For the Year Ended December 31, | |||||||
|---|---|---|---|---|---|---|---|---|
| |
2019 | 2018 | 2017 | 2016 | ||||
Per share data: |
||||||||
Net asset value at beginning of year |
$19.46 | $20.30 | $20.10 | $— | ||||
Net investment income (loss) (1) |
1.64 | 1.45 | 0.73 | (0.90) | ||||
Net realized gain (loss) (1)(7) |
0.15 | (0.17) | 0.00 | — | ||||
Net change in unrealized appreciation (depreciation) (1)(2)(8) |
0.11 | (0.60) | 0.17 | 1.01 | ||||
| | | | | | | | | |
Net increase in net assets resulting from operations (1)(9)(10) |
1.90 | 0.68 | 0.90 | 0.11 | ||||
Stockholder distributions from income (3) |
(1.64) | (1.52) | (0.70) | (0.01) | ||||
Issuance of common stock |
— | — | — | 20.00 | ||||
| | | | | | | | | |
Net asset value at end of year |
$19.72 | $19.46 | $20.30 | 20.10 | ||||
| | | | | | | | | |
| | | | | | | | | |
| | | | | | | | | |
Net assets at end of year |
$1,018,400 |
$1,001,629 |
$506,963 |
$110,344 |
||||
Shares outstanding at end of year |
51,649,812.27 | 51,482,137.46 | 24,975,812.40 | 5,490,882.30 | ||||
Per share market value at end of year |
$19.76 | $16.77 | N/A | N/A | ||||
Total return based on market value (12) |
28.18% | (15.16)% | N/A | N/A | ||||
Total return based on net asset value (4) |
10.02% | 3.36% | 4.52% | 0.58% | ||||
Ratios: |
||||||||
Ratio of net investment income (loss) to average net assets (5)(11) |
8.36% | 7.19% | 3.51% | (4.57)% | ||||
Ratio of total expenses to average net assets (5)(11) |
11.14% | 5.57% | 2.57% | 8.25% | ||||
Supplemental data: |
||||||||
Ratio of interest and debt financing expenses to average net assets (5) |
6.53% | 3.09% | 0.89% | 0.11% | ||||
Ratio of expenses (without incentive fees) to average net assets (5)(11) |
9.69% | 4.71% | 2.38% | 7.18% | ||||
Ratio of incentive fees and management fees, net of contractual and voluntary waivers, to average net assets (5)(11) |
3.85% | 2.00% | 0.19% | 1.07% | ||||
Average principal debt outstanding |
$1,339,072 | $490,468 | $67,253 | $484 | ||||
Portfolio turnover (6) |
49.37% | 19.95% | 18.57% | 1.71% | ||||
Total committed capital, end of year |
N/A | N/A | $1,255,119 | $546,720 | ||||
Ratio of total contributed capital to total committed capital, end of year |
N/A | N/A | 40.04% | 20.10% | ||||
- (1)
- The per share data was derived by using the weighted average shares outstanding during the year.
- (2)
- Net change in unrealized appreciation (depreciation) on investments per share may not be consistent with the consolidated statements of operations due to the timing of shareholder transactions.
- (3)
- The per share data for distributions reflects the actual amount of distributions declared during the year.
200
- (4)
- Total return based on net asset value is calculated as the change in net asset value per share during the year, assuming dividends and distributions, including those distributions that have been declared.
- (5)
- The computation of average net assets during the year is based on averaging net assets for the years reported.
- (6)
- Portfolio turnover rate is calculated using the lesser of year-to-date sales or year-to-date purchases over the average of the invested assets at fair value for the years reported. Year-to-date sales and year-to-date purchases for the year ended December 31, 2019 exclude the ABCS distribution transaction.
- (7)
- Net realized gain (loss) includes net realized gain (loss) on investments, net realized loss on forward currency exchange contracts and net realized gain (loss) on foreign currency transactions.
- (8)
- Net change in unrealized appreciation (depreciation) includes net change in unrealized appreciation (depreciation) on investments, net change in unrealized appreciation (depreciation) on forward currency exchange contracts and net change in unrealized appreciation (depreciation) on foreign currency translation.
- (9)
- The sum of quarterly per share amounts presented in previously filed financial statements on Form 10-Q may not equal earnings per share. This is due to changes in the number of weighted average shares outstanding and the effects of rounding.
- (10)
- Net increase in net assets resulting from operations per share in these financial highlights may be different from the net increase in net assets per share on the consolidated statements of operations due to rounding.
- (11)
- Ratio of voluntary incentive fee waiver to average net assets was (0.27%) for the year ended December 31, 2019 (Note 5). Ratio of voluntary management fee waiver to average net assets was (0.81%) for the year ended December 31, 2019 (Note 5). The ratio of net investment income without the voluntary incentive fee waiver and voluntary management fee waiver to average net assets for the year ended December 31, 2019 would be 7.28%. The ratio of total expenses without the voluntary incentive fee waiver and voluntary management fee waiver to average net assets for the year ended December 31, 2019 would be 12.22%. Ratio of voluntary incentive fee waiver to average net assets was 0.25% for the year ended December 31, 2018 (Note 5). Ratio of voluntary management fee waiver to average net assets was 0.20% for the year ended December 31, 2018 (Note 5). The ratio of net investment income without the voluntary incentive fee waiver and voluntary management fee waiver to average net assets for the year ended December 31, 2018 would be 6.75%. The ratio of total expenses without the voluntary incentive fee waiver and voluntary management fee waiver to average net assets for the year ended December 31, 2018 would be 6.02%. No fees were voluntarily waived in the years ending December 31, 2017 and 2016.
- (12)
- Total return based on market value (not annualized) is calculated as the change in market value per share during the period, assuming dividends and distributions, plus the declared distributions, divided by the beginning market price for the period. For the year ended December 31, 2018 the beginning market value per share is based on the IPO price of $20.25. For the year ended December 31, 2018 total return based on market value covers the period November 15, 2018 through December 31, 2018.
Note 13. Selected Quarterly Financial Data (unaudited)
The following are the quarterly results of operations as of and for the years ended December 31, 2019, 2018 and 2017. The operating results for any quarter are not necessarily indicative of results for any future period:
| |
As of and for the Quarter Ended December 31, 2019 |
As of and for the Quarter Ended September 30, 2019 |
As of and for the Quarter Ended June 30, 2019 |
As of and for the Quarter Ended March 31, 2019 |
||||
|---|---|---|---|---|---|---|---|---|
Total investment income |
$54,767 | $52,688 | $50,598 | $39,892 | ||||
Net investment income before taxes |
$21,292 | $21,175 | $21,155 | $21,245 | ||||
Excise tax expense |
$— | $— | $— | $— | ||||
Net investment income after taxes |
$21,292 | $21,175 | $21,155 | $21,245 | ||||
Net realized and unrealized gain (loss) |
59 | $(2,976) | $(1,933) | $18,068 | ||||
Net increase in net assets resulting from operations |
$21,351 | $18,199 | $19,222 | $39,313 | ||||
Net realized and unrealized gain (loss) per share — basic and diluted |
$0.00 | $(0.06) | $(0.04) | $0.35 | ||||
Net increase in net assets resulting from operations per share — basic and diluted |
$0.41 | $0.35 | $0.37 | $0.76 | ||||
Net asset value per share at period end |
$19.72 | $19.71 | $19.77 | $19.81 |
201
| |
As of and for the Quarter Ended December 31, 2018 |
As of and for the Quarter Ended September 30, 2018 |
As of and for the Quarter Ended June 30, 2018 |
As of and for the Quarter Ended March 31, 2018 |
||||
|---|---|---|---|---|---|---|---|---|
Total investment income |
$33,747 | $26,663 | $21,425 | $17,459 | ||||
Net investment income before taxes |
$19,774 | $13,899 | $13,482 | $8,775 | ||||
Excise tax expense |
$— | $— | $— | $— | ||||
Net investment income after taxes |
$19,774 | $13,899 | $13,482 | $8,775 | ||||
Net realized and unrealized gain (loss) |
$(29,646) | $5,092 | $(7,315) | $2,584 | ||||
Net increase (decrease) in net assets resulting from operations |
$(9,872) | $18,991 | $6,167 | $11,359 | ||||
Net realized and unrealized gain (loss) per share — basic and diluted |
$(0.62) | $0.12 | $(0.21) | $0.09 | ||||
Net increase (decrease) in net assets resulting from operations per share — basic and diluted |
$(0.21) | $0.46 | $0.17 | $0.39 | ||||
Net asset value per share at period end |
$19.46 | $20.17 | $20.14 | $20.33 |
| |
As of and for the Quarter Ended December 31, 2017 |
As of and for the Quarter Ended September 30, 2017 |
As of and for the Quarter Ended June 30, 2017 |
As of and for the Quarter Ended March 31, 2017 |
||||
|---|---|---|---|---|---|---|---|---|
Total investment income |
$10,018 | $7,817 | $4,529 | $2,242 | ||||
Net investment income before taxes |
$4,823 | $5,602 | $2,796 | $989 | ||||
Excise tax expense |
$5 | $— | $— | $— | ||||
Net investment income after taxes |
$4,818 | $5,602 | $2,796 | $989 | ||||
Net realized and unrealized gain |
$2,097 | $1,600 | $775 | $623 | ||||
Net increase in net assets resulting from operations |
$6,915 | $7,202 | $3,571 | $1,612 | ||||
Net realized and unrealized gain per share — basic and diluted |
$0.08 | $0.06 | $0.05 | $0.06 | ||||
Net increase in net assets resulting from operations per share — basic and diluted |
$0.28 | $0.29 | $0.21 | $0.15 | ||||
Net asset value per share at period end |
$20.30 | $20.33 | $20.25 | $20.24 |
On January 8, 2020, the Company entered into an amended and restated credit agreement (the "Amendment"), of its BCSF Revolving Credit Facility with Goldman Sachs Bank USA, as Sole Lead Arranger, Syndication Agent and Administrative Agent, and U.S. Bank National Association as Collateral Administrator, Collateral Agent and Collateral Custodian (collectively, the "Credit Facility Parties"), which amended and restated the terms of the Existing Credit Facility. The Amendment amends the Existing Credit Facility to, among other things, modify various financial covenants, including removing a liquidity covenant and adding a net asset value covenant with respect to the Company, as sponsor.
On January 29, 2020, the Company entered into an amended and restated loan and security agreement (the "JPM Credit Agreement" or the "JPM Credit Facility") as Borrower, with JPMorgan Chase Bank, National Association, as Administrative Agent, and Wells Fargo Bank, National Association as Collateral Administrator, Collateral Agent, Securities Intermediary and Bank. The Amended and Restated Loan and Security Agreement amends the Existing Loan and Security Agreement to, among other things, (1) decrease the financing limit under the agreement from $666.6 million to $500.0 million;
202
(2) decrease the minimum facility amount from $466.6 million to $300.0 million period from January 29, 2020 to July 29, 2020 (the minimum facility amount will increase to $350.0 million after July 29, 2020 until the end of the reinvestment period); (3) decrease the interest rate on financing from 2.75% per annum over the applicable London Interbank Offered Rate ("LIBOR") to 2.375% per annum over the applicable LIBOR; (4) extend the scheduled termination date of the agreement from November 29, 2022 to January 29, 2025; and (5) increase the advance rate from 62.5% to 63.5%.
Item 9. Changes in and Disagreements With Accountants on Accounting and Financial Disclosure
None.
Item 9A. Controls and Procedures
Evaluation of Disclosure Controls and Procedures
As of December 31, 2019 (the end of the period covered by this report), our management has carried out an evaluation, under the supervision of and with the participation of our Chief Executive Officer and Chief Financial Officer, of the effectiveness of the design and operation of our disclosure controls and procedures (as defined in Rule 13a-15 and 15d-15(e) under the Exchange Act). Based on that evaluation our Chief Executive Officer and Chief Financial Officer have concluded that our current disclosure controls and procedures are effective to provide reasonable assurance that information required to be disclosed by us in the reports we file or submit under the Exchange Act is recorded, processed, summarized and reported within the time periods specified in the SEC's rules and forms, and that such information is accumulated and communicated to our Chief Executive Officer and Chief Financial Officer as appropriate to allow timely decisions regarding required disclosure. In designing and evaluating our disclosure controls and procedures, management recognizes that any controls and procedures, no matter how well designed and operated, can provide only reasonable assurance of achieving their objectives, and management necessarily applies its judgment in evaluating the benefits of possible controls and procedures relative to their costs.
Changes in Internal Controls Over Financial Reporting
There have been no changes in our internal control over financial reporting, as defined in Rules 13a-15(f) and 15d-15(f) under the Exchange Act, that occurred during our most recently completed fiscal quarter ended December 31, 2019 that have materially affected, or are reasonably likely to materially affect, our internal control over financial reporting.
Management's Report on Internal Control Over Financial Reporting
Management is responsible for establishing and maintaining adequate internal control over financial reporting (as defined in Rules 13a-15(f) and 15d-15(f) of the Exchange Act). Internal control over financial reporting is a process designed to provide reasonable assurance regarding the reliability of financial reporting and the preparation of financial statements for external purposes in accordance with generally accepted accounting principles.
Management assessed the effectiveness of our internal control over financial reporting at December 31, 2019. In making this assessment, we used criteria set forth in Internal Control—Integrated Framework (2013) issued by the Committee of Sponsoring Organizations of the Treadway Commission (2013 COSO Framework). Based on our assessment, management concluded that, at December 31, 2019, our internal control over financial reporting is effective.
203
Because of its inherent limitations, internal control over financial reporting may not prevent or detect misstatements. Also, projections of any evaluation of effectiveness to future periods are subject to the risk that controls may become inadequate because of changes in conditions, or that the degree of compliance with policies or procedures may deteriorate.
The effectiveness of our internal control over financial reporting as of December 31, 2019 has been audited by PricewaterhouseCoopers LLP, an independent registered public accounting firm, as stated in their report which appears herein.
None.
204
Item 10. Directors, Executive Officers and Corporate Governance
The information required by Item 10 is hereby incorporated by reference from our definitive Proxy Statement relating to our 2020 Annual Meeting of Stockholders, to be filed with the SEC within 120 days following the end of our fiscal year.
Item 11. Executive Compensation
The information required by Item 11 is hereby incorporated by reference from our definitive Proxy Statement relating to our 2020 Annual Meeting of Stockholders, to be filed with the SEC within 120 days following the end of our fiscal year.
Item 12. Security Ownership of Certain Beneficial Owners and Management and Related Stockholder Matters
The information required by Item 12 is hereby incorporated by reference from our definitive Proxy Statement relating to our 2020 Annual Meeting of Stockholders, to be filed with the SEC within 120 days following the end of our fiscal year.
Item 13. Certain Relationships and Related Transactions, and Director Independence
The information required by Item 13 is hereby incorporated by reference from our definitive Proxy Statement relating to our 2020 Annual Meeting of Stockholders, to be filed with the SEC within 120 days following the end of our fiscal year.
Item 14. Principal Accounting Fees and Services
The information required by Item 14 is hereby incorporated by reference from our definitive Proxy Statement relating to our 2020 Annual Meeting of Stockholders, to be filed with the SEC within 120 days following the end of our fiscal year.
205
Item 15. Exhibits, Financial Statement Schedules
The following exhibits are included, or incorporated by reference, in this Annual Report on Form 10-K for the year ended December 31, 2019 (and are numbered in accordance with Item 601 of Regulation S-K under the Securities Act).
206
207
208
- *
- Filed herewith
Not Applicable.
209
Pursuant to the requirements of the Securities Exchange Act of 1934, the registrant has duly caused this report to be signed on its behalf by the undersigned, thereunto duly authorized.
| Bain Specialty Capital Finance, Inc. | ||||
Date: February 26, 2020 |
By: |
/s/ Michael A. Ewald |
||
| Name: | Michael A. Ewald | |||
| Title: | Chief Executive Officer | |||
Date: February 26, 2020 |
By: |
/s/ Sally F. Dornaus |
||
| Name: | Sally F. Dornaus | |||
| Title: | Chief Financial Officer | |||
Pursuant to the requirements of the Securities Exchange Act of 1934, this report has been signed below by the following persons on behalf of the registrant and in the capacities and on the dates indicated:
Signature
|
Title
|
Date
|
||
|---|---|---|---|---|
| /s/ MICHAEL A. EWALD Michael A. Ewald |
Director, President & Chief Executive Officer | February 26, 2020 | ||
/s/ SALLY F. DORNAUS Sally F. Dornaus |
Chief Financial Officer |
February 26, 2020 |
||
/s/ JEFFREY B. HAWKINS Jeffrey B. Hawkins |
Director & Chairman |
February 26, 2020 |
||
/s/ AMY BUTTE Amy Butte |
Director |
February 26, 2020 |
||
/s/ DAVID G. FUBINI David G. Fubini |
Director |
February 26, 2020 |
||
/s/ THOMAS A. HOUGH Thomas A. Hough |
Director |
February 26, 2020 |
||
/s/ JAY MARGOLIS Jay Margolis |
Director |
February 26, 2020 |
||
/s/ CLARE RICHER Clare Richer |
Director |
February 26, 2020 |
210