Attached files
| file | filename |
|---|---|
| EX-32.2 - EXHIBIT 32.2 - HEIDRICK & STRUGGLES INTERNATIONAL INC | hsii-123119xex322.htm |
| EX-32.1 - EXHIBIT 32.1 - HEIDRICK & STRUGGLES INTERNATIONAL INC | hsii-123119xex321.htm |
| EX-31.2 - EXHIBIT 31.2 - HEIDRICK & STRUGGLES INTERNATIONAL INC | hsii-123119xex312.htm |
| EX-31.1 - EXHIBIT 31.1 - HEIDRICK & STRUGGLES INTERNATIONAL INC | hsii-123119xex311.htm |
| EX-23.02 - EXHIBIT 23.02 - HEIDRICK & STRUGGLES INTERNATIONAL INC | hsii-123119x10kexhibit2302.htm |
| EX-23.01 - EXHIBIT 23.01 - HEIDRICK & STRUGGLES INTERNATIONAL INC | hsii-123119x10kexhibit2301.htm |
| EX-21.01 - EXHIBIT 21.01 - HEIDRICK & STRUGGLES INTERNATIONAL INC | hsii-123119x10kexhibit2101.htm |
| EX-10.53 - EXHIBIT 10.53 - HEIDRICK & STRUGGLES INTERNATIONAL INC | hsii-123119xex10.htm |
| EX-4.02 - EXHIBIT 4.02 - HEIDRICK & STRUGGLES INTERNATIONAL INC | hsii-123119x10kexhibit41.htm |
UNITED STATES
SECURITIES AND EXCHANGE COMMISSION
WASHINGTON, D.C. 20549
FORM 10-K
x ANNUAL REPORT PURSUANT TO SECTION 13 OR 15(d) OF THE SECURITIES EXCHANGE ACT OF 1934
For the fiscal year ended December 31, 2019
OR
¨ TRANSITION REPORT PURSUANT TO SECTION 13 OR 15(d) SECURITIES EXCHANGE ACT OF 1934
Commission File No. 0-25837
HEIDRICK & STRUGGLES INTERNATIONAL, INC.
(Exact Name of Registrant as Specified in its Charter)
Delaware | 36-2681268 | |
(State or Other Jurisdiction of Incorporation or Organization) | (I.R.S. Employer Identification Number) | |
233 South Wacker Drive, Suite 4900, Chicago, Illinois 60606-6303
(Address of principal executive offices) (Zip Code)
(312) 496-1200
(Registrant’s telephone number, including area code)
Securities registered pursuant to Section 12(b) of the Act:
Title of Each Class | Trading Symbol | Name of Each Exchange On Which Registered | ||
Common Stock, $0.01 par value | HSII | Nasdaq Stock Market LLC (Nasdaq Global Stock Market) | ||
Securities registered pursuant to Section 12(g) of the Act: None
Indicate by check mark if the registrant is a well-known seasoned issuer as defined in Rule 405 of the Securities Act. Yes ¨ No x
Indicate by check mark if the registrant is not required to file reports pursuant to Section 13 of Section 15(d) of the Act. Yes ¨ No x
Indicate by check mark whether the registrant (1) has filed all reports required to be filed by Section 13 or 15(d) of the Securities Exchange Act of 1934 during the preceding 12 months (or for such shorter period that the registrant was required to file such reports), and (2) has been subject to such filing requirements for the past 90 days. Yes x No ¨
Indicate by check mark whether the registrant has submitted electronically every Interactive Data File required to be submitted pursuant to Rule 405 of Regulation S-T (§232.405 of this chapter) during the preceding 12 months (or for such shorter period that the Registrant was required to submit such files). Yes x No ¨
Indicate by check mark whether the registrant is a large accelerated filer, an accelerated filer, a non-accelerated filer, smaller reporting company, or an emerging growth company. See definitions of “large accelerated filer,” “accelerated filer," “smaller reporting company," and "emerging growth company" in Rule 12b-2 of the Exchange Act.
Large accelerated filer | ¨ | Accelerated filer | x | ||
Non-Accelerated filer | ¨ | Smaller reporting company | ¨ | ||
Emerging growth company | ¨ | ||||
If an emerging growth company, indicate by check mark if the registrant has elected not to use the extended transition period for complying with any new or revised financial accounting standards provided pursuant to Section 13(a) of the Exchange Act. ¨
Indicate by check mark whether the registrant is a shell company (as defined in Rule 12b-2 of the Exchange Act). Yes ¨ No x
The aggregate market value of the registrant’s Common Stock held by non-affiliates (excludes shares held by executive officers, directors and beneficial owners of 10% or more of the registrant’s outstanding Common Stock) on June 28, 2019 was approximately $484,944,428 based upon the closing market price of $29.97 on that date of a share of Common Stock as reported on the Nasdaq Global Stock Market. As of February 21, 2020, there were 19,170,352 shares of the registrant's Common Stock outstanding.
DOCUMENTS INCORPORATED BY REFERENCE
Portions of the registrant’s definitive Proxy Statement for its Annual Meeting of Stockholders to be held on May 28, 2020, are incorporated by reference into Part III of this Form 10-K.
HEIDRICK & STRUGGLES INTERNATIONAL, INC. AND SUBSIDIARIES
TABLE OF CONTENTS
PAGE | ||
Item 1. | ||
Item 1A. | ||
Item 1B. | ||
Item 2. | ||
Item 3. | ||
Item 4. | ||
Item 5. | ||
Item 6. | ||
Item 7. | ||
Item 7A. | ||
Item 8. | ||
Item 9. | ||
Item 9A. | ||
Item 9B. | ||
Item 10. | ||
Item 11. | ||
Item 12. | ||
Item 13. | ||
Item 14. | ||
Item 15. | ||
2
PART I
ITEM 1. BUSINESS
Overview
Heidrick & Struggles International, Inc. (“Heidrick & Struggles”) is a leadership advisory firm providing executive search and consulting services to businesses and business leaders worldwide. When we use the terms “Heidrick & Struggles,” “the Company,” “we,” “us” and “our,” in this Form 10-K, we mean Heidrick & Struggles International, Inc. a Delaware corporation, and its consolidated subsidiaries. We provide our services to a broad range of clients through the expertise of over 450 consultants located in major cities around the world. Heidrick & Struggles and its predecessors have been a leadership advisor for more than 60 years. Heidrick & Struggles was formed as a Delaware corporation in 1999 when two of our predecessors merged to form Heidrick & Struggles.
Our service offerings include the following:
Executive Search. We partner with respected organizations globally to build and sustain the best leadership teams in the world, with a specialized focus on the placement of top-level senior executives. We believe focusing on top-level senior executives provides the opportunity for several competitive advantages including access to and influence with key decision makers, increased potential for recurring search and consulting engagements, higher fees per search, enhanced brand visibility, and a leveraged global footprint. Working at the top of client organizations also facilitates the attraction and retention of high-caliber consultants who desire to serve top industry executives and their leadership needs. Our executive search services derive revenue through the fees generated for each search engagement, which generally are based on the annual compensation for the placed executive. We provide our executive search services primarily on a retained basis, recruiting senior executives whose first-year base salary and bonus averaged approximately $396,000 in 2019 on a worldwide basis.
The executive search industry is highly fragmented, consisting of several thousand executive search firms worldwide. Executive search firms are generally separated into two broad categories: retained search and contingency search. Retained executive search firms fulfill their clients’ senior leadership needs by identifying potentially qualified candidates and assisting clients in evaluating and assessing these candidates. Retained executive search firms generally are compensated for their services regardless of whether the client employs a candidate identified by the search firm and are generally retained on an exclusive basis. Typically, retained executive search firms are paid a retainer for their services equal to approximately one-third of the estimated first year compensation for the position to be filled. In addition, if the actual compensation of a placed candidate exceeds the estimated compensation, executive search firms often are authorized to bill the client for one-third of the excess. In contrast, contingency search firms are compensated only upon successfully placing a recommended candidate.
We are a retained executive search firm. Our search process typically consists of the following steps:
• | Analyzing the client’s business needs in order to understand its organizational structure, relationships and culture, advising the client as to the required set of skills and experiences for the position, and identifying with the client the other characteristics desired of the successful candidate; |
• | Selecting, contacting, interviewing and evaluating candidates on the basis of experience and potential cultural fit with the client organization; |
• | Presenting confidential written reports on the candidates who potentially fit the position specification; |
• | Scheduling a mutually convenient meeting between the client and each candidate; |
• | Completing reference checks on the final candidate selected by the client; and |
• | Assisting the client in structuring compensation packages and supporting the successful candidate’s integration into the client team. |
Heidrick Consulting. In 2018, we combined our Leadership Consulting and Culture Shaping businesses to create Heidrick Consulting, a comprehensive offering of the firm's leadership advisory services. Our consulting services include leadership assessment and development, executive coaching and on-boarding, succession planning, team and board effectiveness, organizational performance acceleration, workforce planning and culture shaping. Our consulting services generate revenue
3
primarily through the professional fees generated for each engagement which are generally based on the size of the project and scope of services. Heidrick Consulting represented less than 10% of our net revenue in 2019.
Client Base
For many of our clients, our global access to and knowledge of regional and functional markets and candidate talent is an important differentiator of our business. Our clients generally fall into one of the following categories:
• | Fortune 1000 companies; |
• | Major U.S. and non-U.S. companies; |
• | Middle market and emerging growth companies; |
• | Governmental, higher education and not-for-profit organizations; and |
• | Other leading private and public entities. |
Available Information
We maintain an Internet website at http://www.heidrick.com. We make available free of charge through the investor relations section of our website annual reports on Form 10-K, quarterly reports on Form 10-Q and current reports on Form 8-K and amendments to those reports filed or furnished pursuant to Section 13(a) or 15(d) of the U.S. Securities Exchange Act of 1934 ("Exchange Act"), as well as proxy statements, as soon as reasonably practicable after we electronically file such material with, or furnish it to, the U.S. Securities and Exchange Commission (“SEC”). Also posted on our website, and available in print upon request of any shareholder to our Investor Relations Officer, are our certificate of incorporation and by-laws, charters for our Audit and Finance Committee, Human Resources and Compensation Committee and Nominating and Board Governance Committee, our Policy Regarding Director Independence Determinations, our Policy on Reporting of Concerns Regarding Accounting and Other Matters, our Corporate Governance Guidelines and our Code of Business Conduct and Ethics governing our directors, officers and employees. Within the time period required by the SEC, we will post on our website any amendment to the Code of Business Conduct and Ethics and any waiver applicable to any executive officer, director or senior financial officer.
In addition, our website includes information concerning purchases and sales of our equity securities by our executive officers and directors, as well as disclosure relating to certain non-GAAP financial measures (as defined in the SEC’s Regulation G) that we may make public orally, telephonically, by webcast, by broadcast or by similar means from time to time.
Our Investor Relations Officer can be contacted at Heidrick & Struggles International, Inc., 233 South Wacker Drive, Suite 4900, Chicago, Illinois, 60606, Attn: Investor Relations Officer, telephone: 312-496-1200,
e-mail: InvestorRelations@heidrick.com.
Organization
Our organizational structure, which is arranged by geography, service offering and industry and functional practices, is designed to enable us to better understand our clients’ cultures, operations, business strategies, industries and regional markets for leadership talent.
Geographic Structure. We provide senior-level executive search and consulting services to our clients worldwide through a network of 54 offices in 28 countries. Each office size varies; however, major locations are staffed with consultants, research associates, administrative assistants and other support staff. Administrative functions are centralized where possible, although certain support and research functions are situated regionally because of variations in local requirements. We face risks associated with managing global operations, social and political instability, legal and regulatory requirements, potential adverse tax consequences and currency fluctuations in our international operations. For a more complete description of the risks associated with our business see the Section in this Form 10-K entitled “Item 1A - Risk Factors”.
In addition to our wholly owned subsidiaries, our worldwide network includes affiliate relationships in Finland, South Africa and Turkey. We have no financial investment in these affiliates but receive licensing fees from them for the use of our name and our databases. Licensing fees are less than 1% of our net revenue.
4
Segment Information. We operate our Executive Search services in three geographic regions, each of which is reported as a separate reporting segment: the Americas (which includes the countries in North and South America); Europe (which includes the continents of Europe and Africa); and Asia Pacific (which includes Asia and the region generally known as the Middle East). Our Heidrick Consulting reporting segment operates globally.
Americas Executive Search. As of December 31, 2019, we had 200 consultants in our Americas segment. The largest offices in this segment, as defined by net revenue, are located in New York, Chicago, and Boston.
Europe Executive Search. As of December 31, 2019, we had 107 consultants in our Europe segment. The largest countries in this segment, as defined by net revenue, are the United Kingdom, France, and Germany.
Asia Pacific Executive Search. As of December 31, 2019, we had 73 consultants in our Asia Pacific segment. The largest countries in this segment, as defined by net revenue, are China (including Hong Kong), Australia, and Dubai.
Heidrick Consulting. As of December 31, 2019, we had 71 consultants in our Heidrick Consulting segment. The largest countries in this segment, as defined by net revenue, are the United States, the United Kingdom, and Dubai.
The relative percentages of net revenue attributable to each segment were as follows:
Year Ended December 31, | |||||||||
2019 | 2018 | 2017 | |||||||
Executive Search | |||||||||
Americas | 58 | % | 57 | % | 55 | % | |||
Europe | 19 | % | 20 | % | 20 | % | |||
Asia Pacific | 14 | % | 14 | % | 14 | % | |||
Heidrick Consulting | 9 | % | 9 | % | 11 | % | |||
For financial information relating to each segment, see Note 18, Segment Information, in the Notes to Consolidated Financial Statements.
Global Industry Practices. Our executive search and consulting businesses operate in six broad industry practices listed below. These industry practices and their relative sizes, as measured by billings for 2019, 2018 and 2017, are as follows:
Percentage of Billings | |||||||||
Global Industry Practices | 2019 | 2018 | 2017 | ||||||
Financial Services | 26 | % | 28 | % | 27 | % | |||
Industrial | 21 | 21 | 18 | ||||||
Global Technology & Services | 21 | 20 | 22 | ||||||
Consumer Markets | 17 | 16 | 17 | ||||||
Healthcare & Life Sciences | 12 | 11 | 12 | ||||||
Education, Non-Profit & Social Enterprise | 3 | 4 | 4 | ||||||
100 | % | 100 | % | 100 | % | ||||
Within each broad industry practice are a number of industry sub-sectors. Consultants often specialize in one or more sub-sectors to provide clients with market intelligence and candidate knowledge specific to their industry. For example, within the Financial Services sector, our business is diversified amongst a number of industry sub-sectors including Asset & Wealth Management, Consumer & Commercial Finance, Commodities, Corporate and Transaction Banking, Global Markets, Hedge Fund, Infrastructure, Investment Banking, Insurance, Private Equity Investment Professionals and Real Estate.
We service our clients with global industry interests and needs through unified global executive search teams who specialize in industry practices. This go-to-market strategy allows us to leverage our global diversity and market intelligence and is designed to provide better client service. Each client is served by one global account team, which we believe is a key differentiator from our competition.
Global Functional Practices. Our Executive Search consultants also specialize in searches for specific “C-level” functional positions, which are roles that generally report directly to the chief executive officer.
5
Our Global Functional Practices include Chief Executive Officer & Board of Directors; Human Resources Officers, Financial Officers; Information and Technology Officers, Legal, Risk, Compliance & Government Affairs, Marketing, Sales and Strategy Officers and Supply Chain and Operations.
Our team of Executive Search consultants may service clients from any one of our offices around the world. For example, an executive search for a chief financial officer of an industrial company located in the United Kingdom may involve an executive search consultant in the United Kingdom with an existing relationship with the client, another executive search consultant in the United States with expertise in our Industrial practice and a third executive search consultant with expertise in recruiting chief financial officers. This same industrial client may also engage us to perform skill-based assessments for each of its senior managers, which could require the expertise of one of our leadership advisory consultants trained in this service.
Seasonality
There is no discernible seasonality in our business, although as a percentage of total annual net revenue, the first quarter typically generates less revenue than the other three quarters. Revenue and operating income have historically varied by quarter and are hard to predict from quarter to quarter. In addition, the volatility in the global economy and business cycles can impact our quarterly revenue and operating income.
Clients and Marketing
Our consultants market the firm’s executive search and consulting services through two principal means: targeted client calling and industry networking with clients and referral sources. These efforts are supported by proprietary databases, which provide our consultants with information as to contacts made by their colleagues with particular referral sources, candidates and clients. In addition, we benefit from a significant number of referrals generated by our reputation for high quality service and successfully completed assignments, as well as repeat business resulting from our ongoing client relationships.
In support of client calling and networking, the practice teams as well as individual consultants also author and publish articles and white papers on a variety of leadership and talent topics and trends around the world. Our consultants often present research findings and talent insights at notable conferences and events as well. Our insights are sometimes acknowledged by major media outlets and trade journalists. These efforts aid in the marketing of our services as well.
Either by agreement with the clients or to maintain strong client relationships, we may refrain from recruiting employees of a client, or possibly other entities affiliated with that client, for a specified period of time but typically not more than one year from the commencement of a search. We seek to mitigate any adverse effects of these off-limits arrangements by strengthening our long-term relationships, allowing us to communicate our belief to prospective clients that we can conduct searches effectively notwithstanding certain off-limits arrangements.
No single client accounted for more than 2% of our net revenue in 2019, and no more than 3% in 2018 or 2017. As a percentage of total revenue, our top ten clients in aggregate accounted for approximately 7% in 2019, 6% in 2018, and 7% in 2017.
Information Management Systems
We rely on technology to support our consultants and staff in the search process. Our technology infrastructure consists of internally developed databases containing candidate profiles and client records, coupled with online services, industry reference sources, and Leadership Signature, an internally developed assessment tool. We use technology to manage and share information on current and potential clients and candidates, to communicate to both internal and external constituencies and to support administrative functions.
Our consulting business’ proprietary Web-based system, Culture Connect, is integral to the culture-shaping process. This technology platform enables our consultants to administer, analyze and interpret online Corporate Culture Profiles™ surveys to develop clarity around team and organizational need and desired outcomes. In addition, we gather data using our online Culture Impact Survey™ to determine which culture-shaping concepts are being utilized by individuals and the team as a whole.
Professional Staff and Employees
Our professionals are generally categorized either as consultants or associates. Associates assist consultants by providing research support, coordinating candidate contact and performing other engagement-related functions. As of December 31, 2019, we had a headcount of 1,780, consisting of 451 consultants (380 related to Executive Search and 71 related to Heidrick Consulting), 591 associates and 738 other search, support and Global Operations Support staff.
6
We promote our associates to consultants during the annual consultant promotion process, and we recruit our consultants from other executive search or human capital firms, or in the case of Executive Search, consultants new to search who have worked in industries or functions represented by our practices. In the latter case, these are often seasoned executives with extensive contacts and outstanding reputations who are entering the search profession as a second career and whom we train in our techniques and methodologies. Our Heidrick Consulting consultants are recruited for their executive business experience as well as their skills in consulting and leadership advisory and often are former clients who are familiar with our consulting methodology. We are not a party to any U.S.-based collective bargaining agreement, and we consider relations with our employees to be good.
Competition
The executive search industry is highly competitive. While we face competition to some degree from all firms in the industry, we believe our most direct competition comes from four established global retained executive search firms that conduct searches primarily for the most senior-level positions within an organization. In particular, our competitors include Egon Zehnder International, Korn Ferry, Russell Reynolds Associates, and Spencer Stuart. To a lesser extent, we also face competition from smaller boutique firms that specialize in certain regional markets or industry segments and Internet-based firms. Each firm with which we compete is also a competitor in the marketplace for effective search consultants.
Overall, the search industry has relatively few barriers to entry; however, there are higher barriers to entry to compete with global retained executive search firms that can provide leadership consulting services at the senior executive level. At this level, clients rely more heavily on a search firm’s reputation, global access and the experience level of its consultants. We believe that the segment of executive search in which we compete is more quality-sensitive than price-sensitive. As a result, we compete on the level of service we offer, reflected by our client services specialties and, ultimately, by the quality of our search results. We believe that our emphasis on senior-level executive search, the depth of experience of our search consultants and our global presence enable us to compete favorably with other executive search firms.
Competition in the leadership consulting markets in which we operate is highly fragmented, with no universally recognized market leaders.
Regulation
We are subject to the U.S. securities laws and general corporate and commercial laws and regulations of the locations which we serve. These include regulations regarding anti-bribery, privacy and data protection, intellectual property, data security, data retention, personal information, economic or other trade prohibitions or sanctions. In particular, we are subject to federal, state, and foreign laws regarding privacy and protection of people's data. In the U.S., California has adopted the California Consumer Privacy Act of 2018 (“CCPA”), which became effective January 1, 2020 and which provides a new private right of action for data breaches and requires companies that process information on California residents to make new disclosures to consumers about their data collection, use and sharing practices and allow consumers to opt out of certain data sharing with third parties. In addition, several other U.S. states are considering adopting laws and regulations imposing obligations regarding the handling of personal data. Foreign data protection, privacy, and other laws and regulations can be more restrictive than those in the United States. Most notably, certain aspects of our business are subject to the European Union's General Data Protection Regulation ("GDPR") which became effective on May 25, 2018. We have a GDPR compliance program to facilitate our ongoing efforts to comply with GDPR regulations. U.S. federal and state and foreign laws and regulations, which in some cases can be enforced by private parties in addition to government entities, are constantly evolving and can be subject to change.
ITEM 1A. RISK FACTORS
In addition to other information in this Form 10-K, the following risk factors should be carefully considered in evaluating our business because such factors may have a material impact on our business, operating results, cash flows and financial condition. The risks and uncertainties described below are not the only ones we face. Additional risks and uncertainties of which we are unaware, or that we currently believe are not material, may also become important factors that adversely affect our business.
We depend on attracting, integrating, developing, managing, and retaining qualified consultants and senior leaders.
Our success depends upon our ability to attract, integrate, develop, manage and retain quality consultants with the skills and experience necessary to fulfill our clients’ needs and achieve our operational and financial goals. Our ability to hire and retain qualified consultants could be impaired by any diminution of our reputation, disparity in compensation relative to our competitors, modifications to our total compensation philosophy or competitor hiring programs. If we cannot attract, hire, develop and retain qualified consultants, our business, financial condition and results of operations may suffer. Our future success also depends upon our ability to integrate newly hired consultants successfully into our operations and to manage the performance of our consultants.
7
Failure to successfully integrate newly hired consultants or to manage the performance of our consultants could affect our profitability by causing operating inefficiencies that could increase operating expenses and reduce operating income. There is also a risk that unanticipated turnover in senior leadership could stall company activity, interrupt strategic vision or lower productive output which may adversely affect our business, financial condition and results of operations.
We may not be able to prevent our consultants from taking our clients with them to another firm.
Our success depends upon our ability to develop and maintain strong, long-term relationships with our clients. Although we work on building these relationships between our firm and our clients, in many cases one or two consultants have primary responsibility for a client relationship. When a consultant leaves one executive search firm and joins another, clients who have established relationships with the departing consultant may move their business to the consultant’s new employer. We may also lose clients if the departing consultant has widespread name recognition or a reputation as a specialist in executing searches in a specific industry or management function. If we fail to retain important client relationships when a consultant departs our firm, our business, financial condition and results of operations may be adversely affected.
Our success depends on our ability to maintain our professional reputation and brand name.
We depend on our overall professional reputation and brand name recognition to secure new engagements and hire qualified consultants. Our success also depends on the individual reputations of our consultants. We obtain many of our new engagements from existing clients or from referrals by those clients. A client who is dissatisfied with our work can adversely affect our ability to secure new engagements. If any factor, including poor performance, hurts our reputation we may experience difficulties in competing successfully for both new engagements and qualified consultants. Failure to maintain our professional reputation and brand name could adversely affect our business, financial condition and results of operations.
Our net revenue may be affected by adverse economic conditions.
Demand for our services is affected by global economic conditions and the general level of economic activity in the geographic regions in which we operate. During periods of slowed economic activity many companies hire fewer permanent employees, and our business, financial condition and results of operations may be adversely affected. If unfavorable changes in economic conditions occur, our business, financial condition and results of operations could suffer.
Because our clients may restrict us from recruiting their employees, we may be unable to fill or obtain new executive search assignments.
Clients frequently require us to refrain from recruiting certain of their employees when conducting executive searches on behalf of other clients. These restrictions generally remain in effect for no more than one year following the commencement of an engagement. However, the specific duration and scope of the off-limits arrangements depend on the length of the client relationship, the frequency with which the client engages us to perform searches, the number of assignments we have performed for the client and the potential for future business with the client.
Client restrictions on recruiting their employees could hinder us from fulfilling executive searches. Additionally, if a prospective client believes that we are overly restricted from recruiting the employees of our existing clients, these prospective clients may not engage us to perform their executive searches. As a result, our business, financial condition and results of operations may suffer.
We face aggressive competition.
The global executive search industry is highly competitive and fragmented. We compete with other large global executive search firms, smaller specialty firms and, more recently with Internet-based firms and social media. Specialty firms may focus on regional or functional markets or on particular industries to a greater extent than we do. Some of our competitors may possess greater resources, greater name recognition and longer operating histories than we do in particular markets or practice areas, or be willing to reduce their fees or agree to alternative pricing practices in order to attract clients and increase market share. Our competitors may be further along in the development and design of technological solutions to meet client requirements.
There are limited barriers to entry into the search industry and new search firms continue to enter the market. Executive search firms that have a smaller client base than we do may be subject to fewer off-limits arrangements. In addition, our clients or prospective clients may decide to perform executive searches using in-house personnel. Also, as Internet-based firms continue to evolve, they may develop offerings similar to or more expansive than ours, thereby increasing competition for our services or more broadly disrupting the executive search industry. As a result, we may not be able to continue to compete effectively with existing or potential competitors and we may not be able to implement our leadership strategy effectively. Our inability to meet these competitive challenges could have an adverse effect on our business, financial condition and results of operations.
8
We rely heavily on information management systems.
Our success depends upon our ability to store, retrieve, process and manage substantial amounts of information. To achieve our goals, we must continue to improve and upgrade our information management systems. We may be unable to license, design and implement, in a cost-effective and timely manner, improved information systems that allow us to compete effectively. In addition, business process reengineering efforts may result in a change in software platforms and programs. Such efforts may result in an acceleration of depreciation expense over the shortened expected remaining life of the software and present transitional problems. Problems or issues with our proprietary search system or other factors may result in interruptions or loss in our information processing capabilities which may adversely affect our business, financial condition and results of operations.
We face the risk of liability in the services we perform.
We are exposed to potential claims with respect to the executive search process. A client could assert a claim for violations of off-limits arrangements, breaches of confidentiality agreements or professional malpractice. The growth and development of our consulting services brings with it the potential for new types of claims. In addition, candidates and client employees could assert claims against us. Possible claims include failure to maintain the confidentiality of the candidate’s employment search or for discrimination or other violations of the employment laws or malpractice. In various countries, we are subject to data protection laws impacting the processing of candidate information. We maintain professional liability insurance in amounts and coverage that we believe are adequate; however, we cannot guarantee that our insurance will cover all claims or that coverage will always be available. Significant uninsured liabilities could have a negative impact on our business, financial condition and results of operations.
Data security, data privacy and data protection laws, such as GDPR and CCPA , and other evolving regulations and cross-border data transfer restrictions, may limit the use of our services and adversely affect our business.
We are or may become subject to a variety of laws and regulations in the European Union (including GDPR), United States (including CCPA) and abroad regarding data privacy, protection and security. As these laws continue to evolve, we may be required to make changes to, or eliminate altogether of, our services, solutions and/or products so as to enable the Company and/or our clients to meet the new legal requirements, including by taking on more onerous obligations in our contracts, limiting or eliminating our storage, transfer and processing of data and, in some cases, limiting or eliminating our service and/or solution offerings in certain locations. Changes in these laws may also increase our potential exposure through significantly higher potential penalties for non-compliance or limitations on the use or transfer of data. The costs of compliance with, and other burdens imposed by, such laws and regulations and client demands in this area may limit the use of, or demand for, our services, solutions and/or products, make it more difficult and costly to meet client expectations, or lead to significant fines, penalties or liabilities for noncompliance, any of which could adversely affect our business, financial condition and results of operations.
In addition, due to the uncertainty and potentially conflicting interpretations of these laws, it is possible that such laws and regulations may be interpreted and applied in a manner that is inconsistent from one jurisdiction to another and may conflict with other rules or our practices. Any failure or perceived failure by us to comply with applicable laws or satisfactorily protect personal information could result in governmental enforcement actions, litigation, or negative publicity, any of which could inhibit sales of our services, solutions and/or products.
Our multinational operations may be adversely affected by social, political, regulatory, legal and economic, and public health risks.
We generate substantial revenue outside the United States. We offer our services through a global network of offices around the world. Our ability to effectively serve our clients is dependent upon our ability to successfully leverage our operating model across our existing and any future locations, maintain effective management controls over all of our locations to ensure, among other things, compliance with applicable laws, rules and regulations, and instill our core values in all of our personnel at each of these and any future locations. We are exposed to the risk of changes in social, political, legal and economic conditions inherent in our operations, which could have a significant impact on our business, financial condition and results of operations. In addition, we conduct business in countries where the legal systems, local laws and trade practices are unsettled and evolving. Commercial laws in these countries are sometimes vague, arbitrary and inconsistently applied. Under these circumstances, it is difficult for us to determine at all times the exact requirements of such local laws. If we fail to comply with local laws, our business, financial condition and results of operations could suffer. In addition, the global nature of our operations poses challenges to our management, and financial and accounting systems. Failure to meet these challenges could adversely affect our business, financial condition and results of operations. We could also be adversely affected by a public health epidemic, including the recent outbreak of coronavirus in China. Consequences of the coronavirus outbreak have included disruptions or restrictions on our ability to travel and temporary closures our China offices. Our business, financial condition and results of operations could suffer to the extent that the coronavirus outbreak harms the Chinese economy in general.
9
A significant currency fluctuation between the U.S. dollar and other currencies could adversely impact our operating income.
With our operations in the Americas, Europe and Asia Pacific, we conduct business using various currencies. In 2019, approximately 40% of our net revenue was generated outside the United States. As we typically transact business in the local currency of our subsidiaries, our profitability may be impacted by the translation of foreign currency financial statements into U.S. dollars. Significant long-term fluctuations in relative currency values, in particular an increase in the value of the U.S. dollar against foreign currencies, could have an adverse effect on our business, financial condition and results of operations.
We may not be able to align our cost structure with net revenue.
We must ensure that our costs and workforce continue to be in proportion to demand for our services. Failure to align our cost structure and headcount with net revenue could adversely affect our business, financial condition and results of operations.
Unfavorable tax law changes and tax authority rulings may adversely affect results.
We are subject to income taxes in the United States and in various foreign jurisdictions. Domestic and international tax liabilities are subject to the allocation of income among various tax jurisdictions. Our effective tax rate could be adversely affected by changes in the mix of earnings among countries with differing statutory tax rates, or changes in the valuation allowance of deferred tax assets or tax laws. The amount of income taxes and other taxes are subject to ongoing audits by U.S. federal, state and local tax authorities and by non-U.S. authorities. If these audits result in assessments different from amounts recorded, future financial results may include unfavorable tax adjustments.
We may not be able to generate sufficient profits to realize the benefit of our net deferred tax assets.
We establish valuation allowances against deferred tax assets when there is insufficient evidence that we will be able to realize the benefit of these deferred tax assets. We reassess our ability to realize deferred tax assets as facts and circumstances dictate. If after future assessments of our ability to realize the deferred tax assets we determine that a lesser or greater allowance is required, we record a reduction or increase to the income tax expense and the valuation allowance in the period of such determination. The uncertainty surrounding the future realization of our net deferred tax assets could adversely impact our financial condition and results of operations.
We may experience impairment of our goodwill, other intangible assets and other long-lived assets.
In accordance with generally accepted accounting principles, we perform assessments of the carrying value of our goodwill at least annually, and we review our goodwill, other intangible assets and other long-lived assets for impairment whenever events occur or circumstances indicate that a carrying amount of these assets may not be recoverable. These events and circumstances include a significant change in business climate, attrition of key personnel, changes in financial condition or results of operations, a prolonged decline in our stock price and market capitalization, competition, and other factors. In performing these assessments, we must make assumptions regarding the estimated fair value of our goodwill and other intangible assets. These assumptions include estimates of future market growth and trends, forecasted revenue and costs, capital investments, discount rates, and other variables. If the fair market value of one of our reporting units or other long-term assets is less than the carrying amount of the related assets, we would be required to record an impairment charge. Due to continual changes in market and general business conditions, we cannot predict whether, and to what extent, our goodwill and long-lived intangible assets may be impaired in future periods. Any resulting impairment loss could have an adverse impact on our business, financial condition and results of operations.
Our ability to execute and integrate future acquisitions, if any, could negatively affect our business and profitability.
Our future success may depend in part on our ability to complete the integration of acquisition targets successfully into our operations. The process of executing and integrating an acquired business may subject us to a number of risks, including:
• | diversion of management attention; |
• | failure to successfully further develop the acquired business; |
• | amortization of intangible assets, adversely affecting our reported results of operations; |
• | inability to retain and/or integrate the management, key personnel and other employees of the acquired business; |
• | inability to properly integrate businesses resulting in operating inefficiencies; |
10
• | inability to establish uniform standards, disclosure controls and procedures, internal control over financial reporting and other systems, procedures and policies in a timely manner; |
• | inability to retain the acquired company’s clients; |
• | exposure to legal claims for activities of the acquired business prior to acquisition; and |
• | inability to generate revenues to offset any new liabilities assumed and expenses associated with an acquired business. |
If our acquisitions are not successfully executed and integrated, our business, financial condition and results of operations, as well as our professional reputation, could be adversely affected.
We have anti-takeover provisions that make an acquisition of us difficult and expensive.
Anti-takeover provisions in our Certificate of Incorporation, our Bylaws and the Delaware laws make it difficult and expensive for someone to acquire us in a transaction which is not approved by our Board of Directors. Some of the provisions in our Certificate of Incorporation and Bylaws include:
• | limitations on the removal of directors; |
• | limitations on stockholder actions; and |
• | the ability to issue one or more series of preferred stock by action of our Board of Directors. |
These provisions could discourage an acquisition attempt or other transaction in which stockholders could receive a premium over the then-current market price for the common stock.
Our ability to access additional credit could be limited.
Banks can be expected to strictly enforce the terms of our credit agreement. Although we are currently in compliance with the financial covenants of our revolving credit facility, a deterioration of economic conditions may negatively impact our business resulting in our failure to comply with these covenants, which could limit our ability to borrow funds under our credit facility or from other borrowing facilities in the future. In such circumstances, we may not be able to secure alternative financing or may only be able to do so at significantly higher costs.
Increased cybersecurity requirements, vulnerabilities, threats and more sophisticated and targeted cyber-related attacks could pose a risk to our systems, networks, solutions, services and data.
Increased global cybersecurity vulnerabilities, threats and more sophisticated and targeted cyber-related attacks pose a risk to the security of our systems and networks and the confidentiality, availability and integrity of our data. We have a program in place to detect and respond to data security incidents. However, we remain potentially vulnerable to additional known or unknown threats. We also have access to sensitive, confidential or personal data or information that is subject to privacy and security laws, regulations and client-imposed controls. Despite our efforts to protect such information or systems, we may be vulnerable to security breaches, ransomware, theft, lost data, employee errors and/or malfeasance that could potentially lead to the compromising of sensitive, confidential or personal data or information, improper use of our systems or networks, unauthorized access, use, disclosure, modification or destruction of information. In addition, a cyber-related attack could result in other negative consequences, including damage to our reputation or competitiveness, remediation or increased protection costs, litigation or regulatory action which could result in a negative impact to our results of operations.
The expansion of social media platforms presents new risks and challenges that can cause damage to our brand and reputation.
There has been a marked increase in the use of social media platforms, including weblogs (or blogs), social media websites and other forms of Internet-based communications, which allow individuals access to a broad audience of consumers and other interested persons. The inappropriate and/or unauthorized use of such media vehicles by our clients or employees could increase our costs, cause damage to our brand, lead to litigation or result in information leakage, including the improper collection and/or dissemination of personally identifiable information of candidates and clients. In addition, negative or inaccurate posts or comments about us on any social networking platforms could damage our reputation, brand image and goodwill.
11
ITEM 1B. UNRESOLVED STAFF COMMENTS
None.
ITEM 2. PROPERTIES
Our corporate headquarters is located in Chicago, Illinois. We have leased office space in 51 cities in 25 countries around the world. All of our offices are leased. We do not own any real estate. The aggregate office space under lease was 460,263 square feet as of December 31, 2019. Our office leases call for future minimum lease payments of approximately $120.6 million and have terms that expire between 2020 and 2030, exclusive of renewal options that we can exercise.
Our office space by geographic segment as of December 31, 2019 is as follows:
Square Footage | ||
Americas | 259,661 | |
Europe | 111,337 | |
Asia Pacific | 89,265 | |
Total | 460,263 | |
ITEM 3. LEGAL PROCEEDINGS
We have contingent liabilities from various pending claims and litigation matters arising in the ordinary course of our business, some of which involve claims for damages that may be substantial in amount. Some of these matters are covered by insurance. Based upon information currently available, we believe the ultimate resolution of such claims and litigation will not have a material adverse effect on our financial condition, results of operations or liquidity.
ITEM 4. MINE SAFETY DISCLOSURES
Not applicable.
12
PART II
ITEM 5. MARKET FOR REGISTRANT’S COMMON EQUITY, RELATED STOCKHOLDER MATTERS AND ISSUER PURCHASES OF EQUITY SECURITIES
Market for our Common Stock
Our common stock, $0.01 par value, is listed on the Nasdaq Global Stock market under the symbol "HSII".
Performance Graph
We have presented below a graph which compares the cumulative total stockholder return on our common shares with the cumulative total stockholder return of the Standard & Poor’s SmallCap 600 Index and the Standard & Poor’s Composite 1500 Human Resource and Employment Services Index. The S&P Composite 1500 Human Resource & Employment Services Index includes 11 companies in related businesses, including Heidrick & Struggles. Cumulative total return for each of the periods shown in the performance graph is measured assuming an initial investment of $100 on December 31, 2014.
The stock price performance depicted in this graph is not necessarily indicative of future price performance. This graph will not be deemed to be filed as part of this Form 10-K, and will not be deemed to be incorporated by reference by any general statement incorporating this Form 10-K into any filing by us under the Securities Act of 1933 or the Exchange Act, except to the extent we specifically incorporate this information by reference.
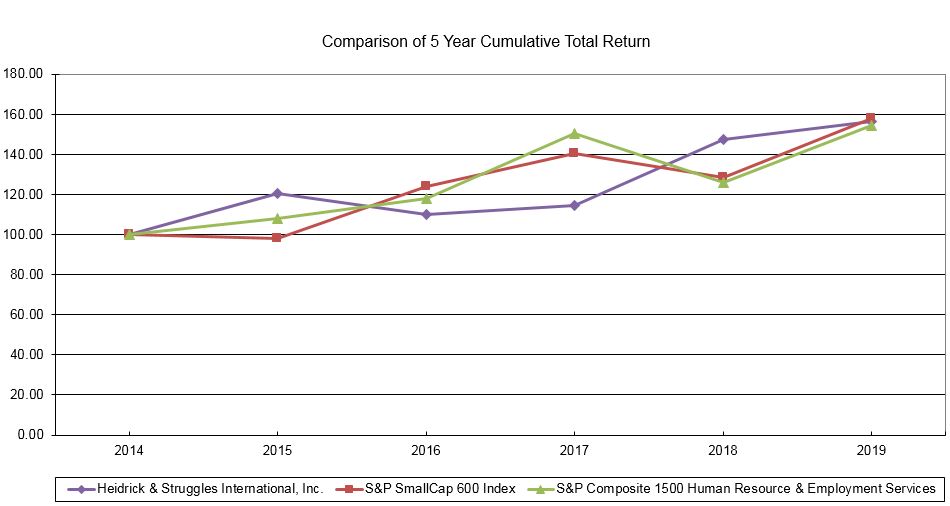
* Assuming $100 invested on 12/31/14 in HSII or index, including reinvestment of dividends.
Prepared by: Zacks Investment Research, Inc.
Copyright: Standard and Poor’s, Inc.
13
Dividends
From September 2007 through December 2018, we paid a quarterly cash dividend of $0.13 per share as approved by our Board of Directors. Beginning with the dividend paid on March 22, 2019, we began paying a quarterly cash dividend of $0.15 per share as approved by our Board of Directors. In 2019, the total cash dividend paid was $0.60 per share.
In February 2020, our Board of Directors approved a quarterly dividend of $0.15 per share on our common stock which will be paid on March 20, 2020 to shareholders of record as of March 6, 2020.
In connection with the quarterly cash dividend, we also pay a dividend equivalent on outstanding restricted stock units. The amounts related to the dividend equivalent payments for restricted stock units are accrued over the vesting period and paid upon vesting. In 2019 and 2018, we paid $0.4 million and $0.2 million, respectively, in dividend equivalent payments.
Issuer Purchases of Equity Securities
On February 11, 2008, we announced that our Board of Directors authorized management to repurchase shares of our common stock with an aggregate purchase price of up to $50 million. We may from time to time and as business conditions warrant purchase shares of our common stock on the open market or in negotiated or block trades. No time limit has been set for completion of this program. We did not repurchase any shares of our common stock in 2019. The most recent purchase of shares of common stock occurred during the year ended December 31, 2012. As of December 31, 2019, we have purchased 1,038,670 shares of our common stock for a total of $28.3 million and $21.7 million remains available for future purchases under the authorization.
Unregistered Sales of Equity Securities
During the year ended December 31, 2019, we issued 38,553 shares of our common stock as partial consideration for our acquisition of 2GET Holdings Limited as described in Note 8, Acquisitions. The shares were issued in reliance on Section 4(a)(2) of the Securities Act of 1933 as a transaction not involving any public offering.
14
ITEM 6. SELECTED FINANCIAL DATA
The selected financial data presented below has been derived from our audited consolidated financial statements. The data as of December 31, 2019 and 2018, and for the years ended December 31, 2019, 2018 and 2017, is derived from the audited current and historical consolidated financial statements, which are included elsewhere in this Form 10-K. Other than noted below, the data as of December 31, 2017, 2016 and 2015, and for the years ended December 31, 2016 and 2015, are derived from audited historical consolidated financial statements, which are not included in this report. The data set forth is qualified in its entirety by, and should be read in conjunction with, “Management’s Discussion and Analysis of Financial Condition and Results of Operations”, the audited consolidated financial statements, the notes thereto, and the other financial data and statistical information included in this Form 10-K.
Year Ended December 31, | ||||||||||||||||||||
2019 | 2018 | 2017 | 2016 | 2015 | ||||||||||||||||
(in thousands, except per share and other operating data) | ||||||||||||||||||||
Statements of Operations Data: | ||||||||||||||||||||
Revenue: | ||||||||||||||||||||
Revenue before reimbursements (net revenue) | $ | 706,924 | $ | 716,023 | $ | 621,400 | $ | 582,390 | $ | 531,139 | ||||||||||
Reimbursements | 18,690 | 19,632 | 18,656 | 18,516 | 17,172 | |||||||||||||||
Total revenue | 725,614 | 735,655 | 640,056 | 600,906 | 548,311 | |||||||||||||||
Operating expenses: | ||||||||||||||||||||
Salaries and benefits | 501,791 | 506,349 | 434,219 | 400,070 | 369,385 | |||||||||||||||
General and administrative expenses | 137,492 | 140,817 | 147,316 | 147,087 | 127,692 | |||||||||||||||
Impairment charges (1) | — | — | 50,722 | — | — | |||||||||||||||
Restructuring charges (2) | 4,130 | — | 15,666 | — | — | |||||||||||||||
Reimbursed expenses | 18,690 | 19,632 | 18,656 | 18,516 | 17,172 | |||||||||||||||
Total operating expenses | 662,103 | 666,798 | 666,579 | 565,673 | 514,249 | |||||||||||||||
Operating income (loss) | 63,511 | 68,857 | (26,523 | ) | 35,233 | 34,062 | ||||||||||||||
Non-operating income (expense): | ||||||||||||||||||||
Interest, net | 2,880 | 1,141 | 385 | 244 | (122 | ) | ||||||||||||||
Other, net | 2,898 | 494 | (3,280 | ) | 2,289 | (2,386 | ) | |||||||||||||
Net non-operating income (expense) | 5,778 | 1,635 | (2,895 | ) | 2,533 | (2,508 | ) | |||||||||||||
Income (loss) before income taxes | 69,289 | 70,492 | (29,418 | ) | 37,766 | 31,554 | ||||||||||||||
Provision for income taxes | 22,420 | 21,197 | 19,217 | 22,353 | 14,422 | |||||||||||||||
Net income (loss) | $ | 46,869 | $ | 49,295 | $ | (48,635 | ) | $ | 15,413 | $ | 17,132 | |||||||||
Basic weighted average common shares outstanding | 19,103 | 18,917 | 18,735 | 18,540 | 18,334 | |||||||||||||||
Diluted weighted average common shares outstanding | 19,551 | 19,532 | 18,735 | 18,939 | 18,715 | |||||||||||||||
Basic net income (loss) per common share | $ | 2.45 | $ | 2.61 | $ | (2.60 | ) | $ | 0.83 | $ | 0.93 | |||||||||
Diluted net income (loss) per common share | $ | 2.40 | $ | 2.52 | $ | (2.60 | ) | $ | 0.81 | $ | 0.92 | |||||||||
Cash dividends paid per share | $ | 0.60 | $ | 0.52 | $ | 0.52 | $ | 0.52 | $ | 0.52 | ||||||||||
Balance Sheet Data (at end of period): | ||||||||||||||||||||
Working capital (3) | $ | 149,140 | $ | 131,916 | $ | 77,998 | $ | 77,838 | $ | 79,533 | ||||||||||
Total assets (3) | 844,173 | 700,629 | 587,204 | 581,502 | 572,718 | |||||||||||||||
Long-term debt, less current maturities | — | — | — | — | — | |||||||||||||||
Stockholders’ equity | 309,115 | 267,156 | 212,705 | 258,590 | 254,802 | |||||||||||||||
(1) | Includes impairment charges of $50.7 million related to Heidrick Consulting in 2017 (See Note 9, Goodwill and Other Intangible Assets). |
(2) | Includes restructuring charges of $4.1 million and $15.7 million in 2019 and 2017, respectively. The 2019 charges primarily consist of employee-related costs associated with severance arrangements. The 2017 charges consist of $13.1 million of employee-related costs associated with severance arrangements, $2.3 million in professional fees and other expenses and $0.3 million in real estate related expenses (See Note 15, Restructuring). |
(3) | As adjusted for the adoption of ASU No. 2015-17, Income Taxes: Balance Sheet Classification of Deferred Taxes in 2015. |
15
ITEM 7. MANAGEMENT’S DISCUSSION AND ANALYSIS OF FINANCIAL CONDITION AND RESULTS OF OPERATIONS
Management’s Discussion and Analysis of Financial Condition and Results of Operations as well as other sections of this annual report on Form 10-K contain forward-looking statements. The Private Securities Litigation Reform Act of 1995 provides a safe harbor for forward-looking statements. Forward-looking statements are not historical facts, but instead represent only our beliefs, assumptions, expectations, estimates, forecasts and projections regarding future events, many of which, by their nature, are inherently uncertain and outside our control. These statements include statements other than historical information or statements of current condition and may relate to our future plans and objectives and results. By identifying these statements for you in this manner, we are alerting you to the possibility that our actual results and financial condition may differ, possibly materially, from the anticipated results and financial condition indicated in these forward-looking statements. Important factors that could cause our actual results and financial condition to differ from those indicated in the forward-looking statements include, among others, those discussed under the Section heading “Risk Factors” in Part I, Item 1A of this Form 10-K.
Factors that may affect the outcome of the forward-looking statements include, among other things, leadership changes, our ability to attract, integrate, develop, manage and retain qualified consultants and senior leaders; our ability to prevent our consultants from taking our clients with them to another firm; our ability to maintain our professional reputation and brand name; the fact that our net revenue may be affected by adverse economic conditions; our clients’ ability to restrict us from recruiting their employees; the aggressive competition we face; our heavy reliance on information management systems; the fact that we face the risk of liability in the services we perform; the fact that data security, data privacy and data protection laws and other evolving regulations and cross-border data transfer restrictions may limit the use of our services and adversely affect our business; social, political, regulatory and legal risks in markets where we operate; the impact of foreign currency exchange rate fluctuations; the fact that we may not be able to align our cost structure with net revenue; unfavorable tax law changes and tax authority rulings; our ability to realize our tax losses; the timing of the establishment or reversal of valuation allowance on deferred tax assets; any impairment of our goodwill, other intangible assets and other long-lived assets; our ability to execute and integrate future acquisitions; the fact that we have anti-takeover provisions that make an acquisition of us difficult and expensive; our ability to access additional credit; and the increased cybersecurity requirements, vulnerabilities, threats and more sophisticated and targeted cyber-related attacks that could pose a risk to our systems, networks, solutions, services and data. We undertake no obligation to update publicly any forward-looking statements, whether as a result of new information, future events or otherwise. We undertake no obligation to update publicly any forward-looking statements, whether as a result of new information, future events or otherwise.
The discussion that follows includes a comparison of our results of operations and liquidity and capital resources for years 2019 and 2018. for the discussion of changes from 2017 to 2018 and other financial information related to 2017, refer to "Item 7 - Management's Discussion and Analysis of Financial Condition and Results of Operations" of our Annual Report on Form 10-K for the year ended December 31, 2018. This document was filed with the SEC on February 26, 2019.
Executive Overview
Our Business
We are a leadership advisory firm providing executive search and consulting services. We help our clients build leadership teams by facilitating the recruitment, management and development of senior executives. We believe focusing on top-level services offers us several advantages that include access to and influence with key decision makers, increased potential for recurring search consulting engagements, higher fees per search, enhanced brand visibility and a leveraged global footprint, which create added barriers to entry for potential competitors. Working at the top of client organizations also allows us to attract and retain high-caliber consultants.
In addition to executive search, we provide consulting services including executive leadership assessment, leadership, team and board development, succession planning, talent strategy, people performance, inter-team collaboration, culture shaping and organizational transformation.
We provide our services to a broad range of clients through the expertise of over 450 consultants located in major cities around the world. Our executive search services are provided on a retained basis. Revenue before reimbursements of out-of-pocket expenses (“net revenue”) consists of retainers and indirect expenses billed to clients. Typically, we are paid a retainer for our executive search services equal to approximately one-third of the estimated first-year compensation for the position to be filled. In addition, if the actual compensation of a placed candidate exceeds the estimated compensation, we often are authorized to bill the client for one-third of the excess. Indirect expenses are calculated as a percentage of the retainer with certain dollar limits per search.
16
Key Performance Indicators
We manage and assess our performance through various means, with primary financial and operational measures including net revenue, operating income, operating margin, Adjusted EBITDA (non-GAAP) and Adjusted EBITDA margin (non-GAAP). Executive Search and Heidrick Consulting performance is also measured using consultant headcount. Specific to Executive Search, confirmation trends, consultant productivity and average revenue per search are used to measure performance.
Revenue is driven by market conditions and a combination of the number of executive search engagements and consulting projects and the average revenue per search or project. With the exception of compensation expense, incremental increases in revenue do not necessarily result in proportionate increases in costs, particularly operating and administrative expenses, thus creating the potential to improve operating margins.
The number of consultants, confirmation trends, number of searches or projects completed, productivity levels and the average revenue per search or project will vary from quarter to quarter, affecting net revenue and operating margin.
Our Compensation Model
At the Executive Search consultant level, there are fixed and variable components of compensation. Individuals are rewarded for their performance based on a system that directly ties a portion of their compensation to the amount of net revenue for which they are responsible. A portion of the reward may be based upon individual performance against a series of non-financial measures. Credit towards the variable portion of an executive search consultant’s compensation is earned by generating net revenue for winning and executing work. Each quarter, we review and update the expected annual performance of all Executive Search consultants and accrue variable compensation accordingly. The amount of variable compensation that is accrued for each Executive Search consultant is based on a tiered payout model. Overall Company performance determines the amount available for total variable compensation. The more net revenue that is generated by the consultant, the higher the percentage credited towards the consultant’s variable compensation and thus accrued by our Company as expense.
At the Heidrick Consulting consultant level, there are also fixed and variable components of compensation. Overall compensation is determined based on the total economic contribution of the Heidrick Consulting segment to the business as a whole. Individual consultant compensation can vary and is derived from credits earned for delivering client work plus credits earned for contributions of intellectual and human capital, client relationship development and consulting practice development. Each quarter, we review and update the expected annual performance of all Heidrick Consulting consultants and accrue variable compensation accordingly.
The mix of individual consultants who generate revenue in Executive Search and economic contributions in Heidrick Consulting can significantly affect the total amount of compensation expense recorded, which directly impacts operating margin. As a result, the variable portion of the compensation expense may fluctuate significantly from quarter to quarter. The total variable compensation is discretionary and is based on Company-wide financial targets approved by the Human Resources and Compensation Committee of the Board of Directors.
A portion of our Executive Search consultants’ and management cash bonuses is deferred and paid over a three-year vesting period. The compensation expense related to the amounts being deferred is recognized on a graded vesting attribution method over the requisite service period. This service period begins on January 1 of the respective fiscal year and continues through the deferral date, which coincides with our bonus payments in the first quarter of the following year, and for an additional three-year vesting period. The deferrals are recorded in Accrued salaries and benefits in the Consolidated Balance Sheets.
2019 Overview
Consolidated net revenue was $706.9 million for the year ended December 31, 2019, a decrease of $9.1 million, or 1.3%, compared to 2018. Executive Search net revenue was $646.4 million in 2019, a decrease of $6.5 million compared to 2018. The decrease in Executive Search net revenue was the result of declines in Europe and Asia Pacific, partially offset by growth in the Americas. Our acquisition of 2Get in September 2019 also contributed to Executive Search net revenue. The number of Executive Search consultants was 380 as of December 31, 2019, compared to 353 as of December 31, 2018. Executive Search productivity, as measured by annualized net Executive Search revenue per consultant, was $1.7 million and $1.9 million for the years ended December 31, 2019 and 2018, respectively. The number of confirmed searches decreased 4.6% in 2019 compared to 2018. The average revenue per executive search increased to $132,000 in 2019 compared to $127,300 in 2018. Heidrick Consulting net revenue decreased $2.6 million, or 4.1%, to $60.6 million in 2019, from $63.1 million in 2018. The number of Heidrick Consulting consultants was 71 as of December 31, 2019, compared to 66 as of December 31, 2018.
17
Operating income as a percentage of net revenue was 9.0% in 2019, compared to 9.6% in 2018. The change in operating income was primarily due to a decrease in net revenue of $9.1 million and $4.1 million of restructuring charges in 2019, partially offset by decreases in salaries and benefits expense and general and administrative expense of $4.6 million and $3.3 million, respectively. Salaries and benefits expense as a percentage of net revenue was 71.0% in 2019 and 70.7% in 2018. General and administrative expense as a percentage of net revenue was 19.4% in 2019 and 19.7% in 2018.
We ended the year with combined cash, cash equivalents, and marketable securities of $332.9 million, an increase of $53.0 million compared to $279.9 million at December 31, 2018. The increase was primarily due to the strong cash inflows from operations partially offset by acquisition spend and larger bonus payments year-over-year. We pay the majority of bonuses in the first quarter following the year in which they were earned. Employee bonuses are accrued throughout the year and are based on the Company’s performance and the performance of the individual employee. We expect to pay approximately $205.0 million in bonuses related to 2019 performance in March and April 2020. In January 2020, we paid approximately $17.1 million in cash bonuses deferred from prior years.
2020 Outlook
We are currently forecasting 2020 first quarter net revenue of between $165 million and $175 million. Our 2020 first quarter guidance is based upon, among other things, management’s assumptions for the anticipated volume of new executive search confirmations and leadership consulting and culture shaping projects, the current backlog, consultant productivity, consultant retention, the seasonality of our business and average currency rates from December 2019.
Our 2020 first quarter guidance is subject to a number of risks and uncertainties, including those disclosed under "Item 1A - Risk Factors" and in this "Management’s Discussion and Analysis of Financial Condition and Results of Operations". As such, actual results could vary from these projections.
18
Results of Operations
The following table summarizes, for the periods indicated, the results of operations (in thousands, except per share data):
Year Ended December 31, | ||||||||||||
2019 | 2018 | 2017 | ||||||||||
Revenue | ||||||||||||
Revenue before reimbursements (net revenue) | $ | 706,924 | $ | 716,023 | $ | 621,400 | ||||||
Reimbursements | 18,690 | 19,632 | 18,656 | |||||||||
Total revenue | 725,614 | 735,655 | 640,056 | |||||||||
Operating Expenses | ||||||||||||
Salaries and benefits | 501,791 | 506,349 | 434,219 | |||||||||
General and administrative expenses | 137,492 | 140,817 | 147,316 | |||||||||
Impairment charges (1) | — | — | 50,722 | |||||||||
Restructuring charges (2) | 4,130 | — | 15,666 | |||||||||
Reimbursed expenses | 18,690 | 19,632 | 18,656 | |||||||||
Total operating expenses | 662,103 | 666,798 | 666,579 | |||||||||
Operating income (loss) | 63,511 | 68,857 | (26,523 | ) | ||||||||
Non-operating income (expense) | ||||||||||||
Interest, net | 2,880 | 1,141 | 385 | |||||||||
Other, net | 2,898 | 494 | (3,280 | ) | ||||||||
Net non-operating income (expense) | 5,778 | 1,635 | (2,895 | ) | ||||||||
Income (loss) before taxes | 69,289 | 70,492 | (29,418 | ) | ||||||||
Provision for income taxes | 22,420 | 21,197 | 19,217 | |||||||||
Net income (loss) | $ | 46,869 | $ | 49,295 | $ | (48,635 | ) | |||||
Basic weighted average common shares outstanding | 19,103 | 18,917 | 18,735 | |||||||||
Diluted weighted average common shares outstanding | 19,551 | 19,532 | 18,735 | |||||||||
Basic net income (loss) per common share | $ | 2.45 | $ | 2.61 | $ | (2.60 | ) | |||||
Diluted net income (loss) per common share | $ | 2.40 | $ | 2.52 | $ | (2.60 | ) | |||||
Cash dividends paid per share | $ | 0.60 | $ | 0.52 | $ | 0.52 | ||||||
(1) | Includes impairment charges of $50.7 million related to Heidrick Consulting in 2017 (See Note 9, Goodwill and Other Intangible Assets). |
(2) | Includes restructuring charges of $4.1 million in 2019 and $15.7 million in 2017. The 2019 charges consist primarily of employee-related costs associated with severance arrangements. The 2017 charges consist of $13.1 million of employee-related costs associated with severance arrangements, $2.3 million in professional fees and other expenses and $0.3 million in real estate related expenses (See Note 15, Restructuring). |
19
The following table summarizes, for the periods indicated, our results of operations as a percentage of revenue before reimbursements (net revenue):
Year Ended December 31, | |||||||||
2019 | 2018 | 2017 | |||||||
Revenue: | |||||||||
Revenue before reimbursements (net revenue) | 100.0 | % | 100.0 | % | 100.0 | % | |||
Reimbursements | 2.6 | 2.7 | 3.0 | ||||||
Total revenue | 102.6 | 102.7 | 103.0 | ||||||
Operating expenses: | |||||||||
Salaries and benefits | 71.0 | 70.7 | 69.9 | ||||||
General and administrative expenses | 19.4 | 19.7 | 23.7 | ||||||
Impairment charges | — | — | 8.2 | ||||||
Restructuring charges | 0.6 | — | 2.5 | ||||||
Reimbursed expenses | 2.6 | 2.7 | 3.0 | ||||||
Total operating expenses | 93.7 | 93.1 | 107.3 | ||||||
Operating income (loss) | 9.0 | 9.6 | (4.3 | ) | |||||
Non-operating income (expense) | |||||||||
Interest, net | 0.4 | 0.2 | 0.1 | ||||||
Other, net | 0.4 | 0.1 | (0.5 | ) | |||||
Net non-operating income (expense) | 0.8 | 0.2 | (0.5 | ) | |||||
Income (loss) before income taxes | 9.8 | 9.8 | (4.7 | ) | |||||
Provision for income taxes | 3.2 | 3.0 | 3.1 | ||||||
Net income (loss) | 6.6 | % | 6.9 | % | (7.8 | )% | |||
Note: Totals and subtotals may not equal the sum of individual line items due to rounding.
20
We operate our Executive Search business in the Americas, Europe (which includes Africa) and Asia Pacific (which includes the Middle East), and we operate our Heidrick Consulting business globally (See Note 18, Segment Information).
The following table sets forth, for the periods indicated, our revenue and operating income by segment (in thousands):
Year Ended December 31, | ||||||||||||
2019 | 2018 | 2017 | ||||||||||
Revenue: | ||||||||||||
Executive Search | ||||||||||||
Americas | $ | 415,455 | $ | 405,267 | $ | 339,793 | ||||||
Europe | 135,070 | 145,348 | 125,346 | |||||||||
Asia Pacific | 95,827 | 102,276 | 86,905 | |||||||||
Total Executive Search | 646,352 | 652,891 | 552,044 | |||||||||
Heidrick Consulting | 60,572 | 63,132 | 69,356 | |||||||||
Revenue before reimbursements (net revenue) | 706,924 | 716,023 | 621,400 | |||||||||
Reimbursements | 18,690 | 19,632 | 18,656 | |||||||||
Total revenue | $ | 725,614 | $ | 735,655 | $ | 640,056 | ||||||
Operating income (loss): | ||||||||||||
Executive Search | ||||||||||||
Americas (1) | $ | 100,833 | $ | 96,880 | $ | 75,337 | ||||||
Europe (2) | 3,026 | 5,849 | 13 | |||||||||
Asia Pacific (3) | 13,590 | 15,999 | 537 | |||||||||
Total Executive Search | 117,449 | 118,728 | 75,887 | |||||||||
Heidrick Consulting (4) | (18,499 | ) | (13,619 | ) | (62,368 | ) | ||||||
Total segments | 98,950 | 105,109 | 13,519 | |||||||||
Global Operations Support (5) | (35,439 | ) | (36,252 | ) | (40,042 | ) | ||||||
Total operating income (loss) | $ | 63,511 | $ | 68,857 | $ | (26,523 | ) | |||||
(1) | Operating income for the Americas includes $4.1 million and $0.8 million of restructuring charges in 2019 and 2017, respectively. |
(2) | Operating income for Europe includes $4.0 million of restructuring charges in 2017. |
(3) | Operating income for Asia Pacific includes $2.0 million of restructuring charges in 2017. |
(4) | Operating loss for Heidrick Consulting includes less than $0.1 million of restructuring charges in 2019, and $50.7 million of impairment charges and $3.4 million of restructuring charges in 2017. |
(5) | Operating loss for Global Operations Support includes less than $0.1 million and $5.5 million of restructuring charges in 2019 and 2017, respectively. |
Year ended December 31, 2019 compared to year ended December 31, 2018
Total revenue. Consolidated total revenue decreased $10.0 million, or 1.4%, to $725.6 million in 2019 from $735.7 million in 2018. The decrease in total revenue was primarily due to the decrease in revenue before reimbursements (net revenue).
Revenue before reimbursements (net revenue). Consolidated net revenue decreased $9.1 million, or 1.3%, to $706.9 million in 2019 from $716.0 million in 2018. Foreign exchange rates negatively impacted results by $11.3 million, or 1.6%. Executive Search net revenue was $646.4 million in 2019, a decrease of $6.5 million compared to 2018. The decrease in Executive Search net revenue was the result of declines in both Europe and Asia Pacific, partially offset by growth in the Americas. Heidrick Consulting net revenue decreased $2.6 million, or 4.1%, to $60.6 million in 2019 from $63.1 million in 2018.
The number of Executive Search and Heidrick Consulting consultants was 380 and 71, respectively, as of December 31, 2019, compared to 353 and 66, respectively, as of December 31, 2018. Specific to Executive Search, which is our largest business, productivity as measured by annualized net Executive Search revenue per consultant was $1.7 million and $1.9 million for the years ended December 31, 2019 and 2018, respectively. The number of confirmed searches decreased 4.6% compared to 2018. The average revenue per executive search increased to $132,000 in 2019 compared to $127,300 in 2018.
21
Salaries and benefits. Consolidated salaries and benefits expense decreased $4.6 million, or 0.9%, to $501.8 million in 2019 from $506.3 million in 2018. The decrease was due to lower variable compensation of $17.5 million, partially offset by higher fixed compensation of $12.9 million. Variable compensation decreased due to lower consultant productivity compared to the prior year. Included in variable compensation for the year ended December 31, 2019 is $0.6 million of contingent compensation for the former owners of 2GET, which is based on the achievement of certain revenue and EBITDA milestones for the period from acquisition through 2023. Fixed compensation increased due to the deferred compensation plan, stock compensation, base salaries and payroll taxes, and retirement and benefits, partially offset by declines in talent acquisition and retention costs and separation. Foreign exchange rate fluctuations positively impacted salaries and benefits expenses by $8.2 million, or 1.6%.
In 2019, we had an average of 1,680 employees, compared to an average of 1,610 employees in 2018.
As a percentage of net revenue, salaries and benefits expense was 71.0% in 2019 compared to 70.7% in 2018.
General and administrative expenses. Consolidated general and administrative expenses decreased $3.3 million, or 2.4%, to $137.5 million in 2019 from $140.8 million in 2018. The decrease was primarily due to decreases in professional fees, intangible amortization, resource library fees, and office occupancy expenses, partially offset by increases in bad debt, the use of external third-party consultants, and taxes and licenses. Foreign exchange rate fluctuations positively impacted general and administrative expenses by $2.1 million, or 1.5%.
As a percentage of net revenue, general and administrative expenses were 19.4% in 2019 compared to 19.7% in 2018.
Restructuring charges. The Company incurred approximately $4.1 million in restructuring charges during the year ended December 31, 2019 in connection with initiatives to integrate the Company's legacy Brazil operations into the 2GET business operation. The expenses are primarily employee-related including the elimination of duplicative positions in the Company's legacy Brazil operations. There were no similar restructuring charges during the year ended December 31, 2018.
Operating income. Consolidated operating income was $63.5 million in 2019, including restructuring charges of $4.1 million, compared to $68.9 million in 2018. Foreign exchange rate fluctuations negatively impacted operating income by $1.1 million or 1.6%. Excluding the impact of restructuring charges in 2019, operating income decreased $1.2 million from $68.9 million to $67.6 million.
Net non-operating income (expense). Net non-operating income was $5.8 million in 2019 compared to $1.6 million in 2018.
Net interest income was $2.9 million in 2019, a $1.7 million increase from $1.1 million in 2018. The increase was primarily due to interest earned on marketable securities, which are primarily comprised of U.S. Treasury bills.
Other, net was income of $2.9 million in 2019 compared to $0.5 million in 2018. The increase was primarily the result of gains on the deferred compensation plan assets.
Income taxes. See Note 16, Income Taxes.
Executive Search
Americas
The Americas segment reported net revenue of $415.5 million in 2019, an increase of 2.5% from $405.3 million in 2018. The increase in net revenue was driven by an increase in average revenue per executive search. All industry practice groups contributed to the increased net revenue with the exception of the Education and Social Enterprises, and Financial Services practice groups. Foreign exchange fluctuations negatively impacted net revenue by $0.8 million, or 0.2%. There were 200 Executive Search consultants in the Americas as of December 31, 2019, compared to 179 as of December 31, 2018.
Salaries and benefits expense decreased $0.1 million from 2018. Fixed compensation increased $14.8 million, primarily due to base salaries and payroll taxes, the deferred compensation plan, stock compensation, and retirement and benefits, partially offset by a decrease in talent acquisition and retention costs. Variable compensation decreased $14.9 million primarily due to the mix of consultant productivity. Included in variable compensation for the year ended December 31, 2019 is $0.6 million of contingent compensation for the former owners of 2GET, which is based on the achievement of certain revenue and EBITDA milestones for the period from acquisition through 2023.
22
General and administrative expenses increased $2.2 million, or 4.8%, from 2018 due to increases in bad debt, internal travel, taxes and licenses, office occupancy expenses, and professional fees, partially offset by decreases in research tool expenses and the use of external third-party consultants.
The Americas segment incurred approximately $4.1 million in restructuring charges during the year ended December 31, 2019 in connection with initiatives to integrate the Company's legacy Brazil operations into the 2GET business operation. The expenses are primarily employee-related including the elimination of duplicative positions in the Company's legacy Brazil operations. There were no similar restructuring charges during the year ended December 31, 2018.
Operating income was $100.8 million in 2019, an increase of $3.9 million, compared to $96.9 million in 2018. Excluding the impact of restructuring charges in 2019, operating income increased $8.1 million from $96.9 million in 2018 to $104.9 million in 2019.
Europe
Europe reported net revenue of $135.1 million in 2019, a decrease of 7.1% from $145.3 million in 2018. The decrease in net revenue was due to a 5.1% decrease in the number of executive search confirmations. All industry practice groups contributed to the decline in revenue with the exception of the Global Technology and Services practice group. Foreign exchange rate fluctuations negatively impacted net revenue by $6.8 million, or 4.8%. There were 107 Executive Search consultants in Europe as of December 31, 2019, compared to 101 as of December 31, 2018.
Salaries and benefits expense decreased $4.2 million, or 4.0%, from 2018. Fixed compensation decreased $0.2 million, primarily due to decreases in base salaries and payroll taxes and retirement and benefits, partially offset by increases in talent acquisition and retention costs, and stock compensation. Variable compensation decreased $4.0 million due to a decline in consultant productivity.
General and administrative expenses decreased $3.3 million, or 9.5% from 2018, primarily due to decreases in professional fees, intangible amortization, internal travel, and office occupancy expenses.
The Europe segment reported operating income of $3.0 million in 2019 compared to $5.8 million in 2018.
Asia Pacific
Asia Pacific reported net revenue of $95.8 million in 2019, a decrease of 6.3% compared to $102.3 million in 2018. The decrease in net revenue was due to a 12.3% decrease in the number of executive search confirmations, partially offset by an increase in average revenue per executive search. All industry practice groups contributed to the decline in revenue with the exception of the Global Technology and Services practice group. Foreign exchange rate fluctuations negatively impacted net revenue by $2.7 million, or 2.7%. There were 73 Executive Search consultants in Asia Pacific as of both December 31, 2019 and 2018.
Salaries and benefits expense decreased $3.3 million, or 5.0%, from 2018. Fixed compensation decreased $3.7 million due to decreases in base salaries and payroll taxes, and talent acquisition and retention costs, partially offset by increases in retirement and benefits, and stock compensation. Variable compensation increased $0.4 million due to the mix of consultant productivity.
General and administrative expenses decreased $0.7 million, or 3.5%, from 2018 primarily due to a decrease in office occupancy expenses, partially offset by increases in bad debt and internal travel.
The Asia Pacific segment reported operating income of $13.6 million in 2019, a decrease of $2.4 million compared to $16.0 million in 2018.
Heidrick Consulting
The Heidrick Consulting segment reported net revenue of $60.6 million in 2019, a decrease of 4.1% compared to $63.1 million in 2018. The decrease in net revenue was due to a decrease in revenue per consulting engagement. Foreign exchange rate fluctuations negatively impacted results by $1.1 million, or 1.7%. There were 71 Heidrick Consulting consultants as of December 31, 2019, compared to 66 as of December 31, 2018.
23
Salaries and benefits expense increased $4.0 million, or 7.5%, from 2018. Fixed compensation increased $1.8 million, primarily due to increases in base salaries and payroll taxes, and retirement and benefits, partially offset by a decrease in talent acquisition and retention costs. Variable compensation increased $2.2 million due to cross collaboration bonuses.
General and administrative expenses decreased $1.7 million, or 7.0%, from 2018, primarily due to decreases in professional fees, information technology, and earnout accretion, partially offset by increases in the use of external third-party consultants and internal travel.
The Heidrick Consulting segment reported an operating loss of $18.5 million in 2019, an increase of $4.9 million compared to an operating loss of $13.6 million in 2018.
Global Operations Support
Global Operations Support expenses decreased $0.8 million, or 2.3%, to $35.4 million from $36.3 million in 2018.
Salaries and benefits expenses decreased $0.9 million, or 4.4%, due to decreases in management bonuses, separation, and stock compensation, partially offset by increases in base salaries and payroll taxes and retirement and benefits.
General and administrative expenses increased $0.1 million due to increases in information technology, the use of external third-party consultants, and taxes and licenses, partially offset by decreases in internal travel, professional fees, and office occupancy expenses.
Global Operations Support incurred less than $0.1 million in restructuring charges during the year ended December 31, 2019. There were no similar restructuring charges during the year ended December 31, 2018.
Liquidity and Capital Resources
General. We continually evaluate our liquidity requirements, capital needs and availability of capital resources based on our operating needs. We believe that our available cash balances together with the funds expected to be generated from operations and funds available under our committed revolving credit facility will be sufficient to finance our operations for the foreseeable future, as well as to finance the cash payments associated with our cash dividends and stock repurchase program.
We pay the non-deferred portion of annual bonuses in the first quarter following the year in which they are earned. Employee bonuses are accrued throughout the year and are based on our performance and the performance of the individual employee.
Lines of Credit. On October 26, 2018, we entered into a new Credit Agreement (the "2018 Credit Agreement") to replace the Second Amended and Restated Credit Agreement (the "Restated Credit Agreement") executed on June 30, 2015. The 2018 Credit Agreement provides us with a senior unsecured revolving line of credit with an aggregate commitment of $175 million, which includes a sublimit of $25 million for letters of credit, and a $10 million swingline loan sublimit. The agreement also includes a $75 million expansion feature. The 2018 Credit Agreement will mature in October 2023. Borrowings under the 2018 Credit Agreement bear interest at our election of the Alternate Base Rate (as defined in the 2018 Credit Agreement) or Adjusted LIBOR (as defined in the 2018 Credit Agreement) plus a spread as determined by our leverage ratio.
Borrowings under the 2018 Credit Agreement may be used for working capital, capital expenditures, Permitted Acquisitions (as defined in the 2018 Credit Agreement) and for other general purposes. The obligations under the 2018 Credit Agreement are guaranteed by certain of our subsidiaries.
We capitalized approximately $1.0 million of loan acquisition costs related to the 2018 Credit Agreement, which will be amortized over the remaining term of the agreement.
Before October 26, 2018, we were party to the Restated Credit Agreement. The Restated Credit Agreement provided a single senior unsecured revolving line of credit with an aggregate commitment of up to $100 million, which included a sublimit of $25 million for letters of credit, and a $50 million expansion feature. Borrowings under the Restated Credit Agreement bore interest at our election of the existing Alternate Base Rate (as defined in the Restated Credit Agreement) or the Adjusted LIBOR Rate (as defined in the Restated Credit Agreement) plus a spread as determined by our leverage ratio.
During the three months ended March 31, 2018, we borrowed $20 million under the Restated Credit Agreement and elected the Adjusted LIBOR Rate. We subsequently repaid $8 million during the three months ended March 31, 2018 and $12 million during the three months ended June 30, 2018.
24
As of December 31, 2019, and 2018, we had no outstanding borrowings under the 2018 Credit Agreement and were in compliance with the financial and other covenants under the 2018 Credit Agreement and no event of default existed.
Cash, cash equivalents, and marketable securities. Cash, cash equivalents and marketable securities at December 31, 2019 were $332.9 million, an increase of $53.0 million compared to $279.9 million at December 31, 2018. The $332.9 million of cash, cash equivalents, and marketable securities at December 31, 2019 includes $131.6 million held by our foreign subsidiaries. The foreign cash balance of $131.6 million is considered permanently reinvested in these foreign subsidiaries. If these funds were required to satisfy obligations in the United States, the repatriation of these funds could cause us to incur additional foreign withholding taxes. We expect to pay approximately $205.0 million in variable compensation related to 2019 performance in March and April 2020. In January 2020, we paid approximately $17.1 million in variable compensation that was deferred in prior years.
Cash flows provided by operating activities. For the year ended December 31, 2019, cash provided by operating activities was $78.6 million, primarily reflecting net income net of non-cash charges of $69.2 million, a decrease in accounts receivable of $6.9 million, an increase in net retirement and pension plan liabilities of $3.3 million and an increase in accrued expenses of $2.4 million. The increase in accrued expenses primarily reflects approximately $205.0 million of current year bonus accruals, partially offset by $202.0 million of bonus payments for 2018 made in early 2019.
Cash provided by operating activities for the year ended December 31, 2018, was $102.9 million, primarily reflecting net income net of non-cash charges of $68.6 million, an increase in accrued expenses of $71.5 million, partially offset by an increase in accounts receivable of $16.8 million and restructuring payments of $11.6 million. The increase in accrued expenses primarily reflects approximately $202.0 million of bonus accruals, partially offset by $148.0 million of bonus payments for 2017 made in early 2018.
Cash flows used in investing activities. For the year ended December 31, 2019, cash used in investing activities was $69.3 million, primarily due to purchases of marketable securities and investments of $130.4 million, the acquisition of 2GET for $3.5 million, and capital expenditures of $3.4 million, partially offset by proceeds from the maturity and sales of marketable securities and investments of $68.0 million. The decrease in capital expenditures is primarily the result of reduced office build-outs.
Cash used in investing activities for the year ended December 31, 2018, was $8.2 million, primarily due to capital expenditures of $6.0 million, the acquisition in January 2018 of Amrop A/S ("Amrop") for $3.1 million and purchases of available for sale securities of $2.2 million, partially offset by proceeds from the sale of available for sale securities of $3.0 million. The increase in capital expenditures is primarily the result of office build-outs and a global information technology update.
Cash flows used in financing activities. For the year ended December 31, 2019, cash used in financing activities was $18.2 million, primarily due to cash dividend payments of $11.8 million, payment of employee tax withholdings on equity transactions of $4.6 million, and earnout payments related to the Scambler MacGregor and DSI acquisitions of $1.9 million.
Cash used in financing activities for the year ended December 31, 2018, was $17.0 million due to cash dividend payments of $10.2 million, earnout payments related to the JCA Group acquisition of $3.6 million and the payment of employee tax withholdings on equity transactions of $2.2 million. Gross proceeds and payments on the Company's line of credit were each $20.0 million during the year ended December 31, 2018.
On February 11, 2008, we announced that our Board of Directors authorized management to repurchase shares of our common stock with an aggregate total amount up to $50 million. We may from time to time and as business conditions warrant purchase shares of our common stock on the open market or in negotiated or block trades. No time limit has been set for completion of this program. We did not repurchase any shares of our common stock in 2019. The most recent purchase of shares of common stock occurred during the year ended December 31, 2012. As of December 31, 2019, we have purchased 1,038,670 shares of our common stock for a total of $28.3 million and $21.7 million remains available for future purchases under the authorization. Unless terminated or extended earlier by resolution of the Board of Directors, the program will expire when the amount authorized for repurchases has been spent.
Off-balance sheet arrangements. We do not have material off-balance sheet arrangements, special purpose entities, trading activities of non-exchange traded contracts or transactions with related parties.
25
Contractual obligations. The following table presents our known contractual obligations as of December 31, 2019, and the expected timing of cash payments related to these contractual obligations (in millions):
Payments due for the years ended December 31, | ||||||||||||||||||||||||||||
2020 | 2021 | 2022 | 2023 | 2024 | Thereafter | Total | ||||||||||||||||||||||
Contractual obligations: | ||||||||||||||||||||||||||||
Operating lease obligations | $ | 30.2 | $ | 27.2 | $ | 23.6 | $ | 20.6 | $ | 10.0 | $ | 9.0 | $ | 120.6 | ||||||||||||||
Asset retirement obligations (1) | 0.6 | 0.9 | 0.1 | 0.5 | 0.8 | 0.1 | 3.0 | |||||||||||||||||||||
Total | $ | 30.8 | $ | 28.1 | $ | 23.7 | $ | 21.1 | $ | 10.8 | $ | 9.1 | $ | 123.6 | ||||||||||||||
(1) Represents the fair value of the obligation associated with the retirement of tangible long-lived assets primarily related to our obligation at the end of the lease term to return office space to the landlord in its original condition.
In addition to the contractual obligations included in the above table, we have liabilities related to certain employee benefit plans. These liabilities are recorded in our Consolidated Balance Sheet at December 31, 2019. The obligations related to these employee benefit plans are described in Note 12, Employee Benefit Plans, and Note 13, Pension Plan and Life Insurance Contract, in the Notes to Consolidated Financial Statements. As the timing of cash disbursements related to these employee benefit plans is uncertain, we have not included these obligations in the above table. The table excludes our liability for uncertain tax positions including accrued interest and penalties, which totaled $0.2 million as of December 31, 2019, since we cannot predict with reasonable reliability the timing of cash settlements to the respective taxing authorities.
Application of Critical Accounting Policies and Estimates
General. Management’s Discussion and Analysis of Financial Condition and Results of Operations is based upon our Consolidated Financial Statements, which have been prepared using accounting principles generally accepted in the United States of America. Our significant accounting policies are discussed in Note 2, Summary of Significant Accounting Policies and Note 3, Revenue, in the Notes to Consolidated Financial Statements. The preparation of these financial statements requires management to make estimates and assumptions that affect the reported amounts of assets, liabilities, revenue and expenses, and related disclosure of contingent assets and liabilities. Management bases its estimates on historical experience and on various other assumptions that are believed to be reasonable under the circumstances, the results of which form the basis for making judgments about the carrying values of assets and liabilities that are not readily apparent from other sources. Actual results may differ from these estimates under different assumptions or conditions. If actual amounts are ultimately different from previous estimates, the revisions are included in our results of operations for the period in which the actual amounts become known.
An accounting policy is deemed to be critical if it requires an accounting estimate to be made based on assumptions about matters that are highly uncertain at the time the estimate is made, there are different estimates that reasonably could have been used, or if changes in the accounting estimates are reasonably likely to occur periodically, that could materially impact the financial statements. Management believes the following critical accounting policies reflect its more significant estimates and assumptions used in the preparation of the Consolidated Financial Statements.
Revenue recognition. In our Executive Search segment, revenue is recognized as we satisfy our performance obligations by transferring a good or service to a client. Generally, each of our executive search contracts contain one performance obligation which is the process of identifying potentially qualified candidates for a specific client position. In most contracts, the transaction price includes both fixed and variable consideration. Fixed compensation is comprised of a retainer, equal to approximately one-third of the estimated first year compensation for the position to be filled, and indirect expenses, equal to a specified percentage of the retainer, as defined in the contract. The Company generally bills its clients for its retainer and indirect expenses in one-third increments over a three-month period commencing in the month of a client’s acceptance of the contract. If actual compensation of a placed candidate exceeds the original compensation estimate, the Company is often authorized to bill the client for one-third of the excess compensation. The Company refers to this additional billing as uptick revenue. In most contracts, variable consideration is comprised of uptick revenue and direct expenses. The Company bills its clients for uptick revenue upon completion of the executive search, and direct expenses are billed as incurred.
As required under Accounting Standards Update ("ASU") No. 2014-09, the Company estimates uptick revenue at contract inception, based on a portfolio approach, utilizing the expected value method based on a historical analysis of uptick revenue realized in the Company’s geographic regions and industry practices, and initially records a contract’s uptick revenue in an amount that is probable not to result in a significant reversal of cumulative revenue recognized when the actual amount of uptick revenue for that contract is known. Differences between the estimated and actual amounts of variable consideration are recorded when
26
known. The Company does not estimate revenue for direct expenses as it is not materially different than recognizing revenue as direct expenses are incurred.
Revenue from our executive search engagement performance obligation is recognized over time as our clients simultaneously receive and consume the benefits provided by the Company's performance. Revenue from executive search engagements is recognized over the expected average period of performance, in proportion to the estimated personnel time incurred to fulfill our obligations under the executive search contract. Revenue is generally recognized over a period of approximately six months.
Our executive search contracts contain a replacement guarantee which provides for an additional search to be completed, free of charge except for expense reimbursements, should the candidate presented by the Company be hired by the client and subsequently terminated by the client for performance reasons within a specified period of time. The replacement guarantee is an assurance warranty, which is not a performance obligation under the terms of the executive search contract, as the Company does not provide any services under the terms of the guarantee that transfer benefits to the client in excess of assuring that the identified candidate complies with the agreed-upon specifications. The Company accounts for the replacement guarantee under the relevant warranty guidance in ASC 460 - Guarantees.
In our Heidrick Consulting segment, revenue is recognized as we satisfy our performance obligations by transferring a good or service to a client. Heidrick Consulting enters into contracts with clients that outline the general terms and conditions of the assignment to provide succession planning, executive assessment, top team and board effectiveness and culture shaping programs. The consideration the Company expects to receive under each contract is generally fixed. Most of our consulting contracts contain one performance obligation, which is the overall process of providing the consulting service requested by the client. The majority of our consulting revenue is recognized over time utilizing both input and output methods. Contracts that contain coaching sessions, training sessions or the completion of assessments are recognized using the output method as each session or assessment is delivered to the client. Contracts that contain general consulting work are recognized using the input method utilizing a measure of progress that is based on time incurred on the project.
The Company enters into enterprise agreements with clients to provide a license for online access, via the Company's Culture Connect platform, to training and other proprietary material related to the Company's culture shaping programs. The consideration the Company expects to receive under the terms of an enterprise agreement is comprised of a single fixed fee. Our enterprise agreements contain multiple performance obligations, the delivery of materials via Culture Connect and material rights related to options to renew enterprise agreements at a significant discount. The Company allocates the transaction price to the performance obligations in the contract on a stand-alone selling price basis. The stand-alone selling price for the initial term of the enterprise agreement is outlined in the contract and is equal to the price paid by the client for the agreement over the initial term of the contract. The stand-alone selling price for the options to renew, or material right, are not directly observable and must be estimated. This estimate is required to reflect the discount the client would obtain when exercising the option to renew, adjusted for the likelihood that the option will be exercised. The Company estimates the likelihood of renewal using a historical analysis of client renewals. Access to Culture Connect represents a right to access the Company’s intellectual property that the client simultaneously receives and consumes as the Company performs under the agreement, and therefore the Company recognizes revenue over time. Given the continuous nature of this commitment, the Company utilizes straight-line ratable revenue recognition over the estimated subscription period as the Company's clients will receive and consume the benefits from Culture Connect equally throughout the contract period. Revenue related to client renewals of enterprise agreements is recognized over the term of the renewal, which is generally twelve months. Enterprise agreements do not comprise a significant portion of the Company's revenue.
Each of the Company's contracts has an expected duration of one year or less. Accordingly, the Company has elected to utilize the available practical expedient related to the disclosure of the transaction price allocated to the remaining performance obligations under its contracts. The Company has also elected the available practical expedients related to adjusting for the effects of a significant financing component and the capitalization of contract acquisition costs. The Company charges and collects from its clients, sales tax and value added taxes as required by certain jurisdictions. The Company has made an accounting policy election to exclude these items from the transaction price in its contracts.
Income taxes. Determining the consolidated provision for income tax expense, income tax liabilities and deferred tax assets and liabilities involves judgment. As a global company, we calculate and provide for income taxes in each of the tax jurisdictions in which we operate. This involves estimating current tax exposures in each jurisdiction as well as making judgments regarding the recoverability of deferred tax assets. Tax exposures can involve complex issues and may require an extended period to resolve. Changes in the geographic mix or estimated level of annual income before taxes can affect the overall effective tax rate.
The recognition of deferred tax assets is based on management’s belief that it is more likely than not that the tax benefits associated with temporary differences, net operating loss carryforwards and tax credits will be utilized. We assess the recoverability of the deferred tax assets on an ongoing basis. In making this assessment, we consider all positive and negative evidence, and all
27
potential sources of taxable income including scheduled reversals of deferred tax liabilities, tax-planning strategies, projected future taxable income and recent financial performance.
Deferred taxes have been recorded for U.S. income taxes and foreign withholding taxes related to undistributed foreign earnings that are not permanently reinvested. Annually, we assess material changes in estimates of cash, working capital and long-term investment requirements in order to determine whether these earnings should be distributed. If so, an additional provision for taxes may apply, which could materially affect our future effective tax rate.
Goodwill and other intangible assets. We review goodwill for impairment annually. We also review goodwill and long-lived assets, including identifiable intangible assets, for impairment whenever events or changes in circumstances indicate that it is more-likely-than-not that the fair value has fallen below the carrying amount of an asset. We review factors such as a significant change in business climate, attrition of key personnel, changes in financial condition or results of operations, a prolonged decline in our stock price and market capitalization, competition, and other factors to determine if an impairment test is necessary. Our annual impairment test begins with a qualitative assessment to determine whether it is necessary to perform a fair value-based goodwill impairment test. The qualitative assessment includes evaluating whether events and circumstances indicate that it is more-likely-than-not that fair values of reporting units are greater than the carrying values. If the qualitative factors do not indicate that it is more-likely-than-not that the fair values of the reporting units are greater than the carrying values, then we perform the fair value test.
The Company operates four reporting units: Americas, Europe (which includes Africa), Asia Pacific (which includes the Middle East) and Heidrick Consulting. The goodwill impairment test is completed by comparing the fair value of a reporting unit with its carrying amount. The fair value of each of the Company’s reporting units is determined using a discounted cash flow methodology. The discounted cash flow approach is dependent on a number of factors including estimates of future market growth and trends, forecasted revenue and costs, capital investments, appropriate discount rates, certain assumptions to allocate shared costs, assets and liabilities, historical and projected performance of our reporting units, the outlook for the executive search industry and the macroeconomic conditions affecting each of our reporting units. We base our fair value estimates on assumptions we believe to be reasonable, but which are unpredictable and inherently uncertain. The fair value of our reporting units is also impacted by our overall market capitalization and may be impacted by volatility in our stock price and assumed control premium, among other factors. As a result, actual future results may differ from those estimates and may result in a future impairment charge. These assumptions are updated annually, at a minimum, to reflect information concerning our reportable segments. The Company continues to monitor potential triggering events including changes in the business climate in which it operates, the Company’s market capitalization compared to its book value, and the Company’s recent operating performance. Any changes in these factors could result in an impairment charge. An impairment charge is recognized for the amount by which the carrying value of a reporting unit exceeds its carrying amount; however, the loss recognized is not to exceed the total amount of goodwill allocated to that reporting unit.
Additionally, we review long-lived assets, such as property, equipment, and purchased intangibles subject to amortization for impairment whenever events or changes in circumstances indicate that the carrying amount of an asset may not be recoverable. Recoverability of assets to be held and used is measured by a comparison of the carrying amount of an asset to estimated undiscounted future cash flows expected to be generated by the asset. If the carrying amount of an asset exceeds its estimated future cash flows, an impairment charge, equal to the amount by which the carrying amount of the asset exceeds the fair value of the asset, is recognized.
We believe that the accounting estimate related to goodwill and other intangible asset impairment is a critical accounting estimate because the assumptions used are highly susceptible to changes in the operating results and cash flows of our reportable segments.
Recently Adopted Financial Accounting Standards
On January 1, 2019, we adopted Accounting Standards Update ("ASU") No. 2016-02, Leases, ASU No. 2018-10, Codification Improvements to Topic 842 (Leases) and ASU No. 2018-11, Targeted Improvements to Topic 842 (Leases). The guidance is intended to increase transparency and comparability among companies for leasing transactions, including a requirement for companies that lease assets to recognize on their balance sheets the assets and liabilities for the rights and obligations created by those leases. The guidance also provides for disclosures that allow the users of financial statements to assess the amount, timing, and uncertainty of cash flows arising from leases.
We adopted the guidance using the modified retrospective method without restatement of comparative periods. As such, periods prior to the date of adoption are presented in accordance with ASC 840 - Leases. We utilized the available practical expedient that allowed for companies to not reassess whether existing contracts contain a lease under the new definition of a lease,
28
lease classification for existing leases and whether previously capitalized initial direct costs would qualify for capitalization under the new guidance.
The adoption of this guidance had a material impact on the Condensed Consolidated Balance Sheet as of December 31, 2019 due to the recognition of equal right-of-use assets and lease liabilities for our portfolio of operating leases. The right-of-use asset balance was then adjusted by the reclassification of pre-existing prepaid and accrued rent balances from other line items within the Condensed Consolidated Balance Sheet. The adoption had an immaterial impact on the Condensed Consolidated Statement of Comprehensive Income and Condensed Consolidated Statement of Cash Flows for the year ended December 31, 2019. The adoption had no impact on the Condensed Consolidated Statement of Changes in Stockholders' Equity for the year ended December 31, 2019.
Additional information and disclosures required by the new standard are contained in Note 6, Leases.
On January 1, 2019, we adopted ASU No. 2018-02, Income Statement - Reporting Comprehensive Income, which is intended to improve the usefulness of information reported as a result of the Tax Cuts and Jobs Act. The new guidance allows a reclassification from accumulated other comprehensive income to retained earnings for stranded tax effects resulting from the Tax Cuts and Jobs Act. The adoption of this guidance did not have an impact on our consolidated financial statements for the year ended December 31, 2019.
Recent Financial Accounting Standards
In December 2019, the Financial Accounting Standards Board ("FASB"), issued ASU No. 2019-12, Simplifying the Accounting for Income Taxes. The guidance simplifies the accounting for income taxes by eliminating certain exceptions to the guidance in Accounting Standards Codification ("ASC") 740 related to the approach for intraperiod tax allocation, the methodology for calculating income taxes in an interim period and the recognition of deferred tax liabilities for outside basis differences. The guidance also simplifies aspects of the accounting for franchise taxes and enacted changes in tax laws or rates and clarifies the accounting for transactions that result in a step-up in the tax basis of goodwill. The guidance is effective for fiscal years, and interim periods within those fiscal years, beginning after December 15, 2021. Early adoption is permitted. The Company is currently evaluating the impact of this accounting guidance. The effect is not known or reasonably estimable at this time.
In June 2016, the FASB issued ASU No. 2016-13, Measurement of Credit Losses on Financial Instruments. The guidance amends the impairment model by requiring entities to use a forward-looking approach based on expected losses to estimate credit losses on certain types of financial instruments, including trade receivables. The standard is effective for fiscal years beginning after December 15, 2019. The Company will adopt this guidance in its fiscal year beginning January 1, 2020. The adoption of this guidance is not anticipated to have a material impact on our consolidated financial statements.
Quarterly Financial Information (Unaudited)
The following table sets forth certain financial information for each quarter of 2019 and 2018. The information is derived from our quarterly consolidated financial statements which are unaudited but which, in the opinion of management, have been prepared on the same basis as the audited annual consolidated financial statements included in this document. The consolidated financial data shown below should be read in conjunction with the consolidated financial statements and notes thereto. The operating results for any quarter are not necessarily indicative of results for any future period.
29
Quarter Ended | ||||||||||||||||||||||||||||||||
2019 | 2018 | |||||||||||||||||||||||||||||||
Mar. 31 | Jun. 30 | Sept. 30 | Dec. 31 | Mar. 31 | Jun. 30 | Sept. 30 | Dec. 31 | |||||||||||||||||||||||||
Revenue before reimbursements (net revenue) | $ | 171,594 | $ | 173,122 | $ | 182,174 | $ | 180,034 | $ | 160,071 | $ | 183,059 | $ | 187,588 | $ | 185,305 | ||||||||||||||||
Operating income (1) | 16,391 | 18,353 | 14,472 | 14,295 | 13,121 | 18,461 | 20,583 | 16,692 | ||||||||||||||||||||||||
Income before income taxes | 18,842 | 19,473 | 14,827 | 16,147 | 12,912 | 18,411 | 23,187 | 15,982 | ||||||||||||||||||||||||
Provision for income taxes | 6,755 | 5,193 | 4,880 | 5,592 | 2,744 | 6,948 | 6,718 | 4,787 | ||||||||||||||||||||||||
Net income | $ | 12,087 | $ | 14,280 | $ | 9,947 | $ | 10,555 | $ | 10,168 | $ | 11,463 | $ | 16,469 | $ | 11,195 | ||||||||||||||||
Basic earnings per common share | $ | 0.64 | $ | 0.75 | $ | 0.52 | $ | 0.55 | $ | 0.54 | $ | 0.61 | $ | 0.87 | $ | 0.59 | ||||||||||||||||
Diluted earnings per common share | $ | 0.62 | $ | 0.73 | $ | 0.51 | $ | 0.54 | $ | 0.53 | $ | 0.59 | $ | 0.85 | $ | 0.58 | ||||||||||||||||
Cash dividends paid per share | $ | 0.15 | $ | 0.15 | $ | 0.15 | $ | 0.15 | $ | 0.13 | $ | 0.13 | $ | 0.13 | $ | 0.13 | ||||||||||||||||
(1) Includes $4.1 million of restructuring charges for the three months ended September 30, 2019.
30
ITEM 7A. QUANTITATIVE AND QUALITATIVE DISCLOSURES ABOUT MARKET RISK
Currency market risk. With our operations in the Americas, Europe and Asia Pacific, we conduct business using various currencies. Revenue earned in each country is generally matched with the associated expenses incurred, thereby reducing currency risk to earnings. A 10% change in the average exchange rate for currencies of all foreign countries in which we operate would have increased or decreased our 2019 net income by approximately $0.9 million. However, because certain assets and liabilities are denominated in currencies other than their respective functional currency, changes in currency rates may cause fluctuations in the valuation of such assets and liabilities. Based on balances exposed to fluctuation in exchange rates as of December 31, 2019, a 10% increase or decrease equally in the value of currencies could result in a foreign exchange gain or loss of approximately $1.4 million. In addition, as the local currency of our subsidiaries has generally been designated as the functional currency, we are affected by the translation of foreign currency financial statements into U.S. dollars. For financial information by segment, see Note 18, Segment Information, in the Notes to Consolidated Financial Statements.
31
ITEM 8. FINANCIAL STATEMENTS AND SUPPLEMENTARY DATA
HEIDRICK & STRUGGLES INTERNATIONAL, INC. AND SUBSIDIARIES
INDEX TO CONSOLIDATED FINANCIAL STATEMENTS
PAGE | |
32
Report of Independent Registered Public Accounting Firm
To the Stockholders and the Board of Directors
Heidrick & Struggles International, Inc.
Opinion on the Financial Statements
We have audited the accompanying consolidated balance sheets of Heidrick & Struggles International, Inc. (the Company) as of December 31, 2019 and 2018, the related consolidated statements of comprehensive income (loss), changes in stockholders' equity and cash flows for each of the two years in the period ended December 31, 2019, and the related notes to the consolidated financial statements (collectively, the financial statements). In our opinion, the financial statements present fairly, in all material respects, the financial position of the Company as of December 31, 2019 and 2018, and the results of its operations and its cash flows for each of the two years in the period ended December 31, 2019, in conformity with accounting principles generally accepted in the United States of America.
We have also audited, in accordance with the standards of the Public Company Accounting Oversight Board (United States) (PCAOB), the Company's internal control over financial reporting as of December 31, 2019, based on criteria established in Internal Control - Integrated Framework issued by the Committee of Sponsoring Organizations of the Treadway Commission in 2013, and our report dated February 24, 2020 expressed an unqualified opinion on the effectiveness of the Company's internal control over financial reporting.
Lease Accounting
As discussed in Note 6 to the financial statements, the Company has changed its method of accounting for leases in 2019 due to the adoption of ASC 842 - Leases.
Segment Reporting
As discussed in Note 18 to the financial statements, the Company changed the composition of its segment information in 2018. We audited the adjustments necessary to restate the 2017 segment information provided in Note 18. In our opinion, such adjustments are appropriate and have been properly applied.
Basis for Opinion
These financial statements are the responsibility of the Company’s management. Our responsibility is to express an opinion on the Company’s financial statements based on our audits. We are a public accounting firm registered with the PCAOB and are required to be independent with respect to the Company in accordance with U.S. federal securities laws and the applicable rules and regulations of the Securities and Exchange Commission and the PCAOB.
We conducted our audits in accordance with the standards of the PCAOB. Those standards require that we plan and perform the audits to obtain reasonable assurance about whether the financial statements are free of material misstatement, whether due to error or fraud. Our audits included performing procedures to assess the risks of material misstatement of the financial statements, whether due to error or fraud, and performing procedures that respond to those risks. Such procedures included examining, on a test basis, evidence regarding the amounts and disclosures in the financial statements. Our audits also included evaluating the accounting principles used and significant estimates made by management, as well as evaluating the overall presentation of the financial statements. We believe that our audits provide a reasonable basis for our opinion.
/s/ RSM US LLP
We have served as the Company's auditor since 2018
Chicago, Illinois
February 24, 2020
33
Report of Independent Registered Public Accounting Firm
To the Stockholders and the Board of Directors
Heidrick & Struggles International, Inc.
Opinion on the Internal Control Over Financial Reporting
We have audited Heidrick & Struggles International, Inc.'s (the Company) internal control over financial reporting as of December 31, 2019, based on criteria established in Internal Control - Integrated Framework issued by the Committee of Sponsoring Organizations of the Treadway Commission in 2013. In our opinion, the Company maintained, in all material respects, effective internal control over financial reporting as of December 31, 2019, based on criteria established in Internal Control - Integrated Framework issued by the Committee of Sponsoring Organizations of the Treadway Commission in 2013.
We have also audited, in accordance with the standards of the Public Company Accounting Oversight Board (United States) (PCAOB), the consolidated balance sheets as of December 31, 2019 and 2018, and the related consolidated statements of comprehensive income (loss), changes in stockholders' equity and cash flows of the Company for each of the two years in the period ended December 31, 2019, and our report dated February 24, 2020 expressed an unqualified opinion.
Basis for Opinion
The Company’s management is responsible for maintaining effective internal control over financial reporting and for its assessment of the effectiveness of internal control over financial reporting in the accompanying Management’s Report on Internal Control over Financial Reporting. Our responsibility is to express an opinion on the Company’s internal control over financial reporting based on our audit. We are a public accounting firm registered with the PCAOB and are required to be independent with respect to the Company in accordance with U.S. federal securities laws and the applicable rules and regulations of the Securities and Exchange Commission and the PCAOB.
We conducted our audit in accordance with the standards of the PCAOB. Those standards require that we plan and perform the audit to obtain reasonable assurance about whether effective internal control over financial reporting was maintained in all material respects. Our audit included obtaining an understanding of internal control over financial reporting, assessing the risk that a material weakness exists, and testing and evaluating the design and operating effectiveness of internal control based on the assessed risk. Our audit also included performing such other procedures as we considered necessary in the circumstances. We believe that our audit provides a reasonable basis for our opinion.
Definition and Limitations of Internal Control Over Financial Reporting
A company's internal control over financial reporting is a process designed to provide reasonable assurance regarding the reliability of financial reporting and the preparation of financial statements for external purposes in accordance with generally accepted accounting principles. A company's internal control over financial reporting includes those policies and procedures that (1) pertain to the maintenance of records that, in reasonable detail, accurately and fairly reflect the transactions and dispositions of the assets of the company; (2) provide reasonable assurance that transactions are recorded as necessary to permit preparation of financial statements in accordance with generally accepted accounting principles, and that receipts and expenditures of the company are being made only in accordance with authorizations of management and directors of the company; and (3) provide reasonable assurance regarding prevention or timely detection of unauthorized acquisition, use or disposition of the company's assets that could have a material effect on the financial statements.
Because of its inherent limitations, internal control over financial reporting may not prevent or detect misstatements. Also, projections of any evaluation of effectiveness to future periods are subject to the risk that controls may become inadequate because of changes in conditions, or that the degree of compliance with the policies or procedures may deteriorate.
/s/ RSM US LLP
Chicago, Illinois
February 24, 2020
34
Report of Independent Registered Public Accounting Firm
To the Stockholders and Board of Directors
Heidrick & Struggles International, Inc.:
Opinion on the Consolidated Financial Statements
We have audited, before the effects of the adjustments to retrospectively apply the change in accounting described in Note 18, the consolidated statements of comprehensive loss, changes in stockholders’ equity, and cash flows of Heidrick & Struggles International, Inc. and subsidiaries (the Company) for the year ended December 31, 2017, and the related notes (collectively, the consolidated financial statements). The 2017 consolidated financial statements before the effects of the adjustments described in Note 18 are not presented herein. In our opinion, the consolidated financial statements, before the effects of the adjustments to retrospectively apply the change in accounting described in Note 18, present fairly, in all material respects, the results of operations of the Company and its cash flows for the year ended December 31, 2017, in conformity with U.S. generally accepted accounting principles.
We were not engaged to audit, review, or apply any procedures to the adjustments to retrospectively apply the change in accounting described in Note 18 and, accordingly, we do not express an opinion or any other form of assurance about whether such adjustments are appropriate and have been properly applied. Those adjustments were audited by other auditors.
Basis for Opinion
These consolidated financial statements are the responsibility of the Company’s management. Our responsibility is to express an opinion on these consolidated financial statements based on our audit. We are a public accounting firm registered with the Public Company Accounting Oversight Board (United States) (PCAOB) and are required to be independent with respect to the Company in accordance with the U.S. federal securities laws and the applicable rules and regulations of the Securities and Exchange Commission and the PCAOB.
We conducted our audit in accordance with the standards of the PCAOB. Those standards require that we plan and perform the audit to obtain reasonable assurance about whether the consolidated financial statements are free of material misstatement, whether due to error or fraud. Our audit included performing procedures to assess the risks of material misstatement of the consolidated financial statements, whether due to error or fraud, and performing procedures that respond to those risks. Such procedures included examining, on a test basis, evidence regarding the amounts and disclosures in the consolidated financial statements. Our audit also included evaluating the accounting principles used and significant estimates made by management, as well as evaluating the overall presentation of the consolidated financial statements. We believe that our audit provides a reasonable basis for our opinion.
/s/ KPMG LLP
We served as the Company’s auditor from 2002 to 2018.
Chicago, Illinois
March 13, 2018
35
HEIDRICK & STRUGGLES INTERNATIONAL, INC. AND SUBSIDIARIES
CONSOLIDATED BALANCE SHEETS
(In thousands, except share amounts)
December 31, 2019 | December 31, 2018 | |||||||
Current assets: | ||||||||
Cash and cash equivalents | $ | 271,719 | $ | 279,906 | ||||
Marketable securities | 61,153 | — | ||||||
Accounts receivable, net | 109,163 | 114,977 | ||||||
Prepaid expenses | 20,185 | 22,766 | ||||||
Other current assets | 27,848 | 29,598 | ||||||
Income taxes recoverable | 4,414 | 3,620 | ||||||
Total current assets | 494,482 | 450,867 | ||||||
Non-current assets: | ||||||||
Property and equipment, net | 28,650 | 33,871 | ||||||
Operating lease right-of-use assets | 99,391 | — | ||||||
Assets designated for retirement and pension plans | 13,978 | 15,035 | ||||||
Investments | 25,409 | 19,442 | ||||||
Other non-current assets | 20,434 | 22,276 | ||||||
Goodwill | 126,831 | 122,092 | ||||||
Other intangible assets, net | 1,935 | 2,216 | ||||||
Deferred income taxes, net | 33,063 | 34,830 | ||||||
Total non-current assets | 349,691 | 249,762 | ||||||
Total assets | $ | 844,173 | $ | 700,629 | ||||
Current liabilities: | ||||||||
Accounts payable | $ | 8,633 | $ | 9,166 | ||||
Accrued salaries and benefits | 234,306 | 227,653 | ||||||
Deferred revenue | 41,267 | 40,673 | ||||||
Operating lease liabilities | 30,955 | — | ||||||
Other current liabilities | 26,253 | 33,219 | ||||||
Income taxes payable | 3,928 | 8,240 | ||||||
Total current liabilities | 345,342 | 318,951 | ||||||
Non-current liabilities: | ||||||||
Accrued salaries and benefits | 59,662 | 57,234 | ||||||
Retirement and pension plans | 46,032 | 39,865 | ||||||
Operating lease liabilities | 79,388 | — | ||||||
Other non-current liabilities | 4,634 | 17,423 | ||||||
Total non-current liabilities | 189,716 | 114,522 | ||||||
Total liabilities | 535,058 | 433,473 | ||||||
Commitments and contingencies (Note 20) | ||||||||
Stockholders’ equity: | ||||||||
Preferred stock, $0.01 par value, 10,000,000 shares authorized, no shares issued at December 31, 2019 and December 31, 2018 | — | — | ||||||
Common stock, $0.01 par value, 100,000,000 shares authorized, 19,585,777 shares issued, 19,165,954 and 18,954,275 shares outstanding at December 31, 2019 and December 31, 2018, respectively | 196 | 196 | ||||||
Treasury stock at cost, 419,823 and 631,502 shares at December 31, 2019 and December 31, 2018, respectively | (14,795 | ) | (20,298 | ) | ||||
Additional paid in capital | 228,807 | 227,147 | ||||||
Retained earnings | 91,083 | 56,049 | ||||||
Accumulated other comprehensive income | 3,824 | 4,062 | ||||||
Total stockholders’ equity | 309,115 | 267,156 | ||||||
Total liabilities and stockholders’ equity | $ | 844,173 | $ | 700,629 | ||||
The accompanying notes to Consolidated Financial Statements are an integral part of these statements.
36
HEIDRICK & STRUGGLES INTERNATIONAL, INC. AND SUBSIDIARIES
CONSOLIDATED STATEMENTS OF COMPREHENSIVE INCOME (LOSS)
(In thousands, except per share amounts)
December 31, | ||||||||||||
2019 | 2018 | 2017 | ||||||||||
Revenue: | ||||||||||||
Revenue before reimbursements (net revenue) | $ | 706,924 | $ | 716,023 | $ | 621,400 | ||||||
Reimbursements | 18,690 | 19,632 | 18,656 | |||||||||
Total revenue | 725,614 | 735,655 | 640,056 | |||||||||
Operating expenses: | ||||||||||||
Salaries and benefits | 501,791 | 506,349 | 434,219 | |||||||||
General and administrative expenses | 137,492 | 140,817 | 147,316 | |||||||||
Impairment charges | — | — | 50,722 | |||||||||
Restructuring charges | 4,130 | — | 15,666 | |||||||||
Reimbursed expenses | 18,690 | 19,632 | 18,656 | |||||||||
Total operating expenses | 662,103 | 666,798 | 666,579 | |||||||||
Operating income (loss) | 63,511 | 68,857 | (26,523 | ) | ||||||||
Non-operating income (expense): | ||||||||||||
Interest, net | 2,880 | 1,141 | 385 | |||||||||
Other, net | 2,898 | 494 | (3,280 | ) | ||||||||
Net non-operating income (expense) | 5,778 | 1,635 | (2,895 | ) | ||||||||
Income (loss) before income taxes | 69,289 | 70,492 | (29,418 | ) | ||||||||
Provision for income taxes | 22,420 | 21,197 | 19,217 | |||||||||
Net income (loss) | 46,869 | 49,295 | (48,635 | ) | ||||||||
Other comprehensive income (loss), net of tax: | ||||||||||||
Foreign currency translation adjustment | 844 | (3,885 | ) | 6,853 | ||||||||
Net unrealized gain on available-for-sale investments | 13 | — | 2,660 | |||||||||
Pension gain (loss) adjustment | (1,095 | ) | 721 | 480 | ||||||||
Other comprehensive income (loss), net of tax | (238 | ) | (3,164 | ) | 9,993 | |||||||
Comprehensive income (loss) | $ | 46,631 | $ | 46,131 | $ | (38,642 | ) | |||||
Basic weighted average common shares outstanding | 19,103 | 18,917 | 18,735 | |||||||||
Diluted weighted average common shares outstanding | 19,551 | 19,532 | 18,735 | |||||||||
Basic net income (loss) per common share | $ | 2.45 | $ | 2.61 | $ | (2.60 | ) | |||||
Diluted net income (loss) per common share | $ | 2.40 | $ | 2.52 | $ | (2.60 | ) | |||||
Cash dividends paid per share | $ | 0.60 | $ | 0.52 | $ | 0.52 | ||||||
The accompanying notes to Consolidated Financial Statements are an integral part of these statements.
37
HEIDRICK & STRUGGLES INTERNATIONAL, INC. AND SUBSIDIARIES
CONSOLIDATED STATEMENTS OF CASH FLOWS
(In thousands)
Year Ended December 31, | ||||||||||||
2019 | 2018 | 2017 | ||||||||||
Cash flows - operating activities: | ||||||||||||
Net income (loss) | $ | 46,869 | $ | 49,295 | $ | (48,635 | ) | |||||
Adjustments to reconcile net income (loss) to net cash provided by operating activities: | ||||||||||||
Depreciation and amortization | 10,371 | 12,522 | 14,774 | |||||||||
Deferred income taxes | 1,644 | (3,496 | ) | (1,690 | ) | |||||||
Stock-based compensation expense | 10,298 | 8,947 | 4,935 | |||||||||
Accretion expense related to earnout payments | 668 | 1,285 | 1,038 | |||||||||
Impairment charges | — | — | 50,722 | |||||||||
Gain on marketable securities | (595 | ) | — | — | ||||||||
Changes in assets and liabilities, net of effects of acquisitions: | ||||||||||||
Accounts receivable | 6,899 | (16,759 | ) | (1,882 | ) | |||||||
Accounts payable | (994 | ) | (526 | ) | 1,474 | |||||||
Accrued expenses | 2,441 | 71,526 | 18,330 | |||||||||
Restructuring accrual | 1,959 | (11,617 | ) | 13,025 | ||||||||
Deferred revenue | 175 | (1,899 | ) | 2,010 | ||||||||
Income taxes (payable) recoverable, net | (5,450 | ) | 757 | 3,381 | ||||||||
Retirement and pension plan assets and liabilities | 3,258 | (1,492 | ) | 3,065 | ||||||||
Prepaid expenses | (455 | ) | (893 | ) | 797 | |||||||
Other assets and liabilities, net | 1,557 | (4,748 | ) | 5,626 | ||||||||
Net cash provided by operating activities | 78,645 | 102,902 | 66,970 | |||||||||
Cash flows - investing activities: | ||||||||||||
Acquisition of businesses, net of cash acquired | (3,520 | ) | (3,083 | ) | (364 | ) | ||||||
Capital expenditures | (3,352 | ) | (5,960 | ) | (14,022 | ) | ||||||
Purchases of available for sale investments | (130,411 | ) | (2,201 | ) | (2,269 | ) | ||||||
Proceeds from sale of available for sale investments | 67,968 | 2,995 | 1,404 | |||||||||
Net cash used in investing activities | (69,315 | ) | (8,249 | ) | (15,251 | ) | ||||||
Cash flows - financing activities: | ||||||||||||
Proceeds from line of credit | — | 20,000 | 40,000 | |||||||||
Payments on line of credit | — | (20,000 | ) | (40,000 | ) | |||||||
Debt issuance costs | — | (981 | ) | — | ||||||||
Cash dividends paid | (11,835 | ) | (10,181 | ) | (10,111 | ) | ||||||
Payment of employee tax withholdings on equity transactions | (4,552 | ) | (2,234 | ) | (2,392 | ) | ||||||
Acquisition earnout payments | (1,853 | ) | (3,592 | ) | (4,557 | ) | ||||||
Net cash used in financing activities | (18,240 | ) | (16,988 | ) | (17,060 | ) | ||||||
Effect of exchange rates fluctuations on cash, cash equivalents and restricted cash | 367 | (5,565 | ) | 7,933 | ||||||||
Net increase (decrease) in cash, cash equivalents and restricted cash | (8,543 | ) | 72,100 | 42,592 | ||||||||
Cash, cash equivalents and restricted cash at beginning of period | 280,262 | 208,162 | 165,570 | |||||||||
Cash, cash equivalents and restricted cash at end of period | $ | 271,719 | $ | 280,262 | $ | 208,162 | ||||||
Supplemental disclosures of cash flow information | ||||||||||||
Cash paid for | ||||||||||||
Income taxes | $ | 27,338 | $ | 22,616 | $ | 14,814 | ||||||
Interest | $ | — | $ | 67 | $ | 193 | ||||||
The accompanying notes to Consolidated Financial Statements are an integral part of these statements.
38
HEIDRICK & STRUGGLES INTERNATIONAL, INC. AND SUBSIDIARIES
CONSOLIDATED STATEMENTS OF CHANGES IN STOCKHOLDERS’ EQUITY
(In thousands)
Common Stock | Treasury Stock | Additional Paid in Capital | Retained Earnings (Deficit) | Accumulated Other Comprehensive Income | Total | |||||||||||||||||||||||||
Shares | Amount | Shares | Amount | |||||||||||||||||||||||||||
Balance at December 31, 2016 | 19,586 | $ | 196 | 1,008 | $ | (32,915 | ) | $ | 229,957 | $ | 58,030 | $ | 3,322 | $ | 258,590 | |||||||||||||||
Net loss | — | — | — | — | — | (48,635 | ) | — | (48,635 | ) | ||||||||||||||||||||
Other comprehensive income, net of tax | — | — | — | — | — | — | 9,993 | 9,993 | ||||||||||||||||||||||
Treasury and common stock transactions: | ||||||||||||||||||||||||||||||
Stock-based compensation | — | — | — | — | 4,935 | — | — | 4,935 | ||||||||||||||||||||||
Vesting of equity, net of tax withholdings | — | — | (188 | ) | 6,311 | (8,716 | ) | — | — | (2,405 | ) | |||||||||||||||||||
Re-issuance of treasury stock | — | — | (15 | ) | 508 | (170 | ) | — | — | 338 | ||||||||||||||||||||
Cash dividends declared ($0.52 per share) | — | — | — | — | — | (9,762 | ) | — | (9,762 | ) | ||||||||||||||||||||
Dividend equivalents on restricted stock units | — | — | — | — | — | (349 | ) | — | (349 | ) | ||||||||||||||||||||
Balance at December 31, 2017 | 19,586 | 196 | 805 | (26,096 | ) | 226,006 | (716 | ) | 13,315 | 212,705 | ||||||||||||||||||||
Net income | — | — | — | — | — | 49,295 | — | 49,295 | ||||||||||||||||||||||
Adoption of accounting standards | — | — | — | — | — | 15,043 | (6,089 | ) | 8,954 | |||||||||||||||||||||
Other comprehensive loss, net of tax | — | — | — | — | — | — | (3,164 | ) | (3,164 | ) | ||||||||||||||||||||
Treasury and common stock transactions: | ||||||||||||||||||||||||||||||
Stock-based compensation | — | — | — | — | 8,947 | — | — | 8,947 | ||||||||||||||||||||||
Vesting of equity, net of tax withholdings | — | — | (167 | ) | 5,604 | (7,837 | ) | — | — | (2,233 | ) | |||||||||||||||||||
Re-issuance of treasury stock | — | — | (6 | ) | 194 | 31 | — | — | 225 | |||||||||||||||||||||
Cash dividends declared ($0.39 per share) | — | — | — | — | — | (7,389 | ) | — | (7,389 | ) | ||||||||||||||||||||
Dividend equivalents on restricted stock units | — | — | — | — | — | (184 | ) | — | (184 | ) | ||||||||||||||||||||
Balance at December 31, 2018 | 19,586 | 196 | 632 | (20,298 | ) | 227,147 | 56,049 | 4,062 | 267,156 | |||||||||||||||||||||
Net income | — | — | — | — | — | 46,869 | — | 46,869 | ||||||||||||||||||||||
Other comprehensive loss, net of tax | — | — | — | — | — | — | (238 | ) | (238 | ) | ||||||||||||||||||||
Treasury and common stock transactions: | ||||||||||||||||||||||||||||||
Stock-based compensation | — | — | — | — | 10,298 | — | — | 10,298 | ||||||||||||||||||||||
Vesting of equity, net of tax withholdings | — | — | (163 | ) | 5,154 | (9,706 | ) | — | — | (4,552 | ) | |||||||||||||||||||
Re-issuance of treasury stock | — | — | (49 | ) | 349 | 1,068 | — | — | 1,417 | |||||||||||||||||||||
Cash dividends declared ($0.60 per share) | — | — | — | — | — | (11,461 | ) | — | (11,461 | ) | ||||||||||||||||||||
Dividend equivalents on restricted stock units | — | — | — | — | — | (374 | ) | — | (374 | ) | ||||||||||||||||||||
Balance at December 31, 2019 | 19,586 | $ | 196 | 420 | $ | (14,795 | ) | $ | 228,807 | $ | 91,083 | $ | 3,824 | $ | 309,115 | |||||||||||||||
The accompanying notes to Consolidated Financial Statements are an integral part of these statements.
39
HEIDRICK & STRUGGLES INTERNATIONAL, INC. AND SUBSIDIARIES
NOTES TO CONSOLIDATED FINANCIAL STATEMENTS
(All tables in thousands, except share and per share figures)
1. | Basis of Presentation |
Heidrick & Struggles International, Inc. and subsidiaries (the “Company”) is engaged in providing executive search and consulting services to clients on a retained basis. The Company operates in the Americas, Europe and Asia Pacific regions.
The consolidated financial statements include Heidrick & Struggles International, Inc. and its wholly owned subsidiaries and have been prepared using accounting principles generally accepted in the United States of America (“GAAP”). The preparation of these financial statements in conformity with GAAP requires management to make estimates and assumptions that affect the reported amounts of assets, liabilities, revenues and expenses. Significant items subject to estimates and assumptions include revenue recognition, allowances for deferred tax assets and liabilities, and assessment of goodwill and other intangible assets for impairment. Estimates are subject to a degree of uncertainty and actual results could differ from these estimates.
2. | Summary of Significant Accounting Policies |
Cash and Cash Equivalents
The Company considers all highly liquid instruments with an original maturity of three months or less to be cash equivalents.
Marketable Securities
The Company’s marketable securities consist of available-for-sale debt securities with original maturities exceeding three months.
Concentration of Risk
The Company is potentially exposed to concentrations of risk associated with its accounts receivable. However, this risk is limited due to the Company’s large number of clients and their dispersion across many different industries and geographies. At December 31, 2019 and 2018, the Company had no significant concentrations of risk.
Accounts Receivable
The Company’s accounts receivable consists of trade receivables. The allowance for doubtful accounts is developed based upon several factors including the age of the Company’s accounts receivable, historical write-off experience and specific account analysis. These factors may change over time, impacting the allowance level.
Fair Value of Financial Instruments
Cash equivalents are stated at cost, which approximates fair value. The carrying value for receivables from clients, accounts payable, deferred revenue and other accrued liabilities reasonably approximate fair value due to the nature of the financial instruments and the short-term nature of the items.
Property and Equipment
Property and equipment are stated at cost. Depreciation is computed using the straight-line method over the estimated useful life of the asset or, for leasehold improvements, the shorter of the lease term or the estimated useful life of the asset, as follows:
Office furniture, fixtures and equipment | 5–10 years | |
Computer equipment and software | 3–7 years | |
Leasehold improvements are depreciated over the lesser of the lease term or life of the asset improvement, which typically range from three to ten years.
Depreciation is calculated for tax purposes using accelerated methods, where applicable.
40
Long-lived Assets
The Company reviews its long-lived assets, including property and equipment, for impairment whenever events or changes in circumstances indicate that the carrying amount of an asset may not be recoverable. Recoverability of assets to be held and used is measured by a comparison of the carrying amount of an asset to estimated undiscounted future cash flows expected to be generated by the asset. If the carrying amount of an asset exceeds its estimated future cash flows, an impairment charge, equal to the amount by which the carrying amount of the asset exceeds the fair value of the asset, is recognized.
Investments
The Company’s investments consist primarily of available-for-sale investments within the U.S. non-qualified deferred compensation plan (the “Plan”).
Available-for-sale investments are reported at fair value with changes in unrealized gains (losses) and realized gains (losses) recorded as a non-operating expense in Other, net in the Consolidated Statements of Comprehensive Income (Loss).
Goodwill and Other Intangible Assets
Goodwill represents the difference between the purchase price of acquired companies and the related fair value of the net assets acquired, which is accounted for by the acquisition method of accounting. Other intangible assets include client relationships, trade names, and employee non-compete agreements. The Company performs assessments of the carrying value of goodwill at least annually and of its goodwill and other intangible assets whenever events occur or circumstances indicate that a carrying amount of these assets may not be recoverable. These circumstances include a significant change in business climate, attrition of key personnel, changes in financial condition or results of operations, a prolonged decline in the Company’s stock price and market capitalization, competition, and other factors.
The goodwill impairment test compares the fair value of a reporting unit to its carrying amount, including goodwill. The Company operates four reporting units: Americas, Europe (which includes Africa), Asia Pacific (which includes the Middle East) and Heidrick Consulting. The goodwill impairment test is completed by comparing the fair value of a reporting unit with its carrying amount. The fair value of each of the Company’s reporting units is determined using a discounted cash flow methodology. An impairment charge is recognized for the amount by which the carrying value of the reporting unit exceeds its fair value; however, the loss recognized is not to exceed the total amount of goodwill allocated to that reporting unit.
The other intangible asset impairment review compares the carrying amount of an asset to estimated undiscounted future cash flows expected to be generated by the asset. If the carrying amount of an asset exceeds its estimated future cash flows, an impairment charge, equal to the amount by which the carrying amount of the asset exceeds the fair value, is recognized.
Other intangible assets acquired are amortized either using the straight-line method over their estimated useful lives or based on the projected cash flow associated with the respective intangible assets.
Restructuring Charges
The Company accounts for restructuring charges by recognizing a liability at fair value when the costs are incurred.
Revenue Recognition
See Note 3, Revenue.
Reimbursements
The Company incurs certain out-of-pocket expenses that are reimbursed by its clients, which are accounted for as revenue and expense in its Consolidated Statements of Comprehensive Income (Loss).
Salaries and Benefits
Salaries and benefits consist of compensation and benefits paid to consultants, executive officers, and administrative and support personnel, of which the most significant elements are salaries and annual performance-related bonuses. Other items in this category are expenses related to sign-on bonuses, forgivable employee loans and minimum guaranteed bonuses (often incurred
41
in connection with the hiring of new consultants), restricted stock unit and performance share unit amortization, payroll taxes, profit sharing and retirement benefits, and employee insurance benefits.
Salaries and benefits are recognized on an accrual basis. Certain sign-on bonuses, retention awards, and minimum guaranteed compensation are capitalized and amortized in accordance with the terms of the respective agreements.
A portion of the Company’s consultants’ and management cash bonuses are deferred and paid over a three-year vesting period. The portion of the bonus is approximately 15% depending on the employee’s level or position. The compensation expense related to the amounts being deferred is recognized on a graded vesting attribution method over the requisite service period. This service period begins on January 1 of the respective fiscal year and continues through the deferral date, which coincides with the Company’s bonus payments in the first quarter of the following year and for an additional three-year vesting period. The deferrals are recorded in Accrued salaries and benefits within both Current liabilities and Non-current liabilities in the Consolidated Balance Sheets.
Income Taxes
Deferred tax assets and liabilities are determined based on the differences between the financial statement and tax basis of assets and liabilities, applying enacted statutory tax rates in effect for the year in which the tax differences are expected to reverse. Deferred tax assets are reduced by a valuation allowance when, in the opinion of management, it is more likely than not that some portion or all of the deferred tax assets will not be realized. Deferred tax assets and liabilities are adjusted for the effects of changes in tax laws and rates on the date of enactment.
Earnings per Common Share
Basic earnings per common share is computed by dividing net income (loss) by weighted average common shares outstanding for the year. Diluted earnings (loss) per share reflect the potential dilution that could occur if securities or other contracts to issue common stock were exercised or converted. Common equivalent shares are excluded from the determination of diluted earnings per share in periods in which they have an anti-dilutive effect.
The following table sets forth the computation of basic and diluted earnings (loss) per share:
December 31, | |||||||||||
2019 | 2018 | 2017 | |||||||||
Net income (loss) | $ | 46,869 | $ | 49,295 | $ | (48,635 | ) | ||||
Weighted average shares outstanding: | |||||||||||
Basic | 19,103 | 18,917 | 18,735 | ||||||||
Effect of dilutive securities: | |||||||||||
Restricted stock units | 285 | 406 | — | ||||||||
Performance stock units | 163 | 209 | — | ||||||||
Diluted | 19,551 | 19,532 | 18,735 | ||||||||
Basic earnings (loss) per share | $ | 2.45 | $ | 2.61 | $ | (2.60 | ) | ||||
Diluted earnings (loss) per share | $ | 2.40 | $ | 2.52 | $ | (2.60 | ) | ||||
Weighted average restricted stock units and performance stock units outstanding that could be converted into approximately 327,000 and 80,000 common shares, respectively, for the year ended December 31, 2017, were not included in the computation of diluted loss per share because the effects would be anti-dilutive.
Translation of Foreign Currencies
The Company generally designates the local currency for all its subsidiaries as the functional currency. The Company translates the assets and liabilities of its subsidiaries into U.S. dollars at the current rate of exchange prevailing at the balance sheet date. Revenue and expenses are translated at a monthly average exchange rate for the period. Translation adjustments are reported as a component of Accumulated other comprehensive income.
Restricted Cash
Historically, the Company had lease agreements and business licenses with terms that required the Company to restrict cash through the termination dates of the agreements. Current and non-current restricted cash is included in Other current assets and Other non-current assets, respectively, in the Condensed Consolidated Balance Sheets.
42
The following table provides a reconciliation of the cash and cash equivalents between the Condensed Consolidated Balance Sheets and the Condensed Consolidated Statement of Cash Flows as of December 31, 2019, 2018 and 2017:
December 31, | |||||||||||
2019 | 2018 | 2017 | |||||||||
Cash and cash equivalents | $ | 271,719 | $ | 279,906 | $ | 207,534 | |||||
Restricted cash included within other current assets | — | 108 | 526 | ||||||||
Restricted cash included within other non-current assets | — | 248 | 102 | ||||||||
Total cash, cash equivalents and restricted cash | $ | 271,719 | $ | 280,262 | $ | 208,162 | |||||
Recently Issued Financial Accounting Standards
In December 2019, the Financial Accounting Standards Board ("FASB"), issued ASU No. 2019-12, Simplifying the Accounting for Income Taxes. The guidance simplifies the accounting for income taxes by eliminating certain exceptions to the guidance in Accounting Standards Codification ("ASC") 740 related to the approach for intraperiod tax allocation, the methodology for calculating income taxes in an interim period and the recognition of deferred tax liabilities for outside basis differences. The guidance also simplifies aspects of the accounting for franchise taxes and enacted changes in tax laws or rates and clarifies the accounting for transactions that result in a step-up in the tax basis of goodwill. The guidance is effective for fiscal years, and interim periods within those fiscal years, beginning after December 15, 2021. Early adoption is permitted. The Company is currently evaluating the impact of this accounting guidance. The effect is not known or reasonably estimable at this time.
In June 2016, the FASB issued ASU No. 2016-13, Measurement of Credit Losses on Financial Instruments. The guidance amends the impairment model by requiring entities to use a forward-looking approach based on expected losses to estimate credit losses on certain types of financial instruments, including trade receivables. The standard is effective for fiscal years beginning after December 15, 2019. The Company will adopt this guidance in its fiscal year beginning January 1, 2020. The adoption of this guidance is not anticipated to have a material impact on our consolidated financial statements.
Recently Adopted Financial Accounting Standards
On January 1, 2019, the Company adopted ASU No. 2016-02, Leases, ASU No. 2018-10, Codification Improvements to Topic 842 (Leases) and ASU No. 2018-11, Targeted Improvements to Topic 842 (Leases). The guidance is intended to increase transparency and comparability among companies for leasing transactions, including a requirement for companies that lease assets to recognize on their balance sheets the assets and liabilities for the rights and obligations created by those leases. The guidance also provides for disclosures that allow the users of financial statements to assess the amount, timing, and uncertainty of cash flows arising from leases.
The Company adopted the guidance on January 1, 2019 using the modified retrospective method without restatement of comparative periods. As such, periods prior to the date of adoption are presented in accordance with ASC 840 - Leases. The Company utilized the available practical expedient that allowed for the Company to not reassess whether existing contracts contain a lease under the new definition of a lease, lease classification for existing leases and whether previously capitalized initial direct costs would qualify for capitalization under the new guidance.
The adoption of this guidance had a material impact on the Condensed Consolidated Balance Sheet as of December 31, 2019 due to the recognition of equal right-of-use assets and lease liabilities for the Company's portfolio of operating leases. The right-of-use asset balance was then adjusted by the reclassification of pre-existing prepaid and accrued rent balances from other line items within the Condensed Consolidated Balance Sheet. The adoption had an immaterial impact on the Condensed Consolidated Statement of Comprehensive Income and Condensed Consolidated Statement of Cash Flows for the year ended December 31, 2019. The adoption had no impact on the Condensed Consolidated Statement of Changes in Stockholders' Equity for the year ended December 31, 2019.
Additional information and disclosures required by the new standard are contained in Note 6, Leases.
On January 1, 2019, the Company adopted ASU No. 2018-02, Income Statement - Reporting Comprehensive Income, which is intended to improve the usefulness of information reported as a result of the Tax Cuts and Jobs Act. The new guidance allows a reclassification from accumulated other comprehensive income to retained earnings for stranded tax effects resulting from the Tax Cuts and Jobs Act. The adoption of this guidance did not have an impact on the Company's consolidated financial statements.
43
3. | Revenue |
Executive Search
Revenue is recognized as we satisfy our performance obligations by transferring a good or service to a client. Generally, each of our executive search contracts contain one performance obligation which is the process of identifying potentially qualified candidates for a specific client position. In most contracts, the transaction price includes both fixed and variable consideration. Fixed compensation is comprised of a retainer, equal to approximately one-third of the estimated first year compensation for the position to be filled, and indirect expenses, equal to a specified percentage of the retainer, as defined in the contract. The Company generally bills its clients for its retainer and indirect expenses in one-third increments over a three-month period commencing in the month of a client’s acceptance of the contract. If actual compensation of a placed candidate exceeds the original compensation estimate, the Company is often authorized to bill the client for one-third of the excess compensation. The Company refers to this additional billing as uptick revenue. In most contracts, variable consideration is comprised of uptick revenue and direct expenses. The Company bills its clients for uptick revenue upon completion of the executive search, and direct expenses are billed as incurred.
As required under ASU No. 2014-09, the Company now estimates uptick revenue at contract inception, based on a portfolio approach, utilizing the expected value method based on a historical analysis of uptick revenue realized in the Company’s geographic regions and industry practices, and initially records a contract’s uptick revenue in an amount that is probable not to result in a significant reversal of cumulative revenue recognized when the actual amount of uptick revenue for that contract is known. Differences between the estimated and actual amounts of variable consideration are recorded when known. The Company does not estimate revenue for direct expenses as it is not materially different than recognizing revenue as direct expenses are incurred.
Revenue from our executive search engagement performance obligation is recognized over time as our clients simultaneously receive and consume the benefits provided by the Company's performance. Revenue from executive search engagements is recognized over the expected average period of performance, in proportion to the estimated personnel time incurred to fulfill our obligations under the executive search contract. Revenue is generally recognized over a period of approximately six months.
Our executive search contracts contain a replacement guarantee which provides for an additional search to be completed, free of charge except for expense reimbursements, should the candidate presented by the Company be hired by the client and subsequently terminated by the client for performance reasons within a specified period of time. The replacement guarantee is an assurance warranty, which is not a performance obligation under the terms of the executive search contract, as the Company does not provide any services under the terms of the guarantee that transfer benefits to the client in excess of assuring that the identified candidate complies with the agreed-upon specifications. The Company accounts for the replacement guarantee under the relevant warranty guidance in ASC 460 - Guarantees.
Heidrick Consulting
Revenue is recognized as we satisfy our performance obligations by transferring a good or service to a client. Heidrick Consulting enters into contracts with clients that outline the general terms and conditions of the assignment to provide succession planning, executive assessment, top team and board effectiveness and culture shaping programs. The consideration the Company expects to receive under each contract is generally fixed. Most of our consulting contracts contain one performance obligation, which is the overall process of providing the consulting service requested by the client. The majority of our consulting revenue is recognized over time utilizing both input and output methods. Contracts that contain coaching sessions, training sessions or the completion of assessments are recognized using the output method as each session or assessment is delivered to the client. Contracts that contain general consulting work are recognized using the input method utilizing a measure of progress that is based on time incurred on the project.
The Company enters into enterprise agreements with clients to provide a license for online access, via the Company's Culture Connect platform, to training and other proprietary material related to the Company's culture shaping programs. The consideration the Company expects to receive under the terms of an enterprise agreement is comprised of a single fixed fee. Our enterprise agreements contain multiple performance obligations, the delivery of materials via Culture Connect and material rights related to options to renew enterprise agreements at a significant discount. The Company allocates the transaction price to the performance obligations in the contract on a stand-alone selling price basis. The stand-alone selling price for the initial term of the enterprise agreement is outlined in the contract and is equal to the price paid by the client for the agreement over the initial term of the contract. The stand-alone selling price for the options to renew, or material right, are not directly observable and must be estimated. This estimate is required to reflect the discount the client would obtain when exercising the option to renew, adjusted for the likelihood that the option will be exercised. The Company estimates the likelihood of renewal using a historical analysis of client renewals. Access to Culture Connect represents a right to access the Company’s intellectual property that the client simultaneously receives and consumes as the Company performs under the agreement, and therefore the Company recognizes revenue over time.
44
Given the continuous nature of this commitment, the Company utilizes straight-line ratable revenue recognition over the estimated subscription period as the Company's clients will receive and consume the benefits from Culture Connect equally throughout the contract period. Revenue related to client renewals of enterprise agreements is recognized over the term of the renewal, which is generally twelve months. Enterprise agreements do not comprise a significant portion of the Company's revenue.
Contract Balances
Contract assets and liabilities are reported in a net position on a contract-by-contract basis at the end of each reporting period. Contract assets and liabilities are classified as current due to the nature of the Company's contracts, which are completed within one year. Contract assets are included within Other Current Assets on the Condensed Consolidated Balance Sheets.
Unbilled receivables: Unbilled revenue represents contract assets from revenue recognized over time in excess of the amount billed to the client and the amount billed to the client is solely dependent upon the passage of time. This amount includes revenue recognized in excess of billed executive search retainers and Heidrick Consulting fees.
Contract assets: Contract assets represent revenue recognized over time in excess of the amount billed to the client and the amount billed to the client is not solely subject to the passage of time. This amount primarily includes revenue recognized for upticks and contingent placement fees in executive search contracts.
Deferred revenue: Contract liabilities consist of deferred revenue, which is equal to billings in excess of revenue recognized.
The following table outlines the changes in our contract asset and liability balances at the end of and during the period:
December 31, 2019 | December 31, 2018 | Variance | |||||||||
Contract assets | |||||||||||
Unbilled receivables | $ | 7,585 | $ | 8,684 | $ | (1,099 | ) | ||||
Contract assets | 14,672 | 15,291 | (619 | ) | |||||||
Total contract assets | 22,257 | 23,975 | (1,718 | ) | |||||||
Contract liabilities | |||||||||||
Deferred revenue | $ | 41,267 | $ | 40,673 | $ | 594 | |||||
During the year ended December 31, 2019, we recognized revenue of $26.6 million that was included in the contract liabilities balance at the beginning of the period. The amount of revenue recognized during the year ended December 31, 2019 from performance obligations partially satisfied in previous periods as a result of changes in the estimates of variable consideration was $19.4 million. During the year ended December 31, 2018, we recognized revenue of $28.0 million that was included in the contract liabilities balance at the beginning of the period. The amount of revenue recognized during the year ended December 31, 2018, from performance obligations partially satisfied in previous periods as a result of changes in the estimates of variable consideration was $21.8 million.
Each of the Company's contracts has an expected duration of one year or less. Accordingly, the Company has elected to utilize the available practical expedient related to the disclosure of the transaction price allocated to the remaining performance obligations under its contracts. The Company has also elected the available practical expedients related to adjusting for the effects of a significant financing component and the capitalization of contract acquisition costs. The Company charges and collects from its clients, sales tax and value added taxes as required by certain jurisdictions. The Company has made an accounting policy election to exclude these items from the transaction price in its contracts.
4. | Allowance for Doubtful Accounts |
The activity of the allowance for doubtful accounts for the years ended:
December 31, | ||||||||||||
2019 | 2018 | 2017 | ||||||||||
Balance at January 1, | $ | 3,502 | $ | 2,534 | $ | 2,575 | ||||||
Provision charged to income | 5,900 | 3,790 | 963 | |||||||||
Write-offs | (4,270 | ) | (2,708 | ) | (1,134 | ) | ||||||
Foreign currency translation | 8 | (114 | ) | 130 | ||||||||
Balance at December 31, | $ | 5,140 | $ | 3,502 | $ | 2,534 | ||||||
45
5. | Property and Equipment, net |
The components of the Company’s property and equipment are as follows:
December 31, | ||||||||
2019 | 2018 | |||||||
Leasehold improvements | $ | 47,269 | $ | 48,455 | ||||
Office furniture, fixtures and equipment | 17,740 | 17,919 | ||||||
Computer equipment and software | 27,531 | 27,063 | ||||||
Property and equipment, gross | 92,540 | 93,437 | ||||||
Accumulated depreciation | (63,890 | ) | (59,566 | ) | ||||
Property and equipment, net | $ | 28,650 | $ | 33,871 | ||||
Depreciation expense for the years ended December 31, 2019, 2018 and 2017, was $9.5 million, $11.0 million and $10.4 million, respectively.
6. | Leases |
The Company's lease portfolio is comprised of operating leases for office space and equipment. The majority of the Company's leases include both lease and non-lease components, which the Company accounts for differently depending on the underlying class of asset. Certain of the Company's leases include one or more options to renew or terminate the lease at the Company's discretion. Generally, the renewal and termination options are not included in the right-of-use assets and lease liabilities as they are not reasonably certain of exercise. The Company regularly evaluates the renewal and termination options and when they are reasonably certain of exercise, includes the renewal or termination option in the Company's lease term.
As most of the Company's leases do not provide an implicit interest rate, the Company utilizes its incremental borrowing rate based on the information available at the commencement date in determining the present value of lease payments. The Company has a centrally managed treasury function; therefore, a portfolio approach is applied in determining the incremental borrowing rate. The incremental borrowing rate is the rate of interest that the Company would have to pay to borrow on a fully collateralized basis over a similar term in an amount equal to the total lease payments in a similar economic environment.
As of December 31, 2019, office leases have remaining lease terms that range from less than one year to 10.4 years, some of which also include options to extend or terminate the lease. Most office leases contain both fixed and variable lease payments. Variable lease costs consist primarily of rent escalations based on an established index or rate and taxes, insurance, and common area or other maintenance costs, which are paid based on actual costs incurred by the lessor. The Company has elected to utilize the available practical expedient to not separate lease and non-lease components for office leases.
As of December 31, 2019, equipment leases, which are comprised of vehicle and office equipment leases, have remaining terms that range from less than one year to 4.8 years, some of which also include options to extend or terminate the lease. The Company's equipment leases do not contain variable lease payments. The Company separates the lease and non-lease components for its equipment leases. Equipment leases do not comprise a significant portion of the Company's lease portfolio.
Lease cost components included within General and Administrative Expenses in our Condensed Consolidated Statements of Comprehensive Income (Loss) for the year ended December 31, 2019, were as follows:
Operating lease cost | $ | 24,928 | ||
Variable lease cost | 7,932 | |||
Total lease cost | $ | 32,860 | ||
Rent expense, as previously defined under ASC 840, which includes the base rent, maintenance costs, operating expenses and real estate taxes, and the costs of equipment leases for the years ended December 31, 2018, and 2017, was $33.2 million and $32.2 million, respectively.
46
Supplemental cash flow information related to the Company's operating leases for the year ended December 31, 2019, was as follows:
Cash paid for amounts included in the measurement of lease liabilities: | ||||
Operating cash flows from operating leases | $ | 33,797 | ||
Right-of-use assets obtained in exchange for lease obligations: | ||||
Operating leases | $ | 19,640 | ||
The weighted average remaining lease term and weighted average discount rate for our operating leases as of December 31, 2019 was as follows:
Weighted Average Remaining Lease Term | ||
Operating leases | 4.7 years | |
Weighted Average Discount Rate | ||
Operating leases | 3.9 | % |
The future maturities of the Company's operating lease liabilities for the years ended December 31, were as follows:
Operating Lease Maturity | |||
2020 | $ | 30,246 | |
2021 | 27,229 | ||
2022 | 23,577 | ||
2023 | 20,555 | ||
2024 | 9,981 | ||
Thereafter | 8,983 | ||
Total lease payments | 120,571 | ||
Less: Interest | (10,228 | ) | |
Present value of lease liabilities | $ | 110,343 | |
The minimum future operating lease payments due in each of the next five years as recorded under ASC 840 at December 2018, were as follows:
2019 | $ | 34,456 | |
2020 | 31,808 | ||
2021 | 27,381 | ||
2022 | 23,445 | ||
2023 | 20,087 | ||
Thereafter | 14,448 | ||
Total | $ | 151,625 | |
The Company has an obligation at the end of the lease term to return certain offices to the landlord in their original condition, which is recorded at fair value at the time the liability is incurred. The Company had $3.0 million and $2.7 million of asset retirement obligations as of December 31, 2019 and 2018, respectively, which are recorded within Other current liabilities and Other non-current liabilities in the Consolidated Balance Sheets.
7. | Financial Instruments and Fair Value |
Fair value is defined as the price that would be received to sell an asset or paid to transfer a liability in an orderly transaction between market participants at the measurement date. A three-level fair value hierarchy prioritizes the inputs used to measure fair value. The hierarchy requires entities to maximize the use of observable inputs and minimize the use of unobservable inputs. The three levels of inputs used to measure fair value are as follows:
• | Level 1 – Quoted prices in active markets for identical assets and liabilities. |
• | Level 2 – Quoted prices in active markets for similar assets and liabilities, or other inputs that are observable for the asset or liability, either directly or indirectly, for substantially the full term of the financial instrument. |
• | Level 3 – Unobservable inputs that are supported by little or no market activity and that are significant to the fair value of the assets and liabilities. This includes certain pricing models, discounted cash flow methodologies and similar techniques that use significant unobservable inputs. |
47
Cash, Cash Equivalents and Marketable Securities
The Company's investments in marketable debt securities, which consist of U.S. Treasury bills and commercial paper, are classified and accounted for as available-for-sale. The Company classifies its marketable debt securities as either short-term or long-term based on each instrument's underlying contractual maturity date. Unrealized gains and losses on marketable debt securities classified as available-for-sale are recognized in Accumulated other comprehensive income in the Consolidated Balance Sheets until realized.
The Company's cash, cash equivalents, and marketable securities by significant investment category are as follows:
Fair Value | Balance Sheet Classification | ||||||||||||||||||||||
Amortized Cost | Unrealized Gains | Unrealized Losses | Fair Value | Cash and Cash Equivalents | Marketable Securities | ||||||||||||||||||
Balance at December 31, 2019 | |||||||||||||||||||||||
Cash | $ | 177,493 | $ | — | |||||||||||||||||||
Level 1: | |||||||||||||||||||||||
Money market funds | 15,661 | 15,661 | — | ||||||||||||||||||||
U.S. Treasury securities | 139,705 | 13 | — | 139,718 | 78,565 | 61,153 | |||||||||||||||||
Total Level 1 | 155,366 | 13 | — | 155,379 | 94,226 | 61,153 | |||||||||||||||||
Total | $ | 155,366 | $ | 13 | $ | — | $ | 155,379 | $ | 271,719 | $ | 61,153 | |||||||||||
Fair Value | Balance Sheet Classification | ||||||||||||||||||||||
Amortized Cost | Unrealized Gains | Unrealized Losses | Fair Value | Cash and Cash Equivalents | Marketable Securities | ||||||||||||||||||
Balance at December 31, 2018 | |||||||||||||||||||||||
Cash | $ | 279,829 | $ | — | |||||||||||||||||||
Level 1: | |||||||||||||||||||||||
Money market funds | 77 | 77 | — | ||||||||||||||||||||
Total | $ | — | $ | — | $ | — | $ | 77 | $ | 279,906 | $ | — | |||||||||||
Investments, Assets Designated for Retirement and Pension Plans and Associated Liabilities
The Company has a U.S. non-qualified deferred compensation plan that consists primarily of U.S. marketable securities and mutual funds. The aggregate cost basis for these investments was $17.2 million and $14.6 million as of December 31, 2019 and December 31, 2018, respectively.
The Company also maintains a pension plan for certain current and former employees in Germany. The pensions are individually fixed Euro amounts that vary depending on the function and the eligible years of service of the employee. The Company’s investment strategy is to support its pension obligations through reinsurance contracts. The BaFin—German Federal Financial Supervisory Authority—supervises the insurance companies and the reinsurance contracts. The BaFin requires each reinsurance contract to guarantee a fixed minimum return. The Company’s pension benefits are fully reinsured by group insurance contracts with ERGO Lebensversicherung AG, and the group insurance contracts are measured in accordance with BaFin guidelines (including mortality tables and discount rates) which are considered Level 2 inputs.
48
The following tables provide a summary of the fair value measurements for each major category of investments, assets designated for retirement and pension plans and associated liabilities measured at fair value on a recurring basis:
Balance Sheet Classification | ||||||||||||||||||||||||
Fair Value | Other Current Assets | Assets Designated for Retirement and Pension Plans | Investments | Other Current Liabilities | Retirement and Pension Plans | |||||||||||||||||||
Balance at December 31, 2019 | ||||||||||||||||||||||||
Level 1: | ||||||||||||||||||||||||
U.S. non-qualified deferred compensation plan | $ | 25,409 | $ | — | $ | — | $ | 25,409 | $ | — | $ | — | ||||||||||||
Level 2: | ||||||||||||||||||||||||
Retirement and pension plan assets | 15,296 | 1,318 | 13,978 | — | — | — | ||||||||||||||||||
Pension benefit obligation | (20,918 | ) | — | — | — | (1,318 | ) | (19,600 | ) | |||||||||||||||
Total Level 2 | (5,622 | ) | 1,318 | 13,978 | — | (1,318 | ) | (19,600 | ) | |||||||||||||||
Total | $ | 19,787 | $ | 1,318 | $ | 13,978 | $ | 25,409 | $ | (1,318 | ) | $ | (19,600 | ) | ||||||||||
Balance Sheet Classification | ||||||||||||||||||||||||
Fair Value | Other Current Assets | Assets Designated for Retirement and Pension Plans | Investments | Other Current Liabilities | Retirement and Pension Plans | |||||||||||||||||||
Balance at December 31, 2018 | ||||||||||||||||||||||||
Level 1: | ||||||||||||||||||||||||
U.S. non-qualified deferred compensation plan | $ | 19,442 | $ | — | $ | — | $ | 19,442 | $ | — | $ | — | ||||||||||||
Level 2: | ||||||||||||||||||||||||
Retirement and pension plan assets | 16,384 | 1,349 | 15,035 | — | — | — | ||||||||||||||||||
Pension benefit obligation | (20,908 | ) | — | — | — | (1,349 | ) | (19,559 | ) | |||||||||||||||
Total Level 2 | (4,524 | ) | 1,349 | 15,035 | — | (1,349 | ) | (19,559 | ) | |||||||||||||||
Total | $ | 14,918 | $ | 1,349 | $ | 15,035 | $ | 19,442 | $ | (1,349 | ) | $ | (19,559 | ) | ||||||||||
Contingent Consideration
The former owners of the entities acquired by the Company are eligible to receive additional cash consideration based on the attainment of certain operating metrics in the periods subsequent to acquisition. Contingent consideration is valued using significant inputs that are not observable in the market which are defined as Level 3 inputs pursuant to fair value measurement accounting. The Company determines the fair value of contingent consideration using discounted cash flow models. As of December 31, 2019, all contingent consideration accruals are recorded within Other current liabilities on the Consolidated Balance Sheets.
49
The following table provides a reconciliation of the beginning and ending balance of Level 3 liabilities for the year ended December 31, 2019:
Acquisition Earnout Accruals | ||||
Balance at December 31, 2018 | $ | (6,627 | ) | |
Earnout accretion | (668 | ) | ||
Earnout payments | 3,009 | |||
Earnout adjustment | (1,062 | ) | ||
Foreign currency translation | 70 | |||
Balance at December 31, 2019 | $ | (5,278 | ) | |
8. | Acquisitions |
2Get Holdings Limited
In September 2019, the Company acquired 2GET Holdings Limited ("2GET"), a Brazil-based provider of executive search services, and its wholly owned subsidiaries. Under the terms of the purchase agreement, the Company paid $5.2 million of initial consideration for substantially all of the outstanding equity of 2GET. The acquisition was funded with $4.1 million of existing cash at closing and $1.1 million of the Company's common stock transferred in October 2019. The common stock transferred as consideration was reissued from the Company's treasury stock. The former owners of 2GET are eligible to receive additional cash consideration, which the Company estimates to be between $5.0 million and $15.0 million, based on the achievement of certain revenue and EBITDA milestones for the period from acquisition through 2023. The additional consideration is linked to future service with the Company and is accounted for as compensation expense. The Company recorded $0.7 million of intangible assets, consisting of the trade name of $0.4 million and customer relationships of $0.3 million, $3.8 million of goodwill, and $0.7 million of net working capital. The goodwill is primarily related to the acquired workforce and strategic fit. The Company will not be able to deduct the recorded goodwill for tax purposes.
Amrop A/S
In January 2018, the Company acquired Amrop A/S ("Amrop"), a Denmark-based provider of executive search services for 24.3 million Danish Kroner (equivalent to $3.9 million on the acquisition date) of initial consideration which was funded from existing cash. The former owners of Amrop are expected to receive additional cash consideration based on fee revenue generated during the two-year period following the completion of the acquisition. When estimating the value of future cash consideration, the Company has accrued $5.3 million as of December 31, 2019. The Company recorded $1.7 million of intangible assets related to customer relationships and $5.5 million of goodwill. The goodwill is primarily related to the acquired workforce and strategic fit.
9. | Goodwill and Other Intangible Assets |
Goodwill
The Company's goodwill by segment is as follows:
December 31, 2019 | December 31, 2018 | ||||||
Executive Search | |||||||
Americas | $ | 92,497 | $ | 88,410 | |||
Europe | 25,579 | 24,924 | |||||
Asia Pacific | 8,755 | 8,758 | |||||
Total Executive Search | 126,831 | 122,092 | |||||
Heidrick Consulting | 36,257 | 36,257 | |||||
Goodwill, gross | 163,088 | 158,349 | |||||
Accumulated impairment | (36,257 | ) | (36,257 | ) | |||
Goodwill, net | $ | 126,831 | $ | 122,092 | |||
50
Changes in the carrying amount of goodwill by segment for the years ended December 31, 2019, 2018, and 2017 were as follows:
Executive Search | ||||||||||||||||||||
Americas | Europe | Asia Pacific | Heidrick Consulting | Total | ||||||||||||||||
Balance as of December 31, 2016 | ||||||||||||||||||||
Goodwill | $ | 88,101 | $ | 19,092 | $ | 8,893 | $ | 35,758 | $ | 151,844 | ||||||||||
Accumulated impairment | — | — | — | — | — | |||||||||||||||
Goodwill, net as of December 31, 2016 | 88,101 | 19,092 | 8,893 | 35,758 | 151,844 | |||||||||||||||
Philosophy IB acquisition | 357 | — | — | 7 | 364 | |||||||||||||||
Foreign currency translation | 232 | 1,808 | 409 | 492 | 2,941 | |||||||||||||||
Impairment | — | — | — | (36,257 | ) | (36,257 | ) | |||||||||||||
Goodwill, net as of December 31, 2017 | 88,690 | 20,900 | 9,302 | — | 118,892 | |||||||||||||||
Amrop acquisition | — | 5,478 | — | — | 5,478 | |||||||||||||||
Foreign currency translation | (280 | ) | (1,454 | ) | (544 | ) | — | (2,278 | ) | |||||||||||
Goodwill, net as of December 31, 2018 | 88,410 | 24,924 | 8,758 | — | 122,092 | |||||||||||||||
2GET acquisition | 3,793 | — | — | — | 3,793 | |||||||||||||||
Foreign currency translation | 294 | 655 | (3 | ) | — | 946 | ||||||||||||||
Goodwill, net as of December 31, 2019 | $ | 92,497 | $ | 25,579 | $ | 8,755 | $ | — | $ | 126,831 | ||||||||||
In September 2019, the Company acquired 2GET and included $3.8 million of goodwill related to the acquisition in the Americas segment.
During the 2019 fourth quarter, the Company conducted its annual goodwill impairment evaluation as of October 31, 2019 in accordance with ASU No. 2017-04, Intangibles - Goodwill and Other. The goodwill impairment test is completed by comparing the fair value of a reporting unit with its carrying amount. An impairment charge is recognized for the amount by which the carrying value of the reporting unit exceeds its fair value; however, the loss recognized is not to exceed the total amount of goodwill allocated to that reporting unit.
The impairment test is considered for each of the Company’s reporting units that has goodwill as defined in the accounting standard for goodwill and intangible assets. The Company operates four reporting units: Americas, Europe (which includes Africa), Asia Pacific (which includes the Middle East) and Heidrick Consulting. As of October 31, 2019, only the Americas, Europe and Asia Pacific reporting units had recorded goodwill.
During the impairment evaluation process, the Company used a discounted cash flow methodology to estimate the fair value of each of its reporting units with goodwill. The discounted cash flow approach is dependent on a number of factors, including estimates of future market growth and trends, forecasted revenue and costs, capital investments, appropriate discount rates, certain assumptions to allocate shared costs, assets and liabilities, historical and projected performance of the reporting unit and the macroeconomic conditions affecting each of the Company’s reporting units. The assumptions used in the determination of fair value were (1) a forecast of growth in the near and long term; (2) the discount rate; (3) working capital investments; and (4) other factors.
Based on the results of the impairment analysis, the fair values of the Americas, Europe, and Asia Pacific reporting units exceeded their carrying values by 329%, 21% and 30%, respectively.
During the twelve months ended December 31, 2017, the Company determined that the goodwill within the former Culture Shaping and Leadership Consulting reporting units was impaired, which resulted in impairment charges of $29.3 million and $6.9 million, respectively, to write off all of the goodwill associated with each of the reporting units. The impairment charges are recorded within Impairment charges in the Condensed Consolidated Statements of Comprehensive Income (Loss) for the twelve months ended December 31, 2017. The impairments were non-cash in nature and did not affect our current liquidity, cash flows, borrowing capability or operations, nor did they impact the debt covenants under our credit agreement. Effective January 1, 2018, the Company completed its integration of the Culture Shaping and Leadership Consulting reporting units into the newly created Heidrick Consulting reporting unit.
51
Other Intangible Assets, net
The Company’s other intangible assets, net, by segment, are as follows:
December 31, 2019 | December 31, 2018 | |||||||
Executive Search | ||||||||
Americas | $ | 557 | $ | 52 | ||||
Europe | 1,314 | 2,086 | ||||||
Asia Pacific | 64 | 78 | ||||||
Total Executive Search | 1,935 | 2,216 | ||||||
Heidrick Consulting | — | — | ||||||
Total Other Intangible Assets, Net | $ | 1,935 | $ | 2,216 | ||||
In September 2019, the Company acquired 2GET and recorded customer relationships and trade name intangible assets in the Americas segment of $0.3 million and $0.4 million, respectively.
During the twelve months ended December 31, 2017, the Company determined that the intangible assets within the Culture Shaping and Leadership Consulting reporting units were impaired, which resulted in impairment charges of $9.9 million and $4.6 million, respectively, to write off all intangible assets associated with each reporting unit. The impairment charges are recorded within Impairment charges in the Condensed Consolidated Statement of Comprehensive Income (Loss) for the twelve months ended December 31, 2017. The impairment charges were non-cash in nature and did not affect current liquidity, cash flows, borrowing capability or operations, nor did they impact the debt covenants under our credit agreement.
The carrying amount of amortizable intangible assets and the related accumulated amortization were as follows:
December 31, 2019 | December 31, 2018 | |||||||||||||||||||||||||
Weighted Average Life (in years) | Gross Carrying Amount | Accumulated Amortization | Net Carrying Amount | Gross Carrying Amount | Accumulated Amortization | Net Carrying Amount | ||||||||||||||||||||
Client relationships | 6.6 | $ | 16,302 | $ | (14,683 | ) | $ | 1,619 | $ | 15,910 | $ | (13,694 | ) | $ | 2,216 | |||||||||||
Trade name | 5.0 | 362 | (46 | ) | 316 | — | — | — | ||||||||||||||||||
Total intangible assets | 6.3 | $ | 16,664 | $ | (14,729 | ) | $ | 1,935 | $ | 15,910 | $ | (13,694 | ) | $ | 2,216 | |||||||||||
Intangible asset amortization expense for the years ended December 31, 2019, 2018 and 2017, was $0.9 million, $1.5 million and $4.4 million, respectively.
The Company's estimated future amortization expense related to intangible assets as of December 31, 2019 for the years ended December 31st is as follows:
2020 | $ | 798 | |
2021 | 507 | ||
2022 | 319 | ||
2023 | 188 | ||
2024 | 76 | ||
Thereafter | 47 | ||
Total | $ | 1,935 | |
52
10. | Other Current Assets and Non-Current Liabilities |
The components of other current assets are as follows:
December 31, 2019 | December 31, 2018 | |||||||
Contract assets | $ | 22,257 | $ | 23,975 | ||||
Other | 5,591 | 5,623 | ||||||
Total other current assets | $ | 27,848 | $ | 29,598 | ||||
The components of other non-current liabilities are as follows:
December 31, 2019 | December 31, 2018 | |||||||
Premise related costs | $ | 2,392 | $ | 15,473 | ||||
Other | 2,242 | 1,950 | ||||||
Total other non-current liabilities | $ | 4,634 | $ | 17,423 | ||||
11. | Line of Credit |
On October 26, 2018, the Company entered into a new Credit Agreement (the "2018 Credit Agreement") to replace the Second Amended and Restated Credit Agreement (the "Restated Credit Agreement") executed on June 30, 2015. The 2018 Credit Agreement provides the Company with a senior unsecured revolving line of credit with an aggregate commitment of $175 million, which includes a sublimit of $25 million for letters of credit, and a $10 million swingline loan sublimit. The agreement also includes a $75 million expansion feature. The 2018 Credit Agreement will mature in October 2023. Borrowings under the 2018 Credit Agreement bear interest at the Company's election of the Alternate Base Rate (as defined in the 2018 Credit Agreement) or Adjusted LIBOR (as defined in the 2018 Credit Agreement) plus a spread as determined by the Company’s leverage ratio.
Borrowings under the 2018 Credit Agreement may be used for working capital, capital expenditures, Permitted Acquisitions (as defined in the 2018 Credit Agreement) and for other general purposes of the Company and its subsidiaries. The obligations under the 2018 Credit Agreement are guaranteed by certain of the Company's subsidiaries.
The Company capitalized approximately $1.0 million of loan acquisition costs related to the 2018 Credit Agreement, which will be amortized over the remaining term of the agreement.
Before October 26, 2018, the Company was party to its Restated Credit Agreement. The Restated Credit Agreement provided a single senior unsecured revolving line of credit with an aggregate commitment of up to $100 million, which includes a sublimit of $25 million for letters of credit, and a $50 million expansion feature (the “Replacement Facility”). Borrowings under the Restated Credit Agreement bore interest at the Company’s election of the existing Alternate Base Rate (as defined in the Restated Credit Agreement) or Adjusted LIBOR Rate (as defined in the Restated Credit Agreement) plus a spread as determined by the Company’s leverage ratio.
During the three months ended March 31, 2018, the Company borrowed $20 million under the Restated Credit Agreement and elected the Adjusted LIBOR Rate. The Company subsequently repaid $8 million during the three months ended March 31, 2018 and $12 million during the three months ended June 30, 2018.
During the three months ended March 31, 2017, the Company borrowed $40 million under the Restated Credit Agreement and elected the Adjusted LIBOR rate. The Company subsequently repaid $15 million during the three months ended March 31, 2017 and $25 million during the three months ended June 30, 2017.
As of December 31, 2019, and 2018, the Company had no outstanding borrowings under the 2018 Credit Agreement. The Company was in compliance with the financial and other covenants under the 2018 Credit Agreement and no event of default existed.
12. | Employee Benefit Plans |
Qualified Retirement Plan
53
The Company has a defined contribution retirement plan (the “Plan”) for all eligible employees in the United States. Eligible employees may begin participating in the Plan upon their hire date. The Plan contains a 401(k) provision, which provides for employee pre-tax and/or after-tax contributions, from 1% to 50% of their eligible compensation up to a combined maximum permitted by law. The Company matched employee contributions on a dollar-for-dollar basis per participant up to the greater of $6,000, or 6.0%, of eligible compensation for the years ended December 31, 2019, 2018 and 2017. Employees are eligible for the Company match immediately provided that they are working on the last day of the Plan year in which the match is made. The Plan also provides for employees who retire, die or become disabled during the Plan year to receive the Company match for that Plan year. The Plan provides that forfeitures will be used to reduce the Company’s contributions. Forfeitures are created annually by participants who terminate employment before becoming entitled to the Company’s matching contribution under the Plan. The Company also has the option of making discretionary contributions. There were no discretionary contributions made for the years ended December 31, 2019, 2018 and 2017. The expense that the Company incurred for matching employee contributions for the years ended December 31, 2019, 2018 and 2017, was $6.3 million, $5.7 million and $5.6 million, respectively.
Deferred Compensation Plans
The Company has a deferred compensation plan for certain U.S. employees (the “U.S. Plan”) that became effective on January 1, 2006. The U.S. Plan allows participants to defer up to 25% of their base compensation and up to the lesser of $500,000 or 25% of their eligible bonus compensation into several different investment vehicles. These deferrals are immediately vested and are not subject to a risk of forfeiture. In 2019 and 2018, all deferrals in the U.S. Plan were funded. The compensation deferred in the U.S. Plan was $23.8 million and $18.3 million at December 31, 2019 and 2018, respectively. The assets of the U.S. Plan are included in Investments and the liabilities of the U.S. Plan are included in Retirement and pension plans in the Consolidated Balance Sheets as of December 31, 2019 and 2018.
The Company has a Non-Employee Directors Voluntary Deferred Compensation Plan whereby non-employee members of the Company’s Board of Directors may elect to defer up to 100% of the cash component of their directors’ fees into several different investment vehicles. As of December 31, 2019 and 2018, the total amounts deferred under the plan were $1.6 million and $1.1 million, respectively, all of which were funded. The assets of the plan are included in Investments and the liabilities of the plan are included in Retirement and pension plans in the Consolidated Balance Sheets at December 31, 2019 and 2018.
The U.S. and Non-Employee Directors Voluntary Deferred Compensation Plans consist primarily of marketable securities and mutual funds, all of which are valued using Level 1 inputs (See Note 7, Financial Instruments and Fair Value).
13. | Pension Plan and Life Insurance Contract |
The Company maintains a pension plan for certain current and former employees in Germany. The pensions are individually fixed Euro amounts that vary depending on the function and the eligible years of service of the employee.
2019 | 2018 | |||||||
Benefit obligation at January 1, | $ | 20,908 | $ | 23,886 | ||||
Interest cost | 338 | 373 | ||||||
Actuarial (gain) loss | 1,506 | (886 | ) | |||||
Benefits paid | (1,375 | ) | (1,450 | ) | ||||
Cumulative translation adjustment | (459 | ) | (1,015 | ) | ||||
Benefit obligation at December 31, | $ | 20,918 | $ | 20,908 | ||||
The benefit obligation amounts recognized in the Consolidated Balance Sheets are as follows:
December 31, | ||||||||
2019 | 2018 | |||||||
Current liabilities | $ | 1,318 | $ | 1,349 | ||||
Noncurrent liabilities | 19,600 | 19,559 | ||||||
Total | $ | 20,918 | $ | 20,908 | ||||
54
The components of and assumptions used to determine the net periodic benefit cost are as follows:
December 31, | ||||||||||||
2019 | 2018 | 2017 | ||||||||||
Net period benefit cost: | ||||||||||||
Interest cost | $ | 338 | $ | 373 | $ | 362 | ||||||
Amortization of net loss | 35 | 92 | 111 | |||||||||
Net periodic benefit cost | $ | 373 | $ | 465 | $ | 473 | ||||||
Weighted average assumptions | ||||||||||||
Discount rate (1) | 1.71 | % | 1.64 | % | 1.49 | % | ||||||
Rate of compensation increase | — | % | — | % | — | % | ||||||
Assumptions to determine the Company’s benefit obligation are as follows:
December 31, | |||||||||
2019 | 2018 | 2017 | |||||||
Discount rate (1) | 1.03 | % | 1.71 | % | 1.64 | % | |||
Rate of compensation increase | — | % | — | % | — | % | |||
Measurement Date | 12/31/2019 | 12/31/2018 | 12/31/2017 | ||||||
(1) | The discount rates are based on long-term bond indices adjusted to reflect the longer duration of the benefit obligation. |
The amounts in Accumulated other comprehensive income as of December 31, 2019 and 2018, that had not yet been recognized as components of net periodic benefit cost were $4.0 million and $2.6 million, respectively.
The Company’s investment strategy is to support its pension obligations through reinsurance contracts. The BaFin—German Federal Financial Supervisory Authority—supervises the insurance companies and the reinsurance contracts. The BaFin requires each reinsurance contract to guarantee a fixed minimum return. The Company’s pension benefits are fully reinsured by group insurance contracts with ERGO Lebensversicherung AG, and the group insurance contracts are measured in accordance with BaFin guidelines (including mortality tables and discount rates) which are considered Level 2 inputs (See Note 7, Financial Instruments and Fair Value). The fair value at December 31, 2019 and 2018, was $15.3 million and $16.4 million, respectively.
Since the pension assets are not segregated in trust from the Company’s other assets, the pension assets are not shown as an offset against the pension liabilities in the Consolidated Balance Sheets. These assets are included in the Consolidated Balance Sheets at December 31, 2019 and 2018, as a component of Other current assets and Assets designated for retirement and pension plans.
The benefits expected to be paid in each of the next five years, and in the aggregate for the five years thereafter are as follows:
2020 | $ | 1,318 | |
2021 | 1,305 | ||
2022 | 1,288 | ||
2023 | 1,269 | ||
2024 | 1,245 | ||
2025 through 2029 | 5,713 | ||
14. | Stock-Based Compensation |
The Company's Second Amended and Restated 2012 Heidrick & Struggles GlobalShare Program (the "2012 Program') provides for grants of stock options, stock appreciation rights and other stock-based awards that are valued based upon the grant date fair value of shares. These awards may be granted to directors, selected employees and independent contractors.
As of December 31, 2019, 2,551,441 shares have been issued under the 2012 Program and 981,682 shares remain available for future awards, which includes 683,123 forfeited shares. The 2012 Program provides that no awards can be granted after May 24, 2028.
In September 2017, the Company entered into an agreement with its former Chief Executive Officer pursuant to which Mr. Wolstencroft voluntarily agreed, with the concurrence of the Board of Directors, to forfeit 100 percent of his 2017 restricted stock unit and performance stock unit grants totaling 39,352 restricted stock units and 39,352 performance stock units.
55
Mr. Wolstencroft vested in 41,667 restricted stock units, or 100 percent of his 2014 sign-on restricted stock unit grant, without proration. With respect to his 2015 and 2016 restricted stock unit and performance stock unit grants, Mr. Wolstencroft vested an agreed upon pro-rata portion of the tranches scheduled to vest in 2017 through 2019 (and with the performance goals for performance stock units deemed to have been achieved at target level performance) totaling 9,948 restricted stock units and 50,007 performance stock units, and he agreed to forfeit the remaining portions of such 2015 and 2016 restricted stock unit and performance stock unit awards totaling 28,903 restricted stock units and 26,246 performance stock units.
The Company measures its stock-based compensation costs based on the grant date fair value of the awards and recognizes these costs in the financial statements over the requisite service period.
A summary of information with respect to stock-based compensation is as follows:
December 31, | ||||||||||||
2019 | 2018 | 2017 | ||||||||||
Salaries and employee benefits (1) | $ | 12,857 | $ | 9,548 | $ | 4,597 | ||||||
General and administrative expenses | 460 | 562 | 338 | |||||||||
Income tax benefit related to stock-based compensation included in net income | 3,529 | 2,674 | 1,948 | |||||||||
(1) Includes $3.0 million and $1.2 million of expense related to cash settled restricted stock units for the years ended December 31, 2019, and 2018, respectively.
Restricted Stock Units
Restricted stock units are generally subject to ratable vesting over a three-year period. Beginning in 2018, a portion of the Company's restricted stock units are subject to ratable vesting over a four-year period. Compensation expense related to service-based restricted stock units is recognized on a straight-line basis over the vesting period.
Restricted stock unit activity for the years ended December 31, 2019, 2018 and 2017 is as follows:
Number of Restricted Stock Units | Weighted- Average Grant-date Fair Value | ||||||
Outstanding on December 31, 2017 | 491,154 | $ | 21.92 | ||||
Granted | 297,664 | 34.64 | |||||
Vested and converted to common stock | (199,550 | ) | 21.66 | ||||
Forfeited | (76,822 | ) | 25.76 | ||||
Outstanding on December 31, 2018 | 512,446 | 28.83 | |||||
Granted | 270,488 | 33.55 | |||||
Vested and converted to common stock | (175,792 | ) | 24.19 | ||||
Forfeited | (8,154 | ) | 34.29 | ||||
Outstanding on December 31, 2019 | 598,988 | $ | 32.25 | ||||
As of December 31, 2019, there was $11.4 million of pre-tax unrecognized compensation expense related to unvested restricted stock units, which is expected to be recognized over a weighted average of 2.5 years.
Performance Stock Units
The Company grants performance stock units to certain of its senior executives. The performance stock units are generally subject to a cliff vesting at the end of a three-year period. The vesting will vary between 0% - 200% based on the attainment of operating income goals over the three-year vesting period. The performance stock units are expensed on a straight-line basis over the three-year vesting period.
During the year ended December 31, 2019, performance stock units were granted to certain employees of the Company, subject to a cliff vesting period of three years and certain other performance conditions. Half of award is based on the achievement of certain operating margin thresholds and half of the award is based on the Company's total shareholder return, relative to a peer group. The fair value of the awards based on total shareholder return was determined using the Monte-Carlo simulation model. A Monte Carlo simulation model uses stock price volatility and other variables to estimate the probability of satisfying the performance conditions and the resulting fair value of the award.
56
Performance share unit activity for the years ended December 31, 2019, 2018 and 2017 was as follows:
Number of Performance Stock Units | Weighted- Average Grant-date Fair Value | ||||||
Outstanding on December 31, 2017 | 185,891 | $ | 23.82 | ||||
Granted | 102,138 | 25.81 | |||||
Vested and converted to common stock | (43,361 | ) | 23.64 | ||||
Forfeited | (47,551 | ) | 23.87 | ||||
Outstanding on December 31, 2018 | 197,117 | 24.88 | |||||
Granted | 81,661 | 35.58 | |||||
Vested and converted to common stock | (99,219 | ) | 25.04 | ||||
Forfeited | — | — | |||||
Outstanding on December 31, 2019 | 179,559 | $ | 32.63 | ||||
As of December 31, 2019, there was $3.4 million of pre-tax unrecognized compensation expense related to unvested performance stock units, which is expected to be recognized over a weighted average of 1.8 years.
Phantom Stock Units
Phantom stock units are grants of phantom stock with respect to shares of the Company's common stock that are settled in cash and are subject to various restrictions, including restrictions on transferability, vesting and forfeiture provisions. Shares of phantom stock that do not vest for any reason will be forfeited by the recipient and will revert to the Company.
Phantom stock units are subject to vesting over a period of four years and certain other conditions, including continued service to the Company. As a result of the cash-settlement feature of the awards, the Company considers the awards to be liability awards, which are measured at fair value at each reporting date and the vested portion of the award is recognized as a liability to the extent that the service condition is deemed probable. The fair value of the phantom stock awards on the balance sheet date was determined using the closing share price of the Company's common stock on that date and is included within Accrued salaries and benefits - non-current on the Consolidated Balance Sheets.
The Company recorded phantom stock-based compensation expense of $3.0 million and $1.2 million for the years ended December 31, 2019 and December 31, 2018, respectively.
Phantom stock unit activity for the years ended December 31, 2019, 2018, and 2017 was as follows:
Number of Phantom Stock Units | |||
Outstanding on December 31, 2017 | — | ||
Granted | 111,673 | ||
Vested | — | ||
Forfeited | — | ||
Outstanding on December 31, 2018 | 111,673 | ||
Granted | 154,387 | ||
Vested | — | ||
Forfeited | — | ||
Outstanding on December 31, 2019 | 266,060 | ||
As of December 31, 2019, there was $5.2 million of pre-tax unrecognized compensation expense related to unvested phantom stock units, which is expected to be recognized over a weighted average of 3.3 years.
15. | Restructuring |
Restructuring Charges
During the year ended December 31, 2019, the Company recorded restructuring charges of $4.1 million related to the closing of the Company's legacy Brazil operations due to the acquisition of 2GET (see Note 8, Acquisitions). The restructuring charges
57
primarily consist of employee-related costs for the Company's legacy Brazil operations. The America's incurred $4.1 million in restructuring charges, while Global Operations Support incurred less than $0.1 million in restructuring charges.
In 2017, the Company recorded restructuring charges of $15.7 million in connection with initiatives to reduce overall costs and improve operational efficiencies. The primary components of the restructuring included: the elimination of two executive officer roles for a flatter leadership structure, a workforce reduction as the firm aligned its support resources to better meet operational needs and recognize synergies with the combination of Leadership Consulting and Culture Shaping, a reduction of the firm’s real estate expenses and support costs by consolidating or closing three of its locations across its global footprint and the acceleration of future expenses under certain contractual obligations.
These charges consisted of $13.1 million of employee-related costs, including severance associated with reductions in our workforce of 251 employees globally, $2.3 million of other professional and consulting fees and $0.3 million of expenses associated with closing three office locations.
Restructuring charges by operating segment for the years ended December 31, were as follows:
December 31, | ||||||||||||
2019 | 2018 | 2017 | ||||||||||
Executive Search | ||||||||||||
Americas | $ | 4,102 | $ | — | $ | 784 | ||||||
Europe | — | — | 3,993 | |||||||||
Asia Pacific | — | — | 2,046 | |||||||||
Total Executive Search | 4,102 | — | 6,823 | |||||||||
Heidrick Consulting | — | — | 3,393 | |||||||||
Global Operations Support | 28 | — | 5,450 | |||||||||
Total restructuring | $ | 4,130 | $ | — | $ | 15,666 | ||||||
Changes in the restructuring accrual for the years ended December 31, 2019, 2018, and 2017 were as follows:
Employee Related | Office Related | Other | Total | |||||||||||||
Accrual balance at December 31, 2016 | $ | — | $ | — | $ | — | $ | — | ||||||||
Restructuring charges | 13,065 | 308 | 2,293 | 15,666 | ||||||||||||
Cash payments | (1,199 | ) | (5 | ) | (1,282 | ) | (2,486 | ) | ||||||||
Non-cash write-offs | — | (155 | ) | — | (155 | ) | ||||||||||
Accrual balance at December 31, 2017 | 11,866 | 148 | 1,011 | 13,025 | ||||||||||||
Cash payments | (8,689 | ) | (248 | ) | (993 | ) | (9,930 | ) | ||||||||
Non-cash write-offs | — | 195 | — | 195 | ||||||||||||
Other | (1,843 | ) | (95 | ) | 5 | (1,933 | ) | |||||||||
Exchange rate fluctuations | (65 | ) | — | (6 | ) | (71 | ) | |||||||||
Accrual balance at December 31, 2018 | 1,269 | — | 17 | 1,286 | ||||||||||||
Restructuring charges | 4,130 | — | — | 4,130 | ||||||||||||
Cash payments | (2,213 | ) | — | — | (2,213 | ) | ||||||||||
Non-cash write-offs | — | — | (17 | ) | (17 | ) | ||||||||||
Other | 4 | — | — | 4 | ||||||||||||
Exchange rate fluctuations | 55 | — | — | 55 | ||||||||||||
Accrual balance at December 31, 2019 | $ | 3,245 | $ | — | $ | — | $ | 3,245 | ||||||||
16. | Income Taxes |
The sources of income (loss) before income taxes are as follows:
58
December 31, | ||||||||||||
2019 | 2018 | 2017 | ||||||||||
United States | $ | 53,461 | $ | 47,191 | $ | (28,577 | ) | |||||
Foreign | 15,828 | 23,301 | (841 | ) | ||||||||
Income (loss) before income taxes | $ | 69,289 | $ | 70,492 | $ | (29,418 | ) | |||||
The provision for (benefit from) income taxes are as follows:
December 31, | ||||||||||||
2019 | 2018 | 2017 | ||||||||||
Current | ||||||||||||
Federal | $ | 11,311 | $ | 12,311 | $ | 10,107 | ||||||
State and local | 4,422 | 4,843 | 2,372 | |||||||||
Foreign | 4,423 | 6,907 | 8,257 | |||||||||
Current provision for income taxes | 20,156 | 24,061 | 20,736 | |||||||||
Deferred | ||||||||||||
Federal | 2,031 | 6,403 | 5,642 | |||||||||
State and local | 698 | (354 | ) | (2,951 | ) | |||||||
Foreign | (465 | ) | (8,913 | ) | (4,210 | ) | ||||||
Deferred provision (benefit) for income taxes | 2,264 | (2,864 | ) | (1,519 | ) | |||||||
Total provision for income taxes | $ | 22,420 | $ | 21,197 | $ | 19,217 | ||||||
A reconciliation of the provision for income taxes to income taxes at the statutory U.S. federal income tax rate of 21% for the years ended December 31, 2019 and 2018, and 35% for the year ended December 31, 2017 is as follows:
December 31, | ||||||||||||
2019 | 2018 | 2017 | ||||||||||
Income tax provision (benefit) at the statutory U.S. federal rate | $ | 14,551 | $ | 14,803 | $ | (10,296 | ) | |||||
State income tax provision (benefit), net of federal tax benefit | 3,509 | 3,242 | (593 | ) | ||||||||
Nondeductible expenses, net | 1,570 | 1,651 | 3,282 | |||||||||
Foreign taxes (includes rate differential and changes in foreign valuation allowance) | 698 | (35 | ) | 5,465 | ||||||||
Release of valuation allowance | (117 | ) | (43 | ) | (3,200 | ) | ||||||
Additional U.S. tax on foreign operations | 2,550 | 1,628 | — | |||||||||
Current/deferred true-up | (157 | ) | (1,199 | ) | 567 | |||||||
Tax reform | — | — | 23,732 | |||||||||
Other, net | (184 | ) | 1,150 | 260 | ||||||||
Total provision for income taxes | $ | 22,420 | $ | 21,197 | $ | 19,217 | ||||||
59
The deferred tax assets and liabilities are attributable to the following components:
December 31, | ||||||||
2019 | 2018 | |||||||
Deferred tax assets attributable to: | ||||||||
Foreign net operating loss carryforwards | $ | 17,940 | $ | 18,259 | ||||
Accrued compensation and employee benefits | 14,506 | 15,442 | ||||||
Deferred compensation | 17,110 | 15,587 | ||||||
Foreign tax credit carryforwards | 6,493 | 8,163 | ||||||
Accrued rent | 2,655 | 3,096 | ||||||
Other accrued expenses | 5,882 | 6,290 | ||||||
Deferred tax assets, before valuation allowance | 64,586 | 66,837 | ||||||
Valuation allowance | (24,200 | ) | (26,460 | ) | ||||
Deferred tax assets, after valuation allowance | 40,386 | 40,377 | ||||||
Deferred tax liabilities attributable to: | ||||||||
Goodwill | 5,440 | 2,203 | ||||||
Taxes provided on unremitted earnings | — | 765 | ||||||
Depreciation on property and equipment | 1,652 | 2,040 | ||||||
Other | 533 | 686 | ||||||
Deferred tax liabilities | 7,625 | 5,694 | ||||||
Net deferred tax assets | $ | 32,761 | $ | 34,683 | ||||
The recognition of deferred tax assets is based on management’s belief that it is more likely than not that the tax benefits associated with temporary differences, net operating loss carryforwards and tax credits will be utilized. The Company assesses the recoverability of the deferred tax assets on an ongoing basis. In making this assessment, the Company considers all positive and negative evidence, and all potential sources of taxable income including scheduled reversals of deferred tax liabilities, tax-planning strategies, projected future taxable income and recent financial performance. Certain of the Company's deferred tax liabilities of $0.3 million and $0.2 million do not qualify for deferred tax netting and are included in Other non-current liabilities on the Consolidated Balance Sheets at December 31, 2019 and 2018, respectively.
The valuation allowance decreased from $26.5 million at December 31, 2018 to $24.2 million at December 31, 2019. The valuation allowance at December 31, 2019 was related to foreign net operating loss carryforwards, foreign tax credit carryforwards, and certain foreign deferred tax assets. The Company intends to maintain these valuation allowances until sufficient evidence exists to support their reversal.
At December 31, 2019, the Company had a net operating loss carryforward of $116.1 million related to its foreign tax filings. Of the $116.1 million net operating loss carryforward, $76.9 million is subject to a valuation allowance. Depending on the tax rules of the tax jurisdictions, the losses can be carried forward indefinitely or for periods ranging from five to twenty years. The Company also has a foreign tax credit carryforward of $6.5 million subject to a valuation allowance of $6.5 million.
At December 31, 2018, the Company had a net operating loss carryforward of $118.0 million related to its foreign tax filings. Of the $118.0 million net operating loss carryforward, $59.8 million is subject to a valuation allowance. Depending on the tax rules of the tax jurisdictions, the losses can be carried forward indefinitely or for periods ranging from five to twenty years. The Company also has a foreign tax credit carryforward of $8.2 million subject to a valuation allowance of $8.2 million.
As of December 31, 2018, the Company had $1.1 million of unrecognized tax benefits. As of December 31, 2019, the Company had $0.1 million of unrecognized tax benefits of which, if recognized, would be recorded as a component of income tax expense.
60
A reconciliation of the beginning and ending balances of the total amounts of gross unrecognized tax benefits is as follows:
December 31, | ||||||||||||
2019 | 2018 | 2017 | ||||||||||
Gross unrecognized tax benefits at January 1, | $ | 1,128 | $ | 740 | $ | 1,038 | ||||||
Gross increases for tax positions of prior years | 389 | 608 | 167 | |||||||||
Gross decreases for tax positions of prior years | (377 | ) | — | — | ||||||||
Settlements | (1,010 | ) | (220 | ) | (465 | ) | ||||||
Lapse of statute of limitations | — | — | — | |||||||||
Gross unrecognized tax benefits at December 31, | $ | 130 | $ | 1,128 | $ | 740 | ||||||
In many cases the Company’s uncertain tax positions are related to tax years that remain subject to examination by the relevant taxable authorities. Years 2016 through 2018 are subject to examination by the state taxing authorities. The years 2016 through 2018 are subject to examination by the federal taxing authority. There are certain foreign jurisdictions that are subject to examination for years prior to 2016.
The Company is currently under audit by some jurisdictions. It is likely that the examination phase of several of these audits will conclude in the next twelve months. No significant increases or decreases in unrecognized tax benefits are expected to occur by December 31, 2020.
Estimated interest and penalties related to the underpayment of income taxes are classified as a component of the provision for income taxes in the Consolidated Statements of Comprehensive Income (Loss). Accrued interest and penalties are less than $0.1 million as of December 31, 2019.
The “Tax Cuts and Jobs Act” was enacted in December 22, 2017. The Tax Act included a territorial tax system, beginning in 2018, and it included two new U.S. tax base erosion provisions, the global intangible low-taxed income (“GILTI”) provisions and the base-erosion and anti-abuse tax (“BEAT”) provisions.
The Global Intangible Low-Taxed Income ("GILTI") provisions require the Company to include in its U.S. income tax return foreign subsidiary earnings in excess of an allowable return on the foreign subsidiary’s tangible assets. The Company became subject to incremental U.S. tax on GILTI income beginning in 2018 due to expense allocations required by the U.S. foreign tax credit rules. The Company has elected to account for GILTI tax in the period in which it is incurred, and therefore has not provided any deferred tax impacts of GILTI in its consolidated financial statements for the year ended December 31, 2019.
The Base Erosion and Anti-Abuse Tax ("BEAT") provisions in the Tax Reform Act eliminates the deduction of certain base-erosion payments made to related foreign corporations and impose a minimum tax if greater than regular tax. The Company does not expect it will be subject to this tax and therefore has not included any tax impacts of BEAT in its consolidated financial statements for the year ended December 31, 2019.
17. | Changes in Accumulated Other Comprehensive Income |
The changes in Accumulated other comprehensive income (“AOCI”) by component for the year ended December 31, 2019, are summarized below:
Available- for- Sale Securities | Foreign Currency Translation | Pension | AOCI | |||||||||||||
Balance at December 31, 2018 | $ | — | $ | 5,258 | $ | (1,196 | ) | $ | 4,062 | |||||||
Other comprehensive income before classification, net of tax | 13 | 844 | (1,095 | ) | (238 | ) | ||||||||||
Balance at December 31, 2019 | $ | 13 | $ | 6,102 | $ | (2,291 | ) | $ | 3,824 | |||||||
61
18. | Segment Information |
In 2018, the Company completed the integration of its Leadership Consulting and Culture Shaping businesses into one combined service offering, Heidrick Consulting. In conjunction with the integration, the Company reorganized its Management Committee, which the Company considers to be its chief operating decision maker, so as to regularly assess performance and make resource allocations decisions for the Heidrick Consulting business. Therefore, the Company now reports Leadership Consulting and Culture Shaping as one operating segment, Heidrick Consulting. In conjunction with the change in operating segments, the Company modified its corporate cost allocation methodology. Previously reported operating segment results for the twelve months ended December 31, 2017, have been recast to conform to the new operating segment structure and corporate cost allocation methodology.
The Company has four operating segments. The executive search business operates in the Americas, Europe (which includes Africa) and Asia Pacific (which includes the Middle East), and the Heidrick Consulting business operates globally.
For segment purposes, reimbursements of out-of-pocket expenses classified as revenue and other operating income are reported separately and, therefore, are not included in the results of each segment. The Company believes that analyzing trends in revenue before reimbursements (net revenue), analyzing operating expenses as a percentage of net revenue, and analyzing operating income (loss) more appropriately reflects its core operations.
62
The revenue, operating income, depreciation and amortization, and capital expenditures, by segment, were as follows:
December 31, | ||||||||||||
2019 | 2018 | 2017 | ||||||||||
Revenue | ||||||||||||
Executive Search | ||||||||||||
Americas | $ | 415,455 | $ | 405,267 | $ | 339,793 | ||||||
Europe | 135,070 | 145,348 | 125,346 | |||||||||
Asia Pacific | 95,827 | 102,276 | 86,905 | |||||||||
Total Executive Search | 646,352 | 652,891 | 552,044 | |||||||||
Heidrick Consulting | 60,572 | 63,132 | 69,356 | |||||||||
Revenue before reimbursements | 706,924 | 716,023 | 621,400 | |||||||||
Reimbursements | 18,690 | 19,632 | 18,656 | |||||||||
Total revenue | $ | 725,614 | $ | 735,655 | $ | 640,056 | ||||||
Operating income (loss) | ||||||||||||
Executive Search | ||||||||||||
Americas (1) | $ | 100,833 | $ | 96,880 | $ | 75,337 | ||||||
Europe (2) | 3,026 | 5,849 | 13 | |||||||||
Asia Pacific (3) | 13,590 | 15,999 | 537 | |||||||||
Total Executive Search | 117,449 | 118,728 | 75,887 | |||||||||
Heidrick Consulting (4) | (18,499 | ) | (13,619 | ) | (62,368 | ) | ||||||
Total segments | 98,950 | 105,109 | 13,519 | |||||||||
Global Operations Support (5) | (35,439 | ) | (36,252 | ) | (40,042 | ) | ||||||
Total operating income (loss) | $ | 63,511 | $ | 68,857 | $ | (26,523 | ) | |||||
Depreciation and amortization | ||||||||||||
Executive Search | ||||||||||||
Americas | $ | 4,204 | $ | 4,605 | $ | 4,794 | ||||||
Europe | 2,784 | 3,735 | 3,328 | |||||||||
Asia Pacific | 1,472 | 1,646 | 1,565 | |||||||||
Total Executive Search | 8,460 | 9,986 | 9,687 | |||||||||
Heidrick Consulting | 1,079 | 1,577 | 4,099 | |||||||||
Total segments | 9,539 | 11,563 | 13,786 | |||||||||
Global Operations Support | 832 | 959 | 988 | |||||||||
Total depreciation and amortization | $ | 10,371 | $ | 12,522 | $ | 14,774 | ||||||
Capital expenditures | ||||||||||||
Executive Search | ||||||||||||
Americas | $ | 1,121 | $ | 601 | $ | 7,123 | ||||||
Europe | 1,070 | 3,557 | 1,460 | |||||||||
Asia Pacific | 295 | 440 | 2,633 | |||||||||
Total Executive Search | 2,486 | 4,598 | 11,216 | |||||||||
Heidrick Consulting | 541 | 581 | 1,172 | |||||||||
Total segments | 3,027 | 5,179 | 12,388 | |||||||||
Global Operations Support | 325 | 1,006 | 3,298 | |||||||||
Total capital expenditures | $ | 3,352 | $ | 6,185 | $ | 15,686 | ||||||
(1) | Operating income for the Americas includes restructuring charges of $4.1 million in 2019 and $0.8 million in 2017. |
(2) | Operating income for Europe includes restructuring charges of $4.0 million in 2017. |
(3) | Operating income for Asia Pacific includes restructuring charges of $2.0 million in 2017. |
(4) | Operating loss for Heidrick Consulting includes impairment charges of $50.7 million and restructuring charges of $3.4 million in 2017. |
(5) | Operating loss for Global Operations Support includes restructuring charges of less than $0.1 million in 2019 and $5.5 million in 2017. |
63
Identifiable assets, and goodwill and other intangible assets, net, by segment, are as follows:
December 31, | ||||||||
2019 | 2018 | |||||||
Current assets | ||||||||
Executive Search | ||||||||
Americas | $ | 286,818 | $ | 255,889 | ||||
Europe | 96,230 | 85,355 | ||||||
Asia Pacific | 78,967 | 74,169 | ||||||
Total Executive Search | 462,015 | 415,413 | ||||||
Heidrick Consulting | 30,628 | 34,174 | ||||||
Total segments | 492,643 | 449,587 | ||||||
Global Operations Support | 1,839 | 1,280 | ||||||
Total allocated current assets | 494,482 | 450,867 | ||||||
Unallocated non-current assets | 220,925 | 125,454 | ||||||
Goodwill and other intangible assets, net | ||||||||
Executive Search | ||||||||
Americas | 93,054 | 88,462 | ||||||
Europe | 26,893 | 27,010 | ||||||
Asia Pacific | 8,819 | 8,836 | ||||||
Total Executive Search | 128,766 | 124,308 | ||||||
Heidrick Consulting | — | — | ||||||
Total goodwill and other intangible assets, net | 128,766 | 124,308 | ||||||
Total assets | $ | 844,173 | $ | 700,629 | ||||
19. | Guarantees |
The Company has utilized letters of credit to support certain obligations, primarily the payment of office lease obligations and business license requirements for certain of its subsidiaries in Europe and Asia Pacific. The letters of credit were made to secure the respective agreements and are for the terms of the agreements, which extend through 2030. For each letter of credit issued, the Company would have to use cash to fulfill the obligation if the subsidiary defaults on a lease payment. The maximum amount of undiscounted payments the Company would be required to make in the event of default on all outstanding letters of credit was approximately $2.5 million as of December 31, 2019. The Company has not accrued for these arrangements as no event of default exists or is expected to exist.
20. | Commitments and Contingencies |
Litigation
The Company has contingent liabilities from various pending claims and litigation matters arising in the ordinary course of the Company’s business, some of which involve claims for damages that are substantial in amount. Some of these matters are covered by insurance. Based upon information currently available, the Company believes the ultimate resolution of such claims and litigation will not have a material adverse effect on its financial condition, results of operations or liquidity.
64
PART II (continued)
ITEM 9. CHANGES IN AND DISAGREEMENTS WITH ACCOUNTANTS ON ACCOUNTING AND FINANCIAL DISCLOSURE
The Audit and Finance Committee of the Board of Directors (the “Audit Committee”) of the Company conducted a competitive process to select a firm to serve as the Company’s independent registered public accounting firm for the fiscal year ending December 31, 2018. The Audit Committee invited several firms to participate in this process.
As a result of this process, on June 13, 2018, the Audit Committee appointed RSM US LLP (“RSM”) as the Company’s independent registered public accounting firm for the fiscal year ended December 31, 2018. In conjunction with the selection of RSM to serve as the Company’s independent registered public accounting firm, the Audit Committee dismissed KPMG LLP (“KPMG”) from that role effective on June 13, 2018.
KPMG’s audit reports on the consolidated financial statements of the Company as of and for the fiscal year ended December 31, 2017, did not contain any adverse opinion or disclaimers of opinion and were not qualified or modified as to uncertainty, audit scope or accounting principles.
During the fiscal year ended December 31, 2017, and the interim period through June 13, 2018, there were (i) no disagreements between the Company and KPMG on any matter of accounting principles or practices, financial statement disclosure or auditing scope or procedure, which disagreements, if not resolved to the satisfaction of KPMG would have caused KPMG to make reference to the subject matter of the disagreement in their reports on the Company’s consolidated financial statements for such years, and (ii) no “reportable events” as that term is defined in Item 304(a)(1)(v) of Regulation S-K.
ITEM 9A. CONTROLS AND PROCEDURES
(a) Evaluation of Disclosure Controls and Procedures
The Company maintains disclosure controls and procedures as defined in Securities Exchange Act of 1934, as amended, (the “Exchange Act”) Rules 13a-15(e) and 15d-15(e), that are designed to ensure that information required to be disclosed in the Company’s reports filed or submitted under the Exchange Act is recorded, processed, summarized and reported within the time periods specified in the Securities and Exchange Commission (the “SEC”) rules and forms, and that such information is accumulated and communicated to the Company’s management, including its principal executive officer and principal financial officer, as appropriate, to allow timely decisions regarding required disclosure. Any system of controls and procedures, no matter how well designed and operated, can provide only reasonable assurance of achieving the desired control objectives.
Management of the Company, with the participation of the principal executive officer and the principal financial officer, evaluated the effectiveness of the design and operation of the Company’s disclosure controls and procedures as of December 31, 2019. Based on the evaluation, the Company’s principal executive officer and principal financial officer concluded that the Company’s disclosure controls and procedures were effective as of December 31, 2019.
(b) Management’s report on internal control over financial reporting
Management is responsible for establishing and maintaining adequate internal control over financial reporting, as defined in Exchange Act Rules 13a-15(f) and 15d-15(f). The Company’s internal control over financial reporting is a process designed by, or under the supervision of, the Company’s principal executive and principal financial officers, or persons performing similar functions, and effected by the Company’s board of directors, management, and other personnel, to provide reasonable assurance regarding the reliability of financial reporting and the preparation of financial statements for external purposes in accordance with U.S. generally accepted accounting principles (U.S. GAAP) and includes those policies and procedures that:
(1)Pertain to the maintenance of records that, in reasonable detail, accurately and fairly reflect the transactions and dispositions of the assets of the Company;
(2)Provide reasonable assurance that transactions are recorded as necessary to permit preparation of financial statements in accordance with U.S. GAAP, and that receipts and expenditures of the Company are being made only in accordance with authorizations of management and directors of the Company; and
(3)Provide reasonable assurance regarding prevention or timely detection of unauthorized acquisition, use, or disposition of the Company’s assets that could have a material effect on the financial statements.
65
Because of its inherent limitations, internal control over financial reporting may not prevent or detect misstatements. Also, projections of any evaluation of effectiveness to future periods are subject to the risk that controls may become inadequate because of changes in conditions, or that the degree of compliance with the policies and procedures may deteriorate.
Management conducted an evaluation of the effectiveness of the system of internal control over financial reporting based on the framework in Internal Control—Integrated Framework issued by the Committee of Sponsoring Organizations of the Treadway Commission 2013. Based on this evaluation, management concluded that the Company’s system of internal control over financial reporting was effective as of December 31, 2019.
The Company’s independent registered public accounting firm, RSM LLP, has issued a report on the Company’s internal control over financial reporting. The report on the audit of internal control over financial reporting appears in this Form 10-K.
(c) Changes in Internal Control over Financial Reporting
Effective January 1, 2019, the Company adopted ASU No. 2016-02, Leases, and implemented changes to the relevant business processes, and related control activities within them, in order to monitor and maintain appropriate controls over financial reporting. There were no other changes in our internal control over financial reporting that occurred during the period covered by this Annual Report on Form 10-K that have materially affected, or are reasonably likely to materially affect, our internal control over financial reporting.
ITEM 9B. OTHER INFORMATION
None.
66
PART III
ITEM 10. DIRECTORS, EXECUTIVE OFFICERS AND CORPORATE GOVERNANCE
Information relating to our directors, executive officers and corporate governance will be included in the 2020 Proxy Statement and is incorporated herein by reference.
ITEM 11. EXECUTIVE COMPENSATION
The information required by this Item is included in our 2020 Proxy Statement and is incorporated herein by reference.
ITEM 12. SECURITY OWNERSHIP OF CERTAIN BENEFICIAL OWNERS AND MANAGEMENT AND RELATED STOCKHOLDER MATTERS
Equity Compensation Plan Information
The following table sets forth additional information as of December 31, 2019, about shares of our common stock that may be issued upon the vesting of restricted stock units and performance stock units and the exercise of options under our existing equity compensation plans and arrangements, divided between plans approved by our stockholders and plans or arrangements not submitted to the stockholders for approval. For a description of the types of securities that may be issued under our Second Amended and Restated 2012 Heidrick & Struggles GlobalShare Program. See Note 14, Stock-Based Compensation.
(a) | (b) | (c) | ||||||||
Plan Category | Number of securities to be issued upon exercise of outstanding options | Weighted- average exercise price of outstanding options | Number of securities remaining available for future issuance under equity compensation plans (excluding securities reflected in column (a)) | |||||||
Equity compensation plans approved by stockholders | 778,547 | (1) | $ | — | 981,682 | |||||
Equity compensation plans not approved stockholders | — | — | — | |||||||
Total equity compensation plans | 778,547 | — | 981,682 | |||||||
(1) | Includes 598,988 restricted stock units and 179,559 performance stock units at their target levels and no options. The performance stock units represent the maximum amount of shares to be awarded at target levels, and accordingly, may overstate expected dilution. |
The other information required by this Item is included in our 2020 Proxy Statement and is incorporated herein by reference.
ITEM 13. CERTAIN RELATIONSHIPS AND RELATED TRANSACTIONS, AND DIRECTOR INDEPENDENCE
The information required by this Item is included in our 2020 Proxy Statement and is incorporated herein by reference.
ITEM 14. PRINCIPAL ACCOUNTANT FEES AND SERVICES
The information required by this Item is included in the discussion under the caption “Audit Fees” in our 2020 Proxy Statement and is incorporated herein by reference.
67
PART IV
ITEM 15. EXHIBITS, FINANCIAL STATEMENT SCHEDULES
(a) | THE FOLLOWING DOCUMENTS ARE FILED AS PART OF THIS REPORT: |
1. Index to Consolidated Financial Statements:
See Consolidated Financial Statements included as part of this Form 10-K beginning on page 32.
2. Exhibits:
Exhibit No. | Description | |
3.01 | Amended and Restated Certificate of Incorporation of the Registrant (Incorporated by reference to Exhibit 3.02 of this Registrant’s Registration Statement on Form S-4 (File No. 333-61023)) | |
3.02 | ||
4.01 | ||
*4.02 | ||
10.01 | ||
10.02 | ||
10.03 | ||
10.04 | ||
10.05 | ||
10.06 | ||
10.07 | ||
10.08 | ||
10.09 | ||
10.10 | ||
10.11 | ||
10.12 | ||
10.13 | ||
68
10.14 | ||
10.15 | ||
10.16 | ||
10.17 | ||
10.18 | ||
10.19 | ||
10.20 | ||
10.21 | ||
10.22 | ||
10.23 | ||
10.24 | ||
10.25 | ||
10.26 | ||
10.27 | ||
10.28 | ||
10.29 | ||
10.30 | ||
10.31 | ||
10.32 | ||
69
10.33 | ||
10.34 | ||
10.35 | ||
10.36 | ||
10.37 | ||
10.38 | ||
10.39 | ||
10.40 | ||
10.41 | ||
10.42 | ||
10.43 | ||
10.44 | ||
10.45 | ||
10.46 | ||
10.47 | ||
10.48 | ||
10.49 | ||
10.50 | ||
10.51 | ||
10.52 | ||
*10.53 | ||
*21.01 | ||
*23.01 | ||
70
*23.02 | ||
*31.1 | ||
*31.2 | ||
*32.1 | ||
*32.2 | ||
*101.INS | XBRL Instance document | |
*101.SCH | XBRL Taxonomy Extension Schema Document | |
*101.CAL | XBRL Taxonomy Calculation Linkbase Document | |
*101.DEF | XBRL Taxonomy Extension Definition Linkbase Document | |
*101.LAB | XBRL Taxonomy Extension Label Linkbase Document | |
*101.PRE | XBRL Taxonomy Extension Presentation Linkbase Document | |
* Filed herewith.
** Denotes a management contract or compensatory plan or arrangement.
(b) | SEE EXHIBIT INDEX ABOVE |
(c) | FINANCIAL STATEMENTS NOT PART OF ANNUAL REPORT |
None.
71
SIGNATURES
Pursuant to the requirements of Section 13 or 15(d) of the Securities Exchange Act of 1934, as amended, the registrant has duly caused this report to be signed on its behalf by the undersigned, thereunto duly authorized on February 24, 2020.
HEIDRICK & STRUGGLES INTERNATIONAL, INC. | ||
/s/ Stephen A. Bondi | ||
By: | Stephen A. Bondi | |
Title: | Vice President, Controller | |
Signature | Title | |
/s/ Krishnan Rajagopalan | Chief Executive Officer & Director | |
Krishnan Rajagopalan (Principal Executive Officer) | ||
/s/ Mark R. Harris | Executive Vice President, Chief Financial Officer | |
Mark R. Harris (Principal Financial Officer) | ||
/s/ Stephen A. Bondi | Vice President, Controller | |
Stephen A. Bondi (Principal Accounting Officer) | ||
/s/ Elizabeth L. Axelrod | Director | |
Elizabeth L. Axelrod | ||
/s/ Clare M. Chapman | Director | |
Clare M. Chapman | ||
/s/ Gary E. Knell | Director | |
Gary E. Knell | ||
/s/ Lyle Logan | Director | |
Lyle Logan | ||
/s/ T. Willem Mesdag | Director | |
T. Willem Mesdag | ||
/s/ Stacey Rauch | Director | |
Stacey Rauch | ||
/s/ Adam Warby | Director | |
Adam Warby | ||
72