Attached files
| file | filename |
|---|---|
| EX-4.3 - EX-4.3 - Solaris Oilfield Infrastructure, Inc. | soi-20191231ex43bc2f040.htm |
| EX-32.2 - EX-32.2 - Solaris Oilfield Infrastructure, Inc. | soi-20191231ex322766f0f.htm |
| EX-32.1 - EX-32.1 - Solaris Oilfield Infrastructure, Inc. | soi-20191231ex3218d412a.htm |
| EX-31.2 - EX-31.2 - Solaris Oilfield Infrastructure, Inc. | soi-20191231ex312ef727c.htm |
| EX-31.1 - EX-31.1 - Solaris Oilfield Infrastructure, Inc. | soi-20191231ex31179f519.htm |
| EX-23.1 - EX-23.1 - Solaris Oilfield Infrastructure, Inc. | soi-20191231ex2310bdce5.htm |
UNITED STATES
SECURITIES AND EXCHANGE COMMISSION
Washington, D.C. 20549
FORM 10-K
(Mark One)
☒ANNUAL REPORT PURSUANT TO SECTION 13 OR 15(d) OF THE SECURITIES EXCHANGE ACT OF 1934
For the fiscal year ended December 31, 2019
or
☐TRANSITION REPORT PURSUANT TO SECTION 13 OR 15(d) OF THE SECURITIES EXCHANGE ACT OF 1934
For the transition period from to
Commission File Number: 001‑38090
SOLARIS OILFIELD INFRASTRUCTURE, INC.
(Exact name of registrant as specified in its charter)
|
Delaware |
81‑5223109 |
|
(State or other jurisdiction |
(I.R.S. Employer |
|
|
|
|
9811 Katy Freeway, Suite 700 Houston, Texas |
77024 |
|
(Address of principal executive offices) |
(Zip code) |
|
|
|
|
(281) 501‑3070 |
|
|
(Registrant’s telephone number, including area code) |
|
|
|
|
|
(Former name, former address and former fiscal year, if changed since last report) |
|
Securities registered pursuant to Section 12(b) of the Act:
|
Title of Each Class |
Trading Symbol(s) |
Name of each exchange on which registered |
|
Class A Common Stock, $0.01 par value |
“SOI" |
New York Stock Exchange |
Securities registered pursuant to Section 12(g) of the Act: None
Indicate by check mark if the Registrant is a well‑known seasoned issuer, as defined in Rule 405 of the Securities Act. Yes ☐ No ☒
Indicate by check mark if the Registrant is not required to file reports pursuant to Section 13 or Section 15(d) of the Act. Yes ☐ No ☒
Indicate by check mark whether the registrant (1) has filed all reports required to be filed by Section 13 or 15(d) of the Securities Exchange Act of 1934 during the preceding 12 months (or for such shorter period that the registrant was required to file such reports), and (2) has been subject to such filing requirements for the past 90 days. Yes ☒ No ☐
Indicate by check mark whether the registrant has submitted electronically every Interactive Data File required to be submitted pursuant to Rule 405 of Regulation S-T (§ 232.405 of this chapter) during the preceding 12 months (or for such shorter period that the registrant was required to submit such files). Yes ☒ No ☐
Indicate by check mark whether the registrant is a large accelerated filer, an accelerated filer, a non-accelerated filer, a smaller reporting company, or an emerging growth company. See the definitions of “large accelerated filer,” “accelerated filer,” “smaller reporting company” and “emerging growth company” in Rule 12b‑2 of the Exchange Act.
|
Large accelerated filer ☐ |
|
Accelerated filer ☒ |
|
|
Non-accelerated filer ☐ |
|
Smaller reporting company ☐ |
|
|
|
Emerging growth company ☒ |
|
|
If an emerging growth company indicate by check mark if the registrant has elected not to use the extended transition period for complying with any new or revised financial accounting standards provided pursuant to Section 13(a) of the Exchange Act. ¨☒
Indicate by check mark whether the registrant is a shell company (as defined in Rule 12b‑2 of the Exchange Act). Yes ☐ No ☒
Aggregate market value of the voting and non‑voting common equity held by non‑affiliates of Registrant as of June 30, 2019: $467,029,613
As of February 14, 2020, the registrant had 30,218,896 shares of Class A common stock, $0.01 par value per share, and 15,939,169 shares of Class B common stock, $0.00 par value per share, outstanding.
DOCUMENTS INCORPORATED BY REFERENCE
Portions of the definitive proxy statement relating to the Registrant’s 2019 Annual Meeting of Shareholders are incorporated by reference into Part III of this Annual Report on Form 10-K.
SOLARIS OILFIELD INFRASTRUCTURE, INC.
2
CAUTIONARY STATEMENT REGARDING FORWARD-LOOKING STATEMENTS
This Annual Report on Form 10-K (this “Annual Report”) includes “forward-looking statements” within the meaning of Section 27A of the Securities Act of 1933, as amended (the “Securities Act”), and Section 21E of the Securities Exchange Act of 1934, as amended (the “Exchange Act”). Statements that are predictive in nature, that depend upon or refer to future events or conditions or that include the words "believe," "expect," "anticipate," "intend," "estimate" and other expressions that are predictions of or indicate future events and trends and that do not relate to historical matters identify forward-looking statements. Our forward-looking statements include statements about our business strategy, our industry, our future profitability, our expected capital expenditures and the impact of such expenditures on our performance, the costs of being a publicly traded corporation and our capital programs.
A forward-looking statement may include a statement of the assumptions or bases underlying the forward-looking statement. We believe that we have chosen these assumptions or bases in good faith and that they are reasonable. You are cautioned not to place undue reliance on any forward-looking statements. You should also understand that it is not possible to predict or identify all such factors and should not consider the following list to be a complete statement of all potential risks and uncertainties. Factors that could cause our actual results to differ materially from the results contemplated by such forward-looking statements include:
|
· |
the level of domestic capital spending by the oil and natural gas industry; |
|
· |
natural or man-made disasters and other external events that may disrupt our manufacturing operations; |
|
· |
volatility of oil and natural gas prices; |
|
· |
changes in general economic and geopolitical conditions; |
|
· |
large or multiple customer defaults, including defaults resulting from actual or potential insolvencies; |
|
· |
technological advancements in well completion technologies; |
|
· |
competitive conditions in our industry; |
|
· |
inability to fully protect our intellectual property rights; |
|
· |
changes in the long-term supply of and demand for oil and natural gas; |
|
· |
actions taken by our customers, competitors and third-party operators; |
|
· |
fluctuations in transportation costs or the availability or reliability of transportation to supply our systems and transloading services; |
|
· |
changes in the availability and cost of capital; |
|
· |
our ability to successfully implement our business plan; |
|
· |
our ability to complete growth projects on time and on budget; |
|
· |
the price and availability of debt and equity financing (including changes in interest rates); |
|
· |
changes in our tax status; |
|
· |
our ability to successfully develop our research and technology capabilities and implement technological developments and enhancements and expand our product and service offerings; |
3
|
· |
changes in market price and availability of materials; |
|
· |
the effects of existing and future laws and governmental regulations (or the interpretation thereof); |
|
· |
cyber-attacks targeting systems and infrastructure used by the oil and natural gas industry; |
|
· |
failure to secure or maintain contracts with our largest customers; |
|
· |
the effects of future litigation; |
|
· |
credit markets; |
|
· |
leasehold or business acquisitions; |
|
· |
weather and other natural phenomena; |
|
· |
uncertainty regarding our future operating results; |
|
· |
significant changes in the transportation industries that service our business, such as increased regulation and embargoes; and |
|
· |
plans, objectives, expectations and intentions contained in this Annual Report that are not historical. |
All forward-looking statements speak only as of the date of this Annual Report. You should not place undue reliance on our forward-looking statements. Although forward-looking statements reflect our good faith beliefs at the time they are made, forward-looking statements involve known and unknown risks, uncertainties and other factors, including the factors described under "Risk Factors," which may cause our actual results, performance or achievements to differ materially from anticipated future results, performance or achievements expressed or implied by such forward-looking statements. We undertake no obligation to publicly update or revise any forward-looking statement, whether as a result of new information, future events, changed circumstances or otherwise, unless required by law.
4
You should read this entire report carefully, including the risks described under Part 1, Item 1A. Risk Factors and our consolidated financial statements and the notes to those consolidated financial statements included elsewhere in this Annual Report. Except as otherwise indicated or required by the context, all references in this Annual Report to the "Company," "Solaris," "we," "us" and "our" refer to (i) Solaris Oilfield Infrastructure, LLC ("Solaris LLC") and its consolidated subsidiaries prior to the completion of our initial public offering and (ii) Solaris Oilfield Infrastructure, Inc. ("Solaris Inc.") and its consolidated subsidiaries following the completion of our initial public offering, unless we state otherwise or the context otherwise requires.
Our Predecessor and Solaris
Solaris LLC was formed in July 2014. Solaris Inc. was incorporated as a Delaware corporation in February 2017 for the purpose of completing an initial public offering of equity in May 2017 (the "IPO" or the "Offering") and related transactions. On May 11, 2017, in connection with the IPO, Solaris Inc. became a holding company whose sole material asset consists of units in Solaris LLC ("Solaris LLC Units"). Solaris Inc. became the managing member of Solaris LLC and is responsible for all operational, management and administrative decisions relating to Solaris LLC's business and consolidates the financial results of Solaris LLC and its subsidiaries.
Overview
We design, manufacture and rent specialized equipment which combined with field technician support, logistics services and our software solutions, enables us to provide a service offering that helps oil and natural gas operators and their suppliers to drive efficiencies and reduce costs during the completion phase of well development. The majority of our revenue is currently derived from rental and services related to our patented mobile proppant and chemical management systems that unload, store and deliver proppant and chemicals used in the hydraulic fracturing of oil and natural gas wells, as well as coordinating the delivery of proppant and chemicals to the well site. Our systems are deployed in most of the active oil and natural gas basins in the United States, including the Permian Basin, Eagle Ford Shale, SCOOP/STACK formations, Haynesville Shale, Rockies, Marcellus and Utica Shales and Bakken formation.
In 2018 and 2019, we introduced new equipment and service enhancements, which we believe will help us maintain and expand our total revenue opportunity in the United States completions space. We introduced our mobile chemical management system to the market in late 2018 and we began commercializing the offering in 2019. Design enhancements to our mobile proppant system include our AutoHopper™ technology, which automates the delivery of proppant into the blender, and the latest version of our Solaris Lens® software, which is available on our systems and allows customers to view the entire last mile proppant supply chain in real time.
Organizational Structure
Solaris Inc. was incorporated in February 2017 for the purpose of completing an initial public offering and related transactions. Our IPO was completed on May 17, 2017.
In connection with the closing of the IPO, Solaris Inc. became the managing member of Solaris LLC and is responsible for all operational, management and administrative decisions relating to Solaris LLC's business. Solaris Inc. consolidates the financial results of Solaris LLC and its subsidiaries and reports non-controlling interest related to the portion of the Solaris LLC Units not owned by Solaris Inc., which reduces net income (loss) attributable to the holders of Solaris Inc.’s Class A common stock. As of December 31, 2019, Solaris Inc. owned 66% of Solaris LLC.
Each share of Class B common stock has no economic rights but entitles its holder to one vote on all matters to be voted on by stockholders generally. Holders of Class A common stock and Class B common stock vote together as a single class on all matters presented to our stockholders for their vote or approval, except as otherwise required by
5
applicable law or by our amended and restated certificate of incorporation. We do not intend to list our Class B common stock on any exchange.
In connection with the IPO, Solaris Inc. entered into a Tax Receivable Agreement (the “Tax Receivable Agreement”) with each member of Solaris LLC immediately prior to the IPO (collectively, the “Original Investors”) (each such person and any permitted transferee, a “TRA Holder,” and together, the “TRA Holders”) on May 17, 2017. The Tax Receivable Agreement generally provides for the payment by Solaris Inc. to each TRA Holder of 85% of the net cash savings, if any, in United States federal, state and local income tax and franchise tax that Solaris Inc. actually realizes (computed using simplifying assumptions to address the impact of state and local taxes) or is deemed to realize in certain circumstances in periods after the IPO as a result of (i) certain increases in tax basis that occur as a result of Solaris Inc.’s acquisition (or deemed acquisition for United States federal income tax purposes) of all or a portion of such TRA Holder’s Solaris LLC Units in connection with the IPO or pursuant to the exercise of the Redemption Right or the Call Right (each as defined in Solaris LLC’s Second Amended and Restated Limited Liability Company Agreement (the “Solaris LLC Agreement”)) and (ii) imputed interest deemed to be paid by Solaris Inc. as a result of, and additional tax basis arising from, any payments Solaris Inc. makes under the Tax Receivable Agreement. Solaris Inc. will retain the benefit of the remaining 15% of these cash savings. For additional information regarding the Tax Receivable Agreement, see Item 1A. “Risk Factors—Risks Related to Our Class A Common Stock.”
The following diagram indicates our simplified ownership structure as of February 18, 2020. This chart is provided for illustrative purposes only and does not represent all legal entities affiliated with us.
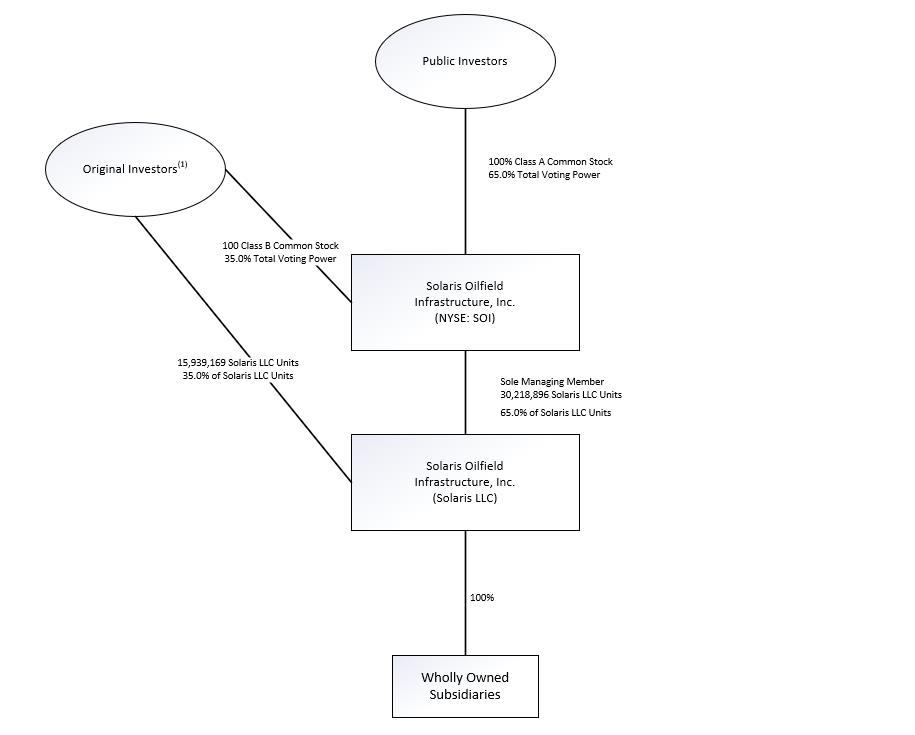
(1) Includes certain investment funds managed by Yorktown Partners LLC (“Yorktown”), certain of our officers and directors and the other members of Solaris LLC.
Our History
We were formed in 2014 in connection with the purchase of two proppant management systems from Loadcraft Industries, Ltd. (“Loadcraft Industries”), the original manufacturer of the systems, under an exclusive marketing
6
arrangement. In September 2014, we acquired Loadcraft Industries' proppant management system manufacturing business, including a manufacturing facility located in Early, Texas, and commenced our manufacturing operations.
Since our inception in 2014, we have grown our fleet of proppant management systems from two systems to 166 systems, improved the capabilities of our systems and developed and acquired additional product and service offerings.
Products and Services
We provide several products and services designed to increase efficiency, ensure reliable supply and reduce logistical costs to deliver and manage proppant and chemicals used during the completion phase of oil and gas well development. Our primary offerings include:
|
· |
System Rental – We manufacture and rent equipment to manage the delivery, handling and storage of proppant and chemicals at the well site. Our systems are highly mobile, can be easily deployed to any North American basin and do not require any specialized equipment to transport or deliver proppant or chemicals to the well site. |
|
o |
Mobile Proppant Management System – Our patented mobile proppant management systems typically contain six silos, two base units and one central conveyor. The six-silo configuration has the capacity to store approximately 2.5 million pounds of proppant and provides 24 unloading points for pneumatic trucks to deliver proppant into the silos. We also offer a non-pneumatic kit that allows our system to receive proppant from belly dump trucks. We believe our six-silo system provides increased inventory capacity compared to other systems, which reduces the amount of truck demurrage, or wait time, at the well site. Our systems are scalable in increments of three, including our 12-silo configuration, which provides a larger buffer to help manage increased proppant loadings, increased reliance on trucking for logistics as sand development shifts to in-basin sources and multi-well pad development activity. |
|
o |
Mobile Chemical Management System – Our patent-pending mobile chemical management systems typically contain three silos, one base unit, and a system of pumps meters and hoses to measure and deliver up to six different completion chemicals to the pressure pumping company’s blender. The three-silo configuration provides increased inventory capacity and control in a smaller footprint when compared to traditional storage and delivery methods which typically include a chem add unit, frac tanks, ISO tanks and dozens of manually operated totes on flatbed trailers. |
|
o |
Inventory Management Software – Each of our systems is equipped with sensors and our integrated Solaris Lens software system that enables our customers to track inventory and throughput volumes of each silo or silo compartment on a remote and real-time basis. With the integration of our Railtronix® software and third-party trucking applications, we can provide full visibility of the proppant and chemical from the vendor to the well site supply chain for certain customers. |
|
· |
Field and Logistics Services – We provide trained personnel to support our systems, train our customers to operate the systems and assist in the transportation of our systems. In addition, we provide last mile proppant logistics services, including managing trucking logistics from source to well site. |
|
· |
Transloading Services – At our Kingfisher Facility in Oklahoma, we provide manifest and unit-train transloading services, as well as provide forward staging storage of regional and local proppant. |
|
· |
Inventory Software Services – We provide real-time inventory management software, Solaris Lens, that enables our customers to monitor and measure proppant loaded into railcars or trucks at transload facilities or mines. |
Manufacturing
We manufacture our systems in our facility in Early, Texas (the “Early Facility”). Early is located in central Texas, which provides convenient access to several of our most active operating areas, including the Permian Basin, the Eagle
7
Ford Shale, the SCOOP/STACK formations and the Haynesville Shale. Our manufacturing process involves cutting, rolling and welding steel and assembly and testing of our systems. We have historically outsourced and may continue to outsource the manufacturing of certain components of our products in order to optimize our manufacturing capacity. When necessary, we also perform major repairs and overhauls of our systems in the Early Facility. We believe our Early Facility is a competitive advantage that provides us with a greater ability to control manufacturing costs, as well as additional supply chain and quality security and research and development capabilities.
Kingfisher Facility
The Kingfisher Facility is located central to the SCOOP/STACK plays and is capable of servicing multiple large volume customers. The Kingfisher Facility has over 45,000 feet of rail track and 30,000 tons of proppant storage in six silos with individual capacity of 5,000 tons per silo. The Kingfisher Facility services manifest and unit-trains and provides high efficiency silo and direct rail-to-truck transloading, in addition to forward staging storage. See our discussion of the Kingfisher Facility in Item 7. “—Management’s Discussion and Analysis of Financial Condition and Results of Operations”.
Raw Materials and Key Suppliers
The primary raw materials used in the manufacturing of our equipment are steel in the form of plate, bar stock and square and round tubing. We purchase steel and most other raw materials and components on the open market and rely on third parties for providing certain materials, including axles, motors and generators. We believe that we will be able to obtain an adequate supply of raw materials and finished goods to meet our manufacturing requirements because these items are generally available from multiple sources. However, prices for such raw materials and finished goods can fluctuate widely and represent a significant portion of the cost of manufacturing. Accordingly, our cost of revenue and capital costs may be affected by changes in the market price or disruptions in the availability of raw materials, components and sourced finished goods.
We work with third-party suppliers to both transport equipment and materials and provide certain materials used in the manufacturing and maintenance of our systems. During the year ended December 31, 2019, one supplier, Automatize Logistics, LLC., accounted for approximately 19%, respectively, of our total spending. During the year ended December 31, 2018, two suppliers, BWJ Metalworks LLC and Heil Trailer International Co., accounted for approximately 13% and 11%, respectively, of our total spending. During the year ended December 31, 2017, no supplier accounted for more than 10% of our total spending.
Our Customers and Contracts
Our primary customers are major E&P and oilfield service companies. We generally execute master service agreements ("MSAs") with our customers. Generally, the MSAs govern the relationship with our customers with specific work performed under individual work orders. For the year ended December 31, 2019, Devon Energy Corporation and ProPetro Services, Inc., accounted for approximately 19% and 10%, respectively, of our total revenue. For the year ended December 31, 2018, EOG Resources, Inc., ProPetro Holding Corp. and BJ Services, LLC, accounted for approximately 15%, 10% and 10%, respectively, of our total revenue. For the year ended December 31, 2017, EOG Resources Inc., ProPetro Holding Corp., Schlumberger Technology Corporation and Devon Energy Corporation accounted for approximately 23%,15%, 13% and 11%, respectively, of our total revenue.
Competition
The oil and natural gas services industry is highly competitive. Please read Item 1A. "Risk Factors—Risks Related to Our Business—We face significant competition that may impede our ability to gain market share or cause us to lose market share or that could make adoption of new product offerings difficult." There are numerous large and small services companies in all regions of the United States with whom we compete. We face competition from proppant and chemical producers and proppant and chemical transporters who also offer solutions for unloading, storing and delivering proppant and chemicals at well sites and also from competitors who are focused on developing more efficient proppant and chemical logistic solutions. Our main competitors include U.S. Silica, Proppant Express Solutions, LLC, Hi-Crush Partners LP, National Oilwell Varco, Inc., CIG Logistics, OmniTRAX, Inc., Smart Sand Inc., Sand Revolution
8
LLC, Total Sand Solution and Hoover Ferguson Group, Inc. We also face competition from pressure pumping, logistics and sand companies that own their own proppant and chemical handling equipment. Many of these companies may be customers of ours on certain jobs while also utilizing their own equipment on other jobs.
We believe that we are well positioned competitively due to our existing market share, patent-protected technology, unique service offerings, low cost of operation, strong balance sheet and operational track record. The most important factors on which we compete are product and service quality, performance, reliability and price. Demand for our systems and services and the prices that we will be able to obtain for our systems and services, are closely linked to proppant and chemical consumption patterns for the completion of oil and natural gas wells in North America. These consumption patterns are influenced by numerous factors, including the price for hydrocarbons, the drilling rig count and hydraulic fracturing activity, including the number and rate of stages completed and the amount of proppant or chemical used per stage. Further, these consumption patterns are also influenced by the location, quality, price and availability of proppant and chemicals.
Seasonality
Our business is not significantly impacted by seasonality, although our fourth quarter activity has historically been impacted by holidays and our clients’ budget cycles, during which we may experience declines in our operating results.
In addition, we provide our proppant and chemical systems and services to E&P companies operating in oil and natural gas producing basins where severe weather conditions may curtail drilling activities and, as a result, impact our revenues generated from those regions. For a discussion of the impact of weather on our operations, please read “Risk Factors—Seasonal weather conditions and natural disasters could severely disrupt normal operations and harm our business.”
Environmental and Occupational Health and Safety Regulations
Our business operations are subject to stringent federal, tribal, regional, state and local laws and regulations governing occupational health and safety, the discharge of materials into the environment and environmental protection. Numerous governmental entities, including the U.S. Environmental Protection Agency (“EPA”), the U.S. Occupational Safety and Health Administration ("OSHA") and analogous state agencies, have the power to enforce compliance with these laws and regulations and the permits issued under them, often requiring difficult and costly actions, including the incurrence of potentially significant capital or operating expenditures to mitigate or prevent releases of materials from our equipment, facilities or from customer locations where we provide products and services. These laws and regulations may, among other things require the acquisition of permits to conduct regulated activities; restrict the types, quantities and concentration of various substances that can be released into the environment; require remedial measures to mitigate pollution from former and ongoing operations; impose specific safety and health criteria addressing worker protection; and impose substantial liabilities for pollution resulting from operations and support services.
The more significant of these existing environmental and occupational health and safety laws and regulations include the following U.S. legal standards, as amended from time to time:
|
· |
the Clean Air Act (“CAA”), which restricts the emission of air pollutants from many sources and imposes various pre-construction, operational, monitoring, and reporting requirements, and that the EPA has relied upon as authority for adopting climate change regulatory initiatives relating to greenhouse gas (“GHG”) emissions; |
|
· |
the Federal Water Pollution Control Act, also known as the Clean Water Act, which regulates discharges of pollutants to state and federal waters and establishes the extent to which waterways are subject to federal jurisdiction and rulemaking as protected waters of the United States; |
|
· |
the Oil Pollution Act of 1990, which, among other things, subjects owners and operators of onshore facilities to liability for removal costs and damages arising from an oil spill in waters of the United States; |
9
|
· |
the Comprehensive Environmental Response, Compensation and Liability Act of 1980 (“CERCLA”), which imposes liability on generators, transporters, and arrangers of hazardous substances at sites where hazardous substance releases have occurred or are threatening to occur; |
|
· |
the Resource Conservation and Recovery Act (“RCRA”), which governs the generation, treatment, storage, transport, and disposal of solid wastes, including hazardous wastes; |
|
· |
the Safe Drinking Water Act (“SDWA”), which ensures the quality of the nation’s public drinking water through adoption of drinking water standards and controlling the injection of waste fluids into below-ground formations that may adversely affect drinking water sources; |
|
· |
the Occupational Safety and Health Act, which establishes workplace standards for the protection of the health and safety of employees, including the implementation of hazard communications programs designed to inform employees about hazardous substances in the workplace, potential harmful effects of these substances, and appropriate control measures; |
|
· |
the Endangered Species Act, which restricts activities that may affect federally identified endangered and threatened species or their habitats by the implementation of operating restrictions or a temporary, seasonal, or permanent ban in affected areas; and |
|
· |
the Department of Transportation regulations, which relate to advancing the safe transportation of energy and hazardous materials and emergency response preparedness. |
Additionally, there exist regional, state and local jurisdictions in the United States where we operate that also have, or are developing or considering developing, similar environmental and occupational health and safety laws and regulations governing many of these same types of activities. While the legal requirements imposed in state and local jurisdictions may be similar in form to federal laws and regulations, in some cases the actual implementation of these requirements may impose additional, or more stringent, conditions or controls that can significantly restrict, delay or cancel the permitting, development or expansion of a project or substantially increase the cost of doing business. Additionally, our operations may require state-law based permits in addition to federal permits, requiring state agencies to consider a range of issues, many the same as federal agencies, including, among other things, a project's impact on wildlife and their habitats, historic and archaeological sites, aesthetics, agricultural operations, and scenic areas. Our existing operations as well as the development of new sites also are subject to a variety of local environmental and regulatory requirements, including land use, zoning, building and transportation requirements. Moreover, whether at the federal, tribal, regional, state and local levels, environmental and occupational health and safety laws and regulations, including new or amended legal requirements that may arise in the future to address potential environmental concerns such as air and water impacts or to address perceived health or safety-related concerns such as oil and natural gas development in close proximity to specific occupied structures and/or certain environmentally-sensitive or recreational areas, are expected to continue to have a considerable impact on the demand for our systems and services.
These environmental and occupational health and safety laws and regulations generally restrict the level of pollutants emitted to ambient air, discharges to surface water, and disposals or other releases to surface and below-ground soils and ground-water. Failure to comply with these laws and regulations may result in the assessment of sanctions, including administrative, civil, and criminal penalties; the imposition of investigatory, remedial, and corrective action obligations or the incurrence of capital expenditures; the occurrence of restrictions, delays or cancellations in the permitting, development or expansion of projects; and the issuance of injunctions restricting or prohibiting some or all of our activities in a particular area. In particular, under certain circumstances, environmental agencies may delay or refuse to grant required approvals or cancel or amend existing permits or leases that may relate to our customers' operations, in which event such operations may be interrupted or suspended for varying lengths of time, causing a reduced demand for our products and services, an associated loss of revenue to us and adversely affecting our results of operations in support of those customers. Additionally, multiple environmental laws provide for citizen suits, which allow private parties, including environmental organizations, to act in place of the government and sue operators for alleged violations of environmental law. See Risk Factors under Part I, Item 1A of this Form 10-K for further discussion on environmental laws and regulations, including with respect to hydraulic fracturing; induced seismicity regulatory developments; ozone standards, site remediation; climate change, including methane or other GHG emissions; and other regulations relating to environmental protection and occupational health and safety. The ultimate financial
10
impact arising from environmental laws and regulations is neither clearly known nor determinable as existing standards are subject to change and new standards or more stringent enforcement programs continue to evolve.
We have incurred and will continue to incur operating and capital expenditures, some of which may be material, to comply with environmental and occupational health and safety laws and regulations. The trend in environmental regulation is to place more restrictions on activities that may affect the environment and, thus, any new laws and regulations, amendment of existing laws and regulations, reinterpretation of legal requirements or increased governmental enforcement that result in more stringent and costly pollution control equipment, the occurrence of restrictions, delays or cancellations in the permitting or performance of projects, or waste handling, storage, transport, disposal or remediation requirements could have a material adverse effect on our operations and financial position. Historically, our environmental compliance costs have not had a material adverse effect on our results of operations; however, there can be no assurance that such costs will not be material in the future or that such future compliance will not have a material adverse effect on our business and operational results. It is possible that other developments, such as stricter and more comprehensive environmental and occupational health and safety laws and regulations, claims for personal injuries to persons or damages to natural resources and property, or disruption of our customers' operations resulting from our actions or omissions, and imposition of penalties due to our operations could have a material adverse effect on us and our results of operations.
Intellectual Property
We continuously seek to innovate our product and service offerings to improve our operations and deliver increased value to our customers. Our engineering team is focused on continuing to enhance the capabilities of our systems, increasing our product and service offerings and improving our manufacturing operations. In addition, our software team is constantly designing and building increased software capabilities to enable efficient supply chain planning and management for our customers. We believe our investment in research and development will result in the development of complementary products and services, which will provide a competitive advantage as our customers focus on extracting oil and natural gas in the most economical and efficient ways possible.
We seek patent and trademark protections for our technology when we deem it prudent, and we aggressively pursue protection of these rights. We believe our patents, trademarks, and other protections for our proprietary technologies are adequate for the conduct of our business and that no single patent or trademark is critical to our business. In addition, we rely to a great extent on the technical expertise and know-how of our personnel to maintain our competitive position, and we take commercially reasonable measures to protect trade secrets and other confidential and/or proprietary information relating to the technologies we develop.
As of December 31, 2019, we had four issued patents in the United States, four corollary patents issued in Canada and two corollary patents issued in Mexico; three utility patent applications in the United States, two in Canada, and one in Mexico; and three provisional patent applications in the United States. Each patent and patent application relates to our systems and services and other technologies. Our issued patents expire, if all of the maintenance fees are paid, between 2032 and 2033. We cannot assure you that any of our patent applications will result in the issuance of a patent, or whether the examination process will require us to narrow our claims. In addition, any patents may be contested, circumvented, found unenforceable or invalid, and we may not be able to prevent third parties from infringing them.
Legal Proceedings
Due to the nature of our business, we may become, from time to time, involved in routine litigation or subject to disputes or claims related to our business activities. In the opinion of our management, there are no pending litigation, disputes or claims against us which, if decided adversely, would have a material adverse effect on our financial condition, cash flows or results of operations.
Employees
As of December 31, 2019, we employed 245 people pursuant to an Administrative Services Agreement. None of our employees are subject to collective bargaining agreements. We consider our employee relations to be good.
11
Available Information
We are required to file any annual, quarterly and current reports, proxy statements and certain other information with the Securities and Exchange Commission (the “SEC”).
The SEC maintains a website at www.sec.gov that contains reports, proxy and information statements and other information regarding registrants that file electronically with the SEC. Any documents filed by us with the SEC, including this Annual Report, can be downloaded from the SEC's website.
Our principal executive offices are located at 9811 Katy Freeway, Suite 700, Houston, Texas 77024, and our telephone number is (281) 501-3070. Our website is at www.solarisoilfield.com. Our periodic reports and other information filed with or furnished to the SEC, pursuant to Section 13(a) or 15(d) of the Exchange Act, including Annual Reports on Form 10-K and 10-K/A, quarterly reports on Form 10-Q and Form 10-Q/A, current reports on Form 8-K, and amendments to those reports are available, free of charge, through our website, as soon as reasonably practicable after those reports and other information are electronically filed with or furnished to the SEC. Information on our website or any other website is not incorporated by reference into this Annual Report and does not constitute a part of this Annual Report.
The following are certain risk factors that affect our business, financial condition, results of operations and cash flows. Many of these risks are beyond our control. These risk factors should be considered in connection with evaluating the forward-looking statements contained in this Annual Report. The risks and uncertainties described below are not the only ones that we face. If any of the events described below were to actually occur, our business, financial condition, results of operations and cash flows could be adversely affected and our results could differ materially from expected and historical results, any of which may also adversely affect the holders of our stock.
Risks Related to Our Business
Our business depends on domestic capital spending by the oil and natural gas industry, and reductions in capital spending could have a material adverse effect on our liquidity, results of operations and financial condition.
Our business is directly affected by capital spending to explore for, develop and produce oil and natural gas in the United States. The oil and natural gas industry is cyclical and historically has experienced periodic downturns in activity. The significant decline in oil and natural gas prices that began in late 2014 caused a reduction in the exploration, development and production activities of most of our customers. In response, we reduced the prices we charged for our systems. If oil and natural gas prices decline below current levels for an extended period of time, certain of our customers may be unable to pay their vendors and service providers, including us, as a result of the decline in commodity prices. Reduced activity in our areas of operation as a result of decreased capital spending may also have a negative long-term impact on our business, even in an environment of stronger oil and natural gas prices. Any of these conditions or events could adversely affect our operating results. If the recent recovery does not continue or our customers fail to further increase their capital spending, it could have a material adverse effect on our liquidity, results of operations and financial condition.
Industry conditions are influenced by numerous factors over which we have no control, including:
|
· |
expected economic returns to E&P companies of new well completions; |
|
· |
domestic and foreign economic conditions and supply of and demand for oil and natural gas; |
|
· |
the level of prices, and expectations about future prices, of oil and natural gas; |
|
· |
the level of global oil and natural gas exploration and production; |
12
|
· |
the level of domestic and global oil and natural gas inventories; |
|
· |
the supply of and demand for hydraulic fracturing and equipment in the United States; |
|
· |
federal, state and local regulation of hydraulic fracturing activities, as well as exploration and production activities, including public pressure on governmental bodies and regulatory agencies to regulate our industry or prohibit exploration and production activities on federal lands or in federal waters; |
|
· |
United States federal, tribal, state and local and non-United States governmental laws, regulations and taxes, including the policies of governments regarding the exploration for and production and development of their oil and natural gas reserves; |
|
· |
technical difficulties or failures; |
|
· |
changes in the price and availability of transportation; |
|
· |
shortages or late deliveries of qualified personnel, equipment or supplies; |
|
· |
political and economic conditions in oil and natural gas producing countries; |
|
· |
actions by the members of Organization of Petroleum Exporting Countries with respect to oil production levels and announcements of potential changes in such levels, including the failure of such countries to comply with production cuts; |
|
· |
global weather conditions and natural disasters; |
|
· |
worldwide political, military and economic conditions; |
|
· |
the cost of producing and delivering oil and natural gas; |
|
· |
lead times associated with acquiring equipment and products and availability of qualified personnel; |
|
· |
the discovery rates of new oil and natural gas reserves; |
|
· |
stockholder activism or activities by non-governmental organizations to limit certain sources of funding for the energy sector or restrict the exploration, development and production of oil and natural gas; |
|
· |
the availability of water resources, suitable proppant and chemical additives in sufficient quantities for use in hydraulic fracturing fluids; |
|
· |
advances in exploration, development and production technologies or in technologies affecting energy consumption; |
|
· |
the potential acceleration of development of alternative fuels; |
|
· |
significant changes in the rail industry or the rail lines that service our business, such as increased regulation, embargoes and disruption in service; and |
|
· |
uncertainty in capital and commodities markets and the ability of oil and natural gas companies to raise equity capital and debt financing. |
13
The volatility of oil and natural gas prices may adversely affect the demand for our systems, products and services, and negatively impact our results of operations.
The demand for our products and services is primarily determined by current and anticipated oil and natural gas prices and the related levels of capital spending and drilling activity in the areas in which we have operations. Volatility or weakness in oil prices or natural gas prices (or the perception that oil prices or natural gas prices will decrease or remain stagnant) affects the spending patterns of our customers and may result in the drilling of fewer new wells. As a result, demand for proppants or chemicals may decrease, which could, in turn, lead to lower demand for our products and services and may cause lower prices and lower utilization of our assets. We have, and may in the future, experienced significant fluctuations in operating results as a result of the reactions of our customers to changes in oil and natural gas prices. For example, prolonged low commodity prices experienced by the oil and natural gas industry beginning in late 2014 and uncertainty about future prices even when prices increased, combined with adverse changes in the capital and credit markets, caused many E&P companies to significantly reduce their capital budgets and drilling activity in recent years. This resulted in a significant decline in demand for oilfield services and adversely impacted the prices oilfield services companies could charge for their services.
Prices for oil and natural gas historically have been extremely volatile and are expected to continue to be volatile. During the past five years, the posted West Texas Intermediate ("WTI") price for oil has ranged from a low of $26.21 per barrel ("Bbl") in February 2016 to a high of $77.41 per Bbl in June 2018. During 2018 and 2019, WTI prices ranged from $44.48 to $77.41 per Bbl. If the prices of oil and natural gas continue to be volatile and reverse their recent increases or decline, our operations, financial condition, cash flows and level of expenditures may be materially and adversely affected.
We face significant competition that may impede our ability to gain market share or cause us to lose market share, or that could make adoption of new product offerings or services difficult.
The market for supply chain management and well site logistic services is becoming increasingly competitive. We face competition from proppant producers, pressure pumping companies, transloaders and proppant transporters who also offer solutions for unloading, storing and delivering proppant at well sites and also from competitors who, like us, are focused on developing more efficient last mile logistics management solutions. Some of these solutions utilize containers for on-site proppant storage and handling delivery, while others use silo-based storage as we do. Some of our competitors have greater financial and other resources than we do and may develop technology superior to ours or more cost-effective than ours. Competition in our industry and for our products is thus based on price, consistency and quality of products, distribution capability, customer service, reliability of supply, breadth of product offering and technical support. If our competitors are able to respond to industry conditions or trends more rapidly or effectively or resort to price competition, or if we are unable to gain market acceptance of new product offerings, we may be unable to gain or maintain our market share or may lose market share or operating profit, which could have an adverse effect on our business, results of operations and financial condition.
Technological advancements in well service products and technologies, including those that reduce the amount of proppant or chemicals required for hydraulic fracturing operations, could have a material adverse effect on our business, financial condition and results of operations.
Our industry is characterized by rapid and significant technological advancements and introductions of new products and services using new technologies. As competitors and others use or develop new technologies, or technologies comparable to ours, in the future, we may lose market share or be placed at a competitive disadvantage. Further, we may face competitive pressure to implement or acquire certain new technologies at a substantial cost. Some of our competitors may have greater financial, technical and personnel resources than we do, which may allow them to gain technological advantages or implement new technologies more rapidly than us. Additionally, we may be unable to implement new technologies or services at all, on a timely basis or at an acceptable cost. New technology or changes in our customers' well completion designs could also reduce the demand for proppant or chemicals or the amount of proppant or chemicals required for hydraulic fracturing activities, thereby reducing or eliminating the need for our systems and services. Limits on our ability to effectively use, implement or adapt to new technologies may have a material adverse effect on our business, financial condition and results of operations.
14
We may be adversely affected by uncertainty in the global financial markets and the deterioration of the financial condition of our customers.
Our future results may be impacted by the uncertainty caused by an economic downturn, volatility or deterioration in the debt and equity capital markets, inflation, deflation or other adverse economic conditions that may negatively affect us or parties with whom we do business resulting in a reduction in our customers' spending and their non-payment or inability to perform obligations owed to us, such as the failure of customers to honor their commitments or the failure of major suppliers to complete orders. Additionally, during times when the natural gas or crude oil markets weaken, our customers are more likely to experience financial difficulties, including being unable to access debt or equity financing, which could result in a reduction in our customers' spending for our systems and services. In addition, in the course of our business we hold accounts receivable from our customers. In the event of the financial distress or bankruptcy of a customer, we could lose all or a portion of such outstanding accounts receivable associated with that customer. Further, if a customer was to enter into bankruptcy, it could also result in the cancellation of all or a portion of our service contracts with such customer at significant expense or loss of expected revenues to us.
Reliance upon a few large customers may adversely affect our revenue and operating results.
During the years ended December 31, 2019 and 2018, our top three customers collectively represented approximately 39% and 35%, respectively, of our consolidated revenue. It is likely that we will continue to derive a significant portion of our revenue from a relatively small number of customers in the future. If a major customer fails to pay us, revenue would be impacted and our operating results and financial condition could be materially harmed. Additionally, we typically do not enter into long-term contractual agreements with our customers and if we were to lose any material customer, we may not be able to redeploy our equipment at similar utilization or pricing levels or within a short period of time and such loss could have a material adverse effect on our business until the equipment is redeployed at similar utilization or pricing levels.
The Kingfisher Facility currently operates under spot contracts without any commitments for future business. We may not be able to obtain long-term contracts with customers for contracted volumes on favorable terms, or at all, which could adversely affect our financial results.
The Kingfisher Facility currently operates with its customers on a spot, uncommitted basis. Our ability to enter into additional contracts with customers or add additional customer contracts on a long-term committed basis is subject to a number of factors, many of which are beyond our control. Any failure to obtain customers at the Kingfisher Facility or the loss of all or a portion of the revenues attributable to our existing customers as a result of competition, creditworthiness, inability to negotiate extensions or replacement of contracts or otherwise, could have a material adverse effect on our business, financial condition, prospects or results of operations.
We are exposed to the credit risk of our customers, and any material nonpayment or nonperformance by our customers could adversely affect our financial results.
We are subject to the risk of loss resulting from nonpayment or nonperformance by our customers, many of whose operations are concentrated solely in the domestic E&P industry which, as described above, is subject to volatility and, therefore, credit risk. Our credit procedures and policies may not be adequate to fully reduce customer credit risk. If we are unable to adequately assess the creditworthiness of existing or future customers or unanticipated deterioration in their creditworthiness, any resulting increase in nonpayment or nonperformance by them and our inability to re-market or otherwise use our equipment could have a material adverse effect on our business, financial condition, prospects or results of operations.
If we are unable to fully protect our intellectual property rights, we may suffer a loss in our competitive advantage or market share.
Our commercial success depends on our patented and proprietary information and technologies, know-how and other intellectual property. Because of the technical nature of our business, we rely on a combination of patent, copyright, trademark and trade secret laws, and restrictions on disclosure to protect our intellectual property. In particular, as of December 31, 2019, we had three patents issued with respect to our mobile proppant management
15
system design and one patent issued with respect to the lifting and lowering mechanism utilized by our systems to erect and lower their silos. We also have four pending utility patent applications and three provisional patent applications. We customarily enter into confidentiality or license agreements with our employees, consultants and corporate partners and control access to and distribution of our design information, documentation and other patented and proprietary information. In addition, in the future we may acquire additional patents or patent portfolios, which could require significant cash expenditures. However, third parties may knowingly or unknowingly infringe our patent or other proprietary rights, third parties may challenge patents or proprietary rights held by us, and pending and future trademark and patent applications may not be approved. Failure to protect, monitor and control the use of our existing intellectual property rights could cause us to lose our competitive advantage and incur significant expenses. It is possible that our competitors or others could independently develop the same or similar technologies or otherwise obtain access to our unpatented technologies. In such case, our trade secrets would not prevent third parties from competing with us. Consequently, our results of operations may be adversely affected. Furthermore, third parties or our employees may infringe or misappropriate our patented or proprietary technologies or other intellectual property rights, which could also harm our business and results of operations. Policing unauthorized use of intellectual property rights can be difficult and expensive, and adequate remedies may not be available.
We may be adversely affected by disputes regarding intellectual property rights of third parties.
Third parties from time to time may initiate litigation against us by asserting that the conduct of our business infringes, misappropriates or otherwise violates intellectual property rights. We may not prevail in any such legal proceedings related to such claims, and our systems may be found to infringe, impair, misappropriate, dilute or otherwise violate the intellectual property rights of others. If we are sued for infringement and lose, we could be required to pay substantial damages and/or be enjoined from using or selling the infringing products or technology. Any legal proceeding concerning intellectual property could be protracted and costly regardless of the merits of any claim and is inherently unpredictable and could have a material adverse effect on our financial condition, regardless of its outcome.
If we were to discover that our technologies or products infringe valid intellectual property rights of third parties, we may need to obtain licenses from these parties or substantially re-engineer our products in order to avoid infringement. We may not be able to obtain the necessary licenses on acceptable terms, or at all, or be able to re-engineer our products successfully. If our inability to obtain required licenses for our technologies or products prevents us from selling our products, that could adversely impact our financial condition and results of operations.
Additionally, we currently license certain third-party intellectual property in connection with our business, and the loss of any such license could adversely impact our financial condition and results of operations.
Our business is subject to inherent risks some of which are beyond our control. These risks may be self-insured or may not be fully covered under our insurance policies.
Our assets and operations may be affected by natural or man-made disasters and other external events such as extreme weather events that may disrupt our business, including manufacturing and field operations. These hazards can also cause personal injury and loss of life, severe damage to and destruction of property and equipment, pollution or environmental damage, and suspension or cancellation of operations. In addition, our operations are subject to, and exposed to, employee/employer liabilities and risks such as wrongful termination, discrimination, labor organizing, retaliation claims and general human resource related matters.
The occurrence of a significant event or adverse claim in excess of the insurance coverage that we maintain or that is not covered by insurance could have a material adverse effect on our liquidity, results of operations and financial condition. Claims for loss of oil and natural gas production and damage to formations can occur in our industry. Litigation arising from a catastrophic occurrence at a location where our systems are deployed or services are provided may result in our being named as a defendant in lawsuits asserting large claims.
We do not have insurance against all foreseeable risks, either because insurance is not available or because of the high premium costs. The occurrence of an event not fully insured against or the failure of an insurer to meet its insurance obligations could result in substantial losses. In addition, we may not be able to maintain adequate insurance in the future at rates we consider reasonable. Insurance may not be available to cover any or all of the risks to which we are subject,
16
or, even if available, it may be inadequate, or insurance premiums or other costs could rise significantly in the future so as to make such insurance prohibitively expensive.
Our assets require capital for maintenance, upgrades and refurbishment and may require significant capital expenditures for new equipment.
Our systems and facilities require capital investment in maintenance, upgrades and refurbishment to maintain their competitiveness. The costs of components and labor have increased in the past and may increase in the future with increases in demand, which will require us to incur additional costs to upgrade our facilities or any systems we may manufacture in the future. Any maintenance, upgrade or refurbishment project for our assets could increase our indebtedness or reduce cash available for other opportunities. Furthermore, such projects may require proportionally greater capital investments as a percentage of total asset value, which may make such projects difficult to finance on acceptable terms. To the extent we are unable to fund such projects, we may have less equipment available for service or our equipment may not be attractive to potential or current customers. Additionally, competition or advances in technology within our industry may require us to update or replace existing facilities or systems or build or acquire new ones. Such demands on our capital or reductions in demand for our products and services and the increase in cost of labor necessary for such maintenance and improvement, in each case, could have a material adverse effect on our business, liquidity position, financial condition, prospects and results of operations and may increase our costs.
We rely on a limited number of third-party manufacturers to supplement our internal production capacity during periods of peak demand, and delays in deliveries of any outsourced components or increases in the cost of such outsourced components could harm our business, results of operations and financial condition.
We have established relationships with a limited number of manufacturers that fabricate certain components of our systems during periods of peak demand to supplement our internal production capacity. Should any of these third-party manufacturers be unable to provide or otherwise fail to deliver such components in a timely manner and in the quantities and at the quality required, any resulting delays in the provision of such components could have a material adverse effect on our business, results of operations and financial condition. Additionally, increasing costs of manufacturing such outsourced components may negatively impact demand for our systems or the profitability of our business operations.
We currently rely on a limited number of suppliers for certain equipment and materials to build and maintain our systems, and our reliance on a limited number of suppliers for such equipment and materials exposes us to risks including price and timing of delivery.
We currently rely on a limited number of suppliers for equipment and materials to build and maintain our systems. If demand for our systems or the components necessary to build and maintain such systems increases or our suppliers for our equipment face financial distress or bankruptcy, our suppliers may not be able to provide such equipment on schedule at the current price or at all. In particular, steel is the principal raw material used in the manufacture of our systems, and the price of steel has historically fluctuated on a cyclical basis and has often depended on a variety of factors over which we have no control. Additionally, we depend on a limited number of suppliers for the motors that we use in our systems, which are a critical component. If our suppliers are unable to provide the raw materials and components needed to build and maintain our systems at the current price or at all, we could be required to seek other suppliers for the raw materials and components needed to build, maintain and operate our systems, which may adversely affect our revenues or increase our costs. Any inability to find alternative components at prices or with quality specifications similar to those deployed today could result in delays or a loss of customers.
Our business depends on our customers having access to an adequate supply of proppant to meet their needs.
There have been historical shortages of proppant during various periods. Because our business depends upon the availability of proppant to our customers, any future proppant shortages could decrease the demand for our products and services and have a material adverse effect on our operations, prospects and financial condition.
17
Changes in the transportation industry, including fluctuations in transportation costs, changes in the way in which proppant or chemicals are transported to the well site or the availability or reliability of transportation to supply our proppant or chemical management systems and transloading services, could impair the ability of our customers to take delivery of proppant or chemicals or make our products and services less attractive and thereby adversely impact our business.
Disruption of proppant or chemical transportation services due to shortages of rail cars or trucks, extreme weather-related events including rising sea levels, flooding and drought, accidents, mechanical difficulties, strikes, lockouts, bottlenecks, more stringent railcar or safety regulatory initiatives, or other events could temporarily impair the ability of our customers to take delivery of proppant or chemicals at the well site or our ability to provide transloading services. Accordingly, if there are disruptions of the services utilized by our customers (whether these services are provided by us or a third party), including but not limited to disruptions in the rail industry or a shortage of qualified motor carriers, and they are unable to find alternative transportation providers to transport proppant or chemicals to the well site, our business could be adversely affected. Additionally, alternative transportation methods for transporting and delivering proppant or chemicals to the well site could make our product offerings less attractive than those of our competitors and affect our results of operations.
Additionally, any disruptions in transportation services associated with delivery of our proppant or chemical management systems, or provision of last mile services, could result in reduced revenue associated with such systems or services, or the loss of customers.
A number of our customers operate in urban areas, which could increase the costs of deploying our systems and/or decrease the demand for our systems.
A number of our current and potential customers operate in urban areas, which could disproportionately expose them to operational and regulatory risk in that area. For example, operations within the city limits of various municipalities in Colorado may involve additional expenses as a result of changes in state law during 2019 that elevated the authority and regulatory oversight that local communities may exercise with respect to oil and gas developmental activities in the state, including expenses relating to limitations placed on operating hours or mitigation of noise, odor and light that may be emitted during operation. In addition, we and our customers may experience a higher rate of litigation or increased insurance and other costs related to operating in such highly populated areas.
We may have difficulty managing growth of our business, which could adversely affect our financial condition and results of operations.
Growth of our business could place a significant strain on our financial, technical, operational and management resources. As we expand the scope of our activities and our geographic coverage through organic growth, there will be additional demands on our financial, technical, operational and management resources. The failure to continue to upgrade our technical, administrative, operating and financial control systems or the occurrences of unexpected expansion difficulties, including the failure to recruit and retain experienced managers, engineers and other professionals in the oilfield services industry, could have a material adverse effect on our business, financial condition, results of operations and our ability to successfully or timely execute our business plan.
Federal, state and local legislative and regulatory initiatives relating to hydraulic fracturing as well as governmental reviews of such activities may serve to limit future oil and natural gas exploration and production activities and could have a material adverse effect on our results of operations and business.
Hydraulic fracturing is an important and commonly used process for the completion of oil and natural gas wells in targeted subsurface formations with low permeability, such as shale formations, and involves the pressurized injection of water, sand or other proppants and chemical additives into rock formations to stimulate oil and natural gas production. We do not conduct hydraulic fracturing but we manufacture specialized equipment that, combined with field products and well site storage and management of proppant and chemicals used by hydraulic fracturing operators in the oil and natural gas industry. In addition, we are able to provide transloading and other logistics services for our customers.
18
Hydraulic fracturing is an important and common practice that is typically regulated by state oil and natural gas commissions or similar agencies. However, the practice continues to be controversial in certain parts of the country, resulting in increased scrutiny and regulations of the fracturing process, including by federal agencies that has resulted in the assertion of regulatory authority or performance of investigations over certain aspects of the hydraulic fracturing process. For example, the EPA has asserted regulatory authority pursuant to the SDWA Underground Injection Control program over hydraulic fracturing activities involving the use of diesel and issued guidance covering such activities, as well as published an Advanced Notice of Proposed Rulemaking regarding Toxic Substances Control Act reporting of the chemical substances and mixtures used in hydraulic fracturing. The EPA also published final rules under the CAA in 2012 and in 2016 governing performance standards, including standards for the capture of air emissions released during oil and natural gas hydraulic fracturing. Additionally, in 2016, the EPA published an effluent limit guideline final rule prohibiting the discharge of wastewater from onshore unconventional oil and natural gas extraction facilities to publicly owned wastewater treatment plants. Also, in late 2016, the EPA released its final report on the potential impacts of hydraulic fracturing on drinking water resources, concluding that "water cycle" activities associated with hydraulic fracturing may impact drinking water resources under some circumstances.
Legislation has been introduced in United States Congress from time to time to provide for federal regulation of hydraulic fracturing and to require disclosure of the chemicals used in the hydraulic fracturing process but, to date, such legislation has not been adopted. Also, some states and local governments have adopted, and other governmental entities have, from time to time, considered adopting, regulations that could impose more stringent permitting, disclosure and well-construction requirements on hydraulic fracturing operations, including states where we or our customers operate. For example, in April 2019, the Governor of Colorado signed Senate Bill 19-181 into law, which legislation, among other things, revises the mission of the state oil and gas agency from fostering energy development in the state to instead focusing on regulating the oil and natural gas industry in a manner that is protective of public health and safety and the environment, as well as authorizing cities and counties to regulate oil and natural gas operations within their jurisdiction as they do other developments. Among other things, the Colorado oil and gas agency will consider enhanced safety and environmental protections during well development operations, including drilling and hydraulic fracturing activities. States could also elect to place prohibitions on hydraulic fracturing altogether, following the approach taken by the States of Maryland, New York and Vermont. Local governments may also seek to adopt ordinances within their jurisdictions regulating the time, place or manner of drilling activities in general or hydraulic fracturing activities in particular.
Moreover, our customers typically dispose of flowback and produced water or certain other oilfield fluids gathered from oil and natural gas producing operations in underground disposal wells. This disposal process has been linked to increased induced seismicity events in certain areas of the country, particularly in Oklahoma, Texas, Colorado, Kansas, New Mexico and Arkansas. These and other states have begun to consider or adopt laws and regulations that may restrict or otherwise prohibit oilfield fluid disposal in certain areas or underground disposal wells, and state agencies implementing these requirements may issue orders directing certain wells where seismic incidents have occurred to restrict or suspend disposal well operations or impose standards related to disposal well construction and monitoring. Any one or more of these developments may result in our customers having to limit disposal well volumes, disposal rates or locations, or require our customers or third party disposal well operators that are used by our customers to cease disposal well activities, which developments could adversely affect our customers' business and result in a corresponding decrease in the need for our systems and services, which could have a material adverse effect on our business, financial condition, and results of operations.
Additionally, non-governmental organizations may seek to restrict hydraulic fracturing, as has been the case in Colorado in recent years, when certain interest groups therein have, thus far, unsuccessfully pursued ballot initiatives in recent general election cycles that, had they been successful, would have revised the state constitution or state statutes in a manner that would have made exploration and production activities in the state more difficult or costly in the future including, for example, by increasing mandatory setback distances of oil and natural gas operations, including hydraulic fracturing, from specific occupied structures and/or certain environmentally sensitive or recreational areas. Notwithstanding the adoption of Colorado Senate Bill 19-181 in 2019, one or more interest groups in the state have already filed new ballot initiatives with the state in January 2020, in hopes of extending drilling setbacks from oil and natural gas development.
19
Increased regulation and attention given to the hydraulic fracturing process and associated processes could lead to greater opposition to, and litigation concerning, oil and natural gas production activities using hydraulic fracturing techniques. Additional legislation or regulation could also lead to operational delays for our customers or increased operating costs in the production of oil and natural gas, including from developing shale plays, or could make it more difficult for our customers to perform hydraulic fracturing. The adoption of any federal, state or local laws or ballot initiatives, or the implementation of any regulations, regarding hydraulic fracturing could potentially cause a decrease in the completion of new oil and natural gas wells and an associated decrease in demand for our products and services and increased compliance costs and time, which could have a material adverse effect on our liquidity, results of operations, and financial condition.
Finally, water is an essential component of shale oil and natural gas production during both the drilling and hydraulic fracturing processes. Our customers' access to water to be used in these processes may be adversely affected due to reasons such as periods of extended drought, private, third party competition for water in localized areas or the implementation of local or state governmental programs to monitor or restrict the beneficial use of water subject to their jurisdiction for hydraulic fracturing to assure adequate local water supplies. Our customers' inability to locate or contractually acquire and sustain the receipt of sufficient amounts of water could adversely impact their exploration and production operations and have a corresponding adverse effect on our business, results of operations and financial condition.
Changes in transportation regulations may increase our costs and negatively impact our results of operations.
We are subject to various transportation regulations, including as a motor carrier by the United States Department of Transportation and by various federal, state and tribal agencies, whose regulations include certain permit requirements of highway and safety authorities. These regulatory authorities exercise broad powers over our trucking operations, generally governing such matters as the authorization to engage in motor carrier operations, safety, equipment testing, driver requirements and specifications and insurance requirements. The trucking industry is subject to possible regulatory and legislative changes that may impact our operations, such as changes in fuel emissions limits, hours of service regulations that govern the amount of time a driver may drive or work in any specific period and limits on vehicle weight and size. As the federal government continues to develop and propose regulations relating to fuel quality, engine efficiency and GHG emissions, we may experience an increase in costs related to truck purchases and maintenance, impairment of equipment productivity, a decrease in the residual value of vehicles, unpredictable fluctuations in fuel prices and an increase in operating expenses. Increased truck traffic may contribute to deteriorating road conditions in some areas where our operations are performed. Our operations, including routing and weight restrictions, could be affected by road construction, road repairs, detours and state and local regulations and ordinances restricting access to certain roads. Proposals to increase federal, state or local taxes, including taxes on motor fuels, are also made from time to time, and any such increase would increase our operating costs. Also, state and local regulation of permitted routes and times on specific roadways could adversely affect our operations. We cannot predict whether, or in what form, any legislative or regulatory changes or municipal ordinances applicable to our logistics operations will be enacted and to what extent any such legislation or regulations could increase our costs or otherwise adversely affect our business or operations.
We are subject to environmental and occupational health and safety laws and regulations that may expose us to significant costs and liabilities.
Our operations and the operations of our customers are subject to stringent federal, tribal, regional, state and local laws and regulations governing worker health and safety, protection of the environment, including natural resources, and the management, transportation and disposal of wastes and other materials. We could be exposed to liabilities for cleanup costs, natural resource damages, and other damages under these laws and regulations, with certain of these legal requirements imposing strict liability for such damages and costs, even though our conduct was lawful at the time it occurred or the conduct resulting in such damage and costs were caused by prior operators or other third-parties.
Environmental laws and regulations in the United States and in foreign countries are subject to change in the future, possibly resulting in more stringent legal requirements. If existing regulatory requirements or enforcement policies change or new regulatory or enforcement initiatives are developed and implemented in the future, we or our oil and
20
natural gas exploration and production customers may be required to make significant, unanticipated capital and operating expenditures. Examples of recent environmental regulations include the following:
|
· |
Ground-Level Ozone Standards. In 2015, the EPA issued a final rule under the CAA, lowering the National Ambient Air Quality Standard (“NAAQS”) for ground-level ozone from 75 parts per billion to 70 parts per billion under both the primary and secondary standards to provide requisite protection of public health and welfare, respectively. Since that time, the EPA issued area designations with respect to ground-level ozone and issued final requirements that apply to state, local, and tribal air agencies for implementing the 2015 NAAQS for ground-level ozone. State implementation of the revised NAAQS could, among other things, require installation of new emission controls on some of our or our customers’ equipment, result in longer permitting timelines, and significantly increase our or our customers’ capital expenditures and operating costs. |
|
· |
EPA Review of Drilling Waste Classification. Drilling, fluids, produced water and most of the other wastes associated with the exploration, development and production of oil or natural gas, if properly handled, are currently exempt from regulation as hazardous waste under the RCRA and instead, are regulated under RCRA’s less stringent non-hazardous waste provisions. However, pursuant to a consent decree issued by the U.S. District Court for the District of Columbia in 2016, the EPA evaluated whether this exemption from hazardous waste regulation should continue to apply. In April 2019, the EPA issued its determination that revisions to those regulations were unnecessary at the current time Notwithstanding the EPA’s determination, any future loss of the RCRA exemption for drilling fluids and related wastes could significantly increase our customers’ costs for management, transport and disposal of generated wastes, which could result in reduced demand for our products and services. Federal Jurisdiction over Waters of the United States. In 2015, the EPA and U.S. Army Corps of Engineers (“Corps”) under the Obama Administration released a final rule outlining federal jurisdictional reach under the Clean Water Act over waters of the United States, including wetlands. In 2017, the EPA and the Corps under the Trump Administration agreed to reconsider the 2015 rule and, thereafter, on October 22, 2019, the agencies published a final rule made effective on December 23, 2019, rescinding the 2015 rule and recodifying the regulatory text that governed waters of the United States prior to promulgation of the 2015 rule until such time as a final rule re-defining the Clean Water Act’s jurisdiction over water of the United States was made effective in replacement of the 2015 rule. On January 23, 2019, the two agencies issued a final rule re-defining such jurisdiction. Upon being published in the Federal Register and the passage of 60 days thereafter, the January 23, 2020 final rule will become effective in replacement of the October 22, 2019 final rule. Under the new January 23, 2020 final rule, the EPA has narrowed the federal government’s jurisdictional permitting authority under the Clean Water Act relative to the 2015 final rule. The 2015 final rule has been the subject of legal challenges by various factions in federal district court and implementation of the 2015 rule has been enjoined in slightly over half of the states pending resolution of the various federal district court challenges. Upon the effectiveness of the January 23, 2020 rule, the United States will be covered under a single regulatory scheme as it relates to federal jurisdictional reach over waters of the United States. However, there remains the expectation that the January 23, 2020 final rule also will be legally challenged in federal district court. To the extent that any challenge to the January 23, 2020 final rule is successful and the 2015 rule or a revised rule expands the scope of the Clean Water Act’s jurisdiction in areas where we or our customers conduct operations, we or our customers could incur increased costs and delays or cancellations, which could reduce demand for our products and services. |
Compliance with these regulations or other laws, regulations and regulatory initiatives, or any other new environmental and occupational health and safety legal requirements could, among other things, require us or our customers to install new or modified emission controls on equipment or processes, incur longer permitting timelines, and incur significantly increased capital or operating expenditures, which costs may be significant. Additionally, one or more of these developments could reduce demand for our products and services. Moreover, any failure by us to comply with applicable environmental laws and regulations may result in governmental authorities taking actions against our business that could adversely impact our operations and financial condition. See “Business” – “Environmental and Occupational Health and Safety Regulation” under Part I, Item 1 of this Form 10 K for further discussion on environmental matters.
21
An accidental release of materials into the environment, such as from our mobile chemical management systems, may cause us to incur significant costs and liabilities.
Our business activities present risks of incurring significant environmental costs and liabilities, including costs and liabilities resulting from our management, transportation and disposal of regulated materials, such as oilfield and other wastes, because of air emissions and wastewater discharges related to our operations, and due to historical oilfield industry operations and waste disposal practices. In addition, private parties, including the owners of properties upon which we conduct operations and facilities where our wastes are taken for reclamation or disposal, also may have the right to pursue legal actions to enforce compliance as well as to seek damages for non-compliance with environmental laws and regulations or for personal injury or property or natural resource damages. We could incur significant costs and liabilities in the clean-up of our, our customers’ or third-party sites. Some environmental laws and regulations may impose strict liability, which means that in some situations we could be exposed to liability as a result of our conduct that was lawful at the time it occurred or the conduct of, or conditions caused by, prior operators or other third parties. Remedial costs and other damages arising as a result of environmental laws and costs associated with changes in environmental laws and regulations could be substantial and could have a material adverse effect on our liquidity, results of operations and financial condition.
Laws and regulations protecting the environment generally have become more stringent in recent years and are expected to continue to do so, which could lead to material increases in costs for future environmental compliance and remediation. Changes in existing laws or regulations, or the adoption of new laws or regulations, could delay or curtail exploratory or developmental drilling for oil and natural gas and could have a corresponding adverse effect on us by reducing the demand for our products and services. We may not be able to recover some or any of our costs of compliance with these laws and regulations from insurance. We may not be able to recover some or any of these costs from insurance. Additionally, we may not be able to recover some or any of these costs from sources of contractual indemnity or insurance, as pollution and similar environmental risks generally are not insurable or fully insurable, either because such insurance is not available or because of the high premium costs and deductibles associated with obtaining such insurance.
Silica-related legislation, health issues and litigation could have a material adverse effect on our business, reputation or results of operations.
We are subject to laws and regulations relating to human exposure to crystalline silica. For example, in 2016, OSHA published a final rule that established a more stringent permissible exposure limit for exposure to respirable crystalline silica and provided other provisions to protect employees, such as requirements for exposure assessments, methods for controlling exposure, respiratory protection, medical surveillance, hazard communication, and recording. The 2016 rule further requires compliance with engineering control obligations to limit exposures to respirable crystalline silica in connection with hydraulic fracturing activities by June 2021. Federal and state regulatory authorities, including OSHA, and analogous state agencies may continue to propose changes in their regulations regarding workplace exposure to crystalline silica, such as permissible exposure limits and required controls and personal protective equipment and we can provide no assurance that we will be able to comply with any future laws and regulations relating to exposure to crystalline silica that are adopted, or that the costs of complying with such future laws and regulations would not have a material adverse effect on our operating results by requiring us to modify or cease our operations.
In addition, the inhalation of respirable crystalline silica is associated with the lung disease silicosis. There is evidence of an association between crystalline silica exposure or silicosis and lung cancer and a possible association with other diseases, including immune system disorders such as scleroderma. These health risks have been, and may continue to be, a significant issue confronting the hydraulic fracturing industry. Concerns over silicosis and other potential adverse health effects, as well as concerns regarding potential liability from the use of hydraulic fracture sand, may have the effect of discouraging our customers' use of hydraulic fracture sand. The actual or perceived health risks of handling hydraulic fracture sand could materially and adversely affect hydraulic fracturing service providers, including us, through reduced use of hydraulic fracture sand, the threat of product liability or the filing of lawsuits naming us as a defendant, increased scrutiny by federal, state and local regulatory authorities of us and our customers or reduced financing sources available to the hydraulic fracturing industry.
22
Anti-indemnity provisions enacted by many states may restrict or prohibit a party's indemnification of us.
We typically enter into agreements with our customers governing the use and operation of our systems and services, which usually include certain indemnification provisions for losses resulting from operations. Such agreements may require each party to indemnify the other against certain claims regardless of the negligence or other fault of the indemnified party; however, many states place limitations on contractual indemnity agreements, particularly agreements that indemnify a party against the consequences of its own negligence. Furthermore, certain states, including Louisiana, New Mexico, Texas and Wyoming have enacted statutes generally referred to as "oilfield anti-indemnity acts" expressly prohibiting certain indemnity agreements contained in or related to oilfield services agreements. Such anti-indemnity acts may restrict or void a party's indemnification of us, which could have a material adverse effect on our business, financial condition, prospects and results of operations.
Fuel conservation measures could reduce demand for oil and natural gas which would in turn reduce the demand for our systems and services.
Fuel conservation measures, alternative fuel requirements and increasing consumer demand for alternatives to oil and natural gas could reduce demand for oil and natural gas. The impact of the changing demand for oil and natural gas may have a material adverse effect on our business, financial condition, prospects, results of operations and cash flows. Additionally, the increased competitiveness of alternative energy sources (such as wind, solar geothermal, tidal, and biofuels) could reduce demand for hydrocarbons and therefore for our systems and services, which would lead to a reduction in our revenues.
Unsatisfactory safety performance may negatively affect our customer relationships and, to the extent we fail to retain existing customers or attract new customers, adversely impact our revenues.
Our ability to retain existing customers and attract new business is dependent on many factors, including our ability to demonstrate that we can reliably and safely operate our business in a manner that is consistent with applicable laws, rules and permits, which legal requirements are subject to change. Existing and potential customers consider the safety record of their third-party service providers to be of high importance in their decision to engage such providers. If one or more accidents were to occur in connection with the use of our systems or performance of our services, the affected customer may seek to terminate or cancel its use of our services which could cause us to lose substantial revenues. Furthermore, our ability to attract new customers may be impaired if they elect not to engage us because they view our safety record as unacceptable. In addition, it is possible that we will experience multiple or particularly severe accidents in the future, causing our safety record to deteriorate. This may be more likely as we continue to grow, if we experience high employee turnover or labor shortage, or hire inexperienced personnel to bolster our staffing needs.
Our and our customers' operations are subject to a number of risks arising out of the threat of climate change, including regulatory, political, litigation, and financial risks, which could result in increased operating and capital costs for our customers and reduced demand for the products and services we provide.
The threat of climate change continues to attract considerable attention in the United States and foreign countries. As a result, numerous proposals have been made and are likely to continue to be made at the international, national, regional and state levels of government to monitor and limit emissions of GHGs as well as to eliminate such future emissions. As a result, our operations as well as the operations of our customers are subject to a series of regulatory, political and litigation and financial risks associated with the production and processing of fossil fuels and emission of GHGs.
In the United States, no comprehensive climate change legislation has been implemented at the federal level. However, with the U.S. Supreme Court finding that GHG emissions constitute a pollutant under the CAA, the EPA the EPA has adopted rules that, among other things, establish construction and operating permit reviews for GHG emissions from certain large stationary sources, require the monitoring and annual reporting of GHG emissions from certain petroleum and natural gas system sources, implement New Source Performance Standards directing the reduction of methane from certain new, modified, or reconstructed facilities in the oil and natural gas sector, and together with the U.S. Department of Transportation, implement GHG emissions limits on vehicles manufactured for operation in the United States. Additionally, various states and groups of states have adopted or are considering adopting legislation,
23
regulations or other regulatory initiatives that are focused on such areas as GHG cap and trade programs, carbon taxes, reporting and tracking programs, and restriction of emissions. At the international level, there exists the United Nations-sponsored "Paris Agreement," which is a non-binding agreement for nations to limit their GHG emissions through individually-determined reduction goals every five years after 2020, although the United States has announced its withdrawal from such agreement, effective November 4, 2020.
Governmental, scientific, and public concern over the threat of climate change arising from GHG emissions has resulted in federal political risks in the United States in the form of pledges made by certain candidates seeking the office of the President of the United States in 2020. Critical declarations made by one or more presidential candidates include proposals to ban hydraulic fracturing of oil and natural gas wells and ban new leases for production of minerals on federal properties, including onshore lands and offshore waters. Other actions to oil and natural gas production activities that could be pursued by presidential candidates may include more restrictive requirements for the establishment of pipeline infrastructure or the permitting of liquified natural gas export facilities, as well as the rescission of the United States’ withdrawal from the Paris Agreement in November 2020. Litigation risks are also increasing, as a number of cities, local governments and other plaintiffs have sought to bring suit against the largest oil and natural gas exploration and production companies in state or federal court, alleging, among other things, that such companies created public nuisances by producing fuels that contributed to global warming effects, such as rising sea levels, and therefore are responsible for roadway and infrastructure damages as a result, or alleging that the companies have been aware of the adverse effects of climate change for some time but defrauded their investors by failing to adequately disclose those impacts.
There are also increasing financial risks for fossil fuel producers as stockholders and bondholders currently invested in fossil-fuel energy companies concerned about the potential effects of climate change may elect in the future to shift some or all of their investments into non-fossil fuel energy related sectors. Institutional lenders who provide financing to fossil-fuel energy companies also have become more attentive to sustainable lending practices and some of them may elect not to provide funding for fossil fuel energy companies. Additionally, the lending and investment practices of institutional lenders have been the subject of intensive lobbying efforts in recent years, oftentimes public in nature, by environmental activists, proponents of the international Paris Agreement, and foreign citizenry concerned about climate change not to provide funding for fossil fuel producers. Limitation of investments in and financings for fossil fuel energy companies could result in the restriction, delay or cancellation of drilling programs or development or production activities.
The adoption and implementation of any international, federal, regional or state legislation regulations or other regulatory initiatives impose more stringent standards for GHG emissions from the oil and natural gas sector or otherwise restrict the areas in which this sector may produce oil and natural gas or generate GHG emissions could result in increased compliance costs or costs of consuming fossil fuels. Such legislation or regulations could, consequently, reduce demand for, oil and natural gas, which could reduce demand for our products and services. Additionally, political, financial and litigation risks may result in our oil and natural gas customers restricting or canceling production activities, incurring liability for infrastructure damages as a result of climatic changes, or impairing the ability to continue to operate in an economic manner, which also could reduce demand for our products and services. The occurrence of one or more of these developments could have a material adverse effect on our business, financial condition, results of operations, and cash flows. Finally, increasing concentrations of GHG in the Earth's atmosphere may produce climate changes that have significant physical effects, such as increased frequency and severity of storms, droughts, floods, rising sea levels and other climatic events. If any such climate changes were to occur, they could have an adverse effect on our financial condition and results of operations and the financial condition and operations of our customers.
The Endangered Species Act, the Migratory Bird Treaty Act and other laws intended to protect certain species of wildlife govern our and our oil and natural gas exploration and production customers’ operations, which constraints could have an adverse impact on our ability to expand some of our existing operations or limit our customers’ ability to develop new oil and natural gas wells.
The federal Endangered Species Act and comparable state laws were established to protect endangered and threatened species. Under the Endangered Species Act, if a species is listed as threatened or endangered, restrictions may be imposed on activities adversely affecting that species habitat. Similar protections are offered to migratory birds
24
under the Migratory Bird Treaty Act. Customer oil and natural gas operations may be adversely affected by seasonal or permanent restrictions on drilling activities designed to protect various wildlife, which may limit their ability to operate in protected areas. Permanent restrictions imposed to protect endangered and threatened species could prohibit drilling in certain areas or require the implementation of expensive mitigation measures. Moreover, as a result of one or more settlements approved by the United States federal government, the U.S. Fish and Wildlife Service must make determinations on the listing of numerous species as endangered or threatened under the Endangered Species Act. The designation of previously unidentified endangered or threatened species could indirectly cause our customers to incur additional costs, cause our or our oil and natural gas exploration and production customers’ operations to become subject to operating restrictions or bans, and limit future development activity in affected areas, which could reduce demand for our products and services to those customers.
Any future indebtedness could adversely affect our financial condition.
Our 2019 Credit Agreement (as defined in Part II, Item 7. "Management's Discussion and Analysis of Financial Condition and Results of Operation—Debt Agreements”) has a borrowing capacity of up to $50.0 million. As of December 31, 2019, we had no borrowings under the 2019 Credit Agreement outstanding and the ability to draw $50.0 million.
In addition, subject to the limits contained in our 2019 Credit Agreement, we may incur additional debt from time to time. Any borrowings we may incur in the future would have several important consequences for our future operations, including that:
|
· |
covenants contained in the documents governing such indebtedness may require us to meet or maintain certain financial tests, which may affect our flexibility in planning for, and reacting to, changes in our industry, such as being able to take advantage of acquisition opportunities when they arise; |
|
· |
our ability to obtain additional financing for working capital, capital expenditures, acquisitions, general corporate and other purposes may be limited; |
|
· |
we may be competitively disadvantaged to our competitors that are less leveraged or have greater access to capital resources; and |
|
· |
we may be more vulnerable to adverse economic and industry conditions. |
If we incur indebtedness in the future, we may have significant principal payments due at specified future dates under the documents governing such indebtedness. Our ability to meet such principal obligations will be dependent upon future performance, which in turn will be subject to general economic conditions, industry cycles and financial, business and other factors affecting our operations, many of which are beyond our control. Our business may not continue to generate sufficient cash flow from operations to repay any incurred indebtedness. If we are unable to generate sufficient cash flow from operations, we may be required to sell assets, to refinance all or a portion of such indebtedness or to obtain additional financing.
Our 2019 Credit Agreement subjects us to various financial and other restrictive covenants. These restrictions may limit our operational or financial flexibility and could subject us to potential defaults under our 2019 Credit Agreement.
Our 2019 Credit Agreement subjects us to significant financial and other restrictive covenants, including, but not limited to, restrictions on incurring additional debt and certain distributions. Our ability to comply with these financial condition tests can be affected by events beyond our control and we may not be able to do so.
Our 2019 Credit Agreement contains certain financial covenants, including a certain leverage ratio and a certain minimum fixed charge coverage ratio we must maintain. Please see Part II, Item 7. "Management's Discussion and Analysis of Financial Condition and Results of Operation—Debt Agreements."
25
If we are unable to remain in compliance with the financial covenants of our 2019 Credit Agreement, then amounts outstanding thereunder may be accelerated and become due immediately. Any such acceleration could have a material adverse effect on our financial condition and results of operations.
Increases in interest rates could adversely impact the price of our shares, our ability to issue equity or incur debt for acquisitions or other purposes.
Interest rates on future borrowings, credit facilities and debt offerings could be higher than current levels, causing our financing costs to increase accordingly. Changes in interest rates, either positive or negative, may affect the yield requirements of investors who invest in our shares, and a rising interest rate environment could have an adverse impact on the price of our shares, our ability to issue equity or incur debt for acquisitions or other purposes.
The uncertainty regarding the potential phase-out of LIBOR may negatively impact our operating results.
LIBOR, the interest rate benchmark used as a reference rate on our 2019 Credit Agreement, is expected to be phased out after 2021, when private-sector banks are no longer required to report the information used to set the rate. Without this data, LIBOR may no longer be published, or the lack of quality and quantity of data may cause the rate to no longer be representative of the market. At this time, no consensus exists as to what rate or rates will become accepted alternatives to LIBOR, although the U.S. Federal Reserve, in connection with the Alternative Reference Rates Committee, a steering committee comprised of large U.S. financial institutions, is considering replacing U.S. dollar LIBOR with the Secured Overnight Financing Rate (“SOFR”). SOFR is a more generic measure than LIBOR and considers the cost of borrowing cash overnight, collateralized by U.S. Treasury securities. Given the inherent differences between LIBOR and SOFR or any other alternative benchmark rate that may be established, there are many uncertainties regarding a transition from LIBOR, including but not limited to the need to amend all contracts with LIBOR as the referenced rate and how this will impact the Company’s cost of debt. The Company will also need to consider new contracts and if they should reference an alternative benchmark rate or include suggested fallback language, as published by the Alternative Reference Rates Committee. The consequences of these developments with respect to LIBOR cannot be entirely predicted and span multiple future periods but could result in an increase in the cost of our debt which may be detrimental to our financial position or operating results.
We rely on a few key employees whose absence or loss could adversely affect our business.
Many key responsibilities within our business have been assigned to a small number of employees. The loss of their services could adversely affect our business. In particular, the loss of the services of one or more members of our executive team, including our chief executive officer or president and chief financial officer, could disrupt our operations. We do not have any written employment agreement with our executives at this time. Further, we do not maintain "key person" life insurance policies on any of our employees. As a result, we are not insured against any losses resulting from the death of our key employees.
If we are unable to access the services of a sufficient number of skilled and qualified workers, or are required to significantly increase wages to attract or retain such workers, our capacity and profitability could be diminished and our growth potential could be impaired.
The manufacture and delivery of our products and performance of our services requires skilled and qualified workers with specialized skills and experience who can perform physically demanding work. As a result of the volatility of the oilfield services industry and the demanding nature of the work, workers may choose to pursue employment in fields that offer a more desirable work environment at wage rates that are competitive. Our ability to be productive and profitable will depend upon our ability to have access to the services of skilled workers. In addition, our ability to expand our operations depends in part on our ability to increase the size of our skilled labor force. The demand for skilled workers is high, and the supply is limited. As a result, competition for experienced personnel is intense, and a significant increase in the wages paid by competing employers could result in a reduction of our skilled labor force, increases in the rates that we must pay, or both. If either of these events were to occur, our capacity and profitability could be diminished and our growth potential could be impaired.
26
We may grow through acquisitions and our failure to properly plan and manage those acquisitions may adversely affect our performance.
We have completed and may, in the future, pursue asset acquisitions or acquisitions of businesses. We must plan and manage any acquisitions effectively to achieve revenue growth and maintain profitability in our evolving market. If we fail to manage acquisitions effectively, our results of operations could be adversely affected. The process of upgrading acquired assets to our specifications and integrating acquired assets or businesses may also involve unforeseen costs and delays or other operational, technical and financial difficulties and may require a significant amount time and resources and may divert management’s attention from existing operations or other priorities. Our failure to incorporate acquired assets or businesses into our existing operations successfully or to minimize any unforeseen operational difficulties could have a material adverse effect on our financial condition and results of operations. Such events could also mean an acquisition that we expected to be accretive is not accretive and, in extreme cases, the asset is idle.
Our industry overall has experienced a high rate of employee turnover. Any difficulty we experience replacing or adding personnel could have a material adverse effect on our liquidity, results of operations and financial condition.
We are dependent upon the available labor pool of skilled employees and may not be able to find enough skilled labor to meet our needs, which could have a negative effect on our growth. In addition, we are dependent upon a large number of independent contractors to service our business and construct our proppant and chemical management systems. Increased competition for their services could result in a loss of available, skilled contractors or services at a price that is not as advantageous to our business, both of which could negatively affect our operating results. We are also subject to the Fair Labor Standards Act, which governs such matters as minimum wage, overtime and other working conditions. Our systems and services require skilled workers who can perform physically demanding work. As a result of our industry volatility, including the recent and pronounced decline in drilling activity, as well as the demanding nature of the work, many workers in our industry have left to pursue employment in different fields. Though our historical turnover rates have been significantly lower than those of our competitors, if we are unable to retain or meet growing demand for skilled technical personnel, our operating results and our ability to execute our growth strategies may be adversely affected.
We may be subject to claims for personal injury and property damage, which could materially adversely affect our financial condition, prospects and results of operations.
Our systems and services are subject to inherent risks that can cause personal injury or loss of life, damage to or destruction of property, equipment or the environment or the suspension of our operations. Litigation arising from our operations, including where our systems are deployed or services are provided or from transportation associated with moving our systems or employees, may cause us to be named as a defendant in lawsuits asserting potentially large claims including claims for exemplary damages. We maintain what we believe is customary and reasonable insurance to protect our business against these potential losses, but such insurance may not be adequate to cover our liabilities, and we are not fully insured against all risks.
In addition, our customer assumes responsibility for, including control and removal of, all other pollution or contamination which may occur during operations, including that which may result from seepage or any other uncontrolled flow of drilling and completion fluids. We may have liability in such cases if we are negligent or commit willful acts. Our customers generally agree to indemnify us against claims arising from their employees' personal injury or death to the extent that, in the case of our well site services, their employees are injured or their properties are damaged by such services, unless resulting from our gross negligence or willful misconduct. Our customers also generally agree to indemnify us for loss or destruction of customer-owned property or equipment. In turn, we agree to indemnify our customers for loss or destruction of property or equipment we own and for liabilities arising from personal injury to or death of any of our employees, unless resulting from gross negligence or willful misconduct of the customer. However, we might not succeed in enforcing such contractual allocation or might incur an unforeseen liability falling outside the scope of such allocation. As a result, we may incur substantial losses which could adversely affect our financial condition and results of operation. Alternatively, even if we are fully indemnified or insured, any legal proceedings could negatively impact our reputation among our customers and the public, and make it more difficult for us to compete effectively or obtain adequate insurance in the future.
27
Seasonal weather conditions and natural disasters could severely disrupt normal operations and harm our business.
Our operations are located in different regions of the United States, some of which are prone to periods of heavy snow, ice or rain and others of which may be prone to certain natural disasters such as tornadoes. The occurrence of any such severe weather conditions or natural disasters could cause our E&P customers to suspend operations, thereby reducing the demand for our systems and services and our ability to generate revenues. The exploration activities of our customers may also be affected during such periods of adverse weather conditions. Additionally, extended drought conditions in our operating regions could impact our ability or our customers' ability to source sufficient water or increase the cost for such water. As a result, a natural disaster or inclement weather conditions could severely disrupt the normal operation of our business and adversely impact our financial condition and results of operations.
We may be subject to interruptions or failures in our information technology systems.
We rely on sophisticated information technology systems and infrastructure to support our business, including but not limited to process control technology through our integrated Railtronix and Solaris Lens inventory management systems. Any of these systems may be susceptible to outages due to fire, floods, power loss, telecommunications failures, usage errors by employees, computer viruses, cyber-attacks or other security breaches, or similar events. The failure of any of our information technology systems may cause disruptions in our or our customers’ operations, which could adversely affect our reputation, sales and profitability.
We are subject to cyber security risks. A cyber incident could occur and result in information theft, data corruption, operational disruption and/or financial loss.
The oil and natural gas industry has become increasingly dependent on digital technologies to conduct certain processing activities. For example, we depend on digital technologies to deliver our systems and perform many of our services and to process and record financial and operating data. In addition, in the ordinary course of our business, we collect and store sensitive data, including our proprietary business information and personally identifiable information of our employees in our data centers and on our networks. These secure processing, maintenance and transmission of this information is important to our operations. At the same time, cyber incidents, including deliberate attacks, have increased and become more sophisticated. The United States government has issued public warnings that indicate that energy assets might be specific targets of cyber security threats. Our technologies, systems and networks, and those of our customers, vendors, suppliers and other business partners, may become the target of cyberattacks or information security breaches that could result in the unauthorized release, gathering, monitoring, misuse, loss or destruction of proprietary and other information, or other disruption of business operations. This could result in significant losses, loss of customers and business opportunities, reputation damage, litigation, regulatory fines, penalties or intervention, reimbursement or other compensatory costs, or otherwise adversely affect our business, financial condition or results of operations. In addition, certain cyber incidents, such as surveillance, may remain undetected for an extended period. Our systems and controls for protecting against cyber security risks, and those used by our business partners, may not be sufficient. As cyber incidents continue to evolve, we will likely be required to expend additional resources to continue to modify or enhance our protective measures or to investigate and remediate any vulnerability to cyber incidents. The reliability and capacity of our information technology systems is critical to our operations. Any material disruption in our information technology systems or systems that affect our business operations, or delays or difficulties in implementing or integrating new systems or enhancing current systems, could have an adverse effect on our business and results of operations.
A terrorist attack or armed conflict could harm our business.
The occurrence or threat of terrorist attacks in the United States or other countries, anti-terrorist efforts and other armed conflicts involving the United States or other countries, including continued hostilities in the Middle East, may adversely affect the United States and global economies and could prevent us from meeting our financial and other obligations. Additionally, destructive forms of protest and opposition by extremists and other disruptions, including acts of sabotage or eco-terrorism, against oil and natural gas development and production activities could potentially result in personal injury to persons, damages to property, natural resources or the environment, or lead to extended interruptions of our or our clients’ operations. If any of these events occur, the resulting political instability and societal disruption
28
could reduce overall demand for oil and natural gas, potentially putting downward pressure on demand for our systems and services and causing a reduction in our revenues. Oil and natural gas related facilities could be direct targets of terrorist attacks, and our operations could be adversely impacted if infrastructure integral to our customers' operations is destroyed or damaged. Costs for insurance and other security may increase as a result of these threats, and some insurance coverage may become more difficult to obtain, if available at all.
We engage in transactions with related parties and such transactions present possible conflicts of interest that could have an adverse effect on us.
We have entered into transactions with related parties. The details of certain of these transactions are set forth in Note 13. “Related Party Transactions” under Part II, Item 8. “Financial Statements and Supplementary Data.” Related party transactions create the possibility of conflicts of interest with regard to our management or directors. Such a conflict could cause an individual in our management or on our board of directors to seek to advance his or her economic interests above ours. Further, the appearance of conflicts of interest created by related party transactions could impair the confidence of our investors. Our board of directors, or a committee thereof, regularly reviews these transactions. Notwithstanding this, it is possible that a conflict of interest could have a material adverse effect on our liquidity, results of operations and financial condition.
Our historical financial statements may not be indicative of future performance.
Due to our limited operating history, comparisons of our current and future operating results with prior periods are difficult. As a result, our limited historical financial performance may make it difficult for stockholders to evaluate our business and results of operations to date and to assess our future prospects and viability.
We may record losses or impairment charges related to idle or underutilized assets, or assets that we sell.
Prolonged periods of low demand for our products and services, changes in technology or the sale of assets below their carrying value may cause us to experience losses. For example, the profitability of our Kingfisher Facility relies in large part upon the volumes of sand being processed through the Facility. Any increase in local or regional sand or additional transload facilities constructed in close proximity could eliminate our current and potential customers’ need for the Kingfisher Facility, thus reducing the throughput volumes and corresponding profitability. These events, or periods of underutilization, could result in the recognition of impairment charges that negatively impact our financial results. Significant impairment charges as a result of a decline in market conditions or otherwise could have a material adverse effect on our results of operations in future periods.
Final regulations relating to and interpretations of provisions of the Tax Act may vary from our current interpretation of such legislation.
The United States federal income tax legislation enacted in Public Law No. 115-97, commonly referred to as the Tax Cuts and Jobs Act (the “Tax Act”), is highly complex and subject to interpretation. The presentation of our financial condition and results of operations is based upon our current interpretation of the provisions contained in the Tax Act. In the future, the Treasury Department and the Internal Revenue Service are expected to issue final regulations and additional interpretive guidance with respect to the provisions of the Tax Act. Any significant variance of our current interpretation of such provisions from any future final regulations or interpretive guidance could result in a change to the presentation of our financial condition and results of operations and could negatively affect our business.
If we fail to establish and maintain proper internal controls, our ability to produce accurate financial statements or comply with applicable regulations could be impaired.
Under Section 404(a) of the Sarbanes-Oxley Act our management is required to assess and report annually on the effectiveness of our internal control over financial reporting and identify any material weaknesses in our internal control over financial reporting. Once we are no longer an emerging growth company, Section 404(b) of the Sarbanes-Oxley Act will require our independent registered public accounting firm to issue an annual report that addresses the effectiveness of our internal control over financial reporting.
29
Subsequent to filing the Company’s Quarterly Report on Form 10-Q for the period ending March 31, 2019, our management identified a material weakness in our internal control over financial reporting pertaining to the Company’s accounting of its investment in Solaris LLC. This error resulted in the restatement of our consolidated financial statements included in our Annual Reports on Form 10-K for the years ended December 31, 2018 and 2017, and Quarterly Report on Form 10-Q for the period ended March 31, 2019. As a result of this material weakness, management, under the supervision and with the participation of the Company’s Chief Executive Officer and Chief Financial Officer, has concluded that the Company’s internal control over financial reporting and disclosure controls and procedures were not effective as of December 31, 2018.
As described in Part II, Item 9A of this Annual Report on Form 10-K, we have taken steps to remediate this material weakness.
If further material weaknesses are discovered in the future, the Company’s financial statements could contain additional errors which, in turn, could lead to errors in our financial reports and/or delays in our financial reporting, which could require us to further restate our operating results.
If additional material weaknesses occur, investors may lose confidence in our operating results, the price of our Class A common stock could decline and we may be subject to litigation or regulatory enforcement actions. In addition, if we are unable to meet the requirements of Section 404 of the Sarbanes-Oxley Act, we may not be able to remain listed on the NYSE.
Implementing any appropriate changes to our internal controls may require expending additional resources and providing additional management oversight, specific compliance training of our directors and employees, entail substantial costs in order to modify our existing accounting systems, take a significant period of time to complete and divert management’s attention from other business concerns. These changes may not, however, ultimately be effective in allowing us to achieve and maintain adequate internal controls.
The restatement of our consolidated financial statements has subjected us to a number of additional risks and uncertainties, including regulatory, stockholder or other actions, loss of investor confidence and negative impacts on our stock price.
As discussed elsewhere in this Annual Report on Form 10-K, we restated our consolidated financial statements included in our Annual Reports on Form 10-K for the periods ended December 31, 2018 and 2017 (and the quarterly periods within those years), and our Quarterly Report on Form 10-Q for the period ended March 31, 2019. The preparation of our restated financial statements has caused us to incur substantial expenses for legal, accounting, tax and other professional services and has diverted our management’s attention from our business and could continue to do so. If additional restatements were to occur, investors may lose confidence in our operating results, the price of our Class A common stock could decline and we may be subject to litigation or regulatory enforcement actions.
Risks Related to Our Class A Common Stock
Solaris Inc. is a holding company. Solaris Inc.’s sole material asset is its equity interest in Solaris LLC and Solaris Inc. is accordingly dependent upon distributions from Solaris LLC to pay taxes, make payments under the Tax Receivable Agreement and cover its corporate and other overhead expenses.
Solaris Inc. is a holding company and has no material assets other than its equity interest in Solaris LLC. Solaris Inc. has no independent means of generating revenue. To the extent Solaris LLC has available cash, Solaris Inc. intends to cause Solaris LLC to make (i) generally pro rata distributions to its unitholders, including Solaris Inc., in an amount at least sufficient to allow Solaris Inc. to pay its taxes and to make payments under the Tax Receivable Agreement and any subsequent tax receivable agreements that Solaris Inc. may enter into in connection with future acquisitions and (ii) non-pro rata payments to it to reimburse it for Solaris Inc.’s corporate and other overhead expenses. To the extent that Solaris Inc. needs funds and Solaris LLC or its subsidiaries are restricted from making such distributions or payments under applicable law or regulation or under the terms of any future financing arrangements, or are otherwise unable to provide such funds, Solaris Inc.’s liquidity and financial condition could be materially adversely affected.
30
Moreover, because Solaris Inc. has no independent means of generating revenue, its ability to make payments under the Tax Receivable Agreement is dependent on the ability of Solaris LLC to make distributions to Solaris Inc. in an amount sufficient to cover its obligations under the Tax Receivable Agreement. This ability, in turn, may depend on the ability of Solaris LLC's subsidiaries to make distributions to it. The ability of Solaris LLC, its subsidiaries and other entities in which it directly or indirectly holds an equity interest to make such distributions is subject to, among other things, (i) the applicable provisions of Delaware law (or other applicable jurisdiction) that may limit the amount of funds available for distribution and (ii) restrictions in relevant debt instruments issued by Solaris LLC or its subsidiaries and/other entities in which it directly or indirectly holds an equity interest. To the extent that Solaris Inc. is unable to make payments under the Tax Receivable Agreement for any reason, such payments will be deferred and will accrue interest until paid.
The requirements of being a public company, including compliance with the reporting requirements of the Exchange Act, and the requirements of the Sarbanes-Oxley Act of 2002, may strain our resources, increase our costs and distract management, and we may be unable to comply with these requirements in a timely or cost-effective manner.
As a public company, we need to comply with laws, regulations and requirements, certain corporate governance provisions of the Sarbanes-Oxley Act of 2002 and related regulations of the SEC and the requirements of the New York Stock Exchange (“NYSE”). Complying with these statutes, regulations and requirements occupies a significant amount of time of our board of directors and management and significantly increases our costs and expenses. We have been required to:
|
· |
institute a more comprehensive compliance function; |
|
· |
comply with rules promulgated by the NYSE; |
|
· |
continue to prepare and distribute periodic public reports in compliance with our obligations under the federal securities laws; |
|
· |
establish new internal policies, such as those relating to insider trading; and |
|
· |
involve and retain to a greater degree outside counsel and accountants in the above activities. |
Furthermore, while we must comply with Section 404 of the Sarbanes-Oxley Act of 2002, we are not required to have our independent registered public accounting firm attest to the effectiveness of our internal controls until our first annual report subsequent to our ceasing to be an "emerging growth company" within the meaning of Section 2(a)(19) of the Securities Act. Accordingly, we may not be required to have our independent registered public accounting firm attest to the effectiveness of our internal controls until as late as our annual report for the fiscal year ending December 31, 2022. Once it is required to do so, our independent registered public accounting firm may issue a report that is adverse in the event it is not satisfied with the level at which our controls are documented, designed, operated or reviewed. Compliance with these requirements may strain our resources, increase our costs and distract management, and we may be unable to comply with these requirements in a timely or cost-effective manner.
In addition, being a public company subject to these rules and regulations may make it more difficult and more expensive for us to obtain director and officer liability insurance and we may be required to accept reduced policy limits and coverage or incur substantially higher costs to obtain the same or similar coverage. As a result, it may be more difficult for us to attract and retain qualified individuals to serve on our board of directors or as executive officers. We are currently evaluating these rules, and we cannot predict or estimate the amount of additional costs we may incur or the timing of such costs.
Our stock price could be volatile, and you may not be able to resell shares of your Class A common stock at or above the price you paid.
The stock markets in general have experienced extreme volatility that has often been unrelated to the operating performance of particular companies. These broad market fluctuations may adversely affect the trading price of our
31
Class A common stock. Volatility in the market price of our Class A common stock may prevent you from being able to sell your Class A common stock at or above the price at which you purchased the stock. As a result, you may suffer a loss on your investment. Securities class action litigation has often been instituted against companies following periods of volatility in the overall market and in the market price of a company's securities. Such litigation, if instituted against us, could result in very substantial costs, divert our management's attention and resources and harm our business, operating results and financial condition.
In addition to the risks described in this section, the market price of our Class A common stock may fluctuate significantly in response to a number of factors, most of which we cannot control, including:
|
· |
our operating and financial performance; |
|
· |
quarterly variation in the rate of growth of our financial indicators, such as EBITDA; |
|
· |
the public reaction to our public releases and filings; |
|
· |
actions by our competitors; |
|
· |
our failure to meet revenue and earnings estimates by research analysts or other investors; |
|
· |
changes in revenue or earnings estimates, or changes in recommendations or withdrawal of research coverage, by equity research analysts; |
|
· |
the failure of research analysts to cover our Class A common stock; |
|
· |
speculation in the press or investment community; |
|
· |
sales of our Class A common stock by us, selling shareholders or other stockholders, or the perception that such sales may occur; |
|
· |
changes in accounting principles, policies, guidance, interpretations, or standards; |
|
· |
additions or departures of key management personnel; |
|
· |
actions by our stockholders; |
|
· |
general market conditions, including fluctuations in commodity prices or additional tariffs on the materials used to manufacture our equipment; |
|
· |
domestics and international economic, legal and regulatory factors unrelated to our performance; and |
|
· |
the realization of any risks described under this “Risk Factors” section. |
Our principal stockholders collectively hold a significant amount of the voting power of our common stock.
Holders of Class A common stock and Class B common stock vote together as a single class on all matters presented to our stockholders for their vote or approval, except as otherwise required by applicable law or our certificate of incorporation, and the members of Solaris LLC immediately prior to the IPO (collectively, the “Original Investors”) own a substantial majority of our Class B common stock, which represents 35% of our combined economic interest and voting power.
Although the Original Investors are entitled to act separately in their own respective interests with respect to their ownership in us, if the Original Investors choose to act in concert, they will together have the ability to strongly influence the election of the members of our board of directors, and thereby our management and affairs. In addition,
32
they will be able to strongly influence the outcome of all matters requiring stockholder approval, including mergers and other material transactions. The existence of significant stockholders may also have the effect of deterring hostile takeovers, delaying or preventing changes in control or changes in management, or limiting the ability of our other stockholders to approve transactions that they may deem to be in the best interests of our company.
So long as the Original Investors continue to control a significant amount of our common stock, each will continue to be able to strongly influence all matters requiring stockholder approval, regardless of whether or not other stockholders believe that a potential transaction is in their own best interests. In any of these matters, the interests of the Original Investors may differ or conflict with the interests of our other stockholders. In addition, certain of our Original Investors, including Yorktown, and their respective affiliates may, from time to time, acquire interests in businesses that directly or indirectly compete with our business, as well as businesses that are significant existing or potential customers. Such Original Investors and their respective affiliates may acquire or seek to acquire assets that we seek to acquire and, as a result, those acquisition opportunities may not be available to us or may be more expensive for us to pursue. Moreover, this concentration of stock ownership may also adversely affect the trading price of our Class A common stock to the extent investors perceive a disadvantage in owning stock of a company with a controlling stockholder.
Certain of our directors have significant duties with, and spend significant time serving, entities that may compete with us in seeking acquisitions and business opportunities and, accordingly, may have conflicts of interest in allocating time or pursuing business opportunities.
Certain of our officers and directors hold positions of responsibility with other entities (including affiliated entities) that are in the oil and natural gas industry. For example, William A. Zartler, our Chairman and Chief Executive Officer, is the Chief Executive Officer of Solaris Midstream Holdings, LLC, a midstream company that owns, operates and designs midstream assets across United States basins and is currently focused on water-specific midstream solutions in the Permian Basin, a position which may require a significant portion of his time. These officers and directors may become aware of business opportunities that may be appropriate for presentation to us as well as to the other entities with which they are or may become affiliated. Due to these existing and potential future affiliations, they may present potential business opportunities to other entities prior to presenting them to us, which could cause additional conflicts of interest. They may also decide that certain opportunities are more appropriate for other entities with which they are affiliated, and as a result, they may elect not to present those opportunities to us. These conflicts may not be resolved in our favor. For additional discussion of our directors' business affiliations and the potential conflicts of interest of which our stockholders should be aware, see Note 13. “Related Party Transactions” under Part II, Item 8. “Financial Statements and Supplementary Data.”
Certain Designated Parties are not limited in their ability to compete with us, and the corporate opportunity provisions in our amended and restated certificate of incorporation could enable such Designated Parties and their respective affiliates to benefit from corporate opportunities that might otherwise be available to us.
Our governing documents provide that Yorktown, Wells Fargo Central Pacific Holdings, Inc. and our directors who are not also our officers, including William A. Zartler, our Chief Executive Officer and the Chairman of our board of directors, and their respective portfolio investments and affiliates (collectively, the "Designated Parties") are not restricted from owning assets or engaging in businesses that compete directly or indirectly with us.
In particular, subject to the limitations of applicable law, our amended and restated certificate of incorporation, among other things:
|
· |
permits such Designated Parties to conduct business that competes with us and to make investments in any kind of property in which we may make investments; and |
|
· |
provides that if such Designated Parties, or any employee, partner, member, manager, officer or director of such Designated Parties who is also one of our directors, becomes aware of a potential business opportunity, transaction or other matter, they will have no duty to communicate or offer that opportunity to us. |
33
The Designated Parties may become aware, from time to time, of certain business opportunities (such as acquisition opportunities) and may direct such opportunities to other businesses in which they have invested, in which case we may not become aware of or otherwise have the ability to pursue such opportunity. Furthermore, such businesses may choose to compete with us for these opportunities, possibly causing these opportunities to not be available to us or causing them to be more expensive for us to pursue. In addition, the Designated Parties may dispose of oil and natural gas service assets in the future, without any obligation to offer us the opportunity to purchase any of those assets. As a result, our renouncing our interest and expectancy in any business opportunity that may be from time to time presented to the Designated Parties could adversely impact our business or prospects if attractive business opportunities are procured by such parties for their own benefit rather than for ours.
Our amended and restated certificate of incorporation and amended and restated bylaws, as well as Delaware law, contain provisions that could discourage acquisition bids or merger proposals, which may adversely affect the market price of our Class A common stock and could deprive our investors of the opportunity to receive a premium for their shares.
Our amended and restated certificate of incorporation authorizes our board of directors to issue preferred stock without stockholder approval in one or more series, designate the number of shares constituting any series, and fix the rights, preferences, privileges and restrictions thereof, including dividend rights, voting rights, rights and terms of redemption, redemption price or prices and liquidation preferences of such series. If our board of directors elects to issue preferred stock, it could be more difficult for a third party to acquire us. In addition, some provisions of our amended and restated certificate of incorporation and amended and restated bylaws could make it more difficult for a third party to acquire control of us, even if the change of control would be beneficial to our stockholders. These provisions include:
|
· |
dividing our board of directors into three classes of directors, with each class serving staggered three-year terms; |
|
· |
providing that all vacancies, including newly created directorships, may, except as otherwise required by law or, if applicable, the rights of holders of a series of preferred stock, only be filled by the affirmative vote of a majority of directors then in office, even if less than a quorum (prior to such time, vacancies may also be filled by stockholders holding a majority of the outstanding shares); |
|
· |
permitting any action by stockholders to be taken only at an annual meeting or special meeting rather than by a written consent of the stockholders, subject to the rights of any series of preferred stock with respect to such rights; |
|
· |
permitting special meetings of our stockholders to be called only by our board of directors pursuant to a resolution adopted by the affirmative vote of a majority of the total number of authorized directors whether or not there exist any vacancies in previously authorized directorships; |
|
· |
requiring the affirmative vote of the holders of at least 75% in voting power of all then outstanding common stock entitled to vote generally in the election of directors, voting together as a single class, to remove any or all of the directors from office at any time, and directors will be removable only for "cause"; |
|
· |
prohibiting cumulative voting in the election of directors; |
|
· |
establishing advance notice provisions for stockholder proposals and nominations for elections to the board of directors to be acted upon at meetings of stockholders; and |
|
· |
providing that the board of directors is expressly authorized to adopt, or to alter or repeal our bylaws. |
In addition, certain change of control events have the effect of accelerating the payment due under the Tax Receivable Agreement, which could be substantial and accordingly serve as a disincentive to a potential acquirer of our company. Please see "—In certain cases, payments under the Tax Receivable Agreement may be accelerated and/or
34
significantly exceed the actual benefits, if any, Solaris Inc. realizes in respect of the tax attributes subject to the Tax Receivable Agreement."
Our amended and restated certificate of incorporation designates the Court of Chancery of the State of Delaware as the sole and exclusive forum for certain types of actions and proceedings that may be initiated by our stockholders, which could limit our stockholders' ability to obtain a favorable judicial forum for disputes with us or our directors, officers, employees or agents.
Our amended and restated certificate of incorporation provides that, unless we consent in writing to the selection of an alternative forum, the Court of Chancery of the State of Delaware will, to the fullest extent permitted by applicable law, be the sole and exclusive forum for (i) any derivative action or proceeding brought on our behalf, (ii) any action asserting a claim of breach of a fiduciary duty owed by any of our directors, officers, employees or agents to us or our stockholders, (iii) any action asserting a claim arising pursuant to any provision of the Delaware General Corporation Law (the "DGCL"), our amended and restated certificate of incorporation or our bylaws, or (iv) any action asserting a claim against us that is governed by the internal affairs doctrine, in each such case subject to such Court of Chancery having personal jurisdiction over the indispensable parties named as defendants therein. Section 27 of the Exchange Act creates exclusive federal jurisdiction over all suits brought to enforce any duty or liability created by the Exchange Act or the rules and regulations promulgated thereunder. As a result, the exclusive forum provision will not apply to actions arising under the Exchange Act or the rules and regulations promulgated thereunder. However, Section 22 of the Securities Act provides for concurrent federal and state court jurisdiction over actions under the Securities Act and the rules and regulations promulgated thereunder, subject to a limited exception for certain “covered class actions” as defined in Section 16 of the Securities Act and interpreted by the courts. Accordingly, we believe that the exclusive forum provision would apply to actions arising under the Securities Act or the rules and regulations promulgated thereunder, except to the extent a particular action fell within the exception for covered class actions or the exception in the certificate of incorporation described above otherwise applied to such action, which could occur if, for example, the action also involved claims under the Exchange Act. Stockholders will not be deemed, by operation of Article 14 of the certificate of incorporation alone, to have waived claims arising under the federal securities laws and the rules and regulations promulgated thereunder.
Any person or entity purchasing or otherwise acquiring any interest in shares of our capital stock will be deemed to have notice of, and consented to, the provisions of our amended and restated certificate of incorporation described in the preceding sentence. This choice of forum provision may limit a stockholder's ability to bring a claim in a judicial forum that it finds favorable for disputes with us or our directors, officers, employees or agents, which may discourage such lawsuits against us and such persons. Alternatively, if a court were to find these provisions of our amended and restated certificate of incorporation inapplicable to, or unenforceable in respect of, one or more of the specified types of actions or proceedings, we may incur additional costs associated with resolving such matters in other jurisdictions, which could adversely affect our business, financial condition or results of operations.
Holders of our Class A common stock may not receive dividends on our Class A common stock.
We declared our first dividend to Class A stockholders in the fourth quarter of 2018 and have continued to declare dividends on a quarterly basis. Holders of our Class A common stock are entitled to receive only such dividends as our board of directors may declare out of funds legally available for such payments. We are incorporated in Delaware and are governed by the DGCL. The DGCL allows a corporation to pay dividends only out of a surplus, as determined under Delaware law or, if there is no surplus, out of net profits for the fiscal year in which the dividend was declared and for the preceding fiscal year. Under the DGCL, however, we cannot pay dividends out of net profits if, after we pay the dividend, our capital would be less than the capital represented by the outstanding stock of all classes having a preference upon the distribution of assets. While management and our board of directors remain committed to evaluating additional ways of creating shareholder value, any determination to pay dividends and other distributions in cash, stock or property by us in the future will be at the discretion of our board of directors and will be dependent on then-existing conditions, including business conditions, our financial condition, results of operations, liquidity, capital requirements, contractual restrictions including restrictive covenants contained in debt agreements and other factors. While we have declared and paid a quarterly cash dividend on our Class A common stock as described under Part II, Item 5. “Market for Registrant’s Common Equity, Related Stockholder Matters and Issuer Purchases of Equity Securities” of this Annual Report, we are not required to declare future cash dividends on our Class A common stock.
35
Future sales of our Class A common stock in the public market, or the perception that such sales may occur, could reduce our stock price, and any additional capital raised by us through the sale of equity or convertible securities may dilute your ownership in us.
We may sell additional shares of our Class A common stock in subsequent offerings. In addition, subject to certain limitations and exceptions, the Original Investors may redeem their Solaris LLC Units (together with a corresponding number of shares of Class B common stock) for shares of Class A common stock (on a one-for-one basis, subject to conversion rate adjustments for stock splits, stock dividends and reclassification and other similar transactions) and then sell those shares of Class A common stock.
We previously filed a registration statement with the SEC on Form S-8 providing for the registration of 5,629,888 shares of our Class A common stock issued or reserved for issuance under our long-term incentive plan. Subject to the satisfaction of vesting conditions, shares registered under the registration statement on Form S-8 may be made available for resale immediately in the public market without restriction.
We cannot predict the size of future issuances of our Class A common stock or securities convertible into Class A common stock or the effect, if any, that future issuances and sales of shares of our Class A common stock will have on the market price of our Class A common stock. Sales of substantial amounts of our Class A common stock (including shares issued in connection with an acquisition), or the perception that such sales could occur, may adversely affect prevailing market prices of our Class A common stock.
Solaris Inc. will be required to make payments under the Tax Receivable Agreement for certain tax benefits that it may claim, and the amounts of such payments could be significant.
In connection with the closing of the IPO, Solaris Inc. entered into a Tax Receivable Agreement with the TRA Holders (as defined herein). This agreement generally provides for the payment by Solaris Inc. to each TRA Holder of 85% of the net cash savings, if any, in United States federal, state and local income tax and franchise tax that Solaris Inc. actually realizes (computed using simplifying assumptions to address the impact of state and local taxes) or is deemed to realize in certain circumstances in periods after the IPO as a result of certain increases in tax basis and certain benefits attributable to imputed interest. Solaris Inc. will retain the benefit of the remaining 15% of these cash savings.
The term of the Tax Receivable Agreement will continue until all tax benefits that are subject to the Tax Receivable Agreement have been utilized or expired, unless Solaris Inc. exercises its right to terminate the Tax Receivable Agreement (or the Tax Receivable Agreement is terminated due to other circumstances, including Solaris Inc.’s breach of a material obligation thereunder or certain mergers, asset sales, other forms of business combination or other changes of control), and Solaris Inc. makes the termination payment specified in the Tax Receivable Agreement. In addition, payments Solaris Inc. makes under the Tax Receivable Agreement will be increased by any interest accrued from the due date (without extensions) of the corresponding tax return.
The payment obligations under the Tax Receivable Agreement are Solaris Inc.'s obligations and not obligations of Solaris LLC, and Solaris Inc. expects that the payments it will be required to make under the Tax Receivable Agreement will be substantial. Estimating the amount and timing of payments that may become due under the Tax Receivable Agreement is by its nature imprecise. For purposes of the Tax Receivable Agreement, cash savings in tax generally are calculated by comparing Solaris Inc.’s actual tax liability (determined by using the actual applicable United States federal income tax rate and an assumed combined state and local income and franchise tax rate) to the amount Solaris Inc. would have been required to pay had it not been able to utilize any of the tax benefits subject to the Tax Receivable Agreement. The actual increase in tax basis, as well as the amount and timing of any payments under the Tax Receivable Agreement, will vary depending upon a number of factors, including the timing of any redemption of Solaris LLC Units, the price of Solaris Inc.’s Class A common stock at the time of each redemption, the extent to which such redemptions are taxable transactions, the amount and timing of the taxable income Solaris Inc. generates in the future, the United States federal income tax rates then applicable, and the portion of Solaris Inc.’s payments under the Tax Receivable Agreement that constitute imputed interest or give rise to depreciable or amortizable tax basis.
The payments under the Tax Receivable Agreement are not conditioned upon a holder of rights under the Tax Receivable Agreement having a continued ownership interest in Solaris Inc. or Solaris LLC. For additional information
36
regarding the Tax Receivable Agreement, see Note 10. “Income Taxes” under Part II, Item 8. “Financial Statements and Supplementary Data.”
In certain cases, payments under the Tax Receivable Agreement may be accelerated and/or significantly exceed the actual benefits, if any, Solaris Inc. realizes in respect of the tax attributes subject to the Tax Receivable Agreement.
If we experience a change of control (as defined under the Tax Receivable Agreement, which includes certain mergers, asset sales and other forms of business combinations) or the Tax Receivable Agreement terminates early (at Solaris Inc.’s election or as a result of its breach), we would be required to make a substantial, immediate lump-sum payment. This payment would equal the present value of hypothetical future payments that could be required to be paid under the Tax Receivable Agreement (determined by applying a discount rate of one-year London Interbank Offered Rate ("LIBOR") plus 100 basis points). The calculation of hypothetical future payments will be based upon certain assumptions and deemed events set forth in the Tax Receivable Agreement, including that (i) Solaris Inc. has sufficient taxable income to fully utilize the tax benefits covered by the Tax Receivable Agreement (including having sufficient taxable income to currently utilize any accumulated net operating loss carryforwards) and (ii) any Solaris LLC Units (other than those held by Solaris Inc.) outstanding on the termination date are deemed to be redeemed on the termination date. Any early termination payment may be made significantly in advance of, and may materially exceed, the actual realization, if any, of the future tax benefits to which the termination payment relates.
If we experience a change of control (as defined under the Tax Receivable Agreement) or the Tax Receivable Agreement otherwise terminates early, Solaris Inc.’s obligations under the Tax Receivable Agreement could have a substantial negative impact on Solaris Inc.’s liquidity and could have the effect of delaying, deferring or preventing certain mergers, asset sales or other forms of business combinations or changes of control. For example, if the Tax Receivable Agreement were terminated immediately after the filing of this Annual Report, the estimated termination payments would, in the aggregate, be approximately $101.7 million (calculated using a discount rate equal to one-year LIBOR plus 100 basis points, applied against an undiscounted liability of $114.6 million, based upon the last reported closing sale price of our Class A common stock on December 31, 2019). The foregoing number is merely an estimate and the actual payment could differ materially. There can be no assurance that we will be able to finance our obligations under the Tax Receivable Agreement.
Please read Note 10. “Income Taxes” under Part II, Item 8. “Financial Statements and Supplementary Data.”
In the event that Solaris Inc.’s payment obligations under the Tax Receivable Agreement are accelerated upon certain mergers, other forms of business combinations or other changes of control, the consideration payable to holders of our Class A common stock could be substantially reduced.
If we experience a change of control (as defined under the Tax Receivable Agreement, which includes certain mergers, asset sales and other forms of business combinations) Solaris Inc. would be obligated to make a substantial, immediate lump-sum payment, and such payment may be significantly in advance of, and may materially exceed, the actual realization, if any, of the future tax benefits to which the payment relates. As a result of this payment obligation, holders of our Class A common stock could receive substantially less consideration in connection with a change of control transaction than they would receive in the absence of such obligation. Further, Solaris Inc.’s payment obligations under the Tax Receivable Agreement will not be conditioned upon the TRA Holders having a continued interest in Solaris Inc. or Solaris LLC. Accordingly, the TRA Holders' interests may conflict with those of the holders of our Class A common stock. Please read "—Risks Related to Our Class A Common Stock—In certain cases, payments under the Tax Receivable Agreement may be accelerated and/or significantly exceed the actual benefits, if any, Solaris Inc. realizes in respect of the tax attributes subject to the Tax Receivable Agreement" and Note 10. “Income Taxes” under Part II, Item 8. “Financial Statements and Supplementary Data.”
We will not be reimbursed for any payments made under the Tax Receivable Agreement in the event that any tax benefits are subsequently disallowed.
Payments under the Tax Receivable Agreement will be based on the tax reporting positions that we will determine. The TRA Holders will not reimburse us for any payments previously made under the Tax Receivable Agreement if any
37
tax benefits that have given rise to payments under the Tax Receivable Agreement are subsequently disallowed, except that excess payments made to any TRA Holder will be netted against payments that would otherwise be made to such TRA Holder, if any, after our determination of such excess. As a result, in such circumstances, we could make payments that are greater than our actual cash tax savings, if any, and may not be able to recoup those payments, which could adversely affect our liquidity.
We may issue preferred stock whose terms could adversely affect the voting power or value of our Class A common stock.
Our amended and restated certificate of incorporation authorizes us to issue, without the approval of our stockholders, one or more classes or series of preferred stock having such designations, preferences, limitations and relative rights, including preferences over our Class A common stock respecting dividends and distributions, as our board of directors may determine. The terms of one or more classes or series of preferred stock could adversely impact the voting power or value of our Class A common stock. For example, we might grant holders of preferred stock the right to elect some number of our directors in all events or on the happening of specified events or the right to veto specified transactions. Similarly, the repurchase or redemption rights or liquidation preferences we might assign to holders of preferred stock could affect the residual value of the Class A common stock.
For as long as we are an emerging growth company, we will not be required to comply with certain reporting requirements, including those relating to accounting standards and disclosure about our executive compensation, that apply to other public companies.
We are classified as an "emerging growth company" under the Jumpstart Our Business Startups Act (the “JOBS Act”). For as long as we are an emerging growth company, which may be up to five full fiscal years, unlike other public companies, we will not be required to, among other things: (i) provide an auditor's attestation report on management's assessment of the effectiveness of our system of internal control over financial reporting pursuant to Section 404(b) of the Sarbanes-Oxley Act of 2002; (ii) comply with any new requirements if adopted by the Public Company Accounting Oversight Board (United States) (“PCAOB”) requiring mandatory audit firm rotation or a supplement to the auditor's report in which the auditor would be required to provide additional information about the audit and the financial statements of the issuer; (iii) provide certain disclosures regarding executive compensation required of larger public companies; or (iv) hold nonbinding advisory votes on executive compensation. The Company has elected not to use the extended transition period for complying with any new or revised financial accounting standards. We may remain an emerging growth company until December 31, 2022, although we will lose that status sooner if we have more than $1.07 billion of revenues in a fiscal year, have more than $700.0 million in market value of our Class A common stock held by non-affiliates, or issue more than $1.0 billion of non-convertible debt over a three-year period.
To the extent that we rely on any of the exemptions available to emerging growth companies, you will receive less information about our executive compensation and internal control over financial reporting than issuers that are not emerging growth companies. If some investors find our Class A common stock to be less attractive as a result, there may be a less active trading market for our Class A common stock and our stock price may be more volatile.
If securities or industry analysts adversely change their recommendations regarding our Class A common stock or if our operating results do not meet their expectations, our stock price could decline.
The trading market for our Class A common stock will be influenced by the research and reports that industry or securities analysts publish about us or our business. If one or more of these analysts cease coverage of our company or fail to publish reports on us regularly, we could lose visibility in the financial markets, which in turn could cause our stock price or trading volume to decline. Moreover, if one or more of the analysts who cover our company downgrades our Class A common stock or if our operating results do not meet their expectations, our stock price could decline.
Item 1B. Unresolved Staff Comments
None.
38
Our principal properties are described in Item 1. “Business” under the caption “—Kingfisher Facility.”
Due to the nature of our business, we may become, from time to time, involved in routine litigation or subject to disputes or claims related to our business activities. In the opinion of our management, there are no pending litigation, disputes or claims against us which, if decided adversely, will have a material adverse effect on our financial condition, cash flows or results of operations.
Item 4. Mine Safety Disclosures
Not applicable.
Item 5. Market for Registrant’s Common Equity, Related Stockholder Matters and Issuer Purchases of Equity Securities
Market Information
Shares of our Class A common stock trade on the NYSE under the symbol “SOI.”
As of February 14, 2020, we had approximately 9 holders of record of our Class A common stock. This number excludes owners for whom Class A common stock may be held in "street" name.
There is no market for our Class B common stock. As of February 14, 2020, we had 19 holders of record of our Class B common stock.
Dividend Policy
The Company pays dividends on its Class A common stock. We currently intend to continue paying the quarterly dividend while retaining the balance of future earnings, if any, to finance the growth of our business. However, our future dividend policy is within the discretion of our board of directors and will depend upon then-existing conditions, including our results of operations, financial condition, capital requirements, investment opportunities, statutory restrictions on our ability to pay dividends and other factors our board of directors may deem relevant. In addition, our 2019 Credit Agreement contains certain restrictions on our ability to pay cash dividends to holders of our Class A common stock.
Securities Authorized for Issuance under Equity Compensation Plans
The information relating to our equity compensation plans required by Item 5 is incorporated by reference to such information as set forth in Item 12. “Security Ownership of Certain Beneficial Owners and Management and Related Stockholder Matters” contained herein.
39
Issuer Purchases of Equity Securities
The following table presents the total number of shares of our Class A common stock that we purchased during the year ended December 31, 2019 and the average price paid per share:
|
|
|
|
|
|
|
|
|
Total Number of |
|
Maximum Dollar |
|
|
|
|
|
|
|
|
|
|
Shares Purchased as |
|
Value of Shares |
|
|
|
|
Total Number of |
|
|
Average Price |
|
Part of Publicly |
|
that May Yet be |
||
|
|
|
Shares |
|
|
Paid Per |
|
Announced |
|
Purchased Under |
||
|
Period |
|
Purchased |
|
|
Share |
|
Plan (1) |
|
the Plan (1) |
||
|
January 1 - January 31 |
|
— |
|
|
$ |
— |
|
— |
|
$ |
N/A |
|
February 1 - February 28 |
|
— |
|
|
|
— |
|
— |
|
|
N/A |
|
March 1 - March 31 |
|
27,788 |
(2) |
|
|
15.49 |
|
— |
|
|
N/A |
|
April 1 - April 30 |
|
— |
|
|
|
— |
|
— |
|
|
N/A |
|
May 1 - May 31 |
|
16,475 |
(2) |
|
|
18.13 |
|
— |
|
|
N/A |
|
June 1 - June 30 |
|
— |
|
|
|
— |
|
— |
|
|
N/A |
|
July 1 - July 31 |
|
— |
|
|
|
— |
|
— |
|
|
N/A |
|
August 1 - August 31 |
|
27,641 |
(2) |
|
|
13.69 |
|
— |
|
|
N/A |
|
September 1 - September 30 |
|
— |
|
|
|
— |
|
— |
|
|
N/A |
|
October 1 - October 31 |
|
— |
|
|
|
— |
|
— |
|
|
N/A |
|
November 1 - November 30 |
|
352 |
(2) |
|
|
11.19 |
|
— |
|
|
N/A |
|
December 1 - December 31 |
|
251,930 |
|
|
|
12.90 |
|
251,930 |
|
|
21,746,202 |
|
Total |
|
324,186 |
|
|
$ |
13.45 |
|
251,930 |
|
$ |
21,746,202 |
|
(1) |
In December 2019, our Board of Directors authorized and announced the repurchase of up to $25 million of our Class A common stock. |
|
(2) |
Represents shares of stock withheld for the payment of withholding taxes upon the vesting of restricted stock. |
Sales of Unregistered Equity Securities
We did not have any sales of unregistered equity securities during the year ended December 31, 2019.
Item 6. Selected Financial Data
Solaris Inc. was formed in February 2017 and did not have any historical financial or operating results prior to the IPO. Following the IPO, Solaris Inc. became the sole managing member for Solaris LLC. As a result, Solaris Inc. consolidates the financial results of Solaris LLC and its subsidiaries and reports noncontrolling interest related to the portion of Solaris LLC Units not owned by Solaris Inc., which reduces net income (loss) attributable to the holders of Solaris Inc.'s Class A stock. For periods prior to the completion of the IPO, the accompanying consolidated financial statements include the historical financial position and results of operations of Solaris LLC, our predecessor.
The following selected historical financial and operating information was derived from our Consolidated Financial Statements as of and for the years ended December 31, 2019, 2018, 2017, 2016 and 2015. The selected financial data should be read in conjunction with the Company’s Consolidated Financial Statements and the accompanying Notes to Consolidated Financial Statements in “Part II, Item 7. “Management’s Discussion and Analysis of Financial Condition and Results of Operations,” and “Part II, Item 8. “Financial Statements and Supplementary Data.”
40
|
|
|
Year ended |
|||||||||||||
|
|
|
December 31, |
|||||||||||||
|
|
|
2019 |
|
2018 |
|
2017 |
|
2016 |
|
2015 |
|||||
|
|
|
(in thousands, except per share and operating data) |
|||||||||||||
|
|
|
|
|
|
|
|
|
|
|
|
|
|
|||
|
Statement of Operations Data: |
|
|
|
|
|
|
|
|
|
|
|
|
|
|
|
|
Total revenue |
|
$ |
241,687 |
|
$ |
197,196 |
|
$ |
67,395 |
|
$ |
18,157 |
|
$ |
14,205 |
|
Total operating costs and expenses (1) |
|
|
133,757 |
|
|
97,909 |
|
|
41,934 |
|
|
15,296 |
|
|
15,418 |
|
Total other income (expense) |
|
|
(634) |
|
|
(374) |
|
|
22,925 |
|
|
(15) |
|
|
(93) |
|
Income (loss) before income tax expense |
|
|
107,296 |
|
|
98,913 |
|
|
48,386 |
|
|
2,846 |
|
|
(1,306) |
|
Provision for income taxes |
|
|
(16,936) |
|
|
(12,961) |
|
|
(33,709) |
|
|
(43) |
|
|
67 |
|
Net income (loss) |
|
$ |
90,360 |
|
$ |
85,952 |
|
$ |
14,677 |
|
$ |
2,803 |
|
$ |
(1,373) |
|
Less: net (income) loss related to Solaris LLC |
|
|
— |
|
|
— |
|
|
(3,665) |
|
|
(2,803) |
|
|
1,373 |
|
Less: net income related to non-controlling interests |
|
|
(38,353) |
|
|
(43,521) |
|
|
(15,186) |
|
|
— |
|
|
— |
|
Net income (loss) attributable to Solaris Inc. |
|
$ |
52,007 |
|
$ |
42,431 |
|
$ |
(4,174) |
|
$ |
— |
|
$ |
— |
|
Earnings (loss) per share of Class A common stock—basic (2) |
|
$ |
1.69 |
|
$ |
1.60 |
|
$ |
(0.34) |
|
$ |
— |
|
$ |
— |
|
Earnings (loss) per share of Class A common stock—diluted (2) |
|
$ |
1.69 |
|
$ |
1.59 |
|
$ |
(0.34) |
|
$ |
— |
|
$ |
— |
|
Distribution per unit and dividend per share paid to Solaris LLC unitholders and Class A common shareholders |
|
$ |
0.405 |
|
$ |
0.100 |
|
$ |
— |
|
$ |
— |
|
$ |
— |
|
Basic weighted-average shares of Class A common stock outstanding (2) |
|
|
30,141 |
|
|
25,678 |
|
|
12,117 |
|
|
— |
|
|
— |
|
Diluted weighted-average shares of Class A common stock outstanding (2) |
|
|
30,185 |
|
|
25,829 |
|
|
12,117 |
|
|
— |
|
|
— |
|
Balance Sheet Data (at period end): |
|
|
|
|
|
|
|
|
|
|
|
|
|
|
|
|
Cash |
|
$ |
66,882 |
|
$ |
25,057 |
|
$ |
63,421 |
|
$ |
3,568 |
|
$ |
6,923 |
|
Property, plant and equipment, net |
|
|
306,583 |
|
|
296,538 |
|
|
151,163 |
|
|
54,350 |
|
|
46,846 |
|
Total assets |
|
|
505,072 |
|
|
458,607 |
|
|
299,743 |
|
|
77,236 |
|
|
70,553 |
|
Long-term debt (including current portion) |
|
|
— |
|
|
13,628 |
|
|
212 |
|
|
3,041 |
|
|
529 |
|
Total liabilities |
|
|
95,414 |
|
|
117,729 |
|
|
45,500 |
|
|
5,890 |
|
|
3,085 |
|
Total liabilities, stockholders' and members’ equity |
|
|
505,072 |
|
|
458,607 |
|
|
299,743 |
|
|
77,236 |
|
|
70,553 |
|
Cash Flow Statement Data: |
|
|
|
|
|
|
|
|
|
|
|
|
|
|
|
|
Net cash provided by operating activities |
|
$ |
114,871 |
|
$ |
116,365 |
|
$ |
26,729 |
|
$ |
4,521 |
|
$ |
2,156 |
|
Net cash used in investing activities |
|
|
(34,002) |
|
|
(160,545) |
|
|
(98,984) |
|
|
(10,935) |
|
|
(27,859) |
|
Net cash provided by (used in) financing activities |
|
|
(39,044) |
|
|
5,816 |
|
|
132,108 |
|
|
3,059 |
|
|
7,878 |
|
Other Data: |
|
|
|
|
|
|
|
|
|
|
|
|
|
|
|
|
Adjusted EBITDA (3) |
|
$ |
112,885 |
|
$ |
122,835 |
|
$ |
39,923 |
|
$ |
6,788 |
|
$ |
1,659 |
41
|
Fully utilized systems (4) |
|
|
110 |
|
|
111 |
|
|
46 |
|
|
16 |
|
|
7 |
|
(1) |
Total operating costs and expenses include stock-based compensation expense as follows: |
|
|
|
Year ended |
|||||||||||||
|
|
|
December 31, |
|||||||||||||
|
|
|
2019 |
|
2018 |
|
2017 |
|
2016 |
|
2015 |
|||||
|
|
|
(in thousands, except per share and operating data) |
|||||||||||||
|
Cost of system rental |
|
$ |
34 |
|
$ |
6 |
|
$ |
— |
|
$ |
— |
|
$ |
— |
|
Cost of system services |
|
|
262 |
|
|
191 |
|
|
— |
|
|
— |
|
|
— |
|
Cost of transloading services |
|
|
13 |
|
|
3 |
|
|
— |
|
|
— |
|
|
— |
|
Selling, general and administrative |
|
|
4,167 |
|
|
3,661 |
|
|
3,701 |
|
|
127 |
|
|
64 |
|
Stock-based compensation expense |
|
$ |
4,476 |
|
$ |
3,861 |
|
$ |
3,701 |
|
$ |
127 |
|
$ |
64 |
|
(2) |
Represents earnings per share of Class A common stock and weighted-average shares of Class A common stock outstanding for the period following the May 17, 2017 IPO. |
|
(3) |
Adjusted EBITDA is a non-GAAP financial measure. For a definition of Adjusted EBITDA and a reconciliation to our most directly comparable financial measure calculated and presented in accordance with GAAP, please read Item 7. "Note Regarding Non-GAAP Financial Measures." |
|
(4) |
The fully utilized system count is calculated as the total number of revenue days divided by the number of days in the period. |
Item 7. Management’s Discussion and Analysis of Financial Condition and Results of Operations
Unless the context requires otherwise, references in this Annual Report to the "Company," "Solaris," "we," "us" and "our" refer to (i) Solaris Oilfield Infrastructure, LLC ("Solaris LLC") and its consolidated subsidiaries prior to the completion of our initial public offering and (ii) Solaris Oilfield Infrastructure, Inc. ("Solaris Inc.") and its consolidated subsidiaries following the completion of our initial public offering. The following discussion and analysis of our financial condition and results of operations should be read in conjunction with the accompanying financial statements and related notes. This section of this Form 10-K generally discusses 2019 and 2018 items and year-to-year comparisons between 2019 and 2018. Discussions of 2017 items and year-to-year comparisons between 2018 and 2017 that are not included in this Form 10-K can be found in “Part II, Item 7. “Management’s Discussion and Analysis of Financial Conditions and Results of Operations” of our Annual Report on Form 10-K for the fiscal year ended December 31, 2018. The following discussion contains “forward-looking statements” that reflect our plans, estimates, beliefs and expected performance. Our actual results may differ materially from those anticipated as discussed in these forward-looking statements as a result of a variety of risks and uncertainties, including those described above in “Cautionary Statement Regarding Forward-Looking Statements” and “Risk Factors” included elsewhere in this Annual Report, all of which are difficult to predict. In light of these risks, uncertainties and assumptions, the forward-looking events discussed may not occur. We assume no obligation to update any of these forward-looking statements except as otherwise required by law.
Overview
Solaris LLC was formed in July 2014. Solaris Inc. was incorporated as a Delaware corporation in February 2017 for the purpose of completing an initial public offering of equity in May 2017 (the “IPO” or the “Offering”) and related transactions. On May 11, 2017, in connection with the IPO, Solaris Inc. became a holding company whose sole material asset consists of units in Solaris LLC (“Solaris LLC Units”). Solaris Inc. became the managing member of Solaris LLC and is responsible for all operational, management and administrative decisions relating to Solaris LLC’s business and consolidates the financial results of Solaris LLC and its subsidiaries.
42
Executive Summary
We design, manufacture and rent specialized equipment which combined with field technician support, logistics services and our software solutions, enables us to provide a service offering that helps oil and natural gas operators and their suppliers drive efficiencies and reduce costs during the completion phase of well development. The majority of our revenue is currently derived from rental and services related to our patented mobile proppant and chemical management systems that unload, store and deliver proppant used in hydraulic fracturing of oil and natural gas wells, as well as coordinating the delivery of proppant and chemicals to the well site. Our systems are deployed in most of the active oil and natural gas basins in the United States.
In 2018 and 2019, we introduced new equipment and service enhancements, which we believe will help us maintain and expand our total revenue opportunity in the United States completions space. We introduced our mobile chemical management system to the market in late 2018 and we began commercializing the offering in 2019. Design enhancements introduced in 2018 include our AutoHopper™ technology, which we are deploying across our fleet to automate the delivery of proppant into the blender, and the latest version of our Solaris Lens® software, available on our systems and allows customers to view the entire last mile proppant supply chain in real time.
Recent Trends and Outlook
Demand for our products and services is predominantly influenced by the level of oil and natural gas well drilling and completion activity, which, in turn, is determined by the current and anticipated profitability of developing oil and natural gas reserves.
The Baker Hughes US Land rig count decreased 9% to 920 average rigs in 2019 from 1,013 average rigs in 2018. This compares to a 1% decline to an average of 110 fully utilized mobile proppant systems rented during 2019 compared to 2018. The lower decline rate in demand for our systems during 2019 relative to the drilling rig count was due to investments made to grow our service fleet during 2018. During 2019 we reduced investment in fleet growth in response to the slowing activity.
Going forward, absent significant changes in markets share, we would expect our activity to follow the general trends of the US land drilling and completion activity.
Initial 2020 capital budgets announced by oil and gas operators indicate spending on US drilling and completion activity could be down 10-15% in 2020 relative to 2019.
Our service fleet currently consists of 166 mobile proppant management systems and 14 mobile chemical management systems, which is a new service offering for the Company. We do not expect to build any additional proppant systems for the remainder of 2020.
How We Generate Revenue
We generate the majority of our revenue through the rental of our systems and related services, including transportation of proppant to the well site, transportation of our systems field supervision and support, as well as coordinating the delivery of proppant and chemicals to the well site. The system rental and provision of related services are performed under a variety of contract structures, primarily master service agreements as supplemented by individual work orders detailing statements of work, pricing agreements and specific quotes. The master service agreements generally establish terms and conditions for the provision of our systems and service on a well site, indemnification, damages, confidentiality, intellectual property protection and payment terms and provisions. The rentals and services are generally priced based on prevailing market conditions at the time the services are provided, giving consideration to the specific requirements and activity levels of the customer. We typically charge our customers for the rental of our systems and related services on a monthly basis.
In early 2018, we began generating revenue for our transloading services at our independent, transload facility in Oklahoma (the “Kingfisher Facility”). We generally charge our customers a throughput fee for rail-to-truck transloading and high-efficiency sand silo storage and transloading services at the Kingfisher Facility.
43
Finally, we generate revenue through our Railtronix® inventory management software. We generally charge our customers a throughput fee to monitor proppant that is loaded into a railcar, stored at a transload facility or loaded into a truck at either a transload facility or mine.
Costs of Conducting Our Business
The principal costs associated with operating our business are:
|
· |
Cost of system rental (excluding depreciation and amortization); |
|
· |
Cost of system services (excluding depreciation and amortization); |
|
· |
Cost of transloading operations and services (excluding depreciation and amortization); |
|
· |
Cost of software inventory management services (excluding depreciation and amortization); |
|
· |
Depreciation and amortization associated primarily with the costs to build our systems and the costs to develop rail and storage assets; |
|
· |
Selling, general and administrative expenses; and |
|
· |
Other operating expenses. |
Our cost of system rental (excluding depreciation and amortization) consists primarily of the costs of maintaining our equipment, developing and maintaining our Solaris Lens software, as well as insurance and property taxes related to our equipment.
Our cost of system services (excluding depreciation and amortization) consists primarily of direct labor costs, and related travel and lodging expenses, and system transportation costs. A large portion of our cost of system services (excluding depreciation and amortization) are variable based on the number of systems deployed with customers.
Our cost of transloading services (excluding depreciation and amortization) consists primarily of direct labor costs, fuel, utilities and maintenance.
Our cost of software inventory management services (excluding depreciation and amortization) consists primarily of direct labor and software subscriptions.
Our depreciation and amortization expense primarily consists of the depreciation expense related to our systems and related manufacturing machinery and equipment as well as rail and transloading equipment. The costs to build our systems, including any upgrades, are capitalized and depreciated over a life ranging from three to 15 years. The costs to build our rail and transloading storage assets are capitalized and depreciated over a life of 15 to 30 years.
Our selling, general and administrative expenses are comprised of the salaries and related benefits for several functional areas of our organization, including sales and commercial research and development accounting and corporate administrative, as well as office rent, marketing expenses and third-party professional service providers.
How We Evaluate Our Operations
We use a variety of qualitative, operational and financial metrics to assess our performance. Among other measures, management considers revenue, revenue days, fully utilized system count, tons transloaded, EBITDA and Adjusted EBITDA.
We analyze our revenue by comparing actual monthly revenue to our internal projections for a given period and to prior periods to assess our performance. We also assess our revenue in relation to the number of systems we have
44
deployed to customers and the amount of proppant and chemicals transloaded at our Kingfisher Facility from period to period.
Fully Utilized System Count
The fully utilized system count is calculated as the combined number of days that a system generates revenue in a given period divided by the number of days in that period. We view the fully utilized system count as the best measure to track utilization and changes in rental activity on a period-over-period basis as the majority of our systems are rented on a monthly basis.
Tons Transloaded
We view tons transloaded as an important indicator of our performance. We calculate the number of tons transloaded as the combined number of proppant tons and chemicals that are transloaded at our Kingfisher Facility in a period. We assess the number of tons transloaded from period to period in relation to prior periods and contracted minimum volumes.
EBITDA and Adjusted EBITDA
We view EBITDA and Adjusted EBITDA as important indicators of performance. We define EBITDA as net income, plus (i) depreciation and amortization expense, (ii) interest expense and (iii) income tax expense, including franchise taxes. We define Adjusted EBITDA as EBITDA plus (i) stock-based compensation expense and (ii) certain non-cash items and extraordinary, unusual or non-recurring gains, losses or expenses.
Note Regarding Non-GAAP Financial Measures
EBITDA and Adjusted EBITDA are not financial measures presented in accordance with accounting principles generally accepted in the United States (“GAAP”). We believe that the presentation of these non-GAAP financial measures will provide useful information to investors in assessing our financial condition and results of operations. Net income (loss) is the GAAP measure most directly comparable to EBITDA and Adjusted EBITDA. Our non-GAAP financial measures should not be considered as alternatives to the most directly comparable GAAP financial measure. Each of these non-GAAP financial measures has important limitations as analytical tools because they exclude some but not all items that affect the most directly comparable GAAP financial measures. You should not consider EBITDA or Adjusted EBITDA in isolation or as substitutes for an analysis of our results as reported under GAAP. Because EBITDA and Adjusted EBITDA may be defined differently by other companies in our industry, our definitions of these non-GAAP financial measures may not be comparable to similarly titled measures of other companies, thereby diminishing their utility.
Factors Impacting Comparability of Our Financial Results
Our future results of operations may not be comparable to the historical results of operations of our accounting predecessor, Solaris LLC, for the periods presented, primarily for the reasons described below.
Corporate Reorganization
The historical consolidated financial statements included in this report are based on the financial statements of our accounting predecessor, Solaris LLC, prior to our corporate reorganization consummated in connection with the IPO. As a result, the historical consolidated financial data may not give you an accurate indication of what our actual results would have been if the corporate reorganization had been completed at the beginning of the periods presented or of what our future results of operations are likely to be. In connection with the IPO and the transactions related thereto, Solaris Inc. became a holding company whose sole material asset consists of Solaris LLC Units. Solaris Inc. is the managing member of Solaris LLC and is responsible for all operational, management and administrative decisions relating to Solaris LLC’s business and consolidates the financial results of Solaris LLC and its subsidiaries.
45
In addition, in connection with the IPO, Solaris Inc. entered into a tax receivable agreement (the “Tax Receivable Agreement”) with the members of Solaris LLC immediately prior to the IPO (collectively, the “Original Investors”) (each such person and any permitted transferee, a “TRA Holder,” and together, the “TRA Holders”) on May 17, 2017. This agreement generally provides for the payment by Solaris Inc. to each TRA Holder of 85% of the net cash savings, if any, in United States federal, state and local income tax and franchise tax that Solaris Inc. actually realizes (computed using simplifying assumptions to address the impact of state and local taxes) or is deemed to realize in certain circumstances in periods after the IPO as a result of (i) certain increases in tax basis that occur as a result of Solaris Inc. acquisition (or deemed acquisition for United States federal income tax purposes) of all or a portion of such TRA Holder’s Solaris LLC Units in connection with the IPO or pursuant to the exercise of the Redemption Right or the Call Right (each as defined in Solaris LLC’s Second Amended and Restated Limited Liability Company Agreement (the “Solaris LLC Agreement”)) and (ii) imputed interest deemed to be paid by Solaris Inc. as a result of, and additional tax basis arising from, any payments Solaris Inc. makes under the Tax Receivable Agreement. Solaris will retain the benefit of the remaining 15% of these cash savings.
We anticipate that we will account for the effects of these increases in tax basis and associated payments under the Tax Receivable Agreement arising from any future redemptions of Solaris LLC Units from our Original Investors as follows:
|
· |
we will record an increase in deferred tax assets for the estimated income tax effects of the increases in tax basis based on enacted federal and state tax rates at the date of the redemption; |
|
· |
to the extent we estimate that we will not realize the full benefit represented by the deferred tax asset, based on an analysis that will consider, among other things, our expectation of future earnings, we will reduce the deferred tax asset with a valuation allowance; |
|
· |
we will record 85% of the estimated realizable tax benefit as an increase to our payables associated with the future payments due under the Tax Receivable Agreement and the remaining 15% of the estimated realizable tax benefit as an increase to additional paid-in capital; and |
|
· |
we will reduce the payable for payments made under the Tax Receivable Agreement. |
All of the effects of changes in any of our estimates after the date of the exchange will be included in net income for the period in which those changes occur. Similarly, the effect of subsequent changes in the enacted tax rates will be included in net income for the period in which the change occurs.
Fleet Growth
We have experienced significant growth over the past six years. Since commencing operations in April 2014, we have grown our fleet from two systems to 166 mobile proppant management systems and 14 mobile chemical management systems in our fleet as of December 31, 2019 and increased the number of major oil and natural gas basins in which our systems are deployed.
Income Taxes
Solaris Inc. is a corporation and, as a result, is subject to United States federal, state and local income taxes. Although Solaris LLC is subject to franchise tax in the State of Texas (at less than 1% of modified pre-tax earnings) it passes through its taxable income to its owners, including Solaris Inc., for United States federal and other state and local income tax purposes and thus is not generally subject to United States federal income tax or other state or local income taxes. Accordingly, the financial data attributable to Solaris LLC prior to the IPO contains no provision for United States federal income tax or income taxes in any state or locality other than franchise tax in the State of Texas.
46
Results of Operations
Year Ended December 31, 2019 Compared to Year Ended December 31, 2018
|
|
|
Year Ended |
|
|
|
||||
|
|
|
December 31, |
|
|
|
||||
|
|
|
2019 |
|
2018 |
|
Change |
|||
|
|
|
(in thousands) |
|||||||
|
|
|
|
|
|
|
|
|
|
|
|
Revenue |
|
|
|
|
|
|
|
|
|
|
System rental |
|
$ |
142,022 |
|
$ |
143,646 |
|
$ |
(1,624) |
|
System services |
|
|
63,871 |
|
|
43,010 |
|
|
20,861 |
|
Transloading services |
|
|
34,105 |
|
|
8,083 |
|
|
26,022 |
|
Inventory software services |
|
|
1,689 |
|
|
2,457 |
|
|
(768) |
|
Total revenue |
|
|
241,687 |
|
|
197,196 |
|
|
44,491 |
|
Operating costs and expenses: |
|
|
|
|
|
|
|
|
|
|
Cost of system rental (excluding $22,389 and $14,920 of depreciation and amortization for the years ended December 31, 2019 and 2018, respectively, shown separately) |
|
|
9,707 |
|
|
7,230 |
|
|
2,477 |
|
Cost of system services (excluding $1,548 and $1,274 of depreciation and amortization for the years ended December 31, 2019 and 2018, respectively, shown separately) |
|
|
74,749 |
|
|
50,633 |
|
|
24,116 |
|
Cost of transloading services (excluding $1,643 and $954 of depreciation and amortization for the year ended December 31, 2018, shown separately) |
|
|
2,601 |
|
|
2,242 |
|
|
359 |
|
Cost of inventory software services (excluding $772 and $794 of depreciation and amortization for the years ended December 31, 2019 and 2018, respectively, shown separately) |
|
|
604 |
|
|
797 |
|
|
(193) |
|
Depreciation and amortization |
|
|
26,925 |
|
|
18,422 |
|
|
8,503 |
|
Selling, general and administrative (excluding $573 and $480 of depreciation and amortization for the years ended December 31, 2019 and 2018, respectively, shown separately) |
|
|
18,586 |
|
|
16,758 |
|
|
1,828 |
|
Other operating expenses |
|
|
585 |
|
|
1,827 |
|
|
(1,242) |
|
Total operating costs and expenses |
|
|
133,757 |
|
|
97,909 |
|
|
35,848 |
|
Operating income |
|
|
107,930 |
|
|
99,287 |
|
|
8,643 |
|
Interest expense, net |
|
|
(634) |
|
|
(374) |
|
|
(260) |
|
Total other expense |
|
|
(634) |
|
|
(374) |
|
|
(260) |
|
Income before income tax expense |
|
|
107,296 |
|
|
98,913 |
|
|
8,383 |
|
Provision for income taxes |
|
|
(16,936) |
|
|
(12,961) |
|
|
(3,975) |
|
Net income |
|
|
90,360 |
|
|
85,952 |
|
|
4,408 |
|
Less: net (income) loss related to non-controlling interests |
|
|
(38,353) |
|
|
(43,521) |
|
|
5,168 |
|
Net income attributable to Solaris |
|
$ |
52,007 |
|
$ |
42,431 |
|
$ |
9,576 |
Revenue
System Rental Revenue. Our system rental revenue decreased $1.6 million, or 1%, to $142.0 million for the year ended December 31, 2019 compared to $143.6 million for the year ended December 31, 2018.
System Services Revenue. Our system services revenue increased $20.9 million, or 49%, to $63.9 million for the year ended December 31, 2019 compared to $43.0 million for the year ended December 31, 2018. System services revenue increased primarily due to an increase in services provided to coordinate proppant delivered into our systems.
Transloading Services Revenue. Our transloading services revenue increased $26.0 million, or 321%, to $34.1 million for the year ended December 31, 2019 compared to $8.1 million for the year ended December 31, 2018. The increase was primarily due to the recognition of $27.1 million of deferred revenue, partially offset by a decrease in the number of tons transloaded at our Kingfisher Facility. Deferred revenue consisted of a $26.0 partial termination payment
47
received in December 2018 in accordance with a contract modification which was accounted for prospectively and a final termination payment of $1.7 recorded as accounts receivable and recognized as revenue throughout the fourth quarter of 2019. The Company recognized the remaining $27.1 million of deferred revenue as revenue from transloading services in the year ended December 31, 2019 due to the full termination of the contract, resulting in no remaining deferred revenue as of December 31, 2019. The Company recognized $0.5 million of deferred revenue as Revenue from transloading services in the year ended December 31, 2018. We generally charge our customers a throughput fee for providing rail-to-truck transloading and high-efficiency sand silo storage and transloading services in relation to proppant and chemicals delivered to the Kingfisher Facility.
Operating Expenses
Total operating costs and expenses for the years ended December 31, 2019 and 2018 were $133.8 million and $97.9 million, respectively, which represented 55% and 50% of total revenue, respectively. Total operating costs and expenses increased year-over-year primarily as a result of the deployment of additional systems to our customers in early 2019 and services thereof, coupled with the related increase in depreciation and amortization expense. The fully utilized proppant system equivalent count of 110 for the year ended December 31, 2019 was relatively unchanged as compared to 111 for the year ended December 31, 2018. Total operating costs as a percentage of total revenue increased as a result of an increase in system services expense in relation to proppant delivery coordination services provided. Additional details regarding the changes in operating expenses are presented below.
Cost of System Rental (excluding depreciation and amortization). Cost of system rental increased $2.5 million, or 35%, to $9.7 million for the year ended December 31, 2019 compared to $7.2 million for the year ended December 31, 2018, excluding depreciation and amortization expense. Cost of system rental as a percentage of system rental revenue was 7% and 5% for the years ended December 31, 2019 and 2018, respectively. Cost of system rental increased primarily due to an increase in ad valorem and other fixed costs as a result of an increase in the number of systems that were added to our fleet. Repairs and maintenance costs also increased due to maintaining a larger fleet.
Cost of system rental including depreciation and amortization expense increased $9.9 million, or 45%, to $32.1 million for the year ended December 31, 2019 compared to $22.2 million for the year ended December 31, 2018. This increase was primarily attributable to the increase in in depreciation expense related to the additional systems that were manufactured and added to our fleet.
Cost of System Services (excluding depreciation and amortization). Cost of system services increased $24.1 million, or 48%, to $74.7 million for the year ended December 31, 2019 compared to $50.6 million for the year ended December 31, 2018. This increase was primarily due to an increase of $23.1 million in relation to services provided to coordinate proppant delivered to systems.
For the year ended December 31, 2019, the cost of system services as a percentage of system services revenue decreased to 117% compared to 118% the year ended December 31, 2018.
Cost of system services including depreciation and amortization expense increased $24.4 million, or 47%, to $76.3 million for the year ended December 31, 2019 compared to $51.9 million for the year ended December 31, 2018. This increase was primarily attributable to the factors mentioned above.
Cost of Transloading Services (excluding depreciation and amortization). Cost of transloading services increased $0.4 million, or 18% to $2.6 million for the year ended December 31, 2019 compared to $2.2 million for the year ended December 31, 2018, primarily due to increases in insurance, fuel, utilities and maintenance related to increased transloading services activity at our Kingfisher Facility.
Cost of transloading services including depreciation and amortization expense increased $1.0 million, or 31%, to $4.2 million for the year ended December 31, 2019 compared to $3.2 million for the year ended December 31, 2018, due to depreciation expense related to our transloading facility and equipment which commenced upon completion of the construction of the Kingfisher Facility in the third quarter of 2018.
48
Cost of Inventory Software Services (excluding depreciation and amortization). Cost of inventory software services, which decreased $0.2 million, or 25%, to $0.6 million for the year ended December 31, 2019 compared to $0.8 million for the year ended December 31, 2018 primarily includes labor and software subscription costs related to Railtronix inventory management software.
Cost of inventory software services including depreciation and amortization expense decreased $0.2 million, or 13%, to $1.4 million for the year ended December 31, 2019 compared to $1.6 million for the year ended December 31, 2018. This decrease was primarily attributable to the labor and software subscription costs. Amortization consists of customer relationships, a non-competition agreement and software acquired in the acquisition of Railtronix.
Depreciation and Amortization. Depreciation and amortization increased $8.5 million, or 46%, to $26.9 million for the year ended December 31, 2019 compared to $18.4 million for the year ended December 31, 2018. This increase was primarily attributable to additional depreciation expense related to additional systems that were manufactured and added to our fleet and our transloading facility and equipment placed in service in 2018.
Selling, General and Administrative Expenses (excluding depreciation and amortization). Selling, general and administrative expenses increased $1.8 million, or 11%, to $18.6 million for the year ended December 31, 2019 compared to $16.8 million for the year ended December 31, 2018 due primarily to an increase in stock-based compensation, salaries and bad debt expense.
Other Operating Expenses. Other operating expenses decreased $1.2 million, or 67% to $0.6 million for the year ended December 31, 2019 compared to the $1.8 million for the year ended December 31, 2018. Other operating expenses in the year ended December 31, 2019 primarily relate to $0.5 million loss on disposal of assets. Other operating expenses in the year ended December 31, 2018 were primarily related to certain performance-based cash awards totaling $1.7 million in connection with the purchase of Railtronix upon the achievement of certain financial milestones.
Provision for Income Taxes. During the year ended December 31, 2019, we recognized a combined United States federal and state provision for income taxes of $16.9 million, an increase of $4.0 million as compared to $13.0 million we recognized during the year ended December 31, 2018. This increase was attributable to higher operating income. The effective combined United States federal and state income tax rates were 15.8% and 13.1% for the years ended December 31, 2019 and 2018, respectively. For the years ended December 31, 2019 and 2018, our effective tax rate differed from the statutory rate primarily due to Solaris LLC’s passthrough treatment for United States federal income tax purposes.
Net Income
Net income increased $4.4 million, or 5% to $90.4 million for the year ended December 31, 2019 compared to $86.0 million for the year ended December 31, 2018, due to the changes in revenues and expenses discussed above.
Reconciliation of Non-GAAP Financial Measures
We view EBITDA and Adjusted EBITDA as important indicators of performance. We define EBITDA as net income, plus (i) depreciation and amortization expense, (ii) interest expense and (iii) income tax expense, including franchise taxes. We define Adjusted EBITDA as EBITDA plus (i) stock-based compensation expense and (ii) certain non-cash items and extraordinary, unusual or non-recurring gains, losses or expenses.
We believe that our presentation of EBITDA and Adjusted EBITDA will provide useful information to investors in assessing our financial condition and results of operations. Net income is the GAAP measure most directly comparable to EBITDA and Adjusted EBITDA. EBITDA and Adjusted EBITDA should not be considered alternatives to net income presented in accordance with GAAP. Because EBITDA and Adjusted EBITDA may be defined differently by other companies in our industry, our definitions of EBITDA and Adjusted EBITDA may not be comparable to similarly
49
titled measures of other companies, thereby diminishing their utility. The following table presents a reconciliation of Net income to EBITDA and Adjusted EBITDA for each of the periods indicated.
|
|
|
Year ended |
|
|
|
||||
|
|
|
December 31, |
|
|
|
||||
|
|
|
2019 |
|
2018 |
|
Change |
|||
|
|
|
(in thousands) |
|||||||
|
|
|
|
|
|
|
|
|
|
|
|
Net income |
|
$ |
90,360 |
|
$ |
85,952 |
|
$ |
4,408 |
|
Depreciation and amortization |
|
|
26,925 |
|
|
18,422 |
|
|
8,503 |
|
Interest expense, net |
|
|
634 |
|
|
374 |
|
|
260 |
|
Income taxes (1) |
|
|
16,936 |
|
|
12,961 |
|
|
3,975 |
|
EBITDA |
|
$ |
134,855 |
|
$ |
117,709 |
|
$ |
17,146 |
|
Stock-based compensation expense (2) |
|
|
4,476 |
|
|
2,920 |
|
|
1,556 |
|
Loss on disposal of assets |
|
|
463 |
|
|
153 |
|
|
310 |
|
Severance |
|
|
229 |
|
|
— |
|
|
229 |
|
Transload contract termination (3) |
|
|
(27,138) |
|
|
(522) |
|
|
(26,616) |
|
Non-recurring cash bonuses (4) |
|
|
— |
|
|
1,679 |
|
|
(1,679) |
|
IPO bonuses (5) |
|
|
— |
|
|
896 |
|
|
(896) |
|
Adjusted EBITDA |
|
$ |
112,885 |
|
$ |
122,835 |
|
$ |
(9,950) |
|
(1) |
Federal and state income taxes. |
|
(2) |
Represents stock-based compensation expense related to restricted stock awards of $4.5 million and $2.9 million in the years ended December 31, 2019 and 2018, respectively. |
|
(3) |
Deferred revenue related to full termination of a sand storage and transloading agreement; no deferred revenue balance remained as of December 31, 2019. |
|
(4) |
Certain performance-based cash awards paid in connection with the purchase of Railtronix upon the achievement of certain financial milestones. |
|
(5) |
Represents stock-based compensation expense related to restricted stock awards with one-year vesting of $0.9 million in the year ended December 31, 2018 that were granted to certain employees and consultants in connection with the IPO. |
Year Ended December 31, 2019 Compared to Year Ended December 31, 2018: EBITDA and Adjusted EBITDA
EBITDA increased $17.1 million to $134.9 million for the year ended December 31, 2019 compared to $117.7 million for the year ended December 31, 2018. Adjusted EBITDA decreased $9.9 million to $112.9 million for the year ended December 31, 2019 compared to $122.8 million for the year ended December 31, 2018. EBITDA and Adjusted EBITDA increased 15% and decreased 8%, respectively, for the year ended December 31, 2019 compared to the year ended December 31, 2018. The increase in EBITDA and decrease in Adjusted EBITDA were primarily due to the changes in revenues and expenses discussed above.
50
Liquidity and Capital Resources
Overview
Our primary sources of liquidity to date have been capital contributions from our founding investors, cash flows from operations, borrowings under our credit agreements and proceeds from the IPO and a November 2017 offering. Our primary uses of capital have been capital expenditures to expand our proppant and chemical management system fleets, construct the Kingfisher Facility, acquire our manufacturing facility and certain intellectual property, acquire the assets of Railtronix, pay dividends and buyback stock. We strive to maintain financial flexibility and proactively monitor potential capital sources, including equity and debt financing, to meet our investment and target liquidity requirements and to permit us to manage the cyclicality associated with our industry.
On October 9, 2018, Solaris Inc. filed a universal shelf registration statement on Form S-3 (the “Universal Shelf”) with the SEC. Under the Universal Shelf, Solaris Inc. may offer and sell up to $500 million of Class A common stock, preferred stock, debt securities or any combination of such securities during the three-year period that commenced upon the Universal Shelf becoming effective on October 16, 2018. Additionally, certain stockholders of the Company (the “Selling Stockholders”) may offer and sell up to an aggregate of 18,366,612 shares of Class A common stock under the Universal Shelf. Under the Universal Shelf, Solaris Inc. may periodically offer one or more types of securities in amounts, at prices and on terms announced, if and when the securities are ever offered. Solaris Inc. will not receive any proceeds, if any, from the sale of shares of Class A common stock by the Selling Stockholders. Alternatively, the Selling Stockholders from time to time may sell shares of Class A common stock pursuant to an exemption under Rule 144 of the Securities Act.
We intend to finance most of our capital expenditures, contractual obligations and working capital needs with our current cash balance, cash generated from future operations and borrowings under our 2019 Credit Agreement (as defined in “—Debt Agreements”). We continuously evaluate our capital expenditures and the amount we ultimately spend will depend on a number of factors, including expected industry activity levels and company initiatives. We believe that our operating cash flow and available borrowings under our 2019 Credit Agreement will be sufficient to fund our operations for at least the next 12 months.
As of December 31, 2019, cash and cash equivalents totaled $66.9 million.
Cash Flows
The following table summarizes our cash flows for the periods indicated:
|
|
|
Year Ended |
|
|
|
||||
|
|
|
December 31, |
|
Change |
|||||
|
|
|
2019 |
|
2018 |
|
2019 vs. 2018 |
|||
|
|
|
(in thousands) |
|||||||
|
Net cash provided by operating activities |
|
$ |
114,871 |
|
$ |
116,365 |
|
$ |
(1,494) |
|
Net cash used in investing activities |
|
|
(34,002) |
|
|
(160,545) |
|
|
126,543 |
|
Net cash provided by (used in) financing activities |
|
|
(39,044) |
|
|
5,816 |
|
|
(44,860) |
|
Net change in cash |
|
$ |
41,825 |
|
$ |
(38,364) |
|
$ |
80,189 |
Analysis of Cash Flow Changes for Year Ended December 31, 2019 Compared to Year Ended December 31, 2018
Operating Activities. Net cash provided by operating activities was $114.9 million for the year ended December 31, 2019, compared to net cash provided by operating activities of $116.4 million for the year ended December 31, 2018. The decrease of $1.5 million in operating cash flow was primarily attributable to the changes in working capital items.
Investing Activities. Net cash used in investing activities was $34.0 million for the year ended December 31, 2019, compared to $160.5 million for the year ended December 31, 2018. The decrease in investing activities of $126.5 million is primarily due to a decrease in the manufacturing rate of new proppant systems and completion of construction of the Kingfisher Facility in the third quarter of 2018. For the year ended December 31, 2019, $34.9 million of investing
51
activities were capital expenditures related to manufacturing new systems, including work in process offset by a $0.7 million decrease in vehicles due to sales of light duty vehicles. For the year ended December 31, 2018, $143.0 million of investing activities were capital expenditures related to manufacturing new systems, $14.9 million related to the construction of our Kingfisher Facility and $3.7 million related to the purchase of light duty vehicles to support the service of our systems.
Financing Activities. Net cash used in financing activities of $39.0 million for the year ended December 31, 2019, was primarily related to quarterly dividends of $19.3 million, $13.0 million to repay borrowings under the 2019 Credit Agreement (as defined in “—Debt Agreements”), $3.2 million for payments under the share repurchase program, $2.5 million for payments under insurance premium financing and $1.1 million of payments related to the vesting stock-based compensation. Net cash provided by financing activities of $5.8 million for the year ended December 31, 2018 was primarily related to $13.0 million in proceeds from borrowings under the 2018 Credit Agreement (as defined in “—Debt Agreements”), partially offset by $4.7 million related to cash dividend and distributions paid, $1.3 million of payments related to insurance premium financing, $1.1 million of payments related to vesting of stock-based compensation and $1.0 million of debt issuance costs in connection with the 2018 Credit Agreement.
Debt Agreements
Senior Secured Credit Facility
On April 26, 2019, Solaris LLC entered into an Amended and Restated Credit Agreement (the “2019 Credit Agreement”) by and among Solaris LLC, as borrower, each of the lenders party thereto and Wells Fargo Bank, National Association, as administrative agent. The 2019 Credit Agreement replaced, in its entirety, the Company’s Amended and Restated Credit Agreement, dated as of January 19, 2018, by and among the Company, as borrower, each of the lender party thereto and Woodforest National Bank, as administrative agent (the “2018 Credit Agreement”). The 2019 Credit Agreement consists of an initial $50.0 million revolving loan commitment (the “Loan”) with a $25.0 million uncommitted accordion option to increase the Loan availability to $75.0 million. The term of the 2019 Credit Agreement expires on April 26, 2022.
Our obligations under the Loan are generally secured by a pledge of substantially all of the assets of Solaris LLC and its subsidiaries, and such obligations are guaranteed by Solaris LLC’s domestic subsidiaries other than Immaterial Subsidiaries (as defined in the 2019 Credit Agreement). We have the option to prepay the loans at any time without penalty.
Borrowings under the 2019 Credit Agreement bear interest at either LIBOR or an alternate base rate plus an applicable margin, and interest is payable quarterly. The applicable margin ranges from 1.75% to 2.50% for Eurodollar loans and 0.75% to 1.50% for alternate base rate loans, in each case depending on our total leverage ratio. The 2019 Credit Agreement requires that we pay a quarterly commitment fee on undrawn amounts of the Loan, ranging from 0.25% to 0.375% depending upon the total leverage ratio.
The 2019 Credit Agreement requires that we maintain ratios of (a) consolidated EBITDA to interest expense of not less than 2.75 to 1.00, (b) senior indebtedness to consolidated EBITDA of not more than 2.50 to 1.00 and (c) the sum of 100% of eligible accounts, inventory and fixed assets to the total revolving exposure of not less than 1.00 to 1.00 when the total leverage ratio is greater than 2.00 to 1.00 and total revolving exposure under the Loan exceeds $3.0 million. For the purpose of these tests, certain items are subtracted from indebtedness and senior indebtedness. EBITDA, as defined in the 2019 Credit Agreement, excludes certain noncash items and any extraordinary, unusual or non-recurring gains, losses or expenses.
The 2019 Credit Agreement also requires that we prepay any outstanding borrowings under the Loan in the event our total leverage ratio is greater than 1.00 to 1.00 and our consolidated cash balance exceeds $20.0 million, taking into account certain adjustments. Capital expenditures are not restricted unless borrowings under the Loan exceed $5.0 million for any 180 consecutive day period, in which case capital expenditures will be permitted up to $100.0 million plus any unused availability for capital expenditures from the immediately preceding fiscal year.
52
As of December 31, 2019, we had no borrowings under the 2019 Credit Agreement outstanding and ability to draw $50.0 million.
As of December 31, 2019, we were in compliance with all covenants in accordance with the 2019 Credit Agreement.
Contractual Obligations
The table below provides estimates of the timing of future payments that we are contractually obligated to make based on agreements in place at December 31, 2019.
|
|
|
For the Year Ending December 31, |
|||||||||||||||||||
|
|
|
2020 |
|
2021 |
|
2022 |
|
2023 |
|
2024 |
|
Thereafter |
|
Total |
|||||||
|
|
|
(in thousands) |
|||||||||||||||||||
|
Operating lease obligations (1) |
|
$ |
1,116 |
|
$ |
1,060 |
|
$ |
1,091 |
|
$ |
1,100 |
|
$ |
1,108 |
|
$ |
8,354 |
|
$ |
13,829 |
|
Finance lease obligations (2) |
|
|
35 |
|
|
33 |
|
|
33 |
|
|
33 |
|
|
33 |
|
|
11 |
|
|
178 |
|
Commitment fees on Revolving Loan (3) |
|
|
125 |
|
|
125 |
|
|
40 |
|
|
— |
|
|
— |
|
|
— |
|
|
290 |
|
Purchase commitments (4) |
|
|
1,417 |
|
|
1,158 |
|
|
— |
|
|
— |
|
|
— |
|
|
— |
|
|
2,575 |
|
Other commitments |
|
|
274 |
|
|
255 |
|
|
37 |
|
|
2 |
|
|
|
|
|
|
|
|
568 |
|
Total |
|
$ |
2,967 |
|
$ |
2,631 |
|
$ |
1,201 |
|
$ |
1,135 |
|
$ |
1,141 |
|
$ |
8,365 |
|
|
17,440 |
|
(1) |
Operating lease obligations are related to our 30-year land lease with the State of Oklahoma related to the Company's Kingfisher Facility, as well as other office, land and equipment leases. |
|
(2) |
Finance lease obligations are related to our finance lease of a building at our Early, Texas manufacturing facility with the City of Early and leases of certain office equipment with purchase options upon the end of lease terms which are accounted for as finance leases with various expiration dates. |
|
(3) |
Commitment fees on our Revolving Loan were calculated based on the unused portion of lender commitments, at the applicable commitment fee rate of 0.25%. See Note 8. “Senior Secured Credit Facility” to our consolidated financial statements as of December 31, 2019 for interest requirements per the 2019 Credit Agreement. |
|
(4) |
Purchase commitments primarily relate to our agreement with our suppliers for material and parts purchases to be used in the manufacturing of our systems. The purchase commitments represent open purchase orders to our suppliers. |
As of December 31, 2019, our liability under the Tax Receivable Agreement was $68.0 million, representing 85% of the calculated net cash savings in United States federal, state and local income tax or franchise tax that Solaris Inc. anticipates realizing in future years.
Income Taxes
Solaris Inc. is a corporation and, as a result, is subject to United States federal, state and local income taxes. For the years ended December 31, 2019, 2018 and 2017, we recognized a combined United States federal and state provision for income taxes of $16.9 million, $13.0 million and $33.7 million, respectively.
On December 22, 2017, the United States government enacted the Tax Act. The change in tax law required us to remeasure existing net deferred tax assets using the now lower United States federal corporate income tax rate in the period of enactment, resulting in an income tax expense of approximately $30.4 million to reflect these changes in the year ended December 31, 2017.
53
Solaris LLC is treated as a partnership for United States federal income tax purposes and therefore does not pay federal income tax on its taxable income. Instead, the Solaris LLC members are liable for federal income tax on their respective shares of the Company’s taxable income reported on the members’ United States federal income tax returns.
Our revenues are derived through transactions in several states, which may be subject to state and local taxes. Accordingly, we have recorded a liability for state and local taxes that management believes is adequate for activities as of December 31, 2019 and 2018.
We are subject to a franchise tax imposed by the State of Texas. The franchise tax rate is 1%, calculated on taxable margin. Taxable margin is defined as total revenue less deductions for cost of goods sold or compensation and benefits in which the total calculated taxable margin cannot exceed 70% of total revenue. Expenses related to Texas franchise tax were approximately $742,000, $684,000 and $247,000 for the years ended December 31, 2019, 2018 and 2017, respectively.
We determine deferred tax assets and liabilities on the basis of the differences between the book value and tax bases of assets and liabilities by using enacted tax rates in effect for the year in which the differences are expected to reverse. The effect of a change in tax rates on deferred tax assets and liabilities is recognized in income in the period in which the enactment date occurs.
We recognize deferred tax assets to the extent we believe these assets are more-likely-than-not to be realized. In making such a determination, we consider all available positive and negative evidence, including future reversals of existing taxable temporary differences, projected future taxable income, tax planning strategies and recent results of operations.
We record uncertain tax positions on the basis of a two-step process in which (1) we determine whether it is more-likely-than-not the tax positions will be sustained on the basis of the technical merits of the position and (2) for those tax positions meeting the more-likely-than-not recognition threshold, we recognize the largest amount of tax benefit that is more than 50% likely to be realized upon ultimate settlement with the related tax authority. For the year ended December 31, 2019, the Company has recorded an uncertain tax benefit for the treatment of certain costs incurred in connection with the IPO and a November offering.
Interest and penalties related to income taxes are included in the benefit (provision) for income taxes in our consolidated statement of operations. We have not incurred any significant interest or penalties related to income taxes in any of the periods presented.
Payables Related to the Tax Receivable Agreement
In connection with the IPO, Solaris Inc. entered into the Tax Receivable Agreement with the TRA Holders on May 17, 2017. This agreement generally provides for the payment by Solaris Inc. to each TRA Holder of 85% of the net cash savings, if any, in United States federal, state and local income tax or franchise tax that Solaris Inc. actually realizes (computed using simplifying assumptions to address the impact of state and local taxes) or is deemed to realize in certain circumstances in periods after the IPO as a result of (i) certain increases in tax basis that occur as a result of Solaris Inc.’s acquisition (or deemed acquisition for United States federal income tax purposes) of all or a portion of such TRA Holder's Solaris LLC Units in connection with the IPO or pursuant to the exercise of the Redemption Right or the Call Right (each as defined in the “Solaris LLC Agreement”) and (ii) imputed interest deemed to be paid by Solaris Inc. as a result of, and additional tax basis arising from, any payments Solaris Inc. makes under the Tax Receivable Agreement. Solaris Inc. will retain the benefit of the remaining 15% of these cash savings.
See Note 10. “Income Taxes” to our consolidated financial statements for additional information.
Critical Accounting Policies and Estimates
The preparation of financial statements requires the use of judgments and estimates. Our critical accounting policies are described below to provide a better understanding of how we develop our assumptions and judgments about future events and related estimates and how they can impact our financial statements. A critical accounting estimate is one that
54
requires our most difficult, subjective or complex estimates and assessments and is fundamental to our results of operations.
We base our estimates on historical experience and on various other assumptions we believe to be reasonable according to the current facts and circumstances, the results of which form the basis for making judgments about the carrying values of assets and liabilities that are not readily apparent from other sources. We believe the following are the critical accounting policies used in the preparation of our combined financial statements, as well as the significant estimates and judgments affecting the application of these policies. This discussion and analysis should be read in conjunction with our consolidated financial statements and related notes included in this report.
Revenue Recognition
In determining the appropriate amount of revenue to be recognized as we fulfill our obligations under the agreement, the following steps must be performed at contract inception: (i) identification of the promised goods or services in the contract; (ii) determination of whether the promised goods or services are performance obligations, including whether they are distinct in the context of the contract; (iii) measurement of the transaction price, including the constraint on variable consideration; (iv) allocation of the transaction price to the performance obligations; and (v) recognition of revenue when (or as) we satisfy each performance obligation. For contracts that contain multiple performance obligations, we allocate the transaction price to each performance obligation identified in the contract based on relative standalone prices, or estimates of such prices, and recognize the related revenue as each individual service is performed, in satisfaction of the corresponding performance obligations.
Revenues from system rental consist primarily of fixed monthly fees charged to customers for the use of our patented mobile proppant management systems that unload, store and deliver proppant and chemicals at oil and natural gas well sites which is considered to be our performance obligation. Contracts with customers are typically on thirty- to sixty-day payment terms. Revenues are recognized over time as the performance obligations are satisfied under the terms of the customer contract. We determined that the performance obligation is satisfied over time as the customer simultaneously receives and consumes the benefits provided by the entity’s performance of services, typically as our systems are used by the customer. We measure progress using an input method based on resources consumed or expended relative to the total resources expected to be consumed or expended. We typically charge our customers for the rental of our systems on a monthly basis under agreements requiring the rental of a minimum number of systems for a period of twelve months. The Company is typically entitled to short fall payments if such minimum contractual obligations are not maintained by our customers. Minimum contractual obligations have been maintained and thus the Company has not recognized revenues related to shortfalls on such take or pay contractual obligations to date.
Revenues from system services consist primarily of the fees charged to customers for services including mobilization and transportation of our systems, field supervision and support and services coordinating proppant delivery to systems, each of which are considered to be separate performance obligations. Contracts with customers are typically on thirty- to sixty-day payment terms. When the Company provides system services including field supervision and support, we determined that the performance obligation is satisfied over time as the customer simultaneously receives and consumes the benefits provided by the entity’s performance of the services, typically based on fixed weekly or monthly contractual rates for field supervision and support and when the Company provides services coordinating proppant delivery. We measure progress using an input method based on resources consumed or expended relative to the total resources expected to be consumed or expended. When the Company provides mobilization and transportation of our systems on behalf of our customers, we determined that the performance obligation is satisfied at a point in time when the system has reached its intended destination.
Revenues from transloading services consist primarily of the fees charged to customers for transloading proppant at our transloading facility, which is considered to be our performance obligation. Transloading services operations commenced in January 2018. We primarily provide rail-to-truck transloading and high-efficiency sand silo storage and transloading services at the facility. Contracts with customers are typically on thirty- to sixty-day payment terms. Revenues are typically recognized over time as the customer simultaneously receives and consumes the benefits provided by the entity’s performance of the transloading service based on a throughput fee per ton rate for proppant delivered to and transloaded at the facility. We measure progress based on the proppant delivered and transloaded at the facility. Under our agreements at the facility, quarterly minimum throughput volumes are required and the Company is
55
entitled to short fall payments if such minimum quarterly contractual obligations are not maintained. These shortfalls are based on fixed minimum volumes at a fixed rate and are recognized over time as throughput volumes transloaded are below minimum throughput volumes required. The Company recorded $1.3 million of shortfall revenue during the year ended December 31, 2019.
Revenues from inventory software services consist primarily of the fees charged to customers for the use of our Railtronix inventory management software, which is considered to be our performance obligation. Revenues are recognized over time as the customer simultaneously receives and consumes the benefits provided by the entity’s performance based on a throughput fee to monitor proppant that is loaded into a railcar, stored at a transload facility or loaded into a truck.
Deferred Revenue
Deferred revenue consisted of a $26.0 million partial termination payment received in December 2018 in accordance with a contract modification which was accounted for prospectively and a final termination of $1.7 million recorded as accounts receivable in November 2019 and recognized as revenue throughout the fourth quarter of 2019. The termination payments represented the distinct unsatisfied portion of a contract to provide transloading services and were considered part of the transaction price and were allocated to the remaining performance obligations under the contract, which was fully settled as of December 31, 2019. The Company recognized $27.1 million of deferred revenue as Revenue from transloading services in the year ended December 31, 2019, resulting in no remaining deferred revenue as of December 31, 2019. The Company recognized $0.5 million of deferred revenue as Revenue from transloading services in the year ended December 31, 2018, resulting in $25.5 million remaining deferred revenue as of December 31, 2018
Property, Plant and Equipment
Property, plant and equipment are stated at cost, or fair value for assets acquired, less accumulated depreciation. Depreciation is computed using the straight-line method over the estimated useful service lives of the assets. Systems that are in the process of being manufactured are considered property, plant and equipment. However, the systems in process do not depreciate until they are fully completed. Systems in process are a culmination of material, labor and overhead.
The costs of ordinary repairs and maintenance are charged to expense as incurred, while significant enhancements, including upgrades or overhauls, are capitalized. These enhancements include upgrades to various components of the system and to equipment at our manufacturing facility that will either extend the life or improve the utility and efficiency of the systems, plant and equipment. These enhancements include:
|
· |
The patented Solaris Lens inventory management system enables our customers to track inventory levels in, and delivery rates from, each silo in a system. This upgrade improves our customers’ operational efficiencies and reduces operating and supply chain costs by allowing the customer to better manage proppant and chemical inventory levels both onsite and remotely. |
|
· |
Our patented Auto Hopper technology is being added to our proppant systems and is compatible with standard pressure pumping company’s equipment. The technology uses sensors and machine learning to automatically control the amount of sand delivered from our mobile proppant management system silos to the blender, eliminating the need for dedicated personnel historically required to run our system. |
|
· |
Our patent-pending mobile chemical management system can store and deliver up to six different chemicals with significantly improved inventory control, in a smaller footprint and with less personnel when compared to traditional chemical handling methods. |
|
· |
Our patent-pending non-pneumatic loading option provides additional proppant transportation flexibility for our customers, allowing them to use belly-dump trucks in addition to the industry standard pneumatic trucks to fill and maintain inventory in our proppant management systems. This patent-pending non-pneumatic loading option is compatible with our existing fleet with minimal modification. |
56
|
· |
Manufacturing plant improvements include upgrades to overhead cranes and the addition of new column bays and trunnions that improve the manufacturing flow, as well as improvements in the paint booths. These improvements increase productivity by reducing labor hours, while improving safety. |
The determination of whether an expenditure should be capitalized or expensed requires management judgment in the application of how the costs benefit future periods, relative to our capitalization policy. Costs that increase the value or materially extend the life of the asset are capitalized and depreciated over the remaining useful life of the asset. When property and equipment are sold or retired, the cost and related accumulated depreciation are removed from the accounts and any gain or loss is reflected in the consolidated statements of operations.
Allocation of Purchase Price in Business Combinations
As part of our business strategy, we regularly pursue acquisitions and business development opportunities. The purchase price in an acquisition is allocated to the assets acquired and liabilities assumed based on their fair values as of the closing date, which may occur many months after the announcement date. The excess of the purchase price over the amount allocated to the assets and liabilities, if any, is recorded as goodwill. We use all available information to estimate fair values including quoted market prices, the carrying value of acquired assets, and widely accepted valuation techniques such as discounted cash flows. Our most significant estimates in our allocation typically relate to the value assigned to property, plant and equipment, intangible assets and goodwill. The judgments made in determining the estimated fair value assigned to each class of assets acquired and liabilities assumed, as well as asset lives, could materially impact our results of operations.
Impairment of Long-Lived and Other Intangible Assets
Long-lived assets, which include property, plant and equipment and identified intangible assets, comprise a significant amount of our total assets. We make judgments and estimates in conjunction with the carrying value of these assets, including amounts to be capitalized, depreciation and amortization methods, estimated useful lives and impairment.
The carrying values of these assets are reviewed for impairment whenever events or changes in circumstances indicate that the carrying amounts may not be recoverable. An impairment loss is recorded in the period in which it is determined that the carrying amount is not recoverable based on estimated future undiscounted cash flows. We estimate the fair value of these intangible and fixed assets using an income approach. This requires us to make long-term forecasts of its future revenues and costs related to the assets subject to review. These forecasts require assumptions about demand for the Company’s products and services, future market conditions and technological developments. The financial and credit market volatility directly impacts our fair value measurement through our income forecast. Although we have made our best estimates of these factors based on current conditions, it is reasonably possible that changes could occur in the near term, including, but not limited to: sustained declines in worldwide rig counts below current analysts’ forecasts, collapse of spot and futures prices for oil and natural gas, significant deterioration of external financing for our customers, higher risk premiums or higher cost of equity, or any other significant adverse economic news, which could adversely affect our estimates requiring a provision for impairment.
There was no impairment for the years ended December 31, 2019, 2018 and 2017.
Leases
The Company adopted Financial Accounting Standards Board (“FASB”) Accounting Standards Codification (“ASC”) Topic 842, Leases (“ASC Topic 842”) effective January 1, 2019. The Company applied ASC Topic 842 to all leases existing at or commencing after January 1, 2019 and elected the package of transition practical expedients for expired or existing contracts, which does not require reassessment of: (1) whether any of our contracts are or contain leases, (2) lease classification and (3) initial direct costs. The Company also elected the practical expedient to adopt the new lease requirements through a cumulative effect adjustment in the period of adoption and did not adjust comparative periods. As a result of the adoption of ASC Topic 842 on January 1, 2019, the Company recorded operating right-of-use (“ROU”) assets of $8,503, operating lease liabilities of $9,016 and a cumulative effect adjustment to retained earnings for operating leases of $532.
57
We determine if an arrangement is a lease at inception. The Company made the election to not apply the recognition requirements in ASC Topic 842 to short-term leases (i.e., leases of twelve months or less). Instead, the Company recognizes the lease payments in profit or loss on a straight-line basis over the lease term. Operating leases are included in operating lease ROU assets, current portion of operating lease liabilities, and operating lease liabilities, net of current in the Company’s consolidated balance sheets. Finance leases are included in property and equipment, current portion of finance lease liabilities, and finance lease liabilities, net of current in the Company’s consolidated balance sheets.
ROU assets represent the Company’s right to use an underlying asset for the lease term and lease liabilities represent our obligation to make lease payments arising from the lease. ROU assets and liabilities are recognized at the commencement date based on the present value of lease payments over the lease term. As most of the Company’s leases do not provide an implicit rate, we use our incremental borrowing rate in determining the present value of lease payments based on the information available at the commencement date. Our incremental borrowing rate reflects the estimated rate of interest that we would pay to borrow on a collateralized basis over a similar term an amount equal to the lease payments in a similar economic environment. We use the implicit rate when readily determinable. The ROU asset also includes any lease payments made and excludes lease incentives received. The Company’s lease terms may include options to extend or terminate the lease when it is reasonably certain that we will exercise that option. Lease expense for lease payments is recognized on a straight-line basis over the lease term.
Goodwill
Goodwill represents the excess of the purchase price of acquisitions, or fair value of contributed assets, over the fair value of the net assets acquired and consists of synergies in combining operations and other intangible assets which do not qualify for separate recognition. We evaluate goodwill for impairment annually, as of October 31, or more often as facts and circumstances warrant. The recoverability of the carrying value is assessed based on expected future profitability and undiscounted future cash flows of the acquisitions and their contribution to our overall operations. These types of analyses contain uncertainties because they require us to make judgments and assumptions regarding future profitability, industry factors, planned strategic initiatives, discount rates and other factors. Events or circumstances which could indicate a potential impairment include (but are not limited to) a significant sustained reduction in worldwide oil and natural gas prices or drilling; a significant sustained reduction in profitability or cash flow of oil and natural gas companies or drilling contractors; a sustained reduction in the market capitalization of the Company; a significant sustained reduction in capital investment by drilling companies and oil and natural gas companies; or a significant sustained increase in worldwide inventories of oil or natural gas. There was no impairment for years ended December 31, 2019, 2018 and 2017.
Stock-Based Awards
We follow the fair value recognition provisions in accordance with GAAP. Under the fair value recognition provisions, stock-based compensation cost is measured at the grant date based on the fair value of the award and is amortized to compensation expense on a straight-line basis over the awards’ vesting period, which is generally the requisite service period. We have historically and consistently calculated fair value using the Black-Scholes option-pricing model. This valuation approach involves significant judgments and estimates, including estimates regarding our future operations, price variation and the appropriate risk-free rate of return. Our estimates of these variables are made for the purpose of using the valuation model to determine an expense for each reporting period and are not subsequently adjusted. We recognize expense related to the estimated vesting of our performance share units granted.
Income Taxes
We routinely evaluate the realizability of our deferred tax assets by assessing the likelihood that our deferred tax assets will be recovered based on all available positive and negative evidence, including scheduled reversals of deferred tax liabilities, estimates of future taxable income, tax planning strategies and results of operations. Estimating future taxable income is inherently uncertain and requires judgment. In projecting future taxable income, we consider our historical results and incorporate certain assumptions, including revenue growth and operating margins, among others. As of December 31, 2019 and 2018, we had $51.4 million and $58.1 million of deferred tax assets, respectively. We expect to realize future tax benefits related to the utilization of these assets. If we determine in the future that we will not be able to fully utilize all or part of these deferred tax assets, we would record a valuation allowance through earnings in
58
the period the determination was made, which would have an adverse effect on our results of operations and earnings in future periods.
On December 22, 2017, the Tax Act was enacted into law. The provisions of the Tax Act that impact us include, but are not limited to, (1) reducing the United States federal corporate income tax rate from 35% to 21%, (2) eliminating the corporate alternative minimum tax (AMT); (3) allowing businesses to immediately expense the cost of new investments in certain qualified depreciable assets acquired after September 27, 2017 (with a phase-down of such expensing starting in 2023), and, (4) reducing the maximum deduction for net operating loss (NOL) carryforwards generated in tax years beginning after December 31, 2017, to 80% of a taxpayer’s taxable income.
Payables Related to the Tax Receivable Agreement
As described in Note 10. “Income Taxes” to our consolidated financial statements, Solaris Inc. is a party to the Tax Receivable Agreement under which it is contractually committed to pay the TRA Holders 85% of the calculated net cash savings in United States federal, state and local income tax and franchise tax that Solaris Inc. anticipates realizing in future years from certain increases in tax basis and certain tax benefits attributable to imputed interest as a result of Solaris Inc.’s acquisition (or deemed acquisition for United States federal income tax purposes) of Solaris LLC Units in connection with the IPO or pursuant to an exercise of the Redemption Right or the Call Right (each as defined in the Solaris LLC Agreement).
The projection of future taxable income involves significant judgment. Actual taxable income may differ from our estimates, which could significantly impact the liability relating to the Tax Receivable Agreement. We have determined it is more-likely-than not that we will be able to utilize all of our deferred tax assets subject to the Tax Receivable Agreement; therefore, we have recorded a liability under the Tax Receivable Agreement related to the tax savings Solaris Inc. may realize from certain increases in tax basis and certain tax benefits attributable to imputed interest as a result of Solaris Inc.’s acquisition (or deemed acquisition for United States federal income tax purposes) of Solaris LLC Units in connection with the IPO or pursuant to an exercise of the Redemption Right or the Call Right (each as defined in the Solaris LLC Agreement). If we determine the utilization of these deferred tax assets is not more-likely-than-not in the future, our estimate of amounts to be paid under the Tax Receivable Agreement would be reduced. In this scenario, the reduction of the liability under the Tax Receivable Agreement would result in a benefit to our consolidated statement of operations.
Recent Accounting Pronouncements
See Note 2. “Summary of Significant Accounting Policies — Recently Accounting Pronouncements” to our consolidated financial statements as of December 31, 2019 and 2018, for a discussion of recent accounting pronouncements.
Under the JOBS Act, we meet the definition of an “emerging growth company,” which allows us to have an extended transition period for complying with new or revised accounting standards pursuant to Section 107(b) of the JOBS Act, however we elected to opt out of such exemption (this election is irrevocable).
Off Balance Sheet Arrangements
We have no material off balance sheet arrangements. As such, we are not materially exposed to any financing, liquidity, market or credit risk that could arise if we had engaged in such financing arrangements.
Item 7A. Quantitative and Qualitative Disclosures about Market Risk
Market risk is the risk of loss arising from adverse changes in market rates and prices. Currently, our market risks relate to potential changes in the fair value of our long-term debt due to fluctuations in applicable market interest rates. Going forward our market risk exposure generally will be limited to those risks that arise in the normal course of business, as we do not engage in speculative, non-operating transactions, nor do we utilize financial instruments or derivative instruments for trading purposes.
59
Commodity Price Risk
The market for our services is indirectly exposed to fluctuations in the prices of crude oil and natural gas to the extent such fluctuations impact drilling and completion activity levels and thus impact the activity levels of our customers in the exploration and production and oilfield services industries. We do not currently intend to hedge our indirect exposure to commodity price risk.
Interest Rate Risk
We are subject to interest rate risk on a portion of our long-term debt under the 2019 Credit Agreement. As of December 31, 2019, however, we had no outstanding borrowings under our Revolving Credit Agreement and therefore a change in interest rates as of such date would not have resulted in increased or decreased interest expense.
Credit Risk
The majority of our accounts receivable have payment terms of 60 days or less. As of December 31, 2019, two customers collectively accounted for 24% of our total accounts receivable. As of December 31, 2018, three customers collectively accounted for 40% of our total accounts receivable. We mitigate the associated credit risk by performing credit evaluations and monitoring the payment patterns of our customers.
60
Item 8. Financial Statements and Supplementary Data
The following Consolidated Financial Statements are filed as part of this Annual Report on Form 10-K:
Solaris Oilfield Infrastructure, Inc.
61
Report of Independent Registered Public Accounting Firm
Shareholders and Board of Directors
Solaris Oilfield Infrastructure, Inc.
Houston, Texas
Opinion on the Consolidated Financial Statements
We have audited the accompanying consolidated balance sheets of Solaris Oilfield Infrastructure, Inc. (the “Company”) as of December 31, 2019 and 2018, the related consolidated statements of operations, changes in stockholders’ and members’ equity, and cash flows for each of the three years in the period ended December 31, 2019, and the related notes (collectively referred to as the “consolidated financial statements”). In our opinion, the consolidated financial statements present fairly, in all material respects, the financial position of the Company at December 31, 2019 and 2018, and the results of their operations and their cash flows for each of the three years in the period ended December 31, 2019, in conformity with accounting principles generally accepted in the United States of America.
Basis for Opinion
These consolidated financial statements are the responsibility of the Company’s management. Our responsibility is to express an opinion on the Company’s consolidated financial statements based on our audits. We are a public accounting firm registered with the Public Company Accounting Oversight Board (United States) (“PCAOB”) and are required to be independent with respect to the Company in accordance with the U.S. federal securities laws and the applicable rules and regulations of the Securities and Exchange Commission and the PCAOB.
We conducted our audits in accordance with the standards of the PCAOB. Those standards require that we plan and perform the audit to obtain reasonable assurance about whether the consolidated financial statements are free of material misstatement, whether due to error or fraud. The Company is not required to have, nor were we engaged to perform, an audit of its internal control over financial reporting. As part of our audits we are required to obtain an understanding of internal control over financial reporting but not for the purpose of expressing an opinion on the effectiveness of the Company’s internal control over financial reporting. Accordingly, we express no such opinion.
Our audits included performing procedures to assess the risks of material misstatement of the consolidated financial statements, whether due to error or fraud, and performing procedures that respond to those risks. Such procedures included examining, on a test basis, evidence regarding the amounts and disclosures in the consolidated financial statements. Our audits also included evaluating the accounting principles used and significant estimates made by management, as well as evaluating the overall presentation of the consolidated financial statements. We believe that our audits provide a reasonable basis for our opinion.
/s/ BDO USA, LLP
We have served as the Company's auditor since 2017.
Houston, Texas
February 18, 2020
62
SOLARIS OILFIELD INFRASTRUCTURE, INC.
(in thousands)
|
|
|
December 31, |
|
December 31, |
||
|
|
|
2019 |
|
2018 |
||
|
|
|
|
|
|
||
|
Assets |
|
|
|
|
|
|
|
Current assets: |
|
|
|
|
|
|
|
Cash and cash equivalents |
|
$ |
66,882 |
|
$ |
25,057 |
|
Accounts receivable, net |
|
|
38,554 |
|
|
39,746 |
|
Prepaid expenses and other current assets |
|
|
5,002 |
|
|
5,492 |
|
Inventories |
|
|
7,144 |
|
|
10,470 |
|
Total current assets |
|
|
117,582 |
|
|
80,765 |
|
Property, plant and equipment, net |
|
|
306,583 |
|
|
296,538 |
|
Operating lease right-of-use assets |
|
|
7,871 |
|
|
— |
|
Goodwill |
|
|
17,236 |
|
|
17,236 |
|
Intangible assets, net |
|
|
3,761 |
|
|
4,540 |
|
Deferred tax assets, net |
|
|
51,414 |
|
|
58,074 |
|
Other assets |
|
|
625 |
|
|
1,454 |
|
Total assets |
|
$ |
505,072 |
|
$ |
458,607 |
|
Liabilities and Stockholders' Equity |
|
|
|
|
|
|
|
Current liabilities: |
|
|
|
|
|
|
|
Accounts payable |
|
$ |
3,824 |
|
$ |
9,127 |
|
Accrued liabilities |
|
|
14,447 |
|
|
12,658 |
|
Current portion of payables related to Tax Receivable Agreement |
|
|
1,416 |
|
|
— |
|
Current portion of deferred revenue |
|
|
— |
|
|
12,990 |
|
Current portion of operating lease liabilities |
|
|
596 |
|
|
— |
|
Current portion of finance lease liabilities |
|
|
30 |
|
|
35 |
|
Other current liabilities |
|
|
74 |
|
|
515 |
|
Total current liabilities |
|
|
20,387 |
|
|
35,325 |
|
Senior secured credit facility |
|
|
— |
|
|
13,000 |
|
Deferred revenue, net of current portion |
|
|
— |
|
|
12,468 |
|
Operating lease liabilities, net of current |
|
|
7,855 |
|
|
— |
|
Finance lease liabilities, net of current |
|
|
130 |
|
|
154 |
|
Payables related to Tax Receivable Agreement |
|
|
66,582 |
|
|
56,149 |
|
Other long-term liabilities |
|
|
460 |
|
|
633 |
|
Total liabilities |
|
|
95,414 |
|
|
117,729 |
|
Commitments and contingencies (Note 12) |
|
|
|
|
|
|
|
Stockholders' equity: |
|
|
|
|
|
|
|
Preferred stock, $0.01 par value, 50,000 shares authorized, none issued and outstanding |
|
|
— |
|
|
— |
|
Class A common stock, $0.01 par value, 600,000 shares authorized, 30,928 issued and 30,765 outstanding as of December 31, 2019 and 27,182, issued and 27,091 outstanding as of December 31, 2018 |
|
|
308 |
|
|
271 |
|
Class B common stock, $0.00 par value, 180,000 shares authorized, 15,939 shares issued and outstanding as of December 31, 2019 and 19,627 issued and outstanding as of December 31, 2018 |
|
|
— |
|
|
— |
|
Additional paid-in capital |
|
|
191,843 |
|
|
164,086 |
|
Retained earnings |
|
|
74,222 |
|
|
35,507 |
|
Treasury stock (at cost), 163 shares and 91 shares as of December 31, 2019 and 2018, respectively |
|
|
(2,526) |
|
|
(1,414) |
|
Total stockholders' equity attributable to Solaris |
|
|
263,847 |
|
|
198,450 |
|
Non-controlling interest |
|
|
145,811 |
|
|
142,428 |
|
Total stockholders' equity |
|
|
409,658 |
|
|
340,878 |
|
Total liabilities and stockholders' equity |
|
$ |
505,072 |
|
$ |
458,607 |
The accompanying notes are an integral part of these financial statements.
63
SOLARIS OILFIELD INFRASTRUCTURE, INC.
CONSOLIDATED STATEMENTS OF OPERATIONS
(in thousands, except per share amount)
|
|
|
For the Years |
|||||||
|
|
|
Ended December 31, |
|||||||
|
|
|
2019 |
|
2018 |
|
2017 |
|||
|
|
|
|
|
|
|
|
|
|
|
|
Revenue: |
|
|
|
|
|
|
|
|
|
|
System rental |
|
$ |
142,022 |
|
$ |
143,646 |
|
$ |
54,653 |
|
System services |
|
|
63,871 |
|
|
43,010 |
|
|
12,537 |
|
Transloading services |
|
|
34,105 |
|
|
8,083 |
|
|
— |
|
Inventory software services |
|
|
1,689 |
|
|
2,457 |
|
|
205 |
|
Total revenue |
|
|
241,687 |
|
|
197,196 |
|
|
67,395 |
|
|
|
|
|
|
|
|
|
|
|
|
Operating costs and expenses: |
|
|
|
|
|
|
|
|
|
|
Cost of system rental (excluding $22,389, $14,920 and $5,792 of depreciation and amortization for the years ended December 31, 2019, 2018 and 2017, respectively, shown separately) (1) |
|
|
9,707 |
|
|
7,230 |
|
|
2,627 |
|
Cost of system services (excluding $1,548, $1,274 and $461 of depreciation and amortization for the years ended December 31, 2019, 2018 and 2017, respectively, shown separately) (1) |
|
|
74,749 |
|
|
50,633 |
|
|
14,184 |
|
Cost of transloading services (excluding $1,643 and $954 of depreciation and amortization for the year ended December 31, 2019 and 2018, shown separately) (1) |
|
|
2,601 |
|
|
2,242 |
|
|
76 |
|
Cost of inventory software services (excluding $772 and $794 of depreciation and amortization for the years ended December 31, 2019 and 2018, respectively, shown separately) |
|
|
604 |
|
|
797 |
|
|
— |
|
Depreciation and amortization |
|
|
26,925 |
|
|
18,422 |
|
|
6,635 |
|
Selling, general and administrative (excluding $573, $480 and $340 of depreciation and amortization for the years ended December 31, 2019, 2018 and 2017, respectively, shown separately) |
|
|
18,586 |
|
|
16,758 |
|
|
14,286 |
|
Other operating expenses |
|
|
585 |
|
|
1,827 |
|
|
4,126 |
|
Total operating costs and expenses |
|
|
133,757 |
|
|
97,909 |
|
|
41,934 |
|
Operating income |
|
|
107,930 |
|
|
99,287 |
|
|
25,461 |
|
Interest expense, net |
|
|
(634) |
|
|
(374) |
|
|
(97) |
|
Income pursuant to Tax Receivable Agreement |
|
|
— |
|
|
— |
|
|
23,022 |
|
Total other income (expense) |
|
|
(634) |
|
|
(374) |
|
|
22,925 |
|
Income before income tax expense |
|
|
107,296 |
|
|
98,913 |
|
|
48,386 |
|
Provision for income taxes |
|
|
(16,936) |
|
|
(12,961) |
|
|
(33,709) |
|
Net income |
|
|
90,360 |
|
|
85,952 |
|
|
14,677 |
|
Less: net income related to Solaris LLC |
|
|
— |
|
|
— |
|
|
(3,665) |
|
Less: net income related to non-controlling interests |
|
|
(38,353) |
|
|
(43,521) |
|
|
(15,186) |
|
Net income (loss) attributable to Solaris |
|
$ |
52,007 |
|
$ |
42,431 |
|
$ |
(4,174) |
|
|
|
|
|
|
|
|
|
|
|
|
Earnings (loss) per share of Class A common stock - basic (2) |
|
$ |
1.69 |
|
$ |
1.60 |
|
$ |
(0.34) |
|
Earnings (loss) per share of Class A common stock - diluted (2) |
|
$ |
1.69 |
|
$ |
1.59 |
|
$ |
(0.34) |
|
|
|
|
|
|
|
|
|
|
|
|
Basic weighted-average shares of Class A common stock outstanding (2) |
|
|
30,141 |
|
|
25,678 |
|
|
12,117 |
|
Diluted weighted-average shares of Class A common stock outstanding (2) |
|
|
30,185 |
|
|
25,829 |
|
|
12,117 |
(1) The consolidated statements of operations include stock-based compensation expense as follows:
|
Cost of system rental |
|
$ |
34 |
|
$ |
6 |
|
$ |
— |
|
Cost of system services |
|
|
262 |
|
|
191 |
|
|
— |
|
Cost of transloading services |
|
|
13 |
|
|
3 |
|
|
— |
|
Selling, general and administrative |
|
|
4,167 |
|
|
3,661 |
|
|
3,701 |
|
Stock-based compensation expense |
|
$ |
4,476 |
|
$ |
3,861 |
|
$ |
3,701 |
(2) Represents earnings per share of Class A common stock and weighted-average shares of Class A common stock outstanding for the period following the May 17, 2017 Initial Public Offering.
The accompanying notes are an integral part of these financial statements.
64
SOLARIS OILFIELD INFRASTRUCTURE, INC.
CONSOLIDATED STATEMENTS OF CHANGES IN STOCKHOLDERS’ AND MEMBERS’ EQUITY
(in thousands)
|
|
|
|
|
Class A |
|
Class B |
|
Additional |
|
Retained |
|
|
|
Non- |
|
Total |
||||||||||||||
|
|
|
Members’ |
|
Common Stock |
|
Common Stock |
|
Paid-in |
|
Earnings |
|
Treasury Stock |
|
controlling |
|
Stockholders' |
||||||||||||||
|
|
|
Equity |
|
Shares |
|
Amount |
|
Shares |
|
Amount |
|
Capital |
|
(Deficit) |
|
Shares |
|
Amount |
|
Interest |
|
Equity |
||||||||
|
Balance at January 1, 2017 |
|
|
71,346 |
|
— |
|
|
— |
|
— |
|
|
— |
|
|
— |
|
|
— |
|
— |
|
|
— |
|
|
— |
|
|
71,346 |
|
Additional members’ equity related to accrued interest on notes receivable that were exchanged for membership units prior to the Reorganization |
|
|
84 |
|
— |
|
|
— |
|
— |
|
|
— |
|
|
— |
|
|
— |
|
— |
|
|
— |
|
|
— |
|
|
84 |
|
Accrued interest related to notes receivable that were exchanged for membership units prior to the Reorganization |
|
|
(84) |
|
— |
|
|
— |
|
— |
|
|
— |
|
|
— |
|
|
— |
|
— |
|
|
— |
|
|
— |
|
|
(84) |
|
Proceeds from pay down of promissory note and interest related to membership units prior to the Reorganization |
|
|
3,808 |
|
— |
|
|
— |
|
— |
|
|
— |
|
|
— |
|
|
— |
|
— |
|
|
— |
|
|
— |
|
|
3,808 |
|
Unit-based compensation expenses prior to the Reorganization |
|
|
43 |
|
— |
|
|
— |
|
— |
|
|
— |
|
|
— |
|
|
— |
|
— |
|
|
— |
|
|
— |
|
|
43 |
|
Net Income prior to the Reorganization |
|
|
3,665 |
|
— |
|
|
— |
|
— |
|
|
— |
|
|
— |
|
|
— |
|
— |
|
|
— |
|
|
— |
|
|
3,665 |
|
Effect of the Reorganization |
|
|
(78,862) |
|
10,100 |
|
|
101 |
|
32,366 |
|
|
— |
|
|
77,256 |
|
|
— |
|
— |
|
|
— |
|
|
125,056 |
|
|
123,551 |
|
Deferred tax asset and payables related to parties pursuant to Tax Receivable Agreement from the reorganization transactions in connection with the Reorganization |
|
|
— |
|
— |
|
|
— |
|
— |
|
|
— |
|
|
(19,149) |
|
|
— |
|
— |
|
|
— |
|
|
— |
|
|
(19,149) |
|
Effect of the November Offering |
|
|
— |
|
8,050 |
|
|
81 |
|
(5,050) |
|
|
— |
|
|
47,127 |
|
|
— |
|
— |
|
|
— |
|
|
(2,744) |
|
|
44,464 |
|
Deferred tax asset and payables related to parties pursuant to Tax Receivable Agreement from the November Offering |
|
|
— |
|
— |
|
|
— |
|
— |
|
|
— |
|
|
9,998 |
|
|
— |
|
— |
|
|
— |
|
|
— |
|
|
9,998 |
|
Exchange of Solaris LLC Units and shares of Class B common stock for shares of Class A common stock |
|
|
— |
|
785 |
|
|
8 |
|
(785) |
|
|
— |
|
|
3,974 |
|
|
— |
|
— |
|
|
— |
|
|
(3,982) |
|
|
— |
|
Deferred tax asset and payables related to parties pursuant to Tax Receivable Agreement from the exchange of Solaris LLC Units and shares of Class B common stock for shares of Class A common stock |
|
|
— |
|
— |
|
|
— |
|
— |
|
|
— |
|
|
(5,188) |
|
|
— |
|
— |
|
|
— |
|
|
— |
|
|
(5,188) |
|
Stock option exercises |
|
|
— |
|
75 |
|
|
— |
|
— |
|
|
— |
|
|
(6) |
|
|
— |
|
16 |
|
|
(261) |
|
|
267 |
|
|
— |
|
Issuance of shares of Class B common stock in connection with the acquisition of the assets of Railtronix® |
|
|
— |
|
— |
|
|
— |
|
280 |
|
|
— |
|
|
1,585 |
|
|
— |
|
— |
|
|
— |
|
|
2,922 |
|
|
4,507 |
|
Stock-based compensation subsequent to the Reorganization |
|
|
— |
|
— |
|
|
— |
|
— |
|
|
— |
|
|
1,093 |
|
|
— |
|
— |
|
|
— |
|
|
3,645 |
|
|
4,738 |
|
Additional members’ equity related to accrued interest on notes receivable that were exchanged for membership units subsequent to the Reorganization |
|
|
— |
|
— |
|
|
— |
|
— |
|
|
— |
|
|
28 |
|
|
— |
|
— |
|
|
— |
|
|
— |
|
|
28 |
|
Accrued interest related to notes receivable that were exchanged for membership units subsequent to the Reorganization |
|
|
— |
|
— |
|
|
— |
|
— |
|
|
— |
|
|
(28) |
|
|
— |
|
— |
|
|
— |
|
|
— |
|
|
(28) |
|
Proceeds from pay down of promissory note and interest related to membership units subsequent to the Reorganization |
|
|
— |
|
— |
|
|
— |
|
— |
|
|
— |
|
|
948 |
|
|
— |
|
— |
|
|
— |
|
|
500 |
|
|
1,448 |
|
Net income (loss) subsequent to the Reorganization |
|
|
— |
|
— |
|
|
— |
|
— |
|
|
— |
|
|
— |
|
|
(4,174) |
|
— |
|
|
— |
|
|
15,186 |
|
|
11,012 |
|
Balance at December 31, 2017 |
|
|
— |
|
19,010 |
|
|
190 |
|
26,811 |
|
|
— |
|
|
117,638 |
|
|
(4,174) |
|
16 |
|
|
(261) |
|
|
140,850 |
|
|
254,243 |
|
Exchange of Solaris LLC Units and shares of Class B common stock for shares of Class A common stock |
|
|
— |
|
7,184 |
|
|
72 |
|
(7,184) |
|
|
— |
|
|
39,558 |
|
|
— |
|
— |
|
|
— |
|
|
(39,630) |
|
|
— |
|
Deferred tax asset and payables related to parties pursuant to Tax Receivable Agreement from the exchange of Solaris LLC Units and shares of Class B common stock for shares of Class A common stock |
|
|
— |
|
— |
|
|
— |
|
— |
|
|
— |
|
|
649 |
|
|
— |
|
— |
|
|
— |
|
|
— |
|
|
649 |
|
Stock option exercises |
|
|
— |
|
327 |
|
|
3 |
|
— |
|
|
— |
|
|
1,530 |
|
|
— |
|
1 |
|
|
(9) |
|
|
(592) |
|
|
932 |
|
Stock-based compensation |
|
|
— |
|
— |
|
|
— |
|
— |
|
|
— |
|
|
2,609 |
|
|
— |
|
— |
|
|
— |
|
|
2,292 |
|
|
4,901 |
|
Vesting of restricted stock |
|
|
— |
|
570 |
|
|
6 |
|
— |
|
|
— |
|
|
2,042 |
|
|
— |
|
74 |
|
|
(1,144) |
|
|
(2,050) |
|
|
(1,146) |
|
Other |
|
|
— |
|
— |
|
|
— |
|
— |
|
|
— |
|
|
60 |
|
|
— |
|
— |
|
|
— |
|
|
— |
|
|
60 |
|
Solaris LLC distribution paid to Solaris LLC unitholders at $0.10 per Solaris LLC Unit |
|
|
— |
|
— |
|
|
— |
|
— |
|
|
— |
|
|
— |
|
|
— |
|
— |
|
|
— |
|
|
(1,963) |
|
|
(1,963) |
|
Dividends paid ($0.10 per share of Class A common stock) |
|
|
— |
|
— |
|
|
— |
|
— |
|
|
— |
|
|
— |
|
|
(2,750) |
|
— |
|
|
— |
|
|
— |
|
|
(2,750) |
|
Net income |
|
|
— |
|
— |
|
|
— |
|
— |
|
|
— |
|
|
— |
|
|
42,431 |
|
— |
|
|
— |
|
|
43,521 |
|
|
85,952 |
|
Balance at December 31, 2018 |
|
$ |
— |
|
27,091 |
|
$ |
271 |
|
19,627 |
|
$ |
— |
|
$ |
164,086 |
|
$ |
35,507 |
|
91 |
|
$ |
(1,414) |
|
$ |
142,428 |
|
$ |
340,878 |
|
Effect of ASU No. 2016-02 implementation (Refer to Note 2) |
|
|
— |
|
— |
|
|
— |
|
— |
|
|
— |
|
|
186 |
|
|
(532) |
|
— |
|
|
— |
|
|
(186) |
|
|
(532) |
|
Share repurchases |
|
|
— |
|
(252) |
|
|
(2) |
|
— |
|
|
— |
|
|
(2,916) |
|
|
— |
|
— |
|
|
— |
|
|
(331) |
|
|
(3,249) |
|
Exchange of Solaris LLC Units and shares of Class B common stock for shares of Class A common stock |
|
|
— |
|
3,687 |
|
|
36 |
|
(3,687) |
|
|
— |
|
|
28,496 |
|
|
— |
|
— |
|
|
— |
|
|
(28,532) |
|
|
— |
|
Deferred tax asset and payables related to parties pursuant to Tax Receivable Agreement from the exchange of Solaris LLC Units and shares of Class B common stock for shares of Class A common stock |
|
|
— |
|
— |
|
|
— |
|
— |
|
|
— |
|
|
(2,383) |
|
|
— |
|
— |
|
|
— |
|
|
— |
|
|
(2,383) |
|
Stock option exercises |
|
|
— |
|
76 |
|
|
1 |
|
— |
|
|
— |
|
|
649 |
|
|
— |
|
28 |
|
|
(427) |
|
|
(356) |
|
|
(133) |
|
Stock-based compensation |
|
|
— |
|
— |
|
|
— |
|
— |
|
|
— |
|
|
3,030 |
|
|
— |
|
— |
|
|
— |
|
|
1,633 |
|
|
4,663 |
|
Vesting of restricted stock |
|
|
— |
|
163 |
|
|
2 |
|
— |
|
|
— |
|
|
695 |
|
|
— |
|
44 |
|
|
(685) |
|
|
(698) |
|
|
(686) |
|
Solaris LLC distribution paid to Solaris LLC unitholders at $0.405 per Solaris LLC Unit |
|
|
— |
|
— |
|
|
— |
|
— |
|
|
— |
|
|
— |
|
|
— |
|
— |
|
|
— |
|
|
(6,500) |
|
|
(6,500) |
|
Dividends paid ($0.405 per share of Class A common stock) |
|
|
— |
|
— |
|
|
— |
|
— |
|
|
— |
|
|
— |
|
|
(12,760) |
|
— |
|
|
— |
|
|
— |
|
|
(12,760) |
|
Net income |
|
|
— |
|
— |
|
|
— |
|
— |
|
|
— |
|
|
— |
|
|
52,007 |
|
— |
|
|
— |
|
|
38,353 |
|
|
90,360 |
|
Balance at December 31, 2019 |
|
$ |
— |
|
30,765 |
|
$ |
308 |
|
15,940 |
|
$ |
— |
|
$ |
191,843 |
|
$ |
74,222 |
|
163 |
|
$ |
(2,526) |
|
$ |
145,811 |
|
$ |
409,658 |
The accompanying notes are an integral part of these financial statements.
65
SOLARIS OILFIELD INFRASTRUCTURE, INC.
CONSOLIDATED STATEMENTS OF CASH FLOWS
(in thousands)
|
|
|
For the Year Ended |
|||||||
|
|
|
December 31, |
|||||||
|
|
|
2019 |
|
2018 |
|
2017 |
|||
|
|
|
|
|
|
|
|
|
|
|
|
Cash flows from operating activities: |
|
|
|
|
|
|
|
|
|
|
Net income |
|
$ |
90,360 |
|
$ |
85,952 |
|
$ |
14,677 |
|
Adjustment to reconcile net income to net cash provided by operating activities: |
|
|
|
|
|
|
|
|
|
|
Depreciation and amortization |
|
|
26,925 |
|
|
18,422 |
|
|
6,635 |
|
Loss on disposal of asset |
|
|
261 |
|
|
318 |
|
|
498 |
|
Stock-based compensation |
|
|
4,475 |
|
|
3,861 |
|
|
3,701 |
|
Amortization of debt issuance costs |
|
|
753 |
|
|
296 |
|
|
51 |
|
Write-off of deposit |
|
|
202 |
|
|
— |
|
|
— |
|
Provision for bad debt |
|
|
339 |
|
|
— |
|
|
— |
|
Change in payables related to Tax Receivable Agreement |
|
|
— |
|
|
— |
|
|
(23,022) |
|
Deferred income tax expense |
|
|
16,122 |
|
|
12,277 |
|
|
33,462 |
|
Other |
|
|
(150) |
|
|
620 |
|
|
(28) |
|
Changes in assets and liabilities: |
|
|
|
|
|
|
|
|
|
|
Accounts receivable |
|
|
853 |
|
|
(26,766) |
|
|
(8,469) |
|
Prepaid expenses and other assets |
|
|
2,332 |
|
|
(686) |
|
|
(3,273) |
|
Inventories |
|
|
(2,744) |
|
|
(10,470) |
|
|
(7,532) |
|
Accounts payable |
|
|
(3,582) |
|
|
4,469 |
|
|
4,224 |
|
Accrued liabilities |
|
|
4,183 |
|
|
2,614 |
|
|
5,805 |
|
Deferred revenue |
|
|
(25,458) |
|
|
25,458 |
|
|
— |
|
Net cash provided by operating activities |
|
|
114,871 |
|
|
116,365 |
|
|
26,729 |
|
Cash flows from investing activities: |
|
|
|
|
|
|
|
|
|
|
Investment in property, plant and equipment |
|
|
(34,852) |
|
|
(161,079) |
|
|
(93,912) |
|
Cash received from insurance proceeds |
|
|
618 |
|
|
540 |
|
|
— |
|
Proceeds from disposal of assets |
|
|
232 |
|
|
— |
|
|
— |
|
Cash paid for Railtronix® acquisition |
|
|
— |
|
|
— |
|
|
(5,000) |
|
Investment in intangible assets |
|
|
— |
|
|
(6) |
|
|
(72) |
|
Net cash used in investing activities |
|
|
(34,002) |
|
|
(160,545) |
|
|
(98,984) |
|
Cash flows from financing activities: |
|
|
|
|
|
|
|
|
|
|
Distribution and dividend paid to Solaris LLC unitholders and Class A common shareholders |
|
|
(19,260) |
|
|
(4,713) |
|
|
— |
|
Share repurchases |
|
|
(3,249) |
|
|
— |
|
|
— |
|
Payments under finance leases |
|
|
(35) |
|
|
(28) |
|
|
(27) |
|
Payments under insurance premium financing |
|
|
(2,485) |
|
|
(1,275) |
|
|
— |
|
Payments under notes payable |
|
|
— |
|
|
— |
|
|
(451) |
|
Proceeds from stock option exercises |
|
|
294 |
|
|
932 |
|
|
— |
|
Payments related to purchase of treasury stock |
|
|
(1,112) |
|
|
(1,146) |
|
|
— |
|
Proceeds from borrowings under the senior secured credit facility |
|
|
— |
|
|
13,000 |
|
|
3,000 |
|
Repayment of senior secured credit facility |
|
|
(13,000) |
|
|
— |
|
|
(5,500) |
|
Payments related to debt issuance costs |
|
|
(197) |
|
|
(1,014) |
|
|
(111) |
|
Proceeds from issuance of Class A common stock sold in initial public offering, net of offering costs |
|
|
— |
|
|
— |
|
|
111,075 |
|
Proceeds from issuance of Class A common stock sold in November Offering, net of offering costs |
|
|
— |
|
|
— |
|
|
44,684 |
|
Distributions paid to unitholders |
|
|
— |
|
|
— |
|
|
(25,818) |
|
Proceeds from pay down of promissory note related to membership units |
|
|
— |
|
|
— |
|
|
5,256 |
|
Other |
|
|
— |
|
|
60 |
|
|
— |
|
Net cash provided by (used in) financing activities |
|
|
(39,044) |
|
|
5,816 |
|
|
132,108 |
|
|
|
|
|
|
|
|
|
|
|
|
Net (decrease) increase in cash and cash equivalents |
|
|
41,825 |
|
|
(38,364) |
|
|
59,853 |
|
Cash and cash equivalents at beginning of period |
|
|
25,057 |
|
|
63,421 |
|
|
3,568 |
|
Cash and cash equivalents at end of period |
|
$ |
66,882 |
|
$ |
25,057 |
|
$ |
63,421 |
|
|
|
|
|
|
|
|
|
|
|
|
Non-cash activities |
|
|
|
|
|
|
|
|
|
|
Investing: |
|
|
|
|
|
|
|
|
|
|
Capitalized depreciation in property, plant and equipment |
|
$ |
735 |
|
$ |
688 |
|
$ |
668 |
|
Property and equipment additions incurred but not paid at period-end |
|
|
82 |
|
|
3,909 |
|
|
7,765 |
|
Property, plant and equipment additions transferred from inventory |
|
|
5,882 |
|
|
7,532 |
|
|
1,365 |
|
Issuance of shares in acquisition |
|
|
— |
|
|
— |
|
|
4,507 |
|
Financing: |
|
|
|
|
|
|
|
|
|
|
Insurance premium financing |
|
|
1,869 |
|
|
1,552 |
|
|
— |
|
Cash paid for: |
|
|
|
|
|
|
|
|
|
|
Interest |
|
|
275 |
|
|
281 |
|
|
104 |
|
Income taxes |
|
|
663 |
|
|
314 |
|
|
45 |
66
SOLARIS OILFIELD INFRASTRUCTURE, INC.
Notes to the Consolidated Financial Statements
(Dollars in thousands)
1. Organization and Background of Business
Description of Business
We are an independent provider of supply chain management and logistics solutions designed to drive efficiencies and reduce costs for the oil and natural gas industry. We manufacture and provide patented mobile proppant and chemical management systems that unload, store and deliver proppant and chemicals used in hydraulic fracturing of oil and natural gas wells. The systems are designed to address the challenges associated with transferring large quantities of proppant and chemicals to the well site, including the cost and management of last mile logistics which includes coordinating proppant delivery to systems. Our systems are deployed in most of the active oil and natural gas basins in the United States.
We operate an independent, unit-train capable, high speed transload facility in Oklahoma (the “Kingfisher Facility”) that provides rail-to-truck transloading and high-efficiency sand silo storage and transloading services. Commercial operations commenced in January 2018 and we completed construction at the end of July 2018.
We also provide software solutions to remotely monitor proppant inventory from the source mine to well site through our Railtronix® and Solaris Lens® inventory management systems. Our customers use data from our software to manage distribution of proppant and chemicals throughout their supply chain.
2. Summary of Significant Accounting Policies
Basis of Presentation and Consolidation
Solaris Oilfield Infrastructure, Inc. (either individually or together with its subsidiaries, as the context requires “Solaris Inc.” or the “Company”) is the managing member of Solaris Oilfield Infrastructure, LLC (“Solaris LLC”) and is responsible for all operational, management and administrative decisions relating to Solaris LLC’s business. Solaris Inc. consolidates the financial results of Solaris LLC and its subsidiaries and reports non-controlling interest related to the portion of the units in Solaris LLC (the “Solaris LLC Units”) not owned by Solaris Inc., which will reduce net income attributable to the holders of Solaris Inc.’s Class A common stock.
All material intercompany transactions and balances have been eliminated upon consolidation.
Use of Estimates
The preparation of consolidated financial statements in accordance with GAAP requires management to make estimates and assumptions that affect the reported amounts of assets and liabilities and disclosure of contingent liabilities at the date of the financial statements, and the reported amounts of revenues and expenses during the reporting period. Significant estimates used in the preparation of these consolidated financial statements include, but are not limited to, stock-based compensation, depreciation associated with property, plant and equipment and related impairment considerations of those assets, determination of fair value of intangible assets acquired in business combinations, determination of the present value of lease payments and right-of-use assets and certain other assets and liabilities. Actual results could differ from management's best estimates as additional information or actual results become available in the future, and those differences could be material.
Cash and Cash Equivalents
For the purposes of the statements of cash flows, the Company considers all short-term, highly liquid, investments with an original maturity of three months or less to be cash equivalents. Cash is deposited in demand accounts in
67
federally insured domestic institutions to minimize risk. Accounts of each institution are insured by Federal Deposit Insurance Corporation. Cash balances at times may exceed federally-insured limits. We have not incurred losses related to these deposits.
Accounts Receivable
Accounts receivable consists of trade receivables recorded at the invoice amount, plus accrued revenue that is not yet billed, less an estimated allowance for doubtful accounts (if any). Accounts receivable are generally due within 60 days or less, or in accordance with terms agreed with customers. The Company considers accounts outstanding longer than the payment terms past due. The Company determines the allowance by considering a number of factors, including the length of time trade accounts receivable are past due, previous loss history, the customer’s current ability to pay its obligation, and the condition of the general economy and the industry as a whole. Accounts receivable are written off when they are deemed uncollectible, and payments subsequently received on such receivables are credited to the allowance for doubtful accounts. Allowance for doubtful accounts was $339 and $0 as of December 31, 2019 and 2018, respectively.
Inventories
Inventories consist of materials used in the manufacturing of the Company’s systems, which include raw materials, and purchased parts and is stated at the lower of cost or net realizable value. Net realizable value is determined, giving consideration to quality, excessive levels, obsolescence and other factors. Adjustments that reduce stated amounts will be recognized as impairments in the consolidated statements of operations. There were no impairments recorded for the years ended December 31, 2019, 2018 and 2017.
Business Combinations
The Company accounts for business combinations using the acquisition method of accounting. Under this method, acquired assets, including separately identifiable intangible assets and any assumed liabilities, are recorded at their acquisition date estimated fair value. The excess of purchase price over the fair value amounts assigned to the assets acquired and liabilities assumed represents the goodwill amount resulting from the acquisition. Determining the fair value of assets acquired and liabilities assumed involves the use of significant estimates and assumptions. Additional information regarding the Company’s business combinations is presented in Note 3. “–Business Combinations.”
Property, Plant and Equipment
Property, plant and equipment are stated at cost, or fair value for assets acquired in a business combination, less accumulated depreciation. Depreciation is computed using the straight-line method over the estimated useful service lives of the assets as noted below:
|
|
|
Useful Life |
|
Systems and related equipment |
|
Up to 15 years |
|
Machinery and equipment |
|
3-10 years |
|
Furniture and fixtures |
|
5 years |
|
Computer hardware and software |
|
3-10 years |
|
Vehicles |
|
5 years |
|
Transloading facility and equipment |
|
15-30 years |
|
Buildings and leasehold improvements |
|
15 years |
Systems that are in the process of being manufactured are considered property, plant and equipment. However, the systems do not depreciate until they are fully completed. Systems in process are a culmination of material, labor and overhead.
Expenditures for maintenance and repairs are charged against income as incurred. Betterments that increase the value or materially extend the life of the related assets are capitalized. Upon sale or disposition of property and
68
equipment, the cost and related accumulated depreciation and amortization are removed from the consolidated financial statements and any resulting gain or loss is recognized in the consolidated statements of operations.
Definite-lived Intangible Assets
Identified intangible assets with determinable lives consist primarily of customer relationships, a non-competition agreement and software acquired in the acquisition of Railtronix, LLC (“Railtronix”) as described further in Note 3, as well as patents that were filed for our systems and other intellectual property. Amortization expense of identified intangibles is expected to be approximately $748 in each of the next five years. Amortization on these assets is calculated on the straight-line method over the estimated useful lives of the assets, which is five to fifteen years. The Company recorded amortization expense of $779, $801, and $46 for the years ended December 31, 2019, 2018 and 2017, respectively.
Identified intangible assets by major classification consist of the following:
|
|
|
|
|
|
Accumulated |
|
Net Book |
||
|
|
|
Gross |
|
Amortization |
|
Value |
|||
|
As of December 31, 2019: |
|
|
|
|
|
|
|
|
|
|
Customer relationships |
|
$ |
4,703 |
|
$ |
(1,400) |
|
$ |
3,303 |
|
Software acquired in the acquisition of Railtronix |
|
|
346 |
|
|
(103) |
|
|
243 |
|
Non-competition agreement |
|
|
225 |
|
|
(94) |
|
|
131 |
|
Patents and other |
|
|
114 |
|
|
(30) |
|
|
84 |
|
Total identifiable intangibles |
|
$ |
5,388 |
|
$ |
(1,627) |
|
$ |
3,761 |
|
|
|
|
|
|
|
|
|
|
|
|
As of December 31, 2018: |
|
|
|
|
|
|
|
|
|
|
Customer relationships |
|
$ |
4,703 |
|
$ |
(727) |
|
$ |
3,976 |
|
Software acquired in the acquisition of Railtronix |
|
|
346 |
|
|
(54) |
|
|
292 |
|
Non-competition agreement |
|
|
225 |
|
|
(49) |
|
|
176 |
|
Patents and other |
|
|
114 |
|
|
(18) |
|
|
96 |
|
Total identifiable intangibles |
|
$ |
5,388 |
|
$ |
(848) |
|
$ |
4,540 |
Leases
The Company accounts for leases in accordance with Financial Accounting Standards Board (“FASB”) Accounting Standards Codification (“ASC”) Topic 842, Leases (“ASC Topic 842”) effective January 1, 2019. The Company applied ASC Topic 842 to all leases existing at or commencing after January 1, 2019 and elected the package of transition practical expedients for expired or existing contracts, which does not require reassessment of: (1) whether any of our contracts are or contain leases, (2) lease classification and (3) initial direct costs. The Company also elected the practical expedient to adopt the new lease requirements through a cumulative effect adjustment in the period of adoption and did not adjust comparative periods. As a result of the adoption of ASC Topic 842 on January 1, 2019, the Company recorded operating right-of-use (“ROU”) assets of $8,503, operating lease liabilities of $9,016 and a cumulative effect adjustment to retained earnings for operating leases of $532.
We determine if an arrangement is a lease at inception. The Company made the election to not apply the recognition requirements in ASC Topic 842 to short-term leases (i.e., leases of twelve months or less). Instead, the Company recognizes the lease payments in profit or loss on a straight-line basis over the lease term. Operating leases are included in operating lease ROU assets, current portion of operating lease liabilities, and operating lease liabilities, net of current in the Company’s consolidated balance sheets. Finance leases are included in property and equipment, current portion of finance lease liabilities, and finance lease liabilities, net of current in the Company’s consolidated balance sheets.
ROU assets represent the Company’s right to use an underlying asset for the lease term and lease liabilities represent our obligation to make lease payments arising from the lease. ROU assets and liabilities are recognized at the
69
commencement date based on the present value of lease payments over the lease term. As most of the Company’s leases do not provide an implicit rate, we use our incremental borrowing rate in determining the present value of lease payments based on the information available at the commencement date. Our incremental borrowing rate reflects the estimated rate of interest that we would pay to borrow on a collateralized basis over a similar term an amount equal to the lease payments in a similar economic environment. We use the implicit rate when readily determinable. The ROU asset also includes any lease payments made and excludes lease incentives received. The Company’s lease terms may include options to extend or terminate the lease when it is reasonably certain that we will exercise that option. Lease expense for lease payments is recognized on a straight-line basis over the lease term. See Note 7.
Goodwill
Goodwill represents the excess of the purchase price of a business over the estimated fair value of the identifiable assets acquired and liabilities assumed. As of December 31, 2019 and 2018, the Company reported $17,236 of goodwill related to the 2014 purchase of the silo manufacturing business from Loadcraft Industries Ltd. and the 2017 purchase of the assets of Railtronix (See Note 3. “–Business Combinations”). The Company evaluates goodwill for impairment annually, as of October 31, or more often as facts and circumstances warrant. Factors such as unexpected adverse economic conditions, competition and market changes may require more frequent assessments. There was no impairment for the years ended December 31, 2019, 2018 and 2017.
Before employing detailed impairment testing methodologies, the Company may first evaluate the likelihood of impairment by considering qualitative factors relevant to the business, such as macroeconomic, industry, market or any other factors that have a significant bearing on fair value. If the Company first utilizes a qualitative approach and determines that it is more likely than not that goodwill is impaired, detailed testing methodologies are then applied. Otherwise, the Company concludes that no impairment has occurred. The Company may also choose to bypass a qualitative approach and opt instead to employ detailed testing methodologies, regardless of a possible more likely than not outcome. If the Company determines through the qualitative approach that detailed testing methodologies are required, or if the qualitative approach is bypassed, the Company compares the fair value of a reporting unit with its carrying amount. An entity should recognize an impairment charge for the amount by which the carrying amount exceeds the reporting unit’s fair value; however, the loss recognized should not exceed the total amount of goodwill allocated to that reporting unit.
Impairment of Long-Lived Assets and Definite-lived Intangible Assets
Long-lived assets, such as property, plant, equipment and definite-lived intangible assets, are reviewed for impairment whenever events or changes in circumstances indicate that the carrying amount may not be recoverable, such as insufficient cash flows or plans to dispose of or sell long-lived assets before the end of their previously estimated useful lives. If the carrying amount is not recoverable, the Company recognizes an impairment loss equal to the amount by which the carrying amount exceeds fair value. The Company estimates fair value based on projected future discounted cash flows. Fair value calculations for long-lived assets and intangible assets contain uncertainties because it requires the Company to apply judgment and estimates concerning future cash flows, strategic plans, useful lives and market performance. The Company also applies judgment in the selection of a discount rate that reflects the risk inherent in the current business model. There were no impairment indicators for the years ended December 31, 2019, 2018 and 2017.
Revenue Recognition
In determining the appropriate amount of revenue to be recognized as we fulfill our obligations under the agreement, the following steps must be performed at contract inception: (i) identification of the promised goods or services in the contract; (ii) determination of whether the promised goods or services are performance obligations, including whether they are distinct in the context of the contract; (iii) measurement of the transaction price, including the constraint on variable consideration; (iv) allocation of the transaction price to the performance obligations; and (v) recognition of revenue when (or as) we satisfy each performance obligation. For contracts that contain multiple performance obligations, we allocate the transaction price to each performance obligation identified in the contract based on relative standalone prices, or estimates of such prices, and recognize the related revenue as each individual service is performed, in satisfaction of the corresponding performance obligations.
70
Revenues from system rental consist primarily of fixed monthly fees charged to customers for the use of our patented mobile proppant management systems that unload, store and deliver proppant and chemicals at oil and natural gas well sites which is considered to be our performance obligation. Contracts with customers are typically on thirty- to sixty-day payment terms. Revenues are recognized over time as the performance obligations are satisfied under the terms of the customer contract. We determined that the performance obligation is satisfied over time as the customer simultaneously receives and consumes the benefits provided by the entity’s performance of services, typically as our systems are used by the customer. We measure progress using an input method based on resources consumed or expended relative to the total resources expected to be consumed or expended. We typically charge our customers for the rental of our systems on a monthly basis under agreements requiring the rental of a minimum number of systems for a period of twelve months. The Company is typically entitled to short fall payments if such minimum contractual obligations are not maintained by our customers. Minimum contractual obligations have been maintained and thus the Company has not recognized revenues related to shortfalls on such take or pay contractual obligations to date.
Revenues from system services consist primarily of the fees charged to customers for services including mobilization and transportation of our systems, field supervision and support and services coordinating proppant delivery to systems, each of which are considered to be separate performance obligations. Contracts with customers are typically on thirty- to sixty-day payment terms. When the Company provides system services including field supervision and support, we determined that the performance obligation is satisfied over time as the customer simultaneously receives and consumes the benefits provided by the entity’s performance of the services, typically based on fixed weekly or monthly contractual rates for field supervision and support and when the Company provides services coordinating proppant delivery. We measure progress using an input method based on resources consumed or expended relative to the total resources expected to be consumed or expended. When the Company provides mobilization and transportation of our systems on behalf of our customers, we determined that the performance obligation is satisfied at a point in time when the system has reached its intended destination.
Revenues from transloading services consist primarily of the fees charged to customers for transloading proppant at our transloading facility, which is considered to be our performance obligation. Transloading services operations commenced in January 2018. We provide rail-to-truck transloading and high-efficiency sand silo storage and transloading services at the facility. Contracts with customers are typically on thirty- to sixty-day payment terms. Revenues are typically recognized over time as the customer simultaneously receives and consumes the benefits provided by the entity’s performance of the transloading service based on a throughput fee per ton rate for proppant delivered to and transloaded at the facility. We measure progress based on the proppant delivered and transloaded at the facility. Under our agreements at the facility, quarterly minimum throughput volumes are required and the Company is entitled to short fall payments if such minimum quarterly contractual obligations are not maintained. These shortfalls are based on fixed minimum volumes at a fixed rate and are recognized over time as throughput volumes transloaded are below minimum throughput volumes required. The Company recorded $1,332 of shortfall revenue during the year ended December 31, 2019.
Revenues from inventory software services consist primarily of the fees charged to customers for the use of our Railtronix inventory management software, which is considered to be our performance obligation. Revenues are recognized over time as the customer simultaneously receives and consumes the benefits provided by the entity’s performance based on a throughput fee to monitor proppant that is loaded into a railcar, stored at a transload facility or loaded into a truck.
Deferred Revenue
Deferred revenue consisted of a $25,980 partial termination payment received in December 2018 in accordance with a contract modification which was accounted for prospectively and a final termination payment of $1,680 recorded as accounts receivable and recognized as revenue throughout the fourth quarter of 2019. The termination payments represented the distinct unsatisfied portion of a contract to provide transloading services and were considered part of the transaction price and were allocated to the remaining performance obligations under the contract, which was fully settled as of December 31, 2019 upon termination of the contract. The Company recognized $27,138 of deferred revenue as Revenue from transloading services in the year ended December 31, 2019, resulting in no remaining deferred revenue as of December 31, 2019. The Company recognized $522 of deferred revenue as Revenue from transloading services in the year ended December 31, 2018, resulting in $25,458 remaining deferred revenue as of December 31, 2018.
71
Stock-based Compensation
The Company accounts for its stock-based compensation including grants of restricted stock and options in the consolidated statements of operations based on their fair values on the date of grant. The Company recognizes expense on a straight-line basis over the awards’ vesting period, which is generally the requisite service period.
Solaris LLC previously sponsored a stock-based management compensation program called the 2015 Membership Unit Option Plan (the “Plan”). Solaris LLC accounted for the units under the Plan as compensation cost measured at the fair value of the award on the date of grant using the Black-Scholes option-pricing model.
In connection with the Offering, the options granted under the Plan were modified by a conversion into options under the Solaris Long-Term Incentive Plan (the “LTIP”). Refer also to Note 9. “–Equity”.
Research and Development
The Company expenses research and development costs as incurred, which is included in selling, general and administrative expenses in the consolidated statements of operations. No research and development costs were incurred for the years ended December 31, 2019 and 2018. For the year ended December 31, 2017, research and development costs were $210.
Financial Instruments
The carrying value of the Company’s financial instruments, consisting of cash, accounts receivable, notes receivable, accounts payable and insurance premium financing, approximates their fair value due to the short maturity of such instruments. Financial instruments also consist of a revolving credit facility and term loans, for which fair value approximates carrying value as the debt bears interest at a variable rate which is reflective of current rates otherwise available to the Company. As of December 31, 2019, we had no borrowings under the 2019 Credit Agreement (as defined below) outstanding. Unless otherwise noted, it is management’s opinion that the Company is not exposed to significant interest, currency or credit risks arising from these financial instruments.
Fair Value Measurements
The Company’s financial assets and liabilities, as well as other recurring and nonrecurring fair value measurements such as goodwill impairment and purchase accounting, are to be measured using inputs from the three levels of the fair value hierarchy, of which the first two are considered observable and the last unobservable, which are as follows:
|
· |
Level 1—Inputs are unadjusted quoted prices in active markets for identical assets or liabilities that the Company has the ability to access at the measurement date; |
|
· |
Level 2—Inputs other than Level 1 that are observable, either directly or indirectly, such as quoted prices for similar assets or liabilities in active markets, quoted prices for identical or similar assets or liabilities in markets that are not active or other inputs corroborated by observable market data for substantially the full term of the assets or liabilities; and |
|
· |
Level 3—Unobservable inputs that reflect the Company’s assumptions that market participants would use in pricing assets or liabilities based on the best information available. |
Income Taxes
Solaris Inc. is a corporation and, as a result, is subject to United States federal, state and local income taxes. For the years ended December 31, 2019, 2018 and 2017, we recognized a combined United States federal and state provision for income taxes of $16,936, $12,961 and $33,709, respectively.
72
On December 22, 2017, Public Law No. 115-97, commonly referred to as the Tax Cuts and Jobs Act (the “Tax Act”) was enacted into law. The provisions of the Tax Act that impact us include, but are not limited to, (1) reducing the United States federal corporate income tax rate from 35% to 21%, (2) eliminating the corporate alternative minimum tax (AMT); (3) allowing business to immediately expense the cost of new investments in certain qualified depreciable assets acquired after September 27, 2017 (with a phase-down of such expensing starting in 2023); and (4) reducing the maximum deduction for net operating loss (NOL) carryforwards generated in tax years beginning after December 31, 2017 to 80% of a taxpayer’s taxable income.
Solaris LLC is treated as a partnership for United States federal income tax purposes and therefore does not pay United States federal income tax on its taxable income. Instead, the Solaris LLC members are liable for United States federal income tax on their respective shares of the Company’s taxable income reported on the members’ United States federal income tax returns.
Our revenues are derived through transactions in several states, which may be subject to state and local taxes. Accordingly, we have recorded a liability for state and local taxes that management believes is adequate for activities as of December 31, 2019 and 2018.
We are subject to a franchise tax imposed by the State of Texas. The franchise tax rate is 1%, calculated on taxable margin. Taxable margin is defined as total revenue less deductions for cost of goods sold or compensation and benefits in which the total calculated taxable margin cannot exceed 70% of total revenue. Current expenses related to Texas franchise tax were approximately $742,000, $684,000 and $247,000 for the years ended December 31, 2019, 2018 and 2017.
We determine deferred tax assets and liabilities on the basis of the differences between the book value and tax bases of assets and liabilities by using enacted tax rates in effect for the year in which the differences are expected to reverse. The effect of a change in tax rates on deferred tax assets and liabilities is recognized in income in the period in which the enactment date occurs.
We recognize deferred tax assets to the extent we believe these assets are more-likely-than-not to be realized. In making such a determination, we consider all available positive and negative evidence, including future reversals of existing taxable temporary differences, projected future taxable income, tax planning strategies and recent results of operations.
We record uncertain tax positions on the basis of a two-step process in which (1) we determine whether it is more-likely-than-not the tax positions will be sustained on the basis of the technical merits of the position and (2) for those tax positions meeting the more-likely-than-not recognition threshold, we recognize the largest amount of tax benefit that is more than 50% likely to be realized upon ultimate settlement with the related tax authority.
Interest and penalties related to income taxes are included in the benefit (provision) for income taxes in our consolidated statement of operations. We have not incurred any significant interest or penalties related to income taxes in any of the periods presented.
See Note 10. “–Income Taxes” for additional information regarding income taxes.
Payable Related to the Tax Receivable Agreement
In connection with the IPO, Solaris Inc. entered into a Tax Receivable Agreement (the “Tax Receivable Agreement”) with the members of Solaris LLC immediately prior to the IPO (each such person and any permitted transferee, a “TRA Holder,” and together, the “TRA Holders”) on May 17, 2017. This agreement generally provides for the payment by Solaris Inc. to each TRA Holder of 85% of the net cash savings, if any, in United States federal, state and local income tax or franchise tax that Solaris Inc. actually realizes (computed using simplifying assumptions to address the impact of state and local taxes) or is deemed to realize in certain circumstances in periods after the IPO as a result of (i) certain increases in tax basis that occur as a result of Solaris Inc.’s acquisition (or deemed acquisition for United States federal income tax purposes) of all or a portion of such TRA Holder's Solaris LLC Units in connection with the IPO or pursuant to the exercise of the Redemption Right or the Call Right (each as defined in the Solaris LLC
73
Agreement) and (ii) imputed interest deemed to be paid by Solaris Inc. as a result of, and additional tax basis arising from, any payments Solaris makes under the Tax Receivable Agreement. Solaris Inc. will retain the benefit of the remaining 15% of these cash savings. As of December 31, 2019 and 2018, Solaris Inc. recorded a payable related to the Tax Receivable Agreement of $67,998 and $56,149, respectively, $1,416 of which has been recorded as a current liability in the year ended December 31, 2019. The increase in payables related to the Tax Receivable Agreement is a result of Solaris Inc.’s acquisition (or deemed acquisition for United States federal income tax purposes) of Solaris LLC Units from TRA Holders during the year ended December 31, 2019.
Environmental Matters
The Company is subject to various federal, state and local laws and regulations relating to the protection of the environment. Management has established procedures for the ongoing evaluation of the Company’s operations, to identify potential environmental exposures and to comply with regulatory policies and procedures. Environmental expenditures that relate to current operations are expensed or capitalized as appropriate. Expenditures that relate to an existing condition caused by past operations and do not contribute to current or future revenue generation are expensed as incurred. Liabilities are recorded when environmental costs are probable, and the costs can be reasonably estimated. The Company maintains insurance which may cover in whole or in part certain environmental expenditures. As of December 31, 2019 and 2018, no liabilities were recorded with respect to any environmental matters as no environmental costs were deemed probable.
Segment Information
Operating segments are identified as components of an enterprise about which separate discrete financial information is available for evaluation by the chief operating decision maker, or decision-making group, in making decisions on how to allocate resources and assess performance. The Company’s chief operating decision maker is the Chief Executive Officer. The Company and the Chief Executive Officer view the Company’s operations and manage its business as one operating segment. All long-lived assets of the Company reside in the United States.
Accounting Standards Recently Adopted
In December 2019, the FASB issued ASU No. 2019-12, Income Taxes (Topic 740), Simplifying the Accounting for Income Taxes (“ASU 2019-12”), which removes certain exceptions to the general principles of ASC 740 and simplifies other areas in order to reduce simplify its application. For public business entities, the amendments are effective for fiscal years beginning after December 15, 2020, including interim periods within those fiscal years, with early adoption permitted. The Company early adopted ASU 2019-12 during the quarter ended December 31, 2019, which did not have an impact on the consolidated financial statements.
Accounting Standards Recently Issued But Not Yet Adopted
In June 2016, the FASB issued ASU No. 2016-13, Financial Instruments – Credit Losses (Topic 326), Measurement of Credit Losses on Financial Instruments (“ASU 2016-13”), which replaces the incurred loss impairment methodology under current GAAP with a methodology that reflects expected credit losses and requires consideration of a broader range of reasonable and supportable information to inform credit loss estimates. ASU 2016-13 requires the use of a forward-looking expected credit loss model for accounts receivables, loans and other financial instruments. For public business entities, the amendments are effective for fiscal years beginning after December 15, 2019, including interim periods within those fiscal years, with early adoption permitted. Adoption of ASU 2016-13 will be applied using a modified-retrospective approach through a cumulative-effect adjustment to retained earnings as of the beginning of the first reporting period in which the guidance is effective. We are currently in the process of evaluating the impact, if any, that ASU 2016-13 will have on our condensed consolidated financial statements.
74
3. Business Combinations
On December 6, 2017 the Company completed its acquisition of substantially all of the assets of Railtronix, a leading provider of real-time inventory management solutions for proppant mining, rail shipping and transloading operations, for $9,505 including $5,000 cash consideration, and $4,505 equity consideration of 279,655 Solaris LLC Units and 279,655 shares of Class B common stock. The equity consideration was based on the closing price of our Class A common stock on December 6, 2017 of $16.11.
The purchase price was allocated based on the fair value of $4,697, $225, and $346 for identifiable intangible assets including customer relationships, a non-competition agreement and software, respectively. The amount of consideration in excess of the fair value of identifiable intangible assets of $4,237 was recognized as goodwill. The valuations to derive the allocation of purchase price included a multi period excess earnings valuation method, with or without valuation method, and relief from royalty valuation method estimates using estimates for future cash flows from customer relationships, return on workforce, customer attrition, working capital assumptions, income taxes, competition, costs saved through owning the asset and risk adjusted discount rates.
The goodwill recognized is attributable to expected customer growth as well as expected synergies of integrating Railtronix with the Company’s Solaris Lens inventory management system, which we believe will uniquely position the Company to provide critical supply chain data to help our customers improve the reliability of proppant supply, save time and reduce the delivered cost of proppant by monitoring key data points and performance indicators. A portion of goodwill is expected to be deductible for corporate income tax purposes.
The actual impact of this acquisition was an increase to “Total revenues” of $205 and an increase to “Net income” of $87 in the consolidated statement of operations for the year ended December 31, 2017. The unaudited pro forma results presented below have been prepared to give the effect of the acquisition discussed above on our results of operations for the year ended December 31, 2017 as if it had been consummated on January 1, 2016. The unaudited pro forma results do not purport to represent what our actual results of operations would have been if the acquisition had been completed on such date or to project our results of operation for any future date or period.
|
|
|
|
|
For the Year Ended |
||||||||
|
|
|
|
|
December 31, 2017 |
||||||||
|
|
|
|
|
|
|
Actual |
|
Pro Forma |
||||
|
|
|
|
|
|
|
|
|
|
|
|
||
|
Pro forma (unaudited) |
|
|
|
|
|
|
|
|
|
|
|
|
|
Total revenues |
|
|
|
|
|
|
|
$ |
67,395 |
|
$ |
69,252 |
|
Net income |
|
|
|
|
|
|
|
|
14,677 |
|
|
15,207 |
Certain contingent performance-based cash awards totaling $2,500 are also payable to the seller upon the achievement of generating certain financial milestones. One milestone was completed and $1,625 was recognized and paid in the quarter ending March 31, 2018 and is recorded in other operating expense. The Company has not yet concluded that it is probable that the remaining milestones will be achieved and thus has not recognized the additional $875 obligation in the consolidated financial statements.
4. Prepaid Expenses and Other Current Assets
Prepaid expenses and other currents assets were comprised of the following at December 31, 2019 and 2018:
|
|
|
December 31, |
|
December 31, |
||
|
|
|
2019 |
|
2018 |
||
|
Prepaid purchase orders |
|
$ |
1,055 |
|
$ |
2,802 |
|
Prepaid insurance |
|
|
865 |
|
|
576 |
|
Deposits |
|
|
1,245 |
|
|
882 |
|
Other assets |
|
|
1,837 |
|
|
1,232 |
|
Prepaid expenses and other current assets |
|
$ |
5,002 |
|
$ |
5,492 |
75
5. Property, Plant and Equipment
Property, plant and equipment was comprised of the following at December 31, 2019 and 2018:
|
|
|
December 31, |
|
December 31, |
||
|
|
|
2019 |
|
2018 |
||
|
Systems and related equipment |
|
$ |
294,547 |
|
$ |
258,600 |
|
Systems in process |
|
|
11,867 |
|
|
11,245 |
|
Transloading facility and equipment |
|
|
40,272 |
|
|
40,218 |
|
Computer hardware and software |
1,335 |
1,185 |
||||
|
Machinery and equipment |
|
|
5,214 |
|
|
5,126 |
|
Vehicles |
|
|
7,633 |
|
|
8,334 |
|
Buildings |
|
|
4,339 |
|
|
4,280 |
|
Land |
|
|
612 |
|
|
612 |
|
Furniture and fixtures |
|
|
284 |
|
|
282 |
|
Property, plant and equipment, gross |
|
|
366,103 |
|
|
329,882 |
|
Less: accumulated depreciation |
|
|
(59,520) |
|
|
(33,344) |
|
Property, plant and equipment, net |
|
$ |
306,583 |
|
$ |
296,538 |
Depreciation expense for the years ended December 31, 2019, 2018 and 2017 was $26,146, $17,621 and $6,589, respectively, of which $22,389, $14,920 and $5,792 is attributable to cost of system rental, $1,548, $1,274 and $461 is attributable to cost of proppant system services, $1,643, $954 and $0 is attributable to cost of transloading services, and $566, $473 and $336 is attributable to selling, general and administrative expenses, respectively. The Company capitalized $735, $688 and $668 of depreciation expense associated with machinery and equipment used in the manufacturing of its systems for the years ended December 31, 2019, 2018 and 2017, respectively.
6. Accrued Liabilities
Accrued liabilities were comprised of the following at December 31, 2019 and 2018:
|
|
|
2019 |
|
2018 |
||
|
Property, plant and equipment |
|
$ |
47 |
|
$ |
2,153 |
|
Employee related expenses |
|
|
4,129 |
|
|
4,500 |
|
Selling, general and administrative |
|
|
1,016 |
|
|
944 |
|
Cost of revenue |
|
|
5,062 |
|
|
2,702 |
|
Excise, franchise and sales taxes |
|
|
2,526 |
|
|
1,461 |
|
Ad valorem taxes |
|
|
1,598 |
|
|
774 |
|
Other |
|
|
69 |
|
|
124 |
|
Accrued liabilities |
|
$ |
14,447 |
|
$ |
12,658 |
7. Leases
The Company leases land equipment under operating leases which expire at various dates through February 2047. These land leases included commitments related to 30-year land lease with the State of Oklahoma related to the Company’s Kingfisher Facility. Equipment leases include locomotives rented from third-parties in order to facilitate rail transloading activities at the Kingfisher Facility. Upon completion of the primary term, both parties have substantive rights to terminate the leases. As a result enforceable rights and obligations do not exist under the rental agreements subsequent to the primary term.
Additionally, the Company leases offices and storage from third-parties for our corporate and field locations under operating leases, which include commitments related to the guarantee of lease agreement with Solaris Energy Management, LLC, a related party of the Company, related to the rental to the office space for the Company’s corporate headquarters. Refer to Note 13. “Related Party Transactions” for additional information regarding related party transactions recognized. Upon completion of the primary term, both parties have substantive rights to terminate the
76
leases. As a result, enforceable rights and obligations do not exist under the rental agreements subsequent to the primary term.
Solaris LLC leases property from the City of Early, Texas under an agreement classified as a finance lease. The lease expires on February 25, 2025. The finance lease obligation is payable in monthly installments including imputed interest. The Company also leases certain office equipment with purchase options upon the end of lease terms which are accounted for as finance leases with various expiration dates. As of December 31, 2019 and 2018, the Company had property, plant and equipment under capital leases with a cost of $299 and $299, respectively, and accumulated depreciation of $105 and $85, respectively.
The Company’s lease agreements do not include both lease and non-lease components, extension options or residual value guarantees, and there are no leases that have yet to commence. Additionally, our lease agreements do not impose restrictions on our ability to pay dividends or incur financing obligations.
The components of lease expense were as follows:
|
|
|
December 31, 2019 |
|
|
Operating lease cost (1) (2) |
|
$ |
1,187 |
|
|
|
|
|
|
Finance lease cost |
|
|
|
|
Amortization of ROU assets |
|
|
29 |
|
Interest on lease liabilities |
|
|
6 |
|
Total finance lease cost |
|
$ |
35 |
|
(1) |
Includes short term leases. |
|
(2) |
Operating lease costs of $741, $78 and $368 were reported in Selling, general and administrative, Cost of system services and Cost of transloading services for the year ended December 31, 2019. |
Future minimum lease payments under non-cancellable operating leases as of December 31, 2019 were as follows:
|
Year Ending December 31, |
|
Operating Leases |
|
Finance Leases |
||
|
2020 |
|
$ |
1,116 |
|
|
35 |
|
2021 |
|
|
1,060 |
|
|
33 |
|
2022 |
|
|
1,091 |
|
|
33 |
|
2023 |
|
|
1,100 |
|
|
33 |
|
2024 |
|
|
1,108 |
|
|
33 |
|
Thereafter |
|
|
8,354 |
|
|
11 |
|
Total future minimum lease payments |
|
|
13,829 |
|
|
178 |
|
Less: effects of discounting |
|
|
(5,379) |
|
|
(15) |
|
Total lease liabilities |
|
$ |
8,450 |
|
$ |
163 |
Future minimum lease payments under non-cancellable operating leases as of December 31, 2018 were as follows:
|
Year Ending December 31, |
|
Amount |
|
|
2019 |
|
$ |
1,432 |
|
2020 |
|
|
1,375 |
|
2021 |
|
|
1,299 |
|
2022 |
|
|
1,093 |
|
2023 |
|
|
1,092 |
|
Thereafter |
|
|
9,725 |
|
Total minimum lease payments |
|
$ |
16,016 |
77
Supplemental cash flow information related to leases were as follows:
|
|
|
December 31, 2019 |
|
|
Supplemental Cash Flows Information |
|
|
|
|
Cash paid for amounts included in the measurement of lease liabilities: |
|
|
|
|
Operating cash flows from operating leases |
|
$ |
1,120 |
|
Financing cash flows from finance leases |
|
|
35 |
Other information related to leases was as follows:
|
|
|
December 31, |
|
|
|
|
2019 |
|
|
Weighted Average Remaining Lease Term |
|
|
|
|
Operating leases |
|
|
13.9 years |
|
Finance leases |
|
|
5.4 years |
|
Weighted Average Discount Rate |
|
|
|
|
Operating leases |
|
|
6.3% |
|
Finance leases |
|
|
3.3% |
8. Senior Secured Credit Facility
On April 26, 2019, Solaris LLC entered into an Amended and Restated Credit Agreement (the “2019 Credit Agreement”) by and among Solaris LLC, as borrower, each of the lenders party thereto and Wells Fargo Bank, National Association, as administrative agent. The 2019 Credit Agreement replaced, in its entirety, 2018 credit agreement (the “2018 Credit Agreement”) by and among the Company, as borrower, each of the lenders party thereto and Woodforest National Bank, as administrative agent. The 2019 Credit Agreement consists of an initial $50,000 revolving loan commitment (the “Loan”) with a $25,000 uncommitted accordion option to increase the Loan availability to $75,000. The term of the 2019 Credit Agreement expires on April 26, 2022.
Our obligations under the Loan are generally secured by a pledge of substantially all the assets of Solaris LLC and its subsidiaries, and such obligations are guaranteed by Solaris LLC’s domestic subsidiaries other than Immaterial Subsidiaries (as defined in the 2019 Credit Agreement). We have the option to prepay the loans at any time without penalty.
Borrowings under the 2019 Credit Agreement bear interest at either LIBOR or an alternate base rate plus an applicable margin, and interest is payable quarterly. The applicable margin ranges from 1.75% to 2.50% for Eurodollar loans and 0.75% to 1.50% for alternate base rate loans, in each case depending on our total leverage ratio. The 2019 Credit Agreement requires that we pay a quarterly commitment fee on undrawn amounts of the Loan, ranging from 0.25% to 0.375% depending upon the total leverage ratio.
The 2019 Credit Agreement requires that we maintain ratios of (a) consolidated EBITDA to interest expense of not less than 2.75 to 1.00, (b) senior indebtedness to consolidated EBITDA of not more than 2.50 to 1.00 and (c) the sum of 100% of eligible accounts, inventory and fixed assets to the total revolving exposure of not less than 1.00 to 1.00 when the total leverage ratio is greater than 2.00 to 1.00 and total revolving exposure under the Loan exceeds $3,000. For the purpose of these tests, certain items are subtracted from indebtedness and senior indebtedness. EBITDA, as defined in the 2019 Credit Agreement, excludes certain noncash items and any extraordinary, unusual or nonrecurring gains, losses or expenses.
The 2019 Credit Agreement also requires that we prepay any outstanding borrowings under the Loan in the event our total leverage ratio is greater than 1.00 to 1.00 and our consolidated cash balance exceeds $20,000, taking into account certain adjustments. Capital expenditures are not restricted unless borrowings under the Loan exceed $5,000 for
78
any 180 consecutive day period, in which case capital expenditures will be permitted up to $100,000 plus any unused availability for capital expenditures from the immediately preceding fiscal year.
As of December 31, 2019, we had no borrowings under the 2019 Credit Agreement outstanding and ability to draw $50,000.
As of December 31, 2019 we were in compliance with all covenants in accordance with the 2019 Credit Agreement.
9. Equity
Dividends
Solaris LLC paid distributions totaling $19,260 and $4,713 to all Solaris LLC unitholders in the years ended December 31, 2019 and 2018, respectively, of which $12,760 and $2,750 was paid to Solaris Inc. Solaris Inc. used the proceeds from the distributions to pay quarterly cash dividends to all holders of shares of Class A common stock totaling $12,760 and $2,750 in the years ended December 31, 2019 and 2018, including $282 and $41 related to shares of restricted stock, respectively.
At its November 2019 meeting, our Board of Directors increased our regular quarterly dividend by 5%, raising it to $0.105 per share.
Share Repurchase Program
On December 3, 2019 the Company’s board of directors authorized a share repurchase plan to repurchase up to $25,000 of the Company’s Class A common stock until the plan terminates pursuant to its provisions. During the year ended December 31, 2019, Solaris LLC purchased and retired 251,930 Solaris LLC Units from the Company for $3,254, and the Company purchased and retired 251,930 shares of Class A common stock for $3,254, or $12.90 average price per share. As of December 31, 2019, $21,746 remains authorized for future repurchases of Class A common stock under the share repurchase program.
Stock-based compensation
The Company’s long-term incentive plan for employees, directors and consultants of the Company and its affiliates (the “LTIP”) provides for the grant of all or any of the following types of equity-based awards: (1) incentive stock options qualified as such under United States federal income tax laws; (2) stock options that do not qualify as incentive stock options; (3) stock appreciation rights; (4) restricted stock awards; (5) restricted stock units; (6) bonus stock; (7) performance awards; (8) dividend equivalents; (9) other stock-based awards; (10) cash awards; and (11) substitute awards.
Subject to adjustment in accordance with the terms of the LTIP, 5,118,080 shares of Solaris Inc.'s Class A common stock have been reserved for issuance pursuant to awards under the LTIP. Class A common stock withheld to satisfy exercise prices or tax withholding obligations will be available for delivery pursuant to other awards. The LTIP will be administered by the Board, the Compensation Committee of the Board or an alternative committee appointed by the Board.
A total of 591,261 options to purchase Class A common stock of the Company have been issued to employees, directors and consultants under the LTIP at an exercise price of $2.87 per option, and a weighted average grant date fair value of $12.04 per option. All options were vested by November 13, 2017. During the year ended December 31, 2019, 103,207 options were exercised in exchange for an equal number of shares of Class A common stock and a total of 27,578 shares were surrendered and recorded as treasury stock on the consolidated balance sheets. Cash received from option exercises for the year ended December 31, 2019 was $294. The actual tax expense realized for the tax deductions from option exercises totaled $33 for the year ended December 31, 2019. During the year ended December 31, 2018, 327,594 options were exercised in exchange for an equal number of shares of Class A common stock and a total of 539 shares were surrendered and recorded as treasury stock on the consolidated balance sheets. Cash received from option
79
exercises for the year ended December 31, 2018 was $932. The actual tax expense realized for the tax deductions from option exercises totaled $128 for the year ended December 31, 2018. During the year ended December 31, 2017, 75,130 options were exercised in exchange for an equal number of shares of Class A common stock and a total of 16,354 shares were surrendered and recorded as treasury stock on the consolidated balance sheets. Cash received from option exercises for the year ended December 31, 2017 was $263. The actual tax expense realized for the tax deduction from option exercise totaled $20 for the year ended December 31, 2017. As of December 31, 2019, 522,285 options have been exercised, 33,350 forfeited and 35,626 remain outstanding.
The fair value of each option award is estimated on the date of grant using the Black-Scholes option-pricing model. Expected volatility is based on implied volatilities from historical trading of publicly traded companies which are in the same industry sector. The simplified method is used to derive an expected term. The expected term represents an estimate of the time options are expected to remain outstanding. The risk-free rate for periods within the contractual life of the option is based on the United States treasury yield curve in effect at the time of grant.
In connection with the 2017 grants, the Company used the following assumptions to determine compensation costs for options granted:
|
2017: |
|
|
|
|
Expected volatility |
|
37.84 |
% |
|
Expected term (years) |
|
4.97 |
|
|
Expected annual dividend yield |
|
— |
% |
|
Expected risk-free rate of return |
|
1.42 |
% |
Compensation cost, as measured at the grant date fair value of the award, is recognized as an expense over the employee's requisite service period for service-based awards (generally the vesting period of the award of four years). For the year ended December 31, 2017, the Company recognized $295 of stock-based compensation expense on options in salaries, benefits and payroll taxes in the consolidated statements of operations. All options were vested in 2017 and no further options were granted in the years ended December 31, 2019 and 2018. For the years ended December 31, 2019 and 2018, the Company did not recognize stock-based compensation expense on options.
80
The following is a summary of the option activity under the LTIP for the years ended December 31, 2019, 2018 and 2017:
|
|
|
Options Outstanding |
||||||||
|
|
|
|
|
|
|
|
Weighted |
|
|
|
|
|
|
|
|
|
|
|
Average |
|
|
|
|
|
|
|
|
Weighted |
|
Remaining |
|
Aggregate |
||
|
|
|
|
|
Average Exercise |
|
Contractual |
|
Intrinsic Value |
||
|
|
|
Options |
|
Price |
|
Term (years) |
|
(in thousands) |
||
|
Balance, January 1, 2017 |
|
12,938 |
|
$ |
135.00 |
|
8.67 |
|
$ |
— |
|
Exercisable, January 1, 2017 |
|
3,235 |
|
$ |
135.00 |
|
8.67 |
|
$ |
— |
|
Canceled |
|
(12,938) |
|
|
135.00 |
|
|
|
|
— |
|
Granted |
|
591,261 |
|
|
2.87 |
|
|
|
|
— |
|
Exercised |
|
(91,484) |
|
|
2.87 |
|
|
|
|
— |
|
Forfeited |
|
(33,346) |
|
|
2.87 |
|
|
|
|
— |
|
Balance, December 31, 2017 |
|
466,431 |
|
$ |
2.87 |
|
6.79 |
|
$ |
8,648 |
|
Exercisable, December 31, 2017 |
|
466,431 |
|
$ |
2.87 |
|
6.79 |
|
$ |
8,648 |
|
Canceled |
|
— |
|
|
— |
|
|
|
|
— |
|
Granted |
|
— |
|
|
— |
|
|
|
|
— |
|
Exercised |
|
(327,594) |
|
|
2.87 |
|
|
|
|
— |
|
Forfeited |
|
— |
|
|
— |
|
|
|
|
— |
|
Balance, December 31, 2018 |
|
138,837 |
|
$ |
2.87 |
|
7.92 |
|
$ |
1,280 |
|
Exercisable, December 31, 2018 |
|
138,837 |
|
$ |
2.87 |
|
7.92 |
|
$ |
1,280 |
|
Canceled |
|
— |
|
|
— |
|
|
|
|
— |
|
Granted |
|
— |
|
|
— |
|
|
|
|
— |
|
Exercised |
|
(103,207) |
|
|
2.87 |
|
|
|
|
— |
|
Forfeited |
|
(4) |
|
|
2.87 |
|
|
|
|
— |
|
Balance, December 31, 2019 |
|
35,626 |
|
$ |
2.87 |
|
7.92 |
|
$ |
397 |
|
Exercisable, December 31, 2019 |
|
35,626 |
|
$ |
2.87 |
|
7.92 |
|
$ |
397 |
As of December 31, 2019, the Company had no unvested options outstanding.
81
The Company accounts for its stock-based compensation including grants of restricted stock in the consolidated statements of operations based on their estimated fair values on the date of grant. The following table further summarizes activity related to restricted stock for the years ended December 31, 2019, 2018 and 2017:
|
|
|
Restricted Stock Awards |
|||
|
|
|
|
|
|
|
|
|
|
|
|
Weighted Average |
|
|
|
|
|
|
Grant Date Fair |
|
|
|
|
Number of Shares |
|
Value ($) |
|
|
Issued on May 17, 2017 |
|
648,676 |
|
$ |
12.04 |
|
Awarded |
|
584,477 |
|
|
13.25 |
|
Vested |
|
— |
|
|
— |
|
Forfeited |
|
(14,888) |
|
|
12.87 |
|
Unvested at December 31, 2017 |
|
1,218,265 |
|
$ |
12.61 |
|
Awarded |
|
88,664 |
|
|
16.92 |
|
Vested |
|
(644,387) |
|
|
12.58 |
|
Forfeited |
|
(251,045) |
|
|
12.49 |
|
Unvested at December 31, 2018 |
|
411,497 |
|
$ |
13.67 |
|
Awarded |
|
448,745 |
|
|
16.62 |
|
Vested |
|
(208,697) |
|
|
15.13 |
|
Forfeited |
|
(24,294) |
|
|
15.52 |
|
Unvested at December 31, 2019 |
|
627,251 |
|
$ |
15.23 |
For the year ended December 31, 2019, the Company recognized $34, $262, $13 and $4,167 of stock-based compensation expense on restricted stock in cost of system rental, cost of system services, cost of transloading services and selling, general and administrative, respectively, in the consolidated statements of operations and $187 within property, plant and equipment, net in the consolidated balance sheets. For the year ended December 31, 2018, the Company recognized $6, $191, $3 and $3,661 of stock-based compensation expense on restricted stock in cost of system rental, cost of system services, cost of transloading services and selling, general and administrative, respectively, in the consolidated statements of operations and $1,040 within property, plant and equipment, net in the consolidated balance sheets. For the year ended December 31, 2017, the Company recognized $3,406 of stock-based compensation expense on restricted stock in selling, general and administrative in the consolidated statements of operations and $1,080 within property, plant and equipment, net in the consolidated balance sheets. As of December 31, 2019, total unrecognized compensation cost related to non-vested restricted stock was $6,764, which is expected to be recognized over a weighted-average period of 1.81 years. 348,214 shares, 147,793 shares, and 131,243 shares of restricted stock vest in 2020, 2021 and 2022, respectively.
The number of shares remaining available for future issuance under LTIP is 3,243,549.
Earnings (Loss) Per Share
Basic earnings (loss) per share of Class A common stock is computed by dividing net income attributable to Solaris for periods following the IPO, by the weighted-average number of shares of Class A common stock outstanding during the same period. Diluted earnings (loss) per share is computed giving effect to all potentially dilutive shares.
There were no shares of Class A or Class B common stock outstanding prior to the IPO, therefore, no earnings (loss) per share information has been presented for any period prior to that date.
82
The following table sets forth the calculation of earnings (loss) per share, or EPS, for the years ended December 31, 2019, 2018 and 2017:
|
|
|
Year Ended December, |
|||||||
|
Basic net income (loss) per share: |
|
2019 |
|
2018 |
|
2017 |
|||
|
Numerator |
|
|
|
|
|
|
|
|
|
|
Net income (loss) attributable to Solaris |
|
$ |
52,007 |
|
$ |
42,431 |
|
$ |
(4,174) |
|
Less income attributable to participating securities (1) |
|
|
(1,120) |
|
|
(1,230) |
|
|
— |
|
Net income (loss) attributable to common stockholders |
|
$ |
50,887 |
|
$ |
41,201 |
|
$ |
(4,174) |
|
|
|
|
|
|
|
|
|
|
|
|
Denominator |
|
|
|
|
|
|
|
|
|
|
Weighted average number of unrestricted outstanding common shares used to calculate basic net income per share |
|
|
30,141 |
|
|
25,678 |
|
|
12,117 |
|
Effect of dilutive securities: |
|
|
|
|
|
|
|
|
|
|
Stock options (2) |
|
|
44 |
|
|
151 |
|
|
— |
|
Diluted weighted-average shares of Class A common stock outstanding used to calculate diluted net income per share |
|
|
30,185 |
|
|
25,829 |
|
|
12,117 |
|
|
|
|
|
|
|
|
|
|
|
|
Earnings (loss) per share of Class A common stock - basic |
|
$ |
1.69 |
|
$ |
1.60 |
|
$ |
(0.34) |
|
Earnings (loss) per share of Class A common stock - diluted |
|
$ |
1.69 |
|
$ |
1.59 |
|
$ |
(0.34) |
|
(1) |
The Company's restricted shares of common stock are participating securities. |
|
(2) |
The years ended December 31, 2019 and 2018 include 44 and 151 shares of Class A common stock resulting from an assumed exercise of the stock options in the calculation of the denominator for diluted earnings per common share as these shares were dilutive. |
The following number of weighted-average potentially dilutive shares were excluded from the calculation of diluted earnings per share because the effect of including such potentially dilutive shares would have been antidilutive upon conversion:
|
|
|
Year Ended December, |
|||||||
|
|
|
2019 |
|
2018 |
|
2017 |
|||
|
Class B common stock |
|
|
16,688 |
|
|
20,727 |
|
|
31,100 |
|
Stock options |
|
|
— |
|
|
— |
|
|
365 |
|
Restricted stock awards |
|
|
320 |
|
|
412 |
|
|
225 |
|
Total |
|
|
17,008 |
|
|
21,139 |
|
|
31,690 |
10. Income Taxes
Income Taxes
On December 22, 2017, Public Law No. 115-97, commonly referred to as the Tax Cuts and Jobs Act (the “Tax Act”) was enacted into law. The provisions of the Tax Act that impact us include, but are not limited to, (1) reducing the United States federal corporate income tax rate from 35% to 21%, (2) eliminating the corporate alternative minimum tax (AMT); (3) allowing business to immediately expense the cost of new investments in certain qualified depreciable assets acquired after September 27, 2017 (with a phase-down of such expensing starting in 2023); and (4) reducing the maximum deduction for net operating loss (NOL) carryforwards generated in tax years beginning after December 31, 2017 to 80% of a taxpayer’s taxable income.
83
Income Tax Expense
The components of the income tax expense are:
|
|
|
Year Ended December 31, |
|||||||
|
|
|
2019 |
|
2018 |
|
2017 |
|||
|
Current: |
|
|
|
|
|
|
|
|
|
|
Federal |
|
$ |
— |
|
$ |
— |
|
$ |
— |
|
State |
|
|
814 |
|
|
684 |
|
|
247 |
|
|
|
|
814 |
|
|
684 |
|
|
247 |
|
Deferred: |
|
|
|
|
|
|
|
|
|
|
Federal |
|
|
14,452 |
|
|
11,410 |
|
|
32,195 |
|
State |
|
|
1,670 |
|
|
867 |
|
|
1,267 |
|
|
|
|
16,122 |
|
|
12,277 |
|
|
33,462 |
|
Income tax expense |
|
$ |
16,936 |
|
$ |
12,961 |
|
$ |
33,709 |
Income tax expense differs from the amount computed by applying the 2019 and 2018 statutory federal income tax rate of 21% and the 2017 statutory federal income tax rate of 35% to income before taxes as follows:
|
|
|
Year Ended December 31, |
|||||||
|
|
|
2019 |
|
2018 |
|
2017 |
|||
|
Income before income taxes |
|
$ |
107,296 |
|
$ |
98,913 |
|
$ |
48,386 |
|
Less: net income prior to corporate reorganization |
|
|
— |
|
|
— |
|
|
3,665 |
|
Less: net income before income taxes attributable to noncontrolling interest |
|
|
38,353 |
|
|
43,521 |
|
|
15,439 |
|
Income attributable to Solaris Oilfield Infrastructure, Inc. stockholders before income taxes |
|
|
68,943 |
|
|
55,392 |
|
|
29,282 |
|
Income tax expense (benefit) at the federal statutory rate |
|
|
14,548 |
|
|
11,632 |
|
|
10,249 |
|
State income taxes, net of federal benefit |
|
|
1,740 |
|
|
1,373 |
|
|
1,071 |
|
Remeasurement of federal deferred tax assets due to rate change |
|
|
— |
|
|
— |
|
|
30,447 |
|
Tax Receivable Agreement adjustments |
|
|
— |
|
|
— |
|
|
(8,058) |
|
Other |
|
|
648 |
|
|
(44) |
|
|
— |
|
Income tax (benefit) expense |
|
$ |
16,936 |
|
$ |
12,961 |
|
$ |
33,709 |
Deferred Tax Assets and Liabilities
The Company’s deferred tax position reflects the net tax effects of the temporary differences between the carrying amounts of assets and liabilities for financial reporting purposes and the amounts used for income tax reporting. Significant components of the deferred tax assets and liabilities are as follows:
|
|
|
December 31, |
||||
|
|
|
2019 |
|
2018 |
||
|
Assets: |
|
|
|
|
|
|
|
Investments in subsidiaries |
|
$ |
7,099 |
|
$ |
15,876 |
|
Imputed interest |
|
|
1,587 |
|
|
1,366 |
|
Net operating loss carryforward |
|
|
43,543 |
|
|
41,648 |
|
Total deferred tax assets |
|
|
52,229 |
|
|
58,890 |
|
Liabilities: |
|
|
|
|
|
|
|
Investments in subsidiaries |
|
|
— |
|
|
— |
|
Total deferred tax liabilities |
|
|
— |
|
|
— |
|
Net deferred tax asset |
|
$ |
52,229 |
|
$ |
58,890 |
The largest components of the Company’s deferred tax position relate to the Company’s investment in Solaris LLC and net operating loss carryovers. The Company recorded a deferred tax asset and additional paid-in capital for the difference between the book value and the tax basis of the Company’s investment in Solaris LLC. This difference
84
originates from the IPO and November Offering, exchanges of Solaris LLC Units (together with a corresponding number of shares of Class B common stock) for shares of Class A common stock and from certain stock-based compensation.
As of December 31, 2019, the Company had approximately $197.3 million of federal net operating loss carryovers and $52.0 million of state net operating loss carryovers. $131.5 million of such federal net operating loss carryovers have no expiration date and the remaining federal net operating loss carryovers expire in 2037. State net operating loss carryovers will expire in varying amounts beginning in 2037.
The Company regularly reviews its deferred tax assets, including net operating loss carryovers, for recoverability and a valuation allowance is provided when it is more likely than not that some portion or all of a deferred tax asset may not be realized. The ultimate realization of deferred tax assets is dependent upon the generation of future taxable income during the periods in which the temporary differences are deductible. In assessing the need for a valuation allowance, the Company makes estimates and assumptions regarding projected future taxable income, its ability to carry back operating losses to prior periods, the reversal of deferred tax liabilities and the implementation of tax planning strategies. Based on our cumulative earnings history and forecasted future sources of taxable income, we believe that we will be able to realize our deferred tax assets in the future. As the Company reassesses these assumptions in the future, changes in forecasted taxable income may alter this expectation and may result in an increase to the valuation allowance and an increase in the effective tax rate.
Uncertain Tax Benefits
The Company evaluates its tax positions and recognizes only tax benefits that, more likely than not, will be sustained upon examination, including resolution of any related appeals or litigation processes, based on the technical merits of the position. The tax position is measured at the largest amount of benefit that has a greater than 50.0% likelihood of being realized upon settlement. As of December 31, 2019 and 2018, the Company’s uncertain tax benefits totaling $816 and $816, respectively, are reported as a component of the net deferred tax asset in the consolidated balance sheets. The full balance of unrecognized tax benefits as of December 31, 2019, if recognized, would affect the effective tax rate. However, we do not believe that any of the unrecognized tax benefits will be realized within the coming year. The Company has elected to recognize interest and penalties related to unrecognized tax benefits in income tax expense notwithstanding the fact that, as of December 31, 2019, the Company has not accrued any penalties or interest. The addition to uncertain tax benefits during the year ended December 31, 2018 related to the treatment of certain costs incurred in connection with the IPO and November Offering. Changes in the Company’s gross unrecognized tax benefits are as follows:
|
|
|
Year Ended December 31, |
|||||||
|
|
|
2019 |
|
2018 |
|
2017 |
|||
|
Balance, January 1, |
|
$ |
816 |
|
$ |
812 |
|
$ |
— |
|
Additions for the current year tax |
|
|
— |
|
|
— |
|
|
812 |
|
Additions related to prior years |
|
|
— |
|
|
4 |
|
|
— |
|
Balance, December 31, |
|
$ |
816 |
|
$ |
816 |
|
$ |
812 |
Payables Related to the Tax Receivable Agreement
As of December 31, 2019, our liability under the Tax Receivable Agreement was $67,998, representing 85% of the calculated net cash savings in United States federal, state and local income tax or franchise tax that Solaris Inc. anticipates realizing in future years from certain increases in tax basis and certain tax benefits attributable to imputed interest as a result of Solaris Inc.’s acquisition (or deemed acquisition for United States federal income tax purposes) of Solaris LLC Units in connection with the IPO or pursuant to an exercise of the Redemption Right or the Call Right (each as defined in the Solaris LLC Agreement).
The projection of future taxable income involves significant judgment. Actual taxable income may differ from our estimates, which could significantly impact our liability under the Tax Receivable Agreement. We have determined it is more-likely-than-not that we will be able to utilize all of our deferred tax assets subject to the Tax Receivable Agreement; therefore, we have recorded a liability under the Tax Receivable Agreement related to the tax savings we may realize from certain increases in tax basis and certain tax benefits attributable to imputed interest as a result of
85
Solaris Inc.’s acquisition (or deemed acquisition for United States federal income tax purposes) of Solaris LLC Units in connection with the IPO or pursuant to an exercise of the Redemption Right or the Call Right (each as defined in the Solaris LLC Agreement). If we determine the utilization of these deferred tax assets is not more-likely-than-not in the future, our estimate of amounts to be paid under the Tax Receivable Agreement would be reduced. In this scenario, the reduction of the liability under the Tax Receivable Agreement would result in a benefit to our consolidated statement of operations.
11. Concentrations
For the year ended December 31, 2019, two customers accounted for 19% and 10% of the Company’s revenue. For the year ended December 31, 2018, three customers accounted for 15%, 10% and 10% of the Company’s revenue. For the year ended December 31, 2017, four customers accounted for 23%, 15%, 13%, and 11% of the Company’s revenue. As of December 31, 2019, one customers accounted for 15% of the Company’s accounts receivable. As of December 31, 2018, three customers accounted for 20%, 10% and 10% of the Company’s accounts receivable.
For the year ended December 31, 2019, one supplier accounted for 19% of the Company’s total purchases. For the year ended December 31, 2018, two suppliers accounted for 13% and 11% of the Company’s total purchases. For the year ended December 31, 2017, no supplier accounted for 10% or more of the Company’s total purchases. As of December 31, 2019, one supplier accounted for 44% of the Company’s accounts payable. As of December 31, 2018, one supplier accounted for 13% of the Company’s accounts payable.
12. Commitments and Contingencies
In the normal course of business, the Company is subjected to various claims, legal actions, contract negotiations and disputes. The Company provides for losses, if any, in the year in which they can be reasonably estimated. In management’s opinion, there are currently no such matters outstanding that would have a material effect on the accompanying consolidated financial statements.
Other Commitments
In the normal course of business, the Company has certain short-term purchase obligations and commitments for products and services, primarily related to purchases of materials used in the manufacturing of its systems. As of December 31, 2019 and 2018, the Company had commitments of approximately $2,575 and $18,998, respectively, related to these commitments.
In connection with the acquisition of Railtronix, the seller is entitled to certain performance-based cash awards totaling $2,500 upon the achievement of certain financial milestones. As of December 31, 2019, one milestone had been achieved and the Company paid and recognized $1,625 in March 2018 in other operating expense in the consolidated statements of operations. However, as of December 31, 2019, the Company had not concluded that the remaining milestone will be achieved and thus has not recognized additional obligations in the consolidated financial statements.
The Company has executed a guarantee of lease agreement with Solaris Energy Management, LLC, a related party of the Company, related to the rental of office space for the Company’s corporate headquarters. The total future guaranty under the guarantee of lease agreement with Solaris Energy Management, LLC is $8,815 as of December 31, 2019. Refer to Note 13. “Related Party Transactions” for additional information regarding related party transactions recognized and Note 7. “Leases” for operating lease discussion.
13. Related Party Transactions
The Company recognizes certain costs incurred in relation to transactions with entities owned or partially owned by William A. Zartler, the Chief Executive Officer and Chairman of the Board. These costs include rent paid for office space, travel services, personnel, consulting and administrative costs. For the years ended December 31, 2019, 2018 and 2017, Solaris LLC paid $1,127, $1,022 and $910 , respectively, for these services. As of December 31, 2019 and 2018, the Company included $233 and $232, respectively, in prepaid expenses and other current assets on the consolidated
86
balance sheets. Additionally, as of December 31, 2019 and 2018, the Company included $74 and $103, respectively, of accruals to related parties in accrued liabilities on the consolidated balance sheet.
These costs are primarily incurred in connection with the administrative services agreement, dated May 17, 2017, between Solaris LLC and Solaris Energy Management, LLC, a company partially owned by William A. Zartler.
Payables Related to the Tax Receivable Agreement
In connection with the IPO, Solaris Inc. entered into the Tax Receivable Agreement with the TRA Holders on May 17, 2017, including certain of our officers, directors and employees. See Note 10. “–Income Taxes” for further discussion of the impact of the Tax Receivable Agreement on Solaris Inc.
14. Subsequent Events
Share Repurchase Program
Subsequent to the balance sheet date and through February 14, 2020, Solaris LLC purchased and retired 1,131 Solaris LLC Units from the Company for $13,912, and the Company purchased and retired 1,131 shares of Class A common stock for $13,912, or $12.29 average price per share. As of February 14, 2020, $7,834 remains authorized for future repurchases of Class A common stock under the share repurchase program.
15. Selected Quarterly Financial Data (Unaudited)
|
|
|
Three Months Ended |
||||||||||
|
|
|
March 31, |
|
June 30, |
|
September 30, |
|
December 31, |
||||
|
|
|
(in thousands, except per share amounts) |
||||||||||
|
2019 |
|
|
|
|
|
|
|
|
|
|
|
|
|
Total revenue |
|
$ |
55,124 |
|
$ |
64,101 |
|
$ |
59,604 |
|
$ |
62,858 |
|
Operating income |
|
|
27,727 |
|
|
27,323 |
|
|
22,793 |
|
|
30,087 |
|
Net income |
|
|
23,435 |
|
|
22,509 |
|
|
19,082 |
|
|
25,334 |
|
Net income attributable to Solaris |
|
|
12,317 |
|
|
13,275 |
|
|
11,398 |
|
|
15,017 |
|
Earnings per share of Class A common stock - basic |
|
$ |
0.43 |
|
$ |
0.42 |
|
$ |
0.36 |
|
$ |
0.48 |
|
Earnings per share of Class A common stock - diluted |
|
$ |
0.43 |
|
$ |
0.42 |
|
$ |
0.36 |
|
$ |
0.48 |
|
|
|
|
|
|
|
|
|
|
|
|
|
|
|
2018 |
|
|
|
|
|
|
|
|
|
|
|
|
|
Total revenue |
|
$ |
36,018 |
|
$ |
47,155 |
|
$ |
56,686 |
|
$ |
57,337 |
|
Operating income |
|
|
15,526 |
|
|
24,796 |
|
|
30,790 |
|
|
28,175 |
|
Net income |
|
|
13,415 |
|
|
21,448 |
|
|
26,437 |
|
|
24,652 |
|
Net income (loss) attributable to Solaris |
|
|
5,930 |
|
|
10,597 |
|
|
13,019 |
|
|
12,885 |
|
Earnings (loss) per share of Class A common stock - basic |
|
$ |
0.24 |
|
$ |
0.40 |
|
$ |
0.49 |
|
$ |
0.47 |
|
Earnings (loss) per share of Class A common stock - diluted |
|
$ |
0.23 |
|
$ |
0.40 |
|
$ |
0.49 |
|
$ |
0.47 |
During the preparation of the financial statements for the year ended December 31, 2019, we identified that the weighted average share and Earnings per share amounts for the nine months ended September 30, 2019 and related footnote disclosures were misstated in the interim financial statements filed on Form 10-Q for the quarter ended September 30, 2019. Other than as noted above, this error had no impact on the interim financial statements for the quarter or nine months ended September 30, 2019 or the quarterly data presented above. Basic and diluted weighted average shares should have been 29,874 and 29,923, respectively, instead of 27,270 and 27,317, respectively, and earnings per share – basic and diluted should have been $1.21 instead of $1.33. Management evaluated the error on previously issued financial statements and concluded the impact was immaterial. These amounts and related footnote disclosure will be revised when the September 30, 2020 financial information is filed.
87
Item 9. Changes in and Disagreements with Accountants on Accounting and Financial Disclosure
None.
Item 9A. Controls and Procedures
Evaluation of Disclosure Controls and Procedures
In accordance with Exchange Act Rules 13a-15 and 15d-15, we have evaluated, under the supervision and with the participation of our management, including our principal executive officer and principal financial officer, the effectiveness of the design and operation of our disclosure controls and procedures (as defined in Rules 13a-15(e) and 15d-15(e) under the Exchange Act) as of December 31, 2019. Our disclosure controls and procedures are designed to provide reasonable assurance that the information required to be disclosed by us in reports that we file under the Exchange Act is accumulated and communicated to our management, including our principal executive officer and principal financial officer, as appropriate, to allow timely decisions regarding required disclosure and is recorded, processed, summarized and reported within the time periods specified in the rules and forms of the SEC. Based on the evaluation of our disclosure controls and procedures as of December 31, 2019, our principal executive officer and principal financial officer have concluded that, as of such date, our disclosure controls and procedures were effective at the reasonable assurance level.
Management’s Annual Report on Internal Control over Financial Reporting
Management, including the principal executive officer and principal financial officer, is responsible for establishing and maintaining adequate internal control over financial reporting for the registrant, as defined in Rule 13a-15(f) under the Exchange Act. Our internal control over financial reporting is designed to provide reasonable assurance regarding the reliability of financial reporting and the preparation of the consolidated financial statements for external purposes in accordance with GAAP.
Because of its inherent limitations, internal control over financial reporting may not prevent or detect misstatements. Also, projections of any evaluation of effectiveness to future periods are subject to the risk that controls may become inadequate because of changes in conditions, or that the degree of compliance with the policies or procedures may deteriorate.
Management assessed the effectiveness of our internal control over financial reporting as of December 31, 2019, using the criteria in Internal Control-Integrated Framework (2013) issued by the Committee of Sponsoring Organizations of the Treadway Commission (“COSO”). Based on this evaluation, management, including the Chief Executive Officer and Chief Financial Officer, believes that our internal control over financial reporting was effective as of December 31, 2019.
Management’s Annual Report on Internal Control over Financial Reporting
This annual report does not include an attestation report of our independent registered public accounting firm regarding internal controls over financial reporting. We are not required to have, nor did we engage our independent audit firm to perform, an audit of the effectiveness of our internal controls over financial reporting for as long as we are an “emerging growth company” pursuant to the provisions of the JOBS Act.
Changes in Internal Control over Financial Reporting
Subsequent to filing the Company’s Quarterly Report on Form 10-Q for the quarter ended March 31, 2019, the Company determined there was an error affecting the deferred tax asset, additional paid-in capital, non-controlling interest and retained earnings accounts reported in the Company’s Annual Reports on Forms 10-K for the periods ended December 31, 2017 and 2018, and in the Company’s Quarterly Reports on Forms 10-Q during 2018 and for the period ended March 31, 2019. As a result, we identified and disclosed a material weakness related to the accounting of the Company’s investment in Solaris LLC. Specifically, certain control activities over the completeness and accuracy of inputs used in the calculation of the Company’s investment in Solaris LLC related to the November 2017 Offering,
88
exchanges of membership interests in Solaris LLC (together with a corresponding number of shares of Class B common stock) for shares of Class A common stock, and contributions of Class A shares in connection with stock based compensation, were not designed to operate effectively.
To remediate the material weakness, we have new implemented new controls over the reconciliation and rollforward of equity and tax accounts, ii) added levels of management review procedures and iii) required additional training to technical accounting and finance personnel. Based on testing performed by management, we believe the implemented controls are operating effectively and the material weaknesses have been remediated as of December 31, 2019. There were no other changes in our internal control over financial reporting during the year ended December 31, 2019 that materially affected, or are reasonably likely to materially affect, our internal control over financial reporting.
Not applicable.
89
Item 10. Directors, Executive Officers and Corporate Governance
Information as to Item 10 will be set forth in the Proxy Statement for the Annual Meeting of Shareholders to be held on May 13, 2020 (the “Annual Meeting”) and is incorporated herein by reference.
The Company’s Code of Business Conduct and Ethics (“Code of Conduct”) can be found on the Company’s website located at www.solarisoilfield.com, under the “Governance Documents” tab within the “Investor Relations” tab. Any shareholder may request a printed copy of the Code of Conduct by submitting a written request to the Company’s Chief Legal Officer. If the Company amends the Code of Conduct or grants a waiver, including an implicit waiver, on behalf of the Chief Executive Officer, Chief Financial Officer or Chief Accounting Officer from the Code of Conduct, the Company will disclose the information on its website. The waiver information will remain on the website for at least 12 months after the initial disclosure of such waiver.
Item 11. Executive Compensation
Information as to Item 11 will be set forth in the Proxy Statement for the Annual Meeting and is incorporated herein by reference.
Item 12. Security Ownership of Certain Beneficial Owners and Management and Related Stockholder Matters
Information as to Item 12 will be set forth in the Proxy Statement for the Annual Meeting and is incorporated herein by reference.
Item 13. Certain Relationships and Related Transactions, and Director Independence
Information as to Item 13 will be set forth in the Proxy Statement for the Annual Meeting and is incorporated herein by reference.
Item 14. Principal Accounting Fees and Services
Information as to Item 14 will be set forth in the Proxy Statement for the Annual Meeting and is incorporated herein by reference.
90
Item 15. Exhibits and Financial Statement Schedules
(1) Financial Statements
The consolidated financial statements of Solaris Oilfield Infrastructure, Inc. and Subsidiaries and the Report of Independent Registered Public Accounting Firm are included in Part II, Item 8 “Financial Statements and Supplementary Data” of this Annual Report. Reference is made to the accompanying Index to Consolidated Financial Statements.
(2) Financial Statement Schedules
All financial statement schedules have been omitted because they are not applicable or the required information is presented in the financial statements or the notes thereto.
(3) Index to Exhibits
The exhibits required to be filed or furnished pursuant to Item 601 of Regulation S-K are set forth below.
|
Exhibit No. |
Description |
|
|
3.1 |
||
|
3.2 |
||
|
4.1 |
||
|
4.2 |
||
|
4.3* |
Description of Securities Registered under Section 12(b) of the Act |
|
|
10.1† |
||
|
10.2† |
||
|
10.3† |
||
|
10.4 |
||
|
10.5 |
||
|
10.6 |
||
|
10.7 |
||
|
10.8 |
||
|
10.9 |
||
|
10.10 |
91
|
10.11 |
||
|
10.12 |
||
|
10.13 |
||
|
10.14 |
||
|
10.15 |
||
|
10.16 |
||
|
10.17 |
||
|
10.18+ |
||
|
10.19+ |
||
|
10.20 |
||
|
10.21 |
||
|
21.1* |
||
|
23.1* |
||
|
31.1* |
Certification of Chief Executive Officer pursuant to Section 302 of the Sarbanes-Oxley Act of 2002. |
|
|
31.2* |
Certification of Chief Financial Officer pursuant to Section 302 of the Sarbanes-Oxley Act of 2002. |
|
|
32.1** |
||
|
32.2** |
||
|
101.INS* |
XBRL Instance Document. |
|
|
101.SCH* |
XBRL Taxonomy Extension Schema Document. |
|
|
101.CAL* |
XBRL Taxonomy Extension Calculation Linkbase Document. |
|
|
101.DEF* |
XBRL Taxonomy Extension Definition Linkbase Document. |
|
|
101.LAB* |
XBRL Taxonomy Extension Labels Linkbase Document. |
|
|
101.PRE* |
XBRL Taxonomy Extension Presentation Linkbase Document. |
* Filed herewith
** Furnished herewith. Pursuant to SEC Release No. 33 8212, this certification will be treated as “accompanying” this Annual Report and not “filed” as part of such report for purposes of Section 18 of the Exchange Act or otherwise subject to the liability of Section 18 of the Exchange Act, and this certification will not be deemed to be incorporated by reference into any filing under the Securities Act, except to the extent that the registrant specifically incorporates it by reference.
†Management contract or compensatory plan or arrangement.
+Certain portions have been omitted pursuant to a confidential treatment request. Omitted information has been separately filed with the Securities and Exchange Commission.
92
93
Pursuant to the requirements of the Securities Exchange Act of 1934, the registrant has duly caused this report to be signed on its behalf by the undersigned thereunto duly authorized.
|
|
SOLARIS OILFIELD INFRASTRUCTURE, INC. |
|
|
|
|
|
|
|
By: |
/s/ William A. Zartler |
|
|
|
William A. Zartler |
|
|
|
Chairman and Chief Executive Officer |
|
|
Date: February 18, 2020 |
|
Pursuant to the requirements of the Securities Exchange Act of 1934, this report has been signed below by the following persons on behalf of the registrant and in the capacities indicated on February 18, 2020.
|
Signature |
|
Title |
|
|
|
|
|
/s/ William A. Zartler |
|
Chairman and Chief Executive Officer (Principal Executive Officer) |
|
William A. Zartler |
|
|
|
|
|
|
|
/s/ Kyle S. Ramachandran |
President and Chief Financial Officer (Principal Financial Officer) |
|
|
Kyle S. Ramachandran |
|
|
|
|
|
|
|
/s/ Lindsay R. Bourg |
|
Chief Accounting Officer (Principal Accounting Officer) |
|
Lindsay R. Bourg |
|
|
|
|
|
|
|
/s/ James R. Burke |
|
Director |
|
James R. Burke |
|
|
|
|
|
|
|
/s/ Cynthia M. Durrett |
|
Director |
|
Cynthia M. Durrett |
|
|
|
|
|
|
|
/s/ Edgar R. Giesinger |
|
Director |
|
Edgar R. Giesinger |
|
|
|
|
|
|
|
/s/ W. Howard Keenan, Jr. |
|
Director |
|
W. Howard Keenan, Jr. |
|
|
|
|
|
|
|
/s/ F. Gardner Parker |
|
Director |
|
F. Gardner Parker |
|
|
|
|
|
|
|
/s/ A. James Teague |
|
Director |
|
A. James Teague |
|
|
|
|
|
|
|
/s/ Ray N. Walker, Jr. |
|
Director |
|
Ray N. Walker, Jr. |
|
|
94