Attached files
| file | filename |
|---|---|
| EX-99.1 - EX-99.1 - GENTHERM Inc | thrm-ex991_6.htm |
| 8-K - 8-K - GENTHERM Inc | thrm-8k_20200219.htm |
2019 Fourth Quarter Results Gentherm, Inc. February 19, 2020 Exhibit 99.2
Forward-Looking Statement Except for historical information contained herein, statements in this presentation are forward-looking statements that are made pursuant to the safe harbor provisions of the Private Securities Litigation Reform Act of 1995. These forward-looking statements represent Gentherm Incorporated's goals, beliefs, plans and expectations about its prospects for the future and other future events. The forward-looking statements included in this presentation are made as of the date hereof or as of the date specified herein and are based on management's reasonable expectations and beliefs. Such statements are subject to a number of important assumptions, risks, uncertainties and other factors that may cause actual results or performance to differ materially from that described in or indicated by the forward-looking statements. Those risks include, but are not limited to, risks that: declines in automobile production may have an adverse impact; sales may not increase and the projected future sales volumes on which the Company manages its business may be inaccurate; new or improved competing products may be developed by competitors with greater resources; customer preferences may shift, including due to the evolving use of automobiles and technology; the Company may lose suppliers or customers; market acceptance of the Company’s existing or new products may decrease; currency exchange rates may change unfavorably; pricing pressures from customers may increase; the macroeconomic environment may present adverse conditions; new products may not be feasible; additional financing may not be available, if needed; work stoppages impacting the Company, its suppliers or customers, due to labor matters, civil or political unrest, infectious diseases and epidemics or other reasons, could harm the Company’s operations; free trade agreements may be altered or additional tariffs may be implemented; customers may not accept pass-through of tariff costs; the Company may be unable to protect its intellectual property in certain jurisdictions; there may be manufacturing or design defects or other quality issues with the Company’s products; the Company may be unable to effectively implement ongoing restructuring and other cost-savings measures or realize the full amount of estimated savings; the Company’s business may be harmed by security breaches and other disruptions to its IT systems; the Company may be unable to repurchase its shares of common stock at favorable prices or at all; the Company may not be able to comply with restrictions under the Company’s debt agreements; the Company may be unable to comply with or may incur increased costs associated with complying with domestic and international regulations, which could change in an unfavorable manner; and other adverse conditions in the industries in which the Company operates may negatively affect its results. The foregoing risks should be read in conjunction with the Company's filings with the Securities and Exchange Commission (the “SEC”), including “Risk Factors,” in its most recent Annual Report on Form 10-K and subsequent quarterly reports, for a discussion of these and other risks and uncertainties. In addition, the business outlook discussed in this release does not include the potential impact of any business combinations, acquisitions, divestitures, strategic investments and other significant transactions that may be completed after the date hereof, each of which may present material risks to the Company’s business and financial results. Except as required by law, the Company expressly disclaims any obligation or undertaking to update any forward-looking statements to reflect any change in its expectations with regard thereto or any change in events, conditions or circumstances on which any such statement is based.
In addition to the results reported in accordance with GAAP throughout this presentation, the Company has provided information regarding Adjusted EBITDA, Adjusted EPS, free cash flow and adjusted operating expenses (as a % of revenue), each a non-GAAP financial measure. The Company defines Adjusted EBITDA as earnings before interest, taxes, depreciation and amortization, deferred financing cost amortization, and other gains and losses that the Company believes is not reflective of its ongoing operations and related tax effects including transaction expenses, debt retirement expenses, impairment of assets held for sale, gain or loss on sale of business, restructuring expense, unrealized currency gain or loss and unrealized revaluation of derivatives. The Company defines Adjusted EPS as earnings per share on a diluted basis, adjusted by gains and losses that the Company believes is not reflective of its ongoing operations and related tax effects including transaction expenses, debt retirement expenses, impairment of assets held for sale, gain or loss on sale of business, restructuring expense, unrealized currency gain or loss and unrealized revaluation of derivatives. The Company defines free cash flow as cash flow from operating activities less capital expenditures. The Company defines adjusted operating expenses (as a % of revenue) as operating expenses adjusted by restructuring expense and other matters that the Company believes is not reflective of its ongoing capital expenditures and related tax effects. In evaluating its business, the Company considers and uses Adjusted EBITDA, Adjusted EPS and adjusted operating expenses (as a % of revenue) as supplemental measures of its operating performance, and free cash flow as a supplemental measure of its liquidity. Management provides these non-GAAP measures so that investors will have the same financial information that management uses with the belief that it will assist investors in properly assessing the Company's performance and liquidity, respectively, on a period-over-period basis. Other companies in our industry may calculate these non-GAAP financial measures differently than we do and those calculations may not be comparable to our metrics. These non-GAAP measures have limitations as analytical tools, and when assessing the Company's operating performance and liquidity, respectively, investors should not consider these non-GAAP measures in isolation, or as a substitute for net income, earnings per share or other consolidated income statement data or cash flows from operations or other consolidated cash flow data, respectively, prepared in accordance with GAAP. Non-GAAP measures referenced in this presentation may include estimates of future performance. Such forward-looking non-GAAP measures may differ significantly from the corresponding GAAP measures, due to depreciation and amortization, tax expense, and/or interest expense, some or all of which management has not quantified for the future periods and therefore the Company has not provided a reconciliation for such forward-looking non-GAAP measures. . Use of Non-GAAP Financial Measures* * See Appendix for certain reconciliations of GAAP to non-GAAP historical financial measures
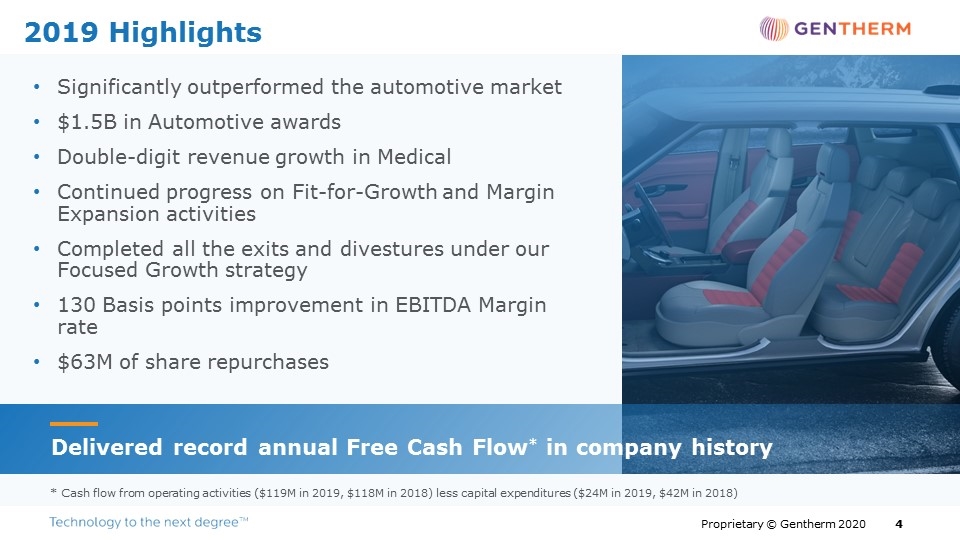
Delivered record annual Free Cash Flow* in company history 2019 Highlights Significantly outperformed the automotive market $1.5B in Automotive awards Double-digit revenue growth in Medical Continued progress on Fit-for-Growth and Margin Expansion activities Completed all the exits and divestures under our Focused Growth strategy 130 Basis points improvement in EBITDA Margin rate $63M of share repurchases * Cash flow from operating activities ($119M in 2019, $118M in 2018) less capital expenditures ($24M in 2019, $42M in 2018)
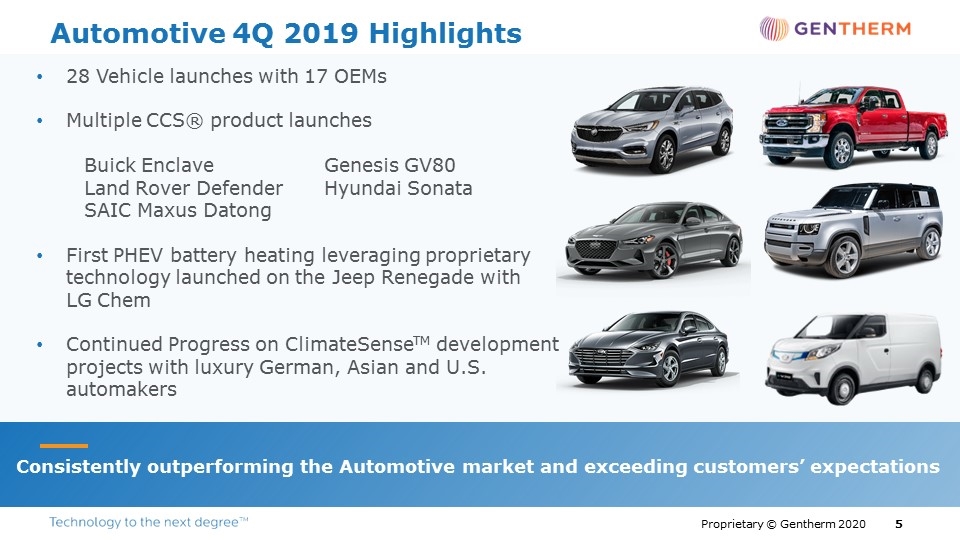
28 Vehicle launches with 17 OEMs Multiple CCS® product launches Buick EnclaveGenesis GV80 Land Rover Defender Hyundai Sonata SAIC Maxus Datong First PHEV battery heating leveraging proprietary technology launched on the Jeep Renegade with LG Chem Continued Progress on ClimateSenseTM development projects with luxury German, Asian and U.S. automakers Consistently outperforming the Automotive market and exceeding customers’ expectations Automotive 4Q 2019 Highlights
Record $560M in awards in 4Q across 18 OEMs Multiple CCS® awards FAW-VWFCAGeneral Motors HondaHyundaiMazda PSASAICSubaru Steering Wheel Heater awards across 8 OEMs First BEV Cell Connecting Board award leveraging proprietary technology with a Premium German OEM Significant Electronics wins with Ford and General Motors Automotive Awards Secured $1.5B of new awards from global OEMs in 2019
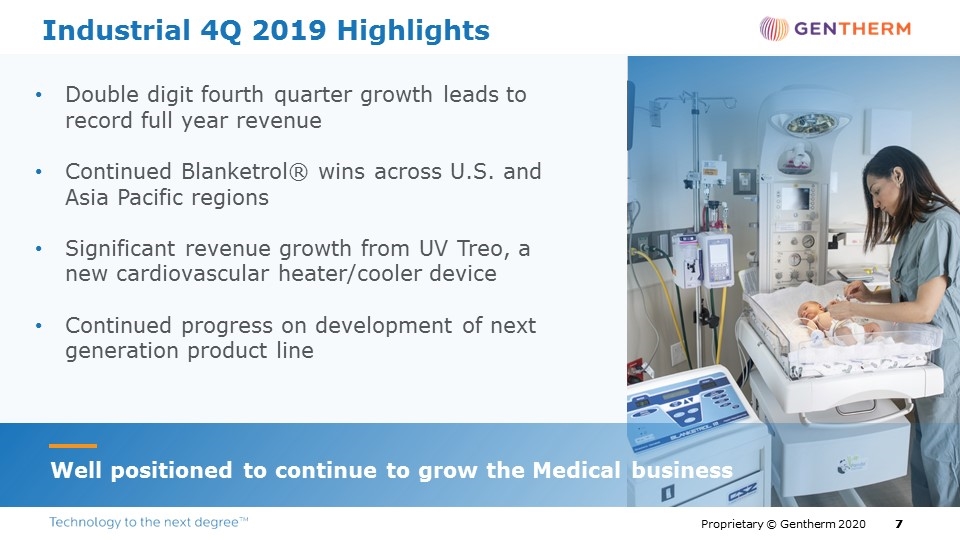
Industrial 4Q 2019 Highlights Well positioned to continue to grow the Medical business Double digit fourth quarter growth leads to record full year revenue Continued Blanketrol® wins across U.S. and Asia Pacific regions Significant revenue growth from UV Treo, a new cardiovascular heater/cooler device Continued progress on development of next generation product line
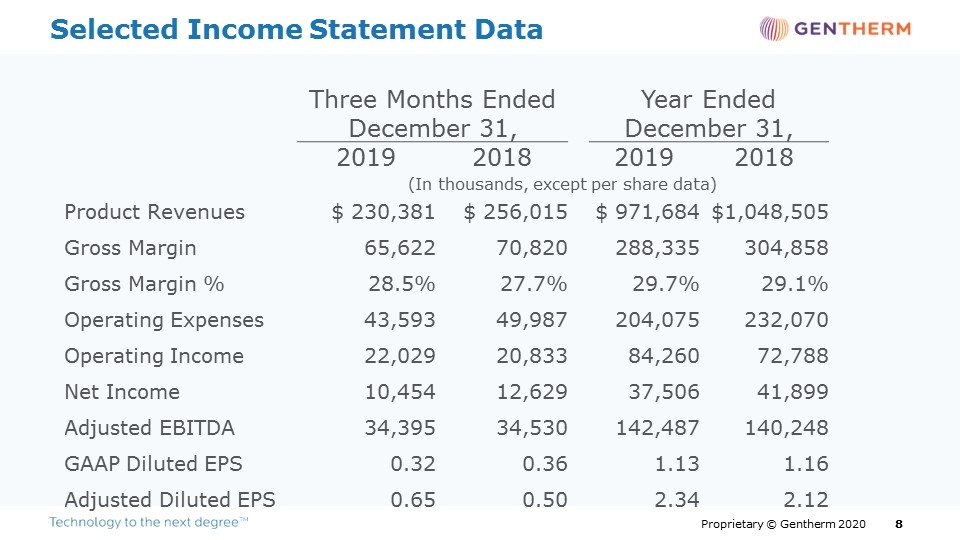
Selected Income Statement Data Three Months Ended December 31, Year Ended December 31, 2019 2018 2019 2018 (In thousands, except per share data) Product Revenues $ 230,381 $ 256,015 $ 971,684 $1,048,505 Gross Margin 65,622 70,820 288,335 304,858 Gross Margin % 28.5% 27.7% 29.7% 29.1% Operating Expenses 43,593 49,987 204,075 232,070 Operating Income 22,029 20,833 84,260 72,788 Net Income 10,454 12,629 37,506 41,899 Adjusted EBITDA 34,395 34,530 142,487 140,248 GAAP Diluted EPS 0.32 0.36 1.13 1.16 Adjusted Diluted EPS 0.65 0.50 2.34 2.12
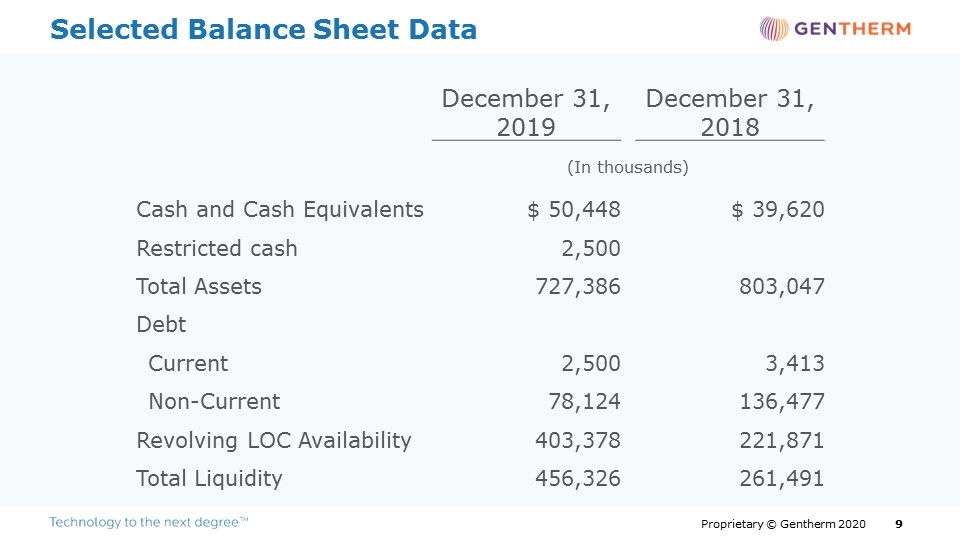
Selected Balance Sheet Data December 31, 2019 December 31, 2018 (In thousands) Cash and Cash Equivalents $ 50,448 $ 39,620 Restricted cash 2,500 Total Assets 727,386 803,047 Debt Current 2,500 3,413 Non-Current 78,124 136,477 Revolving LOC Availability 403,378 221,871 Total Liquidity 456,326 261,491
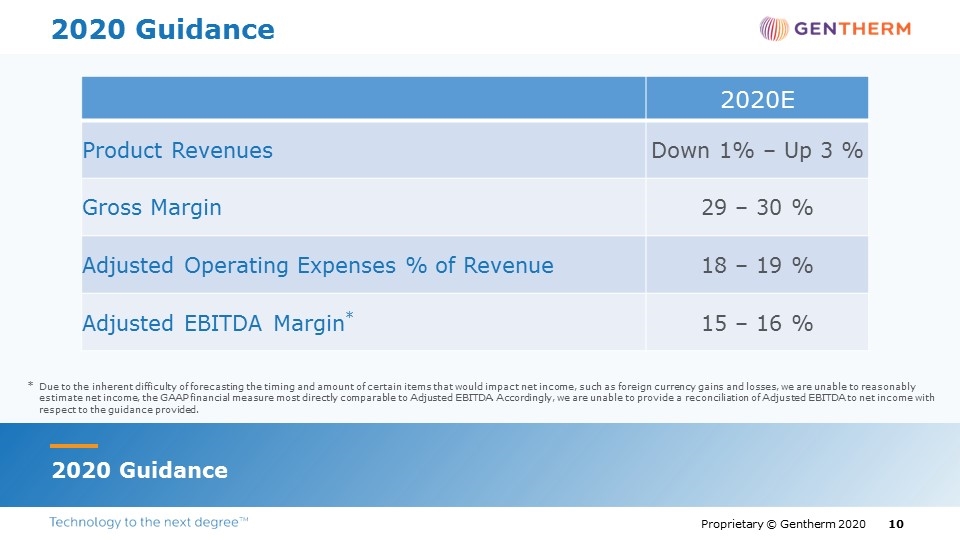
2020 Guidance 2020 Guidance * Due to the inherent difficulty of forecasting the timing and amount of certain items that would impact net income, such as foreign currency gains and losses, we are unable to reasonably estimate net income, the GAAP financial measure most directly comparable to Adjusted EBITDA. Accordingly, we are unable to provide a reconciliation of Adjusted EBITDA to net income with respect to the guidance provided. 2020E Product Revenues Down 1% – Up 3 % Gross Margin 29 – 30 % Adjusted Operating Expenses % of Revenue 18 – 19 % Adjusted EBITDA Margin* 15 – 16 %

Appendix
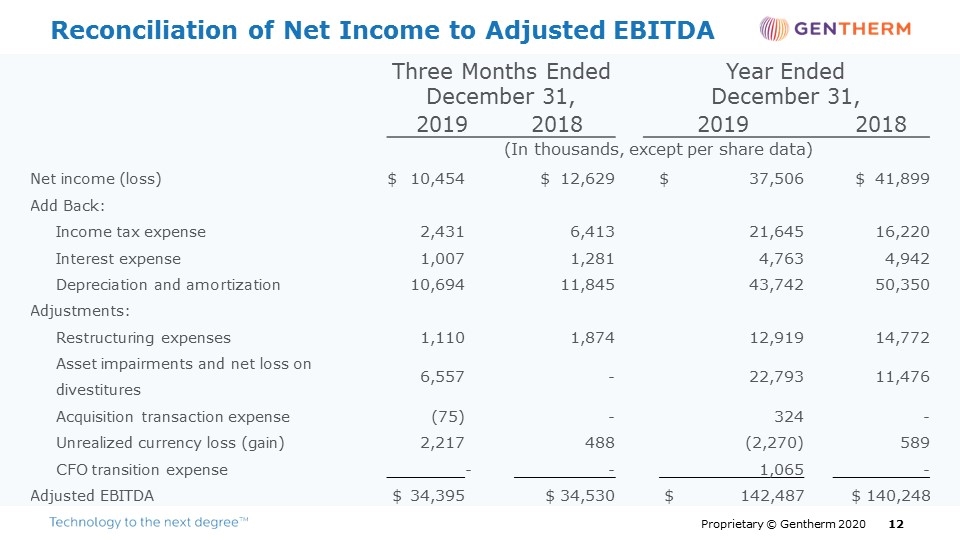
Reconciliation of Net Income to Adjusted EBITDA Three Months Ended December 31, Year Ended December 31, Year Ended December 31, 2019 2017 2018 2019 2018 2017 2018 (In thousands, except per share data) Net income (loss) $ 10,454 $ (5,242) $ 12,629 $ 37,506 $ 41,899 Add Back: Income tax expense 2,431 23,795 6,413 21,645 16,220 Interest expense 1,007 1,252 1,281 4,763 4,942 Depreciation and amortization 10,694 12,238 11,845 43,742 50,350 Adjustments: Restructuring expenses 1,110 – 1,874 12,919 14,772 Asset impairments and net loss on divestitures 6,557 – - 22,793 11,476 Acquisition transaction expense (75) 789 - 324 - Unrealized currency loss (gain) 2,217 2,393 488 (2,270) 589 CFO transition expense - - 1,065 - Adjusted EBITDA $ 34,395 35,225 $ 34,530 $ 142,487 $ 140,248
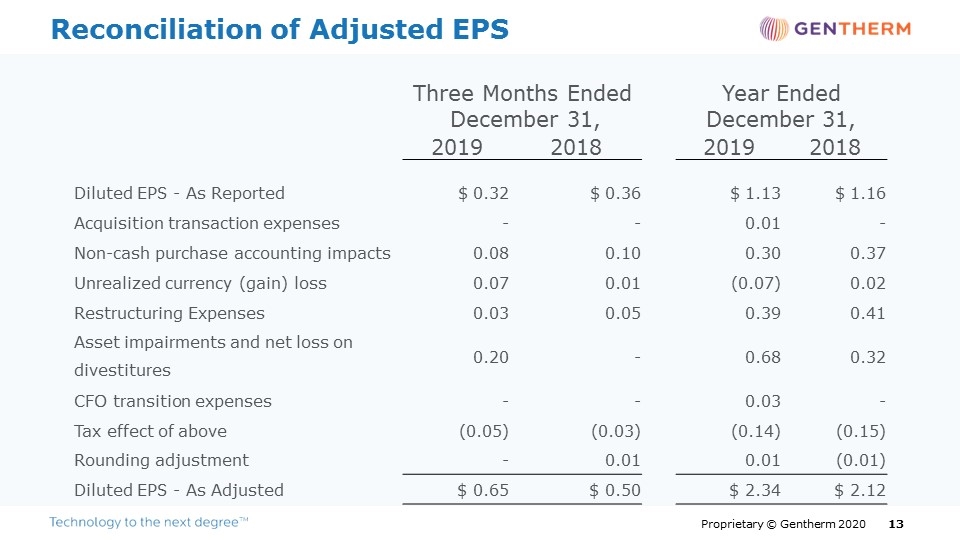
Reconciliation of Adjusted EPS Three Months Ended December 31, Year Ended December 31, 2019 2018 2019 2018 Diluted EPS - As Reported $ 0.32 $ 0.36 $ 1.13 $ 1.16 Acquisition transaction expenses - - 0.01 - Non-cash purchase accounting impacts 0.08 0.10 0.30 0.37 Unrealized currency (gain) loss 0.07 0.01 (0.07) 0.02 Restructuring Expenses 0.03 0.05 0.39 0.41 Asset impairments and net loss on divestitures 0.20 - 0.68 0.32 CFO transition expenses - - 0.03 - Tax effect of above (0.05) (0.03) (0.14) (0.15) Rounding adjustment - 0.01 0.01 (0.01) Diluted EPS - As Adjusted $ 0.65 $ 0.50 $ 2.34 $ 2.12
[GENTHERM LOGO] Technology to the next degreeTM
