Attached files
| file | filename |
|---|---|
| EX-32.2 - CERTIFICATION - ETF Managers Group Commodity Trust I | f10q1219ex32-2_etfmanagers.htm |
| EX-32.1 - CERTIFICATION - ETF Managers Group Commodity Trust I | f10q1219ex32-1_etfmanagers.htm |
| EX-31.2 - CERTIFICATION - ETF Managers Group Commodity Trust I | f10q1219ex31-2_etfmanagers.htm |
| EX-31.1 - CERTIFICATION - ETF Managers Group Commodity Trust I | f10q1219ex31-1_etfmanagers.htm |
UNITED
STATES
SECURITIES AND EXCHANGE COMMISSION
Washington, D.C. 20549
FORM 10-Q
☒
Quarterly report pursuant to Section 13 or 15(d) of the Securities Exchange Act of 1934
for the quarterly period ended December 31, 2019.
OR
☐
Transition report pursuant to Section 13 or 15(d) of the Securities Exchange Act of 1934
for the transition period from to .
Commission File Number: 001-36851
ETF
Managers Group Commodity Trust I
(Exact Name of Registrant as Specified in Its Charter)
| Delaware | 36-4793446 | |
| (State
or Other Jurisdiction of Incorporation or Organization) |
(I.R.S.
Employer Identification No.) | |
30 Maple Street – Suite 2 Summit, NJ 07901 |
07910 | |
| (Address of Principal Executive Offices) | (Zip Code) |
844-383-6477
(Registrant’s Telephone Number, Including Area Code)
N/A
(Former Name, Former Address and Former Fiscal Year, if Changed Since Last Report)
Indicate by check mark whether the registrant (1) has filed all reports required to be filed by Section 13 or 15(d) of the Securities Exchange Act of 1934 during the preceding 12 months (or for such shorter period that the registrant was required to file such reports), and (2) has been subject to such filing requirements for the past 90 days. ☒ Yes ☐ No
Indicate by check mark whether the registrant has submitted electronically every Interactive Data File required to be submitted pursuant to Rule 405 of Regulation S-T (§ 232.405 of this chapter) during the preceding 12 months (or for such shorter period that the registrant was required to submit such files). ☒ Yes ☐ No
Indicate by check mark whether the registrant is a large accelerated filer, an accelerated filer, a non-accelerated filer, smaller reporting company or an emerging growth company. See the definitions of “large accelerated filer,” “accelerated filer,” “smaller reporting company” and “emerging growth company” in Rule 12b-2 of the Exchange Act.
| Large accelerated filer ☐ | Accelerated filer ☐ | |
| Non-accelerated filer ☐ | Smaller reporting company ☒ | |
| Emerging growth company ☒ |
If an emerging growth company, indicate by check mark if the registrant has elected not to use the extended transition period for complying with any new or revised financial accounting standards provided in Section 13(a) of the Exchange Act. ☐
Indicate by check mark whether the registrant is a shell company (as defined in Rule 12b-2 of the Exchange Act). ☐ Yes ☒ No
Securities Registered Pursuant to Section 12(b) of the Act:
| Title of Each Class | Trading Symbol(s) | Name
Of Each Exchange On Which Registered | ||
| Shares of Sit Rising Rate ETF | RISE | NYSE Arca, Inc. | ||
| Shares of Breakwave Dry Bulk Shipping ETF | BDRY | NYSE Arca, Inc. |
Indicate the number of Shares outstanding, as of February 3, 2020: 250,040/(RISE)
Indicate the number of Shares outstanding, as of February 3, 2020: 275,040/(BDRY)
ETF MANAGERS GROUP COMMODITY TRUST I
Table of Contents
i
Part
I.
INTERIM FINANCIAL INFORMATION
Item 1. Interim Combined Financial Statements.
Index to Interim Combined Financial Statements
1
ETF MANAGERS GROUP COMMODITY TRUST I
Combined Statements of Assets and Liabilities
December 31, 2019 (Unaudited)
| SIT RISING RATE ETF | BREAKWAVE DRY BULK SHIPPING ETF | COMBINED | ||||||||||
| Assets | ||||||||||||
| Investment in securities, at fair value (cost $5,528,693 and $551,232 respectively) | $ | 5,533,113 | $ | 551,232 | $ | 6,084,345 | ||||||
| Interest receivable | 182 | 1,828 | 2,010 | |||||||||
| Segregated cash held by broker | 202,475 | 1,866,980 | 2,069,455 | |||||||||
| Receivable on open futures contracts | 15,878 | - | 15,878 | |||||||||
| Total assets | 5,751,648 | 2,420,040 | 8,171,688 | |||||||||
| Liabilities | ||||||||||||
| Options written, at fair value (premiums received $7,366 and $-0-, respectively) | 5,906 | - | 5,906 | |||||||||
| Payable on open futures contracts | - | 105,125 | 105,125 | |||||||||
| Due to Sponsor | 5,256 | 4,886 | 10,142 | |||||||||
| Other liabilities | - | 3,248 | 3,248 | |||||||||
| Total liabilities | 11,162 | 113,259 | 124,421 | |||||||||
| Net Assets | $ | 5,740,486 | $ | 2,306,781 | $ | 8,047,267 | ||||||
| Shares outstanding (unlimited authorized) | 250,040 | 150,040 | ||||||||||
| Net asset value per share | $ | 22.96 | $ | 15.37 | ||||||||
| Market value per share | $ | 22.97 | $ | 15.45 | ||||||||
See accompanying notes to unaudited interim combined financial statements.
2
ETF MANAGERS GROUP COMMODITY TRUST I
Combined Statements of Assets and Liabilities
June 30, 2019
| SIT RISING RATE ETF | BREAKWAVE
DRY BULK SHIPPING ETF |
COMBINED | ||||||||||
| Assets | ||||||||||||
| Investment in securities, at fair value (cost $11,928,143 and $1,095,625, respectively) | $ | 11,909,897 | $ | 1,095,625 | $ | 13,005,522 | ||||||
| Interest receivable | 436 | 5,821 | 6,257 | |||||||||
| Segregated cash held by broker | 365,460 | 2,831,566 | 3,197,026 | |||||||||
| Receivable on open futures contracts | - | 391,415 | 391,415 | |||||||||
| Total assets | 12,275,793 | 4,324,427 | 16,600,220 | |||||||||
| Liabilities | ||||||||||||
| Options written, at fair value (premiums received $16,128 and $-0-, respectively) | 19,336 | - | 19,336 | |||||||||
| Payable on open futures contracts | 326,457 | - | 326,457 | |||||||||
| Due to Sponsor | 9,851 | 11,699 | 21,550 | |||||||||
| Other liabilities | - | 4,466 | 4,466 | |||||||||
| Total liabilities | 355,644 | 16,165 | 371,809 | |||||||||
| Net Assets | $ | 11,920,149 | $ | 4,308,262 | $ | 16,228,411 | ||||||
| Shares outstanding (unlimited authorized) | 525,040 | 325,040 | ||||||||||
| Net asset value per share | $ | 22.70 | $ | 13.25 | ||||||||
| Market value per share | $ | 22.73 | 13.15 | |||||||||
See accompanying notes to unaudited interim combined financial statements.
3
ETF MANAGERS GROUP COMMODITY TRUST I
Combined Schedules of Investments
December 31, 2019 (Unaudited)
| SIT RISING | BREAKWAVE
DRY BULK SHIPPING | |||||||||||
| RATE ETF | ETF | COMBINED | ||||||||||
| PURCHASED OPTIONS - 0.4% and 0.0%, respectively | ||||||||||||
| US Treasury 10 Year Note, Strike Price $129.50 Expiring 02/21/2020 (15 contracts) | $ | 21,797 | $ | - | $ | 21,797 | ||||||
| TOTAL PURCHASED OPTIONS (cost $17,862 and $-0-, respectively) | 21,797 | - | 21,797 | |||||||||
| SHORT-TERM INVESTMENTS - 93.1% and 0.0%, respectively | ||||||||||||
| US TREASURY BILLS - 93.1% and 0.0%, respectively | ||||||||||||
| United States Treasury Bills 1.453%, 01/28/2020 ($5,350,000 principal amount) (a) | 5,344,368 | - | 5,344,368 | |||||||||
| TOTAL US TREASURY BILLS (cost $5,343,883 and $-0-, respectively) | 5,344,368 | - | 5,344,368 | |||||||||
| MONEY MARKET FUNDS - 2.9% and 23.9%, respectively | ||||||||||||
| First American US Treasury Money Market Fund, Class Z, 1.41%* (166,948 shares) | 166,948 | - | 166,948 | |||||||||
| First American US Treasury Obligations Fund, Class X, 1.53%* (551,232 shares) | - | 551,232 | 551,232 | |||||||||
| TOTAL MONEY MARKET FUNDS (Cost $166,948 and $551,232, respectively) | 166,948 | 551,232 | 718,180 | |||||||||
| Total Investments (cost $5,528,693 and $551,232, respectively) - 96.4% and 23.9%, respectively | 5,533,113 | 551,232 | 6,084,345 | |||||||||
| Other Assets in Excess of Liabilities - 3.6% and 76.1%, respectively (b) | 207,373 | 1,755,549 | 1,962,922 | |||||||||
| TOTAL NET ASSETS - 100.0% and 100.0%, respectively | $ | 5,740,486 | $ | 2,306,781 | $ | 8,047,267 | ||||||
| * | Annualized seven-day yield as of December 31, 2019 |
| (a) | All or a portion of this security is held as collateral for certain futures contracts and written options |
| (b) | $202,475 and $1,866,980, respectively, of cash is pledged as collateral for futures contracts |
| BREAKWAVE DRY BULK SHIPPING ETF | Unrealized | Unrealized | Unrealized | |||||||||
| Futures Contracts | Appreciation/ | Appreciation/ | Appreciation/ | |||||||||
| December 31, 2019 | (Depreciation) | (Depreciation) | (Depreciation) | |||||||||
| Baltic Exchange Panamax T/C Average Shipping Route Index Expiring January 31, 2020 (Underlying Face Amount at Market Value - $245,520) (30 contracts) | $ | - | $ | (31,980 | ) | $ | (31,980 | ) | ||||
| Baltic Exchange Panamax T/C Average Shipping Route Index Expiring February 28, 2020 (Underlying Face Amount at Market Value - $257,640) (30 contracts) | - | (19,860 | ) | (19,860 | ) | |||||||
| Baltic Exchange Panamax T/C Average Shipping Route Index Expiring March 31, 2020 (Underlying Face Amount at Market Value - $300,390) (30 contracts) | - | 22,890 | 22,890 | |||||||||
| Baltic Exchange Capesize Time Charter Expiring January 31, 2020 (Underlying Face Amount at Market Value - $452,165) (35 contracts) | - | 10,915 | 10,915 | |||||||||
| Baltic Exchange Capesize Time Charter Expiring February 28, 2020 (Underlying Face Amount at Market Value - $400,085) (35 contracts) | - | (41,165 | ) | (41,165 | ) | |||||||
| Baltic Exchange Capesize Time Charter Expiring March 31, 2020 (Underlying Face Amount at Market Value - $404,040) (35 contracts) | - | (37,210 | ) | (37,210 | ) | |||||||
| Baltic Exchange Supramax Average Shipping Route Expiring January 31, 2020 (Underlying Face Amount at Market Value - $37,250) (5 contracts) | - | (5,750 | ) | (5,750 | ) | |||||||
| Baltic Exchange Supramax Average Shipping Route Expiring February 28, 2020 (Underlying Face Amount at Market Value - $38,910) (5 contracts) | - | (4,090 | ) | (4,090 | ) | |||||||
| Baltic Exchange Supramax Average Shipping Route Expiring March 31, 2020 (Underlying Face Amount at Market Value - $44,125) (5 contracts) | - | 1,125 | 1,125 | |||||||||
| $ | - | $ | (105,125 | ) | $ | (105,125 | ) | |||||
| SIT RISING RATE ETF | ||||||||||||
| Written Option Contracts | ||||||||||||
| December 31, 2019 | ||||||||||||
| US 5 Year Note, Strike Price $118.50 Expiring 02/21/2020 (12 contracts) (Premiums received $7,366) | $ | (5,906 | ) | - | $ | (5,906 | ) | |||||
| SIT RISING RATE ETF | ||||||||||||
| Short Futures Contracts | ||||||||||||
| December 31, 2019 | ||||||||||||
| US Treasury 2 Year Note | ||||||||||||
| Expiring March 2020 (Underlying Face Amount at Market Value - $11,852,500) (55 contracts) | $ | 4,657 | $ | - | $ | 4,657 | ||||||
| US Treasury 5 Year Note | ||||||||||||
| Expiring March 2020 (Underlying Face Amount at Market Value - $5,456,031) (46 contracts) | 11,221 | - | 11,221 | |||||||||
| $ | 15,878 | $ | - | $ | 15,878 | |||||||
See accompanying notes to unaudited interim combined financial statements.
4
ETF MANAGERS GROUP COMMODITY TRUST I
Combined Schedules of Investments
June 30, 2019
| SIT RISING | BREAKWAVE DRY BULK SHIPPING | |||||||||||
| RATE ETF | ETF | COMBINED | ||||||||||
| PURCHASED OPTIONS - 0.3% and 0.0%, respectively | ||||||||||||
| US Treasury 10 Year Note, Strike Price $123.50 Expiring 08/23/19 (40 contracts) | $ | 35,625 | $ | - | $ | 35,625 | ||||||
| TOTAL PURCHASED OPTIONS (Cost $58,883) | 35,625 | - | 35,625 | |||||||||
| SHORT-TERM INVESTMENTS - 97.2% and 0.0%, respectively | ||||||||||||
| US TREASURY BILLS - 97.2% and 0.0%, respectively | ||||||||||||
| United States Treasury Bills 2.082%, 12/12/2019 ($11,700,000 principal amount) (a) | 11,591,734 | - | 11,591,734 | |||||||||
| TOTAL US TREASURY BILLS (Cost $11,586,722) | 11,591,734 | - | 11,591,734 | |||||||||
| MONEY MARKET FUNDS - 1.4% and 25.4%, respectively | ||||||||||||
| First American US Treasury Money Market Fund, Class Z, 2.40% (b) (282,538 shares) | 282,538 | - | 282,538 | |||||||||
| First American US Treasury Obligations Fund, Class X, 2.27% (b) (1,095,625 shares) | - | 1,095,625 | 1,095,625 | |||||||||
| TOTAL MONEY MARKET FUNDS (Cost $282,538 and $1,095,625, respectively | 282,538 | 1,095,625 | 1,378,163 | |||||||||
| Total Investments (Cost $11,928,143 and $1,095,625, respectively) - 99.9% and 25.4%, respectively | 11,909,897 | 1,095,625 | 13,005,522 | |||||||||
| Other Assets in Excess of Liabilities - 0.1% and 74.6%, respectively (a) | 10,252 | 3,212,637 | 3,222,889 | |||||||||
| TOTAL NET ASSETS - 100.0% and 100.0%, respectively | $ | 11,920,149 | $ | 4,308,262 | $ | 16,228,411 | ||||||
| (a) | All or a portion of this security is held as collateral for futures contracts and written options. |
| (b) | Annualized seven-day yield as of June 30, 2019. |
| BREAKWAVE DRY BULK SHIPPING ETF | Unrealized | Unrealized | Unrealized | |||||||||
| Futures Contracts | Appreciation/ | Appreciation/ | Appreciation/ | |||||||||
| June 30, 2019 | (Depreciation) | (Depreciation) | (Depreciation) | |||||||||
| Baltic Exchange Panamax T/C Average Shipping Route Index Expiring July 26, 2019 (Underlying Face Amount at Market Value - $489,015) (45 contracts) | $ | - | $ | 25,015 | $ | 25,015 | ||||||
| Baltic Exchange Panamax T/C Average Shipping Route Index Expiring August 30, 2019 (Underlying Face Amount at Market Value - $497,835) (45 contracts) | - | 33,835 | 33,835 | |||||||||
| Baltic Exchange Panamax T/C Average Shipping Route Index Expiring September 27, 2019 (Underlying Face Amount at Market Value - $495,945) (45 contracts) | - | 31,945 | 31,945 | |||||||||
| Baltic Exchange Supramax T/C Average Shipping Route Expiring July 26, 2019 (Underlying Face Amount at Market Value - $147,435) (15 contracts) | - | (5,565 | ) | (5,565 | ) | |||||||
| Baltic Exchange Supramax T/C Average Shipping Route Expiring August 30, 2019 (Underlying Face Amount at Market Value - $158,250) (15 contracts) | - | 5,250 | 5,250 | |||||||||
| Baltic Exchange Supramax T/C Average Shipping Route Expiring September 27, 2019 (Underlying Face Amount at Market Value - $161,505) (15 contracts) | - | 8,505 | 8,505 | |||||||||
| Baltic Capesize Time Charter Expiring July 26, 2019 (Underlying Face Amount at Market Value - $732,680) (40 contracts) | - | 104,930 | 104,930 | |||||||||
| Baltic Capesize Time Charter Expiring August 30, 2019 (Underlying Face Amount at Market Value - $719,840) (40 contracts) | - | 92,090 | 92,090 | |||||||||
| Baltic Capesize Time Charter Expiring September 27, 2019 (Underlying Face Amount at Market Value - $723,160) (40 contracts) | - | 95,410 | 95,410 | |||||||||
| $ | - | $ | 391,415 | $ | 391,415 | |||||||
| SIT RISING RATE ETF | ||||||||||||
| Written Option Contracts | ||||||||||||
| June 30, 2019 | ||||||||||||
| US 5 Year Note, Strike Price $117.75 Expiring 08/23/2019 (25 contracts) (Premiums received $16,128) | $ | 19,336 | $ | - | $ | 19,336 | ||||||
| SIT RISING RATE ETF | ||||||||||||
| Short Futures Contracts | ||||||||||||
| June 30, 2019 | ||||||||||||
| US Treasury 5 Year Note Expiring September 2019 (Underlying Face Amount at Market Value - $12,051,938) (102 contracts) | $ | (182,361 | ) | $ | - | $ | (182,361 | ) | ||||
| US Treasury 2 Year Note Expiring September 2019 (Underlying Face Amount at Market Value - $22,809,047) (106 contracts) | (144,096 | ) | - | (144,096 | ) | |||||||
| $ | (326,457 | ) | $ | - | $ | (326,457 | ) | |||||
See accompanying notes to unaudited interim combined financial statements.
5
ETF MANAGERS GROUP COMMODITY TRUST I
Combined Statements of Operations
Three Months Ended December 31, 2019 (Unaudited)
| SIT RISING | BREAKWAVE DRY BULK SHIPPING | |||||||||||
| RATE ETF | ETF | COMBINED | ||||||||||
| Investment Income | ||||||||||||
| Interest | $ | 31,146 | $ | 6,346 | $ | 37,492 | ||||||
| Expenses | ||||||||||||
| Sponsor fee | 18,852 | 31,420 | 50,272 | |||||||||
| CTA fee | 3,131 | 6,561 | 9,692 | |||||||||
| Audit fees | 22,012 | 13,785 | 35,797 | |||||||||
| Tax preparation fees | 12,568 | 12,568 | 25,136 | |||||||||
| Admin/accounting/custodian/transfer agent fees | 14,479 | 15,548 | 30,027 | |||||||||
| Legal fees | 8,797 | 11,311 | 20,108 | |||||||||
| Printing and postage expenses | 2,639 | 2,665 | 5,304 | |||||||||
| Chief Compliance Officer fees | 6,301 | 6,283 | 12,584 | |||||||||
| Principal Financial Officer fees | 6,301 | 6,283 | 12,584 | |||||||||
| Regulatory reporting fees | 6,301 | 6,283 | 12,584 | |||||||||
| Brokerage commissions | 927 | 7,202 | 8,129 | |||||||||
| Distribution fees | 3,906 | 3,977 | 7,883 | |||||||||
| Insurance expense | 3,770 | 3,770 | 7,540 | |||||||||
| Listing & calculation agent fees | 3,167 | 3,167 | 6,334 | |||||||||
| Other expenses | 2,193 | 4,211 | 6,404 | |||||||||
| Wholesale support fees | 1,566 | 6,827 | 8,393 | |||||||||
| Interest | 14 | - | 14 | |||||||||
| Total Expenses | 116,924 | 141,861 | 258,785 | |||||||||
| Less: Waiver of CTA fee | - | (6,561 | ) | (6,561 | ) | |||||||
| Less: Expenses absorbed by Sponsor | (100,323 | ) | (112,262 | ) | (212,585 | ) | ||||||
| Net Expenses | 16,601 | 23,038 | 39,639 | |||||||||
| Net Investment Income (Loss) | 14,545 | (16,692 | ) | (2,147 | ) | |||||||
| Net Realized and Unrealized Gain (Loss) on Investment Activity | ||||||||||||
| Net Realized Gain (Loss) on | ||||||||||||
| Investments, futures and options contracts | (306,211 | ) | (243,845 | ) | (550,056 | ) | ||||||
| Change in Unrealized Gain (Loss) on | ||||||||||||
| Investments, futures and options contracts | 391,106 | (117,845 | ) | 273,261 | ||||||||
| Net realized and unrealized gain (loss) | 84,895 | (361,690 | ) | (276,795 | ) | |||||||
| Net income (loss) | $ | 99,440 | $ | (378,382 | ) | $ | (278,942 | ) | ||||
See accompanying notes to unaudited interim combined financial statements.
6
ETF MANAGERS GROUP COMMODITY TRUST I
Combined Statements of Operations
Three Months Ended December 31, 2018 (Unaudited)
| SIT RISING | BREAKWAVE DRY BULK SHIPPING | |||||||||||
| RATE ETF | ETF | COMBINED | ||||||||||
| Investment Income | ||||||||||||
| Interest | $ | 371,146 | $ | 13,479 | $ | 384,625 | ||||||
| Expenses | ||||||||||||
| Sponsor fee | 25,103 | 31,506 | 56,609 | |||||||||
| CTA fee | 33,831 | 10,462 | 44,293 | |||||||||
| Audit fees | 21,537 | 16,322 | 37,859 | |||||||||
| Tax preparation fees | 25,205 | 32,393 | 57,598 | |||||||||
| Admin/accounting/custodian/transfer agent fees | 14,191 | 15,476 | 29,667 | |||||||||
| Legal fees | 8,823 | 11,343 | 20,166 | |||||||||
| Printing and postage expenses | 6,553 | 6,553 | 13,106 | |||||||||
| Chief Compliance Officer fees | 6,301 | 6,301 | 12,602 | |||||||||
| Principal Financial Officer fees | 6,301 | 6,301 | 12,602 | |||||||||
| Regulatory reporting fees | 6,301 | 6,301 | 12,602 | |||||||||
| Brokerage commissions | 19,434 | 6,156 | 25,590 | |||||||||
| Distribution fees | 4,410 | 4,158 | 8,568 | |||||||||
| Insurance expense | 3,781 | 3,781 | 7,562 | |||||||||
| Listing & calculation agent fees | 3,176 | 3,176 | 6,352 | |||||||||
| Other expenses | 4,644 | 5,671 | 10,315 | |||||||||
| Wholesale support fees | 16,915 | 7,167 | 24,082 | |||||||||
| Total Expenses | 206,506 | 173,067 | 379,573 | |||||||||
| Less: Waiver of CTA fee | - | (10,462 | ) | (10,462 | ) | |||||||
| Less: Expenses absorbed by Sponsor | (17,920 | ) | (131,193 | ) | (149,113 | ) | ||||||
| Net Expenses | 188,586 | 31,412 | 219,998 | |||||||||
| Net Investment Income (Loss) | 182,560 | (17,933 | ) | 164,627 | ||||||||
| Net Realized and Unrealized Gain (Loss) on Investment Activity | ||||||||||||
| Net Realized Gain (Loss) on | ||||||||||||
| Investments, futures and options contracts | 266,684 | (737,508 | ) | (470,824 | ) | |||||||
| Change in Unrealized Gain (Loss) on | ||||||||||||
| Investments, futures and options contracts | (3,327,205 | ) | 137,005 | (3,190,200 | ) | |||||||
| Net realized and unrealized gain (loss) | (3,060,521 | ) | (600,503 | ) | (3,661,024 | ) | ||||||
| Net income (loss) | $ | (2,877,961 | ) | $ | (618,436 | ) | $ | (3,496,397 | ) | |||
See accompanying notes to unaudited interim combined financial statements.
7
ETF MANAGERS GROUP COMMODITY TRUST I
Combined Statements of Operations
Six Months Ended December 31, 2019 (Unaudited)
| SIT RISING | BREAKWAVE DRY BULK SHIPPING | |||||||||||
| RATE ETF | ETF | COMBINED | ||||||||||
| Investment Income | ||||||||||||
| Interest | $ | 75,132 | $ | 19,013 | $ | 94,145 | ||||||
| Expenses | ||||||||||||
| Sponsor fee | 37,704 | 62,840 | 100,544 | |||||||||
| CTA fee | 7,164 | 16,213 | 23,377 | |||||||||
| Audit fees | 44,024 | 27,570 | 71,594 | |||||||||
| Tax preparation fees | 25,136 | 25,136 | 50,272 | |||||||||
| Admin/accounting/custodian/transfer agent fees | 28,958 | 31,096 | 60,054 | |||||||||
| Legal fees | 17,594 | 22,622 | 40,216 | |||||||||
| Printing and postage expenses | 5,278 | 5,330 | 10,608 | |||||||||
| Chief Compliance Officer fees | 12,596 | 12,566 | 25,162 | |||||||||
| Principal Financial Officer fees | 12,596 | 12,566 | 25,162 | |||||||||
| Regulatory reporting fees | 12,596 | 12,566 | 25,162 | |||||||||
| Brokerage commissions | 2,793 | 15,499 | 18,292 | |||||||||
| Distribution fees | 7,812 | 7,954 | 15,766 | |||||||||
| Insurance expense | 7,540 | 7,540 | 15,080 | |||||||||
| Listing & calculation agent fees | 6,334 | 6,334 | 12,668 | |||||||||
| Other expenses | 4,386 | 8,422 | 12,808 | |||||||||
| Wholesale support fees | 3,583 | 13,910 | 17,493 | |||||||||
| Interest expense | 14 | - | 14 | |||||||||
| Total Expenses | 236,108 | 288,164 | 524,272 | |||||||||
| Less: Waiver of CTA fee | - | (16,213 | ) | (16,213 | ) | |||||||
| Less: Expenses absorbed by Sponsor | (197,476 | ) | (217,318 | ) | (414,794 | ) | ||||||
| Net Expenses | 38,632 | 54,633 | 93,265 | |||||||||
| Net Investment Income (Loss) | 36,500 | (35,620 | ) | 880 | ||||||||
| Net Realized and Unrealized Gain (Loss) on Investment Activity | ||||||||||||
| Net Realized Gain (Loss) on | ||||||||||||
| Investments, futures and options contracts | (252,728 | ) | 338,181 | 85,453 | ||||||||
| Change in Unrealized Gain (Loss) on | ||||||||||||
| Investments, futures and options contracts | 368,231 | 666,605 | 1,034,836 | |||||||||
| Net realized and unrealized gain (loss) | 115,503 | 1,004,786 | 1,120,289 | |||||||||
| Net income (loss) | $ | 152,003 | $ | 969,166 | $ | 1,121,169 | ||||||
See accompanying notes to unaudited interim combined financial statements.
8
ETF MANAGERS GROUP COMMODITY TRUST I
Combined Statements of Operations
Six Months Ended December 31, 2018 (Unaudited)
| SIT RISING | BREAKWAVE DRY BULK SHIPPING | |||||||||||
| RATE ETF | ETF | COMBINED | ||||||||||
| Investment Income | ||||||||||||
| Interest | $ | 653,882 | $ | 26,608 | $ | 680,490 | ||||||
| Expenses | ||||||||||||
| Sponsor fee | 47,237 | 63,012 | 110,249 | |||||||||
| CTA fee | 63,343 | 23,499 | 86,842 | |||||||||
| Audit fees | 43,074 | 32,644 | 75,718 | |||||||||
| Tax preparation fees | 50,410 | 64,786 | 115,196 | |||||||||
| Admin/accounting/custodian/transfer agent fees | 28,382 | 30,952 | 59,334 | |||||||||
| Legal fees | 17,646 | 22,686 | 40,332 | |||||||||
| Printing and postage expenses | 13,106 | 13,106 | 26,212 | |||||||||
| Chief Compliance Officer fees | 12,602 | 12,602 | 25,204 | |||||||||
| Principal Financial Officer fees | 12,602 | 12,602 | 25,204 | |||||||||
| Regulatory reporting fees | 12,602 | 12,602 | 25,204 | |||||||||
| Brokerage commissions | 35,862 | 15,093 | 50,955 | |||||||||
| Distribution fees | 8,820 | 8,316 | 17,136 | |||||||||
| Insurance expense | 7,562 | 7,562 | 15,124 | |||||||||
| Listing & calculation agent fees | 6,352 | 6,352 | 12,704 | |||||||||
| Other expenses | 9,288 | 11,342 | 20,630 | |||||||||
| Wholesale support fees | 31,671 | 14,547 | 46,218 | |||||||||
| Total Expenses | 400,559 | 351,703 | 752,262 | |||||||||
| Less: Waiver of CTA fee | - | (23,499 | ) | (23,499 | ) | |||||||
| Less: Expenses absorbed by Sponsor | (47,986 | ) | (256,383 | ) | (304,369 | ) | ||||||
| Net Expenses | 352,573 | 71,821 | 424,394 | |||||||||
| Net Investment Income (Loss) | 301,309 | (45,213 | ) | 256,096 | ||||||||
| Net Realized and Unrealized Gain (Loss) on Investment Activity | ||||||||||||
| Net Realized Gain (Loss) on | ||||||||||||
| Investments, futures and options contracts | (456,707 | ) | (434,239 | ) | (890,946 | ) | ||||||
| Change in Unrealized Gain (Loss) on | ||||||||||||
| Investments, futures and options contracts | (1,611,508 | ) | (33,580 | ) | (1,645,088 | ) | ||||||
| Net realized and unrealized gain (loss) | (2,068,215 | ) | (467,819 | ) | (2,536,034 | ) | ||||||
| Net income (loss) | $ | (1,766,906 | ) | $ | (513,032 | ) | $ | (2,279,938 | ) | |||
See accompanying notes to unaudited interim combined financial statements.
9
ETF MANAGERS GROUP COMMODITY TRUST I
Combined Statements of Changes in Net Assets
Three Months Ended December 31, 2019 (Unaudited)
| SIT RISING | BREAKWAVE DRY BULK SHIPPING | |||||||||||
| RATE ETF | ETF | COMBINED | ||||||||||
| Net Assets at Beginning of Period | $ | 6,218,812 | $ | 1,965,548 | $ | 8,184,360 | ||||||
| Increase (decrease) in Net Assets from share transactions | ||||||||||||
| Addition of-0- and 75,000 shares, respectively | - | 1,151,130 | 1,151,130 | |||||||||
| Redemption of 25,000 and 25,000 shares, respectively | (577,766 | ) | (431,515 | ) | (1,009,281 | ) | ||||||
| Net Increase (decrease) in Net Assets from share transactions | (577,766 | ) | 719,615 | 141,849 | ||||||||
| Increase (decrease) in Net Assets from operations | ||||||||||||
| Net investment income (loss) | 14,545 | (16,692 | ) | (2,147 | ) | |||||||
| Net realized gain (loss) | (306,211 | ) | (243,845 | ) | (550,056 | ) | ||||||
| Change in net unrealized gain (loss) | 391,106 | (117,845 | ) | 273,261 | ||||||||
| Net Increase (decrease) in Net Assets from operations | 99,440 | (378,382 | ) | (278,942 | ) | |||||||
| Net Assets at End of Period | $ | 5,740,486 | $ | 2,306,781 | $ | 8,047,267 | ||||||
See accompanying notes to unaudited interim combined financial statements.
10
ETF MANAGERS GROUP COMMODITY TRUST I
Combined Statements of Changes in Net Assets
Three Months Ended December 31, 2018 (Unaudited)
| SIT RISING | BREAKWAVE DRY BULK SHIPPING | |||||||||||
| RATE ETF | ETF | COMBINED | ||||||||||
| Net Assets at Beginning of Period | $ | 62,196,525 | $ | 3,403,193 | $ | 65,599,718 | ||||||
| Increase (decrease) in Net Assets from share transactions | ||||||||||||
| Addition of 500,000 and -0- shares, respectively | 12,510,953 | - | 12,510,953 | |||||||||
| Redemption of 475,000 and -0- shares, respectively | (11,687,830 | ) | - | (11,687,830 | ) | |||||||
| Net Increase in Net Assets from share transactions | 823,123 | - | 823,123 | |||||||||
| Increase (decrease) in Net Assets from operations | ||||||||||||
| Net investment income (loss) | 182,560 | (17,933 | ) | 164,627 | ||||||||
| Net realized gain (loss) | 266,684 | (737,508 | ) | (470,824 | ) | |||||||
| Change in net unrealized gain (loss) | (3,327,205 | ) | 137,005 | (3,190,200 | ) | |||||||
| Net Increase (decrease) in Net Assets from operations | (2,877,961 | ) | (618,436 | ) | (3,496,397 | ) | ||||||
| Net Assets at End of Period | $ | 60,141,687 | $ | 2,784,757 | $ | 62,926,444 | ||||||
See accompanying notes to unaudited interim combined financial statements.
11
ETF MANAGERS GROUP COMMODITY TRUST I
Combined Statements of Changes in Net Assets
Six Months Ended December 31, 2019 (Unaudited)
| SIT RISING | BREAKWAVE DRY BULK SHIPPING | |||||||||||
| RATE ETF | ETF | COMBINED | ||||||||||
| Net Assets at Beginning of Period | $ | 11,920,149 | $ | 4,308,262 | $ | 16,228,411 | ||||||
| Increase (decrease) in Net Assets from share transactions | ||||||||||||
| Addition of -0- and 75,000 shares, respectively | - | 1,151,130 | 1,151,130 | |||||||||
| Redemption of 275,000 and 250,000 shares, respectively | (6,331,666 | ) | (4,121,777 | ) | (10,453,443 | ) | ||||||
| Net Increase (decrease) in Net Assets from share transactions | (6,331,666 | ) | (2,970,647 | ) | (9,302,313 | ) | ||||||
| Increase (decrease) in Net Assets from operations | ||||||||||||
| Net investment income (loss) | 36,500 | (35,620 | ) | 880 | ||||||||
| Net realized gain (loss) | (252,728 | ) | 338,181 | 85,453 | ||||||||
| Change in net unrealized gain (loss) | 368,231 | 666,605 | 1,034,836 | |||||||||
| Net Increase (decrease) in Net Assets from operations | 152,003 | 969,166 | 1,121,169 | |||||||||
| Net Assets at End of Period | $ | 5,740,486 | $ | 2,306,781 | $ | 8,047,267 | ||||||
See accompanying notes to unaudited interim combined financial statements.
12
ETF MANAGERS GROUP COMMODITY TRUST I
Combined Statements of Changes in Net Assets
Six Months Ended December 31, 2018 (Unaudited)
| SIT RISING | BREAKWAVE DRY BULK SHIPPING | |||||||||||
| RATE ETF | ETF | COMBINED | ||||||||||
| Net Assets at Beginning of Period | $ | 51,774,988 | $ | 3,297,789 | $ | 55,072,777 | ||||||
| Increase (decrease) in Net Assets from share transactions | ||||||||||||
| Addition of 775,000 and -0- shares, respectively | 24,297,005 | - | 24,297,005 | |||||||||
| Redemption of 525,000 and -0- shares, respectively | (14,163,400 | ) | - | (14,163,400 | ) | |||||||
| Net increase (decrease) in Net Assets from share transactions | 10,133,605 | - | 10,133,605 | |||||||||
| Increase (decrease) in Net Assets from operations | ||||||||||||
| Net investment gain (loss) | 301,309 | (45,213 | ) | 256,096 | ||||||||
| Net realized loss | (456,707 | ) | (434,239 | ) | (890,946 | ) | ||||||
| Change in net unrealized gain (loss) | (1,611,508 | ) | (33,580 | ) | (1,645,088 | ) | ||||||
| Net Increase (Decrease) in Net Assets from operations | (1,766,906 | ) | (513,032 | ) | (2,279,938 | ) | ||||||
| Net Assets at End of Period | $ | 60,141,687 | $ | 2,784,757 | $ | 62,926,444 | ||||||
See accompanying notes to unaudited interim combined financial statements.
13
ETF MANAGERS GROUP COMMODITY TRUST I
Combined Statements of Cash Flows
Six Months Ended December 31, 2019 (Unaudited)
| SIT RISING | BREAKWAVE DRY BULK SHIPPING | |||||||||||
| RATE ETF | ETF | COMBINED | ||||||||||
| Cash flows provided by (used in) operating activities | ||||||||||||
| Net income (loss) | $ | 152,003 | $ | 969,166 | $ | 1,121,169 | ||||||
| Adjustments to reconcile net income (loss) to net cash provided by (used in) operating activities: | ||||||||||||
| Net realized loss (gain) on investments | 252,728 | (338,181 | ) | (85,453 | ) | |||||||
| Change in net unrealized loss (gain) on investments | (368,231 | ) | (666,605 | ) | (1,034,836 | ) | ||||||
| Change in operating assets and liabilities: | ||||||||||||
| Sale (purchase) of investments, net | 6,492,287 | 1,549,179 | 8,041,466 | |||||||||
| Decrease in interest receivable | 254 | 3,993 | 4,247 | |||||||||
| Decrease in segregated cash held by broker | 162,985 | 964,586 | 1,127,571 | |||||||||
| Increase (decrease) in receivable on open futures contracts | (15,878 | ) | 391,415 | 375,537 | ||||||||
| Decrease in options written, at fair value | (13,430 | ) | - | (13,430 | ) | |||||||
| Increase (decrease) in payable on open futures contracts | (326,457 | ) | 105,125 | (221,332 | ) | |||||||
| Decrease in due to Sponsor | (4,595 | ) | (6,813 | ) | (11,408 | ) | ||||||
| Decrease in other liabilities | - | (1,218 | ) | (1,218 | ) | |||||||
| Net cash provided by (used in) operating activities | 6,331,666 | 2,970,647 | 9,302,313 | |||||||||
| Cash flows from financing activities | ||||||||||||
| Proceeds from sale of shares | - | 1,151,130 | 1,151,130 | |||||||||
| Paid on redemption of shares | (6,331,666 | ) | (4,121,777 | ) | (10,453,443 | ) | ||||||
| Net cash provided by (used in) financing activities | (6,331,666 | ) | (2,970,647 | ) | (9,302,313 | ) | ||||||
| Net increase (decrease) in cash | - | - | - | |||||||||
| Cash, beginning of period | - | - | - | |||||||||
| Cash, end of period | $ | - | $ | - | $ | - | ||||||
See accompanying notes to unaudited interim combined financial statements.
14
ETF MANAGERS GROUP COMMODITY TRUST I
Combined Statements of Cash Flows
Six Months Ended December 31, 2018 (Unaudited)
| SIT RISING | BREAKWAVE DRY BULK SHIPPING | |||||||||||
| RATE ETF | ETF | COMBINED | ||||||||||
| Cash flows provided by (used in) operating activities | ||||||||||||
| Net income | $ | (1,766,906 | ) | $ | (513,032 | ) | $ | (2,279,938 | ) | |||
| Adjustments to reconcile net income to net cash provided by (used in) operating activities: | ||||||||||||
| Net realized loss (gain) on investments | 456,707 | 434,239 | 890,946 | |||||||||
| Change in net unrealized loss (gain) on investments | 1,611,508 | 33,580 | 1,645,088 | |||||||||
| Change in operating assets and liabilities: | ||||||||||||
| Sale (Purchase) of investments, net | (11,463,712 | ) | 85,736 | (11,377,976 | ) | |||||||
| Decrease (Increase) in interest receivable | (1,140 | ) | 3,122 | 1,982 | ||||||||
| Increase in segregated cash held by broker | (571,594 | ) | (106,007 | ) | (677,601 | ) | ||||||
| Decrease in options written, at fair value | 180,930 | - | 180,930 | |||||||||
| Decrease in receivable on open futures contracts | - | 33,580 | 33,580 | |||||||||
| Increase in payable on open futures contracts | 1,406,708 | - | 1,406,708 | |||||||||
| Increase (decrease) in due to Sponsor | 13,894 | (1,309 | ) | 12,585 | ||||||||
| Decrease in other accrued expenses | - | (3,189 | ) | (3,189 | ) | |||||||
| Net cash provided by (used in) operating activities | (10,133,605 | ) | (33,280 | ) | (10,166,885 | ) | ||||||
| Cash flows from financing activities | ||||||||||||
| Proceeds from sale of shares | 24,297,005 | - | 24,297,005 | |||||||||
| Paid on redemption of shares | (14,163,400 | ) | - | (14,163,400 | ) | |||||||
| Net cash provided by financing activities | 10,133,605 | - | 10,133,605 | |||||||||
| Net increase (decrease) in cash | - | (33,280 | ) | (33,280 | ) | |||||||
| Cash, beginning of period | - | 33,280 | 33,280 | |||||||||
| Cash, end of period | $ | - | $ | - | $ | - | ||||||
See accompanying notes to unaudited interim combined financial statements.
15
ETF Managers Group Commodity Trust I
Notes to Interim Combined Financial Statements
December 31, 2019 (unaudited)
(1) Organization
ETF Managers Group Commodity Trust I (the “Trust”) was organized as a Delaware statutory trust on July 23, 2014. The Trust is a series trust formed pursuant to the Delaware Statutory Trust Act and currently includes two separate series. SIT RISING RATE ETF (“RISE”) is the first series of the Trust and is a commodity pool that continuously issues common shares of beneficial interest that may be purchased and sold on the NYSE Arca, Inc. stock exchange (“NYSE Arca”). The second series of the Trust, BREAKWAVE DRY BULK SHIPPING ETF (“BDRY,” and together with RISE, the “Funds”), is also a commodity pool that continuously issues shares of beneficial interest that may be purchased and sold on NYSE Arca. The Funds are managed and controlled by ETF Managers Capital LLC (the “Sponsor”), a Delaware limited liability company. The Sponsor is registered with the Commodity Futures Trading Commission (“CFTC”) as a “commodity pool operator” (“CPO”) and is a member of the National Futures Trading Association (“NFA”). Sit Fixed Income Advisors II, LLC (“Sit”), a subsidiary of Sit Investment Associates, Inc., is registered as a “commodity trading advisor” (“CTA”) with the CFTC and serves as RISE’s commodity trading advisor. Breakwave Advisors, LLC (“Breakwave”) is registered as a CTA with the CFTC and serves as BDRY’s commodity trading advisor.
RISE commenced investment operations on February 19, 2015. RISE commenced trading on NYSE Arca on February 19, 2015 and trades under the symbol “RISE.” BDRY commenced investment operations on March 22, 2018. BDRY commenced trading on NYSE Arca on March 22, 2018 and trades under the symbol “BDRY.”
Effective January 1, 2018, Sit is paid a fee equal to 0.20% per annum of the value of RISE’s average daily net assets for Sit’s services as the commodity trading advisor to RISE.
RISE’s investment objective is to profit from rising interest rates by tracking the performance of a portfolio (the “RISE Benchmark Portfolio”) consisting of exchange traded futures contracts and options on futures on 2, 5 and 10 year U.S. Treasury securities (“Treasury Instruments”) weighted to achieve a targeted negative 10-year average effective portfolio duration (the “Benchmark Component Instruments”). RISE seeks to achieve its investment objective by investing in the Benchmark Component Instruments currently constituting the RISE Benchmark Portfolio. The RISE Benchmark Portfolio is maintained by Sit and will be rebalanced, reconstituted, or both, monthly (typically on the 15th of each month and on the next business day if the 15th is a holiday, weekend, or other day on which the national exchanges are closed) to maintain a negative 10-year average effective duration. The RISE Benchmark Portfolio and RISE will each maintain a short position in Treasury Instruments. RISE does not use futures contracts or options to obtain leveraged investment results. RISE will not invest in swaps or other over the counter derivative instruments.
The weighting of the Treasury Instruments constituting the Benchmark Component Instruments will be based on each maturity’s duration contribution. The expected range for the duration weighted percentage of the 2 year and 5 year maturity Treasury Instruments will be from 30% to 70%. The expected range for the duration weighted percentage of the 10-year maturity Treasury Instruments will be from 5% to 25%. The relative weightings of the Benchmark Component Instruments will be shifted between maturities when there are material changes in the shape of the yield curve, for example, if the Federal Reserve began raising short term interest rates more than long term interest rates. In such an instance, Sit, which maintains the RISE Benchmark Portfolio, will elect to increase the weightings of the 2 year and reduce the weighting in the 10-year maturity. Conversely, Sit will do the opposite if the Federal Reserve began raising long term interest rates more than short term interest rates. Reconstitution and rebalancing each will occur monthly, on the 15th, except for as noted above or if there are radical changes in the yield curve such that effective duration is outside of a range from negative nine to negative 11-year average effective duration, in which case Sit will adjust the maturities of the Treasury Instruments before the next expected monthly reconstitution.
16
The Sponsor anticipates that approximately 5% to 15% of RISE’s assets will be used as payment for or collateral for Treasury Instruments. In order to collateralize its Treasury Instrument positions, RISE will hold such assets, from which it will post margin to its futures commission merchant (“FCM”), SG Americas Securities, LLC, in an amount equal to the margin required by the relevant exchange, and transfer to its FCM any additional amounts that may be separately required by the FCM. When establishing positions in Treasury Instruments, RISE will be required to deposit initial margin with a value of approximately 3% to 10% of the value of each Treasury Instrument position at the time it is established. These margin requirements are subject to change from time to time by the exchange or the FCM. On a daily basis, RISE will be obligated to pay, or entitled to receive, variation margin in an amount equal to the change in the daily settlement level of its Treasury Instruments positions. Any assets not required to be posted as margin with the FCM will be held at RISE’s custodian in cash or cash equivalents, as discussed below.
The RISE Benchmark Portfolio will be invested in Benchmark Component Instruments and rebalanced, as noted above to maintain a negative average effective portfolio duration of approximately 10 years. Duration is a measure of estimated price sensitivity relative to changes in interest rates. Portfolios with longer durations are typically more sensitive to changes in interest rates. For example, if interest rates rise by 1%, the market value of a security with an effective duration of 5 years would decrease by 5%, with all other factors being constant, and likewise the market value of a security with an effective duration of negative 5 years would increase by 5%, with all other factors being constant. The correlation between duration and price sensitivity is greater for securities rated investment-grade than it is for securities rated below investment-grade.
Duration estimates are based on assumptions by Sit and are subject to a number of limitations. Effective duration is calculated based on historical price changes of U.S. Treasuries and Treasury Instruments held by the RISE Benchmark Portfolio, and therefore is a more accurate estimate of price sensitivity provided interest rates remain within their historical range. Investments in debt securities typically decrease in value when interest rates rise. The risk is usually greater for longer-term debt securities.
When RISE purchases an option that expires “out of the money,” RISE will realize a loss. RISE may not be able to invest its assets in futures and options contracts having an aggregate notional amount exactly equal to that which is required to achieve a negative 10-year average effective duration. For example, as standardized contracts, U.S. Treasury futures contracts are denominated in specific dollar amounts, and RISE’s NAV and the proceeds from the sale of a Creation Basket are unlikely to be an exact multiple of the amounts of those contracts. As a result, in such circumstances, RISE may be better able to achieve the exact amount of exposure desired through the use of other investments.
BDRY’s investment objective is to provide investors with exposure to the daily change in the price of dry bulk freight futures, before expenses and liabilities of BDRY, by tracking the performance of a portfolio (the “BDRY Benchmark Portfolio”, and together with the RISE Benchmark Portfolio, the “Benchmark Portfolios”) consisting of a three-month strip of the nearest calendar quarter of futures contracts on specified indexes (each a “Reference Index”) that measure rates for shipping dry bulk freight (“Freight Futures”). Each Reference Index is published each United Kingdom business day by the London-based Baltic Exchange Ltd. (the “Baltic Exchange”) and measures the charter rate for shipping dry bulk freight in a specific size category of cargo ship – Capesize, Panamax or Supramax. The three Reference Indexes are as follows:
| ● | Capesize: the Capesize 5TC Index; |
| ● | Panamax: the Panamax 4TC Index; and |
| ● | Supramax: the Supramax 6TC Index. |
The value of the Capesize 5TC Index is disseminated at 11:00 a.m., London Time and the value of the Panamax 4TC Index and the Supramax 6TC Index each is disseminated at 1:00 p.m., London Time. The Reference Index information disseminated by the Baltic Exchange also includes the components and value of each component in each Reference Index. Such Reference Index information also is widely disseminated by Reuters and/or other major market data vendors.
BDRY seeks to achieve its investment objective by investing substantially all of its assets in the Freight Futures currently constituting the BDRY Benchmark Portfolio. The BDRY Benchmark Portfolio includes all existing positions to maturity and settles them in cash. During any given calendar quarter, the BDRY Benchmark Portfolio progressively increases its positions to the next calendar quarter three-month strip, thus maintaining constant exposure to the Freight Futures market as positions mature.
17
The BDRY Benchmark Portfolio maintains long-only positions in Freight Futures. The BDRY Benchmark Portfolio includes a combination of Capesize, Panamax and Supramax Freight Futures. More specifically, the BDRY Benchmark Portfolio includes 50% exposure in Capesize Freight Futures contracts, 40% exposure in Panamax Freight Futures contracts and 10% exposure in Supramax Freight Futures contracts. The BDRY Benchmark Portfolio does not include and BDRY does not invest in swaps, non-cleared dry bulk freight forwards or other over-the-counter derivative instruments that are not cleared through exchanges or clearing houses. BDRY may hold exchange-traded options on Freight Futures. The BDRY Benchmark Portfolio is maintained by Breakwave and will be rebalanced annually. The Freight Futures currently constituting the BDRY Benchmark Portfolio, as well as the daily holdings of BDRY are available on BDRY’s website at www.drybulketf.com.
When establishing positions in Freight Futures, BDRY will be required to deposit initial margin with a value of approximately 10% to 40% of the notional value of each Freight Futures position at the time it is established. These margin requirements are established and subject to change from time to time by the relevant exchanges, clearing houses or BDRY’s FCM, MacQuarie Futures USA LLC. On a daily basis, BDRY is obligated to pay, or entitled to receive, variation margin in an amount equal to the change in the daily settlement level of its Freight Futures positions. Any assets not required to be posted as margin with the FCM may be held at BDRY’s custodian or remain with the FCM in cash or cash equivalents, as discussed below.
BDRY was created to provide investors with a cost-effective and convenient way to gain exposure to daily changes in the price of Freight Futures. BDRY is intended to be used as a diversification opportunity as part of a complete portfolio, not a complete investment program.
The Funds will incur certain expenses in connection with their operations. The Funds will hold cash or cash equivalents such as U.S. Treasuries or other high credit quality, short-term fixed-income or similar securities for direct investment or as collateral for the Treasury Instruments and for other liquidity purposes and to meet redemptions that may be necessary on an ongoing basis. These expenses and income from the cash and cash equivalent holdings may cause imperfect correlation between changes in the Funds’ net asset value (“NAV”) and changes in the Benchmark Portfolios, because the Benchmark Portfolios do not reflect expenses or income.
The Funds seek to trade their positions prior to maturity; accordingly, natural market forces may cost the Funds while rebalancing. Each time the Funds seek to reconstitute their positions, barring movement in the underlying securities, the futures and option prices may be higher or lower. Such differences in price, barring a movement in the price of the underlying security, will constitute “roll yield” and may inhibit the Funds’ ability to achieve their respective investment objective.
Several factors determine the total return from investing in a futures contract position. One factor that impacts the total return that will result from investing in near month futures contracts and “rolling” those contracts forward each month is the price relationship between the current near month contract and the next month contract.
The CTA will close existing positions when it determines it would be appropriate to do so and reinvest the proceeds in other positions. Positions may also be closed out to meet orders for redemption baskets.
(2) Summary of Significant Accounting Policies
(a) Basis of Accounting
The accompanying interim combined financial statements of the Funds have been prepared in conformity with U.S. generally accepted accounting principles (“U.S. GAAP”). Each Fund qualifies as an investment company for financial reporting purposes under Topic 946 of the Accounting Standard Codification of U.S. GAAP.
The accompanying interim combined financial statements are unaudited, but in the opinion of management, contain all adjustments (which include normal recurring adjustments) considered necessary to present fairly the interim combined financial statements. These interim combined financial statements should be read in conjunction with RISE’s annual report on Form 10-K for the year ended June 30, 2019, RISE’s prospectus dated January 22, 2020 (the “RISE Prospectus”), BDRY’s annual report on Form 10-K for the year ended June 30, 2019 and BDRY’s prospectus dated March 13, 2019 (the “BDRY Prospectus,” and together with the RISE Prospectus, the “Prospectuses”). Interim period results are not necessarily indicative of results for a full-year period.
18
(b) Use of Estimates
The preparation of the interim combined financial statements in conformity with U.S. GAAP requires management to make estimates and assumptions that affect the reported amounts of assets and liabilities and disclosure of contingent assets and liabilities at the date of the interim combined financial statements and accompanying notes. Actual results could differ from those estimates. There were no significant estimates used in the preparation of the interim combined financial statements.
(c) Cash
Cash, when shown in the Combined Statements of Assets and Liabilities, represents non-segregated cash with the custodian and does not include short-term investments.
(d) Cash Held by Broker
Sit is registered as a “commodity trading advisor” and acts as such for RISE. Breakwave is registered as a “commodity trading advisor” and acts as such for BDRY. Each Fund’s arrangement with its respective FCM requires the Fund to meet its variation margin requirement related to the price movements, both positive and negative, on futures contracts held by the Fund by keeping cash on deposit with the Commodity Brokers (as defined below). These amounts are shown as Segregated cash held by broker in the Combined Statements of Assets and Liabilities. The Funds deposit cash or United States Treasury Obligations, as applicable, with their respective FCM subject to the CFTC regulations and various exchange and broker requirements. The combination of the Funds’ deposits with their respective FCM of cash and United States Treasury Obligations, as applicable, and the unrealized gain or loss on open futures contracts (variation margin) represents the Funds’ overall equity in their respective brokerage trading account. The Funds use their cash held by their respective FCM to satisfy variation margin requirements. The Funds earn interest on their cash deposited with their respective FCM and interest income is recorded on the accrual basis.
(e) Final Net Asset Value for Fiscal Period
The calculation time of each Fund’s final net asset value for creation and redemption of Fund shares for the three months ended December 31, 2019 and 2018 was at 4:00 p.m. Eastern Time on December 31, 2019 and December 31, 2018, respectively.
Although the Funds’ shares may continue to trade on secondary markets subsequent to the calculation of the final NAV, the 4:00 p.m. Eastern Time represented the final opportunity to transact in creation or redemption baskets for the three months ended December 31, 2019 and 2018.
Fair value per share is determined at the close of the NYSE Arca.
For financial reporting purposes, each Fund values its investment positions based upon the final closing price in their primary markets. Accordingly, the investment valuations in these interim combined financial statements differ from those used in the calculations of the Funds’ final creation/redemption NAVs at December 31, 2019 and December 31, 2018.
(f) Investment Valuation
Short-term investments, excluding U.S. Treasury Bills, are carried at amortized cost, which approximates fair value. U.S. Treasury Bills are valued as determined by an independent pricing service based on methods which include consideration of: yields or prices of securities of comparable quality, coupon, maturity and type; indications as to values from dealers; and general market conditions.
Futures and options contracts are valued at the last settled price on the applicable exchange on which that futures and/or options contract trades.
19
(g) Financial Instruments and Fair Value
Each Fund discloses the fair value of its investments in accordance with the Financial Accounting Standards Board (“FASB”) fair value measurement and disclosure guidance which requires a fair value hierarchy that prioritizes the inputs to valuation techniques used to measure fair value. The disclosure requirements establish a fair value hierarchy that distinguishes between: (1) market participant assumptions developed based on market data obtained from sources independent to the Fund (observable inputs); and (2) the Fund’s own assumptions about market participant assumptions developed based on the best information available under the circumstances (unobservable inputs). The three levels defined by the disclosure requirements hierarchy are as follows:
Level I: Quoted prices (unadjusted) in active markets for identical assets and liabilities that the reporting entity has the ability to access at the measurement date.
Level II: Inputs other than quoted prices included within Level I that are observable for the asset or liability, either directly or indirectly. Level II inputs include the following: quoted prices for similar assets or liabilities in active markets, quoted prices for identical or similar assets or liabilities in markets that are not active, inputs other than quoted prices that are observable for the asset or liability, and inputs that are derived principally from or corroborated by observable market data by correlation or other means (market-corroborated inputs).
Level III: Unobservable pricing input at the measurement date for the asset or liability. Unobservable inputs shall be used to measure fair value to the extent that observable inputs are not available.
In some instances, the inputs used to measure fair value might fall in different levels of the fair value hierarchy. The level in the fair value hierarchy within which the fair value measurement in its entirety falls shall be determined based on the lowest input level that is significant to the fair value measurement in its entirety.
Fair value measurements also require additional disclosure when the volume and level of activity for the asset or liability have significantly decreased, as well as when circumstances indicate that a transaction is not orderly.
The following tables summarize RISE’s valuation of investments at December 31, 2019 and at June 30, 2019 using the fair value hierarchy:
| December 31, 2019 (unaudited) | ||||||||||||||||||
| Short-Term Investments |
Purchased
Options Contracts |
Written Options Contracts |
Futures Contracts |
Total | ||||||||||||||
| Level I – Quoted Prices | $ | 5,511,316 | a | $ | 21,797 | a | $ | (5,906 | )b | $ | 15,878 | c | $ | 5,543,085 | ||||
a – Included in Investments in securities in the Combined Statements of Assets and Liabilities.
b – Included in Options written, at fair value in the Combined Statements of Assets and Liabilities.
c – Included in Receivable on open futures contracts in the Combined Statements of Assets and Liabilities.
| June 30, 2019 (audited) | ||||||||||||||||||
| Short-Term Investments |
Purchased
Options Contracts |
Written Options Contracts |
Futures
Contracts |
Total | ||||||||||||||
| Level I – Quoted Prices | $ | 11,874,272 | a | $ | 35,625 | a | $ | (19,336 | )b | $ | (326,457) | c | $ | 11,564,104 | ||||
a – Included in Investments in securities in the Combined Statements of Assets and Liabilities.
b – Included in Options written, at fair value in the Combined Statements of Assets and Liabilities.
c – Included in Payable on open futures contracts in the Combined Statements of Assets and Liabilities.
Transfers between levels are recognized at the end of the reporting period. During the six months ended December 31, 2019 and the year ended June 30, 2019, RISE recognized no transfers from Level 1, Level 2 or Level 3.
20
The following table summarizes BDRY’s valuation of investments at December 31, 2019 and at June 30, 2019 using the fair value hierarchy:
| December 31, 2019 (unaudited) | ||||||||||||
| Short-Term Investments |
Futures Contracts |
Total | ||||||||||
| Level I – Quoted Prices | $ | 551,232 | a | $ | (105,125) | b | $ | 446,107 | ||||
a – Included in Investments in securities in the Combined Statements of Assets and Liabilities.
b – Included in Payable on open futures contracts in the Combined Statements of Assets and Liabilities.
| June 30, 2019 (audited) | ||||||||||||
| Short-Term Investments |
Futures
Contracts |
Total | ||||||||||
| Level I – Quoted Prices | $ | 1,095,625 | a | $ | 391,415 | b | $ | 1,487,040 | ||||
a – Included in Investments in securities in the Combined Statements of Assets and Liabilities.
b – Included in Receivable on open futures contracts in the Combined Statements of Assets and Liabilities.
Transfers between levels are recognized at the end of the reporting period. During the six months ended December 31, 2019 and the year ended June 30, 2019, BDRY recognized no transfers from Level 1, Level 2 or Level 3.
The inputs or methodology used for valuing investments are not necessarily an indication of the risk associated with investing in those securities.
(h) Investment Transactions and Related Income
Investment transactions are recorded on the trade date. All such transactions are recorded on the identified cost basis, and marked to market daily. Unrealized gain/loss on open futures contracts is reflected in Receivable/Payable on open futures contracts in the Combined Statements of Assets and Liabilities and the change in the unrealized gain/loss between periods is reflected in the Combined Statements of Operations. RISE’s discounts on short-term securities purchased are accreted daily and reflected as Interest Income, when applicable, in the Combined Statements of Operations. BDRY’s interest earned on short-term securities and on cash deposited with MacQuarie Futures USA LLC are accrued daily and reflected as Interest Income, when applicable, in the Combined Statements of Operations.
(i) Federal Income Taxes
Each Fund is registered as a Delaware statutory trust and is treated as a partnership for U.S. federal income tax purposes. Accordingly, the Funds do not expect to incur U.S. federal income tax liability; rather, each beneficial owner is required to take into account their allocable share of the Funds’ income, gain, loss, deductions and other items for the Funds’ taxable year ending with or within the beneficial owner’s taxable year.
Management of the Funds has reviewed the open tax years and major jurisdictions and concluded that there is no tax liability resulting from unrecognized tax benefits relating to uncertain income tax positions taken or expected to be taken in future tax returns at December 31, 2019 and June 30, 2019. The Funds are also not aware of any tax positions for which it is reasonably possible that the total amounts of unrecognized tax benefits will significantly change in the next twelve months. On an ongoing basis, management will monitor its tax positions taken to determine if adjustments to its conclusions are necessary based on factors including, but not limited to, further implementation of guidance expected from the FASB and on-going analysis of tax law, regulation, and interpretations thereof. The Funds’ federal tax returns are subject to examination by the Internal Revenue Service for a period of three years after they are filed.
(3) Investments
(a) Short-Term Investments
The Funds may purchase U.S. Treasury Bills, agency securities, and other high-credit quality short-term fixed income or similar securities with original maturities of one year or less. A portion of these investments may be used as margin for the Funds’ trading in futures contracts.
(b) Accounting for Derivative Instruments
In seeking to achieve each Fund’s investment objective, the applicable commodity trading advisor uses a mathematical approach to investing. Using this approach, the applicable commodity trading advisor determines the type, quantity and mix of investment positions that it believes in combination should produce returns consistent with the Fund’s objective.
21
All open derivative positions at December 31, 2019 and at June 30, 2019, as applicable, are disclosed in the Combined Schedules of Investments and the notional value of these open positions relative to the shareholders’ capital of the Funds is generally representative of the notional value of open positions to shareholders’ capital throughout the reporting periods for the Funds. The volume associated with derivative positions varies on a daily basis as the Funds transact in derivative contracts in order to achieve the appropriate exposure, as expressed in notional value, in comparison to shareholders’ capital consistent with the applicable Fund’s investment objective.
Following is a description of the derivative instruments used by the Funds during the reporting period, including the primary underlying risk exposures.
(c) Futures Contracts
The Funds enter into futures contracts to gain exposure to changes in the value of the Benchmark Portfolios. A futures contract obligates the seller to deliver (and the purchaser to accept) the future cash settlement of a specified quantity and type of a treasury futures contract at a specified time and place. The contractual obligations of a buyer or seller of a treasury futures contract may generally be satisfied by making an offsetting sale or purchase of an identical futures contract on the same or linked exchange before the designated date of delivery.
Upon entering into a futures contract, the Funds are required to deposit and maintain as collateral at least such initial margin as required by the exchange on which the transaction is affected. The initial margin is segregated as Cash held by broker, as disclosed in the Combined Statements of Assets and Liabilities, and is restricted as to its use. Pursuant to the futures contract, the Funds agree to receive from or pay to the broker an amount of cash equal to the daily fluctuation in value of the futures contract. Such receipts or payments are known as variation margin and are recorded by the Funds as unrealized gains or losses. The Funds will realize a gain or loss upon closing a futures transaction.
Futures contracts involve, to varying degrees, elements of market risk (specifically treasury price risk) and exposure to loss in excess of the amount of variation margin. The face or contract amounts reflect the extent of the total exposure the Funds have in the particular classes of instruments. Additional risks associated with the use of futures contracts include imperfect correlation between movements in the price of the futures contracts and the market value of the underlying securities and the possibility of an illiquid market for a futures contract. With futures contracts, there is minimal counterparty risk to the Funds since futures contracts are exchange-traded and the exchange’s clearinghouse, as counterparty to all exchange-traded futures contracts, guarantees the futures contracts against default.
SIT RISING RATE ETF
Fair Value of Derivative Instruments, as of December 31, 2019
| Asset Derivatives | Liability Derivatives | |||||||||||
| Derivatives | Combined
Statements of Assets and Liabilities |
Fair Value | Combined
Statements of Assets and Liabilities |
Fair Value | ||||||||
| Interest Rate Risk | Purchased options | $ | 21,797 | * | — | — | ||||||
| Interest Rate Risk | Receivable on open futures contracts | $ | 15,878 | ** | — | — | ||||||
| Interest Rate Risk | — | — | Written options, at fair value | $ | (5,906 | )* | ||||||
| * | Represents fair value of options contracts as reported in the Combined Statements of Assets and Liabilities. |
| ** | Represents cumulative appreciation of futures contracts as reported in the Combined Statements of Assets and Liabilities. |
SIT RISING RATE ETF
Fair Value of Derivative Instruments, as of June 30, 2019
| Asset Derivatives | Liability Derivatives | |||||||||||
| Derivatives | Combined
Statements of Assets and Liabilities |
Fair Value | Combined
Statements of Assets and Liabilities |
Fair Value | ||||||||
| Interest Rate Risk | Purchased options | $ | 35,625 | * | Payable on open futures contracts | $ | (326,457 | )** | ||||
| Interest Rate Risk | — | — | Written options, at fair value | $ | (19,336 | )* | ||||||
| * | Represents fair value of options contracts as reported in the Combined Statements of Assets and Liabilities. |
| ** | Represents cumulative depreciation of futures contracts as reported in the Combined Statements of Assets and Liabilities. |
22
SIT RISING RATE ETF
The Effect of Derivative Instruments on the Combined Statements of Operations
For the Three Months Ended December 31, 2019
| Derivatives | Location of Gain (Loss) on Derivatives | Realized Loss
on |
Change
in (Loss)
on |
|||||||
Interest Rate Risk |
Net realized loss on investments, futures and options contracts and/or Change in unrealized gain (loss) on investments, futures and options contracts | $ | (306,211) | $ | 391,106 | |||||
The futures and options contracts open at December 31, 2019 are indicative of the activity for the three months ended December 31, 2019.
SIT RISING RATE ETF
The Effect of Derivative Instruments on the Combined Statements of Operations
For the Three Months Ended December 31, 2018
| Derivatives | Location of Gain (Loss) on Derivatives | Realized Loss on Derivatives Recognized in Income |
Change
in Unrealized Gain (Loss) on Derivatives Recognized in Income |
|||||||
Interest Rate Risk |
Net realized gain on investments, futures and options contracts and/or Change in unrealized gain (loss) on investments, futures and options contracts | $ | 266,684 | $ | (3,327,205 | ) | ||||
The futures and options contracts open at December 31, 2018 are indicative of the activity for the three months ended December 31, 2018.
The Effect of Derivative Instruments on the Combined Statements of Operations
For the Six Months Ended December 31, 2019
| Derivatives | Location of Gain (Loss) on Derivatives | Realized Loss
on |
Change
in (Loss)
on |
|||||||
Interest Rate Risk |
Net realized loss on investments, futures and options contracts and/or Change in unrealized gain (loss) on investments, futures and options contracts | $ | (252,728) | $ | 368,231 | |||||
The futures and options contracts open at December 31, 2019 are indicative of the activity for the six months ended December 31, 2019.
The Effect of Derivative Instruments on the Combined Statements of Operations
For the Six Months Ended December 31, 2018
| Derivatives | Location of Gain (Loss) on Derivatives | Realized Loss on Derivatives Recognized in Income |
Change
in Unrealized Gain (Loss) on Derivatives Recognized in Income |
|||||||
Interest Rate Risk |
Net realized loss on investments, futures and options contracts and/or Change in unrealized gain (loss) on investments, futures and options contracts | $ | (456,707) | $ | (1,611,508 | ) | ||||
The futures and options contracts open at December 31, 2018 are indicative of the activity for the six months ended December 31, 2018.
23
BREAKWAVE DRY BULK SHIPPING ETF
Fair Value of Derivative Instruments, as of December 31, 2019
| Asset Derivatives | Liability Derivatives | |||||||||||||
| Derivatives | Combined
Statements of Assets and Liabilities |
Fair Value |
Combined
Statements of Assets and Liabilities |
Fair Value |
||||||||||
| Interest Rate Risk | — |
$ | — | Payable on open futures contracts | $ | (105,125) | * | |||||||
| * | Represents cumulative depreciation of futures contracts as reported in the Combined Statements of Assets and Liabilities. |
BREAKWAVE DRY BULK SHIPPING ETF
Fair Value of Derivative Instruments, as of June 30, 2019
| Asset Derivatives | Liability Derivatives | |||||||||||||
| Derivatives | Combined
Statements of Assets and Liabilities |
Fair Value |
Combined
Statements of Assets and Liabilities |
Fair Value |
||||||||||
| Interest Rate Risk | Receivable on open futures contracts | $ | 391,415 | * | — | — | ||||||||
| * | Represents cumulative appreciation of futures contracts as reported in the Combined Statements of Assets and Liabilities. |
BREAKWAVE DRY BULK SHIPPING ETF
The Effect of Derivative Instruments on the Combined Statements of Operations
For the Three Months Ended December 31, 2019
| Derivatives | Location of Gain (Loss) on Derivatives | Realized
Loss on Derivatives Recognized in Income |
Change
in Unrealized Gain (Loss) on Derivatives Recognized in Income |
|||||||
| Interest Rate Risk | Net realized loss on investments and futures and/or Change in unrealized gain (loss) on investments and futures contracts | $ | (243,845) | $ | (117,845) | |||||
The futures contracts open at December 31, 2019 are indicative of the activity for the three months ended December 31, 2019.
24
BREAKWAVE DRY BULK SHIPPING ETF
The Effect of Derivative Instruments on the Combined Statements of Operations
For the Three Months Ended December 31, 2018
| Derivatives | Location of Gain (Loss) on Derivatives | Realized
Gain on Derivatives Recognized in Income |
Change
in Unrealized Gain (Loss) on Derivatives Recognized in Income |
|||||||
| Interest Rate Risk | Net realized loss on investments and futures and/or Change in unrealized gain (loss) on investments and futures contracts | $ | (737,508) | $ | 137,005 | |||||
The futures contracts open at December 31, 2018 are indicative of the activity for the three months ended December 31, 2018.
BREAKWAVE DRY BULK SHIPPING ETF
The Effect of Derivative Instruments on the Combined Statements of Operations
For the Six Months Ended December 31, 2019
| Derivatives | Location of Gain (Loss) on Derivatives | Realized
Gain on Derivatives Recognized in Income |
Change
in Unrealized Gain (Loss) on Derivatives Recognized in Income |
|||||||
Interest Rate Risk |
Net realized gain on investments and futures and/or Change in unrealized gain (loss) on investments and futures contracts | $ | 338,181 | $ | 666,605 | |||||
The futures contracts open at December 31, 2019 are indicative of the activity for the six months ended December 31, 2019.
BREAKWAVE DRY BULK SHIPPING ETF
The Effect of Derivative Instruments on the Combined Statements of Operations
For the Six Months Ended December 31, 2018
| Derivatives | Location of Gain (Loss) on Derivatives | Realized
Loss on Derivatives Recognized in Income |
Change
in Unrealized Gain (Loss) on Derivatives Recognized in Income |
|||||||
Interest Rate Risk |
Net realized loss on investments and futures and/or Change in unrealized gain (loss) on investments and futures contracts | $ | (434,239) | $ | (33,580) | |||||
The futures contracts open at December 31, 2018 are indicative of the activity for the six months ended December 31, 2018.
(4) Agreements
(a) Management Fee
Each Fund pays the Sponsor a sponsor fee (the “Sponsor Fee”) in consideration of the Sponsor’s advisory services to the Funds. Additionally, each Fund pays its respective commodity trading advisor a license and service fee (the “CTA fee”).
25
Effective January 1, 2018 and later extended, the Sponsor has agreed to waive receipt of the Sponsor Fee for RISE and/or assume RISE’s expenses (excluding brokerage fees, interest expense, and extraordinary expenses) so that RISE’s total annual expenses do not exceed 1.00% per annum through January 31, 2021.
Further, effective January 1, 2018, RISE’s CTA fee, calculated daily and paid monthly in arrears, was reduced from .50% per annum to .20% per annum of average daily net assets.
In addition to the reduction in the expense limit, effective January 1, 2018, RISE’s Sponsor Fee, calculated daily and paid monthly, became the greater of 0.15% of its average daily net assets, or $75,000, and the fees for Principal Financial Officer and Chief Compliance Officer services provided to RISE by the Sponsor were each increased to $25,000 per annum. Certain additional fees paid to the Sponsor for tax return preparation and regulatory reporting fees were also increased. Effective April 1, 2019, the fee paid to the Sponsor for tax return preparation was reduced from $100,000 per year to $50,000 per year.
BDRY pays the Sponsor an annual Sponsor Fee, monthly in arrears, in an amount calculated as the greater of 0.15% of its average daily net assets, or $125,000. BDRY also paid an annual fee to Breakwave, monthly in arrears, in an amount equal to 1.45% of BDRY’s average daily net assets. As of March 22, 2018, Breakwave has agreed to waive its CTA fee to the extent necessary, and the Sponsor has voluntarily agreed to correspondingly assume the remaining expenses of BDRY such that Fund expenses do not exceed an annual rate of 3.50%, excluding brokerage commissions and interest expense, of the value of BDRY’s average daily net assets (the “BDRY Expense Cap,” and together with the RISE Expense Cap, the “Expense Caps”). The assumption of expenses by the Sponsor and waiver of BDRY’s CTA fee are contractual on the part of the Sponsor and Breakwave, respectively.
The waiver of BDRY’s CTA fees, pursuant to the undertaking, amounted to $6,561 and $10,462, for the three months ended December 31, 2019 and 2018, respectively and $16,213 and $23,499, respectively, for the six months ended December 31, 2019 and 2018, as disclosed in the Combined Statements of Operations.
The Funds currently accrue their daily expenses up to the applicable Expense Cap. At the end of each month, the accrued amount is remitted to the Sponsor as the Sponsor has assumed, and is responsible for the payment of the routine operational, administrative and other ordinary expenses of the Funds in excess of the Funds’ respective Expense Cap, which in the case of RISE, aggregated $100,323 and $17,920 for the three months ended December 31, 2019 and 2018, respectively, and $197,476 and $47,986 for the six months ended December 31, 2018, respectively and in the case of BDRY, aggregated $112,262 and $131,193 for the three months ended December 31, 2019 and 2018, respectively, and $217,318 and $256,383 for the six months ended December 31, 2019 and 2018, respectively, as disclosed in the Combined Statements of Operations.
(b) The Administrator, Custodian, Fund Accountant and Transfer Agent
Each Fund has appointed U.S. Bank, a national banking association, with its principal office in Milwaukee, Wisconsin, as the custodian (the “Custodian”). Its affiliate, U.S. Bancorp Fund Services, is the Fund accountant (“the Fund accountant”) of the Funds, transfer agent (the “Transfer Agent”) for Fund shares and administrator for the Funds (the “Administrator”). It performs certain administrative and accounting services for the Funds and prepares certain SEC, NFA and CFTC reports on behalf of the Funds. (U.S. Bank and U.S. Bancorp Fund Services are referred to collectively hereinafter as “U.S. Bank”).
26
RISE has agreed to pay U.S. Bank 0.05% of assets under management (“AUM”), with a $50,000 minimum annual fee payable for its administrative, accounting and transfer agent services and 0.01% of AUM, with an annual minimum of $4,800 for custody services. RISE paid U.S. Bank $14,479 and $14,191 for the three months ended December 31, 2019 and 2018, respectively, and $28,958 and $28,382 for the six months ended December 31, 2019 and 2018, respectively, as disclosed in the Combined Statements of Operations.
Effective March 22, 2018, BDRY has agreed to pay U.S. Bank 0.05% of AUM, with a $45,000 minimum annual fee payable for its administrative, accounting and transfer agent services and 0.01% of AUM, with an annual minimum of $4,800 for custody services. BDRY paid U.S. Bank $15,548 and $15,476 for the three months ended December 31, 2019 and, 2018, respectively, and $31,096 and $30,952 for the six months ended December 31, 2019 and 2018, respectively, as disclosed in the Combined Statements of Operations.
(c) The Distributor
The Funds pay ETFMG Financial LLC. (the “Distributor”), an affiliate of the Sponsor, an annual fee for statutory and wholesaling distribution services and related administrative services equal to the greater of $15,000 or 0.02% of the Funds’ average daily net assets, payable monthly. Pursuant to the respective Marketing Agent Agreement between the Sponsor, each Fund and the Distributor, the Distributor assists the Sponsor and the applicable Fund with certain functions and duties relating to distribution and marketing services to the applicable Fund, including reviewing and approving marketing materials and certain regulatory compliance matters. The Distributor also assists with the processing of creation and redemption orders.
RISE incurred $3,906 and $4,410 in distribution and related administrative services for the three months ended December 31, 2019 and 2018, respectively, and $7,812 and $8,820 for the six months ended December 31, 2019 and 2018, respectively, as disclosed in the Combined Statements of Operations. BDRY incurred $3,977 and $4,158 for the three months ended December 31, 2019 and 2018, respectively, and $7,954 and $8,316 for the six months ended December 31, 2019 and 2018, respectively, as disclosed in the Combined Statements of Operations.
RISE also pays the Sponsor an annual fee for wholesale support services equal to 0.1% of RISE’s average daily net assets, payable monthly. BDRY pays the Sponsor an annual fee for wholesale support services of $25,000 plus 0.12% of BDRY’s average daily net assets, payable monthly.
RISE incurred $1,566 and $16,915 in wholesale support fees for the three months ended December 31, 2019 and 2018, respectively, and $3,583 and $31,671 for the six months ended December 31, 2019 and 2018, respectively, as disclosed in the Combined Statements of Operations. BDRY incurred $6,827 and $7,167 in wholesale support fees for the three months ended December 31, 2019 and 2018, respectively, and $13,910 and $14,547 for the six months ended December 31, 2019 and 2018, respectively, as disclosed in the Combined Statements of Operations.
(d) The Commodity Broker
SG Americas Securities, LLC, a Delaware limited liability company, serves as RISE’s clearing broker. MacQuarie Futures USA LLC, a Delaware limited liability company, serves as BDRY’s clearing broker (such clearing broker, together with SG Americas Securities, LLC, the “Commodity Brokers”). In their capacity as clearing broker, the Commodity Brokers execute and clear the Funds’ futures transactions and perform certain administrative services for the Funds.
27
The Funds pay respective brokerage commissions, including applicable exchange fees, National Futures Association (“NFA”) fees, give–up fees, pit brokerage fees and other transaction related fees and expenses charged in connection with trading activities in CFTC regulated investments. Brokerage commissions on futures contracts are recognized on a half-turn basis.
The Sponsor does not expect brokerage commissions and fees to exceed 0.08% for RISE, and 0.76% for BDRY, of the net asset value of the applicable Fund for execution and clearing services on behalf of the applicable Fund, although the actual amount of brokerage commissions and fees in any year or any part of any year may be greater. The effects of trading spreads, financing costs associated with financial instruments, and costs relating to the purchase of U.S. Treasury Securities or similar high credit quality short-term fixed-income or similar securities are not included in the foregoing analysis. RISE incurred $927 and $19,434 in brokerage commissions and fees for the three months ended December 31, 2019 and 2018, respectively, and $2,793 and $35,862 for the six months ended December 31, 2019 and 2018, respectively, as disclosed in the Combined Statements of Operations. BDRY incurred $7,202 and $6,156 in brokerage commissions and fees for the three months ended December 31, 2019 and 2018, respectively, and $15,499 and $15,093 for the six months ended December 31, 2019 and 2018, respectively, as disclosed in the Combined Statements of Operations.
(e) The Trustee
Under the respective Amended and Restated Declaration of Trust and Trust Agreement (the “Trust Agreement”) for each Fund, Wilmington Trust Company, the Trustee of each of the Funds (the “Trustee”) serves as the sole trustee of each Fund in the State of Delaware. The Trustee will accept service of legal process on the Funds in the State of Delaware and will make certain filings under the Delaware Statutory Trust Act. Under the respective Trust Agreement for each Fund, the Sponsor has the exclusive management and control of all aspects of the business of the Fund. The Trustee does not owe any other duties to the Fund, the Sponsor or the Shareholders of the Fund. The Trustee has no duty or liability to supervise or monitor the performance of the Sponsor, nor does the Trustee have any liability for the acts or omissions of the Sponsor. RISE incurred $628 and $630, in trustee fees for the three months ended December 31, 2019 and 2018, respectively, and $1,256 and $1,260 for the six months ended December 31, 2019 and 2018, respectively, which is included in Other Expenses in the Combined Statements of Operations. BDRY incurred $628 and $630 in trustee fees for the three months ended December 31, 2019 and 2018, respectively, and $1,256 and $1,260 for the six months ended December 31, 2019 and 2018, respectively, which is included in Other Expenses in the Combined Statements of Operations.
(f) Routine Offering, Operational, Administrative and Other Ordinary Expenses
Effective January 1, 2018, the Sponsor, in accordance with the RISE Expense Cap limitation, paid all of the routine offering, operational, administrative and other ordinary expenses of RISE in excess of 1.00% (excluding brokerage commissions and interest expense) of RISE’s average daily net assets, including, but not limited to, accounting and computer services, the fees and expenses of the Trustee, Administrator, Custodian, Transfer Agent and Distributor, legal and accounting fees and expenses, tax return preparation expenses, filing fees, and printing, mailing and duplication costs. RISE incurred $116,924 and $206,506 for the three months ended December 31, 2019 and 2018, respectively, and $236,108 and $400,559 for the six months ended December 31, 2019 and 2018, respectively, in routine offering, operational, administrative or other ordinary expenses.
The assumption of Fund expenses above the RISE Expense Cap by the Sponsor, pursuant to the undertaking (as discussed in Note 4a), amounted to $100,323 and $17,920 for the three months ended December 31, 2019 and 2018, respectively, and $197,476 and $47,986 for the six months ended December 31, 2019 and 2018, respectively.
28
The Sponsor, in accordance with the BDRY Expense Cap limitation paid, after the waiver of the CTA fee for BDRY by Breakwave, all of the routine offering, operational, administrative and other ordinary expenses of BDRY in excess of 3.50% (excluding brokerage commissions and interest expense) of BDRY’s average daily net assets, including, but not limited to, accounting and computer services, the fees and expenses of the Trustee, Administrator, Custodian, Transfer Agent and Distributor, legal and accounting fees and expenses, tax return preparation expenses, filing fees, and printing, mailing and duplication costs. BDRY incurred $141,861 and $173,067 for the three months ended December 31, 2019 and 2018, respectively, and $288,164 and $351,703 for the six months ended December 31, 2019 and 2018, respectively, in routine offering, operational, administrative or other ordinary expenses.
The CTA fee waiver for BDRY by Breakwave was $6,561 and $10,462 for the three months ended December 31, 2019 and 2018, respectively, and $16,213 and $23,499 for the six months ended December 31, 2019 and 2018, respectively.
In addition, the assumption of Fund expenses above the BDRY Expense Cap by the Sponsor, pursuant to the undertaking (as discussed in Note 4a), amounted to $112,262 and $131,193 for the three months ended December 31, 2019 and 2018, respectively, and $217,318 and $256,383 for the six months ended December 31, 2019 and 2018, respectively.
(g) Organizational and Offering Costs
Expenses incurred in connection with organizing RISE and up to the offering of its Shares upon commencement of its investment operations on February 19, 2015, were paid by the Sponsor and Sit without reimbursement. Expenses incurred in connection with organizing BDRY and up to the offering of its Shares upon commencement of its investment operations on March 22, 2018, were paid by the Sponsor and Breakwave without reimbursement.
Accordingly, all such expenses are not reflected in the Statements of Operations. The Funds will bear the costs of their continuous offerings of Shares and ongoing offering expenses. Such ongoing offering costs will be included as a portion of the Routine Offering, Operational, Administrative and Other Ordinary Expenses. These costs will include registration fees for regulatory agencies and all legal, accounting, printing and other expenses associated therewith. These costs will be accounted for as a deferred charge and thereafter amortized to expense over twelve months on a straight-line basis or a shorter period if warranted. For the three and six months ended December 31, 2019 and 2018, neither RISE nor BDRY incurred such expenses.
(h) Extraordinary Fees and Expenses
The Fund will pay all extraordinary fees and expenses, if any. Extraordinary fees and expenses are fees and expenses which are nonrecurring and unusual in nature, such as legal claims and liabilities, litigation costs or indemnification or other unanticipated expenses. Such extraordinary fees and expenses, by their nature, are unpredictable in terms of timing and amount. For the three and six months ended December 31, 2019 and 2018, respectively, nether RISE nor BDRY incurred such expenses.
(5) Creations and Redemptions
Each Fund issues and redeems Shares from time to time, but only in one or more Creation Baskets. A Creation Basket is a block of 25,000 Shares (50,000 Shares prior to August 17, 2018) of each Fund. Baskets may be created or redeemed only by Authorized Participants.
Except when aggregated in Creation Baskets, the Shares are not redeemable securities. Retail investors, therefore, generally will not be able to purchase or redeem Shares directly from or with each Fund. Rather, most retail investors will purchase or sell Shares in the secondary market with the assistance of a broker. Thus, some of the information contained in these Notes to Interim Combined Financial Statements – such as references to the Transaction Fee imposed on creations and redemptions – is not relevant to retail investors.
29
(a) Transaction Fees on Creation and Redemption Transactions
In connection with orders to create and redeem one or more Creation Baskets, an Authorized Participant is required to pay a transaction fee, or AP Transaction Fee, of $500 per order, which goes directly to the Custodian. The AP Transaction Fees are paid by the Authorized Participants and not by the Funds.
(b) Share Transactions
SIT RISING RATE ETF
| Summary of Share Transactions for the Three Months Ended December 31, 2019 | ||||||||
| Shares | Net Assets Decrease | |||||||
| Shares Sold | — | $ | — | |||||
| Shares Redeemed | (25,000 | ) | (577,766 | ) | ||||
| Net Decrease | (25,000 | ) | $ | (577,766 | ) | |||
| Summary of Share Transactions for the Three Months Ended December 31, 2018 | ||||||||
| Shares | Net Assets Increase | |||||||
| Shares Sold | 500,000 | $ | 12,510,953 | |||||
| Shares Redeemed | (475,000 | ) | (11,687,830 | ) | ||||
| Net Increase | 25,000 | $ | 823,123 | |||||
| Summary of Share Transactions for the Six Months Ended December 31, 2019 | ||||||||
| Shares | Net Assets Decrease | |||||||
| Shares Sold | — | $ | — | |||||
| Shares Redeemed | (275,000 | ) | (6,331,666 | ) | ||||
| Net Decrease | (275,000 | ) | $ | (6,331,666 | ) | |||
| Summary of Share Transactions for the Six Months Ended December 31, 2018 | ||||||||
| Shares | Net
Assets Increase |
|||||||
| Shares Sold | 775,000 | $ | 24,297,005 | |||||
| Shares Redeemed | (525,000 | ) | (14,163,400 | ) | ||||
| Net Increase | 250,000 | $ | 10,133,605 | |||||
30
BREAKWAVE DRY BULK SHIPPING ETF
| Summary of Share Transactions for the Three Months Ended December 31, 2019 | ||||||||
| Shares | Net Assets Increase | |||||||
| Shares Sold | 75,000 | $ | 1,151,130 | |||||
| Shares Redeemed | (25,000 | ) | (431,515 | ) | ||||
| Net Increase | 50,000 | $ | 719,615 | |||||
| Summary of Share Transactions for the Three Months Ended December 31, 2018 | ||||||||
| Shares | Net
Assets Increase | |||||||
| Shares Sold | — | $ | — | |||||
| Shares Redeemed | — | — | ||||||
| Net Increase | — | $ | — | |||||
| Summary of Share Transactions for the Six Months Ended December 31, 2019 | ||||||||
| Shares | Net
Assets Decrease | |||||||
| Shares Sold | 75,000 | $ | 1,151,130 | |||||
| Shares Redeemed | (250,000 | ) | (4,121,777 | ) | ||||
| Net Decrease | (175,000 | ) | $ | (2,970,647 | ) | |||
| Summary of Share Transactions for the Six Months Ended December 31, 2018 | ||||||||
| Shares | Net
Assets Increase | |||||||
| Shares Sold | — | $ | — | |||||
| Shares Redeemed | — | — | ||||||
| Net Increase | — | $ | — | |||||
31
(6) Risk
(a) Investment Related Risk
The NAV of RISE’s shares relates directly to the value of the U.S. treasuries, cash and cash equivalents held by RISE and the portfolio’s negative effective duration established and maintained through RISE’s investment in Treasury Instruments. Fluctuations in the prices of these assets could materially adversely affect the value and performance of an investment in RISE’s shares. Past performance is not necessarily indicative of future results; all or substantially all of an investment in RISE could be lost.
Investments in debt securities typically decrease in value when interest rates rise, however, RISE attempts to maintain a portfolio with a negative effective duration and therefore anticipates that an increase in interest rates may increase RISE’s value, and a decrease in rates may lower RISE’s value. The NAV of RISE’s shares relates directly to the value of U.S. Treasuries and Treasury Instruments held by RISE which are materially impacted by interest rate movements. The magnitude of the impact on value from a change in interest rates is often greater for longer-term fixed income than shorter-term securities. Interest rates have remained near historic lows since the market events of 2008 and may remain low.
Interest rate movements are heavily influenced by the action of the Board of Governors of the Federal Reserve System and other central banks. Their actions are based on judgments and policies which involve numerous political and economic factors which are unpredictable. Recent interest rate and monetary policies have been unprecedented and may continue to be so.
RISE attempts to track a portfolio benchmark. The performance of RISE may not closely track the performance of the RISE Benchmark Portfolio for a variety of reasons. For example, RISE incurs operating expenses and portfolio transaction costs not incurred by the benchmark. RISE is also required to manage cash flows and may experience operational inefficiencies the benchmark does not. In addition, RISE may not be fully invested in the contents of its benchmark at all times or may hold securities not included in its benchmark.
RISE invests in Treasury Instruments and U.S. treasuries with exposure to different maturity dates. Generally, RISE’s exposure to securities with maturities of 2 and 5 years will be greater than its exposure to securities with maturities of 10 years. Interest rates do not change uniformly for U.S. Treasuries of different maturities and therefore if interest rates rise, the investment performance of RISE will be impacted by RISE’s current maturity exposure which may be different from the expectations of the Sponsor and investors in RISE. At any time, RISE’s maturity exposure may not be optimal with respect to a movement in interest rates which would negatively impact performance.
The NAV of BDRY’s shares relates directly to the value of the futures portfolio, cash and cash equivalents held by BDRY. Fluctuations in the prices of these assets could materially adversely affect the value and performance of an investment in BDRY’s shares. Past performance is not necessarily indicative of future results; all or substantially all of an investment in BDRY could be lost.
The NAV of BDRY’s shares relates directly to the value of futures investments held by BDRY which are materially impacted by fluctuations in changes in spot charter rates. Charter rates for dry bulk vessels are volatile and have declined significantly since their historic highs and may remain at low levels or decrease further in the future.
Futures and options contracts have expiration dates. Before or upon the expiration of a contract, BDRY may be required to enter into a replacement contract that is priced higher or that have less favorable terms than the contract being replaced (see “Negative Roll Risk,” below). The Freight Futures market settles in cash against published indices, so there is no physical delivery against the futures contracts.
Similar to other futures contracts, the Freight Futures curve shape could be either in “contango” (where the futures curve is upward sloping with next futures price higher than the current one) or “backwardation” (where each the next futures price is lower than the current one). Contango curves are generally characterized by negative roll cost, as the expiring contract value is lower that the next prompt contract value, assuming the same lot size. That means there could be losses incurred when the contracts are rolled each period and such losses are independent of the Freight Futures price level.
32
(b) Liquidity Risk
In certain circumstances, such as the disruption of the orderly markets for the futures contracts or Financial Instruments in which the Funds invest, the Funds might not be able to dispose of certain holdings quickly or at prices that represent what the market value may have been in an orderly market. Futures and option positions cannot always be liquidated at the desired price. It is difficult to execute a trade at a specific price when there is a relatively small volume of buy and sell orders in a market. A market disruption can also make it difficult to liquidate a position. The large size of the positions that the Funds may acquire increases the risk of illiquidity both by making its positions more difficult to liquidate and by potentially increasing losses while trying to do so. Such a situation may prevent the Funds from limiting losses, realizing gains or achieving a high correlation with the applicable Benchmark Portfolio.
(7) Profit and Loss Allocations and Distributions
Pursuant to the Trust Agreement, income and expenses are allocated pro rata among the Shareholders monthly based on their respective percentage interests as of the close of the last trading day of the preceding month. Any losses allocated to the Sponsor which are in excess of the Sponsor’s capital balance are allocated to the Shareholders in accordance with their respective interest in the Funds as a percentage of total Shareholders’ capital. Distributions (other than redemption of units) may be made at the sole discretion of the Sponsor on a pro rata basis in accordance with the respective interests of the Shareholders.
(8) Indemnifications
The Sponsor, either in its own capacity or in its capacity as the Sponsor and on behalf of the Funds, has entered into various service agreements that contain a variety of representations, or provide indemnification provisions related to certain risks service providers undertake in performing services which are in the best interests of the Funds. As of December 31, 2019, the Funds had not received any claims or incurred any losses pursuant to these agreements and expects the risk of such losses to be remote.
(9) Termination
The term of each Fund is perpetual unless terminated earlier in certain circumstances as described in the applicable Prospectus.
33
(10) Net Asset Value and Financial Highlights
The Funds are presenting, as applicable, the following net asset value and financial highlights related to investment performance for a Share outstanding throughout the three months ended December 31, 2019 and December 31, 2018, respectively, and the six months ended December 31, 2019 and 2018, respectively. The net investment income and total expense ratios are calculated using average net assets. The net asset value presentation is calculated by dividing each Fund’s net assets by the average daily number of Shares outstanding. The net investment income (loss) and expense ratios have been annualized. The total return is based on the change in net asset value and market value of the Shares during the period. An individual investor’s return and ratios may vary based on the timing of their transactions in Fund Shares.
| THREE MONTHS ENDED | THREE MONTHS ENDED | |||||||||||||||
| DECEMBER 31, 2019 | DECEMBER 31, 2018 | |||||||||||||||
| SIT RISING | BREAKWAVE DRY BULK SHIPPING | SIT RISING | BREAKWAVE DRY BULK SHIPPING | |||||||||||||
| RATE ETF | ETF | RATE ETF | ETF | |||||||||||||
| Net Asset Value | ||||||||||||||||
| Net asset value per Share, beginning of period | $ | 22.61 | $ | 19.65 | $ | 25.13 | $ | 22.68 | ||||||||
| Net investment income (loss) | 0.05 | (0.17 | ) | 0.07 | (0.12 | ) | ||||||||||
| Net realized and unrealized gain (loss) | 0.30 | (4.11 | ) | (1.14 | ) | (4.00 | ) | |||||||||
| Net Income (Loss) | 0.35 | (4.28 | ) | (1.07 | ) | (4.12 | ) | |||||||||
| Net Asset Value per Share, end of period | $ | 22.96 | $ | 15.37 | $ | 24.06 | $ | 18.56 | ||||||||
| Market Value per Share, end of period | $ | 22.97 | $ | 15.45 | $ | 24.09 | $ | 17.92 | (a) | |||||||
| Ratios to Average Net Assets* | ||||||||||||||||
| Expense Ratio*** | 1.06 | % | 5.09 | % | 1.11 | % | 4.35 | % | ||||||||
| Expense Ratio*** before Waiver/Assumption | 7.47 | % | 31.35 | % | 1.22 | % | 23.98 | % | ||||||||
| Net Investment Income (Loss) | 0.93 | % | (3.69 | %) | 1.08 | % | (2.49 | %) | ||||||||
| Total Return, at Net Asset Value** | 1.55 | % | (21.78 | %) | (4.26 | %) | (18.17 | %) | ||||||||
| Total Return, at Market Value** | 1.50 | % | (21.61 | %) | (4.10 | %) | (21.88 | %) | ||||||||
| (a) | Represents the closing bid/ask mean as of December 31, 2018 |
| * | Percentages are annualized |
| ** | Percentages are not annualized |
| *** | For Sit Rising Rate ETF, effective January 1, 2018, Fund expenses have been capped at 1.00% of average daily net assets, plus brokerage commissions and interest expense. For Breakwave Dry Bulk Shipping ETF, as of inception (March 22, 2018), Fund expenses have been capped at 3.50% of average daily net assets, plus brokerage commissions and interest expense. |
34
| SIX MONTHS ENDED | SIX MONTHS ENDED | |||||||||||||||
| DECEMBER 31, 2019 | DECEMBER 31, 2018 | |||||||||||||||
| SIT RISING | BREAKWAVE DRY BULK SHIPPING | SIT RISING | BREAKWAVE DRY BULK SHIPPING | |||||||||||||
| RATE ETF | ETF | RATE ETF | ETF | |||||||||||||
| Net Asset Value | ||||||||||||||||
| Net asset value per Share, beginning of period | $ | 22.70 | $ | 13.25 | $ | 24.65 | $ | 21.98 | ||||||||
| Net investment income (loss) | 0.12 | (0.28 | ) | 0.12 | (0.30 | ) | ||||||||||
| Net realized and unrealized gain (loss) | 0.14 | 2.40 | (0.71 | ) | (3.12 | ) | ||||||||||
| Net Income (Loss) | 0.26 | 2.12 | (0.59 | ) | (3.42 | ) | ||||||||||
| Net Asset Value per Share, end of period | $ | 22.96 | $ | 15.37 | $ | 24.06 | 18.56 | |||||||||
| Market Value per Share, end of period | $ | 22.97 | $ | 15.45 | $ | 24.09 | 17.92 | (a) | ||||||||
| Ratios to Average Net Assets* | ||||||||||||||||
| Expense Ratio*** | 1.08 | % | 4.89 | % | 1.19 | % | 4.43 | % | ||||||||
| Expense Ratio*** before Waiver/Assumption | 6.59 | % | 25.77 | % | 1.36 | % | 21.70 | % | ||||||||
| Net Investment Income (Loss) | 1.02 | % | (3.19 | %) | 1.02 | % | (2.79 | %) | ||||||||
| Total Return, at Net Asset Value** | 1.15 | % | 16.00 | % | (2.39 | %) | (15.56 | %) | ||||||||
| Total Return, at Market Value** | 1.06 | % | 17.49 | % | (2.31 | %) | (18.69 | %) | ||||||||
| (a) | Represents the closing bid/ask mean as of December 31, 2018 |
| * | Percentages are annualized |
| ** | Percentages are not annualized |
| *** | For Sit Rising Rate ETF, effective January 1, 2018, Fund expenses have been capped at 1.00% of average daily net assets, plus brokerage commissions and interest expense. For Breakwave Dry Bulk Shipping ETF, as of inception (March 22, 2018), Fund expenses have been capped at 3.50% of average daily net assets, plus brokerage commissions and interest expense. |
(11) Legal Proceedings
Samuel Masucci III and Bernard Karol, principals of the Sponsor, are defendants, along with certain affiliates of the Sponsor, in an action filed May 2, 2017 in the Superior Court of New Jersey captioned PureShares, LLC d/b/a PureFunds et al. v. ETF Managers Group, LLC et al., Docket No. C-63-17 (the “PureShares Action”). The PureShares Action alleges claims based on disputes arising out of contractual relationships with ETF Managers Group LLC, an affiliate of the Sponsor. The action seeks damages in unspecified amounts and injunctive relief based on breach of contract, wrongful termination, and several other theories.
Samuel Masucci III, a principal of the Sponsor, was a defendant, along with certain affiliates of the Sponsor, in a case filed on October 26, 2017 in the United States District Court for the Southern District of New York by NASDAQ, Inc. captioned Nasdaq, Inc. v. Exchange Traded Managers Group, LLC et al., Case 1:17-cv-08252 (the “Nasdaq Action”). This action arose out of the same facts and circumstances as the PureShares Action and asserts claims for breach of contract, conversion and certain other claims with respect to the same exchange traded funds as in the PureShares Action. Mr. Masucci was dismissed as a defendant pursuant to a motion to dismiss in August 2018. The matter was the subject of a bench trial in May 2019, and on December 20, 2019, the Court issued an Opinion and Order awarding compensatory damages to Plaintiff in the amount of $78,403,172.36, plus prejudgment interest. The Court also denied Plaintiff’s requests for punitive damages and equitable relief. The Adviser filed a notice of appeal from the judgment on January 19, 2020. The Sponsor believes that this judgment will not affect its ability to continue to act as CPO and Sponsor for the Funds.
(12) Subsequent Events
In preparing these financial statements, the Funds have evaluated events and transactions for potential recognition or disclosure through the date the financial statements were issued. This evaluation did not result in any subsequent events that necessitated disclosures and/or adjustments to the financial statements.
35
Item 2. Management’s Discussion and Analysis of Financial Condition and Results of Operations.
This information should be read in conjunction with the financial statements and notes included in Item 1 of Part I of this Quarterly Report (the “Report”). The discussion and analysis which follows may contain trend analysis and other forward-looking statements within the meaning of Section 21E of the Securities Exchange Act of 1934 which reflect our current views with respect to future events and financial results. Words such as “anticipate,” “expect,” “intend,” “plan,” “believe,” “seek,” “outlook” and “estimate,” as well as similar words and phrases, signify forward-looking statements. ETF Managers Group Commodity Trust I’s forward-looking statements are not guarantees of future results and conditions, and important factors, risks and uncertainties may cause our actual results to differ materially from those expressed in our forward-looking statements.
You should not place undue reliance on any forward-looking statements. Except as expressly required by the Federal securities laws, ETF Managers Capital, LLC undertakes no obligation to publicly update or revise any forward-looking statements or the risks, uncertainties or other factors described in this Report, as a result of new information, future events or changed circumstances or for any other reason after the date of this Report.
Overview
The Trust is a Delaware statutory trust formed on July 23, 2014. The Trust is a series trust formed pursuant to the Delaware Statutory Trust Act and currently includes two separate series: Sit Rising Rate ETF (“RISE”) is the first series of the Trust and is a commodity pool that continuously issues common shares of beneficial interest that may be purchased and sold on the NYSE Arca, Inc. stock exchange (“NYSE Arca”). The second series of the Trust, Breakwave Dry Bulk Shipping ETF (“BDRY,” and together with RISE, each, a “Fund” and collectively, the “Funds”), is also a commodity pool that continuously issues shares of beneficial interest that may be purchased and sold on the NYSE Arca.
The Funds are each managed and controlled by ETF Managers Capital LLC (the “Sponsor”), a single member limited liability company that was formed in the state of Delaware on June 12, 2014. Each Fund pays the Sponsor a management fee. The Sponsor, the Trust, and the Funds maintain their main business offices at 30 Maple Street, Suite 2, Summit, NJ 07901. The Sponsor’s telephone number is (908) 897-0518.
The Sponsor is a wholly-owned subsidiary of Exchange Traded Managers Group LLC (“ETFMG”), a limited liability company domiciled and headquartered in New Jersey.
The Sponsor has the power and authority to establish and designate one or more series and to issue shares thereof, from time to time as it deems necessary or desirable. The Sponsor has exclusive power to fix and determine the relative rights and preferences as between the shares of any series as to the right of redemption, special and relative rights as to dividends and other distributions and on liquidation, conversion rights, and conditions under which the series shall have separate voting rights or no voting rights. The term for which the Trust is to exist commenced on the date of the filing of the Certificate of Trust, and the Trust, the Funds, and any additional series created in the future will exist in perpetuity, unless earlier terminated in accordance with the provisions of the Trust Agreement. Separate and distinct records shall be maintained for each Fund and the assets associated with a Fund shall be held in such separate and distinct records (directly or indirectly, including a nominee or otherwise) and accounted for in such separate and distinct records separately from the assets of any other series. The Funds and each future series will be separate from all such series in respect of the assets and liabilities allocated to a Fund and each separate series and will represent a separate investment portfolio of the Trust.
The Funds are each a “commodity pool” as defined by the Commodity Exchange Act (“CEA”). Consequently, the Sponsor has registered as a commodity pool operator (“CPO”) with the Commodity Futures Trading Commission (“CFTC”) and is a member of the National Futures Association (“NFA”).
The sole Trustee of the Trust is Wilmington Trust, N.A. (the “Trustee”), and the Trustee serves as the Trust’s corporate trustee as required under the Delaware Statutory Trust Act (“DSTA”). The Trustee’s principal offices are located at 1100 North Market Street, Wilmington, Delaware 19890. The Trustee is unaffiliated with the Sponsor. The rights and duties of the Trustee and the Sponsor with respect to the offering of the Shares and Fund management and the shareholders are governed by the provisions of the DSTA and by the Trust Agreement.
RISE commenced investment operations on February 19, 2015. RISE commenced trading on NYSE Arca on February 19, 2015 and trades under the symbol “RISE”. BDRY commenced investment operations on March 22, 2018. BDRY commenced trading on NYSE Arca on March 22, 2018. BDRY commenced trading on NYSE Arca on March 22, 2018 and trades under the symbol “BDRY”.
Each Fund is designed and managed to track the performance of a portfolio (a “Benchmark Portfolio”) consisting of futures contracts and options on futures contracts (the “Benchmark Component Instruments”).
36
Sit Rising Rate ETF
The Investment Objective of the Fund
RISE’s investment objective is to profit from rising interest rates by tracking the performance of a portfolio (“the Benchmark Portfolio”) consisting of exchange traded futures contracts and options on futures on 2, 5 and 10 year U.S. Treasury securities (“Treasury Instruments”) weighted to achieve a targeted negative 10 year average effective portfolio duration (the “RISE Benchmark Component Instruments”). RISE seeks to achieve its investment objective by investing in the RISE Benchmark Component Instruments currently constituting the RISE Benchmark Portfolio.
The Benchmark Portfolio
The RISE Benchmark Portfolio is maintained by Sit Fixed Income Advisors II, LLC (“Sit”), which also serves as the Fund’s commodity trading advisor (“CTA”). The RISE Benchmark Portfolio will be rebalanced, reconstituted, or both, monthly (typically on the 15th of each month or on the next business day if the 15th is a holiday, weekend, or other day on which the national stock exchanges are closed) to maintain a negative 10 year average effective duration. The RISE Benchmark Portfolio and RISE will each maintain a short position in Treasury Instruments. RISE does not use futures contracts or options to obtain leveraged investment results.
The Fund will not invest in swaps or other over-the-counter derivative instruments.
The RISE Benchmark Component Instruments currently constituting the RISE Benchmark Portfolio as of December 31, 2019 include:
| Name | Ticker | Market Value USD | ||||
| US 10YR FUT OPTN FEB 20P 129.50 | TYH0P129.5 | $ | 21,797 | |||
| UNITED STATES TREAS BILLS | 912796WQ8 | 5,344,368 | ||||
| US 5YR NOTE MAR20 | FVH0 | (5,456,031 | ) | |||
| US 2 YR NOTE MAR20 | TUH0 | (11,852,500 | ) | |||
| US 5YR FUTR OPTN FEB19C 118.50 | FVH0C118.5 | (5,906 | ) | |||
The RISE Benchmark Component Instruments currently constituting the RISE Benchmark Portfolio and anticipated rebalancing dates, as well as the daily holdings of the Fund, are available on the Fund’s website at www.risingrateetf.com.
The weighting of the Treasury Instruments constituting the RISE Benchmark Component Instruments will be based on each maturity’s duration contribution. The expected range for the duration weighted percentage of the 2 year and 5 year maturity Treasury Instruments will be from 30% to 70%. The expected range for the duration weighted percentage of the 10 year maturity Treasury Instruments will be from 5% to 25%. The relative weightings of the RISE Benchmark Component Instruments will be shifted between maturities when there are material changes in the shape of the yield curve, for example, if the Federal Reserve began raising short term interest rates more than long term interest rates. In such an instance, Sit, which maintains the RISE Benchmark Portfolio, will increase the weightings of the 2 year and reduce the weighting in the 10 year maturity Treasury Instruments. Conversely, Sit will do the opposite if the Federal Reserve began raising long term interest rates more than short term interest rates. Reconstitution and rebalancing each will occur monthly, on the 15th, except for as noted above or if there are radical changes in the yield curve such that effective duration is outside of a range from negative nine to negative 11 year average effective duration, in which case Sit will adjust the maturities of the Treasury Instruments before the next expected monthly reconstitution.
The Sponsor anticipates that approximately 5% to 15% of the Fund’s assets will be used as payment for or collateral for Treasury Instruments. In order to collateralize its Treasury Instrument positions, the Fund will hold such assets, from which it will post margin to its FCM, in an amount equal to the margin required by the relevant exchange, and transfer to its FCM any additional amounts that may be separately required by the FCM. When establishing positions in Treasury Instruments, the Fund will be required to deposit initial margin with a value of approximately 3% to 10% of the value of each Treasury Instrument position at the time it is established. These margin requirements are subject to change from time to time by the exchange or the FCM. On a daily basis, the Fund will be obligated to pay, or entitled to receive, variation margin in an amount equal to the change in the daily settlement level of its Treasury Instruments positions. Any assets not required to be posted as margin with the FCM will be held at the Fund’s administrator in cash or cash equivalents as discussed below.
37
The RISE Benchmark Portfolio will be invested in RISE Benchmark Component Instruments and rebalanced, as noted above, to maintain a negative average effective portfolio duration of approximately 10 years. Duration is a measure of estimated price sensitivity relative to changes in interest rates. Portfolios with longer durations are typically more sensitive to changes in interest rates. For example, if interest rates rise by 1%, the market value of a security with an effective duration of 5 years would decrease by 5%, with all other factors being constant, and likewise the market value of a security with an effective duration of negative 5 years would increase by 5%, with all other factors being constant. Duration estimates are based on assumptions by Sit and are subject to a number of limitations. Duration is a more accurate estimate of price sensitivity provided interest rate changes are small and occur equally in short-term and long-term securities. Investments in debt securities typically decrease in value when interest rates rise. The risk is usually greater for longer-term debt securities.
The Fund will incur certain expenses in connection with its operations. The Fund will hold cash or cash equivalents such as U.S. Treasuries or other high credit quality, short-term fixed-income or similar securities for direct investment or as collateral for the Treasury Instruments and for other liquidity purposes and to meet redemptions that may be necessary on an ongoing basis. These expenses and income from the cash and cash equivalent holdings may cause imperfect correlation between changes in the Fund’s NAV and changes in the RISE Benchmark Portfolio, because the RISE Benchmark Portfolio does not reflect expenses or income.
Breakwave Dry Bulk Shipping ETF
The Investment Objective of the Fund
BDRY’s investment objective is to provide investors with exposure to the daily change in the price of dry bulk freight futures by tracking the performance of a portfolio (the “BDRY Benchmark Portfolio” and consisting of exchange-cleared futures contracts on the cost of shipping dry bulk freight (“Freight Futures”). BDRY seeks to achieve its investment objective by investing substantially all of its assets in the Freight Futures currently constituting the BDRY Benchmark Portfolio.
The Benchmark Portfolio
The BDRY Benchmark Portfolio is maintained by Breakwave Advisors LLC (“Breakwave”), which also serves as BDRY’s CTA. The BDRY Benchmark Portfolio consists of the Freight Futures, which are a three-month strip of the nearest calendar quarter of futures contracts on specified indexes (each a “Reference Index”) that measure rates for shipping dry bulk freight. Each Reference Index is published each United Kingdom business day by the London-based Baltic Exchange Ltd. (the “Baltic Exchange”) and measures the charter rate for shipping dry bulk freight in a specific size category of cargo ship – Capesize, Panamax or Supramax. The three Reference Indexes are as follows:
| ● | Capesize: the Capesize 5TC Index; |
| ● | Panamax: the Panamax 4TC Index; and |
| ● | Supramax: the Supramax 6TC Index. |
The BDRY Benchmark Component Instruments currently constituting the BDRY Benchmark Portfolio as of December 31, 2019 include:
| Name | Ticker | Market Value USD | ||||
| Baltic Panamax Time Charter Jan 20 | BFFAP F20 Index | $ | 245,520 | |||
| Baltic Panamax Time Charter Feb 20 | BFFAP G20 Index | 257,640 | ||||
| Baltic Panamax Time Charter Mar 20 | BFFAP H20 Index | 300,390 | ||||
| Baltic Capesize Time Charter Jan 20 | BFFATC F20 Index | 452,165 | ||||
| Baltic Capesize Time Charter Feb 20 | BFFATC G20 Index | 400,085 | ||||
| Baltic Capesize Time Charter Mar 20 | BFFATC H20 Index | 404,040 | ||||
| Baltic Supramax T/C Average Shipping Route Jan 20 | BFFAS F20 Index | 37,250 | ||||
| Baltic Supramax T/C Average Shipping Route Feb 20 | BFFAS G20 Index | 38,910 | ||||
| Baltic Supramax T/C Average Shipping Route Mar 20 | BFFAS H20 Index | 44,125 | ||||
The value of the Capesize 5TC Index is disseminated at 11:00 a.m., London Time and the value of the Panamax 4TC Index and the Supramax 6TC Index each is disseminated at 1:00 p.m., London Time. The Reference Index information disseminated by the Baltic Exchange also includes the components and value of each component in each Reference Index. Such Reference Index information also is widely disseminated by Reuters and/or other major market data vendors.
BDRY seeks to achieve its investment objective by investing substantially all of its assets in the Freight Futures currently constituting the BDRY Benchmark Portfolio. The BDRY Benchmark Portfolio will include all existing positions to maturity and settle them in cash. During any given calendar quarter, the BDRY Benchmark Portfolio will progressively increase its position to the next calendar quarter three-month strip, thus maintaining constant exposure to the Freight Futures market as positions mature.
38
The BDRY Benchmark Portfolio will maintain long-only positions in Freight Futures. The BDRY Benchmark Portfolio will include a combination of Capesize, Panamax and Supramax Freight Futures. More specifically, the BDRY Benchmark Portfolio will include 50% exposure in Capesize Freight Futures contracts, 40% exposure in Panamax Freight Futures contracts and 10% exposure in Supramax Freight Futures contracts. The BDRY Benchmark Portfolio will not include and the Fund will not invest in swaps, non-cleared dry bulk freight forwards or other over-the-counter derivative instruments that are not cleared through exchanges or clearing houses. The Fund may hold exchange-traded options on Freight Futures. The BDRY Benchmark Portfolio is maintained by Breakwave and will be rebalanced annually. The Freight Futures currently constituting the Benchmark Portfolio, as well as the daily holdings of the Fund will be available on the Fund’s website at www.drybulketf.com.
When establishing positions in Freight Futures, BDRY will be required to deposit initial margin with a value of approximately 10% to 40% of the notional value of each Freight Futures position at the time it is established. These margin requirements are established and subject to change from time to time by the relevant exchanges, clearing houses or the Fund’s futures commission merchant (“FCM”). On a daily basis, the Fund will be obligated to pay, or entitled to receive, variation margin in an amount equal to the change in the daily settlement level of its Freight Futures positions. Any assets not required to be posted as margin with the FCM will be held at the Fund’s custodian in cash or cash equivalents.
BDRY will hold cash or cash equivalents such as U.S. Treasuries or other high credit quality, short-term fixed-income or similar securities for direct investment or as collateral for the U.S. Treasuries and for other liquidity purposes and to meet redemptions that may be necessary on an ongoing basis. The Fund may also realize interest income from its holdings in U.S. Treasuries or other market rate instruments.
The Sponsor
ETF Managers Capital, LLC is the sponsor of the Trust and the Funds. The Sponsor is a Delaware limited liability company, formed on June 12, 2014. The principal office is located at 30 Maple Street, Suite 2, Summit, NJ 07901. The Sponsor is registered as a commodity pool operator (“CPO”) with the Commodity Futures Trading Commission (“CFTC”) and became a member of the National Futures Association (“NFA”) on September 23, 2014. The Trust and the Funds operate pursuant to the Trust Agreement.
The Sponsor is a wholly-owned subsidiary of Exchange Traded Managers Group LLC (“ETFMG”), a limited liability company domiciled and headquartered in New Jersey. The Sponsor maintains its main business office at 30 Maple Street, Suite 2, Summit, NJ 07901.
Under the Trust Agreement, the Sponsor has exclusive management and control of all aspects of the Trust’s business. The Trustee has no duty or liability to supervise the performance of the Sponsor, nor will the Trustee have any liability for the acts or omissions of the Sponsor. The shareholders have no voice in the day to day management of the business and operations of the Funds and the Trust, other than certain limited voting rights as set forth in the Trust Agreement. In the course of its management of the business and affairs of the Funds and the Trust, the Sponsor may, in its sole and absolute discretion, appoint an affiliate or affiliates of the Sponsor as additional sponsors and retain such persons, including affiliates of the Sponsor, as it deems necessary to effectuate and carry out the purposes, business and objectives of the Trust.
39
Results of Operations
Sit Rising Rate ETF
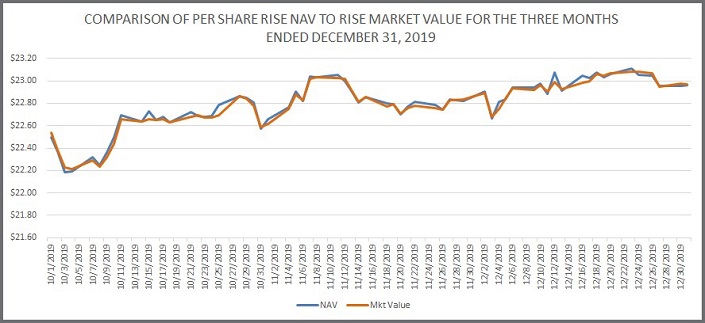
NEITHER THE PAST PERFORMANCE OF THE FUND NOR THE PRIOR INDEX LEVELS AND CHANGES, POSITIVE OR NEGATIVE, SHOULD BE TAKEN AS AN INDICATION OF THE FUND’S FUTURE PERFORMANCE.
The per Share market value of RISE and its NAV tracked closely for the three months ended December 31, 2019.
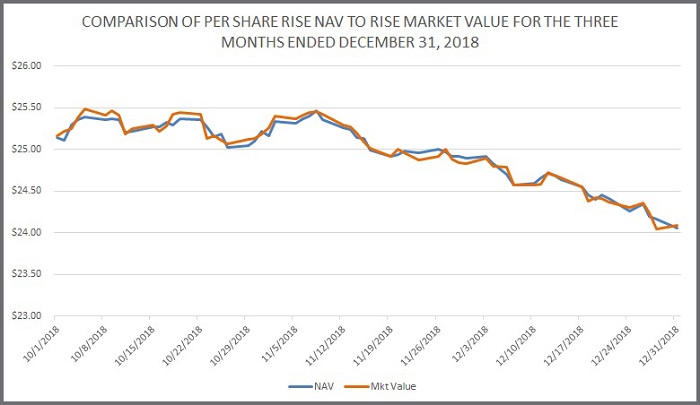
NEITHER THE PAST PERFORMANCE OF THE FUND NOR THE PRIOR INDEX LEVELS AND CHANGES, POSITIVE OR NEGATIVE, SHOULD BE TAKEN AS AN INDICATION OF THE FUND’S FUTURE PERFORMANCE.
The per Share market value of RISE and its NAV tracked closely for the three months ended December 31, 2018.
40
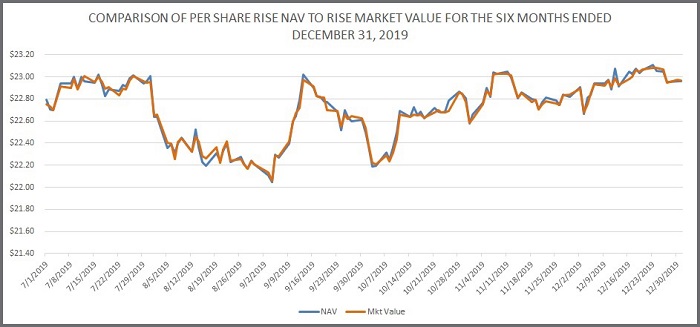
NEITHER THE PAST PERFORMANCE OF THE FUND NOR THE PRIOR INDEX LEVELS AND CHANGES, POSITIVE OR NEGATIVE, SHOULD BE TAKEN AS AN INDICATION OF THE FUND’S FUTURE PERFORMANCE.
The per Share market value of RISE and its NAV tracked closely for the six months ended December 31, 2019.
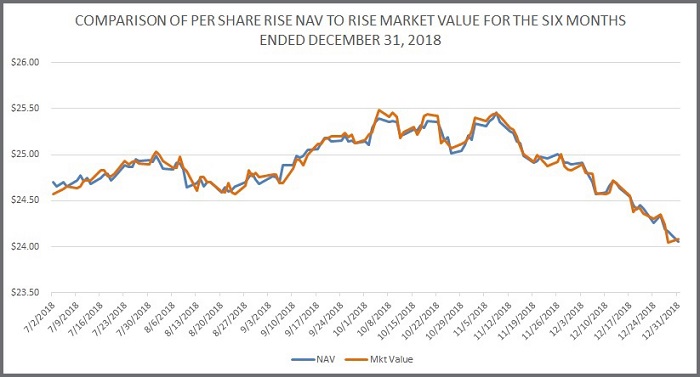
NEITHER THE PAST PERFORMANCE OF THE FUND NOR THE PRIOR INDEX LEVELS AND CHANGES, POSITIVE OR NEGATIVE, SHOULD BE TAKEN AS AN INDICATION OF THE FUND’S FUTURE PERFORMANCE.
The per Share market value of RISE and its NAV tracked closely for the six months ended December 31, 2018.
41
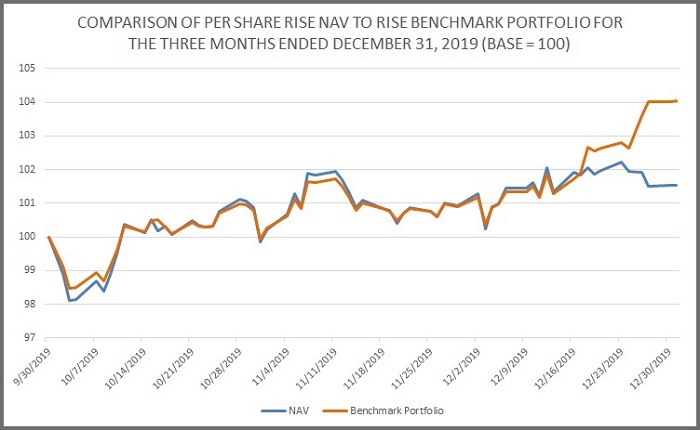
NEITHER THE PAST PERFORMANCE OF THE FUND NOR THE PRIOR INDEX LEVELS AND CHANGES, POSITIVE OR NEGATIVE, SHOULD BE TAKEN AS AN INDICATION OF THE FUND’S FUTURE PERFORMANCE.
The graph above compares the return of RISE with the benchmark portfolio returns for the three months ended December 31, 2019. The difference in the NAV price and the benchmark value often results in the appearance of a NAV premium or discount to the benchmark. The difference is related to the cumulative impact on NAV of the Fund’s income and expenses during the period presented in the chart above.
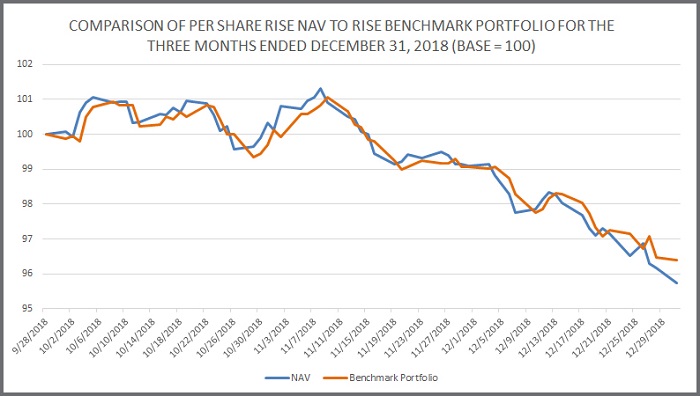
NEITHER THE PAST PERFORMANCE OF THE FUND NOR THE PRIOR INDEX LEVELS AND CHANGES, POSITIVE OR NEGATIVE, SHOULD BE TAKEN AS AN INDICATION OF THE FUND’S FUTURE PERFORMANCE.
The graph above compares the return of RISE with the benchmark portfolio returns for the three months ended December 31, 2018. The difference in the NAV price and the benchmark value often results in the appearance of a NAV premium or discount to the benchmark. The difference is related to the cumulative impact on NAV of the Fund’s income and expenses during the period presented in the chart above.
42
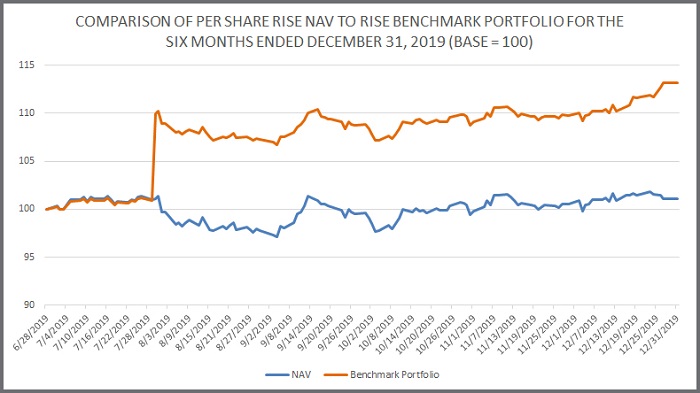
NEITHER THE PAST PERFORMANCE OF THE FUND NOR THE PRIOR INDEX LEVELS AND CHANGES, POSITIVE OR NEGATIVE, SHOULD BE TAKEN AS AN INDICATION OF THE FUND’S FUTURE PERFORMANCE.
The graph above compares the return of RISE with the benchmark portfolio returns for the six months ended December 31, 2019. The difference in the NAV price and the benchmark value often results in the appearance of a NAV premium or discount to the benchmark. The difference is related to the cumulative impact on NAV of the Fund’s income and expenses during the period presented in the chart above.
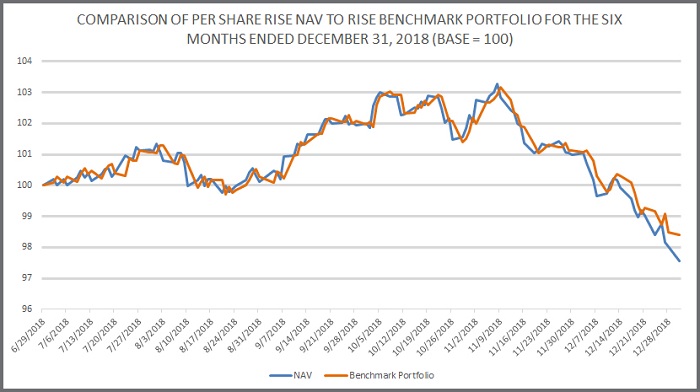
NEITHER THE PAST PERFORMANCE OF THE FUND NOR THE PRIOR INDEX LEVELS AND CHANGES, POSITIVE OR NEGATIVE, SHOULD BE TAKEN AS AN INDICATION OF THE FUND’S FUTURE PERFORMANCE.
The graph above compares the return of RISE with the benchmark portfolio returns for the six months ended December 31, 2018. The difference in the NAV price and the benchmark value often results in the appearance of a NAV premium or discount to the benchmark. The difference is related to the cumulative impact on NAV of the Fund’s income and expenses during the period presented in the chart above.
43
FOR THE THREE MONTHS ENDED DECEMBER 31, 2019
Fund Share Price Performance
During the three months ended December 31, 2019, the NYSE Arca market value of each Share increased (+1.50%) from $22.63 per Share, representing the closing trade on September 30, 2019, to $22.97 per Share, representing the closing price on December 31, 2019. The Share price high and low for the three months ended December 31, 2019 and related change from the closing Share price on September 30, 2019 were as follows: Shares traded from a high of $23.10 per Share (+2.08%) on December 18, 2019 to a low of $22.17 per Share (-2.03%) on October 8, 2019.
Fund Share Net Asset Performance
For the three months ended December 31, 2019, the net asset value of each Share increased (+1.55%) from $22.61 per Share, representing the closing net asset value per Share on September 30, 2019, to $22.96 per Share. The realized and unrealized net gains in the investments, futures and options contracts and net investment income resulted in the overall increase in the NAV per Share during the three months ended December 31, 2019.
Net income for the three months ended December 31, 2019, was $99,440, resulting from net realized losses on investments, futures and options contracts of $306,211, net unrealized gains on investments, futures and options contracts of $391,106 and the net investment income of $14,545.
FOR THE THREE MONTHS ENDED DECEMBER 31, 2018
Fund Share Price Performance
During the three months ended December 31, 2018, the NYSE Arca market value of each Share decreased (-4.10%) from $25.12 per Share, representing the closing trade on September 28, 2018, to $24.09 per Share, representing the closing price on December 31, 2018. The Share price high and low for the three months ended December 31, 2018 and related change from the closing Share price on September 28, 2018 were as follows: Shares traded from a high of $25.50 per Share (+1.51%) on October 5, 2018 to a low of $24.00 per Share (-4.46%) on December 31, 2018.
Fund Share Net Asset Performance
For the three months ended December 31, 2018, the net asset value of each Share decreased (-4.26%) from $25.13 per Share, representing the closing net asset value per Share on September 28, 2018, to $24.06 per Share. Net losses in the investments, futures and options contracts more than offset Fund net investment income which resulted in the overall decrease in the NAV per Share during the three months ended December 31, 2018.
Net loss for the three months ended December 31, 2018, was $2,877,961, resulting from net unrealized losses on investments, futures and options contracts of $3,327,205, net realized gains on investments, futures and options contracts of $266,684 and the net investment income of $182,560.
44
FOR THE SIX MONTHS ENDED DECEMBER 31, 2019
Fund Share Price Performance
During the six months ended December 31, 2019, the NYSE Arca market value of each Share increased (+1.06%) from $22.73 per Share, representing the closing trade on June 28, 2019, to $22.97 per Share, representing the closing price on December 31, 2019. The Share price high and low for the six months ended December 31, 2019 and related change from the closing Share price on June 28, 2019 were as follows: Shares traded from a high of $23.10 per Share (+1.63%) on December 18, 2019 to a low of $22.07 per Share (-2.90%) on September 3, 2019.
Fund Share Net Asset Performance
For the six months ended December 31, 2019, the net asset value of each Share increased (+1.15%) from $22.70 per Share, representing the closing net asset value per Share on June 28, 2019, to $22.96 per Share. The realized and unrealized net gain in the investments, futures and options contracts and net investment income resulted in the overall increase in the NAV per Share during the six months ended December 31, 2019.
Net income for the six months ended December 31, 2019, was $152,003, resulting from net realized losses on investments, futures and options contracts of $252,728, offset by net unrealized gains on investments, futures and options contracts of $368,231 and the net investment income of $36,500.
FOR THE SIX MONTHS ENDED DECEMBER 31, 2018
Fund Share Price Performance
During the six months ended December 31, 2018, the NYSE Arca market value of each Share decreased (-2.31%) from $24.66 per Share, representing the closing trade on June 29, 2018, to $24.09 per Share, representing the closing price on December 31, 2018. The Share price high and low for the six months ended December 31, 2018 and related change from the closing Share price on June 29, 2018 were as follows: Shares traded from a high of $25.50 per Share (+3.41%) on October 5, 2018 to a low of $24.00 per Share (-2.68%) on December 31, 2018.
Fund Share Net Asset Performance
For the six months ended December 31, 2018, the net asset value of each Share decreased (-2.39%) from $24.65 per Share, representing the closing net asset value per Share on June 29, 2018, to $24.06 per Share. Net losses in the investments, futures and options contracts more than offset Fund net investment income which resulted in the overall decrease in the NAV per Share during the six months ended December 31, 2018.
Net loss for the six months ended December 31, 2018, was $1,766,906, resulting from net realized losses on investments, futures and options contracts of $1,611,508, net unrealized losses on investments, futures and options contracts of $456,707 and the net investment income of $301,309.
Breakwave Dry Bulk Shipping ETF
During the three months ended December 31, 2019, freight rates experienced weakness relative to the previous quarter, with the Baltic Dry Index declining approximately 40% during the period. The relatively elevated level of rates during the previous calendar quarter combined with lower demand for iron ore from China, were the main reasons for such performance. Furthermore, with the IMO 2020 fuel regulations starting on January 1, 2020, uncertainty over availability of fuel and pricing weighed on the dry bulk freight market during the period. Partly offsetting those factors was stronger overall coal and grain volumes as a result of seasonality which usually has a positive impact on dry bulk shipping during the last quarter of the year.
During the three months ended December 31, 2019, freight futures declined compared to the previous quarter, following the declining trajectory of spot rates. As a result, BDRY’s performance closely tracked the performance of short-term dry bulk freight futures, with the Fund’s NAV steadily declining during the period. Such decline accelerated toward the end of the quarter, with the holidays negatively impacting liquidity as most market participants were away.
45
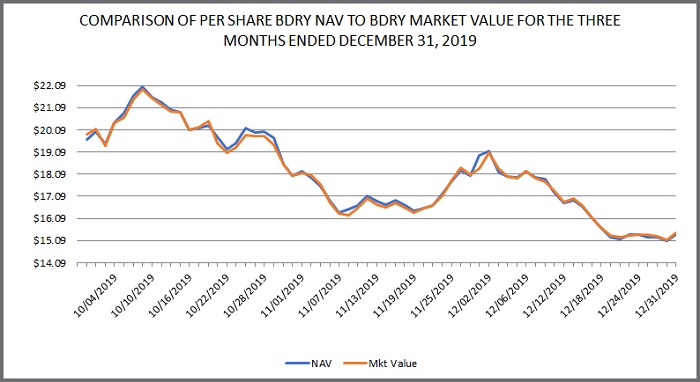
NEITHER THE PAST PERFORMANCE OF THE FUND NOR THE PRIOR BENCHMARK PORTFOLIO LEVELS AND CHANGES, POSITIVE OR NEGATIVE, SHOULD BE TAKEN AS AN INDICATION OF THE FUND’S FUTURE PERFORMANCE.
The per Share market value of BDRY and its NAV tracked closely for the three months ended December 31, 2019.
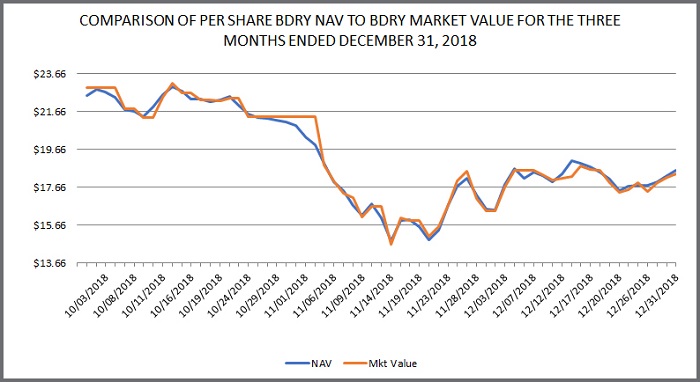
NEITHER THE PAST PERFORMANCE OF THE FUND NOR THE PRIOR BENCHMARK PORTFOLIO LEVELS AND CHANGES, POSITIVE OR NEGATIVE, SHOULD BE TAKEN AS AN INDICATION OF THE FUND’S FUTURE PERFORMANCE.
The per Share market value of BDRY and its NAV tracked closely for the three months ended December 31, 2018.
46
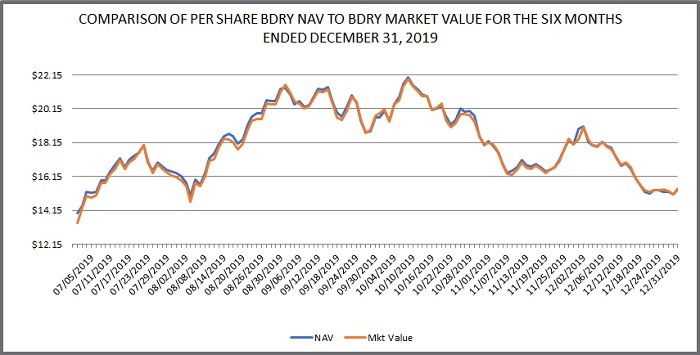
NEITHER THE PAST PERFORMANCE OF THE FUND NOR THE PRIOR BENCHMARK PORTFOLIO LEVELS AND CHANGES, POSITIVE OR NEGATIVE, SHOULD BE TAKEN AS AN INDICATION OF THE FUND’S FUTURE PERFORMANCE.
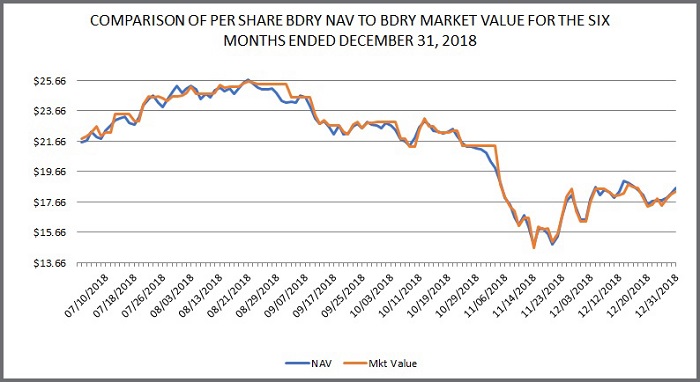
NEITHER THE PAST PERFORMANCE OF THE FUND NOR THE PRIOR BENCHMARK PORTFOLIO LEVELS AND CHANGES, POSITIVE OR NEGATIVE, SHOULD BE TAKEN AS AN INDICATION OF THE FUND’S FUTURE PERFORMANCE.
47
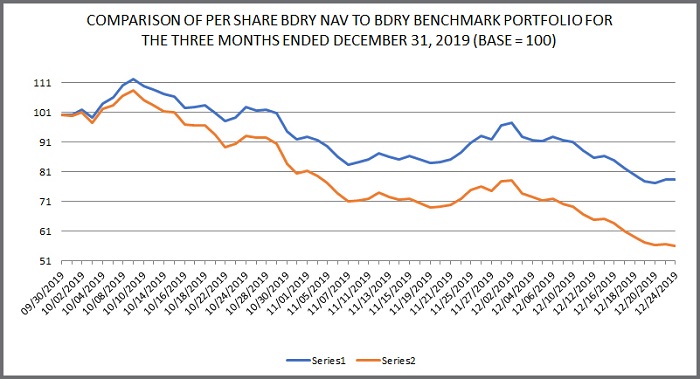
NEITHER THE PAST PERFORMANCE OF THE FUND NOR THE PRIOR BENCHMARK PORTFOLIO LEVELS AND CHANGES, POSITIVE OR NEGATIVE, SHOULD BE TAKEN AS AN INDICATION OF THE FUND’S FUTURE PERFORMANCE.
The per Share market value of BDRY and its NAV tracked closely for the six months ended December 31, 2019.
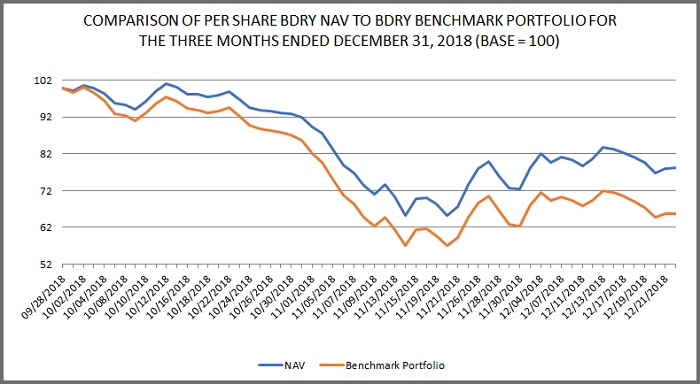
NEITHER THE PAST PERFORMANCE OF THE FUND NOR THE PRIOR BENCHMARK PORTFOLIO LEVELS AND CHANGES, POSITIVE OR NEGATIVE, SHOULD BE TAKEN AS AN INDICATION OF THE FUND’S FUTURE PERFORMANCE.
The per Share market value of BDRY and its NAV tracked closely for the six months ended December 31, 2018.
48
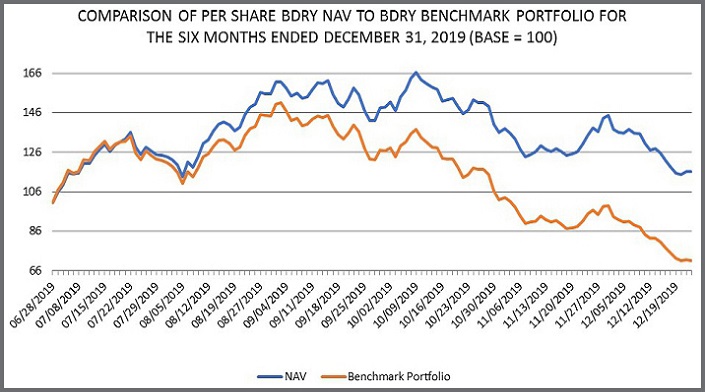
NEITHER THE PAST PERFORMANCE OF THE FUND NOR THE PRIOR BENCHMARK PORTFOLIO LEVELS AND CHANGES, POSITIVE OR NEGATIVE, SHOULD BE TAKEN AS AN INDICATION OF THE FUND’S FUTURE PERFORMANCE.

NEITHER THE PAST PERFORMANCE OF THE FUND NOR THE PRIOR BENCHMARK PORTFOLIO LEVELS AND CHANGES, POSITIVE OR NEGATIVE, SHOULD BE TAKEN AS AN INDICATION OF THE FUND’S FUTURE PERFORMANCE.
49
The graphs above compare the returns of BDRY with the benchmark portfolio returns for the three months ended December 31, 2019 and 2018, and the six months ended December 31, 2019 and 2018. The difference in the NAV price and the benchmark value often results in the appearance of a NAV premium or discount to the benchmark. Differences in the benchmark return and the BDRY net asset value per share are due primarily to the following factors:
| ○ | Benchmark portfolio uses settlement prices of freight futures vs. BDRY closing Share price, |
| ○ | Benchmark portfolio roll methodology assumes rolls that can happen even at fractions of lots vs. BDRY that uses the real minimum market lot available (5 days per months), |
| ○ | Benchmark portfolio assumes rolls are happening at the settlement price of the day vs. that buys at a transaction price during the day that might or might not be equal to the settlement price, |
| ○ | Benchmark portfolio assumes no trading commissions vs. BDRY that pays 10bps for each transaction, |
| ○ | Benchmark portfolio assumes no clearing fees vs. BDRY that pays approximately 3-5bps of total clearing fees for each trade, |
| ○ | Benchmark portfolio assumes no management fees vs. BDRY fee structure of 3.5% of average net assets on an annualized basis, and |
| ○ | Creations and redemptions that lead to transactions that occur at prices that might be different than the settlement prices |
There are no competitors. BDRY is the only Freight futures ETF globally.
50
FOR THE THREE MONTHS ENDED DECEMBER 31, 2019
Fund Share Price Performance
During the three months ended December 31, 2019, the NYSE Arca market value of each Share decreased (-21.61%) from $19.71 per Share, representing the closing trade on September 30, 2019, to $15.45 per Share, representing the closing price on December 31, 2019. The Share price high and low for the three months ended December 31, 2019 and related change from the closing Share price on September 30, 2019 were as follows: Shares traded from a high of $22.19 per Share (+12.58%) on October 9, 2019 to a low of $15.10 per Share (-23.39%) on December 30, 2019.
Fund Share Net Asset Performance
For the three months ended December 31, 2019, the net asset value of each Share decreased (-21.78%) from $19.65 per Share to $15.37 per Share. Losses in the investments and futures contracts and the net investment loss resulted in the overall decrease in the NAV per Share during the three months ended December 31, 2019.
Net loss for the three months ended December 31, 2019, was $378,382, resulting from net realized losses on investments and futures contracts of $243,845, unrealized losses on futures contracts of $117,845 and the net investment loss of $16,692.
FOR THE THREE MONTHS ENDED DECEMBER 31, 2018
Fund Share Price Performance
During the three months ended December 31, 2018, the NYSE Arca market value of each Share decreased (-21.88%) from $22.94 per Share, representing the closing trade on June 29, 2018, to $17.92 per Share, representing the closing price on December 31, 2018. The Share price high and low for the three months ended December 31, 2018 and related change from the closing Share price on June 29, 2018 were as follows: Shares traded from a high of $23.20 per Share (+1.13%) on October 12, 2018 to a low of $14.45 per Share (-37.01%) on November 14, 2018.
Fund Share Net Asset Performance
For the three months ended December 31, 2018, the net asset value of each Share decreased (-18.17%) from $22.68 per Share to $18.56 per Share. Losses in the investments and futures contracts and the net investment loss resulted in the overall decrease in the NAV per Share during the three months ended December 31, 2018.
Net loss for the three months ended December 31, 2018, was $618,436, resulting from net realized losses on investments and futures contracts of $737,508, unrealized gains on futures contracts of $137,005 and the net investment loss of $17,933.
FOR THE SIX MONTHS ENDED DECEMBER 31, 2019
Fund Share Price Performance
During the six months ended December 31, 2019, the NYSE Arca market value of each Share increased (+17.49%) from $13.15 per Share, representing the closing trade on June 30, 2019, to $15.45 per Share, representing the closing price on December 31, 2019. The Share price high and low for the six months ended December 31, 2019 and related change from the closing Share price on September 30, 2019 were as follows: Shares traded from a high of $22.19 per Share (+68.75%) on October 9, 2019 to a low of $13.35 per Share (+1.52%) on July 1, 2019.
Fund Share Net Asset Performance
For the six months ended December 31, 2019, the net asset value of each Share increased (+16.00%) from $13.25 per Share to $15.37 per Share. Gains in the investments and futures contracts more than offset the net investment loss resulting in the overall increase in the NAV per Share during the six months ended December 31, 2019.
Net income for the six months ended December 31, 2019, was $969,166, resulting from net realized gains on investments and futures contracts of $338,181, unrealized gains on futures contracts of $666,605 and the net investment loss of $35,620.
51
FOR THE SIX MONTHS ENDED DECEMBER 31, 2018
Fund Share Price Performance
During the six months ended December 31, 2018, the NYSE Arca market value of each Share decreased (-18.69%) from $22.04 per Share, representing the closing trade on June 29, 2018, to $17.92 per Share, representing the closing price on December 31, 2018. The Share price high and low for the six months ended December 31, 2018 and related change from the closing Share price on June 29, 2018 were as follows: Shares traded from a high of $25.60 per Share (+16.15%) on August 21, 2018 to a low of $14.45 per Share (-34.44%) on November 14, 2018.
Fund Share Net Asset Performance
For the six months ended December 31, 2018, the net asset value of each Share decreased (-15.56%) from $21.98 per Share to $18.56 per Share. Losses in the investments and futures contracts and the net investment loss resulted in the overall decrease in the NAV per Share during the six months ended December 31, 2018.
Net loss for the six months ended December 31, 2019, was $513,032, resulting from net realized gains on investments and futures contracts of $434,239, unrealized losses on futures contracts of $33,580 and the net investment loss of $45,213.
Calculating NAV
The Fund’s NAV is calculated by:
| ● | Taking the current market value of its total assets; |
| ● | Subtracting any liabilities; and |
| ● | Dividing that total by the total number of outstanding shares. |
The Administrator calculates the NAV of the Fund once each NYSE Arca trading day. The NAV for a particular trading day is released after 4:00 p.m. E.T. Trading during the core trading session on the NYSE Arca typically closes at 4:00 p.m. E.T. The Administrator uses CME closing price (determined at the earlier of the close of the CME or 2:30 p.m. E.T.) for the contracts traded on the CME, with respect to RISE, and the Baltic Exchange settlement price for the Freight Futures and option contracts, with respect to BDRY. The Administrator calculates or determines the value of all other Fund investments using market quotations, if available, or other information customarily used to determine the fair value of such investments as of the close of the NYSE Arca (normally 4:00 p.m. E.T.), in accordance with the current Administrative Agency Agreement among U.S. Bancorp Fund Services, the Fund and the Sponsor. For purposes of calculating the NAV of RISE, “other information” customarily used in determining fair value includes information consisting of market data in the relevant market supplied by one or more third parties including, without limitation, relevant rates, prices, yields, yield curves, volatilities, spreads, correlations or other market data in the relevant market; or information of the types described above from internal sources if that information is of the same type used by the Fund in the regular course of its business for the valuation of similar transactions. The information may include costs of funding, to the extent costs of funding are not and would not be a component of the other information being utilized. Third parties supplying quotations or market data may include, without limitation, dealers in the relevant markets, end-users of the relevant product, information vendors, brokers and other sources of market information.
In addition, in order to provide updated information relating to the Fund for use by investors and market professionals, an updated indicative fund value (“IFV”) is made available through on-line information services throughout the core trading session hours of 9:30 a.m. E.T. to 4:00 p.m. E.T. on each trading day. The IFV is calculated by using the prior day’s closing NAV per share of the Fund as a base and updating that value throughout the trading day to reflect changes in the most recently reported trade price for the futures and/or options held by the Fund. For BDRY, certain Freight Futures brokers provide real time pricing information to the general public either through their websites or through data vendors such as Bloomberg or Reuters. The IFV disseminated during NYSE Arca core trading session hours should not be viewed as an actual real time update of the NAV, because the NAV is calculated only once at the end of each trading day based upon the relevant end of day values of the Fund’s investments.
The IFV is disseminated on a per share basis every 15 seconds during regular NYSE Arca core trading session hours. The normal trading hours of the CME are 10:00 a.m. E.T. to 2:30 p.m. E.T. The customary trading hours of the Freight Futures trading are 3:00 a.m. E.T. to 12:00 p.m. E.T. This means that there is a gap in time at the beginning and/or the end of each day during which a Fund’s shares are traded on the NYSE Arca, but real-time trading prices for contracts are not available. During such gaps in time the IFV will be calculated based on the end of day price of such contracts from the CMR’s or Baltic Exchange’s, as applicable, immediately preceding trading session. In addition, other investments and U.S. Treasuries held by the Fund will be valued by the Administrator, using rates and points received from client-approved third party vendors (such as Reuters and WM Company) and advisor or broker-dealer quotes. These investments will not be included in the IFV.
The NYSE Arca disseminates the IFV through the facilities of CTA/CQ High Speed Lines. In addition, the IFV is published on the NYSE Arca’s website and is available through on-line information services such as Bloomberg and Reuters.
52
Dissemination of the IFV provides additional information that is not otherwise available to the public and is useful to investors and market professionals in connection with the trading of a Fund’s shares on the NYSE Arca. Investors and market professionals are able throughout the trading day to compare the market price of a Fund’s shares and the IFV. If the market price of a Fund’s shares diverges significantly from the IFV, market professionals will have an incentive to execute arbitrage trades. For example, if a Fund’s shares appear to be trading at a discount compared to the IFV, a market professional could buy the Fund shares on the NYSE Arca and take the opposite position in Treasury Instruments or Freight Futures, as applicable. Such arbitrage trades can tighten the tracking between the market price of a Fund’s shares and the IFV and thus can be beneficial to all market participants.
Critical Accounting Policies
Each Fund’s critical accounting policies are as follows:
Preparation of the financial statements and related disclosures in accordance with U.S. generally accepted accounting principles requires the application of appropriate accounting rules and guidance, as well as the use of estimates. The Funds’ application of these policies involves judgments and the use of estimates. Actual results may differ from the estimates used and such differences could be material. Each Fund holds a significant portion of its assets in futures contracts and money market funds, which are held at fair value.
Each Fund calculates its net asset value as of the NAV Calculation Time as described above.
The values which are used by the Funds for their Treasury Instruments and Freight Futures, as applicable, are provided by the applicable Fund’s commodity broker, which uses market prices when available. In addition, the Funds estimate interest income on a daily basis using prevailing rates earned on their cash and cash equivalents. These estimates are adjusted to the actual amount received on a monthly basis and the difference, if any, is not considered material.
Credit Risk
When a Fund enters into Benchmark Component Instruments, it will be exposed to the credit risk that the counterparty will not be able to meet its obligations. For purposes of credit risk, the counterparty for the Benchmark Component Instruments traded on or cleared by the CME and other futures exchanges is the clearinghouse associated with those exchanges. In general, clearinghouses are backed by their members who may be required to share in the financial burden resulting from the nonperformance of one of their members, which should significantly reduce credit risk. There can be no assurance that any counterparty, clearinghouse, or their financial backers will satisfy their obligations to the Funds.
The Sponsor will attempt to minimize certain of these market and credit risks by normally:
| ● | executing and clearing trades with creditworthy counterparties, as determined by the Sponsor; |
| ● | limiting the outstanding amounts due from counterparties of the Funds; |
| ● | not posting margin directly with a counterparty; |
| ● | limiting the amount of margin or premium posted at the FCM; and |
| ● | ensuring that deliverable contracts are not held to such a date when delivery of an underlying asset could be called for. |
The Commodity Exchange Act (“CEA”) requires all FCMs, such as the Fund’s clearing brokers, to meet and maintain specified fitness and financial requirements, to segregate customer funds from proprietary funds and account separately for all customers’ funds and positions, and to maintain specified books and records open to inspection by the staff of the CFTC. The CFTC has similar authority over introducing brokers, or persons who solicit or accept orders for commodity interest trades but who do not accept margin deposits for the execution of trades. The CEA authorizes the CFTC to regulate trading by FCMs and by their officers and directors, permits the CFTC to require action by exchanges in the event of market emergencies, and establishes an administrative procedure under which customers may institute complaints for damages arising from alleged violations of the CEA. The CEA also gives the states powers to enforce its provisions and the regulations of the CFTC.
53
On November 14, 2013, the CFTC published final regulations that require enhanced customer protections, risk management programs, internal monitoring and controls, capital and liquidity standards, customer disclosures and auditing and examination programs for FCMs. The rules are intended to afford greater assurances to market participants that customer segregated funds and secured amounts are protected, customers are provided with appropriate notice of the risks of futures trading and of the FCMs with which they may choose to do business, FCMs are monitoring and managing risks in a robust manner, the capital and liquidity of FCMs are strengthened to safeguard the continued operations and the auditing and examination programs of the CFTC and the self-regulatory organizations are monitoring the activities of FCMs in a thorough manner.
Liquidity and Capital Resources
The Funds do not anticipate making use of borrowings or other lines of credit to meet their obligations. The Funds meets their liquidity needs in the normal course of business from the proceeds of the sale of their investments or from the cash, cash equivalents and/or the collateralizing Treasury Securities that they hold. The Funds’ liquidity needs include: redeeming their shares, providing margin deposits for existing Benchmark Component Instruments, the purchase of additional Benchmark Component Instruments, and paying expenses.
The Funds generate cash primarily from (i) the sale of Creation Baskets and (ii) interest earned on cash, cash equivalents and their investments in collateralizing Treasury Securities. Generally, all of the net assets of the Funds are allocated to trading in Benchmark Component Instruments. Most of the assets of the Funds are held in Treasury Instruments, cash and/or cash equivalents that could or are used as margin or collateral for trading in Benchmark Component Instruments. The percentage that such assets bear to the total net assets will vary from period to period as the market values of the Benchmark Component Instruments change. Interests earned on interest-bearing assets of the Funds are paid to the Funds.
The investments of the Funds in Benchmark Component Instruments could be subject to periods of illiquidity because of market conditions, regulatory considerations and other reasons. Such conditions could prevent the Funds from promptly liquidating a position in Benchmark Component Instruments.
Market Risk
Trading in Benchmark Component Instruments such as futures contracts will involve the Funds entering into contractual commitments to purchase or sell specific amounts of instruments at a specified date in the future. The gross or face amount of the contracts is expected to significantly exceed the future cash requirements of the Funds as the Funds intend to close out any open positions prior to the contractual expiration date. As a result, the Funds’ market risk is the risk of loss arising from the decline in value of the contracts, not from the need to make delivery under the contracts. The Funds consider the “fair value” of derivative instruments to be the unrealized gain or loss on the contracts. The market risk associated with the commitment by the Funds to purchase a specific contract will be limited to the aggregate face amount of the contracts held.
The exposure of the Funds to market risk will depend on a number of factors including the markets for the specific instrument, the volatility of interest rates and foreign exchange rates, the liquidity of the instrument-specific market and the relationships among the contracts held by the Funds.
Regulatory Environment
The regulation of futures markets, futures contracts, and futures exchanges has historically been comprehensive. The CFTC and the exchanges are authorized to take extraordinary actions in the event of a market emergency including, for example, the retroactive implementation of speculative position limits, increased margin requirements, the establishment of daily price limits and the suspension of trading.
The regulation of commodity interest transactions in the United States is an evolving area of law and is subject to ongoing modification by governmental and judicial action. Considerable regulatory attention has been focused on non-traditional investment pools that are publicly distributed in the United States. There is a possibility of future regulatory changes within the United States altering, perhaps to a material extent, the nature of an investment in the Funds, or the ability of the Funds to continue to implement its investment strategy. The effect of any future regulatory change on the Funds is impossible to predict but could be substantial and adverse.
54
The CFTC possesses exclusive jurisdiction to regulate the activities of commodity pool operators and commodity trading advisors with respect “commodity interests,” such as futures, swaps and options, and has adopted regulations with respect to the activities of those persons and/or entities. Under the CEA, a registered CPO, such as the Sponsor, is required to make annual filings with the CFTC and NFA describing its organization, capital structure, management and controlling persons. In addition, the CEA authorizes the CFTC to require and review books and records of, and documents prepared by, registered CPOs. Pursuant to this authority, the CFTC requires CPOs to keep accurate, current and orderly records for each pool that they operate. The CFTC may suspend the registration of a commodity pool operator (1) if the CFTC finds that the operator’s trading practices tend to disrupt orderly market conditions, (2) if any controlling person of the operator is subject to an order of the CFTC denying such person trading privileges on any exchange, and (3) in certain other circumstances. Suspension, restriction or termination of the Sponsor’s registration as a commodity pool operator would prevent it, until that registration were to be reinstated, from managing the Funds, and might result in the termination of the Funds if a successor sponsor is not elected pursuant to the Trust Agreement.
The Funds’ investors are afforded prescribed rights for reparations under the CEA. Investors may also be able to maintain a private right of action for violations of the CEA. The CFTC has adopted rules implementing the reparation provisions of the CEA, which provide that any person may file a complaint for a reparations award with the CFTC for violation of the CEA against a floor broker or an FCM, introducing broker, commodity trading advisor, CPO, and their respective associated persons.
Pursuant to authority in the CEA, the NFA has been formed and registered with the CFTC as a registered futures association. At the present time, the NFA is the only self-regulatory organization for commodity interest professionals, other than futures exchanges. The CFTC has delegated to the NFA responsibility for the registration of CPOs and FCMs and their respective associated persons. The Sponsor and the Funds’ clearing broker are members of the NFA. As such, they will be subject to NFA standards relating to fair trade practices, financial condition and consumer protection. The NFA also arbitrates disputes between members and their customers and conducts registration and fitness screening of applicants for membership and audits of its existing members. Neither the Trust nor the Funds are required to become a member of the NFA.
The regulations of the CFTC and the NFA prohibit any representation by a person registered with the CFTC or by any member of the NFA, that registration with the CFTC, or membership in the NFA, in any respect indicates that the CFTC or the NFA has approved or endorsed that person or that person’s trading program or objectives. The registrations and memberships of the parties described in this summary must not be considered as constituting any such approval or endorsement. Likewise, no futures exchange has given or will give any similar approval or endorsement.
Futures exchanges in the United States are subject to varying degrees of regulation under the CEA depending on whether such exchange is a designated contract market, exempt board of trade or electronic trading facility. Clearing organizations are also subject to the CEA and the rules and regulations adopted thereunder as administered by the CFTC. The CFTC’s function is to implement the CEA’s objectives of preventing price manipulation and excessive speculation and promoting orderly and efficient commodity interest markets. In addition, the various exchanges and clearing organizations themselves exercise regulatory and supervisory authority over their member firms.
The Dodd-Frank Wall Street Reform and Consumer Protection Act (the “Dodd-Frank Act”) was enacted in response to the economic crisis of 2008 and 2009 and it significantly altered the regulatory regime to which the securities and commodities markets are subject. To date, the CFTC has issued proposed or final versions of almost all of the rules it is required to promulgate under the Dodd-Frank Act. The provisions of the new law include the requirement that position limits be established on a wide range of commodity interests, including agricultural, energy, and metal-based commodity futures contracts, options on such futures contracts and cleared and uncleared swaps that are economically equivalent to such futures contracts and options; new registration and recordkeeping requirements for swap market participants; capital and margin requirements for “swap dealers” and “major swap participants,” as determined by the new law and applicable regulations; reporting of all swaps transactions to swap data repositories; and the mandatory use of clearinghouse mechanisms for sufficiently standardized swap transactions that were historically entered into in the over-the-counter market, but are now designated as subject to the clearing requirement; and margin requirements for over-the counter swaps that are not subject to the clearing requirements.
55
The Dodd-Frank Act was intended to reduce systemic risks that may have contributed to the 2008/2009 financial crisis. Since the first draft of what became the Dodd-Frank Act, opponents have criticized the broad scope of the legislation and, in particular, the regulations implemented by federal agencies as a result. Since 2010, and most notably in 2015 and 2016, Republicans have proposed comprehensive legislation both in the House and the Senate of the US Congress. These bills are intended to pare back some of the provisions of the Dodd-Frank Act of 2010 that critics view as overly broad, unnecessary to the stability of the U.S. financial system, and inhibiting the growth of the U.S. economy. Further, the administration has promised and issued several executive orders intended to relieve the financial burden created by the Dodd-Frank Act, although these executive orders only set forth several general principles to be followed by the federal agencies and do not mandate the wholesale repeal of the Dodd-Frank Act. The scope of the effect that passage of new financial reform legislation could have on U.S. securities, derivatives and commodities markets is not clear at this time because each federal regulatory agency would have to promulgate new regulations to implement such legislation. Nevertheless, regulatory reform may have a significant impact on U.S. regulated entities.
Current rules and regulations under the Dodd-Frank Act require enhanced customer protections, risk management programs, internal monitoring and controls, capital and liquidity standards, customer disclosures and auditing and examination programs for FCMs. The rules are intended to afford greater assurances to market participants that customer segregated funds and secured amounts are protected, customers are provided with appropriate notice of the risks of futures trading and of the FCMs with which they may choose to do business, FCMs are monitoring and managing risks in a robust manner, the capital and liquidity of FCMs are strengthened to safeguard the continued operations and the auditing and examination programs of the CFTC and the self-regulatory organizations are monitoring the activities of FCMs in a thorough manner.
Regulatory bodies outside the U.S. have also passed or proposed, or may propose in the future, legislation similar to that proposed by the Dodd-Frank Act or other legislation containing other restrictions that could adversely impact the liquidity of and increase costs of participating in the commodities markets. For example, the European Union (“EU”) Markets in Financial Instruments Directive (Directive 2014/65/EU) and Markets in Financial Instruments Regulation (Regulation (EU) No 600/2014) (together “MiFID II”), which has applied since January 3, 2018, governs the provision of investment services and activities in relation to, as well as the organized trading of, financial instruments such as shares, bonds, units in collective investment schemes and derivatives. In particular, MiFID II requires EU Member States to apply position limits to the size of a net position which a person can hold at any time in commodity derivatives traded on trading EU trading venues and in “economically equivalent” over-the-counter (“OTC”) contracts. By way of further example, the European Market Infrastructure Regulation (Regulation (EU) No 648/2012) (“EMIR”) introduced certain requirements in respect of OTC derivatives including: (i) the mandatory clearing of OTC derivative contracts declared subject to the clearing obligation; (ii) risk mitigation techniques in respect of un-cleared OTC derivative contracts, including the mandatory margining of un-cleared OTC derivative contracts; and (iii) reporting and recordkeeping requirements in respect of all derivatives contracts. In the event that the requirements under EMIR and MiFID II apply, these are expected to increase the cost of transacting derivatives.
In addition, considerable regulatory attention has been focused on non-traditional publicly distributed investment pools such as the Funds. Furthermore, various national governments have expressed concern regarding the disruptive effects of speculative trading in certain commodity markets and the need to regulate the derivatives markets in general. The effect of any future regulatory change on the Funds is impossible to predict, but could be substantial and adverse.
Management believes that as of December 31, 2019, it had fulfilled in a timely manner all Dodd-Frank or other regulatory requirements to which it is subject.
56
Off Balance Sheet Financing
As of December 31, 2019, neither the Trust nor the Funds have any loan guarantees, credit support or other off-balance sheet arrangements of any kind other than agreements entered into in the normal course of business, which may include indemnification provisions relating to certain risks service providers undertake in performing services which are in the best interests of the Funds. While the exposure of the Funds under these indemnification provisions cannot be estimated, they are not expected to have a material impact on the financial position of the Funds.
Redemption Basket Obligation
Other than as necessary to meet the investment objective of the Fund and pay the contractual obligations described below, the Fund will require liquidity to redeem Redemption Baskets. The Fund intends to satisfy this obligation through the transfer of cash of the Fund (generated, if necessary, through the sale of Treasury Instruments) in an amount proportionate to the number of Shares being redeemed.
Contractual Obligations
The primary contractual obligations of each Fund will be with the Sponsor and certain other service providers.
Management and CTA Fees
RISE and BDRY each pay the Sponsor a management fee (the “Sponsor Fee”) in consideration of the Sponsor’s advisory services to the Funds. Additionally, RISE and BDRY each pays its respective commodity trading advisor a license and service fee (the “CTA Fee”).
RISE pays the Sponsor Fee monthly in arrears, in an amount equal to the greater of 0.15% per annum of the value of RISE’s average daily net assets or $75,000 effective January 1, 2018. The Sponsor Fee is paid in consideration of the Sponsor’s management services to RISE. RISE also pays Sit a CTA Fee monthly in arrears, for the use of the RISE Benchmark Portfolio in an amount equal to 0.20% effective January 1, 2018 (0.50% prior to January 1, 2018) per annum of RISE’s average daily net assets.
The Sponsor has contractually agreed to waive RISE’s Sponsor Fee and/or assume RISE’s remaining expenses so that RISE’s expenses do not exceed an annual rate of 1.00%, excluding brokerage commissions, interest expense, and extraordinary expenses, of the value of RISE’s average daily net assets (the “RISE Expense Cap”). The assumption of expenses and waiver of RISE’s Sponsor fee are contractual on the part of the Sponsor, through January 31, 2021. If after that date, the Sponsor no longer assumed expenses or waived RISE’s Sponsor Fee, RISE could be adversely impacted, including in its ability to achieve its investment objective.
57
RISE currently accrues its daily expenses up to the RISE Expense Cap. At the end of each month, the accrued amount is remitted to the Sponsor as the Sponsor is responsible for the payment of the routine operational, administrative and other ordinary expenses of RISE. RISE’s total expenses amounted to $116,924 and $206,506, for the three months ended December 31, 2019 and 2018, respectively, and $236,108 and $400,559 for the six months ended December 31, 2019 and 2018, respectively, of which $100,323 and $17,920 for the three months ended December 31, 2019 and 2018, respectively, and $197,476 and $47,986 for the six months ended December 31, 2019 and 2018, respectively, was absorbed by the Sponsor pursuant to the RISE Expense Cap.
BDRY pays the Sponsor Fee, monthly in arrears, in an amount equal to the greater of 0.15% per year of BDRY’s average daily net assets; or $125,000. BDRY’s Sponsor Fee is paid in consideration of the Sponsor’s management services to BDRY. BDRY also pays Breakwave the CTA Fee monthly in arrears, for the use of BDRY’s Benchmark Portfolio in an amount equal to 1.45% per annum of BDRY’s average daily net assets.
Breakwave has agreed to waive its CTA Fee and the Sponsor has agreed to correspondingly assume the remaining expenses of BDRY so that BDRY’s expenses do not exceed an annual rate of 3.50%, excluding brokerage commissions, interest expense, and extraordinary expenses, of the value of BDRY’s average daily net assets (the “BDRY Expense Cap”). The assumption of expenses and waiver of BDRY’s CTA Fee are contractual on the part of the Sponsor and Breakwave, respectively, through September 30, 2020. If after that date, the Sponsor and/or Breakwave no longer assumed expenses or waived the CTA Fee, respectively, BDRY could be adversely impacted, including in its ability to achieve its investment objective.
The assumption of expenses by the Sponsor for BDRY, pursuant to the BDRY Expense Cap, amounted to $112,262 and $131,193 for the three months ended December 31, 2019 and 2018, respectively, and $217,318 and $256,383, for the six months ended December 31, 2019 and 2018, respectively as disclosed in the Combined Statements of Operations. The waiver of Breakwave’s CTA fees, pursuant to the undertaking, amounted to $6,561 and $10,462 for the three months ended December 31, 2019 and 2018, respectively, and $16,213 and $23,499 for the six months ended December 31, 2019 and 2018, respectively, as disclosed in the Combined Statements of Operations. BDRY currently accrues its daily expenses up to the BDRY Expense Cap. At the end of each month, the accrued amount is remitted to the Sponsor as the Sponsor is responsible for the payment of the routine operational, administrative and other ordinary expenses of the Fund. BDRY’s total expenses amounted to $141,861 and $173,067 for the three months ended December 31, 2019 and 2018, respectively, and $288,164 and $351,703 for the six months ended December 31, 2019 and 2018, respectively.
58
Each Fund’s ongoing fees, costs and expenses of its operation, not subject to the applicable Expense Cap include brokerage and other fees and commissions incurred in connection with the trading activities of the Fund, and extraordinary expenses (including, but not limited to, legal claims and liabilities and litigation costs and any indemnification related thereto). Expenses subject to an Expense Cap include (i) expenses incurred in connection with registering additional Shares of a Fund or offering Shares of a Fund; (ii) the routine expenses associated with the preparation and, if required, the printing and mailing of monthly, quarterly, annual and other reports required by applicable U.S. federal and state regulatory authorities, Trust meetings and preparing, printing and mailing proxy statements to Shareholders; (iii) the routine services of the Trustee, legal counsel and independent accountants; (iv) routine accounting, bookkeeping, custodial and transfer agency services, whether performed by an outside service provider or by affiliates of the Sponsor; (v) postage and insurance; (vi) costs and expenses associated with client relations and services; (vii) costs of preparation of all federal, state, local and foreign tax returns and any taxes payable on the income, assets or operations of a Fund.
While the Sponsor has agreed to pay registration fees to the SEC and any other regulatory agency in connection with the offer and sale of the Shares offered through each Fund’s prospectus, the legal, printing, accounting and other expenses associated with such registration, and the initial fee of $7,500 for listing the Shares on the NYSE Arca, each Fund will be responsible for any registration fees and related expenses incurred in connection with any future offer and sale of Shares of the Fund in excess of those offered through its prospectus.
Any general expenses of the Trust will be allocated among the Funds and any other series of the Trust as determined by the Sponsor in its sole and absolute discretion. The Trust is also responsible for extraordinary expenses, including, but not limited to, legal claims and liabilities and litigation costs and any indemnification related thereto. The Trust and/or the Sponsor may be required to indemnify the Trustee, Distributor or Administrator under certain circumstances.
The parties cannot anticipate the amount of payments that will be required under these arrangements for future periods as the NAV and trading levels to meet investment objectives for the Funds will not be known until a future date. These agreements are effective for a specific term agreed upon by the parties with an option to renew, or, in some cases, are in effect for the duration of a Fund’s existence. The parties may terminate these agreements earlier for certain reasons listed in the agreements.
59
Item 3. Quantitative and Qualitative Disclosures About Market Risk
Not applicable to Smaller Reporting Companies.
Item 4. Controls and Procedures
Disclosure Controls and Procedures
The Trust and the Funds maintain disclosure controls and procedures that are designed to ensure that material information required to be disclosed in the Trust’s periodic reports filed or submitted under the Securities Exchange Act of 1934, as amended, is recorded, processed, summarized and reported within the time period specified in the SEC’s rules and forms.
The duly appointed officers of the Sponsor, including its principal executive officer and principal financial officer, have evaluated the effectiveness of the Trust’s and the Funds’ disclosure controls and procedures and have concluded that the disclosure controls and procedures of the Trust and the Funds have been effective as of the end of the period covered by this quarterly report on Form 10-Q.
Change in Internal Control Over Financial Reporting
There were no changes in the Trust’s or either Fund’s internal control over financial reporting during the last fiscal quarter that have materially affected, or are reasonably likely to materially affect, the Trust’s or the Funds’ internal control over financial reporting.
60
Although the Funds may, from time to time, be involved in litigation arising out of its operations in the normal course of business or otherwise, the Funds are currently not a party to any pending material legal proceedings.
Samuel Masucci III and Bernard Karol, principals of the Sponsor, are defendants, along with certain affiliates of the Sponsor, in an action filed May 2, 2017 in the Superior Court of New Jersey captioned PureShares, LLC d/b/a PureFunds et al. v. ETF Managers Group, LLC et al., Docket No. C-63-17 (the “PureShares Action”). The PureShares Action alleges claims based on disputes arising out of contractual relationships with ETF Managers Group LLC, an affiliate of the Sponsor. The action seeks damages in unspecified amounts and injunctive relief based on breach of contract, wrongful termination, and several other theories.
Samuel Masucci III, a principal of the Sponsor, was a defendant, along with certain affiliates of the Sponsor, in a case filed on October 26, 2017 in the United States District Court for the Southern District of New York by NASDAQ, Inc. captioned Nasdaq, Inc. v. Exchange Traded Managers Group, LLC et al., Case 1:17-cv-08252 (the “Nasdaq Action”). This action arose out of the same facts and circumstances as the PureShares Action and asserts claims for breach of contract, conversion and certain other claims with respect to the same exchange traded funds as in the PureShares Action. Mr. Masucci was dismissed as a defendant pursuant to a motion to dismiss in August 2018. The matter was the subject of a bench trial in May 2019, and on December 20, 2019, the Court issued an Opinion and Order awarding compensatory damages to Plaintiff in the amount of $78,403,172.36, plus prejudgment interest. The Court also denied Plaintiff’s requests for punitive damages and equitable relief. The Adviser filed a notice of appeal from the judgment on January 19, 2020. The Sponsor believes that this judgment will not affect its ability to continue to act as CPO and Sponsor for the Funds.
Not applicable to Smaller Reporting Companies.
Item 2. Unregistered Sales of Equity Securities and Use of Proceeds
| (a) | On January 4, 2018, the Sponsor made a $1,000 capital contribution to the Breakwave Dry Bulk Shipping ETF in exchange for forty shares of such Fund prior to the Fund’s commencement of operations; such shares were sold in a private offering exempt from registration under Section 4(a)(2) of the Securities Act of 1933, as amended. |
| (b) | The original registration statement on Form S-1 registering 20,000,000 common units, or “Shares,” of the Sit Rising Rate ETF (File No. 333-199190) was declared effective on January 29, 2015. A second registration statement on Form S-1 (File No. 333-222379) which replaced the original registration statement was declared effective on January 19, 2018. On December 31, 2019, 250,040 shares of the Fund were outstanding for a market capitalization of $5,740,486. The offering proceeds were invested in futures contracts, options on futures contracts or cash and cash equivalents in accordance with the Fund’s investment objective stated in the prospectus. |
The original registration statement on Form S-1 registering 10,000,000 common units, or “Shares,” of the Breakwave Dry Bulk Shipping ETF (File No. 333-218453) was declared effective on March 9, 2018. On December 31, 2019, 150,040 shares of the Fund were outstanding for a market capitalization of $2,318,118. The offering proceeds were invested in futures contracts, options on futures contracts or cash and cash equivalents in accordance with the Fund’s investment objective stated in the prospectus.
| (c) | RISE does not purchase shares directly from its shareholders. In connection with redemptions of baskets held by an Authorized Participant, RISE redeemed one (1) basket (comprising 25,000 shares) during the three months ended December 31, 2019 at an average price per share of $23.11. The following table provides information about RISES’s redemptions by Authorized Participants during the three months ended December 31, 2019: |
| Calendar Month | Number of Shares Redeemed | Average Price Paid per Share | ||||||
| October 2019 | - | - | ||||||
| November 2019 | - | - | ||||||
| December 2019 | 25,000 | $ | 23.11 | |||||
| Total | 25,000 | $ | 23.11 | |||||
BDRY does not purchase shares directly from its shareholders. In connection with redemptions of baskets held by an Authorized Participant, BDRY redeemed one (1) basket (comprising 25,000 shares) during the three months ended December 31, 2019 at an average price per share of $17.26. The following table provides information about BDRY’s redemptions by Authorized Participants during the three months ended December 31, 2019:
| Calendar Month | Number of Shares Redeemed | Average Price Paid per Share | ||||||
| October 2019 | - | - | ||||||
| November 2019 | - | - | ||||||
| December 2019 | 25,000 | $ | 17.26 | |||||
| Total | 25,000 | $ | 17.26 | |||||
61
Item 3. Defaults Upon Senior Securities
None.
Item 4. Mine Safety Disclosures
Not Applicable.
| (a) | None. |
| (b) | Not Applicable. |
The following exhibits are filed as part of this report as required under Item 601 of Regulation S-K:
| 31.1 | Certification by the Principal Executive Officer of the Registrant pursuant to Rules 13a-14 and 15d-14 of the Exchange Act. (1) | |
| 31.2 | Certification by the Principal Financial Officer of the Registrant pursuant to Rules 13a-14 and 15d-14 of the Exchange Act. (1) | |
| 32.1 | Certification by the Principal Executive Officer of the Registrant pursuant to 18 U.S.C. Section 1350, as adopted pursuant to Section 906 of the Sarbanes-Oxley Act of 2002. (1) | |
| 32.2 | Certification by the Principal Financial Officer of the Registrant pursuant to 18 U.S.C. Section 1350, as adopted pursuant to Section 906 of the Sarbanes-Oxley Act of 2002. (1) | |
| 101.INS | XBRL Instance Document | |
| 101.SCH | XBRL Taxonomy Extension Schema | |
| 101.CAL | XBRL Taxonomy Extension Calculation Linkbase | |
| 101.DEF | XBRL Taxonomy Definition Linkbase | |
| 101.LAB | XBRL Taxonomy Extension Label Linkbase | |
| 101.PRE | XBRL Taxonomy Extension Presentation Linkbase |
| (1) | Filed Herewith. |
62
Pursuant to the requirements of the Securities Exchange Act of 1934, the Registrant has duly caused this report to be signed on its behalf by the undersigned, thereunto duly authorized.
ETF Managers Group Commodity Trust I (Registrant)
| By: | ETF Managers Capital, LLC | |
| its Sponsor | ||
| By: | /s/ Samuel Masucci III | |
| Name: Samuel Masucci III | ||
| Title: Principal Executive Officer | ||
| By: | /s/ John A. Flanagan | |
| Name: John A. Flanagan | ||
| Title: Principal Financial Officer |
Date: February 14, 2020
63