Attached files
| file | filename |
|---|---|
| EX-23.1 - EX-23.1 - Cole Haan, Inc. | d811846dex231.htm |
| EX-21.1 - EX-21.1 - Cole Haan, Inc. | d811846dex211.htm |
Table of Contents
As filed with the Securities and Exchange Commission on February 14, 2020
Registration No. 333-
UNITED STATES
SECURITIES AND EXCHANGE COMMISSION
Washington, D.C. 20549
FORM S-1
REGISTRATION STATEMENT
UNDER
THE SECURITIES ACT OF 1933
Cole Haan, Inc.
(Exact name of registrant as specified in its charter)
| Delaware | 3021 | 46-1371438 | ||
| (State or other jurisdiction of incorporation or organization) |
(Primary Standard Industrial Classification Code Number) |
(I.R.S. Employer Identification No.) |
150 Ocean Road
Greenland, New Hampshire 03840
(603) 430-7800
(Address, including zip code, and telephone number, including area code, of registrant’s principal executive offices)
Laura W. Kelley
Senior Vice President, Legal, Human Resources & General Counsel
Cole Haan, Inc.
150 Ocean Road
Greenland, New Hampshire 03840
(603) 430-7800
(Name, address, including zip code, and telephone number, including area code, of registrant’s agent for service)
With copies to:
| Kenneth B. Wallach, Esq. Sunny Cheong, Esq. Simpson Thacher & Bartlett LLP 425 Lexington Avenue New York, New York 10017 (212) 455-2000 |
Jason M. Licht, Esq. Stelios G. Saffos, Esq. Latham & Watkins LLP 555 Eleventh Street, NW Washington, D.C. 20004 (202) 637-2200 |
Approximate date of commencement of proposed sale to the public: As soon as practicable after this Registration Statement is declared effective.
If any of the securities being registered on this Form are to be offered on a delayed or continuous basis pursuant to Rule 415 under the Securities Act of 1933, check the following box: ☐
If this Form is filed to register additional securities for an offering pursuant to Rule 462(b) under the Securities Act, please check the following box and list the Securities Act registration statement number of the earlier effective registration statement for the same offering. ☐
If this Form is a post-effective amendment filed pursuant to Rule 462(c) under the Securities Act, check the following box and list the Securities Act registration statement number of the earlier effective registration statement for the same offering. ☐
If this Form is a post-effective amendment filed pursuant to Rule 462(d) under the Securities Act, check the following box and list the Securities Act registration statement number of the earlier effective registration statement for the same offering. ☐
Indicate by check mark whether the registrant is a large accelerated filer, an accelerated filer, a non-accelerated filer, a smaller reporting company or an emerging growth company. See the definitions of “large accelerated filer,” “accelerated filer” “smaller reporting company” and “emerging growth company” in Rule 12b-2 of the Exchange Act:
| Large accelerated filer | ☐ | Accelerated filer | ☐ | |||
| Non-accelerated filer | ☒ | Smaller reporting company | ☐ | |||
| Emerging growth company | ☒ |
If an emerging growth company, indicate by check mark if the registrant has elected not to use the extended transition period for complying with any new or revised financial accounting standards provided pursuant to Section 7(a)(2)(B) of the Securities Act. ☒
CALCULATION OF REGISTRATION FEE
|
| ||||
| Title of Each Class of Securities to be Registered |
Proposed Maximum Aggregate |
Amount of Registration Fee | ||
| Common Stock, $0.01 par value per share |
$100,000,000 | $12,980 | ||
|
| ||||
|
| ||||
| (1) | Includes shares of common stock that the underwriters have the option to purchase. See “Underwriting.” |
| (2) | Estimated solely for the purpose of calculating the registration fee in accordance with Rule 457(o) promulgated under the Securities Act of 1933, as amended. |
The Registrant hereby amends this Registration Statement on such date or dates as may be necessary to delay its effective date until the Registrant shall file a further amendment which specifically states that this Registration Statement shall thereafter become effective in accordance with Section 8(a) of the Securities Act of 1933, as amended, or until this Registration Statement shall become effective on such date as the Securities and Exchange Commission, acting pursuant to said Section 8(a), may determine.
Table of Contents
The information in this prospectus is not complete and may be changed. These securities may not be sold until the registration statement filed with the Securities and Exchange Commission is effective. This prospectus is not an offer to sell these securities nor a solicitation of an offer to buy these securities in any jurisdiction where the offer and sale is not permitted.
Subject to completion, dated February 14, 2020
Prospectus
Shares

COLE HAAN, INC.
Common Stock
This is the initial public offering of common stock of Cole Haan, Inc. The selling stockholders named in this prospectus are offering shares of our common stock. We will not be selling any shares in this offering and will not receive any proceeds from the sale of our common stock by the selling stockholders.
Prior to this offering, there has been no public market for our common stock. We expect that the initial public offering price of our common stock will be between $ and $ per share. We intend to apply to list our common stock on the NASDAQ Global Select Market, or NASDAQ, under the symbol “CLHN”.
We are an “emerging growth company” as defined in Section 2(a)(19) of the Securities Act of 1933, as amended, or the Securities Act, and, as such, we have elected to comply with certain reduced public company reporting requirements for this prospectus and future filings. See “Summary—Implications of Being an Emerging Growth Company.” After the completion of this offering, funds advised by Apax Partners LLP and Apax Partners, L.P. will continue to own a majority, approximately %, of the shares eligible to vote in the election of our directors. As a result, we will be a “controlled company” within the meaning of the corporate governance standards of NASDAQ. See “Management—Controlled Company Exemption.”
Investing in our common stock involves risks. See “Risk Factors” beginning on page 19 to read about factors you should consider before buying shares of our common stock.
Neither the Securities and Exchange Commission, or the SEC, nor any state securities commission has approved or disapproved of these securities or passed upon the adequacy or accuracy of this prospectus. Any representation to the contrary is a criminal offense.
| Per Share | Total | |||||||
| Initial public offering price |
$ | $ | ||||||
| Underwriting discount(1) |
$ | $ | ||||||
| Proceeds, before expenses, to the selling stockholders |
$ | $ | ||||||
| (1) | See “Underwriting” for additional information regarding underwriting compensation. |
To the extent that the underwriters sell more than shares of our common stock, the underwriters have the option, for a period of 30 days from the date of this prospectus, to purchase up to additional shares of our common stock from the selling stockholders at the initial public offering price, less the underwriting discount. We will not receive any proceeds from the sale of our common stock by the selling stockholders pursuant to any exercise of the underwriters’ option to purchase additional shares.
The underwriters expect to deliver the shares against payment in New York, New York on or about , 2020.
| BofA Securities | Morgan Stanley | J.P. Morgan | Goldman Sachs & Co. LLC | |||
| Jefferies | Baird | Cowen | Piper Sandler | Stifel | ||||
, 2020
Table of Contents

COLE HAAN
Table of Contents

Nearly a century in the making, Cole Haan stands for a simple and powerful idea—we all seek to live extraordinary lives on our own terms. Since our founding in 1928 by Trafton Cole and Eddie Haan, Cole Haan has been worn by extraordinary people—from artists and astronauts, to poets and presidents—who have given the brand its enduring values. Cole Haan transcends genders, generations, cultures and socioeconomic status. As a values-based brand, we deliver ground-breaking products and digital marketing that resonate and aim to inspire our customers to extraordinary living. To be fearless. To blaze trails and shatter boundaries. To earn what cannot be bought. The future isn’t making itself. So we’re building our vision into a reality. We know that the best way to honor a past like ours, is to thoughtfully, and passionately work to create an extraordinary tomorrow. For our customers, our partners, our investors, and ourselves. This is Cole Haan
Table of Contents

Table of Contents

Ground-breaking innovation WATERPROOF Waterproof premium leathers combine with considered WEATHER-READY construction to deliver the ultimate protection against An insulated lining keeps the the elements. heat inside and the chill at bay. IDEAL FIT An anatomically engineered footbed cradles the foot, for better weight distribution and TIMELESS DURABILITY supreme all-day comfort. A perimeter layer of rubberized material protects high-wear areas. STEADY TRACTION TPU outsole with a rugged tread pattern provides superior grip and durability. RESPONSIVE CUSHIONING Three tiers of GRANDFØAM start softest in the area of greatest impact and get firmer as they move outward, for comfort and stability that adapt to every step. 4.ZERØGRAND Hiker
Table of Contents

Cole Haan at a glance
COLE HAAN
GRAND SHOP
Table of Contents

$687M $33M 30% Revenue1 Net Income1 Sales from +14% vs FY18 +43% vs FY18 Digital Commerce1 64 360+ 450+ Countries of Stores Wholesale Distribution1 Globally1 Accounts Globally1 61M 400+ Visits to North America Patents Issued DTC Channels1 or Pending2 +31% vs FY18
Table of Contents
| Page | ||||
| ii | ||||
| ii | ||||
| ii | ||||
| iv | ||||
| v | ||||
| 1 | ||||
| 19 | ||||
| 53 | ||||
| 55 | ||||
| 56 | ||||
| 57 | ||||
| 58 | ||||
| Management’s Discussion and Analysis of Financial Condition and Results of Operations |
61 | |||
| 87 | ||||
| 106 | ||||
| 126 | ||||
| 128 | ||||
| 130 | ||||
| 138 | ||||
| 143 | ||||
| Material United States Federal Income and Estate Tax Consequences to Non-U.S. Holders |
145 | |||
| 149 | ||||
| 157 | ||||
| 157 | ||||
| 157 | ||||
| F-1 | ||||
You should rely only on the information contained in this prospectus or in any free writing prospectus we may authorize to be delivered or made available to you. This prospectus is an offer to sell only the shares offered hereby, but only under the circumstances and in jurisdictions where it is lawful to do so. Neither we, the selling stockholders nor the underwriters have authorized anyone to provide you with different information. The information in this prospectus or in any applicable free writing prospectus is accurate only as of its date, regardless of the time of delivery of this prospectus, or any free writing prospectus, as the case may be, or any sale of shares of our common stock.
For investors outside the United States: The selling stockholders are offering to sell, and seeking offers to buy, shares of our common stock only in jurisdictions where offers and sales are permitted. Neither we nor the underwriters have done anything that would permit this offering or possession or distribution of this prospectus in any jurisdiction where action for that purpose is required, other than in the United States. Persons outside the United States who come into possession of this prospectus must inform themselves about, and observe any restrictions relating to, the offering of the shares of our common stock and the distribution of this prospectus outside the United States.
i
Table of Contents
Within this prospectus, we reference information and statistics regarding the footwear and lifestyle accessories industries, as well as the consumer marketplace generally. We have obtained this information and statistics from various independent third-party sources, including independent industry publications, reports by market research firms and other independent sources, such as eMarketer (Oct. 2018), Euromonitor International Limited and The NPD Group/ Retail Tracking Service/ Dollar Sales Adjusted for Men’s and Women’s/ January-December 2016-2018. The industry data presented in this prospectus related to the size of the global footwear (excluding children’s footwear) and lifestyle accessories markets is based on data from Euromonitor International Limited’s Apparel and Footwear, 2019 edition, 2018 fixed exchange rates, and includes bags and eyewear data from Personal Accessories and Eyewear 2020 editions, 2019 fixed exchange rates. All market sizing data is based on retail sales in absolute dollar terms and reflects current prices by Euromonitor. The size of the international footwear market reflects Euromonitor’s men’s and women’s global footwear market (excluding children’s footwear), net of the U.S. and Canadian footwear markets. Some data and other information contained in this prospectus, such as those relating to use occasions, are also based on management’s estimates and calculations, which are derived from our review and interpretation of internal surveys and independent sources. Data regarding the industries in which we compete and our market position and market share within these industries are inherently imprecise and are subject to significant business, economic and competitive uncertainties beyond our control, but we believe they generally indicate size, position and market share within these industries. While we believe such information is reliable, we have not independently verified any third-party information. While we believe our internal company research and estimates are reliable, such research and estimates have not been verified by any independent source. In addition, assumptions and estimates of our and our industries’ future performance are necessarily subject to a high degree of uncertainty and risk due to a variety of factors, including those described in “Risk Factors.” These and other factors could cause our future performance to differ materially from our assumptions and estimates. See “Forward-Looking Statements.” As a result, you should be aware that market, ranking and other similar industry data included in this prospectus, and estimates and beliefs based on that data, may not be reliable. Neither we, the selling stockholders nor the underwriters can guarantee the accuracy or completeness of any such information contained in this prospectus.
TRADEMARKS, TRADENAMES AND SERVICE MARKS
We own a number of registered and common law trademarks and pending applications for trademark registrations in the United States and other countries, primarily through our subsidiary Cole Haan LLC and its affiliates, including, for example: COLE HAAN, ZERØGRAND, 2.ZERØGRAND, 3.ZERØGRAND, ØRIGINALGRAND, STITCHLITE, GRANDSERIES, GRAND AMBITION AND GRANDPRØ. Unless otherwise indicated, all trademarks appearing in this prospectus are proprietary to us, our affiliates and/or licensors. This prospectus also contains trademarks, tradenames and service marks of other companies, which are the property of their respective owners. Solely for convenience, the trademarks, tradenames and service marks referred to in this prospectus may appear without the ® and ™ symbols, but such references are not intended to indicate, in any way, that we will not assert, to the fullest extent under applicable law, our rights or the rights of the applicable licensors to these trademarks, tradenames and service marks. We do not intend our use or display of other parties’ trademarks, tradenames or service marks to imply, and such use or display should not be construed to imply, a relationship with, or endorsement or sponsorship of us by, these other parties.
The following terms are used in this prospectus unless otherwise noted or indicated by the context:
| • | “2013 Acquisition” means the acquisition of the Company by management and Apax Partners from Nike, Inc. in February 2013. |
| • | “ABL Credit Facility” means the asset-based revolving credit facility pursuant to the ABL Credit Agreement, dated as of February 1, 2013, as amended by Amendment No. 1, dated as of November 23, |
ii
Table of Contents
| 2015, and Amendment No. 2, dated as of July 11, 2018, by and among Calceus MidCo, Inc., its subsidiary, Calceus Acquisition, Inc., as lead borrower, and its other subsidiaries party thereto, as borrowers, the lenders from time to time party thereto and Wells Fargo Bank, National Association, as administrative agent and collateral agent. |
| • | “active DTC customers” mean customers whose data we have in our CRM database and that have transacted on our colehaan.com website and/or within our Company-operated stores in the United States and Canada during the last 12 months. In June 2019 we began to capture information in our CRM database for our International operations and do not currently have the CRM data required to determine the number of active DTC customers for our International segment for all the periods presented in this prospectus. As such, we do not disclose active DTC customers on a consolidated basis or for the International segment in this prospectus. |
| • | “Apax Partners” means Apax Partners LLP, Apax Partners, L.P. and their respective affiliates. |
| • | “Cole Haan,” the “Company,” “we,” “us” and “our” mean the business of Cole Haan, Inc. and its subsidiaries. |
| • | “CRM” means customer relationship management. |
| • | Our “customers” mean consumers who have purchased our products, directly from us and/or through our wholesale and distribution partners and licensees. |
| • | “DTC” means direct-to-consumer, and is inclusive of digital commerce sales through our sites and sales at our Company-operated stores. |
| • | “GAAP” means U.S. generally accepted accounting principles. |
| • | “inline stores” mean full-price retail stores. |
| • | “lifestyle accessories” mean handbags, small leather goods, hosiery, shoe care, eyewear, outerwear, suiting and cold weather goods. |
| • | “LPA” means the Amended and Restated Agreement of Limited Partnership of the Partnership, dated as of February 1, 2013. |
| • | “North America” means the United States and Canada. |
| • | “North America DTC comparable sales growth (decline)” measures the increase or decrease in North America DTC comparable sales as described under “Management’s Discussion and Analysis of Financial Condition and Results of Operations—How We Assess the Performance of Our Business—North America DTC Comparable Sales Growth.” |
| • | “Partnership” means Calceus TopCo, L.P. |
| • | “sites” mean our websites and mobile applications. |
| • | “Sponsor” means funds advised by Apax Partners. |
| • | “Term Loan Facility” means the term loan credit facility pursuant to the Credit Agreement, dated as of February 12, 2019, by and among Calceus MidCo, Inc., Calceus Acquisition, Inc., as borrower, the lenders from time to time party thereto and JPMorgan Chase Bank, N.A., as administrative and collateral agent. |
We operate on a fiscal calendar pursuant to which our fiscal year consists of 52 or 53 weeks, ending on the Saturday closest to May 31. Unless otherwise indicated or the context otherwise requires, all references to years and quarters relate to fiscal periods rather than calendar periods. Unless otherwise noted, store counts are as of June 1, 2019.
References to “fiscal year 2018” and “fiscal year 2019” relate to our fiscal years ended June 2, 2018 and June 1, 2019, respectively. References to “fiscal year 2020” relate to our fiscal year ending May 30, 2020.
iii
Table of Contents
We adopted the Financial Accounting Standards Board’s, or FASB, Accounting Standards Codification, or ASC, No. 606, Revenue from Contracts with Customers, or Topic 606, effective June 3, 2018 using the modified retrospective method. The amounts reported in the consolidated statement of operations for fiscal year 2019 and the consolidated balance sheet as of June 1, 2019 reflect this adoption. According to the modified retrospective method, all financial information before June 3, 2018 was not conformed to the current period presentation. See Notes 2 and 3 to our audited consolidated financial statements included elsewhere in this prospectus for more information regarding our adoption of Topic 606.
We also adopted ASC No. 842, Leases, or Topic 842, effective June 2, 2019 using the modified retrospective method. The amounts reported in the consolidated statement of operations for the 26-week period ended November 30, 2019 and the consolidated balance sheet as of November 30, 2019 reflect this adoption. According to the modified retrospective method, all financial information before June 2, 2019 was not conformed to the current period presentation. See Notes 2 and 9 to our unaudited condensed consolidated financial statements included elsewhere in this prospectus for more information regarding our adoption of Topic 842.
Numerical figures included in this prospectus have been subject to rounding adjustments. Accordingly, numerical figures shown as totals in various tables may not be arithmetic aggregations of the figures that precede them.
This prospectus contains “non-GAAP financial measures” that are financial measures that either exclude or include amounts that are not excluded or included in the most directly comparable measures calculated and presented in accordance with GAAP. Specifically, we make use of the non-GAAP financial measures “Adjusted EBITDA” and “Adjusted EBITDA margin.”
Adjusted EBITDA and Adjusted EBITDA margin have been presented in this prospectus as supplemental measures of financial performance that are not required by, or presented in accordance with, GAAP, because we believe they assist investors and analysts in comparing our operating performance across reporting periods on a consistent basis by excluding items that we do not believe are indicative of our core operating performance. Management believes Adjusted EBITDA and Adjusted EBITDA margin are useful to investors in highlighting trends in our operating performance, while other measures can differ significantly depending on long-term strategic decisions regarding capital structure, the tax jurisdictions in which we operate and capital investments. Management uses Adjusted EBITDA and Adjusted EBITDA margin to supplement GAAP measures of performance in the evaluation of the effectiveness of our business strategies, to make budgeting decisions, to establish discretionary annual incentive compensation and to compare our performance against that of other peer companies using similar measures. Management supplements GAAP results with non-GAAP financial measures to provide a more complete understanding of the factors and trends affecting the business than GAAP results alone.
Adjusted EBITDA and Adjusted EBITDA margin are not recognized terms under GAAP and should not be considered as an alternative to net income as a measure of financial performance or cash provided by operating activities as a measure of liquidity, or any other performance measure derived in accordance with GAAP. In addition, these measures are not intended to be a measure of free cash flow available for management’s discretionary use as they do not consider certain cash requirements such as interest payments, tax payments and debt service requirements. The presentations of these measures have limitations as analytical tools and should not be considered in isolation, or as a substitute for analysis of our results as reported under GAAP. Because not all companies use identical calculations, the presentations of these measures may not be comparable to other similarly titled measures of other companies and can differ significantly from company to company. For a discussion of the use of these measures and a reconciliation to the most directly comparable GAAP measures, see footnote (4) under “Summary—Summary Historical Consolidated Financial and Other Data.”
iv
Table of Contents
We are advocates for extraordinary living.
Seven years ago, we began our journey as an independent company and set out to transform a classic domestic dress shoe company with a 90-year heritage into something even bigger—a global lifestyle brand serving always-connected, active professionals with innovative footwear and lifestyle accessories. Today, Cole Haan is a $1 billion global performance lifestyle brand at retail that connects with consumers primarily over digital platforms. And we’re just at the beginning of our journey.
Today’s Cole Haan was born out of a simple observation—that technology, which is reshaping our personal and professional lives in profound ways, would radically change what consumers need in footwear and lifestyle accessories in ways traditional dress footwear and accessories companies were not embracing.
Sure, people were talking about the way technology would impact the way we sell our products, but few, if any, were talking about how to reengineer those very products. We saw opportunity—in the marketplace and, specifically, with Cole Haan. And, our colleagues at Apax Partners shared in that vision. Why Cole Haan? Easy—it had a sterling reputation in a category ready for disruption.
So, in 2013, Cole Haan became an independent company for the first time in 25 years. Since then we have been successful in attracting active urban adventurers throughout the world whose lives require versatile, stylish and comfortable products that allow them to go from work-to-workout-to-weekend. These women and men have taught us a few things about how they see their lives—that no one seeks to be ordinary—that they can live extraordinary lives and impact the world in extraordinary ways if they choose.
Given this, our mission is to inspire our customers to live extraordinary lives by encouraging and supporting their personal and professional passions. We live this mission each and every day we come to work at Cole Haan. And, we make products that strive to exceed our customers’ expectations.
Our company culture is driven by a simple mantra: respect tradition enough to reinvent it. We refuse to be bound by convention when it comes to product creation and marketing at Cole Haan. Why should we? Our customers are not bound by convention when it comes to starting new businesses, finding new ways to express ideas or making human connections through new technology. This led us to the development and launch of our iconic ZERØGRAND label, which first debuted in 2014. This revolutionary idea was the first step for Cole Haan on its path to inventing a new category of performance lifestyle footwear and accessories.
Today, the Cole Haan brand is resonating across the globe. Our customers believe in the promise of our brand and are demonstrating increased demand for our breakthrough products. I am confident we are only at the beginning of our journey. With our foundational investments in place, Cole Haan is now a modern enterprise built for the digital future. I believe we have the scale and capabilities for sustainable and profitable growth. My colleagues and I are extremely proud to carry the Cole Haan legacy forward. As we move to our next chapter, we will always endeavor to do right by our customers, employees, partners, stakeholders and investors.
We encourage you to join us on our extraordinary journey.

Jack Boys
Chief Executive Officer
v
Table of Contents
This summary highlights selected information contained elsewhere in this prospectus. This summary does not contain all of the information that you should consider before deciding to invest in our common stock. Before making an investment decision, you should read the entire prospectus carefully, including “Risk Factors,” “Management’s Discussion and Analysis of Financial Condition and Results of Operations” and our consolidated financial statements and related notes thereto included elsewhere in this prospectus. This summary contains forward-looking statements that involve risks and uncertainties.
Our Brand Mission
We are advocates for extraordinary living—on the go, pushing forward, disrupting conventional thinking and shattering boundaries. Our mission is to inspire our consumers to live extraordinary lives and support their career-oriented dreams through lifestyle products, stories that inspire and digital experiences that connect and engage.
Who We Are
Cole Haan is a global lifestyle brand serving always-connected, active professionals with innovative footwear and lifestyle accessories. Recognizing a major cultural shift in consumer adoption of a more casual workplace, management and Apax Partners acquired Cole Haan from Nike, Inc. in February 2013 with a vision to disrupt the conventional dress footwear industry. Since then, we have pioneered new categories of footwear and lifestyle accessories that customers wear from work-to-workout-to-weekend, building upon our 90-year heritage and reputation for quality craftsmanship with innovation. Our brand resonates equally with women and men across multiple generations, with the focus of product creation and marketing towards our core 24- to 44-year-old customers. We market footwear and lifestyle accessories across the Dress, Casual, Outdoor and Sport use occasions—resulting in a broad portfolio that enables Cole Haan to own more share of our customers’ closets. We transformed Cole Haan to conduct business at the speed of digital and we connect directly to consumers using a digital-first approach. As a result, over 30% of our total sales come from digital commerce through our sites and our wholesale partners’ sites.
Cole Haan offers a four-season portfolio of lifestyle products for head-to-toe styling, led by footwear. Over the past several years, our footwear offering has broadened from a focus on the Dress use occasion to include a broader selection of Casual, Outdoor and Sport use occasions, which comprised 53% of our fiscal year 2019 footwear revenue. Our expansion into these use occasions has considerably expanded our addressable market in the fastest-growing segments of footwear. Our lifestyle accessories include an innovative selection of handbags, small leather goods, hosiery, shoe care, eyewear, outerwear, suiting and cold weather goods that complement our footwear portfolio. We market our footwear and lifestyle accessories across a broad range of premium price points that allow us to compete in multiple channels.
We believe we are the leader in our industry for engineering innovative products. Every product we make—from pumps to performance runners to handbags to outerwear—combines style with exceptional performance attributes built on our proprietary innovation platform, the Grand 36Ø Design & Engineering System. This system enables Cole Haan to create versatile, stylish and comfortable products that meet the demands of on-the-go consumers.
We acquire customers primarily using a digital-first marketing discipline that emphasizes media investments viewed on mobile devices, through digital media and social channels. Through our marketing channels, we create compelling native content that inspires consumers and increases the awareness of the Cole Haan brand. To amplify our reach, we partner with premier national and global editorial sources, such as Forbes,
1
Table of Contents
The Wall Street Journal and The New York Times. Once consumers demonstrate a desire to learn more about Cole Haan, we invest in targeted marketing to provide a seamless path toward purchase conversion.
We have built a global, multi-channel distribution network across 64 countries that includes our global digital flagship site, colehaan.com, 368 stores and over 450 diverse global wholesale accounts. Our North America segment comprises our DTC business, which includes our digital flagship site and 112 stores, and wholesale distribution to a diverse account base spanning digital pureplay, specialty retail, premium department store, sporting goods and family footwear accounts. A representative selection of our North American wholesale partners includes Nordstrom, Bloomingdale’s, Hibbett Sports, Amazon, Zappos and Stitch Fix.
Our International segment includes our wholly owned Japanese subsidiary and partnerships with leading regional distributors and wholesalers. In Japan, where we have operated for nearly 25 years, our footprint is primarily DTC consisting of 80 stores and our localized digital commerce site, colehaan.co.jp. Outside of Japan, the remainder of our international sales occur in over 60 countries. In these markets, we employ a capital-efficient model where our 37 regional distributors fund costs to build and operate 176 Cole Haan designed and branded stores. We have also successfully expanded our wholesale business in countries where we operate directly, including the United Kingdom and Japan.
How We Transformed Cole Haan for the Modern Digital Age
When Apax and management acquired Cole Haan in 2013, we became an independent company for the first time in 25 years. Since our 2013 Acquisition, we have completed over $100 million in transformational investments in technology, digital infrastructure, product innovation and other areas, which we believe have positioned the Company for growth. We have reinvented our corporate culture as a “90-year-old start-up.” Key initiatives have included:
| • | modernizing and amplifying the perception of the Cole Haan brand with consumers; |
| • | transforming our innovation and product-creation capabilities to expand our total addressable market to over $700 billion and create a diverse portfolio of breakthrough footwear and lifestyle accessories; |
| • | shifting the Company’s North American distribution focus toward a DTC model with a primary emphasis on building our digital commerce capabilities and rationalizing our store footprint, while accelerating our wholesale business; |
| • | expanding the Company’s global footprint from eight countries in 2013 to 64 countries today, unlocking the substantial opportunity outside the United States and Canada that represents 78% of the global footwear market; |
| • | upgrading the enterprise to do business at the speed of digital, from supply chain to customer experience; and |
| • | building a diverse, multidisciplinary team to drive our growth agenda—nearly 90% of our employees have joined since 2013. |
Recent Financial Performance
While we believe we are still in the early stages of realizing the benefits of our transformation, we have already accelerated our growth profile as evidenced by our following recent achievements:
| • | grew our base of active DTC customers from 1.058 million in fiscal year 2018 to 1.501 million in fiscal year 2019, representing year-over-year growth of 41.9%; |
2
Table of Contents
| • | grew our revenue from $601.6 million in fiscal year 2018 to $686.6 million in fiscal year 2019, representing year-over-year growth of 14.1%; |
| • | increased our net income from $23.1 million in fiscal year 2018 to $33.1 million in fiscal year 2019, representing year-over-year growth of 43.4%; |
| • | grew our Adjusted EBITDA from $60.1 million in fiscal year 2018 to $94.8 million in fiscal year 2019, representing year-over-year growth of 57.8%; and |
| • | increased our Adjusted EBITDA margin from 10.0% in fiscal year 2018 to 13.8% in fiscal year 2019. |
For further information about how we calculate Adjusted EBITDA and Adjusted EBITDA margin, limitations of their use and a reconciliation of Adjusted EBITDA to net income, see “—Summary Historical Consolidated Financial and Other Data.”
Our Competitive Strengths
We believe the following competitive strengths have been instrumental to our success and position us for future growth:
A Powerful Brand that Inspires Extraordinary Living
Powerful ideas fuel global consumer brands. The Cole Haan brand stands for a simple and powerful idea—we all seek to live extraordinary lives on our own terms. Since our founding in 1928 by Trafton Cole and Eddie Haan, Cole Haan has been worn by extraordinary people—from artists and astronauts, to poets and presidents—who have infused the brand with enduring values that continue to connect consumers to our storied brand. It is a brand that transcends generations, socio-economic status, genders and cultures. As a values-based brand, we deliver ground-breaking products and digital marketing that resonate strongly with consumers and aim to inspire extraordinary living.
Deep Consumer Knowledge Drives Our Product Development and Marketing
Unlike many companies that prioritize designer-led inspiration to develop products, we use ongoing insights into consumers’ lives gathered through proprietary research, surveying, media use tracking and consumer analytics to inform product design and development. We believe this institutional discipline underpins our product creation and will enable us to continue earning additional share of our customers’ closets in the future. While the Cole Haan brand resonates with women and men across multiple generations, we focus our product design, development and marketing initiatives to meet the needs of our “First Best Customers.”
Who are they? Our First Best Customers are active women and men ages 24 to 44 who live in global urban centers. We target this group because of its large and fast-growing generational spending power. They are multi-faceted and see their potential for extraordinary—making a positive impact on the world—through their personal and professional passions. They are inspired by those extraordinary people across the cultural spectrum who “work for what they believe in.” Our First Best Customers:
| • | Dress casually in the workplace. Casualization of dress in the workplace continues to increase, with 50% of organizations in the United States allowing casual dress every day in 2018. |
| • | Pursue an on-the-go-lifestyle. They prioritize experiences over possessions, extend business trips into leisure trips and work remotely on a flexible schedule. |
| • | Are always connected digitally. 94% of U.S. millennials own a smartphone, according to eMarketer. |
3
Table of Contents
| • | Prefer to shop online. 85% of U.S. millennials are expected to be digital shoppers in 2019, according to eMarketer. |
We deliver on their expectations. We have pioneered a new category of products that combine versatility, style and comfort so our First Best Customers can live their on-the-go lives. We envisioned a collection of high-performance footwear and lifestyle accessories consumers could use from work-to-workout-to-weekend—our groundbreaking ZERØGRAND label. Originally launched in footwear in 2014, ZERØGRAND has grown into a multi-category label that encompasses footwear across multiple use occasions, including innovative new boots and all-day trainers, as well as bags, outerwear, hosiery and cold weather goods.
Proprietary Multi-Category Product Portfolio and Innovation Capabilities
Our deep consumer knowledge combined with our innovation capabilities support our leadership position and enable us to have a broader portfolio of products compared to our peers. There are two key components to our product-creation process:
| • | Multi-category lifestyle product architecture enables broad category penetration. Our customers are active women and men who are commuting, traveling and traversing throughout cities around the world. Consequently, they need versatile products that perform from work-to-workout-to-weekend. In response, we created a multi-category lifestyle product architecture, which includes all-year-round footwear and lifestyle accessories across Dress, Casual, Outdoor and Sport use occasions. Our expansive product portfolio enables us to capture an increased share of our customers’ closets. Within this architecture, we create products under two primary labels: ZERØGRAND and GRANDSERIES. |
| • | ZERØGRAND invents products with overt design and innovation characteristics consumers can easily see. These products fuse athletic footwear engineering with modern styling. |
| • | GRANDSERIES reinvents products with classic styling and innovation characteristics consumers can feel when they try them on. |
MULTI-CATEGORY LIFESTYLE PRODUCT ARCHITECTURE*

| * | Includes certain products, such as dresses, shirts, pants, skirts and luggage, that are not Cole Haan products. |
4
Table of Contents
| • | Innovation differentiates our products. We built an Innovation Center in New Hampshire where team members with backgrounds in biomechanics, material science, engineered materials, advanced concept research and development, product development engineering, fit and performance testing and industrial design come together to employ state-of-the-art technology to invent breakthrough products. We created a revolutionary innovation system for solving consumer needs through specific enhancements, called the Grand 36Ø Design & Engineering System. This system focuses on specific performance principles to deliver holistic product solutions in a repeatable manner. We protect our industry-leading technology and designs with a growing portfolio of over 400 patents, issued or pending. |
GRAND 36Ø DESIGN & ENGINEERING SYSTEM

Digital-First Commerce and Marketing Drives Customer Acquisition
We have focused our investments in digital commerce to build highly scalable, best-in-class capabilities from customer acquisition to transaction. These investments have enabled the rapid growth of digital sales through both our sites and our wholesale partners’ sites, which represent over 30% of our total sales. Our global digital platform is built upon three cloud-based technology platforms across demand generation (marketing), commerce and analytics. This combination enables our digital-first marketing funnel, creates enriching and frictionless experiences for customers and provides data we can leverage real-time to enhance site experience and drive purchase conversion.
To continuously improve our capabilities and drive digital sales, we recently completed the redesign and replatforming of our global digital flagship, colehaan.com. Our site offers the broadest assortment of our products and is the definitive resource for our brand storytelling to consumers, including the sharing of content, experiences and product detail. We specifically focused on improving our mobile commerce experience with the redesign, as nearly 70% of digital visits originated from mobile devices in fiscal year 2019.
Our marketing funnel is nearly 100% digitally driven and emphasizes using media investments to deliver branded content to mobile devices, through digital media and social channels. Unlike our competitors, we have
5
Table of Contents
eliminated almost all traditional media investments and instead invest across four phases of our digital market funnel to acquire customers and build our community:
| • | Inspire. We seek to acquire new customers through two complementary methodologies: native content and product and social media collaborations. We collaborate with traditional and new media partners to produce award-winning native content displayed on digital platforms. We also work with extraordinary cultural influencers and brands to create limited-edition products and messages for social media audiences who may be introduced to the Cole Haan brand for the first time or within a new context. |
| • | Engage. We create targeted digital advertising and invest in media across an integrated landscape of media platforms and social channels, such as Facebook, Instagram, Twitter, YouTube and Snapchat, that consumers engage with many times throughout the day. |
| • | Inform. When consumers demonstrate a desire to learn more about Cole Haan through digital search or by visiting our sites, we invest in targeted marketing to provide a seamless path toward purchase conversion. |
| • | Transact. Our mobile-optimized site provides consumers with the information they need to make informed purchase decisions. |
We believe our digital-first marketing approach is driving the success of our DTC business, as illustrated by the 61 million visits to colehaan.com and our North America stores in fiscal year 2019, a 31% increase from fiscal year 2018, and improvements in our mobile purchase conversion.
Operating Platform Built for Business at the Speed of Digital
As part of our transformation, we built a highly efficient, scalable operating platform for global commerce:
Go-to-Market Process. We have streamlined our product development process to allow us to introduce new products to the marketplace more quickly and on complementary development calendars. Our typical go-to-market process takes 12 to 15 months. Our most rapid internal development process, which we call “Quick Strike,” enables us to address new opportunities emerging in the marketplace within 90 days from consumer insight to product introduction. More complex innovation projects operate on an “Advanced Development” process calendar, which can take between 24 to 36 months to deliver new products to the market.
Sourcing and Supply Chain. We have modernized our manufacturing base with leading sourcing, development, commercialization and manufacturing capabilities, focusing on Vietnam and India as primary countries of origin. Less than 15% of the Company’s footwear and handbag products are manufactured in China and we intend to further reduce that percentage over time.
Global Operations. We manage our business on a fully integrated global basis across multiple operations functions, including product lifecycle management, inventory planning, commerce, distribution and technology. This approach allows us to be flexible in meeting consumer demand across geographies and channels. Furthermore, within our DTC channels we offer a seamless experience to our customers by managing operations with an integrated view of inventory and omni-channel fulfillment capabilities across in-store and online.
Visionary and Proven Management Team
Our seasoned management team is led by our CEO Jack A. Boys. Mr. Boys has successfully transformed multiple global lifestyle brands across the footwear, apparel and outdoor specialty industries, including Converse and The North Face.
6
Table of Contents
At Cole Haan, Mr. Boys has led our transformation and recruited a leadership team with diverse and relevant backgrounds from leading global consumer brands. We have assembled a team with talent from a broad set of industries, such as consumer retail, automotive design, software programming, materials engineering, digital commerce, data science and advertising. The members of our team have proven track records of understanding and marketing to millennials, designing best-in-class products and building scalable global operations. Our team has successfully transformed our business, created a culture of innovation that permeates the organization and driven financial momentum. We believe our management team has the vision and experience to successfully continue to drive our future growth and profitability.
Our Growth Strategies
We believe we are still in the early stages of realizing the benefits of our transformation and intend to leverage our competitive strengths and growth investments by pursuing the following strategies:
Earn More Share of Customers’ Closets
We intend to continue to grow our business by delivering innovative footwear and lifestyle accessories. We will leverage our strengths in consumer insight, lifestyle merchandising and product innovation to compete and win in three primary areas:
| • | Continue expanding core franchises. We believe we have a significant opportunity to further attract new customers to our iconic, multi-generation product franchises. In total unit count, we believe that many of these franchises, such as the ZERØGRAND Wingtip Oxford, have long runway for growth and we intend to continue driving sales of these products across our global distribution network. |
| • | Expand our offerings through our multi-category lifestyle product architecture. The market for Casual, Outdoor and Sport use occasion footwear is growing at double the rate of the overall U.S. footwear market. We believe Cole Haan is underpenetrated in these market segments. Over the last several years, we have successfully extended into these use occasions with products such as our GrandPrø Tennis Sneaker and ZERØGRAND Explore Hiker Boot. We intend to continue developing a broader array of products for these use occasions, while continuing to grow our products for the Dress use occasion. |
| • | Increase penetration of lifestyle accessories. We will continue to leverage our brand and customer satisfaction with our footwear products to gain more share of our customers’ closets with our lifestyle accessories offered and sold through our licensing partners and our sites and stores. We believe these categories are underrepresented in our business, accounting for 7.8% of our fiscal year 2019 revenue. |
Acquire New Customers and Drive Long-Term Customer Relationships
We believe we have a significant opportunity to continue to grow our customer base. We intend to continue marketing almost exclusively via digital platforms, a strategy that resulted in a 41.9% year-over-year increase in the number of our active DTC customers in fiscal year 2019. Our digital marketing is resonating with consumers and we will continue to attract and engage consumers through extraordinary stories that feature our brand and our innovative products. We have inspirational stories to tell and intend to share them with more people. As a values-based brand, Cole Haan plans to continue partnering with digital media content creators and social media influencers, among others, to power our digital-first marketing strategy and attract younger customers.
We believe a focus on driving long-term customer relationships will strengthen brand awareness, customer acquisition and retention, and, ultimately, result in higher lifetime customer values. Our key initiatives include:
| • | creating full-funnel customer journeys, leveraging our competitive strengths in digital-first marketing; |
7
Table of Contents
| • | launching a digital membership program, “Above and Beyond,” to retain customers, gain more share of our customers’ closets and encourage customer advocacy; |
| • | driving further engagement by leveraging CRM data and leading-edge marketing technologies to deliver personalized brand messages and product recommendations; and |
| • | developing a mechanism for customer-generated social sharing of extraordinary living to drive audience growth and amplify our brand mission. |
Continue to Grow Our North America DTC Business
Our North America DTC channel allows us to create meaningful, direct relationships with customers and capture full retail margin. In fiscal year 2019, we drove North America DTC traffic of 61 million visits, a 31% increase from the prior fiscal year. We intend to build on the success of our North America DTC business by:
| • | increasing our number of active DTC customers across our sites and our stores; |
| • | leveraging our investments in CRM and omni-channel technology to increase multi-channel customer relationships and engagement; |
| • | offering a product assortment responsive to consumer preferences and design trends through continuous innovation across the product portfolio; |
| • | increasing customer lifetime value by earning more share of our customers’ closets; and |
| • | selectively growing our store fleet by opening highly productive, digitally connected small space stores that showcase our most innovative footwear and lifestyle accessories. |
Expand Our North America Wholesale Business
We have created a growing wholesale business with diverse wholesale partners. We have driven growth through a rigorous approach to product segmentation within each channel, often on a retailer-by-retailer basis, by selling a price-appropriate, compelling assortment of our merchandise. To continue this growth, we intend to:
| • | Drive velocity within existing accounts. We believe we have ample runway for growth with our existing wholesale partners by increasing sales of our core products through increased brand and product awareness, expanding product assortments into additional footwear and lifestyle accessory categories, gaining market share with superior products and growing wholesale digital sales by employing our drop-ship capabilities. |
| • | Accelerate digital pureplay partnerships. We expect to continue broadening our existing relationships in the United States with digital pureplays such as Amazon, Zappos, Stitch Fix and others, and will look to create relationships with new emerging players. |
| • | Diversify into specialty channels in the United States. In order to further expand our wholesale partner mix, we intend to selectively add new specialty channels of distribution, such as sporting goods and premier independent boutiques. |
8
Table of Contents
Grow Our International Business
We have a significant opportunity to leverage our international presence to drive growth. Our International segment represented just 14.3% of our total revenue for fiscal year 2019. To address this opportunity, we intend to:
| • | Grow our Japanese business. Japan is a leading global footwear and apparel market and our position in that market promotes brand awareness among international consumers. We expect to build upon our nearly 25-year market presence in Japan by: |
| ○ | using our proven digital-first marketing discipline to inspire, engage and inform Japanese First Best Customers on our redesigned, replatformed site, colehaan.co.jp; and |
| ○ | continuing to grow our premium wholesale sales following our recent debut at ABC-Mart, one of the leading footwear retailers in the country. |
| • | Leverage our international distributor network and expand our wholesale presence. We have developed a successful and disciplined framework for connecting with consumers in leading international markets through regional distributors and wholesalers. We expect to continue to grow by: |
| ○ | opening additional distributor stores in leading shopping districts and malls throughout the world, with a long-term target of doubling our international footprint; |
| ○ | selectively expanding the wholesale business in the United Kingdom, Europe, the Middle East and Mexico; and |
| ○ | continuing to open and accelerate relationships with digital pureplays in international markets, where our products are currently offered on sites including TMall, Zalando, Amazon and Souq. |
| • | Enhance international customer experience on colehaan.com. We are planning to better serve our international customers on colehaan.com by deploying a global digital commerce solution that enables localized user experiences, pricing and ordering. We believe that creating a more frictionless experience for customers outside of the United States will enable us to grow our global digital sales. |
Continue to Drive Operating Margin Expansion
As we continue to realize the benefits of the multi-year investments we have completed in systems, infrastructure and other improvements across the enterprise, we believe we have opportunities to grow our profitability faster than sales and expand our operating margin by:
| • | leveraging investments in digital functionality, CRM capability and marketing spend to drive traffic and customer acquisition; |
| • | utilizing our global scale and product cost engineering to drive sourcing efficiencies and supply chain savings; and |
| • | leveraging our fixed cost base to drive quality execution, efficiency and profitability. |
Risks Related to Our Business and this Offering
Investing in our common stock involves a high degree of risk. You should carefully consider the risks described in “Risk Factors” before making a decision to invest in our common stock. If any of these risks actually occurs, our business, results of operations and financial condition may be materially adversely affected. In such case, the trading price of our common stock may decline and you may lose part or all of your investment. Below is a summary of some of the principal risks we face:
| • | Our success depends in large part on the value and reputation of our brand, which is integral to our business and the implementation of our strategies for expanding our business. Maintaining and |
9
Table of Contents
| promoting our brand will depend largely on the success of our marketing and merchandising efforts and our ability to provide consistent, high-quality products and services, and may require us to make substantial investments. Consumers in new markets may not accept our brand image and maintaining and enhancing our brand may become increasingly difficult and expensive. Our brand and reputation may also be harmed by negative claims or publicity. |
| • | If we fail to adequately continue to connect with our consumer base, it could have a material adverse effect on our business, results of operations and financial condition. If we fail to successfully develop and implement marketing, advertising and promotional strategies in new and existing markets, we may be unable to achieve and maintain brand awareness and consumer traffic to our sites and/or stores may be reduced. |
| • | Our business depends on consumer demand for our products and, consequently, is sensitive to a number of factors that influence consumer confidence and spending. An overall decline in the health of the economy and other factors may affect consumer purchases, reduce demand for our products and materially harm our business, results of operations and financial condition. |
| • | Our plans to improve and expand our product offerings may not be successful due to, among other things, delays in the introduction of new products, lack of acceptance of new products, their pricing or novel technologies incorporated into such products and limited effectiveness of our marketing strategies. Implementation of these plans may divert our operational, managerial and administrative resources, which could harm our competitive position and reduce our revenue and profitability. |
| • | If we fail to introduce technical innovation in our products, we may not be able to generate sufficient consumer interest in our products to remain competitive, and if we experience problems with the quality of our products, we may incur substantial expense to remedy such issues and our brand may be adversely affected. Our results of operations would also suffer if our innovations do not respond to the needs of our consumers, are not appropriately timed with market opportunities or are not effectively brought to market. |
| • | Our business is highly dependent upon our ability to identify and respond to new and changing consumer trends and translate them into appropriate, saleable product offerings in a timely, cost-efficient manner. Our failure to identify and react appropriately to trends or consumer preferences or to accurately forecast demand for certain product offerings could lead to, among other things, excess inventories or inventory shortages, higher markdowns and write-offs of unsold merchandise. This could have an adverse effect on the image and reputation of our brand and could adversely affect our gross margins. |
| • | The footwear and lifestyle accessories markets are highly competitive and fragmented. Competition may result in pricing pressure, reduced profit margins or lost market share or a failure to grow our market share, any of which could substantially harm our business, results of operations and financial condition. |
| • | As a digital commerce retailer, we encounter risks and difficulties frequently experienced by Internet-based businesses, such as uncertainties associated with our sites, including changes in required technology interfaces, technical failures, costs and issues, inadequate system capacity, security breaches and legal claims, credit or debit card fraud and payment processing issues and cybersecurity and consumer privacy concerns and regulations, among others. Our failure to successfully manage our digital commerce business could adversely impact our business and profitability. |
| • | If we fail to open and operate new stores in a timely and cost-effective manner or fail to successfully enter new markets, our financial performance could be materially and adversely affected. In addition, there can be no assurance that newly opened stores will achieve sales or profitability levels comparable to those of our existing stores in the time periods estimated by us, or at all. We may not be able to maintain the levels of North America DTC comparable sales that we have experienced recently. |
10
Table of Contents
| • | We are dependent on domestic and international wholesale partners for a significant portion of our sales. A decision by any of our major wholesale partners to decrease significantly the amount of merchandise purchased from us or our licensing partners, or to change their manner of doing business with us or our licensing partners, could substantially reduce our revenue and have a material adverse effect on our probability. If any disputes with our wholesale partners arose, if we were to lose any of our key wholesale partners or if any of our key wholesale partners consolidate and/or gain greater market power, our business, results of operations and financial condition may be materially adversely affected. In addition, we may be similarly adversely impacted if any of our key wholesale partners experience any operational or financial difficulties, close stores or generate less traffic. |
| • | Our business is subject to risks associated with our international distribution partners. If we terminate an independent distributor, we may lose our customers who have been dealing with that distributor. Actions by independent distributors that are beyond our control could result in flat or declining sales in that geography, harm to our reputation or our products or legal liability. In addition, our failure to identify and maintain regional distributor relationships in new and existing geographies may adversely affect our growth and financial performance. |
| • | Our substantial indebtedness could adversely affect our ability to raise additional capital to fund our operations, limit our ability to react to changes in the economy or our industry and prevent us from meeting our obligations. We will require a significant amount of cash to service our debt, and our ability to generate cash depends on many factors beyond our control. |
| • | After completion of this offering, we will be a “controlled company” within the meaning of the rules of NASDAQ and the rules of the SEC and, as a result, qualify for, and intend to rely on, exemptions from certain corporate governance requirements. You will not have the same protections afforded to stockholders of other companies that are subject to such requirements. |
| • | Our Sponsor controls us and its interests may conflict with yours in the future. In the ordinary course of their business activities, our Sponsor and its affiliates may engage in activities where their interests conflict with our interests or those of our stockholders. In addition, our Sponsor and its affiliates will be able to determine the outcome of all matters requiring stockholder approval and will be able to cause or prevent a change of control of the Company or a change in the composition of our board of directors and could preclude any acquisition of the Company. |
Implications of Being an Emerging Growth Company
We qualify as an “emerging growth company” as defined in Section 2(a)(19) of the Securities Act. As a result, we are permitted to, and intend to, rely on exemptions from certain disclosure requirements that are applicable to other companies that are not emerging growth companies. Accordingly, in this prospectus, we have (i) presented only two years of audited consolidated financial statements, selected financial data and management’s discussion and analysis of financial condition and results of operation disclosure; and (ii) have not included a compensation discussion and analysis of our executive compensation programs. In addition, for so long as we are an emerging growth company, among other exemptions, we will not be required to:
| • | engage an independent registered public accounting firm to report on our internal controls over financial reporting pursuant to Section 404(b) of the Sarbanes-Oxley Act of 2002, or the Sarbanes-Oxley Act; |
| • | comply with any requirement that may be adopted by the Public Company Accounting Oversight Board, or PCAOB, regarding mandatory audit firm rotation or a supplement to the auditor’s report providing additional information about the audit and the financial statements; |
| • | disclose certain executive compensation-related items, such as the correlation between executive compensation and performance and comparisons of the chief executive officer’s compensation to median employee compensation; or |
11
Table of Contents
| • | submit certain executive compensation matters to stockholder advisory votes, such as “say-on-pay,” “say-on-frequency” and “say-on-golden parachutes.” |
We will remain an emerging growth company until the earliest to occur of:
| • | the last day of the fiscal year in which we have $1.07 billion or more in annual gross revenue; |
| • | our becoming a “large accelerated filer,” with at least $700.0 million of equity securities held by non-affiliates; |
| • | our issuance, in any three-year period, of more than $1.0 billion in non-convertible debt; and |
| • | the fiscal year-end following the fifth anniversary of the completion of this initial public offering. |
The Jumpstart Our Business Startups Act of 2012, or the JOBS Act, also permits an emerging growth company such as us to take advantage of an extended transition period to comply with new or revised accounting standards applicable to public companies. We are choosing to “opt out” of this provision and, as a result, we will comply with new or revised accounting standards as required when they are adopted. This decision to opt out of the extended transition period under the JOBS Act is irrevocable.
Our Sponsor
Apax Partners
Apax Partners is a leading global private equity advisory firm. Over its more than 40-year history, Apax Partners has raised and advised funds with aggregate commitments of approximately $50 billion. The Apax Funds invest in companies across four global sectors of Tech & Telco, Services, Healthcare and Consumer. These funds provide long-term equity financing to build and strengthen world-class companies. The Apax Funds have been a leading global investor in the consumer space over several decades, investing more than $8 billion in consumer businesses. Selected current and past consumer investments include Baltic Classified Group, MATCHESFASHION.COM, Idealista, wehkamp, Advantage Sales and Marketing, Tnuva Food Industries, Auto Trader Group, Tommy Hilfiger, Ollie’s Bargain Outlets, New Look Group and PVH in its acquisition of Calvin Klein.
Our Corporate Information
Calceus TopCo, Inc. was incorporated in Delaware on November 9, 2012. We changed our name to “Cole Haan, Inc.” on October 15, 2019. Our principal offices are located at 150 Ocean Road, Greenland, New Hampshire 03840. Our telephone number is (603) 430-7800. We maintain a website at www.colehaan.com. The reference to our website is intended to be an inactive textual reference only. The information contained on, or that can be accessed through, our website is not part of this prospectus and investors should not rely on such information in deciding whether to purchase shares of our common stock.
12
Table of Contents
The Offering
| Issuer |
Cole Haan, Inc. |
| Common Stock Offered by the Selling Stockholders |
shares |
| Option to Purchase Additional Shares of Common Stock |
The selling stockholders have granted the underwriters a 30-day option from the date of this prospectus to purchase up to additional shares of our common stock at the initial public offering price, less the underwriting discount. |
| Common Stock to be Outstanding Immediately After this Offering |
shares |
| Use of Proceeds |
We will not receive any proceeds from the sale of shares of our common stock by the selling stockholders in this offering, including from any exercise by the underwriters of their option to purchase additional shares from the selling stockholders. The selling stockholders will receive all of the net proceeds and bear the underwriting discount attributable to their sale of our common stock. We will pay certain expenses associated with this offering. See “Principal and Selling Stockholders.” |
| Controlled Company |
Upon the closing of this offering, our Sponsor will own a majority of the shares eligible to vote in the election of our directors. We currently intend to avail ourselves of the controlled company exemption under the corporate governance standards of NASDAQ. |
| Dividend Policy |
We have no current plans to pay dividends on our common stock. Any decision to declare and pay dividends in the future will be made at the sole discretion of our board of directors and will depend on, among other things, our results of operations, cash requirements, financial condition, contractual restrictions, including restrictions in the agreements governing our indebtedness, and other factors that our board of directors may deem relevant. See “Dividend Policy.” |
| Risk Factors |
Investing in shares of our common stock involves a high degree of risk. See “Risk Factors” for a discussion of factors you should carefully consider before investing in shares of our common stock. |
| NASDAQ Trading Symbol |
“CLHN”. |
13
Table of Contents
The number of shares of our common stock to be outstanding immediately after the closing of this offering is based on shares of common stock outstanding as of , 2020. Unless we indicate otherwise or the context otherwise requires, this prospectus:
| • | reflects and assumes: |
| • | no exercise of the underwriters’ option to purchase additional shares of our common stock; |
| • | the filing and effectiveness of our amended and restated certificate of incorporation and the adoption of our amended and restated bylaws immediately prior to the consummation of this offering; and |
| • | the -for-one stock split of our common stock, which we intend to effectuate immediately prior to the effectiveness of the registration statement of which this prospectus forms a part; and |
| • | does not reflect shares of our common stock reserved for future issuance under our new Omnibus Incentive Plan, which we intend to adopt in connection with this offering. See “Management—Executive Compensation—Compensation Arrangements to be Adopted in Connection with this Offering.” |
14
Table of Contents
SUMMARY HISTORICAL CONSOLIDATED FINANCIAL AND OTHER DATA
Set forth below is our summary historical consolidated financial and other data as of the dates and for the periods indicated. We have derived the summary historical consolidated statements of operations data and consolidated statements of cash flows data for the fiscal years ended June 2, 2018 and June 1, 2019 and the summary historical consolidated balance sheet data as of June 2, 2018 and June 1, 2019 from our audited historical consolidated financial statements included elsewhere in this prospectus. Our historical audited results are not necessarily indicative of the results that should be expected in any future period.
We have derived the summary historical condensed consolidated statements of operations data and condensed consolidated statements of cash flows data for the 26-week periods ended December 1, 2018 and November 30, 2019 and the summary historical condensed consolidated balance sheet data as of November 30, 2019 from our unaudited historical condensed consolidated financial statements included elsewhere in this prospectus. With the exception of the adoption of Topic 842, which we adopted on a modified retrospective basis on June 2, 2019, the first day of fiscal year 2020, our unaudited condensed consolidated financial statements were prepared on a basis consistent with the audited consolidated financial statements and have included all adjustments, consisting only of normal recurring adjustments that, in our opinion, are necessary to present fairly the financial information set forth in those statements. The results for any interim period are not necessarily indicative of the results that may be expected for the full year and our historical unaudited results are not necessarily indicative of the results that should be expected in any future period.
15
Table of Contents
You should read the following summary historical consolidated financial and other data below together with the information under “Capitalization,” “Selected Historical Consolidated Financial and Other Data,” “Management’s Discussion and Analysis of Financial Condition and Results of Operations,” our audited consolidated financial statements and related notes thereto and our unaudited condensed consolidated financial statements and related notes thereto, each included elsewhere in this prospectus.
| Fiscal Year Ended | 26-Week Period Ended | |||||||||||||||
| June 2, 2018 | June 1, 2019 | December 1, 2018 |
November 30, 2019 |
|||||||||||||
| (In thousands, except share and per share amounts) | ||||||||||||||||
| Consolidated Statements of Operations Data(1): |
||||||||||||||||
| Revenue |
$ | 601,566 | $ | 686,576 | $ | 351,462 | $ | 403,083 | ||||||||
| Cost of sales |
326,218 | 359,372 | 181,499 | 218,200 | ||||||||||||
|
|
|
|
|
|
|
|
|
|||||||||
| Gross profit |
275,348 | 327,204 | 169,963 | 184,883 | ||||||||||||
| Selling, general and administrative expense |
249,875 | 264,674 | 128,481 | 145,992 | ||||||||||||
|
|
|
|
|
|
|
|
|
|||||||||
| Operating income |
25,473 | 62,530 | 41,482 | 38,891 | ||||||||||||
| Interest expense, net |
20,854 | 21,893 | 10,344 | 12,106 | ||||||||||||
| Loss on debt modification and extinguishment |
— | 3,075 | — | — | ||||||||||||
| Other (income), net |
(216 | ) | (342 | ) | (189 | ) | (127 | ) | ||||||||
|
|
|
|
|
|
|
|
|
|||||||||
| Income before income taxes |
4,835 | 37,904 | 31,327 | 26,912 | ||||||||||||
| Income tax (benefit) expense |
(18,268 | ) | 4,767 | 1,878 | 2,147 | |||||||||||
|
|
|
|
|
|
|
|
|
|||||||||
| Net income |
$ | 23,103 | $ | 33,137 | $ | 29,449 | $ | 24,765 | ||||||||
|
|
|
|
|
|
|
|
|
|||||||||
| Per Share Data(2): |
||||||||||||||||
| Net income per share attributable to common stockholders—basic and diluted |
$ | 23,102.82 | $ | 33,136.97 | $ | 29,448.90 | $ | 24,764.66 | ||||||||
| Weighted average common shares outstanding—basic and diluted |
1,000 | 1,000 | 1,000 | 1,000 | ||||||||||||
| Fiscal Year Ended | 26-Week Period Ended | |||||||||||||||
| June 2, 2018 | June 1, 2019 | December 1, 2018 |
November 30, 2019 |
|||||||||||||
| (In thousands, except percentages) | ||||||||||||||||
| Consolidated Balance Sheet Data (end of period)(1): |
||||||||||||||||
| Cash |
$ | 23,476 | $ | 37,862 | $ | 10,786 | ||||||||||
| Total assets |
538,649 | 587,858 | 737,029 | |||||||||||||
| Total debt(3) |
300,847 | 280,247 | 277,396 | |||||||||||||
| Total stockholders’ equity |
132,552 | 164,789 | 189,298 | |||||||||||||
| Consolidated Statements of Cash Flow Data(1): |
||||||||||||||||
| Cash flows provided by (used in): |
||||||||||||||||
| Operating activities |
$ | 50,491 | $ | 55,168 | $ | 30,827 | $ | (12,829 | ) | |||||||
| Investing activities |
(15,991 | ) | (17,745 | ) | (8,628 | ) | (10,580 | ) | ||||||||
| Financing activities |
(23,219 | ) | (22,929 | ) | (12,490 | ) | (3,625 | ) | ||||||||
| Other Financial Data and Operational Data: |
||||||||||||||||
| North America DTC comparable sales growth (decline) |
(0.1 | )% | 13.0 | % | 13.1 | % | 3.0 | % | ||||||||
| Adjusted EBITDA(4) |
$ | 60,072 | $ | 94,774 | $ | 57,117 | $ | 62,370 | ||||||||
| Adjusted EBITDA margin(4) |
10.0 | % | 13.8 | % | 16.3 | % | 15.5 | % | ||||||||
16
Table of Contents
| (1) | See Notes 2 and 3 to our audited consolidated financial statements included elsewhere in this prospectus for additional information regarding the impact of our adoption of Topic 606 on our consolidated financial statements. See Notes 2 and 9 to our unaudited condensed consolidated financial statements included elsewhere in this prospectus for additional information regarding the impact of our adoption of Topic 842 on our unaudited condensed consolidated financial statements. |
| (2) | See Note 18 to our audited consolidated financial statements and Note 14 to our unaudited condensed consolidated financial statements included elsewhere in this prospectus for an explanation of the calculations of net income per share attributable to common stockholders, basic and diluted. |
| (3) | Total debt equals current and non-current portions of long-term debt, net of discount and debt issuance costs. |
| (4) | We define Adjusted EBITDA as net income, plus interest expense, net, income tax (benefit) expense and depreciation and amortization, net, further adjusted to exclude impairment charges, (gain) loss on disposals of property and equipment, loss on debt modification and extinguishment, other (income), net and certain IPO costs. We describe these adjustments reconciling net income to Adjusted EBITDA in the table below. We define Adjusted EBITDA margin as Adjusted EBITDA as a percentage of revenue. |
We present Adjusted EBITDA and Adjusted EBITDA margin because we believe they are useful indicators of our operating performance. Our management uses Adjusted EBITDA and Adjusted EBITDA margin principally as measures of our operating performance and believes that Adjusted EBITDA and Adjusted EBITDA margin are useful to investors because they are frequently used by analysts, investors and other interested parties to evaluate companies in our industry. We also believe Adjusted EBITDA and Adjusted EBITDA margin are useful to our management and investors as a measure of comparative operating performance from period to period.
Adjusted EBITDA and Adjusted EBITDA margin are non-GAAP financial measures and should not be considered as alternatives to net income as a measure of financial performance or cash provided by operating activities as a measure of liquidity, or any other performance measure derived in accordance with GAAP, and they should not be construed as an inference that our future results will be unaffected by unusual or non-recurring items. In evaluating Adjusted EBITDA and Adjusted EBITDA margin, you should be aware that in the future we may incur expenses that are the same as or similar to some of the adjustments in this presentation. Our presentation of Adjusted EBITDA and Adjusted EBITDA margin should not be construed to imply that our future results will be unaffected by any such adjustments. Management compensates for these limitations by primarily relying on our GAAP results in addition to using Adjusted EBITDA and Adjusted EBITDA margin as a supplement.
Our Adjusted EBITDA measures have limitations as analytical tools, and you should not consider them in isolation, or as substitutes for analysis of our results as reported under GAAP. Some of these limitations are:
| • | they do not reflect costs or cash outlays for capital expenditures or contractual commitments; |
| • | they do not reflect changes in, or cash requirements for, our working capital needs; |
| • | they do not reflect the interest expense, net or the cash requirements necessary to service interest or principal payments on our debt; |
| • | they do not reflect period-to-period changes in taxes, income tax expense or the cash necessary to pay income taxes; |
| • | they do not reflect the impact of earnings or charges resulting from matters we consider not to be indicative of our ongoing operations; |
| • | although depreciation and amortization are non-cash charges, the assets being depreciated and amortized will often have to be replaced in the future, and they do not reflect cash requirements for such replacements; and |
17
Table of Contents
| • | other companies in our industry may calculate these measures differently than we do, limiting their usefulness as comparative measures. |
Because of these limitations, Adjusted EBITDA and Adjusted EBITDA margin should not be considered as measures of discretionary cash available to invest in business growth or to reduce indebtedness.
The following table provides a reconciliation of net income to Adjusted EBITDA for the periods presented:
| Fiscal Year Ended | 26-Week Period Ended | |||||||||||||||
| June 2, 2018 | June 1, 2019 | December 1, 2018 |
November 30, 2019 |
|||||||||||||
| (In thousands, except percentages) | ||||||||||||||||
| Net income |
$ | 23,103 | $ | 33,137 | $ | 29,449 | $ | 24,765 | ||||||||
| Interest expense, net |
20,854 | 21,893 | 10,344 | 12,106 | ||||||||||||
| Income tax (benefit) expense |
(18,268) | 4,767 | 1,878 | 2,147 | ||||||||||||
| Depreciation and amortization, net(a) |
34,667 | 32,152 | 15,699 | 15,768 | ||||||||||||
| Impairment charges(b) |
— | 192 | — | 1,643 | ||||||||||||
| (Gain) loss on disposals of property and equipment(c) |
(68) | (100) | (64) | (6) | ||||||||||||
| Loss on debt modification and extinguishment(d) |
— | 3,075 | — | — | ||||||||||||
| Other (income), net(e) |
(216) | (342) | (189) | (127) | ||||||||||||
| IPO costs(f) |
— | — | — | 6,074 | ||||||||||||
|
|
|
|
|
|
|
|
|
|||||||||
| Adjusted EBITDA |
$ | 60,072 | $ | 94,774 | $ | 57,117 | $ | 62,370 | ||||||||
|
|
|
|
|
|
|
|
|
|||||||||
| Revenue |
$ | 601,566 | $ | 686,576 | $ | 351,462 | $ | 403,083 | ||||||||
| Adjusted EBITDA margin |
10.0% | 13.8% | 16.3% | 15.5% | ||||||||||||
| (a) | Excludes amortization included in interest expense, net. |
| (b) | Represents non-cash store impairment charges. |
| (c) | Represents the non-cash gain on disposals of property and equipment. |
| (d) | Represents the loss on debt modification and extinguishment in connection with the refinancing of the Term Loan Facility in February 2019. |
| (e) | Primarily represents foreign currency transaction (gains) and losses associated with our international subsidiaries and realized and unrealized (gains) and losses on our foreign currency forward contracts. |
| (f) | Represents non-recurring expenses primarily composed of legal, accounting and professional fees incurred in connection with this offering, which are included within selling, general and administrative expenses. |
18
Table of Contents
Investing in our common stock involves a high degree of risk. You should carefully consider the risks and uncertainties described below and the other information set forth in this prospectus before deciding to invest in shares of our common stock. If any of the following risks actually occurs, our business, results of operations and financial condition may be materially adversely affected. In such case, the trading price of our common stock could decline and you may lose all or part of your investment.
Risks Related to Our Business
Our success depends on our ability to maintain the value and reputation of our brand.
Our success depends in large part on the value and reputation of our brand, which is integral to our business and the implementation of our strategies for expanding our business. Maintaining, promoting and positioning our brand will depend largely on the success of our marketing and merchandising efforts and our ability to provide consistent, high-quality products and services, and may require us to make substantial investments in areas such as research and development, store operations, community relations and employee training. Customer complaints or negative publicity about our products, product delivery times, our sites or in-store shopping experience, customer data handling and security practices or customer support, especially on blogs, social media platforms and our sites, could rapidly and severely diminish consumer, partner and supplier confidence in us and consumer use of our sites and result in harm to our brand and reduced demand for our products. As we expand into new markets and as the environment becomes increasingly competitive, consumers in these markets may not accept our brand image and maintaining and enhancing our brand may become increasingly difficult and expensive.
Our brand value also depends on our ability to maintain a positive consumer perception of our corporate integrity and culture. Negative claims or publicity involving us, our wholesale partners, our distributors or our products, or the production methods of any of our suppliers, could seriously damage our reputation and brand image, undermine consumer confidence in our brand and reduce long-term demand for our products, regardless of whether such claims or publicity are accurate. Social media, which accelerates and potentially amplifies the scope of negative claims or publicity, can increase the challenges of responding to negative claims or publicity. Social media influencers or other endorsers of our products or third parties with whom we maintain relationships or collaborate could engage in behavior, or use their platforms to communicate directly with consumers in a manner, that reflects poorly on our brand and may be attributed to us or otherwise adversely affect us. Any harm to our brand and reputation could adversely affect our business, results of operations and financial condition.
If we fail to adequately continue to connect with our consumer base, it could have a material adverse effect on our business, results of operations and financial condition.
Our marketing and promotional programs are important in capturing the interest of consumers and attracting them to our sites and/or stores and encouraging purchases by consumers. If we fail to successfully develop and implement marketing, advertising and promotional strategies in new and existing markets, we may be unable to achieve and maintain brand awareness and consumer traffic to our sites and/or stores may be reduced.
We believe that much of the growth in our customer base to date has originated from our marketing strategy, including social media and other digital marketing efforts. For example, we maintain Facebook, Instagram, Twitter, YouTube and Snapchat accounts. We also maintain relationships with social media influencers. If we are unable to cost-effectively use social media platforms as marketing tools, our ability to acquire new customers and our financial condition may suffer. Unauthorized or inappropriate use of our social media channels could result in harmful publicity or negative consumer experiences, which could have an adverse impact on the effectiveness of our marketing in these channels. In addition, substantial negative commentary by others on social media platforms could have an adverse impact on our ability to successfully connect with consumers. Furthermore, as laws and regulations rapidly evolve to govern the use of these platforms, the failure
19
Table of Contents
by us, our employees, our network of social media influencers or third parties acting at our direction to comply with applicable laws and regulations could subject us to regulatory investigations, lawsuits, including class actions, liability, fines or other penalties and could result in a material adverse effect on our business, results of operations and financial condition. In addition, an increase in the use of social media platforms for product promotion and marketing may cause an increase in our burden to monitor compliance of such platforms, and increase the risk that such materials could contain problematic product or marketing claims in violation of applicable regulations. For example, in some cases, the Federal Trade Commission, or the FTC, has sought enforcement action where an endorsement has failed to clearly and conspicuously disclose a financial relationship or material connection between an influencer and an advertiser. We do not prescribe what our influencers post, and if we were held responsible for the content of their posts or their actions, we could be forced to alter our practices, which could have an adverse impact on our business.
Moreover, we rely in part upon third parties, such as search engines and product reviewers, for both paid and unpaid services and we are unable to fully control their efforts. We obtain a significant amount of traffic via search engines and, therefore, rely on search engines such as Google to direct traffic to our sites. Search engines frequently update and change the algorithm that determines the placement and display of a user’s search results, such that the purchased or algorithmic placement of links to our site may be negatively affected. A search engine could, for competitive or other purposes, alter its algorithms or results in a manner that negatively affects our paid or non-paid search ranking and competitive dynamics, limiting the effectiveness of search engine marketing or search engine optimization.
As digital commerce and social networking continue to rapidly evolve, we must continue to establish relationships with these channels and may be unable to develop or maintain these relationships on acceptable terms. If we are unable to cost-effectively drive traffic to our stores and sites, our ability to acquire and retain customers and our financial condition would suffer.
Furthermore, we establish relationships with public figures to promote our products, as well as to establish product authenticity with consumers. However, as competition in our industry has evolved, the costs associated with establishing and retaining such relationships have increased. If we are unable to maintain our current associations with public figures, or to do so at a reasonable cost, we could lose the visibility associated with our products, and we may be required to modify and substantially increase our marketing investments. As a result, our brand, sales, expenses and profitability could be harmed. In addition, a failure to continue to correctly identify promising public figures to use and endorse our products or a failure to enter into cost-effective endorsement arrangements with prominent public figures could adversely affect our brand, sales and profitability.
Changes in the amount and degree of promotional intensity or merchandising strategy by our competitors could cause us to have difficulties in retaining existing customers and attracting new customers. If the efficacy of our marketing or promotional activities declines, if we are not able to cost-effectively manage our marketing expenses, if such activities of our competitors are more effective than ours, or if for any other reason we lose the loyalty of our customers, it could have a material adverse effect on our business, results of operations and financial condition.
An overall decline in the health of the economy and other factors impacting consumer spending, such as natural disasters and fluctuations in inflation and foreign currency exchange rates may affect consumer purchases, reduce demand for our products and materially harm our business, results of operations and financial condition.
Our business depends on consumer demand for our products and, consequently, is sensitive to a number of factors that influence consumer confidence and spending, such as general current and future economic and political conditions, consumer disposable income, energy and fuel prices, recession and fears of recession, unemployment, minimum wages, availability of consumer credit, consumer debt levels, conditions in the housing
20
Table of Contents
market, interest rates, tax rates and policies, inflation, war and fears of war, inclement weather, natural disasters, terrorism, active shooter situations, outbreak of viruses, widespread illness, infectious diseases, contagions and the occurrence of unforeseen epidemics (including the outbreak of the coronavirus and its potential impact on our financial results) and consumer perceptions of personal well-being and security.
Consumer purchases of discretionary items such as footwear, apparel and accessories, including our products, often decline during periods when economic or market conditions are unstable or weak. Reduced consumer confidence and spending cutbacks may result in reduced demand for our merchandise, which could result in lost sales and/or excessive markdowns. Reduced demand also may require increased selling and promotional expenses, impacting our profitability. Changes in areas around our store locations that result in reductions in consumer foot traffic or otherwise render the locations unsuitable could cause our sales to be less than expected. Prolonged or pervasive economic downturns could slow the pace of new store openings, reduce comparable sales or cause us to close certain stores, which could have a material negative impact on our financial performance. When the retail economy weakens or as consumer behavior shifts, retailers may be more cautious with orders. A slowing or changing economy in our key markets could adversely affect the financial health of our wholesale partners, which in turn could have an adverse effect on our results of operations and financial condition.
Our plans to improve and expand our product offerings may not be successful, and implementation of these plans may divert our operational, managerial and administrative resources, which could harm our competitive position and reduce our revenue and profitability.
We plan to grow our business by, among other things, scaling our core franchises, growing our offerings in Sport, Casual and Outdoor use occasions and expanding our lifestyle accessories products. The principal risks to our ability to successfully carry out our strategy are that:
| • | introduction of new products may be delayed, including due to interruptions or difficulties affecting the ability of our suppliers to timely manufacture, distribute and ship new products, which may allow our competitors to introduce similar products in a more timely fashion and hurt our goal to be viewed as a leader in product innovation; |
| • | sales of our new products may not be as high as we anticipate due to lack of acceptance of the products themselves or their price, or limited effectiveness of our marketing strategies; |
| • | we may experience a decrease in sales of certain existing products as a result of newly launched products; |
| • | if our expanded product offerings fail to maintain and enhance our distinctive brand identity, our brand image may be diminished and our sales may decrease; and |
| • | incorporation of novel technologies into our products may not be accepted by consumers or our wholesale partners or may be inferior to similar products offered by our competitors. |
In addition, our ability to successfully carry out our plans to improve and expand our product offerings may be affected by economic and competitive conditions, changes in consumer spending patterns and changes in consumer preferences and style trends. These plans could be abandoned and could cost more than anticipated, any of which could impact our competitive position and reduce our revenue and profitability.
We rely on technical innovation and high-quality products to compete in the market for our products.
Technical innovation and quality control in the design and manufacturing process of footwear and lifestyle accessories is essential to the commercial success of our products. Research and development play a key role in technical innovation. If we fail to introduce technical innovation in our products, we may not be able to generate sufficient consumer interest in our products to remain competitive, and if we experience problems with the
21
Table of Contents
quality of our products, we may incur substantial expense to remedy such issues and our brand may be adversely affected. Our results of operations would also suffer if our innovations do not respond to the needs of our consumers, are not appropriately timed with market opportunities or are not effectively brought to market.
Our business is highly dependent upon our ability to identify and respond to new and changing consumer trends and preferences to accurately forecast demand.
Consumer tastes are volatile and can change rapidly. Our success depends in large part upon our ability to effectively identify and respond to changing consumer demands and to translate these trends and demands into appropriate, saleable product offerings in a timely, cost-efficient manner. In addition, we must create products at a range of price points that appeal to the consumers of both our sites and stores and our wholesale partners and distributors across our diverse geographic regions.
Our failure to identify and react appropriately to new and changing trends or consumer preferences or to accurately forecast demand for certain product offerings could lead to, among other things, excess inventories or inventory shortages, higher markdowns and write-offs of unsold merchandise. This could have an adverse effect on the image and reputation of our brand and could adversely affect our gross margins. If consumers no longer find our offerings appealing, or if we are unable to timely update our offerings to meet current trends and consumer demands, consumers may make fewer or less valuable purchases in the future. A decrease in the number of customers who make repeat purchases or a decrease in their spending could negatively impact our results of operations. Further, our future success will depend in part on our ability to increase sales to our existing customers over time and to attract new customers to our brand, and if we are unable to do so, our business, results of operations and financial condition may be materially adversely affected. If we fail to generate repeat purchases or maintain high levels of consumer engagement and average order value, our business, growth prospects, results of operations and financial condition could be materially adversely affected.
In addition, consumer preferences regarding the shopping experiences, including where and how they shop, continue to rapidly evolve. If we or our wholesale partners do not provide consumers with an attractive in-store experience or an engaging and user-friendly digital commerce platform, demand for our products may decrease and our brand image, business, results of operations and financial condition may be adversely affected.
We operate in highly competitive markets, and may lose market share if we do not compete successfully.
The footwear and lifestyle accessories markets are highly competitive and fragmented. We compete against a wide range of designers and manufacturers of footwear and lifestyle accessories, both domestic and international, across a wide range of retail price points. We also compete with other companies for the production capacity of suppliers that manufacture our products. See “Business—Our Competition.” Competition may result in pricing pressure, reduced profit margins or lost market share or a failure to grow our market share, any of which could substantially harm our business, results of operations and financial condition. The retail landscape is changing as a result of changes in consumers’ shopping habits, as well as technical innovation in the design and manufacturing process within the retail industry.
Some of our competitors are larger companies and have greater financial and operational resources, stronger brand recognition and broader geographic presence than we do. As a result, they may be able to engage in extensive and prolonged price promotions or otherwise offer more competitive prices than we do, which may adversely affect our business. They may also be able to spend more than we do for advertising and social media promotion. We may be at a substantial disadvantage to larger competitors with greater economies of scale. If our costs are greater compared to those of our competitors, the pricing of our products may not be as attractive, thus depressing sales or the profitability of our products. Our competitors may expand into markets in which we currently operate and we remain vulnerable to the marketing power and high level of consumer recognition of these larger competitors and to the risk that these competitors or others could attract our consumer base. In addition, if any of our competitors were to consolidate operations, such consolidation would exacerbate the aforementioned risks.
22
Table of Contents
In addition, retailers have limited resources and floor space, and we must compete with others to develop relationships with them. Increased competition by existing and future competitors could result in reductions in floor space in retail locations, reductions in sales or reductions in the prices of our products, and if retailers have better sell through or earn greater margins from our competitors’ products, they may favor the display and sale of those products.
Our failure to successfully manage our digital commerce business could adversely impact our business and profitability.
In addition to our product expansion strategy, we plan to continue to expand our digital platforms through marketing and other investments to drive new customer acquisition and retention and grow our sales to digital retailers.
As a digital commerce retailer, we encounter risks and difficulties frequently experienced by Internet-based businesses. The successful operation of our digital commerce business, as well as our ability to provide a positive shopping experience that will generate orders and drive subsequent visits, depends on operating an appealing digital platform and efficient and uninterrupted operation of our order-taking and distribution operations. Risks associated with our digital commerce businesses include:
| • | uncertainties associated with our sites, including changes in required technology interfaces, website/application downtime and other technical failures, costs and technical issues as we upgrade our software, inadequate system capacity, computer viruses, human error, security breaches and legal claims related to our digital commerce operations; |
| • | disruptions in Internet and telephone service or power outages; |
| • | reliance on third parties for computer hardware and software, as well as delivery of merchandise to our customers and wholesale partners; |
| • | rapid technology changes; |
| • | credit or debit card fraud and other payment processing related issues; |
| • | changes in applicable federal, state and international regulations; |
| • | liability for online content; |
| • | cybersecurity and consumer privacy concerns and regulations; and |
| • | natural disasters or adverse weather conditions. |
We expect to keep up to date with competitive technology trends, which may include the use of new or improved technology, creative user interfaces and other digital commerce marketing tools such as paid search and mobile applications, among others. In addition, the number of people who access the Internet through devices other than personal computers, including mobile phones, smartphones, notebooks, tablets, video game consoles and television set-top devices, has increased dramatically in the past few years. The smaller screen size, functionality and memory associated with some alternative devices may make the use of our sites and purchasing our products more difficult. The versions of our sites developed for these devices may not be compelling to consumers. As new mobile devices and platforms are released, it is difficult to predict the problems we may encounter in developing applications for alternative devices and platforms and we may need to devote significant resources to the creation, support and maintenance of such applications. If we are unable to attract consumers to our sites through these devices or are slow to develop a version of our sites that is more compatible with alternative devices, we may fail to capture a significant share of consumers in the markets in which we operate, which could adversely affect our business. It is time consuming and costly to keep pace with rapidly changing and continuously evolving technology and our efforts may not increase sales or attract customers.
Our competitors, some of whom have greater resources than we do, may also be able to benefit from changes in digital commerce technologies, which could harm our competitive position. If we are unable to allow
23
Table of Contents
real-time and accurate visibility to product availability when consumers are ready to purchase, quickly and efficiently fulfill their orders using the distribution and payment methods they demand, provide a convenient and consistent experience for customers regardless of the ultimate sales channel or effectively manage our digital commerce sales, our ability to compete and our results of operations could be adversely affected.
Furthermore, if our digital commerce business and/or our sales to digital retailers successfully grow, they may do so in part by attracting existing customers, rather than new customers, who choose to purchase products from us or our wholesale partners online rather than from our brick and mortar stores, thereby detracting from the financial performance of our stores.
If we fail to open and operate new stores in a timely and cost-effective manner or fail to successfully enter new markets, our financial performance could be materially and adversely affected.
Our growth strategy depends on growing our store base and expanding our operations in existing and new geographic regions and operating our new stores successfully. We cannot assure you that our contemplated expansion will be successful.
Our ability to successfully open and operate new stores depends on many factors, including, among others, our ability to:
| • | identify suitable store locations, the availability of which is outside of our control; |
| • | negotiate acceptable lease terms, including the ability to renew or extend upon favorable terms; |
| • | address regulatory, competitive, merchandising, marketing, distribution and other challenges encountered in connection with expansion into new markets; |
| • | hire, train and retain an expanded workforce of store managers and other personnel; |
| • | maintain an adequate distribution footprint, information systems and other operational capabilities; |
| • | successfully integrate new stores into our existing management structure and operations, including information system integration; |
| • | source sufficient levels of inventory at acceptable costs; |
| • | obtain necessary permits and licenses; |
| • | construct and open our stores on a timely basis; |
| • | generate sufficient levels of cash or obtain financing on acceptable terms to support our expansion; |
| • | achieve and maintain brand awareness in new and existing markets; and |
| • | identify and satisfy the merchandise and other preferences of our consumers. |
Our failure to effectively address challenges such as these could adversely affect our ability to successfully open and operate new stores in a timely and cost-effective manner. Further, we will have pre-operating costs and we may have initial losses while new stores commence operations.
In addition, there can be no assurance that newly opened stores will achieve sales or profitability levels comparable to those of our existing stores in the time periods estimated by us, or at all. We may not be able to maintain the levels of North America DTC comparable sales that we have experienced recently. A variety of factors affect North America DTC comparable sales, including consumer trends, competition, current economic conditions, pricing, inflation, the timing of the release of new merchandise and promotional events, changes in our merchandise mix, the success of marketing programs and weather conditions. These factors may cause our North America DTC comparable sales results to be materially lower than recent periods and our expectations, which could harm our results of operations. If our stores fail to achieve, or are unable to sustain, acceptable total
24
Table of Contents
sales and profitability levels, our business may be materially harmed and we may incur significant costs associated with the early closure of such stores. Our plans to accelerate the growth of our store base may increase this risk.
Accordingly, we cannot assure you that we will achieve our planned growth or, even if we are able to grow our store base as planned, that our new stores will perform as expected. Our failure to implement our growth strategy and to successfully open and operate new stores in the time frames and at the costs estimated by us could have a material adverse effect on our business, results of operations and financial condition.
We are dependent on domestic and international wholesale partners for a significant portion of our sales.
We derive significant revenue from our network of domestic and international wholesale partners, consisting of digital pureplay retailers, specialty retailers and department stores, among others. A decision by any of our major wholesale partners, whether motivated by marketing strategy, competitive conditions, financial difficulties or otherwise, to decrease significantly the amount of merchandise purchased from us or our licensing partners, or to change their manner of doing business with us or our licensing partners, could substantially reduce our revenue and have a material adverse effect on our profitability. In addition, store closings by our wholesale partners shrink the number of doors carrying our products, while the remaining stores may purchase a smaller amount of our products and/or may reduce the retail floor space designated for our products. We also rely on our wholesale partners to train their employees with respect to our products and to ensure a successful consumer experience. If any disputes with our wholesale partners arose, if we were to lose any of our key wholesale partners or if any of our key wholesale partners consolidate and/or gain greater market power, our business, results of operations and financial condition may be materially adversely affected. In addition, we may be similarly adversely impacted if any of our key wholesale partners experience any operational difficulties or generate less traffic.
We enter into vendor agreements with our wholesale partners whereby we negotiate and agree on, among other things, packaging, delivery and cancellation terms. However, there is no minimum guaranty or commitment to purchase from our wholesale partners. As a result, we rely on our wholesale partners’ continuing demand for our products and our position in the market for all purchase orders. To assist in the scheduling of production and the shipping of our products, we offer our wholesale partners the opportunity to place orders five to six months ahead of delivery under our futures ordering program. These advance orders may be canceled under certain conditions, and the risk of cancellation may increase when dealing with financially unstable retailers or retailers struggling with economic uncertainty. In addition, certain of our wholesale partners, particularly those located in the United States, have become highly promotional and have aggressively marked down their merchandise. Such promotional activity could negatively impact our business. If our wholesale partners change their pricing and margin expectations, change their business strategies as a result of industry consolidation or otherwise, maintain and seek to grow their own private-label competitive offerings, reduce the number of brands they carry or amount of shelf space they allocate to our products, or allocate greater shelf space to, or increase their advertising or promotional efforts for, our competitors’ products, our sales could decrease and our business, results of operations and financial condition may be materially adversely affected.
Certain of our wholesale partners may from time to time experience financial difficulties, including bankruptcy or insolvency. If our wholesale partners suffer significant financial difficulty, they may reduce their orders from us or stop purchasing from us and/or be unable to pay the amounts due to us timely or at all, which could have a material adverse effect on our ability to collect on receivables and our results of operations. It is possible that wholesale partners may contest their contractual obligations to us under bankruptcy laws or otherwise. Further, we may have to negotiate significant discounts and/or extended financing terms with these wholesale partners in such a situation. If we are unable to collect upon our accounts receivable as they come due in an efficient and timely manner, our business, results of operations and financial condition may be materially adversely affected. In addition, product sales are dependent in part on high-quality merchandising and an appealing retail environment to attract consumers, which requires continuing investments by retailers. Retailers
25
Table of Contents
that experience financial difficulties may fail to make such investments or delay them, resulting in lower sales and orders for our products. We also face risk from international wholesale partners that file for bankruptcy protection in foreign jurisdictions, as the application of foreign bankruptcy laws may be more difficult to predict.
Consolidations among our wholesale partners would concentrate our credit risk with a relatively small number of retailers, and, if any of these retailers were to experience a shortage of liquidity or consumer behavior shifts away from traditional retail, it would increase the risk that their outstanding payables to us may not be paid. In addition, increasing market share concentration among one or a few retailers in a particular country or region increases the risk that if any one of them substantially reduces their purchases of our products, we may be unable to find a sufficient number of other retail outlets for our products to sustain the same level of sales and revenue.
Our business is subject to risks associated with our international distribution partners.
We rely on our international distributors to understand local market conditions, to diligently sell our products and to comply with local laws and regulations, including applicable anti-bribery and anti-corruption laws. The operation of local laws and our agreements with distributors can make it difficult for us to change quickly from a distributor who we feel is underperforming. If we do terminate an independent distributor, we may lose our customers who have been dealing with that distributor. We do not have local staff in many of the areas covered by independent distributors, which may make it difficult for us to monitor our distributors’ performance. Actions by independent distributors that are beyond our control could result in flat or declining sales in that geography, harm to our reputation or our products or legal liability. In addition, our international expansion depends on our ability to identify and maintain regional distributor relationships in new and existing geographies, and our failure to so identify and maintain such relationships may adversely affect our growth and financial performance.
We are subject to the risk our licensees may not generate expected sales or maintain the value of our brands.
We currently license, and expect to continue licensing, certain of our proprietary rights, such as trademarks, to third parties. If our licensees fail to successfully market and sell licensed products, or fail to obtain sufficient capital or effectively manage their business operations, customer relationships, labor relationships, supplier relationships or credit risks, it could adversely affect our revenue, both directly from reduced royalties received and indirectly from reduced sales of our other products.
We also rely on our licensees to help preserve the value of our brand. Although we attempt to protect our brand through approval rights over the design, production processes, quality, packaging, merchandising, distribution, advertising and promotion of our licensed products, we cannot completely control the use of our licensed brand by our licensees. Although we make efforts to police the use of our trademarks by our licensees, we cannot assure you that these efforts will be sufficient to ensure that our licensees abide by the terms of their licenses. In the event that our licensees fail to do so, our trademark rights could be harmed. Moreover, the misuse of our brand by, or negative publicity involving, a licensee could have a material adverse effect on our brand and on us.
We may not be able to adequately protect our intellectual property and we may be accused of infringing intellectual property or other proprietary rights of third parties, which could harm the value of our brand and adversely affect our business.
We rely on a combination of patents, trademarks, trade secrets and contractual provisions to protect our intellectual property. Patents and our other intellectual property rights are important to our business and our ability to compete effectively with other companies. Our efforts to protect our intellectual property and other proprietary rights may not be sufficient. We cannot be sure that:
| • | our pending patent applications will result in the issuance of patents; |
26
Table of Contents
| • | patents issued or licensed to us in the past or in the future will not be challenged or circumvented by competitors or others; |
| • | our patents will remain valid and enforceable or will be sufficient to preclude our competitors or others from introducing technologies and products similar to those covered by our patents and patent applications; |
| • | our competitors will not independently develop products or technologies that are equivalent or superior to ours; or |
| • | competitors will not otherwise gain access to or circumvent our trade secrets or other confidential information. |
In addition, our ability to enforce and protect our intellectual property rights may be limited in certain countries outside the United States because of the differences in foreign laws concerning proprietary rights, which could make it easier for competitors to capture a market position in such countries by utilizing technologies and products that are similar to those developed or owned by or licensed to us.
We rely on our trademark registrations and common law trademark rights to distinguish our products from the products of our competitors, and have registered or applied to register many of our trademarks. We cannot assure you that our trademark applications will be approved. Third parties may also oppose our trademark applications, or otherwise challenge our use of the trademarks. In the event that our trademarks are successfully challenged, we could be forced to rebrand our products, which could result in loss of brand recognition. Furthermore, there are jurisdictions that do not recognize common law trademark rights, and third parties in these jurisdictions may register marks similar or identical to our own and sue us to preclude our use of these trademarks. Moreover, common law trademarks may be more difficult to enforce than registered trademarks in the United States because they are not entitled to, among other things, a presumption of ownership and exclusive rights on a nationwide basis, and certain statutory remedies (including the right to record the marks with the U.S. Customs and Border Patrol to block importation of infringing goods from overseas). In addition, we cannot assure you that competitors will not infringe our trademarks, or that we will have adequate resources to fully enforce our trademarks.
Moreover, we cannot guarantee we will successfully enjoin infringers. We periodically discover counterfeit reproductions of our products or products that otherwise infringe our intellectual property rights. If we are unsuccessful in enforcing our intellectual property rights, continued sales of these products could adversely affect our sales and our brand and could result in a shift of consumer preference away from our products. Competitors also may harm our sales by designing products that mirror the capabilities of our products without infringing or otherwise violating our intellectual property rights. Confidentiality or other agreements to which we are a party may be breached, and the remedies thereunder may not be sufficient to protect our rights. Our failure to obtain or maintain adequate protection of our intellectual property rights for any reason could have a material adverse effect on our business, results of operations and financial condition. Any litigation to enforce our rights could be costly, divert attention of management, and may not be successful.
We are also at risk of claims by others that we have infringed their copyrights, trademarks or patents, or improperly used or disclosed their trade secrets, or otherwise infringed or violated their proprietary rights, such as the right of publicity. The costs of supporting any litigation or disputes related to these claims can be considerable, and we cannot assure you that we will achieve a favorable outcome of any such claim. If any such claim is valid, we may be compelled to cease sale of certain products and/or our use of such proprietary rights, enter into royalty or licensing agreements in order to obtain the right to use a third-party’s intellectual property, pay damages or indemnify our wholesale partners, which could adversely affect our business, results of operations and financial condition. Even if such claims were not valid, defending them could be expensive and distracting.
We may not be able to successfully implement our growth strategies on a timely basis or at all.
Our future success depends, in large part, on our ability to implement our growth strategies, including expanding our product offerings to earn more share of customers’ closets, continuing to engage in customer
27
Table of Contents
acquisition and retention efforts that drive long-term customer relationships and continuing to grow our North America DTC, North America wholesale and International businesses. Our ability to implement these growth strategies depends, among other things, on our ability to:
| • | expand core franchises and expand our product offerings across use occasions and new lifestyle accessories categories; |
| • | increase our brand recognition by effectively implementing our digital-first marketing strategy; |
| • | increase customer engagement with our digital platform; |
| • | increase our number of active DTC customers across our sites and stores; |
| • | leverage our investments to drive traffic and customer acquisition; |
| • | selectively grow our store fleet; |
| • | expand and diversify our wholesale channel and accelerate partnerships with digital pureplay retailers; and |
| • | enter into distribution and other strategic arrangements with potential distributors of our products. |
We may not be able to successfully implement our growth strategies and may need to change them. If we fail to implement our growth strategies or if we invest resources in a growth strategy that ultimately proves unsuccessful, our business, results of operations and financial condition may be materially and adversely affected.
Our growth strategies could strain our existing resources and cause our performance to suffer.
We continue to experience rapid growth in our headcount and operations, which will continue to place significant demands on our management and our operational and financial resources. Our organizational structure may become more complex as we add additional staff, and as we continue to grow, we must effectively integrate, develop and motivate a large number of employees. To attract top talent, we have had to offer, and believe we will need to continue to offer, competitive compensation packages. Furthermore, we may not be able to hire new employees quickly enough to meet our needs. If we fail to effectively manage our hiring needs and successfully integrate our new hires, our efficiency and ability to meet our forecasts and our employee morale, productivity and retention could suffer, and our business and results of operations may be adversely affected.
In addition, if we do not effectively manage the growth of our business and operations, the quality of our products and the pace of innovation could suffer, which could negatively affect our brand, business, results of operations and financial condition. To effectively manage our growth, we will need to continue to improve our operational, financial and management controls, and our reporting systems and procedures, by, among other things:
| • | improving our technology infrastructure to maintain the effectiveness of our processes; |
| • | enhancing information and communication systems to ensure that our employees and offices are well-coordinated and can effectively communicate with each other and our users and customers; and |
| • | augmenting our internal controls to ensure timely and accurate reporting of all of our operations. |
These systems enhancements and control improvements will require significant capital expenditures and allocation of valuable management and employee resources. If we fail to implement these improvements effectively, our ability to manage our growth and comply with the rules and regulations that are applicable to public companies will be impaired.
We will require significant capital to fund our expanding business. If we are unable to maintain sufficient levels of cash flow from our operations, we may not be able to execute or sustain our growth strategy or we may require additional financing, which may not be available to us on satisfactory terms or at all.
To support our expanding business and execute our growth strategy, we will need significant amounts of capital, including funds to pay our lease obligations, build out new store spaces, purchase inventory, expand our
28
Table of Contents
distribution and fulfillment network, pay personnel and further invest in our infrastructure and facilities. Further, our plans to grow our store base may create cash flow pressure if new locations do not perform as projected. In the past, we have primarily depended on cash flow from operations to fund our business and growth plans. Upon the closing of this offering, we expect that we will continue to primarily depend on cash flow from operations to fund our business and growth plans. If we do not generate sufficient cash flow from operations, we may need to obtain additional equity or debt financing. Tightening in the credit markets, low liquidity, volatility in the capital markets and lack of confidence in the equity market could result in diminished availability of credit and higher cost of borrowing, making it more difficult to obtain additional financing on terms that are favorable to us, if at all. If such financing is not available to us, or is not available on satisfactory terms, our ability to operate and expand our business could be curtailed and we may need to delay, limit or eliminate planned product expansion or introduction, marketing initiatives, store openings or operations, digital expansion or other elements of our growth strategy.
Our international business operations are subject to risks and uncertainties, including risks arising from currency exchange rate fluctuations, which could adversely affect our operating results.
Our operations outside the United States are subject to certain legal, regulatory, social, political and economic risks inherent in international business operations, including, without limitation:
| • | local product preferences and product requirements; |
| • | different consumer demand dynamics, which may make the merchandise we offer less successful compared to the United States; |
| • | more stringent regulations relating to privacy and data security and access to, or use of, commercial and personal information, particularly in Europe; |
| • | less rigorous protection of intellectual property; |
| • | competition from local incumbents that understand the local market and may operate more effectively; |
| • | navigating shipping and returns in a more fragmented geography, particularly, if the European Union were to lose members or change its policies regarding the flow of goods across country borders; |
| • | trade protection measures, sanctions, quotas, embargoes, import and export licensing requirements, duties, tariffs or surcharges; |
| • | changes in foreign regulatory requirements and tax laws; |
| • | alleged or actual violations of the Foreign Corrupt Practices Act of 1977, or the FCPA, the United Kingdom’s Bribery Act of 2010, or the Bribery Act, and other anti-bribery and anti-corruption laws, rules and regulations in the foreign jurisdictions in which we do business; |
| • | difficulty in establishing, staffing and managing non-U.S. operations; |
| • | differing labor regulations where labor laws may be more advantageous to employees as compared to the United States, as well as increased labor costs; |
| • | complex tax and cash management issues; |
| • | potential tax costs associated with repatriating cash from our non-U.S. subsidiaries; |
| • | political and economic instability and inflation, recession or interest rate fluctuations; and |
| • | longer-term receivables than are typical in the United States and greater difficulty of collecting receivables in certain foreign jurisdictions. |
Doing business in multiple countries requires us to comply with the laws and regulations of the U.S. government and various non-U.S. jurisdictions. Our failure to comply with these rules and regulations may
29
Table of Contents
expose us to liabilities. These laws and regulations may apply to us, individual directors, officers, employees and agents, and may restrict our operations, trade practices, investment decisions and partnering activities. In particular, we are subject to the FCPA, the Bribery Act and other anti-bribery and anti-corruption laws, rules and regulations around the world. The anti-bribery laws generally prohibit covered entities and their intermediaries from engaging in bribery or making other prohibited payments, offers or promises to foreign officials for the purpose of obtaining or retaining business or other advantages. In addition, the FCPA and other anti-bribery and anti-corruption laws impose recordkeeping and internal controls requirements on publicly traded corporations and their foreign affiliates. We face significant risks if we fail to comply with the FCPA and other laws that prohibit improper payments, offers or promises of payment to foreign governments and their officials and political parties by us and other business entities for the purpose of obtaining or retaining business or other advantages. In many foreign countries, particularly in countries with developing economies, it may be a local custom that businesses operating in such countries engage in business practices that are prohibited by the FCPA or other similar laws and regulations. Despite our training and compliance programs, our internal control policies and procedures may not always protect us from violating anti-corruption laws or from acts committed by our employees or by third parties, including, but not limited to, our wholesale partners and distributors. Therefore, there can be no assurance that our employees, agents, wholesale partners and distributors have not and will not take actions that violate our policies or applicable laws, for which we may be ultimately held responsible. Any violation of anti-bribery and anti-corruption laws or allegation of such violations could result in severe criminal or civil sanctions, which could have a material adverse effect on our reputation, business, results of operations and financial condition.
We are also exposed to a variety of market risks, including the effects of changes in foreign currency exchange rates. If the U.S. dollar strengthens in relation to the currencies of other countries where we sell our products, our U.S. dollar reported revenue and income will decrease. In addition, we incur significant costs in foreign currencies and a fluctuation in those currencies’ value can negatively impact manufacturing and selling costs. Changes in the relative values of currencies occur regularly and, in some instances, could have an adverse effect on our results of operations and financial condition.
In addition, certain of these risks may be heightened as a result of changing political climates. The U.S. government has threatened substantial changes to trade agreements and has raised the possibility of imposing significant increases on tariffs on goods imported into the United States, particularly from China. The imposition of additional tariffs by the United States could result in the adoption of tariffs by other countries, leading to a global trade war. For example, throughout 2018 and 2019, the United States and China have been levying tariffs on their respective imports. Such tariffs could have a significant impact on our business. While we may attempt to renegotiate prices with suppliers or diversify our supply chain in response to tariffs, such efforts may not yield immediate results or may be ineffective. We might also consider increasing prices to the end consumer; however, this could reduce the competitiveness of our products and adversely affect revenue. If we fail to manage these dynamics successfully, our gross margins and profitability could be adversely affected.
Further, the United Kingdom’s intended withdrawal from the European Union, or Brexit, has created political and economic uncertainty, particularly in the United Kingdom and the European Union, and this uncertainty may last for years. Our and our distributors’ and wholesale partners’ business could be affected during this period of uncertainty, and perhaps longer, by the impact of Brexit. In addition, our and our distributors’ and wholesale partners’ business could be negatively affected by new trade agreements between the United Kingdom and other countries, including the United States and by the possible imposition of trade or other regulatory barriers in the United Kingdom.
The outbreak, and threat or perceived threat of outbreak, of the coronavirus may negatively impact our sourcing and manufacturing operations and consumer spending, which could adversely affect our business, results of operations and financial condition.
The outbreak of the coronavirus in Greater China could adversely affect our business, results of operations and financial condition. The coronavirus outbreak may materially impact our sourcing and manufacturing
30
Table of Contents
operations as a portion of our products are manufactured in China and materials for our products are sourced in China by our manufacturers within Greater China and in other affected regions. Travel within China and into other countries may be restricted, which may impact our manufacturers’ ability to obtain necessary materials and inhibit travel of our and our manufacturers’ and material suppliers’ employees, which may in turn reduce our work force and that of our manufacturers and material suppliers. As a result of such reduced workforces, potential factory closures, inability to obtain materials, disruptions in the supply chain and potential disruption of transportation of goods produced in China or other countries adversely impacted by the coronavirus outbreak, or threat or perceived threat of such outbreak, we may be unable to obtain adequate inventory or samples sources from these regions, which could adversely affect our business, results of operations and financial condition. Furthermore, our existing suppliers, such as our suppliers located in India and Vietnam, or new suppliers or sources of materials may pass the increase in sourcing costs due to the coronavirus outbreak to us through price increases, thereby impacting our margins. Material changes in the pricing practices of our suppliers could negatively impact our profitability.
In addition, as of February 14, 2020, one of our distributors operates 18 stores in Greater China and has temporarily closed certain locations while its remaining locations are operating with reduced hours and experiencing significantly reduced consumer foot traffic, which we expect will result in lost sales. Moreover, our business, results of operations and financial condition could be further adversely affected if the coronavirus outbreak expands to other countries where we have a significant number of stores, partnerships with regional distributors and wholesalers and/or sourcing and manufacturing operations. If the retail economy weakens and/or consumer behavior shifts due to the coronavirus outbreak or threat or perceived threat of such outbreak, we or our distributors may need to significantly reduce or limit store operations and/or close additional stores and retailers may be more cautious with orders. A slowing or changing economy in the regions adversely affected by the coronavirus outbreak could adversely affect the financial health of our distributors and wholesale partners, which in turn could have an adverse effect on our business, results of operations and financial condition. While this global health emergency is expected to be temporary, the duration and intensity of the disruption is uncertain, including potential broader impacts outside of China if travel and tourist traffic is further restricted and there is a resulting decline in Chinese tourist spending in other regions.
Our products are subject to risks associated with sourcing and manufacturing.
We do not own or operate any of the manufacturing facilities for our products and rely on a concentrated number of international independent suppliers to manufacture all of the products we sell. We source our footwear and selected lifestyle accessories from 12 suppliers across Vietnam, India and China, with our largest supplier representing 27% of the total footwear units we purchased in fiscal year 2019. For our business to be successful, our suppliers must provide us with quality products in substantial quantities, in compliance with regulatory requirements, at acceptable costs and on a timely basis. Our ability to obtain a sufficient selection or volume of merchandise on a timely basis at competitive prices could suffer as a result of any deterioration or change in our supplier relationships or events that adversely affect our suppliers.
There can be no assurance we will be able to detect, prevent or fix all defects that may affect our products manufactured by our suppliers. Failure to detect, prevent or fix defects, or the occurrence of real or perceived quality or safety problems or material defects in our current and future products, could result in a variety of consequences, including a greater number of product returns than expected from customers and our wholesale partners, litigation, product recalls and credit, warranty or other claims, among others, which could harm our brand, results of operations and financial condition. Such problems could hurt our brand image, which is critical to maintaining and expanding our business. Any negative publicity or lawsuits filed against us related to the perceived quality and safety of our products could harm our brand and decrease demand for our products.
If one or more of our significant suppliers were to sever their relationship with us or significantly alter the terms of our relationship, including due to changes in applicable trade policies, we may not be able to obtain replacement products in a timely manner, which could have a material adverse effect on our business, results of operations and financial condition. In addition, if any of our primary suppliers fail to make timely shipments, do not meet our quality standards or otherwise fail to deliver us product in accordance with our plans, there could be a material adverse effect on our results of operations.
31
Table of Contents
Our contractors and suppliers buy raw materials and are subject to wage rates that are oftentimes regulated by the governments of the countries in which our products are manufactured. The raw materials used to manufacture our products are subject to availability constraints and price volatility. There could be a significant disruption in the supply of fabrics or raw materials from current sources or, in the event of a disruption, our suppliers might not be able to locate alternative suppliers of materials of comparable quality at an acceptable price or at all. Our business is dependent upon the ability of our unaffiliated suppliers to locate, train, employ and retain adequate personnel. Our unaffiliated suppliers have experienced, and may continue to experience in the future, unexpected increases in work wages, whether government-mandated or otherwise. Our suppliers may increase their pricing if their raw materials became more expensive. Our suppliers may pass the increase in sourcing costs to us through price increases, thereby impacting our margins. Material changes in the pricing practices of our suppliers could negatively impact our profitability.
In addition, we cannot be certain that our unaffiliated suppliers will be able to fill our orders in a timely manner. If we experience significant increases in demand, or reductions in the availability of materials, or need to replace an existing supplier, there can be no assurance additional supplies of fabrics or raw materials or additional manufacturing capacity will be available when required on terms acceptable to us, or at all, or that any supplier would allocate sufficient capacity to us in order to meet our requirements. In addition, even if we are able to expand existing or find new manufacturing or sources of materials, we may encounter delays in production and added costs as a result of the time it takes to train suppliers in our methods, products, quality control standards and labor, health and safety standards. Any delays, interruption or increased costs in labor or wages, or the supply of materials or manufacture of our products, could have an adverse effect on our ability to meet wholesale partner and customer and consumer demand for our products and result in lower revenue and net income both in the short and long term.
Events that adversely impact our suppliers could impair our ability to obtain adequate and timely supplies. Such events include, among others, difficulties or problems associated with our suppliers’ business, the financial instability and labor problems of suppliers, merchandise quality and safety issues, natural or man-made disasters, inclement weather conditions, war, acts of terrorism and other political instability, economic conditions, transportation delays and shipment issues. Our suppliers may be forced to reduce their production, shut down their operations or file for bankruptcy. Our suppliers may consolidate, increasing their market power. The occurrence of one or more of these events could impact our ability to get products to our customers and/or wholesale partners, result in disruptions to our operations, increase our costs and decrease our profitability.
Global sourcing and foreign trade involve numerous factors and uncertainties beyond our control, including:
| • | increased shipping costs; |
| • | the imposition of additional import or trade restrictions; |
| • | legal or economic restrictions on overseas suppliers’ ability to produce and deliver products; |
| • | increased custom duties and tariffs; |
| • | unforeseen delays in customs clearance of goods; |
| • | more restrictive quotas; |
| • | loss of a most favored nation trading status; |
| • | currency exchange rates; |
| • | transportation delays; |
| • | port of entry issues; and |
| • | foreign government regulations, political instability and economic uncertainties in the countries from which we or our suppliers source our products. |
32
Table of Contents
Our sourcing operations may also be hurt by health concerns regarding the outbreak of viruses, widespread illness, infectious diseases, contagions and the occurrence of unforeseen epidemics (including the outbreak of the coronavirus and its potential impact on our financial results) in countries in which our merchandise is produced. Moreover, negative press or reports about internationally manufactured products may sway public opinion, and thus customer confidence, away from the products sold in our stores. Furthermore, changes in U.S. trade policies, including new restrictions, tariffs or other changes could lead to additional costs, delays in shipments, embargos and other uncertainties that could negatively impact our relationships with our international suppliers and materially adversely affect our business. These and other issues affecting our international suppliers or internationally manufactured merchandise could have a material adverse effect on our business, results of operations and financial condition.
In addition, some of our suppliers may not have the capacity to supply us with sufficient merchandise to keep pace with our growth plans, especially if we need significantly greater amounts of inventory. In such cases, our ability to pursue our growth strategy will depend in part upon our ability to develop new supplier relationships.
Failure of our suppliers or our licensees’ suppliers to use ethical business practices and comply with our code of conduct and laws and regulations could harm our business.
We work with contractors outside of the United States to manufacture our products, and we also have license agreements that permit unaffiliated parties to manufacture or contract for the manufacture of products using our intellectual property. We require the contractors that directly manufacture our products and our licensees that make products using our intellectual property (including, indirectly, their suppliers) to comply with a code of conduct and other environmental, health and safety standards for the benefit of workers. We also require these contractors to comply with applicable standards for product safety. We have partnered with Social Accountability International, a global non-governmental organization, and various third parties to develop a factory code of conduct and dual management systems and compliance audit programs based on local and international standards. Direct and licensee manufacturing partners are audited at least annually based on this standard, and the program is managed through the supply chain software, OSCA. However, we do not control our suppliers and manufacturers or their business, and notwithstanding their contractual obligations, from time to time contractors may not comply with such standards or applicable law or regulation or our licensees may fail to enforce such standards or applicable law or regulation on their contractors. Significant or continuing noncompliance with such standards and laws by one or more contractors could harm our reputation or result in a product recall and, as a result, could have an adverse effect on our sales and financial condition. In addition, we rely on our manufacturers’ and suppliers’ compliance reporting in order to comply with regulations applicable to our products. This is further complicated by the fact that expectations of ethical business practices continually evolve and may be substantially more demanding than applicable legal requirements. Ethical business practices are also driven in part by legal developments and by diverse groups active in publicizing and organizing public responses to perceived ethical shortcomings. Accordingly, we cannot predict how such regulations or expectations might develop in the future and cannot be certain that our guidelines or current practices would satisfy all parties who are active in monitoring our products or other business practices worldwide.
Negative publicity regarding production methods, alleged practices or workplace or related conditions of any of our suppliers, manufacturers or licensees could adversely affect our brand image and sales and force us to locate alternative suppliers, manufacturers or licenses, which could increase our costs and result in delayed delivery of our products, product shortages or other disruptions to our operations.
If we encounter problems with distribution, our or our customers’ ability to deliver our products to market could be adversely affected.
We rely on a limited number of distribution and fulfillment centers in the regions in which we operate. Substantially all of our inventory is shipped directly from our suppliers to our distribution center in New
33
Table of Contents
Hampshire and a network of fulfillment centers in the United States, Hong Kong and Japan that are managed by third-party vendors where the inventory is then processed, sorted and shipped to our stores, our customers, our wholesale partners or our distributors using third-party carriers. We depend in large part on the orderly operation of this receiving and distribution process, which depends, in turn, on adherence to shipping schedules and effective management of our distribution center and our vendors’ fulfillment centers. Any increase in transportation costs (including increases in fuel costs), increased shipping costs, issues with overseas shipments, supplier-side delays, reductions in the transportation capacity of carriers, labor strikes or shortages in the transportation industry, disruptions to the national and international transportation infrastructure and unexpected delivery interruptions or delays may increase the cost of, and adversely impact, our distribution process.
In addition, if we or our vendors change the transportation companies we or they use, we or they could face logistical difficulties that could adversely affect deliveries and we or they could incur costs and expend resources in connection with such change. We or our vendors also may not be able to obtain terms as favorable as those received from the third-party transportation providers we or they currently use, which could increase our or their costs. We also may not adequately anticipate changing demands on our distribution system, including the effect of any expansion we may need to implement in our distribution center or through our vendors’ fulfillment centers.
In addition, events beyond our control, such as disruptions in operations due to natural or man-made disasters, inclement weather conditions, accidents, system failures, power outages, political instability, physical or cyber break-ins, server failure, work stoppages, slowdowns or strikes by employees, acts of terrorism, the outbreak of viruses, widespread illness, infectious diseases, contagions and the occurrence of unforeseen epidemics (including the outbreak of the coronavirus and its potential impact on our financial results) and other unforeseen or catastrophic events, could damage our distribution center or our vendors’ fulfillment centers or render them inoperable, making it difficult or impossible for us or our vendors to process customer orders for an extended period of time. Such events may also result in delays in our or our vendors’ receipt of inventory and the delivery of merchandise between our customers, our stores and/or our partners and our distribution center and our vendors’ fulfillment centers. We or our vendors could also incur significantly higher costs and longer lead times associated with distributing inventory during the time it takes for us or our vendors to reopen or replace our distribution center or any of their fulfillment centers.
The inability to fulfill, or any delays in processing, customer orders through our distribution network or any quality issues could result in the loss of retail customers or wholesale partners or issuances of refunds or credits, and may also adversely affect our reputation. The success of our stores, our wholesale partners or our distributors depends on their timely receipt of products for sale and any repeated, intermittent or long-term disruption in, or failures of, the operations of our distribution center or our vendors’ fulfillment centers could result in lower sales and profitability, a loss of loyalty to our brand and excess inventory. The insurance we maintain for business interruption may not cover all risk, or be sufficient to cover all of our potential losses, and may not continue to be available to us on acceptable terms, if at all, and any insurance proceeds may not be paid to us in a timely manner.
We rely on third parties to provide us with services in connection with the administration of certain aspects of our business.
We have entered into agreements with third-party service providers, both domestically and internationally, to provide processing, information technology and administrative functions over a broad range of areas, including managing our supply chain and inventory, processing transactions in our stores, our financial accounting and reporting, compensating our employees and operating our digital commerce platform, and we may continue to do so in the future. These areas include digital commerce, information technology and distribution functions. Services provided by third parties could be interrupted as a result of many factors, including contract disputes, destruction of facilities, work stoppage or strike, or failure of essential equipment. Any failure by third parties to provide us with these services on a timely basis or within our service level
34
Table of Contents
expectations and performance standards could result in a disruption of our operations and could have a material adverse effect on our business, results of operations and financial condition. In addition, to the extent we are unable to maintain these arrangements, we would incur substantial costs in order to return these services in-house, including costs associated with hiring new employees, or to transition the services to other third parties.
We are subject to data security and privacy risks that could negatively impact our results of operations or reputation.
We collect, process, transmit and store personal, sensitive and confidential information, including our proprietary business information and that of consumers (including users of our sites) and our wholesale partners, distributors, employees, suppliers and business partners. The secure processing, maintenance and transmission of this information is critical to our operations. Consumers and our wholesale partners, distributors, employees, suppliers and business partners have a high expectation that we will adequately protect their information, including personal information, from cyber-attack or other security breaches, and may have claims against us if we are unable to do so. We may also have exposure to regulatory investigation and other compliance risks in the event of a cyber-attack or other security breach. Our wholesale partners, distributors and other business partners may have contractual rights of indemnification against us in the event that their customer or proprietary business information is released as a result of a breach of our information systems. In such an event, these business partners may also seek to terminate our contracts with them.
Our systems and those of our wholesale partners, distributors, third-party service providers and business partners may be vulnerable to security breaches, attacks by hackers, acts of vandalism, computer viruses, misplaced or lost data, human errors or other similar events. We have been subject to attempted cyber-attacks in the past and may continue to be subject to such attacks in the future. If unauthorized parties gain access to our networks or databases, or those of our wholesale partners, distributors, third-party service providers or business partners, they may be able to steal, publish, delete, use inappropriately or modify our private and sensitive third-party information, including credit card information and personal identification information. In addition, employees may intentionally or inadvertently cause data or security breaches that result in unauthorized release of personal or confidential information. Because the techniques used to circumvent security systems can be highly sophisticated, change frequently, are often not recognized until launched against a target and may originate from less regulated and remote areas around the world, we may be unable to proactively address all possible techniques or implement adequate preventive measures for all situations. Any such breach, attack, virus or other event could result in costly investigations and litigation exceeding applicable insurance coverage or contractual rights available to us, government enforcement actions, civil or criminal penalties, fines, operational changes or other response measures, loss of consumer confidence in our security measures, and negative publicity that could adversely affect our brand, business, results of operations and financial condition. These losses may not be adequately covered by insurance or other contractual rights available to us.
In addition, we must comply with increasingly complex and rigorous regulatory standards enacted to protect business and personal data in the United States, Europe and elsewhere. The regulatory environment surrounding information security and privacy is demanding, with the frequent imposition of new and changing requirements across our business. Various federal, state and foreign legislative and regulatory bodies, or self-regulatory organizations, may expand current laws or regulations, enact new laws or regulations or issue revised rules or guidance regarding privacy, data protection, information security and consumer protection. For example, California recently enacted the California Consumer Privacy Act, or the CCPA, which, among other things, requires new disclosures to California consumers, affords such consumers new abilities to opt out of certain sales of personal information and creates a new and potentially severe statutory damages framework for violations as it went into effect on January 1, 2020. The effects of the CCPA potentially are significant, however, and may require us to modify our data processing practices and policies and to incur substantial costs and expenses in an effort to comply. Penalties for violations of the CCPA will include civil penalties. The interplay of federal and state laws may be subject to varying interpretations by courts and government agencies, creating complex compliance issues for us, consumers and our wholesale partners and distributors, and potentially exposing us to
35
Table of Contents
additional expense, adverse publicity and liability. As privacy and information security laws and regulations change, we may incur additional compliance costs.
In May 2018, the European Union’s new regulation governing data practices and privacy called the General Data Protection Regulation, or the GDPR, became effective. The law requires companies to meet more stringent requirements regarding the handling of personal data of individuals in the European Union than were required under predecessor requirements. The law also increases the penalties for non-compliance, which may result in monetary penalties of up to €20.0 million or 4% of a company’s worldwide annual revenue of the previous fiscal year, whichever is higher. The GDPR and other similar regulations require companies to give specific types of notice and in some cases seek consent from consumers and other data subjects before collecting or using their data for certain purposes, including some marketing activities. Outside of the European Union, many countries and territories have laws, regulations or other requirements relating to privacy, data protection, information security and consumer protection, and new countries and territories are adopting such legislation or other obligations with increasing frequency. Many of these laws may require consent from consumers for the use of data for various purposes, including marketing, which may reduce our ability to market our products. There is no harmonized approach to these laws and regulations globally. Consequently, we would increase our risk of non-compliance with applicable foreign data protection laws by expanding internationally. We may need to change and limit the way we use personal information in operating our business and may have difficulty maintaining a single operating model that is compliant.
Further, because we accept debit and credit cards for payment, we are subject to the Payment Card Industry Data Security Standard, or the PCI Standard, issued by the Payment Card Industry Security Standards Council, with respect to payment card information. The PCI Standard contains compliance guidelines with regard to our security surrounding the physical and electronic storage, processing and transmission of cardholder data. Compliance with the PCI Standard and implementing related procedures, technology and information security measures requires significant resources and ongoing attention. Costs and potential problems and interruptions associated with the implementation of new or upgraded systems and technology, such as those necessary to achieve compliance with the PCI Standard or with maintenance or adequate support of existing systems could also disrupt or reduce the efficiency of our operations. Any material interruptions or failures in our payment-related systems could have a material adverse effect on our business, results of operations and financial condition. If there are amendments to the PCI Standard, the cost of re-compliance could also be substantial and we may suffer loss of critical data and interruptions or delays in our operations as a result. If we are unable to comply with the security standards established by banks and the payment card industry, we may be subject to fines, restrictions and expulsion from card acceptance programs, which could adversely affect our retail operations.
As a general matter, compliance with laws, regulations and any applicable rules or guidance from self-regulatory organizations relating to privacy, data protection, information security and consumer protection may result in substantial costs and may necessitate changes to our business practices, which may compromise our growth strategy, adversely affect our ability to acquire customers and otherwise adversely affect our business, results of operations and financial condition.
Any failure, inadequacy, interruption or breach of our information technology systems, whether owned by us or outsourced or managed by third parties, could harm our ability to effectively operate our business and could have a material adverse effect on our business, results of operations and financial condition.
We rely heavily on our information technology systems, including those maintained by us and those maintained and provided by third parties (for example, “software-as-a-service” and cloud solutions), for many functions across our operations, including managing our supply chain and inventory, processing transactions in our stores, our financial accounting and reporting, compensating our employees and operating our digital commerce platform. Our ability to effectively manage our business and coordinate the sourcing, distribution and sale of our products depends significantly on the reliability and capacity of these systems. Such systems are
36
Table of Contents
subject to damage or interruption from power outages or damages, telecommunications problems, data corruption, software errors, theft, design defects, network failures, security breaches, acts of war or terrorist attacks, fire, flood and natural disasters. Our servers or those maintained by third-party providers could be affected by physical or electronic break-ins, and computer viruses or similar disruptions may occur. A system outage may also cause the loss of important data. Our or our third-party providers’ existing safety systems, data backup, access protection, user management and information technology emergency planning may not be sufficient to prevent data loss or long-term network outages.
In addition, we may have to upgrade our existing information technology systems from time to time in order for such systems to withstand the increasing needs of our expanding business. We rely on certain hardware, telecommunications and software vendors to maintain and periodically upgrade many of these systems so that we can continue to support our business. Costs and potential problems and interruptions associated with the implementation of new or upgraded systems and technology or with maintenance or adequate support of existing systems could disrupt or reduce the efficiency of our operations. We also depend on our information technology staff. If we cannot meet our staffing needs in this area, we may not be able to fulfill our technology initiatives while continuing to provide maintenance on existing systems.
We could be required to make significant capital expenditures to remediate any such failure, malfunction or breach with our information technology systems. Further, additional investment needed to upgrade and expand our information technology infrastructure will require significant investment of additional resources and capital, which may not always be available or available on favorable terms. Any material disruption or slowdown of our systems or those of our third-party providers, including those caused by our or their failure to successfully upgrade our or their systems, and our or their inability to convert to alternate systems in an efficient and timely manner could have a material adverse effect on our business, results of operations and financial condition.
If we fail to retain our existing senior management team or attract qualified new talent, such failure could have a material adverse effect on our business, financial condition and results of operations.
Our business requires disciplined execution at all levels of our organization. This execution requires an experienced and talented management team. If we were to lose the benefit of the experience, efforts and abilities of key executive personnel, it could have a material adverse effect on our business, results of operations and financial condition. Our success also depends on our ability to recruit, retain and motivate a sufficient number of qualified team members for our Innovation Center, qualified retail personnel and qualified technical and support roles for procurement, distribution, digital commerce and back office functions, both to maintain our current business and to execute our strategic initiatives. Competition for skilled and experienced management and qualified employees is intense and subject to high turnover, and requires us to pay higher wages to attract a sufficient number of suitable employees. We may not be successful in finding, attracting and retaining new qualified talent required to grow and operate our business profitably. In addition, shifts in U.S. immigration policy could negatively impact our ability to attract, hire and retain highly skilled employees who are from outside the United States.
Factors such as wage rate increases, inflation, cost increases, increases in raw material prices and energy prices could have a material adverse effect on our business, results of operations and financial condition.
Increases in compensation and other expenses for our employees may adversely affect our profitability. Wage and hour regulations, such as regulations issued in 2016 by the U.S. Department of Labor relating to minimum wages and overtime pay, can exacerbate this risk. Certain states have recently adopted legislation increasing minimum wages. Other future cost increases, such as increases in the cost of merchandise, shipping rates, raw material prices, freight costs and store occupancy costs, may also reduce our profitability. These cost increases may be the result of inflationary pressures that could further reduce our sales or profitability. Increases in other operating costs, including changes in energy prices and lease and utility costs, may increase our cost of sales or selling, general and administrative expense. Competitive pressures in the retail industry may inhibit our
37
Table of Contents
ability to reflect these increased costs in the prices of our products, in which case such increased costs could have a material adverse effect on our business, results of operations and financial condition.
Our profitability and cash flows may be negatively affected if we are not successful in managing our inventory.
Efficient inventory management is a key component of our success and profitability. To be successful, we must maintain sufficient inventory levels to meet our customers’ demands without allowing those levels to increase to such an extent that the costs to distribution center and stores to hold the goods unduly impacts our financial results. If we do not accurately predict customer trends or spending levels in general or at particular stores or if we inappropriately price products, we may have to take unanticipated markdowns and discounts to dispose of obsolete, aged or excess inventory or record potential write-downs relating to the value of obsolete, aged or excess inventory. Conversely, if we underestimate future demand for a particular product or do not respond quickly enough to replenish our best-performing products, we may have a shortfall in inventory of such products, likely leading to unfulfilled orders, reduced revenue and customer dissatisfaction.
Maintaining adequate inventory requires significant attention and monitoring of market trends, local markets, developments with suppliers and our distribution network, and it is not certain that we will be effective in our inventory management. We are subject to the risk of inventory loss or theft and we may experience higher rates of inventory shrinkage or incur increased security costs to combat inventory theft. In addition, any casualty or disruption to our distribution center, third-party fulfillment centers or our stores may damage or destroy our inventory located there. As we expand our operations, it may be more difficult to effectively manage our inventory. If we are not successful in managing our inventory balances, it could have a material adverse effect on our business, results of operations and financial condition.
Merchandise returns could harm our business.
We allow our customers to return products, subject to our return policy. From time to time our products are damaged in transit, which can increase return rates and harm our brand. If the rate of merchandise returns increases significantly or if merchandise return economics become less efficient, our business, results of operations and financial condition could be harmed. Further, we modify our policies relating to returns from time to time, which may result in customer dissatisfaction or an increase in the number of product returns.
Our results of operations and inventory levels fluctuate on a quarterly basis.
We experience quarterly fluctuations in our financial performance, including in our North America DTC comparable sales, as a result of a variety of factors, including the timing of the holiday shopping season (in particular, around Thanksgiving), the timing of store openings or closings and the sales generated by new stores or lost by closed stores, merchandise mix, the timing of new advertising and product introductions and the timing and level of inventory markdowns. In addition, adverse events, such as higher unemployment, deteriorating economic conditions, public transportation disruptions or unanticipated adverse weather or travel conditions can deter consumers from shopping. Unseasonal weather could also negatively impact sales of certain of our seasonal products, such as boots and sandals. As a result, historical period-to-period comparisons of our results of operations are not necessarily indicative of future period-to-period results. See “Business—Impact of Variability of Calendar on Comparability of Our Quarterly Results.”
In addition, in order to prepare for our peak shopping quarters, we must increase the staffing at our stores and order and keep in stock more merchandise than we carry during other parts of the year. This staffing increase and inventory build-up may require us to expend cash faster than is generated by our operations during this period. Any unanticipated decrease in demand for our products during such period could require us to sell excess inventory at a substantial markdown, which could have a material adverse effect on our business, results of operations and financial condition.
38
Table of Contents
We are subject to risks associated with leasing substantial amounts of space, including future increases in occupancy costs.
We lease all of the Company-operated store locations, our corporate headquarters and our distribution center. As a result, we are susceptible to changes in the property rental market and increases in our occupancy costs.
The success of our business depends, in part, on our ability to identify suitable premises for our stores and to negotiate acceptable lease terms. Our ability to effectively renew our existing store leases or obtain store leases to open new stores depends on the availability of store premises that meet our criteria for traffic, square footage, lease economics, demographics and other factors. We may not be able to renew or extend our existing store leases on acceptable terms, or at all, and may have to abandon desirable locations or renew leases on unfavorable terms. In addition, tenants at shopping centers in which we are located or have executed leases, or to which our locations are near, may fail to open or may cease operations. Decreases in total tenant occupancy in shopping centers in which we are located, or to which our locations are near, may affect traffic at our stores. All of these factors could have a material adverse impact on our operations.
Most leases for our stores provide for a minimum rent and typically include escalating rent increases over time. In certain circumstances, we pay a percentage rent based upon sales after certain minimum thresholds are achieved. The leases generally require us to pay insurance, utilities, real estate taxes and repair and maintenance expenses. Certain leases also provide that we cannot close or “go dark” even if we continue to pay rent. Our substantial lease obligations could have significant negative consequences, including:
| • | requiring that a substantial portion of our available cash be applied to pay our rental obligations, reducing cash available for other purposes and reducing our operating profitability; |
| • | increasing our vulnerability to general adverse economic and industry conditions; |
| • | limiting our flexibility in planning for, or reacting to changes in, our business or in the industry in which we compete; |
| • | placing us at a disadvantage with respect to some of our competitors; and |
| • | limiting our ability to obtain additional financing. |
We depend on cash flows from operations to pay our lease expenses and to fulfill our other cash needs. If our business does not generate sufficient cash flow from operating activities, and sufficient funds are not otherwise available to us from borrowings or other sources, we may not be able to service our lease expenses, grow our business, respond to competitive changes or fund our other liquidity and capital needs, which could harm our business.
Further, the substantial majority of our leased sites are both currently and in the future expected to be subject to long-term, non-cancellable leases. If an existing or future store is not profitable and we decide to close it, we may nonetheless be obligated to perform our obligations under the applicable lease, including, among other things, paying the base rent and other charges for the balance of the lease term. Even if a lease has an early cancellation clause, we may not satisfy the contractual requirements for early cancellation under that lease.
As we expand our store base, particularly in certain markets that are more expensive, our lease expense and our cash outlays for rent under lease agreements may increase. Our inability to enter into new leases or renew existing leases on terms acceptable to us, or be released from our obligations under leases for stores that we close, could materially and adversely affect our business, results of operations and financial condition.
Changes in tax laws, adoption of new tax laws, unfavorable resolution of tax contingencies or exposure to additional tax liabilities could have a material impact on our results of operations or financial condition.
We are subject to income taxes and non-income based taxes in both the United States and various foreign jurisdictions. We are also subject to on-going tax audits in various jurisdictions. Tax authorities may disagree
39
Table of Contents
with certain positions we have taken and assess additional taxes. We regularly assess the likely outcomes of these audits in order to determine the appropriateness of our tax provision and have established contingency reserves for material, known tax exposures. However, the calculation of such tax exposures involves the application of complex tax laws and regulations in many jurisdictions, as well as interpretations as to the legality under European Union state aid rules of tax advantages granted in certain jurisdictions. Therefore, there can be no assurance that we will accurately predict the outcomes of these disputes or other tax audits or that issues raised by tax authorities will be resolved at a financial cost that does not exceed our related reserves, and the actual outcomes of these disputes and other tax audits could have a material impact on our results of operations or financial condition.
Changes in tax laws and regulations, or their interpretation and application, in the jurisdictions where we are subject to tax could materially impact our effective tax rate. The Tax Cuts and Jobs Act, which was enacted on December 22, 2017, included a number of significant changes to previous U.S. tax laws that impact us, including a reduction in the corporate tax rate from 35% to 21% for tax years beginning after December 31, 2017, among other changes. The Tax Cuts and Jobs Act also transitions U.S. international taxation from a worldwide system to a modified territorial system and includes base erosion prevention measures on non-U.S. earnings, which has the effect of subjecting certain earnings of our foreign subsidiaries to U.S. taxation.
The tax laws in the United States and other countries in which we do business could change on a prospective or retroactive basis, and any such changes could materially adversely affect our results of operations or financial condition.
We could be required to collect additional sales taxes or be subject to other tax liabilities that may increase the costs our customers would have to pay for our products and adversely affect our results of operations.
On June 21, 2018, the U.S. Supreme Court held in South Dakota v. Wayfair, Inc. that states could impose sales tax collection obligations on out-of-state retailers even if those retailers lack any physical presence within the states imposing sales taxes. An increasing number of states, both before and after the Supreme Court’s ruling, have considered or adopted laws that attempt to impose sales tax collection obligations on out-of-state retailers. The Supreme Court’s Wayfair decision has removed a significant impediment to the enactment of these laws, and it is possible that states may seek to tax out-of-state retailers, including for prior tax years. Although we believe that we currently collect sales taxes in all states that have adopted laws imposing sales tax collection obligations on out-of-state retailers since Wayfair was decided, a successful assertion by one or more states requiring us to collect sales taxes where we presently do not do so, or to collect more taxes in a jurisdiction in which we currently do collect some sales taxes, could result in substantial tax liabilities, including taxes on past sales, as well as penalties and interest. The imposition by state governments of sales tax collection obligations on out-of-state retailers in jurisdictions where we do not currently collect sales taxes, whether for prior years or prospectively, could also create additional administrative burdens for us, put us at a competitive disadvantage if they do not impose similar obligations on our competitors and decrease our future sales, which could have a material adverse impact on our business, results of operations and financial condition.
Adverse litigation judgments or settlements resulting from legal proceedings relating to our business operations could materially adversely affect our business, results of operations and financial condition.
From time to time, we are subject to allegations, and may be party to legal claims and regulatory proceedings, relating to our business operations. Such allegations, claims and proceedings may be brought by third parties, including consumers, customers, partners, employees, governmental or regulatory bodies or competitors, and may include class actions. Defending against such claims and proceedings is costly and time consuming and may divert management’s attention and personnel resources from our normal business operations, and the outcome of many of these claims and proceedings cannot be predicted. If any of these claims or proceedings were to be determined adversely to us, a judgment, fine or settlement involving a payment of a material sum of money were to occur or injunctive relief were issued against us, our business, results of operations and financial condition could be materially adversely affected.
40
Table of Contents
Our operations are subject to environmental and workplace safety requirements, and costs or claims related to these requirements or to contamination could adversely affect us.
Our operations are subject to various federal, state and local requirements relating to the protection of the environment, including those governing the discharge of pollutants into the air, soil and water, the management and disposal of solid and hazardous materials and wastes, employee exposure to hazards in the workplace and the investigation and remediation of contamination resulting from releases of hazardous materials. If we fail to comply with such legal requirements we could be subject to enforcement actions, fines and liability. We use small quantities of hazardous substances in our operations. Our workers may also be subject to workplace hazards associated with our distribution operations. In addition, although we no longer manufacture shoes, we at one time operated several former manufacturing facilities. We may incur investigation, remediation or other costs related to releases of hazardous materials or other environmental conditions at locations where wastes from our facilities have been treated or disposed of, as well as at our currently or formerly owned or operated properties, regardless of whether we caused or contributed to such conditions, or those conditions were caused by former owners or operators or other third parties.
Goodwill and intangible assets, net represent a significant portion of our total assets, and any impairment of these assets could materially adversely affect our results of operations and financial condition.
Goodwill and intangible assets, net accounted for 52.9% and 40.8% of our total assets as of June 1, 2019 and November 30, 2019, respectively. We monitor the recoverability of our indefinite-lived intangible assets, which are our trademarks and tradenames, and evaluate goodwill and indefinite-lived intangible assets annually to determine if impairment has occurred. We also review the carrying value of our goodwill and intangible assets, both indefinite- and definite-lived, for impairment whenever events or changes in circumstances indicate that the carrying value of such assets may not be fully recoverable. Such indicators are based on market conditions and the operational performance of our business. If the testing performed indicates that impairment has occurred, we are required to record a non-cash impairment charge for the difference between the carrying value of the intangible assets or goodwill and the fair value of the intangible assets and the implied fair value of the goodwill, respectively, in the period the determination is made. The testing of goodwill and intangible assets for impairment requires us to make estimates that are subject to significant assumptions about our future sales, profitability, cash flow, fair value of assets and liabilities and weighted average cost of capital, as well as other assumptions. Changes in these estimates, or changes in actual performance compared with these estimates, may affect the fair value of intangible assets or goodwill, which may result in an impairment charge.
We may recognize impairment charges in the future based on such assumptions. We cannot accurately predict the amount or timing of any impairment of assets. If we determine that a significant impairment has occurred, we will be required to write off the impaired portion of intangible assets and goodwill. If a significant amount of our goodwill and intangible assets were deemed to be impaired, our business, results of operations and financial condition could be materially adversely affected.
Risks Related to Our Indebtedness
Our substantial indebtedness could adversely affect our ability to raise additional capital to fund our operations, limit our ability to react to changes in the economy or our industry and prevent us from meeting our obligations.
We have a significant amount of indebtedness. As of November 30, 2019, we had $277.4 million of indebtedness outstanding, all of which was secured indebtedness, and an additional $115.0 million of availability under the ABL Credit Facility, which was undrawn.
41
Table of Contents
Our substantial level of indebtedness increases the risk that we may be unable to generate cash sufficient to pay amounts due in respect of our indebtedness. Our substantial indebtedness could have other important consequences to us, including:
| • | increasing our vulnerability to adverse changes in general economic, industry and competitive conditions; |
| • | requiring us to dedicate a substantial portion of our cash flow from operations to make payments on our indebtedness, thereby reducing the availability of our cash flow to fund working capital, capital expenditures and other general corporate purposes; |
| • | limiting our flexibility in planning for, or reacting to, changes in our business and the industry in which we operate; |
| • | requiring us to repatriate cash from our foreign subsidiaries to accommodate debt service payments; |
| • | exposing us to the risk of increased interest rates as certain of our borrowings are at variable rates; |
| • | restricting us from capitalizing on business opportunities; |
| • | making it more difficult to satisfy our other financial obligations; |
| • | placing us at a competitive disadvantage compared to our competitors that have less debt; and |
| • | limiting our ability to borrow additional funds for working capital, capital expenditures, acquisitions, debt service requirements, execution of our business strategy or other general corporate purposes. |
In addition, the credit agreements governing the Term Loan Facility and ABL Credit Facility contain, and the agreements governing future indebtedness may contain, restrictive covenants that limit our ability to engage in activities that may be in our long-term best interests. Our failure to comply with those covenants could result in an event of default that, if not cured or waived, could result in the acceleration of all of our indebtedness.
We may be able to incur significant additional indebtedness in the future. Although the credit agreements governing the Term Loan Facility and ABL Credit Facility contain restrictions on the incurrence of additional indebtedness by us, such restrictions are subject to a number of qualifications and exceptions, and the indebtedness incurred in compliance with these restrictions could be substantial. Also, these restrictions do not prohibit us from incurring obligations that do not constitute “Indebtedness” as defined therein. To the extent that we incur additional indebtedness or such other obligations, the risk associated with our substantial indebtedness described above will increase.
We will require a significant amount of cash to service our debt, and our ability to generate cash depends on many factors beyond our control. Any failure to meet our debt service obligations could materially adversely affect our business, results of operations and financial condition.
Our ability to make payments on and to refinance our indebtedness and to fund working capital needs and planned capital expenditures will depend on our ability to generate cash in the future. This, to a certain extent, is subject to general economic, financial, competitive, business, legislative, regulatory and other factors that are beyond our control.
If our business does not generate sufficient cash flow from operations, or if future borrowings are not available to us in an amount sufficient to enable us to service our indebtedness or to fund our other liquidity needs, we may need to refinance all or a portion of our indebtedness on or before the maturity thereof, sell assets, reduce or delay capital investments or seek to raise additional capital, any of which could have a material adverse effect on our operations. In addition, we may not be able to effect any of these actions, if necessary, on commercially reasonable terms or at all. Our ability to restructure or refinance our indebtedness will depend on the condition of the capital markets and our financial condition at such time. Any refinancing of our debt could
42
Table of Contents
be at higher interest rates and may require us to comply with more onerous covenants, which could further restrict our business operations. The terms of existing or future debt instruments, including the credit agreements governing the Term Loan Facility and ABL Credit Facility, may limit or prevent us from taking any of these actions. In addition, any failure to make scheduled payments of interest and principal on our outstanding indebtedness would likely result in a reduction of our credit rating, which could harm our ability to incur additional indebtedness on commercially reasonable terms or at all. Our inability to generate sufficient cash flow to satisfy our debt service obligations, or to refinance or restructure our obligations on commercially reasonable terms or at all, would have an adverse effect, which could be material, on our business, results of operations and financial condition, as well as on our ability to satisfy our obligations in respect of the Term Loan Facility and ABL Credit Facility.
Our variable rate indebtedness subjects us to interest rate risk, which could cause our debt service obligations to increase significantly.
Borrowings under the Term Loan Facility and ABL Credit Facility are at variable rates of interest and expose us to interest rate risk. If interest rates were to increase, our debt service obligations on variable rate indebtedness would increase even though the amount borrowed remained the same, and our net income and cash flows, including cash available for servicing our indebtedness, will correspondingly decrease. We have entered into, and may enter into in the future, interest rate swaps that involve the exchange of floating for fixed rate interest payments in order to reduce interest rate volatility. However, we may not maintain interest rate swaps with respect to all or any of our variable rate indebtedness, and any swaps we enter into may not fully mitigate our interest rate risk.
LIBOR and other interest rates that are indices deemed to be “benchmarks” are the subject of recent and ongoing national, international and other regulatory guidance and proposals for reform. Some of these reforms are already effective, while others are still to be implemented. These reforms may cause such benchmarks to perform differently than in the past, or to disappear entirely, or have other consequences that cannot be predicted. Any such consequence could have a material adverse effect on our existing facilities, our interest rate swap agreement or our future debt linked to such a “benchmark” and our ability to service debt that bears interest at floating rates of interest.
Our debt instruments restrict our current and future operations, particularly our ability to respond to changes or to take certain actions.
The credit agreements governing the Term Loan Facility and ABL Credit Facility impose significant operating and financial restrictions and limit our ability to:
| • | incur additional indebtedness and guarantee indebtedness; |
| • | pay dividends or make other distributions in respect of, or repurchase or redeem, capital stock; |
| • | prepay, redeem or repurchase certain debt; |
| • | make acquisitions, investments, loans and advances; |
| • | sell or otherwise dispose of assets; |
| • | incur liens; |
| • | enter into transactions with affiliates; |
| • | enter into agreements restricting our subsidiaries’ ability to pay dividends; |
| • | consolidate, merge or sell all or substantially all of our assets; and |
| • | engage in certain fundamental changes, including changes in the nature of our business. |
43
Table of Contents
As a result of these covenants and restrictions, we are and will be limited in how we conduct our business, and we may be unable to raise additional debt or equity financing to compete effectively or to take advantage of new business opportunities. In addition, we are required to maintain specified financial ratios and satisfy other financial condition tests. The terms of any future indebtedness we may incur could include more restrictive covenants. We cannot guarantee that we will be able to maintain compliance with these covenants in the future and, if we fail to do so, that we will be able to cure such non-compliance, obtain waivers from the lenders and/or amend the covenants.
Our failure to comply with the restrictive covenants described above, as well as others contained in our future debt instruments from time to time, could result in an event of default, which, if not cured or waived, could result in our being required to repay these borrowings before their due date.
Our failure to comply with the agreements relating to our outstanding indebtedness, including as a result of events beyond our control, could result in an event of default that could materially adversely affect our business, results of operations and financial condition.
If there were an event of default under any of the agreements relating to our outstanding debt, the holders of the defaulted debt could cause all amounts outstanding with respect to that debt to be due and payable immediately. Our assets or cash flow may not be sufficient to fully repay borrowing under our outstanding debt instruments if accelerated upon an event of default. Further, if we are unable to repay, refinance or restructure our secured debt, the holders of such debt could proceed against the collateral securing such debt. In addition, any event of default or declaration of acceleration under one debt instrument could result in an event of default under one or more of our other debt instruments. As a result, any default by us on our debt could have a materially adverse effect on our business, results of operations and financial condition.
Risks Related to this Offering and Ownership of Our Common Stock
We are an “emerging growth company” and we cannot be certain if the reduced disclosure requirements applicable to “emerging growth companies” will make our common stock less attractive to investors.
We are an “emerging growth company,” as defined in Section 2(a)(19) of the Securities Act, and we may take advantage of certain exemptions and relief from various reporting requirements that are applicable to other public companies that are not “emerging growth companies.” In particular, while we are an “emerging growth company,” among other exemptions:
| • | we will not be required to comply with the auditor attestation requirements of Section 404(b) of the Sarbanes-Oxley Act, |
| • | we will be subject to reduced disclosure obligations regarding executive compensation in our periodic reports and proxy statements, and |
| • | we will not be required to hold nonbinding advisory votes on executive compensation or stockholder approval of any golden parachute payments not previously approved. |
We may remain an “emerging growth company” until the fiscal year-end following the fifth anniversary of the completion of this initial public offering, though we may cease to be an “emerging growth company” earlier under certain circumstances, including (1) if our gross revenue exceeds $1.07 billion in any fiscal year, (2) if we become a large accelerated filer, with at least $700.0 million of equity securities held by non-affiliates, or (3) if we issue more than $1.0 billion in non-convertible notes in any three-year period.
We cannot predict if investors may find our common stock less attractive if we rely on the exemptions and relief granted by the JOBS Act. If some investors find our common stock less attractive as a result, there may be a less active trading market for our common stock and our stock price may decline and/or become more volatile.
44
Table of Contents
We will be a “controlled company” within the meaning of the rules of NASDAQ and the rules of the SEC and, as a result, qualify for, and intend to rely on, exemptions from certain corporate governance requirements. You will not have the same protections afforded to stockholders of other companies that are subject to such requirements.
After completion of this offering, our Sponsor will continue to control a majority of the voting power of our outstanding common stock. As a result, we will be a “controlled company” within the meaning of the corporate governance standards of NASDAQ. Under these rules, a company of which more than 50% of the voting power is held by an individual, group or another company is a “controlled company” and may elect not to comply with certain corporate governance requirements, including the requirement that:
| • | a majority of our board of directors consist of “independent directors” as defined under the rules of NASDAQ; |
| • | our director nominees be selected, or recommended for our board of directors’ selection, by a nominating/governance committee comprised solely of independent directors; and |
| • | the compensation of our executive officers be determined, or recommended to our board of directors for determination, by a compensation committee comprised solely of independent directors. |
Following this offering, we intend to utilize these exemptions. As a result, we may not have a majority of independent directors, our compensation committee and nominating and governance committee may not consist entirely of independent directors. Accordingly, you may not have the same protections afforded to stockholders of companies that are subject to all of the corporate governance requirements of NASDAQ.
Our Sponsor controls us and its interests may conflict with yours in the future.
Immediately following this offering, our Sponsor will beneficially own % of our common stock, or % if the underwriters exercise in full their option to purchase additional shares. Our Sponsor will be able to control the election and removal of our directors and thereby determine our corporate and management policies, including potential mergers or acquisitions, payment of dividends, asset sales, amendment of our certificate of incorporation or bylaws and other significant corporate transactions, for so long as our Sponsor and its affiliates retain significant ownership of us. This concentration of our ownership may delay or deter possible changes in control of the Company, which may reduce the value of an investment in our common stock. So long as our Sponsor continues to own a significant amount of our combined voting power, even if such amount is less than 50%, our Sponsor will continue to be able to strongly influence or effectively control our decisions and, so long as our Sponsor and its affiliates and certain of their transferees collectively own at least 5% of all outstanding shares of our stock entitled to vote generally in the election of directors, our Sponsor will be able to appoint individuals to our board of directors under the stockholders agreement to be entered into in connection with this offering. In addition, the stockholders agreement will grant to our Sponsor and its affiliates and certain of their transferees certain governance rights for as long as our Sponsor and its affiliates and certain of their transferees maintain ownership of at least 25% of our outstanding common stock, including rights of approval over certain corporate and other transactions and the appointment of our chief executive officer. See “Certain Relationships and Related Party Transactions—Stockholders Agreement.” The interests of our Sponsor may not coincide with the interests of other holders of our common stock.
In the ordinary course of their business activities, our Sponsor and its affiliates may engage in activities where their interests conflict with our interests or those of our stockholders. Our certificate of incorporation will provide that our Sponsor, any of its affiliates or any director who is not employed by us (including any non-employee director who serves as one of our officers in both his director and officer capacities) or his or her affiliates will not have any duty to refrain from engaging, directly or indirectly, in the same business activities or similar business activities or lines of business in which we operate. Our Sponsor also may pursue acquisition opportunities that may be complementary to our business and, as a result, those acquisition opportunities may not be available to us. In addition, our Sponsor may have an interest in pursuing acquisitions, divestitures and other transactions that, in its judgment, could enhance its investment, even though such transactions might involve risks to you.
45
Table of Contents
In addition, our Sponsor and its affiliates will be able to determine the outcome of all matters requiring stockholder approval and will be able to cause or prevent a change of control of the Company or a change in the composition of our board of directors and could preclude any acquisition of the Company. This concentration of voting control could deprive you of an opportunity to receive a premium for your shares of common stock as part of a sale of the Company and ultimately might affect the market price of our common stock.
We will incur increased costs and become subject to additional regulations and requirements as a result of becoming a public company, and our management will be required to devote substantial time to new compliance matters, which could lower our profits or make it more difficult to run our business.
As a public company, we will incur significant legal, regulatory, finance, accounting, investor relations and other expenses that we have not incurred as a private company, including costs associated with public company reporting requirements and costs of recruiting and retaining non-executive directors. We also have incurred and will incur costs associated with the Sarbanes-Oxley Act and the Dodd-Frank Wall Street Reform and Consumer Protection Act, or the Dodd-Frank Act, and related rules implemented by the SEC and NASDAQ. The expenses incurred by public companies generally for reporting and corporate governance purposes have been increasing. We expect these rules and regulations to increase our legal and financial compliance costs and to make some activities more time-consuming and costly, although we are currently unable to estimate these costs with any degree of certainty. Our management will need to devote a substantial amount of time to ensure that we comply with all of these requirements, diverting the attention of management away from revenue-producing activities. These laws and regulations also could make it more difficult or costly for us to obtain certain types of insurance, including director and officer liability insurance, and we may be forced to accept reduced policy limits and coverage or incur substantially higher costs to obtain the same or similar coverage. These laws and regulations could also make it more difficult for us to attract and retain qualified persons to serve on our board of directors or board committees or as our executive officers. Furthermore, if we are unable to satisfy our obligations as a public company, we could be subject to delisting of our common stock, fines, sanctions and other regulatory actions and potentially civil litigation.
Failure to comply with requirements to design, implement and maintain effective internal controls could have a material adverse effect on our business and stock price. We currently have a material weakness in our internal control over financial reporting.
As a privately held company, we were not required to evaluate our internal control over financial reporting in a manner that meets the standards of publicly traded companies required by Section 404(a) of the Sarbanes-Oxley Act, or Section 404.
As a public company, we will have significant requirements for enhanced financial reporting and internal controls. The process of designing and implementing effective internal controls is a continuous effort that requires us to anticipate and react to changes in our business and the economic and regulatory environments and to expend significant resources to maintain a system of internal controls that is adequate to satisfy our reporting obligations as a public company. If we are unable to establish or maintain appropriate internal financial reporting controls and procedures, it could cause us to fail to meet our reporting obligations on a timely basis, result in material misstatements in our consolidated financial statements and harm our operating results. In addition, we will be required, pursuant to Section 404, to furnish a report by management on, among other things, the effectiveness of our internal control over financial reporting in the second annual report following the completion of this offering. Internal control over financial reporting is a process designed to provide reasonable assurance regarding the reliability of financial reporting and the preparation of financial statements in accordance with GAAP. This assessment will need to include disclosure of any material weaknesses identified by our management in our internal control over financial reporting. The rules governing the standards that must be met for our management to assess our internal control over financial reporting are complex and require significant documentation, testing and possible remediation. Testing and maintaining internal controls may divert our management’s attention from other matters that are important to our business. If we are no longer an “emerging
46
Table of Contents
growth company,” our auditors will be required to issue an attestation report on the effectiveness of our internal controls on an annual basis.
In connection with the implementation of the necessary procedures and practices related to internal control over financial reporting, we may identify deficiencies that we may not be able to remediate in time to meet the deadline imposed by the Sarbanes-Oxley Act for compliance with the requirements of Section 404. In addition, we may encounter problems or delays in completing the remediation of any deficiencies identified by our independent registered public accounting firm in connection with the issuance of their attestation report. Our testing, or the subsequent testing (if required) by our independent registered public accounting firm, may reveal deficiencies in our internal control over financial reporting that are deemed to be material weaknesses. A material weakness is a deficiency, or combination of deficiencies, in internal control over financial reporting, such that there is a reasonable possibility that a material misstatement of the entity’s financial statements will not be prevented or detected on a timely basis. Any material weaknesses could result in a material misstatement of our annual or quarterly consolidated financial statements or disclosures that may not be prevented or detected. The existence of any material weakness would require management to devote significant time and incur significant expense to remediate any such material weakness and management may not be able to remediate any such material weakness in a timely manner.
We identified a material weakness in our internal control over financial reporting related to our Japan subsidiary, as we did not design and maintain effective controls over the review of journal entries and account reconciliations. Specifically, we did not design and maintain effective controls to ensure that journal entries and account reconciliations were (i) properly prepared with sufficient supporting documentation or (ii) reviewed and approved to ensure accuracy and completeness. This material weakness did not result in a misstatement to our financial statements. The material weakness could result in a misstatement that would result in a material misstatement of our financial statements that would not be prevented or detected and, accordingly, we determined that these control deficiencies constitute a material weakness.
We are implementing process and control improvements to address this material weakness. If we are unable to remediate this material weakness in a timely manner, we may not be able to conclude on an ongoing basis that we have effective internal control over financial reporting in accordance with Section 404, or our independent registered public accounting firm may not issue an unqualified opinion (to the extent it is required to issue a report). If either we are unable to conclude that we have effective internal control over financial reporting or our independent registered public accounting firm is unable to provide us with an unqualified report (to the extent it is required to issue a report), investors could lose confidence in our reported financial information, which could have a material adverse effect on our business or the trading price of our common stock.
There may not be an active, liquid trading market for shares of our common stock, which may cause shares of our common stock to trade at a discount from the initial offering price and make it difficult to sell the shares of common stock you purchase.
Prior to this offering, there has not been a public trading market for shares of our common stock. We cannot predict the extent to which investor interest in us will lead to the development of a trading market or how active and liquid that market may become. If an active and liquid trading market does not develop or continue, you may have difficulty selling your shares of our common stock at an attractive price or at all. The initial public offering price per share of common stock will be determined by agreement among us, the selling stockholders and the representatives of the underwriters, and may not be indicative of the price at which shares of our common stock will trade in the public market after this offering. The market price of our common stock may decline below the initial offering price and you may not be able to sell your shares of our common stock at or above the price you paid in this offering, or at all.
47
Table of Contents
Our stock price may change significantly following this offering, you may not be able to resell shares of our common stock at or above the price you paid or at all and you could lose all or part of your investment as a result.
Even if a trading market develops, the market price of our common stock may be highly volatile and could be subject to wide fluctuations. You may not be able to resell your shares at or above the initial public offering price due to a number of factors, such as those listed elsewhere in this “Risk Factors” section and the following:
| • | results of operations that vary from the expectations of securities analysts and investors; |
| • | results of operations that vary from those of our competitors; |
| • | changes in expectations as to our future financial performance, including financial estimates and investment recommendations by securities analysts and investors; |
| • | changes in general economic or market conditions or trends in our industry or the economy as a whole; |
| • | changes in market valuations of, or earnings and other announcements by, companies in our industry; |
| • | declines in the market prices of stocks generally, particularly those of footwear and lifestyle accessories companies; |
| • | additions or departures of key management personnel; |
| • | strategic actions by us or our competitors; |
| • | announcements by us, our competitors, our suppliers or our distributors of significant contracts, price reductions, new products or technologies, acquisitions, dispositions, joint marketing relationships, joint ventures, other strategic relationships or capital commitments; |
| • | changes in preference of our customers and our market share; |
| • | changes in business or regulatory conditions; |
| • | future sales of our common stock or other securities; |
| • | investor perceptions of, or the investment opportunity associated with, our common stock relative to other investment alternatives; |
| • | the public’s response to press releases or other public announcements by us or third parties, including our filings with the SEC; |
| • | changes or proposed changes in laws or regulations or differing interpretations or enforcement thereof affecting our business; |
| • | announcements relating to litigation or governmental investigations; |
| • | guidance, if any, that we provide to the public, any changes in this guidance or our failure to meet this guidance; |
| • | the development and sustainability of an active trading market for our stock; |
| • | changes in accounting principles; and |
| • | other events or factors, including those resulting from information technology system failures and disruptions, natural disasters, war, acts of terrorism or responses to these events. |
Furthermore, the stock market may experience extreme volatility that, in some cases, may be unrelated or disproportionate to the operating performance of particular companies. These broad market and industry fluctuations may adversely affect the market price of our common stock, regardless of our actual operating performance. In addition, price volatility may be greater if the public float and trading volume of our common stock is low.
48
Table of Contents
In the past, following periods of market volatility, stockholders have instituted securities class action litigation. If we were to become involved in securities litigation, it could have a substantial cost and divert resources and the attention of executive management from our business regardless of the outcome of such litigation.
You may be diluted by the future issuance of additional common stock in connection with our incentive plans, acquisitions or otherwise.
After this offering we will have approximately shares of common stock authorized but unissued. Our amended and restated certificate of incorporation to become effective immediately prior to the consummation of this offering will authorize us to issue these shares of common stock and options relating to common stock for the consideration, and on the terms and conditions, established by our board of directors in its sole discretion, whether in connection with acquisitions or otherwise. We have reserved shares for issuance under our new Omnibus Incentive Plan. See “Management—Executive Compensation—Compensation Arrangements to be Adopted in connection with this Offering.” Any common stock that we issue, including under our new Omnibus Incentive Plan or other equity incentive plans that we may adopt in the future, would dilute the percentage ownership held by the investors who purchase common stock in this offering. In the future, we may also issue our securities in connection with investments or acquisitions. The amount of shares of our common stock issued in connection with an investment or acquisition could constitute a material portion of our then-outstanding shares of our common stock. Any issuance of additional securities in connection with investments or acquisitions may result in additional dilution to you.
Because we have no current plans to pay cash dividends on our common stock, you may not receive any return on investment unless you sell your common stock for a price greater than that which you paid for it.
We have no current plans to pay cash dividends on our common stock. The declaration, amount and payment of any future dividends will be at the sole discretion of our board of directors, and will depend on, among other things, general and economic conditions, our results of operations and financial condition, our available cash and current and anticipated cash needs, capital requirements, contractual, legal, tax and regulatory restrictions and implications on the payment of dividends by us to our stockholders or by our subsidiaries to us, including restrictions under the Term Loan Facility and ABL Credit Facility and other indebtedness we may incur, and such other factors as our board of directors may deem relevant. See “Dividend Policy.”
As a result, you may not receive any return on an investment in our common stock unless you sell our common stock for a price greater than your purchase price.
Cole Haan, Inc. is a holding company and depends on its subsidiaries for cash to fund its operations and expenses, including future dividend payments, if any.
Our operations are conducted through our wholly owned subsidiaries and our ability to generate cash to meet our debt service obligations or to make future dividend payments, if any, is highly dependent on the earnings of, and the receipt of funds from, our subsidiaries via dividends or intercompany loans. We do not currently expect to declare or pay dividends on our common stock for the foreseeable future; however, to the extent that we determine in the future to pay dividends on our common stock, the agreements governing our indebtedness may restrict the ability of our subsidiaries to pay dividends or otherwise transfer assets to us. In addition, Delaware law may impose requirements that may restrict our ability to pay dividends to holders of our common stock.
Future sales, or the perception of future sales, by us or our existing stockholders in the public market following this offering could cause the market price for our common stock to decline.
The sale of substantial amounts of shares of our common stock in the public market, or the perception that such sales could occur, including sales by our Sponsor, could harm the prevailing market price of shares of our
49
Table of Contents
common stock. These sales, or the possibility that these sales may occur, also might make it more difficult for us to sell equity securities in the future at a time and at a price that we deem appropriate.
Upon completion of this offering we will have a total of shares of our common stock outstanding. Of the outstanding shares, the shares sold in this offering (or shares if the underwriters exercise their option to purchase additional shares) will be freely tradable without restriction or further registration under the Securities Act, except that any shares held by our affiliates, as that term is defined under Rule 144 of the Securities Act, or Rule 144, including our directors, executive officers and other affiliates (including our Sponsor), may be sold only in compliance with the limitations described in “Shares Eligible for Future Sale.”
The remaining outstanding shares of common stock held by our existing stockholders after this offering will be subject to certain restrictions on resale. We, our executive officers, our directors and certain of our significant stockholders, including the selling stockholders, will sign lock-up agreements with the underwriters that will, subject to certain customary exceptions, restrict the sale of the shares of our common stock and certain other securities held by them for 180 days following the date of this prospectus. BofA Securities, Inc. and Morgan Stanley & Co. LLC may, in their sole discretion and at any time without notice, release all or any portion of the shares or securities subject to any such lock-up agreements. See “Underwriting” for a description of these lock-up agreements.
Upon the expiration of the lock-up agreements described above, all of such shares (or shares if the underwriters exercise in full their option to purchase additional shares) will be eligible for resale in a public market, subject, in the case of shares held by our affiliates, to volume, manner of sale and other limitations under Rule 144. We expect that our Sponsor will be considered an affiliate upon the expiration of the lock-up period based on its expected share ownership (consisting of shares), as well as its board nomination rights. Certain other of our stockholders, including our directors and executive officers, may also be considered affiliates at that time. The stockholders agreement will impose significant restrictions on transfers of shares of our common stock held by management and director stockholders. See “Certain Relationships and Related Party Transactions—Stockholders Agreement.”
In addition, pursuant to the stockholders agreement, our Sponsor has the right, subject to certain conditions, to require us to register the sale of their shares of our common stock under the Securities Act. See “Certain Relationships and Related Party Transactions—Stockholders Agreement.” By exercising its registration rights and selling a large number of shares, our Sponsor could cause the prevailing market price of our common stock to decline. Certain of our other stockholders have “piggyback” registration rights with respect to future registered offerings of our common stock. Following completion of this offering, the shares covered by registration rights would represent approximately % of our total common stock outstanding (or % if the underwriters exercise in full their option to purchase additional shares). Registration of any of these outstanding shares of common stock would result in such shares becoming freely tradable without compliance with Rule 144 upon effectiveness of the applicable registration statement. See “Shares Eligible for Future Sale.”
We intend to file one or more registration statements on Form S-8 under the Securities Act to register shares of our common stock or securities convertible into or exchangeable for shares of our common stock issued pursuant to our new Omnibus Incentive Plan. Any such Form S-8 registration statements will automatically become effective upon filing. Accordingly, shares registered under such registration statements will be available for sale in the open market. We expect that the initial registration statement on Form S-8 will cover shares of our common stock.
As restrictions on resale end, or if existing stockholders exercise their registration rights, the market price of our shares of common stock could drop significantly if the holders of these restricted shares sell them or are perceived by the market as intending to sell them. These factors could also make it more difficult for us to raise additional funds through future offerings of our shares of common stock or other securities.
50
Table of Contents
If securities analysts do not publish research or reports about our business or if they downgrade our stock or our sector, our stock price and trading volume could decline.
The trading market for our common stock will rely in part on the research and reports that industry or financial analysts publish about us or our business. We do not control these analysts. If one or more of the analysts who cover us downgrade our stock or our industry, or the stock of any of our competitors, or publish inaccurate or unfavorable research about our business, the price of our common stock could decline. If one or more of these analysts ceases coverage of the Company or fails to publish reports on us regularly, we could lose visibility in the market, which in turn could cause our stock price or trading volume to decline.
Anti-takeover provisions in our organizational documents could delay or prevent a change of control.
Certain provisions of our amended and restated certificate of incorporation and amended and restated bylaws may have an anti-takeover effect and may delay, defer or prevent a merger, acquisition, tender offer, takeover attempt, or other change of control transaction that a stockholder might consider in its best interest, including those attempts that might result in a premium over the market price for the shares held by our stockholders.
These provisions will provide for, among other things:
| • | a classified board of directors, as a result of which our board of directors will be divided into three classes, with each class serving for staggered three-year terms; |
| • | the ability of our board of directors to issue one or more series of preferred stock; |
| • | advance notice requirements for nominations of directors by stockholders and for stockholders to include matters to be considered at our annual meetings; |
| • | certain limitations on convening special stockholder meetings; |
| • | the removal of directors only for cause and only upon the affirmative vote of the holders of at least 662/3% of the shares of common stock entitled to vote generally in the election of directors if our Sponsor and its affiliates cease to beneficially own at least 40% of the shares of common stock entitled to vote generally in the election of directors; and |
| • | that certain provisions may be amended only by the affirmative vote of at least 662/3% of the shares of common stock entitled to vote generally in the election of directors if our Sponsor and its affiliates cease to beneficially own at least 40% of the shares of common stock entitled to vote generally in the election of directors. |
These anti-takeover provisions could make it more difficult for a third party to acquire us, even if the third party’s offer may be considered beneficial by many of our stockholders. As a result, our stockholders may be limited in their ability to obtain a premium for their shares. See “Description of Capital Stock.”
Our board of directors will be authorized to issue and designate shares of our preferred stock in additional series without stockholder approval.
Our amended and restated certificate of incorporation will authorize our board of directors, without the approval of our stockholders, to issue shares of our preferred stock, subject to limitations prescribed by applicable law, rules and regulations and the provisions of our amended and restated certificate of incorporation, as shares of preferred stock in series, to establish from time to time the number of shares to be included in each such series and to fix the designation, powers, preferences and rights of the shares of each such series and the qualifications, limitations or restrictions thereof. The powers, preferences and rights of these additional series of preferred stock would be senior to our common stock, which may reduce the value of our common stock.
51
Table of Contents
Our amended and restated certificate of incorporation will provide, subject to limited exceptions, that state and federal courts (as appropriate) located within the State of Delaware will be the sole and exclusive forum for certain stockholder litigation matters, which could limit our stockholders’ ability to obtain a favorable judicial forum for disputes with us or our directors, officers, employees or stockholders.
Our amended and restated certificate of incorporation will provide, subject to limited exceptions, that unless we consent to the selection of an alternative forum, the state or federal courts (as appropriate) located within the State of Delaware shall, to the fullest extent permitted by law, be the sole and exclusive forum for any (i) derivative action or proceeding brought on our behalf, (ii) action asserting a claim of breach of a fiduciary duty owed by any director, officer, or other employee or stockholder of ours to the Company or our stockholders, creditors or other constituents, (iii) action asserting a claim against the Company or any director or officer of the Company arising pursuant to any provision of the Delaware General Corporation Law, or the DGCL, or our amended and restated certificate of incorporation or our amended and restated bylaws, or as to which the DGCL confers jurisdiction on the Court of Chancery of the State of Delaware, (iv) action asserting a claim against the Company or any director or officer of the Company governed by the internal affairs doctrine or (v) action against us or any of our directors or officers involving a claim or defense arising pursuant to the Securities Exchange Act of 1934, as amended, or the Exchange Act, or the Securities Act. The enforceability of similar forum provisions in other companies’ certificates of incorporation has been challenged in legal proceedings, and it is possible that a court could find these types of provisions to be unenforceable in whole or in part. Our exclusive forum provision will not relieve the Company of its duties to comply with the federal securities laws and the rules and regulations thereunder, and our stockholders will not be deemed to have waived our compliance with these laws, rules and regulations.
Any person or entity purchasing or otherwise acquiring any interest in shares of our capital stock will be deemed to have notice of and consented to the forum provisions in our amended and restated certificate of incorporation. This choice of forum provision may limit a stockholder’s ability to bring a claim in a judicial forum that it finds favorable for disputes with us or any of our directors, officers, other employees or stockholders which may discourage lawsuits with respect to such claims. Alternatively, if a court were to find the choice of forum provision contained in our amended and restated certificate of incorporation to be inapplicable or unenforceable in an action, we may incur additional costs associated with resolving such action in other jurisdictions, which could harm our business, operating results and financial condition.
52
Table of Contents
This prospectus includes forward-looking statements that reflect our current views with respect to, among other things, our operations and financial performance. Forward-looking statements include all statements that are not historical facts. These forward-looking statements are included throughout this prospectus, including in the sections entitled “Summary,” “Risk Factors,” “Management’s Discussion and Analysis of Financial Condition and Results of Operations” and “Business,” and relate to matters such as our industry, business strategy, goals and expectations concerning our market position, future operations, margins, profitability, capital expenditures, liquidity and capital resources and other financial and operating information. We have used the words “anticipate,” “assume,” “believe,” “continue,” “could,” “estimate,” “expect,” “intend,” “may,” “plan,” “potential,” “predict,” “project,” “future,” “will,” “seek,” “foreseeable,” the negative version of these words or similar terms and phrases to identify forward-looking statements in this prospectus.
The forward-looking statements contained in this prospectus are based on management’s current expectations and are not guarantees of future performance. The forward-looking statements are subject to various risks, uncertainties, assumptions or changes in circumstances that are difficult to predict or quantify. Our expectations, beliefs and projections are expressed in good faith and we believe there is a reasonable basis for them. However, there can be no assurance that management’s expectations, beliefs and projections will result or be achieved. Actual results may differ materially from these expectations due to changes in global, regional or local economic, business, competitive, market, regulatory and other factors, many of which are beyond our control. We believe that these factors include but are not limited to those described under “Risk Factors” and the following:
| • | our ability to maintain the value and reputation of our brand; |
| • | our failure to adequately continue to connect with our consumer base; |
| • | an overall decline in the health of the economy and other factors impacting consumer spending; |
| • | our ability to improve and expand our product offerings; |
| • | our reliance on technical innovation and high-quality products to compete in the market for our products; |
| • | our ability to identify and respond to new and changing consumer trends and preferences to accurately forecast demand; |
| • | our ability to compete successfully in highly competitive markets; |
| • | our failure to successfully manage our digital commerce business; |
| • | our failure to open and operate new stores in a timely and cost-effective manner, or to successfully enter new markets; |
| • | our dependence on our wholesale partners; |
| • | risks associated with our international distribution partners; |
| • | failure of our licensees to generate expected sales or maintain the value of our brands; |
| • | our inability to adequately protect our intellectual property and allegations that we have infringed the intellectual property or other proprietary rights of third parties; |
| • | our ability to successfully implement our growth strategies on a timely basis or at all; |
| • | our growth strategies straining our existing resources and causing our performance to suffer; |
| • | our ability to maintain sufficient levels of cash flow from our operations to fund our expanding business; |
| • | risks associated with our international business operations; |
| • | the impact of the outbreak, and threat or perceived threat of outbreak, of the coronavirus on our sourcing and manufacturing operations and consumer spending; |
53
Table of Contents
| • | risks associated with sourcing and manufacturing; |
| • | failure of our suppliers or our licensees’ suppliers to use ethical business practices and comply with our code of conduct and laws and regulations; |
| • | problems with distribution and our or our customers’ ability to deliver our products; |
| • | our reliance on third parties to provide us with services in connection with the administration of certain aspects of our business; |
| • | data security and privacy risks; |
| • | any failure, inadequacy, interruption, security failure or breach of our information technology systems, whether owned by us or outsourced or managed by third parties; |
| • | our failure to retain our existing senior management team or attract qualified new talent; |
| • | the impact of wage rate increases, inflation, cost increases, increases in raw material prices and energy prices; |
| • | our ability to successfully manage our inventory; |
| • | the impact of a significant increase in the rate of merchandise returns; |
| • | quarterly fluctuations in our results of operations and inventory levels; |
| • | risks associated with leasing substantial amounts of space; |
| • | the impact of any changes in tax laws, adoption of new tax laws, unfavorable resolution of tax contingencies, or exposure to additional tax liabilities; |
| • | the impact of additional sales taxes or other tax liabilities that may increase the costs our customers would have to pay for our products; |
| • | the impact of any adverse litigation judgments or settlements resulting from legal proceedings relating to our business operations; |
| • | the impact of environmental and workplace safety requirements, and costs or claims related to these requirements or to contamination; and |
| • | the impact of any impairment of goodwill and intangible assets, net as such assets represent a significant portion of our total assets. |
These factors should not be construed as exhaustive and should be read in conjunction with the other cautionary statements that are included in this prospectus. Should one or more of these risks or uncertainties materialize, or should any of our assumptions prove incorrect, our actual results may vary in material respects from those projected in these forward-looking statements. Factors or events that could cause our actual results to differ may emerge from time to time, and it is not possible for us to predict all of them. Our forward-looking statements do not reflect the potential impact of any future acquisitions, mergers, dispositions, joint ventures, investments or other strategic transactions we may make.
Any forward-looking statement made by us in this prospectus speaks only as of the date of this prospectus and is expressly qualified in its entirety by the cautionary statements included in this prospectus. We undertake no obligation to publicly update or review any forward-looking statement, whether as a result of new information, future developments or otherwise, except as may be required by any applicable laws. You should not place undue reliance on our forward-looking statements.
54
Table of Contents
We will not receive any proceeds from the sale of shares of our common stock by the selling stockholders in this offering, including from any exercise by the underwriters of their option to purchase additional shares from the selling stockholders. The selling stockholders will receive all of the net proceeds and bear the underwriting discount, if any, attributable to their sale of our common stock. We will pay certain expenses associated with this offering. See “Principal and Selling Stockholders.”
55
Table of Contents
We currently expect to retain all future earnings for use in the operation and expansion of our business and have no current plans to pay dividends on our common stock. The declaration, amount and payment of any future dividends will be at the sole discretion of our board of directors, and will depend on, among other things, general and economic conditions, our results of operations and financial condition, our available cash and current and anticipated cash needs, capital requirements, contractual, legal, tax and regulatory restrictions and implications on the payment of dividends by us to our stockholders or by our subsidiaries to us, including restrictions under the Term Loan Facility and ABL Credit Facility and other indebtedness we may incur, and such other factors as our board of directors may deem relevant. If we elect to pay such dividends in the future, we may reduce or discontinue entirely the payment of such dividends at any time.
Because we are a holding company, our ability to pay dividends depends on our receipt of cash from our operating subsidiaries, which may further restrict our ability to pay dividends as a result of the laws of their jurisdiction of organization, agreements of our subsidiaries or covenants under any existing and future outstanding indebtedness we or our subsidiaries incur. Certain of our subsidiaries are subject to the Term Loan Facility and ABL Credit Facility, which contain covenants that limit such subsidiaries’ ability to make restricted payments, including dividends, and take on additional indebtedness. See “Description of Certain Indebtedness” for a description of the restrictions on our ability to pay dividends.
56
Table of Contents
The following table sets forth our cash and our capitalization as of November 30, 2019.
You should read this table in conjunction with the information contained in “Use of Proceeds,” “Selected Historical Consolidated Financial and Other Data,” “Management’s Discussion and Analysis of Financial Condition and Results of Operations” and “Description of Certain Indebtedness” as well as our audited consolidated financial statements and related notes thereto and our unaudited condensed consolidated financial statements and related notes thereto, each included elsewhere in this prospectus.
| As of November 30, 2019 |
||||
| (In thousands, except share and per share data) | ||||
| Cash |
$ | 10,786 | ||
|
|
|
|||
| Debt: |
||||
| Term Loan Facility(1) |
$ | 284,563 | ||
| ABL Credit Facility(2) |
— | |||
| Unamortized discount and debt issuance costs |
(7,167 | ) | ||
|
|
|
|||
| Total debt, net of discount and debt issuance costs |
$ | 277,396 | ||
|
|
|
|||
| Stockholders’ equity: |
||||
| Preferred stock, $0.01 par value per share, no shares authorized, issued and outstanding |
$ | — | ||
| Common stock, $0.01 par value per share, 1,000 shares authorized, issued and outstanding |
— | |||
| Additional paid-in capital |
238,330 | |||
| Accumulated deficit |
(45,988 | ) | ||
| Accumulated other comprehensive loss |
(3,044 | ) | ||
|
|
|
|||
| Total stockholders’ equity |
189,298 | |||
|
|
|
|||
| Total capitalization |
$ | 466,694 | ||
|
|
|
|||
| (1) | For a further description of the Term Loan Facility, see “Description of Certain Indebtedness.” |
| (2) | For a further description of the ABL Credit Facility, see “Description of Certain Indebtedness.” As of November 30, 2019, we had no borrowings and had $115.0 million of availability under the ABL Credit Facility. |
57
Table of Contents
SELECTED HISTORICAL CONSOLIDATED FINANCIAL AND OTHER DATA
Set forth below is our selected historical consolidated financial and other data as of the dates and for the periods indicated. We have derived the selected historical consolidated statements of operations data and consolidated statements of cash flows data for the fiscal years ended June 2, 2018 and June 1, 2019 and the selected historical consolidated balance sheet data as of June 2, 2018 and June 1, 2019 from our audited historical consolidated financial statements included elsewhere in this prospectus. Our historical audited results are not necessarily indicative of the results that should be expected in any future period.
We have derived the selected historical condensed consolidated statements of operations data and condensed consolidated statements of cash flows data for the 26-week periods ended December 1, 2018 and November 30, 2019 and the selected historical condensed consolidated balance sheet data as of November 30, 2019 from our unaudited historical condensed consolidated financial statements included elsewhere in this prospectus. With the exception of the adoption of Topic 842, which we adopted on a modified retrospective basis on June 2, 2019, the first day of fiscal year 2020, our unaudited condensed consolidated financial statements were prepared on a basis consistent with the audited consolidated financial statements and, have included all adjustments, consisting only of normal recurring adjustments that, in our opinion, are necessary to present fairly the financial information set forth in those statements. The results for any interim period are not necessarily indicative of the results that may be expected for the full year and our historical unaudited results are not necessarily indicative of the results that should be expected in any future period.
You should read the following selected historical consolidated financial and other data below together with the information under “Capitalization,” “Management’s Discussion and Analysis of Financial Condition and Results of Operations,” our audited consolidated financial statements and related notes thereto and our unaudited condensed consolidated financial statements and related notes thereto, each included elsewhere in this prospectus.
| Fiscal Year Ended | 26-Week Period Ended | |||||||||||||||
| June 2, 2018 | June 1, 2019 | December 1, 2018 |
November 30, 2019 |
|||||||||||||
| (In thousands, except share and per share amounts) | ||||||||||||||||
| Consolidated Statements of Operations Data(1): |
||||||||||||||||
| Revenue |
$ | 601,566 | $ | 686,576 | $ | 351,462 | $ | 403,083 | ||||||||
| Cost of sales |
326,218 | 359,372 | 181,499 | 218,200 | ||||||||||||
|
|
|
|
|
|
|
|
|
|||||||||
| Gross profit |
275,348 | 327,204 | 169,963 | 184,883 | ||||||||||||
| Selling, general and administrative expense |
249,875 | 264,674 | 128,481 | 145,992 | ||||||||||||
|
|
|
|
|
|
|
|
|
|||||||||
| Operating income |
25,473 | 62,530 | 41,482 | 38,891 | ||||||||||||
| Interest expense, net |
20,854 | 21,893 | 10,344 | 12,106 | ||||||||||||
| Loss on debt modification and extinguishment |
— | 3,075 | — | — | ||||||||||||
| Other (income), net |
(216 | ) | (342 | ) | (189 | ) | (127 | ) | ||||||||
|
|
|
|
|
|
|
|
|
|||||||||
| Income before income taxes |
4,835 | 37,904 | 31,327 | 26,912 | ||||||||||||
| Income tax (benefit) expense |
(18,268 | ) | 4,767 | 1,878 | 2,147 | |||||||||||
|
|
|
|
|
|
|
|
|
|||||||||
| Net income |
$ | 23,103 | $ | 33,137 | $ | 29,449 | $ | 24,765 | ||||||||
|
|
|
|
|
|
|
|
|
|||||||||
| Per Share Data(2): |
||||||||||||||||
| Net income per share attributable to common stockholders—basic and diluted |
$ | 23,102.82 | $ | 33,136.97 | $ | 29,448.90 | $ | 24,764.66 | ||||||||
| Weighted average common shares outstanding—basic and diluted |
1,000 | 1,000 | 1,000 | 1,000 | ||||||||||||
58
Table of Contents
| Fiscal Year Ended | 26-Week Period Ended | |||||||||||||||
| June 2, 2018 | June 1, 2019 | December 1, 2018 |
November 30, 2019 |
|||||||||||||
| (In thousands, except percentages) | ||||||||||||||||
| Consolidated Balance Sheet Data (end of period)(1): |
||||||||||||||||
| Cash |
$ | 23,476 | $ | 37,862 | $ | 10,786 | ||||||||||
| Total assets |
538,649 | 587,858 | 737,029 | |||||||||||||
| Total debt(3) |
300,847 | 280,247 | 277,396 | |||||||||||||
| Total stockholders’ equity |
132,552 | 164,789 | 189,298 | |||||||||||||
| Consolidated Statements of Cash Flow Data(1): |
||||||||||||||||
| Cash flows provided by (used in): |
||||||||||||||||
| Operating activities |
$ | 50,491 | $ | 55,168 | $ | 30,827 | $ | (12,829 | ) | |||||||
| Investing activities |
(15,991 | ) | (17,745 | ) | (8,628 | ) | (10,580 | ) | ||||||||
| Financing activities |
(23,219 | ) | (22,929 | ) | (12,490 | ) | (3,625 | ) | ||||||||
| Other Financial Data and Operational Data: |
||||||||||||||||
| North America DTC comparable sales growth (decline) |
(0.1 | )% | 13.0 | % | 13.1 | % | 3.0 | % | ||||||||
| Adjusted EBITDA(4) |
$ | 60,072 | $ | 94,774 | $ | 57,117 | $ | 62,370 | ||||||||
| Adjusted EBITDA margin(4) |
10.0 | % | 13.8 | % | 16.3 | % | 15.5 | % | ||||||||
| (1) | See Notes 2 and 3 to our audited consolidated financial statements included elsewhere in this prospectus for additional information regarding the impact of our adoption of Topic 606 on our consolidated financial statements. See Notes 2 and 9 to our unaudited condensed consolidated financial statements included elsewhere in this prospectus for additional information regarding the impact of our adoption of Topic 842 on our unaudited condensed consolidated financial statements. |
| (2) | See Note 18 to our audited consolidated financial statements and Note 14 to our unaudited condensed consolidated financial statements included elsewhere in this prospectus for an explanation of the calculations of net income per share attributable to common stockholders, basic and diluted. |
| (3) | Total debt equals current and non-current portions of long-term debt, net of discount and debt issuance costs. |
| (4) | We define Adjusted EBITDA as net income, plus interest expense, net, income tax (benefit) expense and depreciation and amortization, net, further adjusted to exclude impairment charges, (gain) loss on disposals of property and equipment, loss on debt modification and extinguishment, other (income), net and certain IPO costs. We describe these adjustments reconciling net income to Adjusted EBITDA in the table below. We define Adjusted EBITDA margin as Adjusted EBITDA as a percentage of revenue. |
We present Adjusted EBITDA and Adjusted EBITDA margin because we believe they are useful indicators of our operating performance. Our management uses Adjusted EBITDA and Adjusted EBITDA margin principally as measures of our operating performance and believes that Adjusted EBITDA and Adjusted EBITDA margin are useful to investors because they are frequently used by analysts, investors and other interested parties to evaluate companies in our industry. We also believe Adjusted EBITDA and Adjusted EBITDA margin are useful to our management and investors as a measure of comparative operating performance from period to period.
Adjusted EBITDA and Adjusted EBITDA margin are non-GAAP financial measures and should not be considered as alternatives to net income as a measure of financial performance or cash provided by operating activities as a measure of liquidity, or any other performance measure derived in accordance with GAAP, and they should not be construed as an inference that our future results will be unaffected by unusual or non-recurring items. In evaluating Adjusted EBITDA and Adjusted EBITDA margin, you should be aware that in the future we may incur expenses that are the same as or similar to some of the adjustments in this presentation. Our presentation of Adjusted EBITDA and Adjusted EBITDA margin should not be construed to imply that our future results will be unaffected by any such adjustments. Management compensates for these limitations by primarily relying on our GAAP results in addition to using Adjusted EBITDA and Adjusted EBITDA margin as a supplement.
59
Table of Contents
Our Adjusted EBITDA measures have limitations as analytical tools, and you should not consider them in isolation, or as substitutes for analysis of our results as reported under GAAP. Some of these limitations are:
| • | they do not reflect costs or cash outlays for capital expenditures or contractual commitments; |
| • | they do not reflect changes in, or cash requirements for, our working capital needs; |
| • | they do not reflect the interest expense, net or the cash requirements necessary to service interest or principal payments on our debt; |
| • | they do not reflect period-to-period changes in taxes, income tax expense or the cash necessary to pay income taxes; |
| • | they do not reflect the impact of earnings or charges resulting from matters we consider not to be indicative of our ongoing operations; |
| • | although depreciation and amortization are non-cash charges, the assets being depreciated and amortized will often have to be replaced in the future, and they do not reflect cash requirements for such replacements; and |
| • | other companies in our industry may calculate these measures differently than we do, limiting their usefulness as comparative measures. |
Because of these limitations, Adjusted EBITDA and Adjusted EBITDA margin should not be considered as measures of discretionary cash available to invest in business growth or to reduce indebtedness.
The following table provides a reconciliation of net income to Adjusted EBITDA for the periods presented:
| Fiscal Year Ended | 26-Week Period Ended | |||||||||||||||
| June 2, 2018 | June 1, 2019 | December 1, 2018 |
November 30, 2019 |
|||||||||||||
| (In thousands, except percentages) | ||||||||||||||||
| Net income |
$ | 23,103 | $ | 33,137 | $ | 29,449 | $ | 24,765 | ||||||||
| Interest expense, net |
20,854 | 21,893 | 10,344 | 12,106 | ||||||||||||
| Income tax (benefit) expense |
(18,268 | ) | 4,767 | 1,878 | 2,147 | |||||||||||
| Depreciation and amortization, net(a) |
34,667 | 32,152 | 15,699 | 15,768 | ||||||||||||
| Impairment charges(b) |
— | 192 | — | 1,643 | ||||||||||||
| (Gain) loss on disposals of property and equipment(c) |
(68 | ) | (100 | ) | (64 | ) | (6 | ) | ||||||||
| Loss on debt modification and extinguishment(d) |
— | 3,075 | — | — | ||||||||||||
| Other (income), net(e) |
(216 | ) | (342 | ) | (189 | ) | (127 | ) | ||||||||
| IPO costs(f) |
— | — | — | 6,074 | ||||||||||||
|
|
|
|
|
|
|
|
|
|||||||||
| Adjusted EBITDA |
$ | 60,072 | $ | 94,774 | $ | 57,117 | $ | 62,370 | ||||||||
|
|
|
|
|
|
|
|
|
|||||||||
| Revenue |
$ | 601,566 | $ | 686,576 | $ | 351,462 | $ | 403,083 | ||||||||
| Adjusted EBITDA margin |
10.0 | % | 13.8 | % | 16.3 | % | 15.5 | % | ||||||||
| (a) | Excludes amortization included in interest expense, net. |
| (b) | Represents non-cash store impairment charges. |
| (c) | Represents the non-cash gain on disposals of property and equipment. |
| (d) | Represents the loss on debt modification and extinguishment in connection with the refinancing of the Term Loan Facility in February 2019. |
| (e) | Primarily represents foreign currency transaction (gains) and losses associated with our international subsidiaries and realized and unrealized (gains) and losses on our foreign currency forward contracts. |
| (f) | Represents non-recurring expenses primarily composed of legal, accounting and professional fees incurred in connection with this offering, which are included within selling, general and administrative expenses. |
60
Table of Contents
MANAGEMENT’S DISCUSSION AND ANALYSIS OF FINANCIAL CONDITION
AND RESULTS OF OPERATIONS
The following discussion and analysis of our financial condition and results of operations should be read in conjunction with “Summary—Summary Historical Consolidated Financial and Other Data,” “Selected Historical Consolidated Financial and Other Data” and our consolidated financial statements and related notes thereto included elsewhere in this prospectus. The following discussion contains forward-looking statements that reflect our plans, estimates and assumptions. Our actual results could differ materially from those discussed in any forward-looking statements. Factors that could cause such differences are discussed in the sections of this prospectus titled “Risk Factors” and “Forward-Looking Statements.”
We conduct substantially all of our activities through our direct wholly owned subsidiary, Cole Haan LLC, and its subsidiaries. We operate on a 52 or 53-week fiscal year that ends on the Saturday closest to May 31 of that year. In a 52-week fiscal year, each quarter contains 13 weeks of operations, and in the years with 53 weeks, the fourth quarter contains 14 weeks of operations. References to fiscal year 2018 and fiscal year 2019 relate to our fiscal years ended June 2, 2018 and June 1, 2019, respectively, each a 52-week period.
Overview
Cole Haan is a global lifestyle brand serving always-connected, active professionals with innovative footwear and lifestyle accessories. We market footwear and lifestyle accessories across the Dress, Casual, Outdoor and Sport use occasions. Over the past several years, our footwear offering has broadened from a focus on the Dress use occasion to include a broader selection of Casual, Outdoor and Sport use occasions, which comprised 53% of our fiscal year 2019 footwear revenue. We have built a global, multi-channel distribution network across 64 countries that includes our global digital flagship site, colehaan.com, 368 stores and over 450 diverse global wholesale accounts.
Since our 2013 Acquisition, we have completed over $100.0 million in transformational investments in technology, digital infrastructure, product innovation and other areas, which we believe have positioned us for growth. We plan to grow our business by expanding our product offerings to earn more share of our customers’ closets, continuing to engage in customer acquisition and retention efforts that drive long-term customer relationships, and continuing to grow our North America DTC, North America Wholesale and International businesses.
Our Segments
Our business is operated through two geographic regions that comprise our two reportable segments. We measure each operating segment’s performance based on revenue and Segment Adjusted EBITDA.
Our North America segment comprises our DTC business, which includes our digital flagship site, colehaan.com, and 112 stores in the United States and Canada, and wholesale distribution in the United States to a diverse account base spanning digital pureplay, specialty retail, premium department store, sporting goods and family footwear accounts. Over 96% of our North America segment revenue was generated from the United States in each of fiscal year 2018 and fiscal year 2019 and the 26-week period ended December 1, 2018 and the 26-week period ended November 30, 2019. In Canada, in addition to our DTC sales, we generate revenue by selling our products to a distributor who then sells to regional wholesale accounts. In addition, we license to third parties the design, development and distribution of certain product categories, including small leather goods, eyewear, outerwear, hosiery, suiting and cold weather goods. Our North America segment represented 84.3% and 85.7% of our revenue for fiscal year 2018 and fiscal year 2019, respectively, and 86.7% and 86.1% of our revenue for the 26-week period ended December 1, 2018 and the 26-week period ended November 30, 2019, respectively.
Our International segment includes our wholly owned Japanese subsidiary and partnerships with leading regional distributors and wholesalers. In Japan, where we have operated for nearly 25 years, our footprint is
61
Table of Contents
primarily DTC, consisting of 80 stores and our localized digital commerce site, colehaan.co.jp. Outside of Japan, the remainder of our International sales occur in over 60 countries. In these markets, we employ a capital-efficient model where our 37 regional distributors fund the cost to build and operate 176 Cole Haan designed and branded stores. Typically, we retain digital commerce rights, while our distributors have local distribution rights. We have also successfully expanded our wholesale business in countries where we operate directly, including the United Kingdom and Japan. Our International segment represented 15.7% and 14.3% of our revenue for fiscal year 2018 and fiscal year 2019, respectively, and 13.3% and 13.9% of our revenue for the 26-week period ended December 1, 2018 and the 26-week period ended November 30, 2019, respectively.
The following table sets forth, for the periods indicated, our revenue and Segment Adjusted EBITDA:
| Fiscal Year Ended | 26-Week Period Ended | |||||||||||||||
| June 2, 2018 | June 1, 2019 | December 1, 2018 |
November 30, 2019 |
|||||||||||||
| (In thousands) | ||||||||||||||||
| Revenue: |
||||||||||||||||
| North America |
$ | 506,904 | $ | 588,174 | $ | 304,604 | $ | 346,989 | ||||||||
| International |
94,662 | 98,402 | 46,858 | 56,094 | ||||||||||||
|
|
|
|
|
|
|
|
|
|||||||||
| Total revenue |
$ | 601,566 | $ | 686,576 | $ | 351,462 | $ | 403,083 | ||||||||
|
|
|
|
|
|
|
|
|
|||||||||
| Segment Adjusted EBITDA: |
||||||||||||||||
| North America |
$ | 47,764 | $ | 77,182 | $ | 48,344 | $ | 48,771 | ||||||||
| International |
12,308 | 17,592 | 8,773 | 13,599 | ||||||||||||
Factors Affecting Our Business
We believe that our business and growth depend on a number of factors that present significant opportunities for us and may pose risks and challenges, including those discussed below and under “Risk Factors.”
| • | Growth in DTC Sales. Our DTC sales have driven our growth and we expect it to continue to be a key driver of our future growth and profitability. Globally, we will seek to continue to expand our DTC sales by increasing the number of active DTC customers across our sites and stores, leveraging our investments in CRM and omni-channel technology to strengthen our customer relationships and engagement, and selectively growing our store fleet with highly productive, digitally connected small space locations. We expect that the change in our number of active DTC customers may not directly correspond to the change in our DTC sales because we only record active DTC customers once certain of their data is captured in our CRM database, and such customers may have previously made DTC purchases without sharing their customer data such that they would not be previously identified as an active DTC customer. |
| • | Expanding Existing Products and Adding New Products. Scaling of our core footwear franchises, growth into Sport, Casual and Outdoor footwear use occasions and expansion of our lifestyle accessories products have contributed meaningfully to our performance. Our success has been enabled by the breadth of our product portfolio, our consumer-insight driven approach to product creation and our leading innovation capabilities. We intend to increase our market share in our existing products and continue investing in the development and introduction of new products, which we expect will help us to earn more share of our customers’ closets and support future growth. |
| • | Global Wholesale and Distributor Expansion. We seek to maintain a diverse multi-channel distribution network and plan to continue growing our wholesale and distribution partnerships. In North America, we plan to continue growing sales of our products to our existing wholesale partners across store and digital commerce formats, and continue to diversify our U.S. wholesale account base. We also expect to leverage our wholesale partners’ investments in digital commerce and our drop-ship capabilities to |
62
Table of Contents
| offer their customers an expanded selection of Cole Haan products on their websites. In our International segment, we intend to leverage existing distributor relationships to increase the number of distributor-operated stores globally, and selectively expand our wholesale presence across regions. |
| • | Macroeconomic Trends. Macroeconomic factors may affect consumer spending patterns and thereby our results of operations. These factors include general economic conditions, consumer confidence, employment rates, business conditions, changes in the housing market, the availability of credit, interest rates, tax rates and fuel and energy costs. Factors that impact consumer discretionary spending, which remains volatile globally, continue to create a complex and challenging retail environment for us and our wholesale and distribution partners. |
| • | Increased Competition. The global footwear and lifestyle accessories markets are highly competitive and fragmented. We compete against a wide range of designers and manufacturers of footwear and lifestyle accessories, both domestic and international, across a wide range of retail price points. Some of our competitors may be significantly larger and have substantially greater resources than us. Our competitive set includes both established companies that are seeking to expand their market share and new entrants to the market. |
| • | Sourcing and Supply Chain Management. For our business to be successful, our suppliers must provide us with quality products in substantial quantities, in compliance with regulatory requirements, at acceptable costs and on a timely basis. Competition for resources throughout the supply chain, such as production and transportation capacities, has increased. Trends affecting the supply chain include the impact of fluctuating prices of labor and raw materials on our suppliers. In addition, the announcement or imposition of any new or increased tariffs, duties or taxes as a result of trade or political tensions between the United States and other countries or otherwise could adversely affect our supply chain. |
We are also carefully monitoring the ongoing coronavirus health crisis in Greater China, which developed ahead of a peak traveling and shopping season around the Lunar New Year on January 25, 2020. The outbreak of the coronavirus in Greater China could adversely affect our business, results of operations and financial condition. The coronavirus outbreak may materially impact our sourcing and manufacturing operations as a portion of our products are manufactured in China and materials for our products are sourced in China by our manufacturers within Greater China and in other affected regions. Travel within China and into other countries may be restricted, which may impact our manufacturers’ ability to obtain necessary materials and inhibit travel of our and our manufacturers’ and material suppliers’ employees, which may in turn reduce our work force and that of our manufacturers and material suppliers. As a result of such reduced workforces, potential factory closures, inability to obtain materials, disruptions in the supply chain and potential disruption of transportation of goods produced in China or other countries adversely impacted by the coronavirus outbreak, or threat or perceived threat of such outbreak, we may be unable to obtain adequate inventory or samples sources from these regions, which could adversely affect our business, results of operations and financial condition. Furthermore, our existing suppliers, such as our suppliers located in India and Vietnam, or new suppliers or sources of materials may pass the increase in sourcing costs due to the coronavirus outbreak to us through price increases, thereby impacting our margins. Material changes in the pricing practices of our suppliers could negatively impact our profitability.
In addition, as of February 14, 2020, one of our distributors operates 18 stores in Greater China and has temporarily closed certain locations while its remaining locations are operating with reduced hours and experiencing significantly reduced consumer foot traffic, which we expect will result in lost sales. Moreover, our business, results of operations and financial condition could be further adversely affected if the coronavirus outbreak expands to other countries where we have a significant number of stores, partnerships with regional distributors and wholesalers and/or sourcing and manufacturing operations. If the retail economy weakens and/or consumer behavior shifts due to the coronavirus outbreak or threat or perceived threat of such outbreak, we or our distributors may need to significantly reduce or limit store operations and/or close additional stores and retailers may be more cautious with orders. A slowing or changing economy in the regions adversely affected by the coronavirus outbreak could adversely affect the financial health of our distributors and wholesale partners, which in turn could have an adverse effect on our business, results of operations and financial condition. While
63
Table of Contents
this global health emergency is expected to be temporary, the duration and intensity of the disruption is uncertain, including potential broader impacts outside of China if travel and tourist traffic is further restricted and there is a resulting decline in Chinese tourist spending in other regions. The dynamic nature and uncertainty of these circumstances may have adverse consequences on our results of operations for the fourth quarter of fiscal year 2020 and may negatively impact future fiscal periods in the event of prolonged disruptions associated with the outbreak.
Impact of Variability of Calendar on Comparability of Our Quarterly Results
Our fiscal year ends on the Saturday closest to May 31 and, consequently, our interim fiscal quarters typically end on the Saturday closest to the last calendar day of August, November and February. The following table sets forth the percentage of our total revenue represented by each of our fiscal quarters over the last two fiscal years:
| Percentage of Annual Revenue | Q1 | Q2 | Q3 | Q4 | ||||||||||||
| Fiscal Year 2018 |
20.8 | % | 30.1 | % | 23.0 | % | 26.1 | % | ||||||||
| Fiscal Year 2019 |
22.5 | % | 28.7 | % | 23.1 | % | 25.7 | % | ||||||||
Many major holidays typically occur near the end of our fiscal quarters and the exact timing of these holidays may impact our results in a given quarter. As a result of the variability of when holidays occur in the calendar, comparing the results of our fiscal quarters to the comparable period of prior fiscal years may not be indicative of our underlying performance.
For example, we typically generate a significant amount of North America segment revenue during the holiday shopping period extending generally from Thanksgiving to Christmas. Our second fiscal quarter usually ends on the Saturday closest to November 30, so the timing of Thanksgiving in a given year determines how much of the holiday shopping period is included in the second quarter compared to the third quarter of our fiscal year. As a result, our second and third quarter results for fiscal years in which Thanksgiving falls later in November may not be comparable to our second and third quarter results for fiscal years in which Thanksgiving falls earlier in November.
In fiscal year 2018 and fiscal year 2019, Thanksgiving fell on November 23, 2017 and November 22, 2018, respectively, which had the effect of including nine days of the holiday shopping period in the second quarter of each fiscal year. However, due to Thanksgiving occurring on November 28, 2019 in fiscal year 2020, we expect more holiday shopping period sales to occur in the third quarter of fiscal year 2020.
64
Table of Contents
How We Assess the Performance of Our Business
Our management considers a number of financial and operating metrics, including the following key metrics, to evaluate our business, measure our performance, identify trends affecting our business, determine the allocation of resources, make decisions regarding corporate strategies and evaluate projections. These metrics include operational measures and non-GAAP metrics supplemental to our GAAP results. The following table sets forth our key performance metrics for the periods presented, which are further discussed below:
| Fiscal Year Ended | 26-Week Period Ended | |||||||||||||||
| June 2, 2018 | June 1, 2019 | December 1, 2018 |
November 30, 2019 |
|||||||||||||
| (In thousands, except percentages and store data) |
||||||||||||||||
| North America DTC Comparable Sales Growth (Decline) |
(0.1 | )% | 13.0 | % | 13.1 | % | 3.0 | % | ||||||||
| Category Sales: |
||||||||||||||||
| Footwear |
$ | 542,441 | $ | 632,707 | $ | 322,965 | $ | 378,289 | ||||||||
| Lifestyle Accessories |
$ | 59,125 | $ | 53,869 | $ | 28,497 | $ | 24,794 | ||||||||
| Global Store Count (at period end) |
284 | 368 | 302 | 385 | ||||||||||||
| Adjusted EBITDA |
$ | 60,072 | $ | 94,774 | $ | 57,117 | $ | 62,370 | ||||||||
| Segment Adjusted EBITDA: |
||||||||||||||||
| North America |
$ | 47,764 | $ | 77,182 | $ | 48,344 | $ | 48,771 | ||||||||
| International |
$ | 12,308 | $ | 17,592 | $ | 8,773 | $ | 13,599 | ||||||||
North America DTC Comparable Sales Growth (Decline)
North America DTC comparable sales growth allows us to evaluate how our store base and sites are performing on a comparable basis. We calculate North America DTC comparable sales as follows: (i) sales from our digital flagship site, colehaan.com, and our directly operated stores in the United States and Canada are included, excluding the impact of foreign exchange; (ii) stores are added to the calculation in their 13th full fiscal month of operation; (iii) sales for stores that are closed or shut down are removed from the calculation for time periods that are not comparable; (iv) sales from partial months of operation are ignored when stores do not open or close on the first day of the month; (v) sales for stores that are either relocated, remodeled or generally closed for 30 or more consecutive days for renovation are also excluded until such stores have been operating in their new location or in their newly renovated state for at least 13 full fiscal months; and (vi) when applicable, we adjust for the effect of the 53rd week. Our calculation of North America DTC comparable sales may not be comparable to similar data made available by other retailers. We measure North America DTC comparable sales growth as the increase or decrease in North America DTC comparable sales for a reporting period, compared to the prior reporting period.
Category Sales
We assess our revenue by major product categories—footwear and lifestyle accessories—in order to evaluate the performance of each of our product categories and inform our product development process.
Global Store Count
The total number of stores that sell our products directly to customers globally, including both Company-operated stores in the United States, Canada and Japan and distributor-operated stores in international markets, as well as the timing of store openings and closings, have, and will continue to have, an impact on our performance. In fiscal year 2018, we opened five Company-operated stores and closed ten Company-operated stores, and our distributors opened 35 stores and closed 21 stores. In fiscal year 2019, we opened 17 Company-operated stores and closed eight Company-operated stores, and our distributors opened 98 stores and closed 23 stores. In the 26-week period ended December 1, 2018, we opened four Company-operated stores and closed two Company-
65
Table of Contents
operated stores, and our distributors opened 25 stores and closed nine stores. In the 26-week period ended November 30, 2019, we opened four Company-operated stores and closed one Company-operated store, and our distributors opened 23 stores and closed nine stores.
Adjusted EBITDA
We use Adjusted EBITDA to supplement GAAP measures of performance to evaluate the effectiveness of our business strategies, to make budgeting decisions, to establish discretionary annual incentive compensation and to compare our performance against that of other peer companies using similar measures. We define Adjusted EBITDA as net income, as adjusted to exclude (i) interest expense, net; (ii) income tax (benefit) expense; (iii) depreciation and amortization, net; (iv) impairment charges; (v) (gain) loss on disposals of property and equipment; (vi) loss on debt modification and extinguishment; (vii) other (income), net; and (viii) certain IPO costs. Our definition of Adjusted EBITDA may not be comparable to similarly titled measures of other companies. For a discussion of Adjusted EBITDA and the limitation on its use, and the reconciliation of Adjusted EBITDA to net income, the most directly comparable GAAP financial measure, see “—Non-GAAP Financial Measures” below.
Segment Adjusted EBITDA
Our Chief Executive Officer has been identified as the chief operating decision maker, or CODM. We determined that our measure of segment profitability is Adjusted EBITDA of each reportable segment. Accordingly, our CODM evaluates the performance of each of our segments based primarily on Segment Adjusted EBITDA. Our CODM also, in part, allocates resources based on Segment Adjusted EBITDA. Segment Adjusted EBITDA excludes from net income: (i) interest expense, net; (ii) income tax (benefit) expense; (iii) depreciation and amortization, net; (iv) impairment charges; (v) (gain) loss on disposals of property and equipment; (vi) loss on debt modification and extinguishment; (vii) other (income), net; and (viii) certain IPO costs. The costs of all corporate departments that serve the respective segment are fully allocated. We do not allocate amounts reported below operating income to our reportable segments. Our definition of Segment Adjusted EBITDA may not be comparable to similarly titled measures of other companies.
Components of Our Results of Operations
Revenue
We derive our revenue from the sale of footwear and lifestyle accessories, including handbags, small leather goods, hosiery, shoe care, eyewear, outerwear, suiting and cold weather goods. Our sales include direct sales to customers at our sites and stores and sales to wholesale partners and distributors. Our licensing revenue primarily consists of sales-based royalties paid to us from licensees in exchange for the use of our trademarks in connection with the design, development and distribution of selected lifestyle accessories, including small leather goods, eyewear, outerwear, hosiery, suiting and cold weather goods. All revenue transactions involving a third party are presented on a gross basis.
Our revenue transactions generally comprise a single performance obligation, which consists of the sale of products to customers, and we satisfy the performance obligation and record revenue when transfer of control has passed to the customer. Transfer of control passes to wholesale partners and digital commerce customers upon shipment and to retail store customers at the time of sale. Our licensing revenue is recognized over the license period. Gift card revenue recognition occurs when the gift card is redeemed by the consumer. Provisions for sales discounts, returns and miscellaneous claims from customers are made at the time of sale, and reflect the most likely amount we anticipate being entitled to receive based on historical experience and current trends, and are recorded as a reduction of revenue. See “—Critical Accounting Policies and Significant Estimates—Revenue Recognition.”
66
Table of Contents
Cost of Sales
Cost of sales includes all costs to make products saleable, such as design, product development and tooling costs, materials, inbound freight, customs charges and duties, purchasing and receiving costs, depreciation and warehousing and distribution costs, including digital commerce fulfillment fees. Shipping and handling costs associated with outbound freight after control over a product has transferred to a customer are accounted for as fulfillment costs as incurred and are included in cost of sales when the related revenue is recognized. The components of our cost of sales may not be comparable to other retailers. The changes in our cost of sales generally correspond with the changes in revenue and may be impacted by any significant fluctuations in the components of our cost of sales.
Gross Profit and Gross Profit Margin
Gross profit is calculated as revenue less cost of sales. Gross profit margin is calculated as gross profit divided by revenue. Gross profit margin is dependent upon a variety of factors, including changes in the relative sales mix among our sales channels, changes in the mix of products sold, the average price of our products, the timing and level of promotional activities, increases or decreases in inventory sell-through levels, the impact of fluctuations in material and labor costs on our suppliers and changes in transportation costs, tariffs and foreign currency exchange rates. These factors, among others, may cause gross profit margin to fluctuate from period to period. In the near term, we expect a change in sales mix among channels, a reduction in inventory sell through of certain products and the impact of tariffs that went into effect in September 2019 will negatively affect our gross profit margins.
Selling, General and Administrative Expense
Selling, general and administrative expense, or SG&A, consists of all operating costs not otherwise included in cost of sales. These expenses include corporate and store-level compensation and benefits expense, including stock-based compensation, rent and occupancy costs, insurance costs, professional fees, corporate facility costs, depreciation and amortization expense for tangible and intangible assets, information technology costs and other professional service costs. SG&A also includes marketing expenses, which consist of advertising and promotional costs, including costs of digital media and print advertising, public relations, brand events and retail brand presentation.
Selling costs generally correlate to revenue timing and therefore experience similar variability. As a percentage of sales, we believe these selling costs will decrease over time as our business continues to scale. In the past, our general and administrative expense has increased as we have made targeted investments in talent and infrastructure. Going forward, we anticipate limited additional investments in these areas, including investments to operate as a public company.
We expect to incur transaction costs and stock-based compensation expense in connection with this offering and we anticipate a significant increase in accounting, legal and professional fees, corporate governance and financial compliance costs associated with being a public company. We estimate our annual ongoing public company costs, including additions to headcount but excluding stock-based compensation expense, will be between $15 million and $17 million. We began to incur such costs in the 26-week period ended November 30, 2019.
Interest Expense, Net
Interest expense, net consists primarily of cash and non-cash interest on borrowings under the Term Loan Facility and ABL Credit Facility, partially offset by interest earned on our cash.
67
Table of Contents
Other (Income), Net
Other (income), net consists primarily of foreign currency transaction gains and losses associated with our international subsidiaries that are denominated in currencies other than our foreign subsidiaries’ functional currencies and realized and unrealized gains and losses on our foreign currency forward contracts.
Income Taxes
We are subject to income taxes in the jurisdictions in which we operate and, consequently, income tax expense is a function of the allocation of taxable income by jurisdiction and the various activities that impact the timing of taxable events. The primary regions that are applicable to the determination of our effective tax rate are the United States, the Netherlands, Japan and Canada. Our effective tax rate will vary depending upon the relative proportion of foreign to U.S. earnings, changes in the value and realizability of our deferred tax assets and liabilities, changes in indemnified taxes and changes to tax laws and rulings in the jurisdictions in which we do business.
Results of Operations
The following table sets forth our results of operations for the periods presented:
| Fiscal Year Ended | 26-Week Period Ended | |||||||||||||||
| June 2, 2018 | June 1, 2019 | December 1, 2018 |
November 30, 2019 |
|||||||||||||
| (In thousands) |
||||||||||||||||
| Consolidated Statement of Operations Data: |
||||||||||||||||
| Revenue |
$ | 601,566 | $ | 686,576 | $ | 351,462 | $ | 403,083 | ||||||||
| Cost of sales |
326,218 | 359,372 | 181,499 | 218,200 | ||||||||||||
|
|
|
|
|
|
|
|
|
|||||||||
| Gross profit |
275,348 | 327,204 | 169,963 | 184,883 | ||||||||||||
| Selling, general and administrative expense |
249,875 | 264,674 | 128,481 | 145,992 | ||||||||||||
|
|
|
|
|
|
|
|
|
|||||||||
| Operating income |
25,473 | 62,530 | 41,482 | 38,891 | ||||||||||||
| Interest expense, net |
20,854 | 21,893 | 10,344 | 12,106 | ||||||||||||
| Loss on debt modification and extinguishment |
— | 3,075 | — | — | ||||||||||||
| Other (income), net |
(216 | ) | (342 | ) | (189 | ) | (127 | ) | ||||||||
|
|
|
|
|
|
|
|
|
|||||||||
| Income before income taxes |
4,835 | 37,904 | 31,327 | 26,912 | ||||||||||||
| Income tax (benefit) expense |
(18,268 | ) | 4,767 | 1,878 | 2,147 | |||||||||||
|
|
|
|
|
|
|
|
|
|||||||||
| Net income |
$ | 23,103 | $ | 33,137 | $ | 29,449 | $ | 24,765 | ||||||||
|
|
|
|
|
|
|
|
|
|||||||||
The following table sets forth our results of operations as a percentage of revenue for the periods presented:
| Fiscal Year Ended | 26-Week Period Ended | |||||||||||||||
| June 2, 2018 | June 1, 2019 | December 1, 2018 |
November 30, 2019 |
|||||||||||||
| Consolidated Statement of Operations Data: |
||||||||||||||||
| Cost of sales |
54.2 | % | 52.3 | % | 51.6 | % | 54.1 | % | ||||||||
| Gross profit |
45.8 | % | 47.7 | % | 48.4 | % | 45.9 | % | ||||||||
| Selling, general and administrative expense |
41.5 | % | 38.5 | % | 36.6 | % | 36.2 | % | ||||||||
| Operating income |
4.2 | % | 9.1 | % | 11.8 | % | 9.6 | % | ||||||||
| Interest expense, net |
3.5 | % | 3.2 | % | 2.9 | % | 3.0 | % | ||||||||
| Loss on debt modification and extinguishment |
— | 0.4 | % | — | — | |||||||||||
| Other (income), net |
— | — | (0.1 | )% | — | |||||||||||
| Income before income taxes |
0.8 | % | 5.5 | % | 8.9 | % | 6.7 | % | ||||||||
| Income tax (benefit) expense |
(3.0 | )% | 0.7 | % | 0.5 | % | 0.5 | % | ||||||||
| Net income |
3.8 | % | 4.8 | % | 8.4 | % | 6.1 | % | ||||||||
68
Table of Contents
The 26-Week Period Ended November 30, 2019 Compared to the 26-Week Period Ended December 1, 2018
Revenue
Revenue increased by $51.6 million, or 14.7%, to $403.1 million for the 26-week period ended November 30, 2019 from $351.5 million for the 26-week period ended December 1, 2018. The increase in revenue was driven by our North America and International segments. Our revenue in our North America DTC business was partially impacted by a shift in the post-Thanksgiving holiday selling period, which had the effect of including nine days of the shopping period in the second quarter of fiscal year 2019, compared to two days of such period in the second quarter of fiscal year 2020. Footwear revenue for the 26-week period ended November 30, 2019 increased by 17.1%, compared to the 26-week period ended December 1, 2018, led by growth across use occasions and in both men’s and women’s. Lifestyle accessories revenue for the 26-week period ended November 30, 2019 decreased by 13.0% compared to the 26-week period ended December 1, 2018, primarily due to the repositioning of certain previously licensed categories, including handbags, as part of a strategic decision to manage them under an in-house model during fiscal year 2020.
Segment Revenue
The following table sets forth, for the periods presented, revenue for our segments, types of channels and the percentage changes between the periods:
| 26-Week Period Ended | ||||||||||||
| December 1, 2018 | November 30, 2019 | % Change | ||||||||||
| (In thousands, except percentages) |
||||||||||||
| North America: |
||||||||||||
| North America—DTC |
$ | 176,840 | $ | 185,393 | 4.8% | |||||||
| North America—Wholesale and Licensing(1) |
127,764 | 161,596 | 26.5% | |||||||||
|
|
|
|
|
|||||||||
| Total North America |
304,604 | 346,989 | 13.9% | |||||||||
| International: |
||||||||||||
| International—DTC |
32,063 | 33,017 | 3.0% | |||||||||
| International—Wholesale and Distributors |
14,795 | 23,077 | 56.0% | |||||||||
|
|
|
|
|
|||||||||
| Total International |
46,858 | 56,094 | 19.7% | |||||||||
|
|
|
|
|
|||||||||
| Total revenue |
$ | 351,462 | $ | 403,083 | 14.7% | |||||||
|
|
|
|
|
|||||||||
| (1) | Includes sales to a distributor in Canada. |
North America
Revenue in our North America segment for the 26-week period ended November 30, 2019 increased by $42.4 million, or 13.9%, compared to the 26-week period ended December 1, 2018. The increase in revenue in our North America segment was driven by increases in both our DTC and Wholesale and Licensing revenue. Our North America DTC revenue for the 26-week period ended November 30, 2019 increased by $8.6 million, or 4.8%, compared to the 26-week period ended December 1, 2018. This increase reflected North America DTC comparable sales growth of 3.0%, driven by increased unit sales and a net increase of two Company-operated stores as of November 30, 2019, compared to December 1, 2018. The increase in North America DTC comparable sales was primarily led by strong performance in digital commerce, driven by increased traffic on colehaan.com. As discussed above, our revenue and comparable sales were partially impacted by a shift in the post-Thanksgiving holiday selling period. Our North America Wholesale and Licensing revenue for the 26-week period ended November 30, 2019 increased by $33.8 million, or 26.5%, compared to the 26-week period ended
69
Table of Contents
December 1, 2018. This increase was primarily due to sales growth to our wholesale partners of 27.1%, driven by selling performance of our products and partially benefitted from a shift in the timing of quarterly shipments. The sales increase in the 26-week period ended November 30, 2019 also reflected increased growth to our wholesale digital partners.
International
Revenue in our International segment for the 26-week period ended November 30, 2019 increased by $9.2 million, or 19.7%, compared to the 26-week period ended December 1, 2018. The increase in International revenue was driven primarily by an increase in our Wholesale and Distributors revenue, driven by an increase in sales to our distributors, due to a net increase in distributor-operated stores. Our DTC business in Japan also contributed to the growth in revenue, primarily led by growth in digital sales.
Gross Profit and Gross Profit Margin
The following table sets forth our gross profit and gross profit margin for the periods presented:
| 26-Week Period Ended | ||||||||
| December 1, 2018 | November 30, 2019 | |||||||
| (In thousands, except percentages) | ||||||||
| Gross profit |
$ | 169,963 | $ | 184,883 | ||||
| Gross profit margin |
48.4 | % | 45.9 | % | ||||
Gross profit for the 26-week period ended November 30, 2019 increased by $14.9 million, or 8.8%, compared to the 26-week period ended December 1, 2018, reflecting the increase in our revenue. Gross profit margin was 45.9% in the 26-week period ended November 30, 2019 and 48.4% for the 26-week period ended December 1, 2018. Our gross profit margin decline primarily reflected the impact of a change in channel sales mix due to a shift in the post-Thanksgiving holiday selling period described above, and, to a lesser extent, increased sales in certain channels, which generally carry lower gross profit margin rates, and the impact of the tariffs that went into effect in September 2019. The decline in gross profit margin was partially offset by improved product costing as we gained scale and realized product engineering benefits.
Selling, General and Administrative Expense
The following table sets forth our SG&A and the percentage relationship to revenue for the periods presented:
| 26-Week Period Ended | ||||||||
| December 1, 2018 | November 30, 2019 | |||||||
| (In thousands, except percentages) | ||||||||
| Selling, general and administrative expense |
$ | 128,481 | $ | 145,992 | ||||
| As a percentage of revenue |
36.6 | % | 36.2 | % | ||||
SG&A for the 26-week period ended November 30, 2019 increased by $17.5 million, or 13.6%, compared to the 26-week period ended December 1, 2018, primarily due to an increase in expenses associated with our strategic priorities and growth initiatives. Our SG&A for the 26-week period ended November 30, 2019 reflected $9.6 million of IPO and public company costs, including $6.1 million of nonrecurring costs incurred to prepare for this offering. We did not incur any such costs in the 26-week period ended December 1, 2018. The increase in SG&A compared to the 26-week period ended December 1, 2018 also reflected an increase in marketing expense to support our digital marketing strategy, primarily consisting of performance marketing initiatives.
70
Table of Contents
SG&A as a percentage of revenue decreased from 36.6% for the 26-week period ended December 1, 2018 to 36.2% for the 26-week period ended November 30, 2019, as our growth in revenue, which partially benefitted from the shift in timing of wholesale shipments, outpaced the increase in SG&A.
Interest Expense, Net
Interest expense, net for the 26-week period ended November 30, 2019 increased by $1.8 million, or 17.0%, compared to the 26-week period ended December 1, 2018. The increase in interest expense, net during the 26-week period ended November 30, 2019 compared to the 26-week period ended December 1, 2018 was primarily related to a higher effective interest rate on the Term Loan Facility, which was refinanced in February 2019.
Income Tax Expense
Income tax expense for the 26-week period ended November 30, 2019 increased by $0.3 million compared to the 26-week period ended December 1, 2018. Our effective income tax rate was 8.0% for the 26-week period ended November 30, 2019 and 6.0% for the 26-week period ended December 1, 2018. During the 26-week period ended November 30, 2019, we continued to record a valuation allowance on deferred tax assets in certain jurisdictions due to our inability to carry back tax losses or credits. The change in our effective tax rate for the 26-week period ended November 30, 2019 compared to the 26-week period ended December 1, 2018 reflected an increase in current tax on operations in certain jurisdictions.
Net Income
As a result of the factors above, net income for the 26-week period ended November 30, 2019 decreased by $4.7 million, or 15.9%, compared to the 26-week period ended December 1, 2018.
Segment Adjusted EBITDA
The following table sets forth our Segment Adjusted EBITDA for the periods presented:
| 26-Week Period Ended | ||||||||
| December 1, 2018 | November 30, 2019 | |||||||
| (In thousands) | ||||||||
| Reportable Segments Adjusted EBITDA: |
||||||||
| North America |
$ | 48,344 | $ | 48,771 | ||||
| International |
8,773 | 13,599 | ||||||
|
|
|
|
|
|||||
| Total Reportable Segments Adjusted EBITDA |
57,117 | 62,370 | ||||||
| Reconciling items: |
||||||||
| Interest expense, net |
10,344 | 12,106 | ||||||
| Income tax expense |
1,878 | 2,147 | ||||||
| Depreciation and amortization, net(1) |
15,699 | 15,768 | ||||||
| Impairment charges |
— | 1,643 | ||||||
| (Gain) on disposals of property and equipment |
(64 | ) | (6 | ) | ||||
| Other (income), net |
(189 | ) | (127 | ) | ||||
| IPO costs(2) |
— | 6,074 | ||||||
|
|
|
|
|
|||||
| Net income |
$ | 29,449 | $ | 24,765 | ||||
|
|
|
|
|
|||||
| (1) | Excludes amortization included in interest expense, net. |
| (2) | Represents non-recurring expenses primarily composed of legal, accounting and professional fees incurred in connection with this offering, which are included within SG&A. |
71
Table of Contents
North America Segment Adjusted EBITDA was $48.8 million for the 26-week period ended November 30, 2019, an increase of $0.4 million, or 0.9%, from the 26-week period ended December 1, 2018. The increase in North America Segment Adjusted EBITDA reflected increased gross profit driven by our growth in sales, partially offset by an increase in SG&A to support our strategic priorities and growth initiatives.
International Segment Adjusted EBITDA was $13.6 million for the 26-week period ended November 30, 2019, an increase of $4.8 million, or 55.0%, from the 26-week period ended December 1, 2018. The increase in International Segment Adjusted EBITDA primarily reflected increased gross profit, driven by growth in sales.
The Fiscal Year Ended June 1, 2019 Compared to the Fiscal Year Ended June 2, 2018
Revenue
Revenue increased by $85.0 million, or 14.1%, to $686.6 million for fiscal year 2019 from $601.6 million for fiscal year 2018. The increase in revenue was driven by our North America and International segments. Footwear revenue for fiscal year 2019 increased by 16.6% compared to fiscal year 2018, led by growth across use occasions and in both men’s and women’s. Lifestyle accessories revenue for fiscal year 2019 decreased by 8.9%, compared to fiscal year 2018, primarily due to the repositioning of certain previously licensed categories, including handbags, as part of a strategic decision to manage them under an in-house model during fiscal year 2020.
Segment Revenue
The following table sets forth, for the periods presented, revenue for our segments, types of channels and the percentage changes between the periods:
| Fiscal Year Ended | ||||||||||||
| June 2, 2018 | June 1, 2019 | % Change | ||||||||||
| (In thousands, except percentages) |
||||||||||||
| North America: |
||||||||||||
| North America—DTC |
$ | 305,107 | $ | 341,820 | 12.0 | % | ||||||
| North America—Wholesale and Licensing(1) |
201,797 | 246,354 | 22.1 | % | ||||||||
|
|
|
|
|
|||||||||
| Total North America |
506,904 | 588,174 | 16.0 | % | ||||||||
| International: |
||||||||||||
| International—DTC |
63,559 | 64,899 | 2.1 | % | ||||||||
| International—Wholesale and Distributors |
31,103 | 33,503 | 7.7 | % | ||||||||
|
|
|
|
|
|||||||||
| Total International |
94,662 | 98,402 | 4.0 | % | ||||||||
|
|
|
|
|
|||||||||
| Total revenue |
$ | 601,566 | $ | 686,576 | 14.1 | % | ||||||
|
|
|
|
|
|||||||||
| (1) | Includes sales to a distributor in Canada. |
North America
Revenue in our North America segment for fiscal year 2019 increased by $81.3 million, or 16.0%, compared to fiscal year 2018. The increase in revenue in our North America segment was driven by increases in both our DTC and Wholesale and Licensing revenue. Our North America DTC revenue for fiscal year 2019 increased by $36.7 million, or 12.0%, compared to fiscal year 2018. This increase was driven by North America DTC comparable sales growth of 13.0%, led by increased unit sales, as well as a net increase of five stores in operation as of June 1, 2019 compared to June 2, 2018. The increase in North America DTC comparable sales was primarily led by strong performance in digital commerce, driven by increased traffic on colehaan.com. Our North America Wholesale and Licensing revenue for fiscal year 2019 increased by $44.6 million, or 22.1%,
72
Table of Contents
compared to fiscal year 2018. This increase was primarily driven by sales growth to our wholesale partners of 21.6%, driven by sales of our expanded product assortment and selling performance of our products. The fiscal year 2019 sales increase also reflected increased growth to our wholesale digital partners.
International
Revenue in our International segment for fiscal year 2019 increased by $3.7 million, or 4.0%, compared to fiscal year 2018. The increase in International revenue was driven primarily by an increase in our Wholesale and Distributors revenue, driven by an increase in sales to our distributors, due to a net increase in distributor-operated stores and increased DTC sales in Japan, primarily led by growth in digital sales.
Gross Profit and Gross Profit Margin
The following table sets forth our gross profit and gross profit margin for the periods presented:
| Fiscal Year Ended | ||||||||
| June 2, 2018 | June 1, 2019 | |||||||
| (In thousands, except percentages) |
||||||||
| Gross profit |
$ | 275,348 | $ | 327,204 | ||||
| Gross profit margin |
45.8 | % | 47.7 | % | ||||
Gross profit for fiscal year 2019 increased by $51.9 million, or 18.8%, compared to fiscal year 2018, reflecting the increase in our revenue. Gross profit margin was 47.7% in fiscal year 2019 and 45.8% for fiscal year 2018. Our gross margin expansion reflected improved product costing as we gained scale and realized product engineering benefits and a higher proportion of digital commerce sales within our North America DTC sales, which generally carry higher gross profit margins.
Selling, General and Administrative Expense
The following table sets forth our SG&A and the percentage relationship to revenue for the periods presented:
| Fiscal Year Ended | ||||||||
| June 2, 2018 | June 1, 2019 | |||||||
| (In thousands, except percentages) | ||||||||
| Selling, general and administrative expense |
$ | 249,875 | $ | 264,674 | ||||
| As a percentage of revenue |
41.5 | % | 38.5 | % | ||||
SG&A for fiscal year 2019 increased by $14.8 million, or 5.9%, compared to fiscal year 2018, primarily due to increased marketing expense and compensation and benefit expense. Marketing expense increased by $8.1 million from $26.8 million in fiscal year 2018 to $34.9 million in fiscal year 2019, driven by an increase in marketing spend to support our digital marketing strategy, primarily consisting of performance marketing initiatives. The remainder of SG&A increased by $6.7 million compared to fiscal year 2018, primarily due to increased corporate and store-level compensation and benefit expense to support business growth and strategic priorities.
SG&A as a percentage of revenue decreased from 41.5% for fiscal year 2018 to 38.5% for fiscal year 2019, as our growth in revenue outpaced the increase in SG&A.
Interest Expense, Net
Interest expense, net for fiscal year 2019 increased by $1.0 million, or 5.0%, compared to fiscal year 2018. The increase in interest expense, net was primarily related to a higher effective interest rate during fiscal year 2019 on the Term Loan Facility, which was refinanced in February 2019, compared to fiscal year 2018.
73
Table of Contents
Loss on Debt Modification and Extinguishment
In February 2019, we recognized a loss of $3.1 million in connection with the refinancing of the Term Loan Facility, including debt modification costs of $2.2 million and a $0.9 million non-cash write-off of debt issuance costs.
Income Tax (Benefit) Expense
Income tax expense for fiscal year 2019 increased by $23.0 million compared to fiscal year 2018, primarily due to the recognition of a $23.2 million benefit in fiscal year 2018 associated with the Tax Cuts and Jobs Act, which comprised an $11.8 million net reduction of the valuation allowance on U.S. net deferred tax assets and a net benefit of $11.4 million for the remeasurement of deferred taxes. During fiscal year 2019 and fiscal year 2018, we continued to record a valuation allowance on deferred tax assets in certain jurisdictions due to our inability to carry back tax losses or credits. Our effective income tax rate was 12.6% for fiscal year 2019 and (377.9)% for fiscal year 2018. Our increase in tax rate for fiscal year 2019 as compared with fiscal year 2018 is primarily the result of the impact of the Tax Cuts and Jobs Act that became effective in fiscal year 2018, including the provision to indefinitely carry forward net operating losses generated in years ending in calendar year 2018 and later and allowing for the use of indefinite-lived deferred tax liabilities as a source of income for those indefinite-lived assets, which resulted in a partial release of the valuation allowance on the U.S. deferred tax assets.
Net Income
As a result of the factors above, net income for fiscal year 2019 increased by $10.0 million, or 43.4%, compared to fiscal year 2018.
Segment Adjusted EBITDA
The following table sets forth our Segment Adjusted EBITDA for the periods presented:
| Fiscal Year Ended | ||||||||
| June 2, 2018 | June 1, 2019 | |||||||
| (In thousands) |
||||||||
| Reportable Segments Adjusted EBITDA: |
||||||||
| North America |
$ | 47,764 | $ | 77,182 | ||||
| International |
12,308 | 17,592 | ||||||
|
|
|
|
|
|||||
| Total Reportable Segments Adjusted EBITDA |
60,072 | 94,774 | ||||||
|
|
|
|
|
|||||
| Reconciling items: |
||||||||
| Interest expense, net |
20,854 | 21,893 | ||||||
| Income tax (benefit) expense |
(18,268 | ) | 4,767 | |||||
| Depreciation and amortization, net(1) |
34,667 | 32,152 | ||||||
| Impairment charges |
— | 192 | ||||||
| (Gain) on disposals of property and equipment |
(68 | ) | (100 | ) | ||||
| Loss on debt modification and extinguishment |
— | 3,075 | ||||||
| Other (income), net |
(216 | ) | (342 | ) | ||||
| IPO costs(2) |
— | — | ||||||
|
|
|
|
|
|||||
| Net income |
$ | 23,103 | $ | 33,137 | ||||
|
|
|
|
|
|||||
| (1) | Excludes amortization included in interest expense, net. |
| (2) | Represents non-recurring expenses primarily composed of legal, accounting and professional fees incurred in connection with this offering, which are included within SG&A. |
74
Table of Contents
North America Segment Adjusted EBITDA was $77.2 million for fiscal year 2019, an increase of $29.4 million, or 61.6%, from fiscal year 2018. The increase in North America Segment Adjusted EBITDA reflected increased gross profit driven by our growth in sales volume, partially offset by an increase in SG&A to support our growth initiatives and strategic priorities, including our digital marketing efforts to drive DTC expansion.
International Segment Adjusted EBITDA was $17.6 million for fiscal year 2019, an increase of $5.3 million, or 42.9%, from fiscal year 2018. The increase in International Segment Adjusted EBITDA primarily reflected increased gross profit, driven by growth in sales.
Non-GAAP Financial Measures
We present Adjusted EBITDA because we believe it is a useful indicator of our comparative operating performance from period to period. We believe that Adjusted EBITDA is useful to investors because it is frequently used by analysts, investors and other interested parties to evaluate companies in our industry.
Adjusted EBITDA is a non-GAAP financial measure and should not be considered as an alternative to net income as a measure of financial performance or cash provided by operating activities as a measure of liquidity, or any other performance measure derived in accordance with GAAP, and it should not be construed as an inference that our future results will be unaffected by unusual or non-recurring items. In evaluating Adjusted EBITDA, you should be aware that in the future we may incur expenses that are the same as or similar to some of the adjustments in this presentation. Our presentation of Adjusted EBITDA should not be construed to imply that our future results will be unaffected by any such adjustments. Management compensates for these limitations by primarily relying on our GAAP results, while using Adjusted EBITDA as a supplement to the corresponding GAAP financial measures. In addition, other companies, including companies in our industry, may calculate Adjusted EBITDA differently or not at all, which reduces the usefulness of Adjusted EBITDA as a tool for comparison.
The following table provides a reconciliation of our net income to Adjusted EBITDA for the periods presented:
| Fiscal Year Ended | 26-Week Period Ended | |||||||||||||||
| June 2, 2018 | June 1, 2019 | December 1, 2018 |
November 30, 2019 |
|||||||||||||
| (In thousands) |
||||||||||||||||
| Net income |
$ | 23,103 | $ | 33,137 | $ | 29,449 | $ | 24,765 | ||||||||
| Interest expense, net |
20,854 | 21,893 | 10,344 | 12,106 | ||||||||||||
| Income tax (benefit) expense |
(18,268 | ) | 4,767 | 1,878 | 2,147 | |||||||||||
| Depreciation and amortization, net(a) |
34,667 | 32,152 | 15,699 | 15,768 | ||||||||||||
| Impairment charges(b) |
— | 192 | — | 1,643 | ||||||||||||
| (Gain) on disposals of property and equipment(c) |
(68 | ) | (100 | ) | (64 | ) | (6 | ) | ||||||||
| Loss on debt modification and extinguishment(d) |
— | 3,075 | — | — | ||||||||||||
| Other (income), net(e) |
(216 | ) | (342 | ) | (189 | ) | (127 | ) | ||||||||
| IPO costs(f) |
— | — | — | 6,074 | ||||||||||||
|
|
|
|
|
|
|
|
|
|||||||||
| Adjusted EBITDA |
$ | 60,072 | $ | 94,774 | $ | 57,117 | $ | 62,370 | ||||||||
|
|
|
|
|
|
|
|
|
|||||||||
| (a) | Excludes amortization included in interest expense, net. |
| (b) | Represents non-cash store impairment charges. |
| (c) | Represents the non-cash gain on disposals of property and equipment. |
| (d) | Represents the loss on debt modification and extinguishment in connection with the refinancing of the Term Loan Facility in February 2019. |
75
Table of Contents
| (e) | Primarily represents foreign currency transaction (gains) and losses associated with our international subsidiaries and realized and unrealized (gains) and losses on our foreign currency forward contracts. |
| (f) | Represents non-recurring expenses primarily composed of legal, accounting and professional fees incurred in connection with this offering, which are included within SG&A. |
Liquidity and Capital Resources
Our primary uses of cash are working capital requirements, funding our SG&A, debt service requirements and capital expenditures. Working capital is required principally to finance accounts receivable and inventory. Our working capital requirements vary from period to period depending on various factors, such as the timing of shipments and the payment cycles of our wholesale partners. Our cash needs include payroll, store rent, capital expenditures associated with new stores and updating existing stores, as well as information technology and infrastructure, including our corporate office and distribution center, and public company costs.
We principally rely on cash flows from operations as our primary source of liquidity and if, needed, up to $115.0 million in revolving loans under the ABL Credit Facility (subject to the borrowing base). We anticipate that cash generated from operations together with amounts available under the ABL Credit Facility will be sufficient to meet our future working capital requirements, capital expenditures and debt service obligations as they become due for the foreseeable future. To the extent additional funds are necessary to meet our long-term liquidity needs as we continue to execute our business strategy, we anticipate that they will be obtained through the incurrence of additional indebtedness, additional equity financings or a combination of these potential sources of funds. In the event that we need access to additional cash, we may not be able to access the credit markets on commercially acceptable terms or at all. Our ability to fund future operating expenses and capital expenditures and our ability to meet future debt service obligations or refinance our indebtedness will depend on our future operating performance, which will be affected by general economic, financial and other factors beyond our control, including those described under “Risk Factors.”
As of November 30, 2019, we had $10.8 million of cash, $277.4 million of indebtedness outstanding and an additional $115.0 million of availability under our ABL Credit Facility, which was undrawn. As of November 30, 2019, $8.0 million of our cash was held by our foreign subsidiaries. In accordance with our policy, the undistributed earnings of our non-U.S. subsidiaries remain indefinitely reinvested outside of the United States as they are required to fund needs outside the United States. In the event funds from foreign operations are needed to fund operations in the United States and if U.S. tax has not already been previously provided for, we may be required to accrue and pay additional U.S. taxes in order to repatriate these funds.
We and/or our Sponsor may from time to time seek to retire or purchase our outstanding debt through open-market purchases, privately negotiated transactions, tender offers or otherwise. Such repurchases or exchanges, if any, may involve the use of cash and will depend on prevailing market conditions, our liquidity requirements, contractual restrictions and other factors that could materially affect our liquidity.
76
Table of Contents
Cash Flows
The following table presents the major components of our net cash flows provided by (used in) operating, investing and financing activities for the periods presented:
| Fiscal Year Ended | 26-Week Period Ended | |||||||||||||||
| June 2, 2018 | June 1, 2019 | December 1, 2018 |
November 30, 2019 |
|||||||||||||
| (In thousands) |
||||||||||||||||
| Net cash provided by (used in): |
||||||||||||||||
| Operating activities |
$ | 50,491 | $ | 55,168 | $ | 30,827 | $ | (12,829 | ) | |||||||
| Investing activities |
(15,991 | ) | (17,745 | ) | (8,628 | ) | (10,580 | ) | ||||||||
| Financing activities |
(23,219 | ) | (22,929 | ) | (12,490 | ) | (3,625 | ) | ||||||||
| Effect of foreign exchange rate changes on cash |
110 | (108 | ) | (177 | ) | (42 | ) | |||||||||
|
|
|
|
|
|
|
|
|
|||||||||
| Net increase (decrease) in cash |
$ | 11,391 | $ | 14,386 | $ | 9,532 | $ | (27,076 | ) | |||||||
|
|
|
|
|
|
|
|
|
|||||||||
The 26-Week Period Ended November 30, 2019 Compared to the 26-Week Period Ended December 1, 2018
Cash Provided By (Used In) Operating Activities
Net cash used in operating activities for the 26-week period ended November 30, 2019 was $12.8 million, resulting from net cash used by changes in our operating assets and liabilities of $56.8 million, partially offset by $24.8 million in our net income and $19.2 million in net non-cash charges. Net cash used by changes in our operating assets and liabilities for the 26-week period ended November 30, 2019 consisted primarily of a $45.0 million increase in accounts receivable, a $12.1 million increase in inventories and a $3.8 million decrease in accounts payable, partially offset by a $6.7 million increase in accrued liabilities. The increase in accounts receivable was due to revenue growth during the period. The increase in inventories was due to growth in operations. The decrease in accounts payable was due to the timing of payments. The increase in accrued liabilities was due to increased inventory purchases to support growth initiatives and personnel-related accrued liabilities, such as accrued salaries and bonuses, due to our improved performance and, to a lesser extent, growth in headcount.
Net cash provided by operating activities for the 26-week period ended December 1, 2018 was $30.8 million, resulting from our net income of $29.4 million and net non-cash charges of $19.8 million, partially offset by net cash used by changes in our operating assets and liabilities of $18.4 million. Net cash used by changes in our operating assets and liabilities for the 26-week period ended December 1, 2018 consisted primarily of a $24.7 million increase in accounts receivable, a $13.4 million increase in inventories and a $6.8 million decrease in accounts payable, partially offset by a $25.7 million increase in accrued liabilities. The increase in inventories was due to growth in operations. The increase in accounts receivable was due to the increased sales, as well as timing of receipts of cash payments from wholesalers. The increase in accounts payable was due to the timing of payments. The increase in accrued liabilities was due to increased inventory purchases to support growth initiatives and personnel-related accrued liabilities, such as accrued salaries and bonuses, associated with our improved performance and, to a lesser extent, growth in headcount.
Cash Used In Investing Activities
During the 26-week period ended November 30, 2019, net cash used in investing activities was $10.6 million, consisting primarily of purchases of property and equipment of $10.1 million, including enhancements to our information technology infrastructure, product innovation and new stores.
During the 26-week period ended December 1, 2018, net cash used in investing activities was $8.6 million, consisting primarily of purchases of property and equipment of $8.4 million, including enhancements to our information technology infrastructure and new stores.
77
Table of Contents
Cash Used In Financing Activities
During the 26-week period ended November 30, 2019, net cash used in financing activities was $3.6 million, consisting of principal repayments under the Term Loan Facility.
During the 26-week period ended December 1, 2018, net cash used in financing activities was $12.5 million, consisting of principal repayments under the Term Loan Facility of $12.2 million and the payment of financing costs associated with the ABL Credit Facility of $0.3 million.
The Fiscal Year Ended June 1, 2019 Compared to the Fiscal Year Ended June 2, 2018
Cash Provided By Operating Activities
Net cash provided by operating activities was $55.2 million for fiscal year 2019, resulting from our net income of $33.1 million and net non-cash charges of $35.9 million, partially offset by net cash used by changes in our operating assets and liabilities of $13.9 million. The net cash used by changes in our operating assets and liabilities for fiscal year 2019 consisted primarily of a $38.6 million increase in inventories, a $7.2 million increase in accounts receivable, a $4.5 million decrease in accounts payable and a $2.3 million increase in prepaid expenses and other current assets, partially offset by a $36.1 million increase in accrued liabilities and a $2.4 million increase in taxes payable. The increase in inventories was to support our first quarter 2020 product launches and anticipated sales growth, and the increase in accounts receivable was due to higher revenue in the fourth quarter of fiscal year 2019, partially offset by timing of the related collections. The decrease in accounts payable was due to the timing of payments. The increase in prepaid expenses and other current assets was due to timing of prepayments and the increase in accrued liabilities was due to increased inventory purchases to support growth initiatives and personnel-related accrued liabilities, such as accrued salaries and bonuses, due to our improved performance and, to a lesser extent, growth in headcount. The increase in taxes payable was primarily due to additional income taxes associated with the Tax Cuts and Jobs Act.
Net cash provided by operating activities was $50.5 million for fiscal year 2018, resulting from our net income of $23.1 million, net non-cash charges of $17.6 million and net cash provided by changes in our operating assets and liabilities of $9.8 million. The net cash provided by changes in our operating assets and liabilities was primarily due to a $13.7 million increase in accrued liabilities, a $4.5 million decrease in accounts receivable and a $3.3 million increase accounts payable, partially offset by a $7.4 million increase in inventories and a $2.6 million decrease in taxes payable. The increase in accrued liabilities was due to increased inventory purchases to support growth initiatives. The decrease in accounts receivable was due to a shift in timing of wholesale shipments, as well as the timing of collections at the end of fiscal year 2018. The increase in accounts payable was due to the timing of payments, and the increase in inventories was to support our first quarter 2019 product launches and anticipated sales growth. The decrease in taxes payable was primarily related to a reduction in indirect tax payments.
Cash Used In Investing Activities
During fiscal year 2019, net cash used in investing activities was $17.7 million, consisting primarily of purchases of property and equipment of $17.1 million, including enhancements to our information technology infrastructure, product innovation and new stores.
During fiscal year 2018, net cash used in investing activities was $16.0 million, consisting primarily of purchases of property and equipment of $15.5 million, including enhancements to our information technology infrastructure, product innovation and store improvements.
Cash Used In Financing Activities
During fiscal year 2019, net cash used in financing activities was $22.9 million, consisting of principal repayments under the Term Loan Facility of $306.1 million and the payment of financing costs associated with
78
Table of Contents
the Term Loan Facility and ABL Credit Facility of $3.2 million, partially offset by net proceeds from borrowings under the Term Loan Facility of $286.4 million.
During fiscal year 2018, net cash used in financing activities was $23.2 million, consisting primarily of principal repayments under the ABL Credit Facility of $70.5 million, partially offset by net proceeds from borrowings under the ABL Credit Facility of $47.4 million.
Financing Obligations
The following table sets forth the amounts owed under the ABL Credit Facility and the Term Loan Facility, the effective interest rates on such outstanding amounts and the amount available for additional borrowing, in each case, as of November 30, 2019:
| Maturity Date |
Effective Interest Rate |
Amount Outstanding |
Amount Available for Additional Borrowing |
|||||||||||||
| (In thousands) | ||||||||||||||||
| ABL Credit Facility |
July 2023 | 2.9 | % | $ | — | $ | 115,000 | |||||||||
| Term Loan Facility |
February 2025 | 7.2 | % | 284,563 | — | |||||||||||
| Unamortized discount and debt issuance costs |
(7,167 | ) | — | |||||||||||||
|
|
|
|
|
|||||||||||||
| Total |
$ | 277,396 | $ | 115,000 | ||||||||||||
|
|
|
|
|
|||||||||||||
ABL Credit Facility
On February 1, 2013, our wholly owned subsidiary, Calceus MidCo, Inc., and its wholly owned subsidiary, Calceus Acquisition, Inc., as lead borrower, and its other subsidiaries party thereto as borrowers, entered into the ABL Credit Agreement (as amended by Amendment No. 1, dated as of November 23, 2015, and Amendment No. 2, dated as of July 11, 2018), with Wells Fargo Bank. The ABL Credit Facility provides for an aggregate principal amount of $115.0 million (subject to the borrowing base), of which up to $20.0 million is available through a subfacility in the form of letters or credit and up to $10.0 million is available through a subfacility for swing line loans, in each case subject to customary conditions and limitations. In addition, the borrowers under the ABL Credit Facility may request one or more incremental increases to the available revolving credit commitments under the ABL Credit Facility in an aggregate amount not to exceed $35.0 million. The lenders under the ABL Credit Facility are not under any obligation to provide any such incremental commitments. See “Description of Certain Indebtedness.”
Term Loan Facility
On February 12, 2019, Calceus MidCo, Inc. and Calceus Acquisition, Inc., as term loan borrower, entered into the Credit Agreement with JPMorgan Chase Bank, N.A., as administrative and collateral agent. The Term Loan Facility provides for a term loan in an aggregate principal amount of $290.0 million. In addition, the term loan borrower may request to add one or more additional tranches of term loans and/or increase the principal amount of term loans under the Term Loan Facility, subject to certain conditions and limitations. The lenders under the Term Loan Facility are not under any obligation to provide any such incremental indebtedness. See “Description of Certain Indebtedness.”
79
Table of Contents
Contractual Obligations
The following table summarizes our contractual obligations as of June 1, 2019 for each of the periods indicated:
| Payments Due by Period | ||||||||||||||||||||
| Less than 1 year |
1-3 years | 3-5 years | More than 5 years |
Total | ||||||||||||||||
| (In thousands) | ||||||||||||||||||||
| Term Loan Facility |
$ | 7,250 | $ | 16,313 | $ | 29,000 | $ | 235,625 | $ | 288,188 | ||||||||||
| ABL Credit Facility(1) |
— | — | — | — | — | |||||||||||||||
| Interest on long-term debt obligations(2) |
22,571 | 41,908 | 41,817 | 12,808 | 119,104 | |||||||||||||||
| Operating lease obligations(3) |
36,828 | 59,125 | 46,377 | 27,505 | 169,835 | |||||||||||||||
| Purchase obligations |
170,853 | — | — | — | 170,853 | |||||||||||||||
| Pension obligations |
229 | 383 | 626 | 2,205 | 3,443 | |||||||||||||||
| Other long-term obligations(4) |
538 | 478 | 255 | 174 | 1,445 | |||||||||||||||
|
|
|
|
|
|
|
|
|
|
|
|||||||||||
| Total(5) |
$ | 238,269 | $ | 118,207 | $ | 118,075 | $ | 278,317 | $ | 752,868 | ||||||||||
|
|
|
|
|
|
|
|
|
|
|
|||||||||||
| (1) | Amounts assume that the ABL Credit Facility remains undrawn, which may or may not reflect future events. |
| (2) | Assumes an interest rate of 7.6% per annum, consistent with the interest rate on the Term Loan Facility at June 1, 2019. |
| (3) | Includes $1.4 million of minimum lease payments which had not commenced as of June 1, 2019. |
| (4) | Primarily consists of asset retirement obligations. |
| (5) | We have excluded the amount of the liability for uncertain tax benefits as of June 1, 2019 in the table above. As of June 1, 2019, we had $2.8 million of uncertain tax benefits, excluding interest and penalties, related to uncertain tax positions. The timing of future cash outflows associated with our liabilities for uncertain tax benefits is highly uncertain. As such, we are unable to make reasonably reliable estimates of the period of cash settlement with the respective tax authority. |
Off-Balance Sheet Arrangements
We do not have any off-balance sheet arrangements.
Critical Accounting Policies and Significant Estimates
Our discussion of results of operations and financial condition is based upon our audited consolidated financial statements and unaudited condensed consolidated financial statements, which have been prepared in accordance with GAAP. The preparation of financial statements in conformity with GAAP requires management to make certain estimates and assumptions about future events that affect the classification and amounts reported in our consolidated financial statements and accompanying notes, including revenue and expenses, assets and liabilities and the disclosure of contingent assets and liabilities. These estimates and assumptions are based on our historical results as well as management’s judgment. Although management believes the judgment applied in preparing estimates is reasonable based on circumstances and information known at the time, actual results could vary materially from estimates based on assumptions used in the preparation of our consolidated financial statements.
The most significant accounting estimates involve a high degree of judgment or complexity. Management believes the estimates and judgments most critical to the preparation of our consolidated financial statements and to the understanding of our reported financial results include those made in connection with estimates to develop the sales returns reserve; impairment assessments for goodwill, intangible assets and long-lived assets; income taxes, including estimating the valuation allowance and uncertain tax positions; and estimating stock-based compensation expense. Management evaluates its policies and assumptions on an ongoing basis. Our significant
80
Table of Contents
accounting policies related to these accounts in the preparation of our consolidated financial statements are described below. See Note 2 to our audited consolidated financial statements and our unaudited condensed consolidated financial statements included elsewhere in this prospectus for additional information regarding our critical accounting policies.
Revenue Recognition
At the beginning of fiscal year 2019, we adopted Topic 606 using the modified retrospective method. Revenue transactions associated with the sale of our footwear, handbags, accessories and outerwear generally comprise a single performance obligation, which consists of the sale of products to customers either through wholesale or DTC channels. We recognize wholesale and digital commerce revenue when the transfer of control has passed to the customer, based on the terms of sale. Our customers are considered to have obtained control once they are able to direct the use and receive substantially all of the benefits of the product. Transfer of control passes to wholesale partners upon shipment or upon receipt, depending on the country of the sale and the agreement with the customer. Control passes to retail store customers at the time of sale and to digital commerce customers upon shipment. The transaction price for wholesale revenue is determined based upon the invoiced sales price, less anticipated sales returns, discounts, certain vendor allowances, and miscellaneous claims from customers. The transaction price for DTC revenue is determined based upon invoiced sales price, less anticipated sales returns and discounts.
Consideration for trademark licensing contracts is earned through sales-based royalty arrangements and the associated revenue is recognized over the license period at such time that the subsequent sales of the licensed products occur.
We sell gift cards to customers in our stores and through our sites. Gift cards do not have expiration dates, inactivity fees or administrative fees. Revenue recognition occurs when the gift card is redeemed by the consumer. Revenue is not recognized for amounts subject to escheatment laws. Gift card breakage income is recognized based upon historical redemption patterns for the balance of gift cards that we believe the likelihood of redemption by the customer is remote. We review our gift card liability on an ongoing basis and recognize our estimate of the unredeemed gift card liability on a ratable basis over the estimated period of redemption. Our historical experience has not varied significantly from amounts historically recorded and we believe our assumptions are reasonable.
At the time sales revenue is recognized, we record provisions for sales discounts, returns and miscellaneous claims from customers, and reflects the most likely amount we anticipate being entitled to receive based upon historical experience and current trends, taking into consideration the type of customer, transaction, and specifics of each arrangement. We do not believe there is a reasonable likelihood that there will be a material change in the assumptions used to calculate these reserves. However, if the actual cost of sales returns is significantly different than the estimated allowance, our results of operations could be materially affected. We do not provide express warranties on our products, but occasionally will repair or take a return in the event that a product does not meet our standards. The impact of such warranties is not material and is considered in our process for estimating our sales returns reserve.
We have determined that the costs to fulfill our contracts, including sales commissions, do not generate or enhance our resources that will be used in satisfying (or in continuing to satisfy) performance obligations in the future. As the amortization period over which any asset would be recorded is less than one year, we have elected the practical expedient to expense such costs as incurred.
We evaluate the presentation of revenue on a gross versus net basis. In this evaluation, we consider if we obtain control of the specified goods or services before they are transferred to our customer, as well as other indicators such as the party primarily responsible for fulfillment, inventory risk, and discretion in establishing price. We have determined gross presentation is appropriate for our revenue transactions involving a third party.
81
Table of Contents
Impairment of Long-Lived Assets, Goodwill and Indefinite-Lived Assets
Long-Lived Assets
Long-lived assets, including property and equipment and definite-lived intangible assets, are evaluated for impairment whenever events or circumstances indicate that the carrying value of the assets may not be recoverable. Conditions that may indicate impairment include, but are not limited to, a significant decrease in the market price of an asset, a significant adverse change in the extent or manner in which an asset is being used or a significant decrease in its physical condition, and operating or cash flow performance that demonstrates continuing losses associated with an asset or asset group.
When such events occur, we compare the sum of the undiscounted cash flows expected to result from the use and eventual disposition of the asset or asset group to the carrying amount of the long-lived asset or asset group.
The cash flows are based on the best estimate of future cash flows derived from the most recent business projections.
A potential impairment has occurred if the projected future undiscounted cash flows expected to result from the use and eventual disposition of the asset or asset group are less than the carrying value of the asset or asset group. If the carrying value exceeds the sum of the undiscounted cash flows, an impairment charge is recorded equal to the excess of the asset or asset group’s carrying value over its fair value. Fair value is measured using appropriate valuation methodologies that would typically include a projected discounted cash flow model using a discount rate we believe is commensurate with the risk inherent in its business. Current and expected operating results and cash flows and other factors are considered in connection with determining the fair value. We recognized aggregate non-cash impairment charges of $1.6 million and $0.2 million during the 26-week period ended November 30, 2019 and fiscal year 2019, respectively. No impairment charge was recognized during fiscal year 2018.
Determining the fair value of long-lived assets requires management judgment and relies upon the use of significant estimates and assumptions, including future sales, our margins and cash flows, current and future market conditions, discount rates applied, useful lives and other factors. We believe our assumptions are reasonable based on available information, our experience, knowledge and judgments. These estimates can be affected by factors that are difficult to predict including future revenue, operating results and economic conditions. Changes in assumptions and estimates used in the impairment analysis, or future results that vary from assumptions used in the analysis, could affect the estimated fair value of long-lived intangible assets and could result in impairment charges in a future period.
Goodwill
We evaluate goodwill for impairment at least annually, or more frequently when events or changes in circumstances indicate that the carrying value may not be recoverable. We assess goodwill at the reporting unit level and have three reporting units: North America Wholesale and Licensing, North America DTC and International. We have selected the fourth fiscal quarter to perform our annual goodwill impairment testing.
We evaluate goodwill for impairment at least annually on the last day of the fiscal year. We may assess our goodwill for impairment initially using a qualitative approach, or step zero, to determine whether conditions exist to indicate that it is more likely than not that the fair value of a reporting unit is less than its carrying value. The qualitative assessment requires significant judgments by management about economic conditions including the entity’s operating environment, its industry and other market considerations, entity-specific events related to financial performance or loss of key personnel and other events that could impact the reporting unit. If management concludes, based on assessment of relevant events, facts and circumstances, that it is more likely than not that a reporting unit’s fair value is greater than its carrying value, no further impairment testing is required.
82
Table of Contents
If our assessment of qualitative factors indicates that it is more likely than not that the fair value of a reporting unit is less than its carrying value, then a two-step quantitative assessment is performed. We may also elect to initially perform a quantitative analysis instead of starting with step zero. “Step one” requires comparing the carrying value of a reporting unit, including goodwill, to its fair value. If the fair value of the respective reporting unit exceeds its carrying amount, goodwill is not considered to be impaired and no further testing is required. If the carrying amount of a reporting unit exceeds its fair value, the second step of the goodwill impairment test is to measure the amount of impairment loss, if any. “Step two” compares the implied fair value of goodwill to the carrying amount of goodwill. If the carrying amount of goodwill exceeds the implied fair value, an impairment charge is recorded to write down goodwill to its implied fair value.
To estimate the fair value of our reporting units we consider the fair values derived from both a market approach and an income approach and which are weighted on a proportionate basis to arrive at our reporting unit fair value. Under the market approach, fair value is estimated using the guideline public company method. The guideline public company method uses a peer group of publicly traded companies determined by various factors including industry similarity, product offering, markets, financial performance, availability of adequate financial data, and an actively traded stock price. After selection of the guideline public companies, factors such as size, growth, risk and profitability were analyzed to assess the market multiples to apply such as forward revenue and EBITDA. The income approach uses a discounted cash flow analysis, which involves applying appropriate discount rates to estimated future cash flows based on forecasts of sales, costs and capital requirements. The most significant estimates and assumptions inherent in the income approach are the enterprise value based on the estimated present value of future net cash flows the business is expected to generate over a forecasted period and an estimate of the present value of cash flows beyond that period, which is referred to as the terminal value. The estimated present value is calculated using a discount rate known as the weighted-average cost of capital, which accounts for the time value of money and the appropriate degree of risks inherent in the business. We estimate future sales growth using a number of critical factors, including among others, our nature and our history, financial and economic conditions affecting us, our industry and the general company, past results and our current operations and future prospects. Forecasts of future operations are based, in part, on operating results and our expectations as to future market conditions. We deem the discount rate used in our analysis to be commensurate with the underlying uncertainties associated with achieving the estimated cash flows we project. This analysis contains uncertainties because it requires us to make assumptions and to apply judgments to estimate industry economic factors and the profitability of future business strategies. If actual results are not consistent with our estimates and assumptions, we may be exposed to future impairment losses that could be material. During fiscal year 2018 and fiscal year 2019, we did not recognize any goodwill impairment charges.
Indefinite-Lived Intangible Assets
We evaluate indefinite–lived intangible assets for impairment at least annually, or more frequently when events or changes in circumstances indicate that the carrying value may not be recoverable. We consider our trademarks and tradenames to be indefinite-lived intangible assets, as we currently anticipate that they will contribute cash flows to us indefinitely. In testing indefinite-lived intangibles for impairment, we have the option to first assess qualitative factors to determine whether the existences or circumstances would indicate that it is more likely than not that the fair value of our indefinite-lived intangible assets is less than its carrying amount, or we can perform a quantitative impairment analysis to determine the fair value of the indefinite-lived intangible assets without performing a qualitative assessment. Under either approach, if the fair value of the indefinite-lived intangible asset is less than its carrying amount, we would be required to record an impairment charge.
Calculating the fair value requires significant judgment. We determine the fair value of our trademarks and tradenames using the relief from royalty method, a variation of the income approach. The use of different assumptions, estimates or judgments, such as the estimated future cash flows, the discount rate used to discount such cash flows or the estimated royalty rate, could significantly increase or decrease the estimated fair value of the intangible assets. We have selected the fourth fiscal quarter to perform our annual intangible asset impairment testing. During fiscal year 2018 and fiscal year 2019, we did not recognize any impairment charges related to our indefinite-lived intangible assets.
83
Table of Contents
Income Taxes
Deferred tax assets and liabilities are determined based on temporary differences resulting from the different treatment of items for tax and financial reporting purposes. Deferred tax assets and liabilities are measured using enacted tax rates expected to apply to taxable income in the years in which those temporary differences are expected to reverse. Deferred tax assets are reduced by a valuation allowance to the extent we believe it is not more likely than not to be realized. The determination of whether a deferred tax asset will be realized is made on both a jurisdictional basis and the use of our estimate of the recoverability of the deferred tax asset. In evaluating whether a valuation allowance is required under such rules, we consider all available positive and negative evidence, including our prior operating results, the nature and reason for any losses, our forecast of future taxable income in each respective tax jurisdiction and the dates on which any deferred tax assets are expected to expire. These assumptions require a significant amount of judgment, including estimates of future taxable income. We determined that we would not be able to fully realize the benefits of all our state deferred tax assets. As of June 1, 2019 and June 2, 2018, a cumulative valuation allowance of $23.1 million, and $27.3 million, respectively, was recorded. We continue to assess whether any significant changes in circumstances or assumptions have occurred that could materially affect our ability to realize deferred tax assets. We expect to release the valuation allowance when we have sufficient positive evidence, including but not limited to, the magnitude and duration of our historical losses as compared to recent profits within taxing jurisdictions to overcome such negative evidence.
We record the financial statement impact for uncertain income tax positions based on a two-step process. The first step is recognition, where an individual tax position is evaluated as to whether it has a likelihood of greater than 50% of being sustained upon examination based on the technical merits of the position, including resolution of any related appeals or litigation processes. For tax positions that are currently estimated to have less than a 50% likelihood of being sustained, no tax benefit is recorded. For tax positions that have met the recognition threshold in the first step, we perform the second step of measuring the benefit to be recorded. The amount of the benefit that may be recognized is the largest amount that has a greater than 50% likelihood of being realized upon ultimate settlement. Our policy is to classify interest and penalties related to unrecognized tax benefits as a component of income tax expense (benefit).
Although we believe that we have adequately reserved for our uncertain tax positions, we can provide no assurance that the final tax outcome of these matters will not be materially different. In future periods, changes in facts, circumstances and new information may require us to change the recognition and measurement estimates with regard to individual tax positions. Changes in recognition and measurement estimates are recorded in income tax expense and liability in the period in which such changes occur.
Stock-Based Compensation
Calceus TopCo, L.P., or Calceus TopCo, maintains Unit Purchase and Grant Agreements or Unit Grant Agreements with certain of our senior executives that allows Calceus TopCo to grant restricted share units awards in the form of Class B Units. Vesting of the Class B Units are contingent upon the occurrence of a liquidity event or a distribution of a specified amount to stockholders, both of which are performance conditions, and the achievement of a specified internal rate of return, which is a market condition. As the Class B Units are classified as equity awards and contain both performance and market conditions, compensation expense recognized for the awards will be equal to the grant date fair value of all awards for which the performance condition is met and the requisite service period is satisfied regardless of whether the market conditions are ultimately satisfied. No compensation expense will be recognized until satisfaction of the performance condition is deemed probable. At that time, we will account for the compensation expense related to the Class B Units, as the costs are deemed to be for our benefit, by recognizing the expense within selling, general and administrative expense in our consolidated statements of operations.
During the periods presented, Calceus TopCo’s Class B Units were not publicly traded. As there has been no public market for Calceus TopCo’s Class B Units to date, the estimated fair value of the Class B Units has
84
Table of Contents
been determined with input from management, considering as one of the factors the most recently available third-party valuations of common stock and an assessment of additional objective and subjective factors that were relevant and which may have changed from the date of the most recent valuation through the date of the grant. These third-party valuations were performed in accordance with the guidance outlined in the American Institute of Certified Public Accountants’ Accounting and Valuation Guide, Valuation of Privately-Held-Company Equity Securities Issued as Compensation.
Calceus TopCo’s Class B Units valuation was prepared using the option-pricing method, or OPM. Under the OPM methodology, we utilized a Contingent Claims Analysis where each class of security is modeled as a call option with the unique claim on the assets of Calceus TopCo. The Contingent Claims Analysis model uses the risk-free rate, expected term, volatility and dividend yield as inputs. The characteristics of each class of stock determine the uniqueness of each class of stock’s claim on our assets, and these characteristics are modeled as distinct call options. Under this method, the equity unit has value only if the funds available for distribution to stockholders exceed the value of the liquidation preferences at the time of a liquidity event. A discount for lack of marketability of the equity unit is then applied to arrive at an indication of value for the equity unit. The OPM uses the Black-Scholes formula to price the call options. This model defines the fair values of equity units as functions of the current fair value of a company and uses assumptions such as the anticipated timing of a potential liquidity event and the estimated volatility of the equity units.
The assumptions underlying these valuations represent management’s best estimates, which involve inherent uncertainties and the application of management judgment. As a result, if factors or expected outcomes change and we use significantly different assumptions or estimates, our stock-based compensation expense could be materially different.
Following the closing of this offering, the fair value of our common stock will be determined based on the quoted market price of our common stock.
Recently Issued Accounting Standards
See Note 2 to our audited consolidated financial statements and Note 2 to our unaudited condensed consolidated financial statements included elsewhere in this prospectus for information regarding recently issued accounting pronouncements.
Emerging Growth Company Status
Section 107 of the JOBS Act provides that an “emerging growth company” can take advantage of the extended transition period provided in Section 7(a)(2)(B) of the Securities Act for complying with new or revised accounting standards. In other words, an “emerging growth company” can delay the adoption of certain accounting standards until those standards would otherwise apply to private companies. Section 107 of the JOBS Act provides that any decision to opt out of the extended transition period for complying with new or revised accounting standards is irrevocable. We are choosing to “opt out” of this provision and, as a result, we will comply with new or revised accounting standards as required when they are adopted.
Quantitative and Qualitative Disclosures About Market Risk
Market risk is the potential loss that may result from market changes associated with our business or with an existing or forecasted financial transaction. The value of a financial instrument may change as a result of changes in interest rates, exchange rates, commodity prices, equity prices and other market changes. We are exposed to various market risks, including variability in currency exchange rates and fluctuations in interest rates. We do not use derivative financial instruments for speculative or trading purposes. We maintain an interest rate swap, which is designated as an accounting hedge, to mitigate the variability in cash flows on our debt-related interest payments. From time to time, we have entered into, and in the future expect to continue to enter into, foreign currency forward contracts to manage certain of the risks described herein.
85
Table of Contents
Foreign Currency Exchange Risk
We are a global enterprise subject to the risk of foreign currency fluctuations. Although our products are offered in 64 countries and 17.1% of our total fiscal year 2019 revenue was generated outside the United States, substantially all of that revenue is transacted in U.S. dollars, Japanese Yen or Canadian dollars.
Most of our foreign businesses operate in functional currencies other than the U.S. dollar. In periods where the U.S. dollar strengthens relative to the Japanese Yen, or, to a lesser extent, the Canadian dollar or other foreign currencies where we have operations, there is a negative impact on our operating results upon translation of those foreign operating results into the U.S. dollar. The reported values of assets and liabilities in these foreign businesses are subject to fluctuations in foreign currency exchange rates. We use financial instruments to reduce the impact of changes in foreign currency exchange rates. The principal financial instruments we enter into on a routine basis are foreign currency forward contracts related to the Japanese Yen. The objective of these practices is to economically hedge the impact of foreign currency fluctuations on our inventory purchases. The periods of the foreign currency forward contracts correspond to the periods of the forecasted transactions, which typically are less than 18 months subsequent to the latest balance sheet date.
The gross U.S. dollar equivalent notional amount of all foreign currency contracts outstanding at June 1, 2019 was $11.0 million, representing a net settlement liability of $0.03 million. Gains and losses on the foreign currency forward contracts are recognized in current period earnings within other (income), net. As of June 1, 2019, a sensitivity analysis of changes in foreign currencies when measured against the U.S. dollar indicates that, if the U.S. dollar had uniformly weakened by 10.0% against all of our U.S. dollar denominated foreign exchange derivatives, the fair value of the instruments would have decreased by $1.2 million. Conversely, if the U.S. dollar uniformly strengthened by 10.0% against all of our U.S. dollar denominated foreign exchange derivatives, the fair value of these instruments would have increased by $1.0 million. Any resulting changes in the fair value of the hedged instruments may be partially offset by changes in the fair value of certain balance sheet positions impacted by the change in the foreign currency rate. The ability to reduce the exposure of currencies on earnings depends on the magnitude of the derivatives compared to the balance sheet positions during each reporting cycle. Our analysis does not consider the implications that such fluctuations could have on the overall economic activity that could exist in such an environment in the United States or such foreign countries or on the results of operations of our foreign entities.
The financial markets and currency volatility may limit our ability to cost-effectively mitigate these exposures. The counterparties to derivative contracts are major financial institutions. We assess credit risk of the counterparties on an ongoing basis.
Interest Rate Risk
Substantially all of our borrowings carry variable interest rates. An increase in interest rates could have a material impact on our cash flows. We use an interest rate swap to manage such risk.
As of June 1, 2019, all of our $288.2 million in term loans were subject to variable interest rates, with a weighted average borrowing rate of 7.6%. After inclusion of the notional amount of $100.0 million of our interest rate swap fixing a portion of the variable rate debt, $188.2 million, or 65.3%, of our debt is subject to variable rates. Our interest rate swap expired in January 2020, at which time all of our debt became subject to variable rates. Assuming an increase to market rates of 1.0% as of June 1, 2019, we would incur an annual increase to interest expense of approximately $2.2 million related to our variable-rate debt.
Impact of Inflation
Our results of operations and financial condition are presented based on historical cost. While it is difficult to accurately measure the impact of inflation due to the imprecise nature of the estimates required, we believe the effects of inflation, if any, on our results of operations and financial condition have been immaterial. We cannot assure you our business will not be affected in the future by inflation.
86
Table of Contents
Our Brand Mission
We are advocates for extraordinary living—on the go, pushing forward, disrupting conventional thinking and shattering boundaries. Our mission is to inspire our consumers to live extraordinary lives and support their career-oriented dreams through lifestyle products, stories that inspire and digital experiences that connect and engage.
Who We Are
Cole Haan is a global lifestyle brand serving always-connected, active professionals with innovative footwear and lifestyle accessories. Recognizing a major cultural shift in consumer adoption of a more casual workplace, management and Apax Partners acquired Cole Haan from Nike, Inc. in February 2013 with a vision to disrupt the conventional dress footwear industry. Since then, we have pioneered new categories of footwear and lifestyle accessories that customers wear from work-to-workout-to-weekend, building upon our 90-year heritage and reputation for quality craftsmanship with innovation. Our brand resonates equally with women and men across multiple generations, with the focus of product creation and marketing towards our core 24- to 44-year-old customers. We market footwear and lifestyle accessories across the Dress, Casual, Outdoor and Sport use occasions—resulting in a broad portfolio that enables Cole Haan to own more share of our customers’ closets. We transformed Cole Haan to conduct business at the speed of digital and we connect directly to consumers using a digital-first approach. As a result, over 30% of our total sales come from digital commerce through our sites and our wholesale partners’ sites.
Cole Haan offers a four-season portfolio of lifestyle products for head-to-toe styling, led by footwear. Over the past several years, our footwear offering has broadened from a focus on the Dress use occasion to include a broader selection of Casual, Outdoor and Sport use occasions, which comprised 53% of our fiscal year 2019 footwear revenue. Our expansion into these use occasions has considerably expanded our addressable market in the fastest-growing segments of footwear. Our lifestyle accessories include an innovative selection of handbags, small leather goods, hosiery, shoe care, eyewear, outerwear, suiting and cold weather goods that complement our footwear portfolio. We market our footwear and lifestyle accessories across a broad range of premium price points that allow us to compete in multiple channels.
We believe we are the leader in our industry for engineering innovative products. Every product we make—from pumps to performance runners to handbags to outerwear—combines style with exceptional performance attributes built on our proprietary innovation platform, the Grand 36Ø Design & Engineering System. This system enables Cole Haan to create versatile, stylish and comfortable products that meet the demands of on-the-go consumers.
We acquire customers primarily using a digital-first marketing discipline that emphasizes media investments viewed on mobile devices, through digital media and social channels. Through our marketing channels, we create compelling native content that inspires consumers and increases the awareness of the Cole Haan brand. To amplify our reach, we partner with premier national and global editorial sources, such as Forbes, The Wall Street Journal and The New York Times. Once consumers demonstrate a desire to learn more about Cole Haan, we invest in targeted marketing to provide a seamless path toward purchase conversion.
We have built a global, multi-channel distribution network across 64 countries that includes our global digital flagship site, colehaan.com, 368 stores and over 450 diverse global wholesale accounts. Our North America segment comprises our DTC business, which includes our digital flagship site and 112 stores, and wholesale distribution to a diverse account base spanning digital pureplay, specialty retail, premium department store, sporting goods and family footwear accounts. A representative selection of our North American wholesale partners includes Nordstrom, Bloomingdale’s, Hibbett Sports, Amazon, Zappos and Stitch Fix.
87
Table of Contents
Our International segment includes our wholly owned Japanese subsidiary and partnerships with leading regional distributors and wholesalers. In Japan, where we have operated for nearly 25 years, our footprint is primarily DTC consisting of 80 stores and our localized digital commerce site, colehaan.co.jp. Outside of Japan, the remainder of our international sales occur in over 60 countries. In these markets, we employ a capital-efficient model where our 37 regional distributors fund costs to build and operate 176 Cole Haan designed and branded stores. Typically, we retain digital commerce rights, while our distributors have local distribution rights. We have also successfully expanded our wholesale business in countries where we operate directly, including the United Kingdom and Japan.
How We Transformed Cole Haan for the Modern Digital Age
When Apax and management acquired Cole Haan in 2013, we became an independent company for the first time in 25 years. Since our 2013 Acquisition, we have completed over $100 million in transformational investments in technology, digital infrastructure, product innovation and other areas, which we believe have positioned the Company for growth. We have reinvented our corporate culture as a “90-year-old start-up.” Key initiatives have included:
| • | modernizing and amplifying the perception of the Cole Haan brand with consumers; |
| • | transforming our innovation and product-creation capabilities to expand our total addressable market to over $700 billion and create a diverse portfolio of breakthrough footwear and lifestyle accessories; |
| • | shifting the Company’s North American distribution focus toward a DTC model with a primary emphasis on building our digital commerce capabilities and rationalizing our store footprint, while accelerating our wholesale business; |
| • | expanding the Company’s global footprint from eight countries in 2013 to 64 countries today, unlocking the substantial opportunity outside the United States and Canada that represents 78% of the global footwear market; |
| • | upgrading the enterprise to do business at the speed of digital, from supply chain to customer experience; and |
| • | building a diverse, multidisciplinary team to drive our growth agenda—nearly 90% of our employees have joined since 2013. |
Recent Financial Performance
While we believe we are still in the early stages of realizing the benefits of our transformation, we have already accelerated our growth profile as evidenced by our following recent achievements:
| • | grew our base of active DTC customers from 1.058 million in fiscal year 2018 to 1.501 million in fiscal year 2019, representing year-over-year growth of 41.9%; |
| • | grew our revenue from $601.6 million in fiscal year 2018 to $686.6 million in fiscal year 2019, representing year-over-year growth of 14.1%; |
| • | increased our net income from $23.1 million in fiscal year 2018 to $33.1 million in fiscal year 2019, representing year-over-year growth of 43.4%; |
| • | grew our Adjusted EBITDA from $60.1 million in fiscal year 2018 to $94.8 million in fiscal year 2019, representing year-over-year growth of 57.8%; and |
| • | increased our Adjusted EBITDA margin from 10.0% in fiscal year 2018 to 13.8% in fiscal year 2019. |
For further information about how we calculate Adjusted EBITDA and Adjusted EBITDA margin, limitations of their use and a reconciliation of Adjusted EBITDA to net income, see “Summary—Summary Historical Consolidated Financial and Other Data.”
88
Table of Contents
Our Competitive Strengths
We believe the following competitive strengths have been instrumental to our success and position us for future growth:
A Powerful Brand that Inspires Extraordinary Living
Powerful ideas fuel global consumer brands. The Cole Haan brand stands for a simple and powerful idea—we all seek to live extraordinary lives on our own terms. Since our founding in 1928 by Trafton Cole and Eddie Haan, Cole Haan has been worn by extraordinary people—from artists and astronauts, to poets and presidents—who have infused the brand with enduring values that continue to connect consumers to our storied brand. It is a brand that transcends generations, socio-economic status, genders and cultures. As a values-based brand, we deliver ground-breaking products and digital marketing that resonate strongly with consumers and aim to inspire extraordinary living.
Deep Consumer Knowledge Drives Our Product Development and Marketing
Unlike many companies that prioritize designer-led inspiration to develop products, we use ongoing insights into consumers’ lives gathered through proprietary research, surveying, media use tracking and consumer analytics to inform product design and development. We believe this institutional discipline underpins our product creation and will enable us to continue earning additional share of our customers’ closets in the future. While the Cole Haan brand resonates with women and men across multiple generations, we focus our product design, development and marketing initiatives to meet the needs of our “First Best Customers.”
Who are they? Our First Best Customers are active women and men ages 24 to 44 who live in global urban centers. We target this group because of its large and fast-growing generational spending power. They are multi-faceted and see their potential for extraordinary—making a positive impact on the world—through their personal and professional passions. They are inspired by those extraordinary people across the cultural spectrum who “work for what they believe in.” Our First Best Customers:
| • | Dress casually in the workplace. Casualization of dress in the workplace continues to increase, with 50% of organizations in the United States allowing casual dress every day in 2018. |
| • | Pursue an on-the-go-lifestyle. They prioritize experiences over possessions, extend business trips into leisure trips and work remotely on a flexible schedule. |
| • | Are always connected digitally. 94% of U.S. millennials own a smartphone, according to eMarketer. |
| • | Prefer to shop online. 85% of U.S. millennials are expected to be digital shoppers in 2019, according to eMarketer. |
We deliver on their expectations. We have pioneered a new category of products that combine versatility, style and comfort so our First Best Customers can live their on-the-go lives. We envisioned a collection of high-performance footwear and lifestyle accessories consumers could use from work-to-workout-to-weekend—our groundbreaking ZERØGRAND label. Originally launched in footwear in 2014, ZERØGRAND has grown into a multi-category label that encompasses footwear across multiple use occasions, including innovative new boots and all-day trainers, as well as bags, outerwear, hosiery and cold weather goods.
Proprietary Multi-Category Product Portfolio and Innovation Capabilities
Our deep consumer knowledge combined with our innovation capabilities support our leadership position and enable us to have a broader portfolio of products compared to our peers. There are two key components to our product-creation process:
| • | Multi-category lifestyle product architecture enables broad category penetration. Our customers are active women and men who are commuting, traveling and traversing throughout cities around the |
89
Table of Contents
| world. Consequently, they need versatile products that perform from work-to-workout-to-weekend. In response, we created a multi-category lifestyle product architecture, which includes all-year-round footwear and lifestyle accessories across Dress, Casual, Outdoor and Sport use occasions. Our expansive product portfolio enables us to capture an increased share of our customers’ closets. Within this architecture, we create products under two primary labels: ZERØGRAND and GRANDSERIES. |
| • | ZERØGRAND invents products with overt design and innovation characteristics consumers can easily see. These products fuse athletic footwear engineering with modern styling. |
| • | GRANDSERIES reinvents products with classic styling and innovation characteristics consumers can feel when they try them on. |
MULTI-CATEGORY LIFESTYLE PRODUCT ARCHITECTURE*

| * | Includes certain products, such as dresses, shirts, pants, skirts and luggage, that are not Cole Haan products. |
90
Table of Contents
| • | Innovation differentiates our products. We built an Innovation Center in New Hampshire where team members with backgrounds in biomechanics, material science, engineered materials, advanced concept research and development, product development engineering, fit and performance testing and industrial design come together to employ state-of-the-art technology to invent breakthrough products. We created a revolutionary innovation system for solving consumer needs through specific enhancements, called the Grand 36Ø Design & Engineering System. This system focuses on specific performance principles to deliver holistic product solutions in a repeatable manner. We protect our industry-leading technology and designs with a growing portfolio of over 400 patents, issued or pending. |
GRAND 36Ø DESIGN & ENGINEERING SYSTEM
Digital-First Commerce and Marketing Drives Customer Acquisition
We have focused our investments in digital commerce to build highly scalable, best-in-class capabilities from customer acquisition to transaction. These investments have enabled the rapid growth of digital sales through both our sites and our wholesale partners’ sites, which represent over 30% of our total sales. Our global digital platform is built upon three cloud-based technology platforms across demand generation (marketing), commerce and analytics. This combination enables our digital-first marketing funnel, creates enriching and frictionless experiences for customers and provides data we can leverage real-time to enhance site experience and drive purchase conversion.
To continuously improve our capabilities and drive digital sales, we recently completed the redesign and replatforming of our global digital flagship, colehaan.com. Our site offers the broadest assortment of our products and is the definitive resource for our brand storytelling to consumers, including the sharing of content, experiences and product detail. We specifically focused on improving our mobile commerce experience with the redesign, as nearly 70% of digital visits originated from mobile devices in fiscal year 2019.
Our marketing funnel is nearly 100% digitally driven and emphasizes using media investments to deliver branded content to mobile devices, through digital media and social channels. Unlike our competitors, we have eliminated almost all traditional media investments and instead invest across four phases of our digital market funnel to acquire customers and build our community:
| • | Inspire. We seek to acquire new customers through two complementary methodologies: native content and product and social media collaborations. We collaborate with traditional and new media partners to produce award-winning native content displayed on digital platforms. We also work with extraordinary |
91
Table of Contents
| cultural influencers and brands to create limited-edition products and messages for social media audiences who may be introduced to the Cole Haan brand for the first time or within a new context. |
| • | Engage. We create targeted digital advertising and invest in media across an integrated landscape of media platforms and social channels, such as Facebook, Instagram, Twitter, YouTube and Snapchat, that consumers engage with many times throughout the day. |
| • | Inform. When consumers demonstrate a desire to learn more about Cole Haan through digital search or by visiting our sites, we invest in targeted marketing to provide a seamless path toward purchase conversion. |
| • | Transact. Our mobile-optimized site provides consumers with the information they need to make informed purchase decisions. |
We believe our digital-first marketing approach is driving the success of our DTC business, as illustrated by the 61 million visits to colehaan.com and our North America stores in fiscal year 2019, a 31% increase from fiscal year 2018, and improvements in our mobile purchase conversion.
Operating Platform Built for Business at the Speed of Digital
As part of our transformation, we built a highly efficient, scalable operating platform for global commerce:
Go-to-Market Process. We have streamlined our product development process to allow us to introduce new products to the marketplace more quickly and on complementary development calendars. Our typical go-to-market process takes 12 to 15 months. Our most rapid internal development process, which we call “Quick Strike,” enables us to address new opportunities emerging in the marketplace within 90 days from consumer insight to product introduction. More complex innovation projects operate on an “Advanced Development” process calendar, which can take between 24 to 36 months to deliver new products to the market.
Sourcing and Supply Chain. We have modernized our manufacturing base with leading sourcing, development, commercialization and manufacturing capabilities, focusing on Vietnam and India as primary countries of origin. Less than 15% of the Company’s footwear and handbag products are manufactured in China and we intend to further reduce that percentage over time.
Global Operations. We manage our business on a fully integrated global basis across multiple operations functions, including product lifecycle management, inventory planning, commerce, distribution and technology. This approach allows us to be flexible in meeting consumer demand across geographies and channels. Furthermore, within our DTC channels we offer a seamless experience to our customers by managing operations with an integrated view of inventory and omni-channel fulfillment capabilities across in-store and online.
Visionary and Proven Management Team
Our seasoned management team is led by our CEO Jack A. Boys. Mr. Boys has successfully transformed multiple global lifestyle brands across the footwear, apparel and outdoor specialty industries, including Converse and The North Face.
At Cole Haan, Mr. Boys has led our transformation and recruited a leadership team with diverse and relevant backgrounds from leading global consumer brands. We have assembled a team with talent from a broad set of industries, such as consumer retail, automotive design, software programming, materials engineering, digital commerce, data science and advertising. The members of our team have proven track records of understanding and marketing to millennials, designing best-in-class products and building scalable global operations. Our team has successfully transformed our business, created a culture of innovation that permeates the organization and driven financial momentum. We believe our management team has the vision and experience to successfully continue to drive our future growth and profitability.
92
Table of Contents
Our Growth Strategies
We believe we are still in the early stages of realizing the benefits of our transformation and intend to leverage our competitive strengths and growth investments by pursuing the following strategies:
Earn More Share of Customers’ Closets
We intend to continue to grow our business by delivering innovative footwear and lifestyle accessories. We will leverage our strengths in consumer insight, lifestyle merchandising and product innovation to compete and win in three primary areas:
| • | Continue expanding core franchises. We believe we have a significant opportunity to further attract new customers to our iconic, multi-generation product franchises. In total unit count, we believe that many of these franchises, such as the ZERØGRAND Wingtip Oxford, have long runway for growth and we intend to continue driving sales of these products across our global distribution network. |
| • | Expand our offerings through our multi-category lifestyle product architecture. The market for Casual, Outdoor and Sport use occasion footwear is growing at double the rate of the overall U.S. footwear market. We believe Cole Haan is underpenetrated in these market segments. Over the last several years, we have successfully extended into these use occasions with products such as our GrandPrø Tennis Sneaker and ZERØGRAND Explore Hiker Boot. We intend to continue developing a broader array of products for these use occasions, while continuing to grow our products for the Dress use occasion. |
| • | Increase penetration of lifestyle accessories. We will continue to leverage our brand and customer satisfaction with our footwear products to gain more share of our customers’ closets with our lifestyle accessories offered and sold through our licensing partners and our sites and stores. We believe these categories are underrepresented in our business, accounting for 7.8% of our fiscal year 2019 revenue. |
Acquire New Customers and Drive Long-Term Customer Relationships
We believe we have a significant opportunity to continue to grow our customer base. We intend to continue marketing almost exclusively via digital platforms, a strategy that resulted in a 41.9% year-over-year increase in the number of our active DTC customers in fiscal year 2019. Our digital marketing is resonating with consumers and we will continue to attract and engage consumers through extraordinary stories that feature our brand and our innovative products. We have inspirational stories to tell and intend to share them with more people. As a values-based brand, Cole Haan plans to continue partnering with digital media content creators and social media influencers, among others, to power our digital-first marketing strategy and attract younger customers.
We believe a focus on driving long-term customer relationships will strengthen brand awareness, customer acquisition and retention, and, ultimately, result in higher lifetime customer values. Our key initiatives include:
| • | creating full-funnel customer journeys, leveraging our competitive strengths in digital-first marketing; |
| • | launching a digital membership program, “Above and Beyond,” to retain customers, gain more share of our customers’ closets and encourage customer advocacy; |
| • | driving further engagement by leveraging CRM data and leading-edge marketing technologies to deliver personalized brand messages and product recommendations; and |
| • | developing a mechanism for customer-generated social sharing of extraordinary living to drive audience growth and amplify our brand mission. |
93
Table of Contents
Continue to Grow Our North America DTC Business
Our North America DTC channel allows us to create meaningful, direct relationships with customers and capture full retail margin. In fiscal year 2019, we drove North America DTC traffic of 61 million visits, a 31% increase from the prior fiscal year. We intend to build on the success of our North America DTC business by:
| • | increasing our number of active DTC customers across our sites and our stores; |
| • | leveraging our investments in CRM and omni-channel technology to increase multi-channel customer relationships and engagement; |
| • | offering a product assortment responsive to consumer preferences and design trends through continuous innovation across the product portfolio; |
| • | increasing customer lifetime value by earning more share of our customers’ closets; and |
| • | selectively growing our store fleet by opening highly productive, digitally connected small space stores that showcase our most innovative footwear and lifestyle accessories. |
Expand Our North America Wholesale Business
We have created a growing wholesale business with diverse wholesale partners. We have driven growth through a rigorous approach to product segmentation within each channel, often on a retailer-by-retailer basis, by selling a price-appropriate, compelling assortment of our merchandise. To continue this growth, we intend to:
| • | Drive velocity within existing accounts. We believe we have ample runway for growth with our existing wholesale partners by increasing sales of our core products through increased brand and product awareness, expanding product assortments into additional footwear and lifestyle accessory categories, gaining market share with superior products and growing wholesale digital sales by employing our drop-ship capabilities. |
| • | Accelerate digital pureplay partnerships. We expect to continue broadening our existing relationships in the United States with digital pureplays such as Amazon, Zappos, Stitch Fix and others, and will look to create relationships with new emerging players. |
| • | Diversify into specialty channels in the United States. In order to further expand our wholesale partner mix, we intend to selectively add new specialty channels of distribution, such as sporting goods and premier independent boutiques. |
Grow Our International Business
We have a significant opportunity to leverage our international presence to drive growth. Our International segment represented just 14.3% of our total revenue for fiscal year 2019. To address this opportunity, we intend to:
| • | Grow our Japanese business. Japan is a leading global footwear and apparel market and our position in that market promotes brand awareness among international consumers. We expect to build upon our nearly 25-year market presence in Japan by: |
| • | using our proven digital-first marketing discipline to inspire, engage and inform Japanese First Best Customers on our redesigned, replatformed site, colehaan.co.jp; and |
| • | continuing to grow our premium wholesale sales following our recent debut at ABC-Mart, one of the leading footwear retailers in the country. |
| • | Leverage our international distributor network and expand our wholesale presence. We have developed a successful and disciplined framework for connecting with consumers in leading international markets through regional distributors and wholesalers. We expect to continue to grow by: |
| • | opening additional distributor stores in leading shopping districts and malls throughout the world, with a long-term target of doubling our international footprint; |
94
Table of Contents
| • | selectively expanding the wholesale business in the United Kingdom, Europe, the Middle East and Mexico; and |
| • | continuing to open and accelerate relationships with digital pureplays in international markets, where our products are currently offered on sites including TMall, Zalando, Amazon and Souq. |
| • | Enhance international customer experience on colehaan.com. We are planning to better serve our international customers on colehaan.com by deploying a global digital commerce solution that enables localized user experiences, pricing and ordering. We believe that creating a more frictionless experience for customers outside of the United States will enable us to grow our global digital sales. |
Continue to Drive Operating Margin Expansion
As we continue to realize the benefits of the multi-year investments we have completed in systems, infrastructure and other improvements across the enterprise, we believe we have opportunities to grow our profitability faster than sales and expand our operating margin by:
| • | leveraging investments in digital functionality, CRM capability and marketing spend to drive traffic and customer acquisition; |
| • | utilizing our global scale and product cost engineering to drive sourcing efficiencies and supply chain savings; and |
| • | leveraging our fixed cost base to drive quality execution, efficiency and profitability. |
Our Market Opportunity
Our core opportunity is the approximately $317 billion global footwear market. Our further expansion into lifestyle accessories considerably expands our global market potential to over $700 billion.
Footwear
According to Euromonitor, the global footwear market, excluding Children’s footwear in which we do not participate, recorded $317 billion of retail sales in 2018, and grew at a 4.0% compound annual growth rate, or CAGR, from 2014 through 2018. As a brand that resonates equally with men and women, we access both the women’s and men’s footwear markets, which grew at a 3.4% and 4.9% CAGR, respectively, from 2014 through 2018. We have also increased our exposure to the Casual, Outdoor and Sport use occasions, which grew two times faster than the overall U.S. footwear market from 2016 to 2018, according to NPD’s Retail Tracking Service.
We see tremendous potential to further expand our business globally. According to Euromonitor, the footwear market was $246 billion in 2018, or 78%, outside the United States and Canada, and our International segment represented only 14.3% of revenue in fiscal year 2019.
Lifestyle Accessories
Our lifestyle accessories include a selection of handbags, small leather goods, hosiery, shoe care, eyewear, outerwear, suiting and cold weather goods that complement our footwear portfolio. These categories collectively represented a $466 billion retail sales market in 2018, and grew at a 3.7% CAGR from 2014 through 2018, according to Euromonitor.
95
Table of Contents
Our Products
We offer a broad range of products, including footwear and lifestyle accessories for four seasons across Dress, Casual, Outdoor and Sport use occasions.
| • | Footwear. Our multi-category footwear offering includes sneakers, oxfords, pumps, loafers, drivers, sandals, boots, chukkas and flats. Price points range from $60 to $400 across channels, with the majority of our products priced between $100 and $200. Our footwear products represented 92.2% of our revenue in fiscal year 2019. |
| • | Lifestyle Accessories. We offer an innovative selection of handbags, small leather goods, hosiery, shoe care, eyewear, outerwear, suiting and cold weather goods across a broad range of premium price points. Our lifestyle accessories products represented 7.8% of our revenue in fiscal year 2019. |
We create footwear and lifestyle accessories primarily under two labels, ZERØGRAND and GRANDSERIES. ZERØGRAND products feature overt design and innovation characteristics consumers can easily see, fusing athletic footwear engineering with modern styling. GRANDSERIES products combine classic styling and innovation characteristics consumers can feel when they try them on. We also market and sell footwear under other labels, including ØRIGINALGRAND.
96
Table of Contents
REPRESENTATIVE FOOTWEAR AND LIFESTYLE ACCESSORIES

Innovation at the Heart of Product Creation
We have established leading innovation and product-creation capabilities to build a diverse portfolio of breakthrough footwear and lifestyle accessories. Every product we make—from pumps to performance runners
97
Table of Contents
to handbags to outerwear—combines style with exceptional performance attributes built on our proprietary innovation platform, the Grand 36Ø Design & Engineering System. This system enables Cole Haan to create versatile, stylish and comfortable products that meet the demands of on-the-go consumers.
We built an Innovation Center in 2015 in Greenland, New Hampshire where talented team members with backgrounds in biomechanics, material science, engineered materials, advanced concept research and development, product development engineering, fit and performance testing and industrial design come together to employ state-of-the-art technology to invent breakthrough products. We have invested in 3-D modelling and printing capabilities along with a suite of new tools to extend the team’s capabilities and increase prototyping efficiency. Our Innovation Center allows us to continually deliver new products that meet and exceed our consumers’ expectations, develop a robust technology portfolio to protect us from imitators and increase our speed to market.
We created our revolutionary Grand 36Ø Design & Engineering System to solve consumer needs for versatile, stylish and comfortable products. This system focuses on specific performance principles such as ideal fit, lightweight construction, responsive cushioning, natural flexibility, modern craft, enhanced breathability, steady traction, energy return and weather readiness to deliver holistic product solutions in a repeatable manner. We protect our industry-leading technology and designs with a growing portfolio of over 400 patents, issued or pending.
We build on successful product collections by incorporating new styles and additional performance features, and also bringing new innovative product collections to market throughout the year. Our product development process allows us to introduce new products to the marketplace quickly and on complementary development calendars. Our typical go-to-market process takes 12 to 15 months. Our most rapid internal development process, which we call “Quick Strike,” enables us to address new opportunities emerging in the marketplace within 90 days from consumer insight to product introduction. More complex innovation projects operate on an “Advanced Development” process calendar, which can take between 24 months and 36 months to deliver new products to the market.
Marketing
We have modernized our marketing strategy, taking a “digital-first” approach from how we attract customers and drive interest in the brand to how we convert those consumers to purchase. Unlike our competitors, we have eliminated almost all traditional media investments and our marketing funnel is nearly 100% digitally driven and focused on mobile, consisting of differentiated native content and social media collaborations.
We believe we have significant capacity to increase our marketing investment while maintaining attractive returns. We believe we are in the early stages of capitalizing on our capabilities in performance marketing, and have ample runway to increase marketing investments, gain further share of voice with our customers and generate increased demand.
Our digital marketing effort interacts with consumers across the following three phases:
| • | Inspire. We seek to acquire new customers through two complementary ongoing methodologies: |
| ○ | Native Content. We collaborate with progressive traditional media partners to produce award-winning and differentiated native content that is displayed on digital platforms for their readers. We partner with them to define a target audience, messaging strategy and creative production to deliver inspiring and informative stories of extraordinary lives. Examples of this include the Changemakers series on the Forbes BrandVoice platform; a story of several members of the New York City Ballet, called Grit & Grace, with The New York Times; and a forthcoming podcast with The New York Times—a first for this media partner—to debut in Spring 2020. In addition, we create native content on new media platforms such as Axios, The Infatuation and The Skimm to deliver targeted messages of extraordinary to millennial audiences from authentic sources. |
98
Table of Contents
| ○ | Product and Social Media Collaborations. We selectively partner with cultural influencers and brands to create limited-edition products and inspirational messages for their social media audiences to introduce the Cole Haan brand to new audiences and existing customers with a new context. Examples of this include our recent collaborations with the streetwear brand and design studio Chinatown Market, as well as the luxury brand Rodarte. In our collaboration with Rodarte, we profiled the story of the label’s co-founders, sisters Kate and Laura Mulleavy, to build awareness of our shared brand values and inspire our female customer base. In both cases we made multiple products, created assets for distribution on their social channels and integrated them into our social channels, sites, paid media and native content stories. |
| • | Engage. We create targeted digital advertising and invest in media across an integrated landscape of media platforms to engage with our consumer cohorts many times throughout the day. This includes: |
| ○ | paid placements of our inspirational content in “snackable” formats meant for mobile phones through programmatic display advertising, syndicated across many platforms; |
| ○ | paid advertising, or “whitelisting,” of social influencer posts to increase reach and engagement with their custom Instagram audiences; |
| ○ | social prospecting, delivering both inspirational extraordinary stories and product-specific messages to targeted audiences on social platforms such as Facebook, Instagram, Twitter, YouTube and Snapchat; and |
| ○ | dynamic re-targeting of consumers who have engaged with our native content or sites through social media and via syndicated banner placements. |
| • | Inform. When inspired and engaged consumers demonstrate a desire to learn more about Cole Haan through digital search or by visiting colehaan.com, we invest in several mechanisms to ensure we connect them with the product information they need to make a purchase decision and drive purchase conversion. We accomplish this through search engine optimization, paid listings and partnerships with our wholesale partners. |
We partner closely with our wholesale partners to create digital shop-in-shop environments on their sites with a consistent brand experience, tailored product stories and a carefully curated assortment. We also coordinate with wholesale partners on marketing content and events, as well as optimizing search and other data analyses to drive higher traffic and conversion for our brand.
Our marketing organization includes both global and regional marketing teams. Our global marketing team is responsible for developing a toolkit of marketing assets and brand guidelines to be applied across all marketing activities. Our regional marketing teams adapt global tools for local relevance and execute marketing strategies within the markets where we operate. In addition to our primary showroom in New York City, we maintain regional showrooms in Tokyo, Hong Kong, London and Amsterdam.
We believe our differentiated marketing efforts are driving the success of our DTC business, as we had 61 million visits to colehaan.com and our North America stores in fiscal year 2019, a 31% increase from fiscal year 2018, and nearly 70% of digital visits coming from mobile devices in fiscal year 2019. A key component of our future marketing strategy is strengthening our long-term customer relationship through retention activities such as a digital membership program, customized experiences and product marketing tailored for individual customer preferences. We believe we are at the early stages of building this increased intimacy with our customers, which we expect will allow us to gain more share of our customers’ closets and encourage brand advocacy.
Our Multi-Channel Distribution Network
We have built a global, multi-channel distribution network across 64 countries that includes our global digital flagship site, colehaan.com, 368 stores and over 450 diverse global wholesale accounts. We provide a
99
Table of Contents
seamless brand experience globally and strive to be everywhere consumers want to shop. We operate across two segments: North America (85.7% of fiscal year 2019 revenue), which includes our North America DTC and North America Wholesale and Licensing businesses, and International (14.3% of fiscal year 2019 revenue), which includes our Japan business and our partnerships with best-in-class regional distributors and wholesalers. Across all geographies in our network, DTC channels represented 59.2% of our fiscal year 2019 revenue and wholesale channels represented 40.8% of our fiscal year 2019 revenue.
COLE HAAN CHANNEL OVERVIEW*
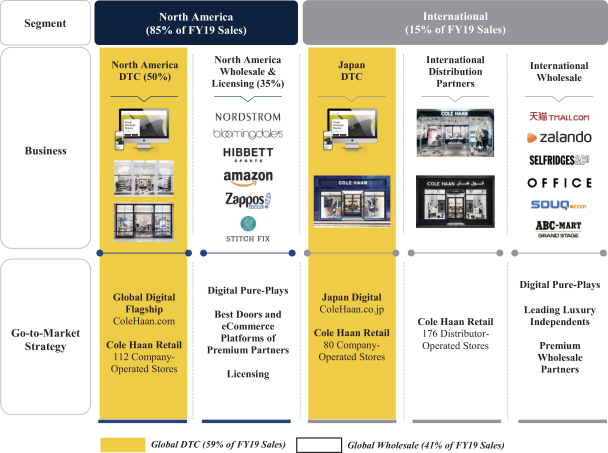
| * | Represents a selection of our wholesale partners. Shaded yellow columns denote our DTC business. |
North America
North America DTC
Our North America DTC channel is led by our digital flagship site, colehaan.com, and is complemented by a focused footprint of 112 stores that allow for controlled brand messaging and a consistent customer experience across all touchpoints.
Digital. Our global flagship website, colehaan.com, offers the broadest assortment of products, is the definitive resource for brand storytelling to consumers and is available in multiple formats, including desktop, tablet and mobile. Our website delivers distinct and immersive brand experiences, enhanced shopping experiences and digital content, such as suggested use occasions and product-specific Q&A, that drives consumer
100
Table of Contents
engagement and purchase conversion. Features available to consumers on our sites include omni-channel shopping options (such as buy online and return in store, and ship from store), predictive sizing tools and checkout ability across six different payment platforms. Our platform is built upon three cloud-based technology platforms across demand generation (marketing), commerce and analytics.
Stores. We operate 112 stores, including 31 inline and 81 outlet stores, located in premium locations in key metro markets in the United States and Canada. Our inline store locations showcase our most innovative styles and products in an atmosphere reflecting the distinctive image of our brand. At our outlet locations, most of our products are made for outlet with the balance comprising past season merchandise. Our stores average approximately 3,150 gross square feet in size. We operate a healthy store base with attractive margins across our fleet and nearly all of our locations are profitable. We plan to selectively grow our store footprint with highly productive, digitally connected smaller square footage locations, averaging approximately 2,000 square feet.
North America Wholesale and Licensing
We have a diverse wholesale distribution platform in North America partnering with more than 350 leading accounts across the digital pureplay, specialty retail, premium department store, sporting goods and family footwear accounts. Our partnerships with these accounts extend the brand’s reach to customers not currently served by our own sites and stores and showcase merchandise in different formats.
Our products are sold to our wholesale partners primarily by our own sales force in our showrooms. We employ a rigorous approach to product segmentation, often on a retailer-by-retailer basis, by selling a price-appropriate, compelling assortment of our merchandise. Our segmentation strategy allows us to engage a broad set of accounts, while minimizing channel conflict and maximizing profitability. To manage our DTC channels, we engage in retail and digital agreements with top customers. We also enforce a minimum advertised pricing policy to prevent channel price conflicts.
A representative selection of our wholesale partners includes Nordstrom, Bloomingdale’s, Hibbett Sports, Amazon, Zappos and Stitch Fix. Nordstrom and its subsidiaries accounted for 12.1% of our fiscal year 2019 revenue. We sell through both our wholesale partners’ most productive locations as well as through their respective digital commerce platforms, leveraging our drop-ship capabilities to offer a broader digital commerce product assortment. Digital sales, which account for approximately one-third of our wholesale business, include sales to both digital pureplays and websites of our wholesale partner accounts (such as Nordstrom.com and Bloomingdales.com).
Within the North America Wholesale and Licensing channel, we generate royalty income from our licensing partners who manufacture a portion of our lifestyle accessories, including select outerwear, hosiery, eyewear, cold weather goods and small leather goods. We also purchase these products from our partners at a favorable price for assortment in our DTC channels in North America and Japan.
International
Our International segment includes our wholly owned Japanese subsidiary and partnerships with leading regional distributors and wholesalers.
Japan DTC and Wholesale
We have operated in Japan for nearly 25 years and maintain a premium position in the marketplace. Our products are distributed through our Company-operated stores, local digital site and wholesale partners. We operate 80 stores consisting of three freestanding locations, 52 concessions and 25 outlets. We believe our store presence in Japan, led by our global flagship Ginza location in Tokyo, serves as a gateway that builds awareness among international consumers and leading wholesale partners. We are primarily focused on growing our digital and wholesale channels in Japan, which we believe are relatively underpenetrated as a percentage of our sales.
101
Table of Contents
International Distributors and Wholesale Partners
We have established relationships with 37 premier global distributors who distribute our products in over 60 countries in our International segment. Our distributors mainly retail our products through 176 Cole Haan stores (composed of concession, freestanding and outlet stores) across Asia, the Middle East, Europe, South America and Central America. We employ an attractive, capital-efficient model where our distributors fund store build out and marketing costs in exchange for exclusive regional distribution rights, typically excluding digital commerce rights that we retain. Our distributors purchase product from us at a discounted wholesale price. We approve all distributor-operated new store locations, and partners work closely with our store design team on the design of all locations so that the brand presentation is consistent across markets.
We are also in the early stages of expanding our wholesale business internationally. Select wholesale partners internationally include Selfridges, Liberty of London, Sole Trader and Office. We plan to continue to drive expansion with our distributors and wholesale partners in international markets with limited future capital outlay.
Sourcing and Supplier Relationships
We do not own or operate any manufacturing facilities, but instead source finished products from a selected number of independent suppliers, many of whom Cole Haan has maintained long-standing relationships with. We source our footwear and selected lifestyle accessories from 12 suppliers across Vietnam, India and China, with our largest supplier representing 27% of the total footwear units we purchased in fiscal year 2019. Over the last five years, we have, in tandem with our long-term suppliers, shifted production from China to Vietnam in an effort to minimize cost, diversify supply sources and proactively protect against inflationary and political pressures. Currently, less than 15% of our footwear and handbag products are manufactured in China and we intend to further reduce that percentage over time.
We believe our suppliers have the capacity to accommodate our future growth. We do not have any long-term agreements requiring us to use any manufacturer, and no manufacturer is required to produce our products over the long term. Suppliers operate under the close supervision of our global sourcing functions located in Vietnam and India, with assistance from our U.S. quality assurance team. All products are produced according to our specifications and standards. Production and quality control staff in each country monitor manufacturing at supplier facilities in order to correct any issues prior to shipment of the final product. We require all suppliers who manufacture our products to comply with our code of conduct relating to supplier working conditions as well as certain environmental, employment and sourcing practices. See “Risk Factors—Risks Related to Our Business—Our products are subject to risks associated with sourcing and manufacturing” and “Risk Factors—Risks Related to Our Business—Failure of our suppliers or our licensees’ suppliers to use ethical business practices and comply with our code of conduct and laws and regulations could harm our business.”
Logistics Network
Our inventory is shipped directly from our suppliers to our 314,000 square foot distribution center in New Hampshire, which we directly lease and operate, and third-party managed fulfillment centers in the United States, Hong Kong and Japan. The inventory is then processed, sorted and shipped to our stores, our customers or our business partners using third-party carriers. The distribution network is managed through global information technology systems that provide an integrated view of inventory across our distribution center and third-party fulfillment centers. We believe that the size and scalability of our distribution network is sufficient to support our future expansion. See “Risk Factors—If we encounter problems with distribution, our or our customers’ ability to deliver our products to market could be adversely affected.”
Information Technology
Our information technology systems are critical to our day-to-day operations as well as to our long-term growth strategies. Our technology is integrated across multiple functions throughout the organization, delivering
102
Table of Contents
end-to-end logistics services, inventory and supply chain management, distribution and fulfillment, financial reporting and accounting functions. Our technology is the foundation of our merchandising and marketing functions; it processes our customers’ and wholesale and distribution partners’ orders, integrates our digital commerce sales with stores, includes drop-ship capabilities to fuel wholesale digital sales and provides a superior customer experience on our sites. We have agreements with third parties to provide hosting services and administrative support for portions of our infrastructure, and utilize cloud-based systems in addition to those hosted on premises.
Competition
The global footwear and lifestyle accessories markets are highly competitive and fragmented. We compete against a wide range of designers and manufacturers of footwear and lifestyle accessories, both domestic and international, across a wide range of retail price points. We also compete with vertically integrated specialty stores, footwear brands, accessories brands, apparel companies, retailers’ private or exclusive labels and certain digital commerce sites. Some of our competitors may be significantly larger and have substantially greater resources than us. Our competitive set includes both established companies that are seeking to expand their market share and new entrants to the market. We compete primarily on the basis of performance features, versatility, comfort, quality, price, style, brand recognition and customer service.
Intellectual Property
Our success depends, in part, upon our ability to protect, maintain and enforce our intellectual property. To protect proprietary rights in our products, new developments, improvements and inventions, we rely on a combination of patents, trademarks, trade secrets and other intellectual property rights, and contractual restrictions on use, disclosure and copying, as well as contractual obligations with respect to ownership and transfer of title.
We own over 230 issued patents and over 190 pending patent applications in key global markets. Depending upon the country of issue and type of patent, most of the patents in our patent portfolio have a term of ten to 25 years from their date of priority. In addition, many of our products are offered under proprietary trademarks. We own approximately 29 U.S. trademark registrations, 429 foreign trademark registrations and three pending U.S. applications and 33 foreign applications to register trademarks. We own our trademarks primarily through our subsidiary, Cole Haan LLC and its affiliates, which trademarks include: COLE HAAN, ZERØGRAND, 2.ZERØGRAND, 3.ZERØGRAND, ØRIGINALGRAND, STITCHLITE, GRANDSERIES, GRAND AMBITION and GRANDPRØ. We protect our proprietary rights in trade secrets and know-how through a variety of methods, including confidentiality agreements with vendors, suppliers, strategic partners, co-developers, employees, consultants and others who may have access to our confidential and proprietary information.
Impact of Variability of Calendar on Comparability of Our Quarterly Results
Our fiscal year ends on the Saturday closest to May 31 and, consequently, our interim fiscal quarters typically end on the Saturday closest to the last calendar day of August, November and February. The following table sets forth the percentage of our total revenue represented by each of our fiscal quarters over the last two fiscal years:
| Percentage of Annual Revenue | Q1 | Q2 | Q3 | Q4 | ||||||||||||
| Fiscal year 2018 |
20.8 | % | 30.1 | % | 23.0 | % | 26.1 | % | ||||||||
| Fiscal year 2019 |
22.5 | % | 28.7 | % | 23.1 | % | 25.7 | % | ||||||||
Many major holidays typically occur near the end of our fiscal quarters and the exact timing of these holidays may impact our results in a given quarter. As a result of the variability of when holidays occur in the calendar, comparing the results of our fiscal quarters to the comparable period of prior fiscal years may not be indicative of our underlying performance.
103
Table of Contents
For example, we typically generate a significant amount of North America segment revenue during the holiday shopping period extending generally from Thanksgiving to Christmas. Our second fiscal quarter usually ends on the Saturday closest to November 30, so the timing of Thanksgiving in a given year determines how much of the holiday shopping period is included in the second quarter compared to the third quarter of our fiscal year. As a result, our second and third quarter results for fiscal years in which Thanksgiving falls later in November may not be comparable to our second and third quarter results for fiscal years in which Thanksgiving falls earlier in November.
In fiscal year 2018 and fiscal year 2019, Thanksgiving fell on November 23, 2017 and November 22, 2018, respectively, which had the effect of including nine days of the holiday shopping period in the second quarter of each fiscal year. However, due to Thanksgiving occurring on November 28, 2019 in fiscal year 2020, we expect more holiday shopping period sales to occur in the third quarter of fiscal year 2020.
Employees
We believe that the recruitment, training and knowledge of our employees and the consistency and quality of the service they deliver are central to our success. As of November 30, 2019, we had approximately 1,000 full-time and 1,350 part-time employees. Approximately 10 employees in our New York City retail stores are represented by a union. None of our other employees are represented by a union. We have never experienced a strike or work stoppage. We consider our relations with employees to be good.
Our Properties
We lease our free-standing Company-operated stores, our corporate headquarters, our distribution center and our regional and sourcing offices. Our corporate offices are located at 150 Ocean Road, Greenland, New Hampshire 03840 and 45 West 18th Street, New York, New York, 10011.
Our leases generally have a term of five to ten years, with renewal options to extend for one or more five-year periods. Most leases for our stores provide for a minimum rent and typically include escalating rent increases over time. In certain circumstances, we pay a percentage rent based upon sales after certain minimum thresholds are achieved. The leases generally require us to pay insurance, utilities, real estate taxes and repair and maintenance expenses.
Government Regulation and Other Considerations
Our operations are subject to extensive federal, state, local and foreign laws and regulations. We monitor changes in these laws and believe we are in material compliance with applicable laws. In the United States and in the other jurisdictions in which we operate, we are subject to labor and employment laws, laws governing advertising, data privacy and security, consumer protection, safety regulations and other laws, including zoning and occupancy ordinances that apply to retailers and/or the promotion and sale of merchandise and the operation of our retail stores and distribution center. Our products are also subject to regulation by U.S. and foreign governmental agencies, including, in the United States, the FTC and the Consumer Products Safety Commission, which relate principally to product labeling, licensing requirements, flammability testing and product safety. Our business is subject to a number of domestic and foreign laws and regulations that affect companies conducting business on the Internet, many of which are still evolving and could be interpreted in ways that could harm our business. In addition, because we accept debit and credit cards for payment, we are subject to the PCI Standard, which contains compliance guidelines with regard to our security surrounding the physical and electronic storage, processing and transmission of cardholder data. Our products that are manufactured and/or sold outside the United States may be subject to tariffs, treaties, anti-dumping measures, quotas, safeguard measures, trade restrictions and various trade agreements, as well as laws affecting the importation of consumer goods. Our international operations are also subject to compliance with the FCPA, the Bribery Act, requirements under the Treasury Department’s Office of Foreign Assets Control and other anti-corruption, anti-bribery and anti-money
104
Table of Contents
laundering laws. We are also subject to environmental laws, rules and regulations. We do not estimate any significant capital expenditures for environmental control matters either in the current fiscal year or in the near future. Our wholesale, distribution and licensing partners and suppliers are also subject to laws and regulations.
Legal Proceedings
We are currently and may in the future become subject to various claims and pending or threatened lawsuits in the ordinary course of our business. Although the results of legal proceedings and claims cannot be predicted with certainty, we believe we are not currently party to any legal proceedings which, if determined adversely to us, would individually or taken together have a material adverse effect on our business, results of operations or financial condition. We also pursue litigation to protect our legal rights and additional litigation may be necessary in the future to enforce our intellectual property and our contractual rights, to protect our confidential information or to determine the validity and scope of the proprietary rights of others.
105
Table of Contents
Executive Officers and Directors
Below is a list of our executive officers and directors, their respective ages as of November 30, 2019 and a brief account of the business experience of each of them. Prior to October 2019, our directors (other than E. Lee Wyatt, Jr.) have served on the board of directors of Calceus Acquisition, Inc., an indirect, wholly owned subsidiary of Cole Haan, Inc. Calceus Acquisition, Inc., as a borrower, is the reporting entity under the Term Loan Facility and the ABL Facility. In connection with this offering, each of our directors (other than E. Lee Wyatt, Jr.) was appointed to the board of directors of Cole Haan, Inc. in October 2019, and E. Lee Wyatt, Jr. was appointed to the board of directors in January 2020.
| Name |
Age | Position | ||
| Jack A. Boys | 61 | Director and Chief Executive Officer | ||
| Thomas J. Linko | 47 | Chief Financial Officer | ||
| Laura W. Kelley | 61 | Senior Vice President, Legal, Human Resources & General Counsel | ||
| Alex Pellegrini | 44 | Chairman and Director | ||
| James Brett | 50 | Director | ||
| Ashwin Cadambi | 32 | Director | ||
| Marsden S. Cason | 77 | Director | ||
| Calvin McDonald | 48 | Director | ||
| E. Lee Wyatt, Jr. | 66 | Director |
Executive Officers
Jack A. Boys has served as our Chief Executive Officer and a Cole Haan director since February 2013. Prior to joining the Company, Mr. Boys served as the Chief Executive Officer of Converse, Inc. beginning in 2001. Mr. Boys subsequently led the turn-around and engineered the sale of Converse to Nike, Inc. in 2003 and continued as CEO until 2010. During the period from August 1998 through April 2001, Mr. Boys was actively pursuing investment acquisition opportunities. From March 1996 to July 1998, Mr. Boys served as vice president of global marketing for The North Face, Inc. Mr. Boys has over 25 years of leadership experience in the retail industry, including senior positions with Avia, an athletic footwear company, then a wholly owned subsidiary of Reebok International, LeCoq Sportif, an apparel brand owned by Adidas AG, and early in his career with Converse, Inc. Mr. Boys holds a B.A. degree from Southern Methodist University. We believe Mr. Boys’ qualifications to serve on our board of directors include his extensive business and financial experience related to the retail industry and his executive leadership and management experience.
Thomas J. Linko has served as our Chief Financial Officer since January 2018. Prior to joining the Company, Mr. Linko served as the Chief Financial Officer of Kate Spade & Company from October 2014 to August 2017, departing after the company was acquired by Tapestry, Inc. From July 2012 to October 2014, Mr. Linko was Chief Operating Officer and Chief Financial Officer of Juicy Couture. Prior to joining Juicy Couture, Mr. Linko was the Chief Financial Officer at Delta Galil, a global manufacturer and marketer of private label apparel products for men, women and children. In addition, Mr. Linko spent 12 years at Tommy Hilfiger, where he oversaw financial operations as the Senior Vice President of Finance for Tommy Hilfiger North America. Mr. Linko is a Certified Public Accountant and holds a B.S. and a MBA from Rider University.
Laura W. Kelley has served as our Senior Vice President, Legal, Human Resources & General Counsel since February 2013. Prior to joining the company, Ms. Kelley served as an Assistant General Counsel of Nike, Inc. from 2009 to 2013. Ms. Kelley also served as the Vice President, Legal, Human Resources & General Counsel of Converse Inc. from 2001 to 2009 and was with CVEO Corporation (formerly Converse, Inc.) from 1989 to 2001 in various legal positions of increasing responsibilities concluding with Vice President and Deputy General Counsel. In addition, Ms. Kelley served as Counsel with Apollo Computer, Inc. from 1988 to 1989 and
106
Table of Contents
as an Attorney with Digital Equipment Corporation from 1986 to 1988, both of which were subsequently acquired by Hewlett-Packard and Compaq, respectively. She also served as an Assistant District Attorney in the Plymouth County District Attorney’s Office from 1984 to 1986. Ms. Kelley holds a B.A. degree from Wheaton College and a J.D. degree from New England School of Law.
Directors
Alex Pellegrini has served as a Cole Haan director since February 2013 and is the Chairman of the Board. Mr. Pellegrini joined Apax Partners in 2000 and is a Partner in Apax Partners’ Consumer team. Prior to joining Apax Partners, Mr. Pellegrini was with Merrill Lynch & Co. in its investment banking department. Mr. Pellegrini holds a B.S. degree from The Pennsylvania State University. We believe Mr. Pellegrini’s qualifications to serve on our board of directors include his extensive business and financial experience related to the retail industry, and prior involvement with Apax Funds’ investment in the Company since 2013.
James Brett has served as a Cole Haan director since November 2018 and previously between January 2016 to June 2017. Mr. Brett has over 25 years of retail experience and most recently held the position of Chief Executive Officer and a director of J.Crew Group, Inc. Prior to joining J.Crew, Mr. Brett served as President, West Elm Brand of Williams-Sonoma, Inc. from January 2010 to June 2017. Prior to West Elm, Mr. Brett was the Chief Merchandising Officer for the Urban Outfitters Division at Philadelphia-based Urban Outfitters, Inc. He has also served in various merchandising roles at other retailers, including Anthropologie, the J.C. Penney Company, Inc. and The May Department Stores Company. We believe Mr. Brett’s qualifications to serve on our board of directors include his extensive business and financial experience related to the retail industry and his executive leadership and management experience.
Ashwin Cadambi has served as a Cole Haan director since March 2018. Mr. Cadambi joined Apax Partners in 2012 and is a Principal in Apax Partners’ Consumer team. Prior to joining Apax Partners, Mr. Cadambi was a Senior Associate at Lion Capital LLP. Prior to Lion Capital LLP, Mr. Cadambi was with Goldman Sachs & Co. LLC in its investment banking department. In addition to his roles in the financial services industry, Mr. Cadambi also served in line management positions at consumer brands including John Varvatos. From August 2015 to August 2016, Mr. Cadambi was Senior Manager of Planning and Strategy at Cole Haan. Mr. Cadambi holds a Sc.B. degree in Computational Biology from Brown University. We believe Mr. Cadambi’s qualifications to serve on our board of directors include his extensive business and financial experience related to the consumer industry, and prior involvement with Apax Funds’ investment in the Company since 2013.
Marsden S. Cason has served as a Cole Haan director and Executive Vice Chairman since February 2013. Mr. Cason previously served as the executive chairman and co-chairman of Converse, Inc. from March 2000 to September 2003. Mr. Cason was managing partner of Infinity Associates, an investment company, from 2004 through January 2013. Mr. Cason was the CEO of The North Face, Inc. from 1993 to 1996 and Chairman from 1997 through 1999. Mr. Cason holds a B.A. degree in Finance from San Francisco State University. We believe Mr. Cason’s qualifications to serve on our board of directors include his extensive business and financial experience related to the retail industry.
Calvin McDonald has served as a Cole Haan director since March 2016. Mr. McDonald is currently the Chief Executive Officer and a member of the board of directors of lululemon athletica inc. Prior to joining lululemon in August 2018, Mr. McDonald served for five years as President and CEO of Sephora Americas, a division of the LVMH group of luxury brands. Prior to joining Sephora in 2013, Mr. McDonald spent two years as President and CEO of Sears Canada. Prior to his tenure at Sears Canada, Mr. McDonald spent 17 years at Loblaw Companies Limited, a grocery and pharmacy leader in Canada. Mr. McDonald has a MBA from the University of Toronto, and Bachelor of Science degree from the University of Western Ontario. We believe Mr. McDonald’s qualifications to serve on our board of directors include his extensive business and financial experience related to the retail industry and his executive leadership and management experience.
107
Table of Contents
E. Lee Wyatt, Jr. has served as a Cole Haan director since January 2020. Mr. Wyatt served as Senior Vice President and Chief Financial Officer of Fortune Brands Home & Security, Inc. from 2011 to July 2017 and subsequently served as the Executive Vice President until December 2017. Mr. Wyatt served as Chief Financial Officer and Executive Vice President of Hanesbrands Inc. (formerly Sara Lee Branded Apparel) from 2005 to 2011. Prior to that, Mr. Wyatt held various financial roles at Sonic Automotive Inc., ultimately serving as Chief Financial Officer through 2005. Mr. Wyatt currently serves on the board of directors (and its audit and compensation committees) of Interpublic Group of Companies, Inc. Mr. Wyatt holds an MBA from Washington University in St. Louis and a B.S. degree in Accounting from Southern Illinois University. We believe Mr. Wyatt’s qualifications to serve on our board of directors include his extensive business and financial experience related to the retail industry, including as the chief financial officer of public companies.
Composition of Our Board of Directors
Our business and affairs are managed under the direction of our board of directors. Our amended and restated certificate of incorporation will provide for a classified board of directors, with directors in Class I (expected to be Messrs. ), directors in Class II (expected to be Messrs. ) and directors in Class III (expected to be Messrs. ). See “Description of Capital Stock.”
In addition, pursuant to the stockholders agreement to be entered into in connection with this offering, or the stockholders agreement, our Sponsor will have the right to designate nominees to our board of directors subject to the maintenance of certain ownership requirements in us. See “Certain Relationships and Related Party Transactions—Stockholders Agreement.”
Controlled Company Exemption
After the completion of this offering, our Sponsor who is party to the stockholders agreement will continue to beneficially own shares representing more than 50% of the voting power of our shares eligible to vote in the election of directors. As a result, we will be a “controlled company” as set forth in Rule 5615 of the NASDAQ Listing Rules. Under these corporate governance standards, a company of which more than 50% of the voting power is held by an individual, group or another company is a “controlled company” and may elect not to comply with certain corporate governance standards, including the requirements (1) that a majority of our board of directors consist of independent directors, (2) that our board of directors have a compensation committee that is comprised entirely of independent directors and (3) that our board of directors have a nominating and governance committee that is comprised entirely of independent directors. For at least some period following this offering, we may utilize one or more of these exemptions since our board of directors has not yet made a determination with respect to the independence of any directors other than Messrs. .
In the future, we expect that our board of directors will make a determination as to whether other directors, including directors associated with our Sponsor, are independent for purposes of the corporate governance standards described above. Pending such determination, you may not have the same protections afforded to stockholders of companies that are subject to all of these corporate governance requirements. In the event that we cease to be a “controlled company” and our shares continue to be listed on NASDAQ, we will be required to comply with these standards and, depending on our board of directors’ independence determination with respect to our then-current directors, we may be required to add additional directors to our board of directors in order to achieve such compliance within the applicable transition periods.
Board Leadership Structure and Our Board of Director’s Role in Risk Oversight
Committees of Our Board of Directors
After the completion of this offering, the standing committees of our board of directors will consist of an Audit Committee, a Compensation Committee and a Nominating and Governance Committee. Our board of directors may also establish from time to time any other committees that it deems necessary or desirable.
108
Table of Contents
Our chief executive officer and other executive officers will regularly report to the non-executive directors and the Audit Committee, the Compensation Committee and the Nominating and Governance Committee to ensure effective and efficient oversight of our activities and to assist in proper risk management and the ongoing evaluation of management controls. We believe that the leadership structure of our board of directors provides appropriate risk oversight of our activities given the controlling interests held by our Sponsor.
Audit Committee
Upon the completion of this offering, we expect to have an Audit Committee, consisting of E. Lee Wyatt, Jr., who will be serving as the Chair, Alex Pellegrini and James Brett. Mr. Wyatt and Mr. Brett qualify as independent directors under the corporate governance standards of NASDAQ and the independence requirements of Rule 10A-3 of the Exchange Act. Our board of directors has determined that Mr. Wyatt qualifies as an “audit committee financial expert” as such term is defined in Item 407(d)(5) of Regulation S-K.
The purpose of the Audit Committee will be to prepare the audit committee report required by the SEC to be included in our proxy statement and to assist our board of directors in overseeing:
| • | accounting, financial reporting and disclosure processes; |
| • | adequacy and soundness of systems of disclosure and internal control established by management; |
| • | the quality and integrity of our consolidated financial statements and the annual independent audit of our consolidated financial statements; |
| • | our independent registered public accounting firm’s qualifications and independence; |
| • | the performance of our internal audit function and independent registered public accounting firm; |
| • | our compliance with legal and regulatory requirements in connection with the foregoing; |
| • | compliance with our Code of Ethics and Business Conduct; and |
| • | overall risk management profile. |
Our board of directors will adopt a written charter for the Audit Committee, which will be available on our website upon the completion of this offering.
Compensation Committee
Upon the completion of this offering, we expect to have a Compensation Committee, consisting of Ashwin Cadambi and Alex Pellegrini, who will serve as the Chair.
The purpose of the Compensation Committee is to assist our board of directors in discharging its responsibilities relating to:
| • | the establishment, maintenance and administration of compensation and benefit policies designed to attract, motivate and retain personnel with the requisite skills and abilities to contribute to our long-term success; |
| • | setting our compensation program and compensation of our executive officers, directors and key personnel; |
| • | monitoring our incentive compensation and equity-based compensation plans; |
| • | succession planning for our executive officers, directors and key personnel; |
| • | our compliance with the compensation rules, regulations and guidelines promulgated by NASDAQ, the SEC and other laws, as applicable; and |
109
Table of Contents
| • | preparing the compensation committee report required to be included in our proxy statement under the rules and regulations of the SEC. |
Our board of directors will adopt a written charter for the Compensation Committee, which will be available on our website upon the completion of this offering.
Nominating and Governance Committee
Upon the completion of this offering, we expect to have a Nominating and Governance Committee, consisting of Ashwin Cadambi, Marsden Cason and Alex Pellegrini, who will serve as the Chair.
The purpose of the Nominating and Governance Committee is to:
| • | advise our board of directors concerning the appropriate composition of our board of directors and its committees; |
| • | identify individuals qualified to become members of our board of directors; |
| • | recommend to our board of directors the persons to be nominated by our board of directors for election as directors at any meeting of stockholders; |
| • | recommend to our board of directors the members of our board of directors to serve on the various committees of our board of directors; |
| • | develop and recommend to our board of directors a set of corporate governance guidelines and assist our board of directors in complying with them; and |
| • | oversee the evaluation of our board of directors, our board of directors’ committees and management. |
Our board of directors will adopt a written charter for the Nominating and Governance Committee, which will be available on our website upon the completion of this offering.
Compensation Committee Interlocks and Insider Participation
None of the members of our Compensation Committee has at any time been one of our executive officers or employees. None of our executive officers currently serves, or has served during the last completed fiscal year, on the compensation committee or board of directors of any other entity that has one or more executive officers serving as a member of our board of directors or Compensation Committee.
We are parties to certain transactions with our Sponsor and certain of our directors described in the section of this prospectus entitled “Certain Relationships and Related Party Transactions.”
Code of Ethics and Business Conduct
We will adopt a new Code of Ethics and Business Conduct that applies to all of our directors, officers and employees, including our chief executive officer and chief financial and accounting officer. Our Code of Ethics and Business Conduct will be available on our website upon the completion of this offering. Our Code of Ethics and Business Conduct is a “code of ethics,” as defined in Item 406(b) of Regulation S-K. We will make any legally required disclosures regarding amendments to, or waivers of, provisions of our code of ethics on our website.
110
Table of Contents
Executive Compensation
Summary Compensation Table
The following table provides summary information concerning compensation earned by our principal executive officer and our two other most highly compensated executive officers as of June 1, 2019 for services rendered for fiscal year 2019. These individuals are referred to as our named executive officers:
| Name and Principal Position |
Fiscal Year |
Salary ($)(1) |
Stock Awards ($)(2) |
Non-Equity Incentive Plan Compensation ($)(3) |
All Other Compensation ($)(4) |
Total ($) | ||||||||||||||||||
| Jack A. Boys |
2019 | 800,000 | — | 800,000 | 244,429 | 1,844,429 | ||||||||||||||||||
| Thomas J. Linko |
2019 | 460,000 | — | 460,000 | 21,942 | 941,942 | ||||||||||||||||||
| Laura W. Kelley |
2019 | 456,000 | — | 456,000 | 180,279 | 1,092,279 | ||||||||||||||||||
| (1) | The amounts reported represent the named executive officer’s base salary earned during the fiscal year covered. |
| (2) | The amounts reported represent the aggregate grant date fair value of the Class B Units awarded to Mr. Linko and Ms. Kelley in fiscal year 2019, calculated in accordance with FASB ASC Topic 718, or Topic 718, utilizing the assumptions discussed in Note 13 to our audited consolidated financial statements included elsewhere in this prospectus. The Class B Units are subject to market conditions and an implied performance condition as defined under applicable accounting standards. The grant date fair value of the Class B Units was computed based on the probable outcome of the performance conditions as of the grant date in accordance with Topic 718. Achievement of the performance conditions for the Class B Units granted in fiscal year 2019 was not deemed probable on the grant date and, accordingly, no value is included in the table for these awards pursuant to the SEC’s disclosure rules. Assuming achievement of the performance conditions, the grant date fair values of the Class B Units that were granted in fiscal year 2019 were $193,900 for Mr. Linko and $96,950 for Ms. Kelley. |
| (3) | Reflects the dollar value of awards earned under our fiscal year 2019 annual incentive plan for each of our named executive officers. For a description of the terms of the fiscal year 2019 annual incentive plan, see “—Narrative Disclosure to Summary Compensation Table—Non-Equity Incentive Plan Compensation.” |
| (4) | Reflects (a) housing and commuting expenses for Mr. Boys and Ms. Kelley and related tax gross-ups and (b) our 401(k) plan contributions on behalf of each of our named executive officers. |
Narrative Disclosure to Summary Compensation Table
Employment Agreements
Cole Haan LLC entered into an employment agreement with Mr. Boys, as amended by the amendment to Mr. Boys’ employment agreement, dated as of November 12, 2019, which we refer to as the Boys amendment, and an offer letter and a senior executive severance agreement with each of Mr. Linko and Ms. Kelley, in each case, that governs the terms of employment of each such named executive officer.
Mr. Boys’ Employment Agreement
Mr. Boys’ employment agreement became effective as of February 1, 2013 and provided for an initial term of two years that automatically renews on an annual basis unless otherwise terminated in accordance with the agreement. The agreement, as amended by the Boys amendment, also provides for (i) an annual base salary of
111
Table of Contents
$800,000, subject to annual review by the board of directors, and (ii) eligibility to receive an annual incentive payment, based on a target bonus opportunity established by our board of directors. Mr. Boys’ annual bonus opportunity is 100% of Mr. Boys’ annual base salary for the 2020, 2021 and 2022 fiscal years, and for all subsequent years unless otherwise determined by our board of directors. Mr. Boys is also entitled to participate in any employee benefit plan available for the benefit of Company employees generally and to a Company-paid term life insurance policy, with a death benefit amount payable of no less than Mr. Boys’ annual base salary. Mr. Boys is entitled to reimbursement for housing and commuting expenses incurred in working in the New York City metropolitan area, not to exceed $8,000 a month, except as otherwise determined by the Company. In addition, if Mr. Boys substantially prevails on any material dispute arising under his employment agreement, Mr. Boys is entitled to payment from the Company, within 30 days after receipt of an invoice from Mr. Boys, of all legal fees and expenses reasonably incurred by Mr. Boys as a result of such dispute. The agreement further provides for severance benefits upon certain qualifying terminations of employment and restrictive covenants following termination of employment, as described below under “—Termination and Change in Control Provisions.”
The Boys amendment further provides for severance benefits upon certain qualifying terminations of employment within the 18-month period following a change in control, as described below under “—Termination and Change in Control Provisions.”
Mr. Boys’ Bonus Letter
In connection with this offering, Mr. Boys entered into an agreement with Cole Haan LLC, dated as of October 15, 2019, which we refer to as the Boys bonus letter, pursuant to which Mr. Boys is entitled to receive a special bonus in the amount of $470,000, payable in two equal installments of $235,000 at the beginning of each of the 2021 and 2022 fiscal years in consideration of his forfeiture of his right to reimbursement for certain housing and commuting expenses (as described above). Payment of this bonus is subject to the completion of an initial public offering prior to the completion of fiscal year 2020, and the forfeiture of his right to reimbursement will occur following the consummation of an initial public offering (but no earlier than May 31, 2020). Mr. Boys is required to repay a portion of the special bonus if his employment is terminated prior to the end of fiscal year 2022 (he will retain a pro-rated portion of the bonus based on the number of days he remains employed during the 2021 and 2022 fiscal years).
In addition, under the Boys bonus letter, if Mr. Boys’ employment is terminated by the Company other than for “cause” (as defined in the Boys amendment) following a direct or indirect sale of the Company, the Company will reimburse Mr. Boys for any remaining payments due under his existing lease, subject to his reasonable best efforts to terminate or sublet the lease, and reimburse reasonable out-of-pocket and relocation expenses.
Mr. Linko’s Offer Letter and Senior Executive Severance Agreement
Mr. Linko’s offer letter is dated as of August 25, 2017 and provides that he is to serve as Chief Financial Officer of the Company on at at-will basis, which service commenced in January 2018. The offer letter also provides for (i) an initial base salary of $460,000, (ii) eligibility to participate in the Company’s annual bonus plan, with a target bonus of 30% of Mr. Linko’s fiscal year earnings, and (iii) an initial grant of equity equal to 30,000 Class B Units of the Partnership. Mr. Linko is also entitled to participate in certain employee benefit plans available for the benefit of Company employees generally. Mr. Linko is also party to a senior executive severance agreement, dated November 12, 2019, which further provides for severance benefits upon certain qualifying terminations of employment and restrictive covenants following termination of employment, as described below under “—Termination and Change in Control Provisions.”
Ms. Kelley’s Offer Letter and Senior Executive Severance Agreement
Ms. Kelley’s offer letter is dated as of February 4, 2013 and provided for an initial term of two years that automatically renews on an annual basis unless otherwise terminated in accordance with the letter. Ms. Kelley’s
112
Table of Contents
offer letter also provides for: (i) an initial base salary of $400,000, (ii) eligibility to receive an annual performance-based bonus with a bonus target commensurate with other direct reports to the Chief Executive Officer, (iii) eligibility to participate in the Company’s long-term incentive program, with a target incentive amount commensurate with other Company direct reports to the Chief Executive Officer, and (iv) an initial grant of 1% of the total pool of Class B Units (or 4% of the pool available for issuance to new executives). Ms. Kelley is also entitled to participate in certain employee benefit plans, policies and arrangements applicable to other executives generally. Ms. Kelley is also party to a senior executive severance agreement, dated November 12, 2019, which provides for severance benefits upon certain qualifying terminations of employment and restrictive covenants following termination of employment, as described below under “—Termination and Change in Control Provisions.”
Ms. Kelley’s Bonus Letter
In connection with this offering, Ms. Kelley entered into an agreement with Cole Haan LLC, dated as of October 15, 2019, which we refer to as the Kelley bonus letter, pursuant to which Ms. Kelley is entitled to receive a special bonus in the amount of $330,000, payable in two equal installments of $165,000 at the beginning of each of the 2021 and 2022 fiscal years in consideration of her forfeiture of her right to reimbursement for certain housing and commuting expenses. Payment of this bonus is subject to the completion of an initial public offering prior to the completion of fiscal year 2020, and the forfeiture of her right to reimbursement will occur following the consummation of an initial public offering (but no earlier than May 31, 2020). Ms. Kelley is required to repay a portion of the special bonus if her employment is terminated prior to the end of fiscal year 2022 (she will retain a pro-rated portion of the bonus based on the number of days she remains employed during the 2021 and 2022 fiscal years).
In addition, under the Kelley bonus letter, if Ms. Kelley’s employment is terminated by the Company other than for “cause” (as defined in Ms. Kelley’s offer letter) following a direct or indirect sale of the Company, the Company will reimburse Ms. Kelley for any remaining payments due under her existing lease, subject to her reasonable best efforts to terminate or sublet the lease, and reimburse reasonable out-of-pocket and relocation expenses.
Base Salary
We provide each named executive officer with a base salary for the services that the executive officer performs for us. This compensation component constitutes a stable element of compensation while other compensation elements are variable. Base salaries are reviewed annually and may be increased based on the individual performance of the named executive officer, company performance, any change in the executive’s position within our business, the scope of his or her responsibilities and any changes thereto.
There were no increases to the base salaries of any of our named executive officers in fiscal year 2019. Effective September 1, 2019, as a result of the annual salary and performance review process, the board of directors increased the base salaries of each of Mr. Linko and Ms. Kelley by 3% to $473,800 and $469,680, respectively.
Non-Equity Incentive Plan Compensation
Annual cash incentive awards are available to eligible employees, including the named executive officers, under our annual incentive plan, or the AIP, to motivate our employees to achieve short-term performance goals.
For fiscal year 2019, in order for the AIP pool to be funded, the Company was required to first meet certain sales growth, gross margin rate expansion, expense operating leverage and free cash flow targets. If each of these performance targets was achieved for the fiscal year, then the AIP pool would be funded based on the achievement of Adjusted EBITDA (as described under “Summary—Summary Historical Consolidated Financial
113
Table of Contents
and Other Data”) on a pre-bonus basis. The level of Adjusted EBITDA achievement is evaluated against an Adjusted EBITDA target to determine the extent to which the AIP pool should be funded and the amount of bonuses to be paid out. If threshold Adjusted EBITDA performance is achieved, then the bonus pool would be funded at a predetermined amount. If Adjusted EBITDA performance fell between threshold and 85% of target, then 100% of each dollar of Adjusted EBITDA achievement that exceeded the threshold amount, or the bonus share rate, would fund the bonus pool. If Adjusted EBITDA achievement fell above 85% of target, then the bonus share rate would be 30% of each dollar of Adjusted EBITDA achievement in excess of such amount. While there was no maximum funding level for the AIP pool, the maximum payout for each of our named executive officers was 100% of base salary.
In early fiscal year 2020, our board of directors determined that each of the corporate performance targets to fund the AIP for fiscal year 2019 had been met. Accordingly, our board of directors reviewed our performance with respect to Adjusted EBITDA to determine the actual amounts to fund the AIP pool. Based on the significant outperformance of our actual Adjusted EBITDA against the targeted Adjusted EBITDA in fiscal year 2019, our named executive officers earned AIP bonuses equal to 100% of base salary.
The following table sets forth the AIP awards payable to each of our named executive officers based on fiscal year 2019 financial performance:
| Name |
Base Salary ($) |
Target Bonus (% of Base Salary) |
Target Bonus ($) |
Bonus Payout (% of Base Salary) |
Total Award ($) |
|||||||||||||||
| Jack A. Boys |
800,000 | 30 | % | 240,000 | 100 | % | 800,000 | |||||||||||||
| Thomas J. Linko |
460,000 | 30 | % | 138,000 | 100 | % | 460,000 | |||||||||||||
| Laura W. Kelley |
456,000 | 30 | % | 136,800 | 100 | % | 456,000 | |||||||||||||
For fiscal year 2020, whether the AIP pool is funded (and the level of such funding) will be based solely on the fiscal year 2020 Adjusted EBITDA achieved.
Equity Awards
Our named executive officers have been granted long-term incentive awards in the form of Class B Units in the Partnership pursuant to the LPA. These Class B Units are intended to be treated as “profits interests” for U.S. tax purposes and have economic characteristics similar to stock appreciation rights. Therefore, the Class B Units only have value to the extent there is an appreciation in the amount that would be distributable to all then-outstanding units in the Partnership from and after the applicable grant date.
All Class B Units granted to our named executive officers are subject to performance-vesting criteria based on achievement on an initial measurement date (i.e., on the first to occur of an extraordinary distribution, an “approved partnership sale” (as defined in the LPA) or an initial public offering) and on any date following such initial measurement date on which Apax and its affiliates receive cash and/or freely tradeable securities in respect of equity securities of the Partnership (which we refer to as an Apax receipt), of both (i) a specified internal rate of return to Apax and its affiliates, which we refer to as the IRR hurdle, and (ii) specified returns of 1.0 times, 2.0 times or 3.0 times on Apax’s and its affiliates’ investment, as applicable to the applicable tranche, which we refer to as the return hurdle. Upon an initial public offering or a partnership sale (as defined in the LPA), the remaining equity securities held by Apax and its affiliates are valued based on the price in the public offering or partnership sale and treated as an Apax receipt for purposes of determining satisfaction of the IRR hurdle and return hurdle, and no other Apax receipts will be deemed to have been received after such initial public offering or partnership sale. Class B Units are eligible to participate in distributions pursuant to the terms of the LPA after the return of capital to Apax and its affiliates and receipt by Apax and its affiliates of amounts constituting a specified internal rate of return.
Except for Class B Units that have contingently vested, as described below, all Class B Units that have not performance vested are forfeited upon a termination of an individual’s employment or service, as applicable,
114
Table of Contents
with us. All vested and unvested Class B Units are terminated and forfeited for no consideration upon a termination of employment or service, as applicable, for “cause” (as defined in the applicable Class B Unit agreement) or upon a breach by the individual of applicable restrictive covenants, as described below under “—Termination and Change in Control Provisions—Restrictive Covenants.”
Class B Units contingently vest based on the passage of time between a specified vesting commencement date and the applicable individual’s termination of employment or service, as applicable. Class B Units that have contingently vested remain outstanding and eligible to vest upon achievement of both the IRR hurdle and the return hurdle, subject to the Company’s right to repurchase such contingently vested Class B Units. As to the Class B Units granted to Mr. Boys, (i) 57,500 Class B Units were immediately contingently vested upon grant of such Class B Units, (ii) 140,000 Class B Units become contingently vested in equal monthly installments following the first anniversary of the vesting date (so as to be fully vested on the fifth anniversary of the vesting commencement date) and (iii) 625 Class B Units vested on November 1, 2017, with an additional 3,125 Class B Units vesting in equal monthly installments over the next three months. As to the Class B Units granted to Mr. Linko, 40,000 Class B Units become contingently vested in equal monthly installments over a four-year period beginning the month following the vesting commencement date. As to the Class B Units granted to Ms. Kelley, 30,000 Class B Units become contingently vested in equal monthly installments over a four-year period beginning the month following the vesting commencement date.
Upon a termination of a named executive officer’s employment or service with us for any reason, we have the right, but not the obligation, within 180 days following such individual’s termination of employment or service, to repurchase any or all of such individual’s contingently vested Class B Units, at a price per unit equal to the fair value of such unit on the date of termination of employment or service. The fair value of a Class B Unit is the amount, as reasonably determined by our board of directors in good faith, that the holder of the Class B Unit would receive in respect of such unit if the Partnership’s assets were sold in an orderly process as a going concern for its then-fair market value (as determined in accordance with the LPA), after payment of all indebtedness and reasonable reserves for contingent liabilities and obligations, as applicable, and the remaining proceeds were distributed to holders of Partnership units in accordance with the terms of the LPA after taking into account all prior distributions.
Class B Units (or shares of our common stock issued in respect of Class B Units in a public offering) are subject to transfer restrictions set forth in the LPA. In the event of a public offering, the transfer restrictions will lapse on the following schedule:
| • | on the seven-month anniversary of an initial public offering, 10% of the then-applicable incentive units, less any Class B Units or shares, as applicable, sold in a public offering between the seven-month and first anniversaries of an initial public offering; |
| • | on the first anniversary of an initial public offering, 25% of the then-applicable incentive units, less any Class B Units (or shares) sold in a public offering between the first and second anniversaries of an initial public offering; |
| • | on the second anniversary of an initial public offering, 33.33% of the then-applicable incentive units, less any Class B Units (or shares) sold in a public offering between the second and third anniversaries of an initial public offering; |
| • | on the third anniversary of an initial public offering, 50% of the then-applicable incentive units, less any Class B Units (or shares) sold in a public offering between the third and fourth anniversaries of an initial public offering; and |
| • | on the fourth anniversary of an initial public offering, all remaining applicable incentive units. |
For purposes hereof, “applicable incentive units” means the number of Class B Units (or shares of our common stock) held immediately following an initial public offering less any Class B Units (or shares of our common stock) that have been released from transfer restrictions or sold in a public offering.
115
Table of Contents
Pursuant to the Class B Unit award agreements, our named executive officers have agreed to specified restrictive covenants, including (i) a perpetual confidentiality covenant, (ii) covenants related to non-competition, non-solicitation of customers, employees, agents and representatives, and non-interference with business relationships, in each case, during employment or service, as applicable, and for a period of 12 months thereafter and (iii) non-disparagement, during employment or service, as applicable, and for three years thereafter.
In connection with this offering, we expect to convert all of the Class B Units held by our executive officers into, or otherwise redeem Class B Units for, shares of our common stock. The number of shares received in this conversion or redemption will be determined in a manner intended to replicate the respective economic value associated with the corresponding Class B Units converted or redeemed based on the valuation derived from the initial public offering price.
Outstanding Equity Awards at June 1, 2019
The following table provides information regarding outstanding equity awards made to our named executive officers as of June 1, 2019:
| Stock Awards | ||||||||||||||||||||
| Name |
Grant Date | Number of Shares or Units of Stock that Have Not Vested (#) |
Market Value of Shares or Units of Stock that Have Not Vested ($) |
Equity Incentive Plan Awards: Number of Unearned Shares, Units or Other Rights that Have Not Vested (#)(1) |
Equity Incentive Plan Awards: Market or Payout Value of Unearned Shares, Units or Other Rights that Have Not Vested ($)(2) |
|||||||||||||||
| Jack A. Boys |
2/1/13 | — | — | 195,000 | 4,208,012 | |||||||||||||||
| 3/26/14 | — | — | 2,500 | 53,949 | ||||||||||||||||
| 5/27/15 | — | — | 10,000 | 215,795 | ||||||||||||||||
| Thomas J. Linko |
2/8/18 | — | — | 30,000 | 647,386 | |||||||||||||||
| 5/31/19 | — | — | 10,000 | — | ||||||||||||||||
| Laura W. Kelley |
3/26/14 | — | — | 10,000 | 215,795 | |||||||||||||||
| 4/30/15 | — | — | 15,000 | 323,693 | ||||||||||||||||
| 5/31/19 | — | — | 5,000 | — | ||||||||||||||||
| (1) | Reflects unvested Class B Units for which the performance vesting conditions have not yet been achieved. The vesting terms of these Class B Units are described under “—Narrative Disclosure to Summary Compensation Table—Equity Awards.” |
| (2) | The equity value of our business had appreciated to a level that would have created value in the Class B Units granted prior to May 31, 2019 as of the date of our most recent valuation prior to June 1, 2019. Therefore, the market value of the Class B Units reflected in this table as of June 1, 2019 was based on the appreciation in the value of our business as of the date of our most recent valuation prior to June 1, 2019 and was determined in accordance with the provisions of the LPA. |
Termination and Change in Control Provisions
Severance Arrangements
Boys Employment Agreement
Under the terms of his employment agreement, Mr. Boys will be entitled to the following severance pay and benefits if his employment is terminated by the Company without “cause,” if he terminates his employment for “good reason” (as such terms are defined in his employment agreement), if his employment is terminated as a
116
Table of Contents
result of his “disability” (as such term is defined in the Boys amendment) or if the Company elects not to extend the term of his employment agreement, subject to compliance with restrictive covenant and cooperation obligations and to the execution and non-revocation of a release of claims in favor of the Company and its affiliates, in addition to certain accrued obligations: (i) any earned but unpaid annual bonus; (ii) a pro rata portion of his annual bonus for the year of termination, based on actual performance; and (iii) 12 months’ continued base salary as in effect on the termination date. Subject to the execution and non-revocation of a release of claims in favor of the Company and its affiliates and Mr. Boys’ timely election of continuation coverage under the Consolidated Omnibus Budget Reconciliation Act of 1985, or COBRA, and applicable law, which we refer to as COBRA continuation coverage, Mr. Boys and his eligible dependents are also entitled to continued participation in the Company’s group health plan, which we refer to as the health continuation benefit, for a period of up to 12 months following the termination date at active employee rates.
Under the terms of the Boys amendment, Mr. Boys is further entitled to the following severance pay and benefits if his employment is terminated by the Company without “cause,” or if he terminates his employment for “good reason,” within the 18-month period following a “change of control” (as defined in the Boys amendment), subject to compliance with restrictive covenant and cooperation obligations and to the execution and non-revocation of a release of claims in favor of the Company and its affiliates, in addition to certain accrued obligations: (i) two years’ continued base salary as in effect on the termination date; (ii) a pro rata portion of his annual bonus for the year of termination of employment, based on actual performance; and (iii) a lump sum payment equal to two times Mr. Boys’ target bonus for the year of termination. Subject to Mr. Boys’ timely election of COBRA continuation coverage, compliance with restrictive covenant and cooperation obligations and execution and non-revocation of a release of claims in favor of the Company and its affiliates, Mr. Boys and his eligible dependents are also entitled to health continuation coverage for a period of up to 18 months following his termination date, at active employee rates, which period we refer to as the CIC benefit period. Following the CIC benefit period, the Company will use reasonable efforts to obtain individual medical insurance policies for Mr. Boys and his eligible dependents at a cost of up to the amount the Company would have paid had Mr. Boys continued participation in our medical plan for six months following the CIC benefit period. If coverage cannot be obtained, then the Company will pay Mr. Boys a monthly amount equal to the amount the Company would have paid had Mr. Boys continued participation in our medical plan for six months following the CIC benefit period.
If Mr. Boys’ employment is terminated as a result of his death and the Company is unable to obtain the life insurance policy described above under “—Employment Agreements,” subject to the execution and non-revocation of a release of claims in favor of the Company and its affiliates, in addition to certain accrued obligations, Mr. Boys’ policy beneficiaries will be entitled to receive a lump-sum payment equal to 12 months’ base salary.
Senior Executive Severance Agreements with Mr. Linko and Ms. Kelley
The Company is party to a senior executive severance agreement with each of Mr. Linko and Ms. Kelley, which we refer to as the executive severance agreements. The executive severance agreements provide that Mr. Linko and Ms. Kelley will be entitled to the following severance pay and benefits if the executive’s employment is terminated by the Company other than for “cause,” death or “disability,” or if the executive terminates employment for “good reason” (as such terms are defined in the executive severance agreements), subject to execution and non-revocation of a release of claims in favor of the Company and its affiliates, in addition to certain accrued obligations (including any earned but unpaid prior year bonus): (i) one year’s continued base salary as in effect on the termination date; (ii) a pro rata target bonus for the fiscal year of termination of employment; and (iii) subject to the timely election of COBRA and payment of premiums associated with such coverage, reimbursement for up to one year of the excess costs of the COBRA continuation coverage (with the excess equal to the COBRA premium minus the premiums for such benefits payable by an active employee), which we refer to as executive COBRA continuation. For purposes of the executive severance agreements, the target bonus for each of Mr. Linko and Ms. Kelley is established at (x) 100% of the executive’s base salary for the
117
Table of Contents
2020 fiscal year, (y) 70% of the executive’s base salary for the 2021 fiscal year and (z) 70% of the executive’s base salary for the 2022 fiscal year and all subsequent fiscal years, unless otherwise determined by our board of directors.
The executive severance agreements further provide that, if either Mr. Linko’s or Ms. Kelley’s employment is terminated by the Company other than for “cause,” death or “disability,” or if the executive terminates employment for “good reason,” in either case, within the 18-month period following a “change of control” (as defined in the executive severance agreements), the executive is entitled to the following severance pay and benefits, subject to the execution and non-revocation of a release of claims in favor of the Company and its affiliates, in addition to certain accrued obligations (including any earned but unpaid prior year bonus): (i) 18 months’ continued base salary as in effect on the termination date; (ii) a pro rata target bonus for the year of termination of employment; (iii) a lump sum payment equal to 100% of the executive’s target bonus for the year of termination of employment; and (iv) up to 18 months of executive COBRA continuation.
Restrictive Covenants
Mr. Boys’ employment agreement contains (i) a perpetual confidentiality covenant, (ii) covenants related to non-competition, non-solicitation of customers, vendors, employees, representatives and agents and non-interference with business relationships, in each case, during his employment with us and for a period of 12 months thereafter and (iii) mutual non-disparagement, during his employment and for a period of three years thereafter.
As a condition to Mr. Linko’s employment, Mr. Linko entered into the Company’s restrictive covenant agreement, containing covenants related to non-competition and non-solicitation of employees, in each case, for a period of 12 months after termination of his employment.
Ms. Kelley’s offer letter contains covenants of non-competition for a period of one year following termination of employment and non-solicitation for a period of two years following termination of employment.
Equity Awards
All Class B Units (other than Class B Units that have contingently vested, as described above under “—Narrative Disclosure to Summary Compensation Table—Equity Awards”) that have not performance vested are forfeited upon a termination of an individual’s employment or service, as applicable, with us. All vested and unvested Class B Units are terminated and forfeited for no consideration upon a termination of employment or service, as applicable, for “cause” (as defined in the applicable Class B Unit agreement) or upon a breach by the individual of applicable restrictive covenants, as described above under “—Restrictive Covenants.”
Retirement Plan
Our named executive officers are eligible to participate in the Company’s tax-qualified 401(k) defined contribution plan, under which we make matching contributions to all participants in the 401(k) plan equal to 100% of the first 5% of a participant’s eligible compensation contributed to the 401(k) plan. We may also make discretionary profit-sharing contributions to eligible participants. We do not have a defined benefit plan or any non-qualified deferred compensation arrangements.
2020 Omnibus Incentive Plan
In connection with this offering, our board of directors expects to adopt, and we expect our stockholders to approve, the Cole Haan, Inc. 2020 Omnibus Incentive Plan, which we refer to as the Omnibus Incentive Plan, prior to the completion of the offering. Equity awards to our named executive officers under the Omnibus Incentive Plan will be designed to reward our named executive officers for long-term stockholder value creation.
118
Table of Contents
The awards expected to be made under our Omnibus Incentive Plan concurrent with the closing of this offering will be granted to recognize such individuals’ efforts on our behalf in connection with our formation and this offering, to ensure their alignment with our stockholder’s interests, and to provide an additional retention element to their compensation.
Purpose. The purpose of the Omnibus Incentive Plan is to provide a means through which to attract, retain and motivate key personnel and to provide a means whereby our directors, officers, employees, consultants and advisors can acquire and maintain an equity interest in the Company, or be paid incentive compensation, including incentive compensation measured by reference to the value of our common stock, thereby strengthening their commitment to the Company’s welfare and aligning their interests with those of our stockholders.
Administration. The Omnibus Incentive Plan will be administered by the Compensation Committee or such other committee of our Board of directors to which it has properly delegated power, or if no such committee or subcommittee exists, our board of directors. The Compensation Committee is authorized to interpret, administer, reconcile any inconsistency in, correct any defect in and/or supply any omission in the Omnibus Incentive Plan and any instrument or agreement relating to, or any award granted under, the Omnibus Incentive Plan; establish, amend, suspend, or waive any rules and regulations and appoint such agents as the Compensation Committee deems appropriate for the proper administration of the Omnibus Incentive Plan; adopt sub-plans; and to make any other determination and take any other action that the Compensation Committee deems necessary or desirable for the administration of the Omnibus Incentive Plan. Except to the extent prohibited by applicable law, the Compensation Committee may allocate all or any portion of its responsibilities and powers to any one or more of its members and may delegate all or any part of its responsibilities and powers to any person or persons selected by it in accordance with the terms of the Omnibus Incentive Plan. Unless otherwise expressly provided in the Omnibus Incentive Plan, all designations, determinations, interpretations, and other decisions under or with respect to the Omnibus Incentive Plan or any award or any documents evidencing awards granted pursuant to the Omnibus Incentive Plan are within the sole discretion of the Compensation Committee, may be made at any time and are final, conclusive and binding upon all persons or entities, including, without limitation, the Company, any of our subsidiaries, any participant, any holder or beneficiary of any award, and any of our stockholders. Subject to the provisions of the Omnibus Incentive Plan, the Compensation Committee may designate participants, determine the types and sizes of awards to be granted to participants, and determine the terms and conditions of awards, which will be set forth in the applicable award agreement.
Shares Subject to Omnibus Incentive Plan. The Omnibus Incentive Plan provides that the total number of shares of common stock that may be issued under the Omnibus Incentive Plan is (the “plan share reserve”), provided, however, that the plan share reserve shall be increased on the first day of each fiscal year beginning with the 2022 fiscal year in an amount equal to the lesser of (i) the positive difference, if any, between (x) % of the outstanding common stock on the last day of the immediately preceding fiscal year and (y) the plan share reserve on the last day of the immediately preceding fiscal year and (ii) a lower number of shares of our common stock as determined by our Board of directors. No more than the number of shares of common stock equal to the plan share reserve may be issued in the aggregate pursuant to the exercise of incentive stock options. The maximum number of shares of common stock granted during a single fiscal year to any non-employee director, taken together with any cash fees paid to such non-employee director during the fiscal year, may not exceed $1,000,000 in total value. Except for substitute awards (as described below), in the event any award expires or is cancelled, forfeited or terminated without issuance to the participant of the full number of shares of common stock to which the award related, the unissued shares of common stock underlying such award will be returned to the plan share reserve and may be granted again under the Omnibus Incentive Plan. Shares of common stock withheld in payment of an option exercise price or taxes relating to an award, and shares equal to the number of shares of common stock surrendered in payment of any option exercise price, a stock appreciation right’s base price, or taxes relating to an award will constitute shares of common stock issued to a participant and will thus reduce the plan share reserve and will not be returned to the plan share reserve. Awards may, in the sole discretion of the Compensation Committee, be granted in assumption of, or in substitution for, outstanding
119
Table of Contents
awards previously granted by an entity directly or indirectly acquired by the Company or with which we combine (referred to as “substitute awards”), and such substitute awards will not be counted against the plan share reserve, except that substitute awards intended to qualify as “incentive stock options” will count against the limit on incentive stock options described above. No award may be granted under the Omnibus Incentive Plan after the tenth anniversary of the effective date (as defined therein), but awards granted before then may extend beyond that date.
Grants. All awards granted under the Omnibus Incentive Plan will vest and become exercisable in such manner and on such date or dates or upon such event or events as determined by the Compensation Committee, including, without limitation, satisfaction of Performance Conditions, if any. For purposes of this prospectus, “Performance Conditions” means specific levels of performance of the Company (and/or one or more of its subsidiaries, divisions or operational and/or business units, product lines, brands, business segments, administrative departments, or any combination of the foregoing), which may be determined in accordance with GAAP or on a non-GAAP basis on, without limitation, the following measures: (i) net earnings, net income (before or after taxes), or consolidated net income; (ii) basic or diluted earnings per share (before or after taxes); (iii) net revenue or net revenue growth; (iv) gross revenue or gross revenue growth, gross profit or gross profit growth; (v) net operating profit (before or after taxes); (vi) return measures (including, but not limited to, return on investment, assets, capital, employed capital, invested capital, equity, or sales); (vii) cash flow measures (including, but not limited to, operating cash flow, free cash flow, or cash flow return on capital), which may be but are not required to be measured on a per share basis; (viii) actual or adjusted earnings before or after interest, taxes, depreciation, and/or amortization (including EBIT and EBITDA); (ix) gross or net operating margins; (x) productivity ratios; (xi) share price (including, but not limited to, growth measures and total stockholder return); (xii) expense targets or cost reduction goals, general and administrative expense savings; (xiii) operating efficiency; (xiv) objective measures of customer/client satisfaction; (xv) working capital targets; (xvi) measures of economic value added or other ‘value creation’ metrics; (xvii) enterprise value; (xviii) sales; (xix) stockholder return; (xx) customer/client retention; (xxi) competitive market metrics; (xxii) employee retention; (xxiii) objective measures of personal targets, goals, or completion of projects (including, but not limited to, succession and hiring projects, completion of specific acquisitions, dispositions, reorganizations, or other corporate transactions or capital-raising transactions, expansions of specific business operations, and meeting divisional or project budgets); (xxiv) comparisons of continuing operations to other operations; (xxv) market share; (xxvi) cost of capital, debt leverage, year-end cash position or book value; (xxvii) strategic objectives; (xxviii) gross or net authorizations; (xxix) backlog; or (xxx) any combination of the foregoing. Any one or more of the aforementioned Performance Conditions may be stated as a percentage of another Performance Condition, or used on an absolute or relative basis to measure the performance of one or more of the Company or its subsidiaries as a whole or any divisions or operational and/or business units, product lines, brands, business segments, or administrative departments of the Company and/or one or more of its subsidiaries or any combination thereof, as the Compensation Committee may deem appropriate, or any of the above performance criteria may be compared to the performance of a selected group of comparison companies, or a published or special index that the Compensation Committee, in its sole discretion, deems appropriate, or as compared to various stock market indices.
Options. The Compensation Committee may grant non-qualified stock options and incentive stock options under the Omnibus Incentive Plan, with terms and conditions determined by the Compensation Committee that are not inconsistent with the Omnibus Incentive Plan. All stock options granted under the Omnibus Incentive Plan are required to have a per share exercise price that is not less than 100% of the fair market value of our common stock underlying such stock options on the date such stock options are granted (other than in the case of options that are substitute awards). All stock options that are intended to qualify as incentive stock options must be granted pursuant to an award agreement expressly stating that the options are intended to qualify as incentive stock options and will be subject to the terms and conditions that comply with the rules as may be prescribed by Section 422 of the Code. The maximum term for stock options granted under the Omnibus Incentive Plan will be ten years from the initial date of grant, or with respect to any stock options intended to qualify as incentive stock options, such shorter period as prescribed by Section 422 of the Code. However, if a non-qualified stock option
120
Table of Contents
would expire at a time when trading of shares of our common stock is prohibited by our insider trading policy (or “blackout period” imposed by the Company), the term will automatically be extended to the 30th day following the end of such period. The purchase price for the shares of common stock as to which a stock option is exercised may be paid to the Company, to the extent permitted by law, (i) in cash or its equivalent at the time the stock option is exercised; (ii) in shares of common stock having a fair market value equal to the aggregate exercise price for the shares of common stock being purchased and satisfying any requirements that may be imposed by the Compensation Committee (so long as such shares have been held by the participant for at least six months or such other period established by the Compensation Committee to avoid adverse accounting treatment); or (iii) by such other method as the Compensation Committee may permit in its sole discretion, including, without limitation, (A) in other property having a fair market value on the date of exercise equal to the purchase price, (B) if there is a public market for the shares of our common stock at such time, through the delivery of irrevocable instructions to a broker to sell the shares of common stock being acquired upon the exercise of the stock option and to deliver to the Company the amount of the proceeds of such sale equal to the aggregate exercise price for the shares of common stock being purchased or (C) through a “net exercise” procedure effected by withholding the minimum number of shares of common stock needed to pay the exercise price or any applicable taxes that are statutorily required to be withheld, or both. Any fractional shares of common stock will be settled in cash. Options will become vested and exercisable in such manner and on such date(s) or event(s) as determined by the Compensation Committee, including, without limitation, satisfaction of Performance Conditions, provided that the Compensation Committee may, in its sole discretion, accelerate the vesting of any options at any time for any reason.
Unless otherwise provided by the Compensation Committee (whether in an award agreement or otherwise), in the event of (i) a participant’s termination of service for cause, all outstanding options will immediately terminate and expire, (ii) a participant’s termination of service due to death or disability, each outstanding unvested option will immediately terminate and expire, and vested options will remain exercisable for one year following termination of service (or, if earlier, through the last day of the tenth year from the initial date of grant), and (iii) a participant’s termination for any other reason, outstanding unvested options will terminate and expire and vested options remain exercisable for 90 days following termination (or, if earlier, through the last day of the tenth year from the initial date of grant).
Restricted Shares and Restricted Stock Units. The Compensation Committee may grant restricted shares of our common stock or restricted stock units, representing the right to receive, upon vesting and the expiration of any applicable restricted period, one share of common stock for each restricted stock unit, or, in the sole discretion of the Compensation Committee, the cash value thereof (or any combination thereof). As to restricted shares of our common stock, subject to the other provisions of the Omnibus Incentive Plan, the holder will generally have the rights and privileges of a stockholder as to such restricted shares of common stock, including, without limitation, the right to vote such restricted shares of common stock. Participants generally have no rights or privileges as a stockholder with respect to restricted stock units. Restricted shares of our common stock and restricted stock units will become vested in such manner and on such date(s) or event(s) as determined by the Compensation Committee, including, without limitation, satisfaction of Performance Conditions, provided that the Compensation Committee may, in its sole discretion, accelerate the vesting of any restricted shares of our common stock or restricted stock units at any time for any reason. Unless otherwise provided by the Compensation Committee, whether in an award agreement or otherwise, in the event of a participant’s termination for any reason prior to vesting of any restricted shares or restricted stock units, as applicable (i) all vesting with respect to the participant’s restricted shares or restricted stock units, as applicable, will cease and (ii) unvested restricted shares and unvested restricted stock units will be forfeited for no consideration on the date of termination.
Other Equity-Based Awards and Cash-Based Awards. The Compensation Committee may grant other equity-based or cash-based awards under the Omnibus Incentive Plan, with terms and conditions, including, without limitation, satisfaction of Performance Conditions, determined by the Compensation Committee that are not inconsistent with the Omnibus Incentive Plan.
121
Table of Contents
Effect of Certain Events on Omnibus Incentive Plan and Awards. Other than with respect to cash-based awards, in the event of (i) any dividend (other than regular cash dividends) or other distribution (whether in the form of cash, shares of common stock, other securities or other property), recapitalization, stock split, reverse stock split, reorganization, merger, consolidation, split-up, split-off, spin-off, combination, repurchase or exchange of shares of common stock or other securities, issuance of warrants or other rights to acquire shares of common stock or other securities, or other similar corporate transaction or event that affects the shares of common stock (including a change in control, as defined in the Omnibus Incentive Plan), or (ii) unusual or nonrecurring events affecting the Company, including changes in applicable rules, rulings, regulations or other requirements, that the Compensation Committee determines, in its sole discretion, could result in substantial dilution or enlargement of the rights intended to be granted to, or available for, participants (any event in (i) or (ii), an “Adjustment Event”), the Compensation Committee will, in respect of any such Adjustment Event, make such proportionate substitution or adjustment, if any, as it deems equitable, to any or all of: (A) the plan share reserve, or any other limit applicable under the Omnibus Incentive Plan with respect to the number of awards which may be granted thereunder, (B) the number of shares of common stock or other securities of the Company (or number and kind of other securities or other property) which may be issued in respect of awards or with respect to which awards may be granted under the Omnibus Incentive Plan or any sub-plan and (C) the terms of any outstanding award, including, without limitation, (x) the number of shares of common stock or other securities of the Company (or number and kind of other securities or other property) subject to outstanding awards or to which outstanding awards relate, (y) the exercise price or strike price with respect to any award, or (z) any applicable performance measures; it being understood that, in the case of any “equity restructuring,” the Compensation Committee will make an equitable or proportionate adjustment to outstanding awards to reflect such equity restructuring.
In connection with any change in control, the Compensation Committee may, in its sole discretion, provide for any one or more of the following: (i) a substitution or assumption of, acceleration of the vesting of, the exercisability of, or lapse of restrictions on, any one or more outstanding awards and (ii) cancellation of any one or more outstanding awards and payment to the holders of such awards that are vested as of such cancellation (including any awards that would vest as a result of the occurrence of such event but for such cancellation) the value of such awards, if any, as determined by the Compensation Committee (which value, if applicable, may be based upon the price per share of common stock received or to be received by other holders of our common stock in such event), including, in the case of stock options and stock appreciation rights, a cash payment equal to the excess, if any, of the fair market value of the shares of common stock subject to the option or stock appreciation right over the aggregate exercise price or base price thereof.
Nontransferability of Awards. Each award under the Omnibus Incentive Plan will not be transferable or assignable by a participant other than by will or by the laws of descent and distribution and any such purported assignment, alienation, pledge, attachment, sale, transfer or encumbrance will be void and unenforceable against the Company or any of our subsidiaries. However, the Compensation Committee may, in its sole discretion, permit awards (other than incentive stock options) to be transferred, including transfers to a participant’s family members, any trust established solely for the benefit of a participant or such participant’s family members, any partnership or limited liability company of which a participant, or such participant and such participant’s family members, are the sole member(s), and a beneficiary to whom donations are eligible to be treated as “charitable contributions” for tax purposes.
Amendment and Termination. Our board of directors may amend, alter, suspend, discontinue, or terminate the Omnibus Incentive Plan or any portion thereof at any time; but no such amendment, alteration, suspension, discontinuance or termination may be made without stockholder approval if (i) such approval is required under applicable law; (ii) it would materially increase the number of securities which may be issued under the Omnibus Incentive Plan (except for adjustments in connection with certain corporate events); or (iii) it would materially modify the requirements for participation in the Omnibus Incentive Plan; and any such amendment, alteration, suspension, discontinuance or termination that would materially and adversely affect the rights of any participant or any holder or beneficiary of any award will not to that extent be effective without such individual’s consent.
122
Table of Contents
The Compensation Committee may, to the extent consistent with the terms of any applicable award agreement, waive any conditions or rights under, amend any terms of, or alter, suspend, discontinue, cancel or terminate, any award granted or the associated award agreement, prospectively or retroactively (including after a participant’s termination). However, except as otherwise permitted in the Omnibus Incentive Plan, any such waiver, amendment, alteration, suspension, discontinuance, cancellation or termination that would materially and adversely affect the rights of any participant with respect to such award will not to that extent be effective without such individual’s consent. In addition, without stockholder approval, except as otherwise permitted in the Omnibus Incentive Plan, (i) no amendment or modification may reduce the exercise price of any option or the strike price of any stock appreciation right; (ii) the Compensation Committee may not cancel any outstanding option or stock appreciation right and replace it with a new option or stock appreciation right (with a lower exercise price or strike price, as the case may be) or other award or cash payment that is greater than the value of the cancelled option or stock appreciation right; and (iii) the Compensation Committee may not take any other action which is considered a “repricing” for purposes of the stockholder approval rules of any securities exchange or inter-dealer quotation system on which our securities are listed or quoted.
Dividends and Dividend Equivalents. The Compensation Committee in its sole discretion may provide that any award under the Omnibus Incentive Plan includes dividends or dividend equivalents, on such terms and conditions as may be determined by the Compensation Committee in its sole discretion. Unless otherwise provided in the award agreement, any dividend payable in respect of any share of restricted stock that remains subject to vesting conditions at the time of payment of such dividend will be retained by the Company and remain subject to the same vesting conditions as the share of restricted stock to which the dividend relates. To the extent provided in an award agreement, the holder of outstanding restricted stock units will be entitled to be credited with dividend equivalents either in cash, or in the sole discretion of the Compensation Committee, in shares of common stock having a fair market value equal to the amount of the dividends (and interest may be credited, at the discretion of the Compensation Committee, on the amount of cash dividend equivalents, at a rate and subject to terms determined by the Compensation Committee), which accumulated dividend equivalents (and any interest) will be payable at the same time as the underlying restricted stock units are settled following the lapse of restrictions (and with any accumulated dividend equivalents forfeited if the underlying restricted stock units are forfeited).
Clawback/Repayment. All awards are subject to reduction, cancellation, forfeiture or recoupment to the extent necessary to comply with (i) any clawback, forfeiture or other similar policy adopted by our board of directors or the Compensation Committee and as in effect from time to time and (ii) applicable law. Unless otherwise determined by the Compensation Committee, to the extent that a participant receives any amount in excess of the amount that the participant should otherwise have received under the terms of the award for any reason (including, without limitation, by reason of a financial restatement, mistake in calculations or other administrative error), the participant will be required to repay any such excess amount to the Company. If a participant engages in any detrimental activity (as described below), as determined by the Compensation Committee, the Compensation Committee may, in its sole discretion, provide for one or more of the following: (i) cancellation of any or all of a participant’s outstanding awards or (ii) forfeiture by the participant of any gain realized on the vesting or exercise of awards, and repayment of any such gain promptly to the Company. For purposes of the Omnibus Incentive Plan and awards thereunder, “detrimental activity” means: any unauthorized disclosure of confidential or proprietary information of the Company or its subsidiaries; any activity that would be grounds to terminate the participant’s employment or service for cause; the participant’s breach of any restrictive covenant (including, but not limited, to any non-competition or non-solicitation covenants); or fraud or conduct contributing to any financial restatements or irregularities, as determined by the Compensation Committee in its discretion.
123
Table of Contents
Director Compensation
Employee directors and directors who are employed by our Sponsor receive no additional compensation for serving on our board of directors. However, all directors are reimbursed for their reasonable out-of-pocket expenses related to their service as a member of our board of directors. Accordingly, none of our directors, other than Messrs. Brett and McDonald, received director compensation for fiscal year 2019.
The following table provides summary information concerning compensation paid or accrued by us to or on behalf of directors other than our Chief Executive Officer for services rendered to us during the last fiscal year:
| Name |
Fees Earned or Paid in Cash ($) |
Stock Awards ($) |
All Other Compensation ($) |
Total ($) |
||||||||||||
| James Brett |
37,500 | — | (1) | — | 37,500 | |||||||||||
| Ashwin Cadambi |
— | — | — | — | ||||||||||||
| Marsden S. Cason(2) |
— | — | 600,000 | 600,000 | ||||||||||||
| Calvin McDonald |
75,000 | — | — | 75,000 | ||||||||||||
| Alex Pellegrini |
— | — | — | — | ||||||||||||
| E. Lee Wyatt, Jr. |
— | — | — | — | ||||||||||||
| (1) | Mr. Brett was the only director who received Class B Units in fiscal year 2019. The Class B Units are subject to market conditions and an implied performance condition as defined under applicable accounting standards. The amount reported represents the aggregate grant-date fair value of the Class B Units awarded to Mr. Brett in fiscal year 2019, calculated in accordance with Topic 718, utilizing the assumptions discussed in Note 13 to our audited consolidated financial statements included elsewhere in this prospectus, computed based on the probable outcome of the performance conditions as of the grant date. Achievement of the performance conditions for the Class B Units granted in fiscal year 2019 was not deemed probable on the grant date and, accordingly, no value is included in the table for this award pursuant to the SEC’s disclosure rules. Assuming achievement of the performance conditions, the grant date fair value of the Class B Units that were granted to Mr. Brett was $390,161. As of June 1, 2019, Messrs. Brett and McDonald each held 10,975 unvested Class B Units. |
| (2) | Mr. Cason also serves as our Executive Vice Chairman. The amount reported represents Mr. Cason’s compensation as Executive Vice Chairman and not as a director, and for fiscal year 2019 consists of his base salary of $300,000 and a non-equity incentive award payment under the AIP of $300,000. Mr. Cason does not receive additional compensation for serving on our board of directors. |
Description of Director Compensation
With respect to fiscal year 2019, each of our non-employee directors (other than the directors employed by our Sponsor) was entitled to receive an annual cash retainer of $75,000, payable quarterly, which was pro-rated for Mr. Brett for the portion of fiscal year 2019 during which he served as a director.
In connection with each of Messrs. Brett’s and McDonald’s appointment to our board of directors, each received a grant of 10,975 Class B Units. For a description of the vesting terms of, and repurchase provisions related to, the Class B Units granted to our directors, see “—Executive Compensation—Narrative Disclosure to Summary Compensation Table—Equity Awards.” Class B Units granted to each of Messrs. Brett and McDonald become contingently vested in four equal installments on anniversaries of a specified vesting commencement date, subject, in each case, to continued service as a member of our board of directors.
Class B Units are subject to certain transfer restrictions set forth in the LPA. For a description of the restrictions and the lapse of such restrictions related to the Class B Units granted to our directors, see “—Executive Compensation—Narrative Disclosure to Summary Compensation Table—Equity Awards.”
124
Table of Contents
As a condition to receiving their Class B Units, each of our directors was required to enter into a Class B Unit award agreement and become a party to the LPA. Pursuant to the Class B Unit award agreements, our directors have agreed to specified restrictive covenants, including (i) a perpetual confidentiality covenant, (ii) covenants related to non-competition, non-solicitation of customers, employees, agents and representatives, and non-interference with business relationships, in each case, during service and for a period of 12 months thereafter and (iii) non-disparagement during service and for three years thereafter.
In connection with this offering, we expect to convert all of the Class B Units held by our directors into, or otherwise redeem Class B Units for, shares of our common stock. The number of shares received in this conversion or redemption will be determined in a manner intended to replicate the respective economic value associated with the corresponding Class B Units converted or redeemed based on the valuation derived from the initial public offering price.
Director compensation will be reviewed in connection with this offering and changes will be made as appropriate for a public company.
Mr. Wyatt’s Offer Letter
In connection with Mr. Wyatt’s appointment to serve on our board of directors and as Chair of the Audit Committee, in each case, effective as of January 27, 2020, the Company entered into an offer letter with Mr. Wyatt on January 9, 2020, which we refer to as the Wyatt offer letter. Pursuant to the Wyatt offer letter, Mr. Wyatt is entitled to receive an annual cash retainer of $75,000 for his service on our board of directors and an additional annual cash retainer of $25,000 for his service as Chair of the Audit Committee. These annual cash retainers are, in each case, payable quarterly, with the first payment for each such retainer prorated for the period between the effective date of Mr. Wyatt’s appointment to our board of directors through March 31, 2020.
The Wyatt offer letter also provides that Mr. Wyatt is entitled to receive an annual equity award of restricted stock units under our Omnibus Incentive Plan with the following grant date values: (i) for 2020, $325,000, to be awarded upon or promptly following completion of this offering; (ii) for 2021, $125,000 to $225,000, depending on the time commitment required during that year; and (iii) for 2022, $125,000.
125
Table of Contents
CERTAIN RELATIONSHIPS AND RELATED PARTY TRANSACTIONS
Stockholders Agreement
In connection with this offering, we intend to enter into a stockholders agreement with our Sponsor and management and director stockholders. This agreement will grant our Sponsor the right to nominate to our board of directors a number of directors proportionate to the percentage of the issued and outstanding common stock owned by our Sponsor and its affiliates and certain transferees so long as our Sponsor and its affiliates and certain of their transferees own at least 5% of our outstanding common stock. For purposes of calculating the number of directors that our Sponsor is entitled to nominate, any fractional amounts would be rounded up to the nearest whole number and the calculation would be made on a pro forma basis, taking into account any increase in the size of our board of directors. In addition, in the event a vacancy on the board of directors is created by the death, disability, retirement or resignation of a Sponsor director designee, our Sponsor, its affiliates and certain transferees who designated such director shall, to the fullest extent permitted by law, have the right to have the vacancy filled by a new Sponsor director-designee.
In addition, the stockholders agreement will grant to our Sponsor and its affiliates and certain of their transferees certain governance rights for as long as our Sponsor and its affiliates and certain of their transferees maintain ownership of at least 25% of our outstanding common stock, including rights of approval over certain corporate and other transactions and the appointment of our chief executive officer.
In the stockholders agreement, we will grant our Sponsor the right to cause us, at our expense, to file registration statements under the Securities Act covering resales of our common stock held by our Sponsor and other stockholders party to that agreement. Under the stockholders agreement, all holders of registrable securities party thereto (including our executive officers and directors) will also be provided with customary “piggyback” registration rights following an initial public offering, with certain exceptions. These shares will represent approximately % of our outstanding common stock after this offering, or % if the underwriters exercise in full their option to purchase additional shares.
The stockholders agreement will also require us to indemnify certain of our stockholders and their affiliates in connection with any registrations of our securities.
The stockholders agreement will impose significant restrictions on transfers of shares of our common stock held by stockholders who are our management or directors immediately prior to the closing of this offering. Generally, shares will be nontransferable by any means, except (i) certain transfers to a management or director stockholder’s estate or trust, (ii) transfers approved by our board of directors, (iii) transfers to us or our designee, (iv) transfers in amounts not to exceed the applicable “catch-up amount” to be determined based on sales of common stock in public offering(s) by our Sponsor during certain periods after this offering and (v) in the case of stockholders who are executive officers or directors, sales pursuant to the proper exercise of piggyback registration rights. Starting at the two-year anniversary of the expiration of the 180-day lock-up period for this offering, such transfer restrictions with respect to common stock held by management stockholders who are not executive officers or directors will lapse in increments over time, with a full release of such transfer restrictions occurring on the four-year anniversary of the expiration of the lock-up period for this offering.
Agreements with Officers
In addition, we have certain agreement with our officers which are described in the section entitled “Management—Executive Compensation.”
Other Related Party Transactions
Our Sponsor and its affiliates have ownership interests in a broad range of companies. We have entered and may enter into commercial transactions in the ordinary course of our business with some of these companies,
126
Table of Contents
which include certain of our suppliers such as Aptos Canada, Inc. Purchases from these suppliers were arms-length transactions and totaled $1.4 million, $1.3 million, $0.4 million and $0.6 million in the years ended June 2, 2018 and June 1, 2019 and the 26-week periods ended December 1, 2018 and November 30, 2019, respectively. As of each of June 2, 2018, June 1, 2019 and November 30, 2019, the outstanding amount payable to related party suppliers was $0.1 million.
Statement of Policy Regarding Transactions with Related Persons
Our board of directors recognizes the fact that transactions with related persons present a heightened risk of conflicts of interests and/or improper valuation (or the perception thereof). Prior to the completion of this offering, our board of directors will adopt a written statement of policy regarding transactions with related persons, which we refer to as our “related person policy,” that is in conformity with the requirements upon issuers having publicly held common stock that is listed on NASDAQ.
Our related person policy will require that a “related person” (as defined as in paragraph (a) of Item 404 of Regulation S-K) must promptly disclose to our General Counsel, or such other person designated by our board of directors, any “related person transaction” (defined as any transaction that we anticipate would be reportable by us under Item 404(a) of Regulation S-K in which we were or are to be a participant and the amount involved exceeds $120,000 and in which any related person had or will have a direct or indirect material interest) and all material facts with respect thereto. The General Counsel, or such other person, will then promptly communicate that information to our board of directors. No related person transaction entered into following this offering will be executed without the approval or ratification of our board of directors or a duly authorized committee of our board of directors. It is our policy that directors interested in a related person transaction will recuse themselves from any vote on a related person transaction in which they have an interest.
127
Table of Contents
PRINCIPAL AND SELLING STOCKHOLDERS
Our Sponsor currently holds its equity interests in the Company indirectly through its ownership of partnership interests of Calceus TopCo, L.P., which owns all of the equity interests of the Company. In connection with this offering, we expect that Calceus TopCo, L.P. will distribute the shares it holds in the Company to its equityholders, including our Sponsor and certain of our directors and officers.
The following table contains information about the beneficial ownership of our common stock as of , 2020, (1) immediately prior to the consummation of this offering and (2) as adjusted to give effect to the filing and effectiveness of our amended and restated certificate of incorporation and the adoption of our amended and restated bylaws immediately prior to the consummation of this offering, with respect to the following:
| • | selling stockholders; |
| • | each individual or entity known by us to beneficially own more than 5% of our outstanding common stock; |
| • | each named executive officer; |
| • | each of our directors; and |
| • | all of our directors and executive officers as a group. |
Our calculation of the percentage of beneficial ownership prior to and after the offering is based on shares of common stock outstanding as of , 2020.
Beneficial ownership and percentage ownership are determined in accordance with the rules and regulations of the SEC. Under SEC rules, a person is deemed to be a “beneficial owner” of a security if that person has or shares voting power or investment power, which includes the power to dispose of or to direct the disposition of such security. A person is also deemed to be a beneficial owner of any securities of which that person has a right to acquire beneficial ownership within 60 days. Securities that can be so acquired are deemed to be outstanding for purposes of computing such person’s ownership percentage, but not for purposes of computing any other person’s percentage. Under these rules, more than one person may be deemed to be a beneficial owner of the same securities and a person may be deemed to be a beneficial owner of securities as to which such person has no economic interest. Except as indicated in the footnotes to the following table or pursuant to applicable community property laws, we believe, based on information furnished to us, that each stockholder named in the table has sole voting and investment power with respect to the shares set forth opposite such stockholder’s name.
For further information regarding material transactions between us and certain of our stockholders, see “Certain Relationships and Related Party Transactions.”
128
Table of Contents
Unless otherwise indicated in the footnotes, the address of each of the individuals named below is: c/o Cole Haan, Inc., 150 Ocean Road, Greenland, New Hampshire 03840.
|
Name of Beneficial Owner |
Shares beneficially owned prior to the offering |
Shares to be sold in the offering | Shares beneficially owned after the offering |
|||||||||||||||||||||||||||||
| Excluding exercise of the underwriters’ option to purchase additional shares |
Including exercise of the underwriters’ option to purchase additional shares |
Excluding exercise of the underwriters’ option to purchase additional shares |
Including exercise of the underwriters’ option to purchase additional shares |
|||||||||||||||||||||||||||||
| Number | Percent | Number | Number | Number | Percent | Number | Percent | |||||||||||||||||||||||||
| Selling Stockholders: |
||||||||||||||||||||||||||||||||
| Cole Haan Holdings LP(1) |
% | % | % | |||||||||||||||||||||||||||||
| Named Executive Officers and Directors: |
||||||||||||||||||||||||||||||||
| Jack A. Boys |
% | % | % | |||||||||||||||||||||||||||||
| Thomas J. Linko |
% | % | % | |||||||||||||||||||||||||||||
| Laura W. Kelley |
% | % | % | |||||||||||||||||||||||||||||
| James Brett |
% | % | % | |||||||||||||||||||||||||||||
| Ashwin Cadambi |
% | % | % | |||||||||||||||||||||||||||||
| Marsden S. Cason |
% | % | % | |||||||||||||||||||||||||||||
| Calvin McDonald |
% | % | % | |||||||||||||||||||||||||||||
| Alex Pellegrini |
% | % | % | |||||||||||||||||||||||||||||
| E. Lee Wyatt, Jr. |
% | % | % | |||||||||||||||||||||||||||||
| All executive officers and directors as a group (eight persons) |
% | % | % | |||||||||||||||||||||||||||||
| * | Less than 1% |
| (1) | Represents shares of common stock held by Cole Haan Holdings LP. Cole Haan Holdings LP is beneficially owned by Apax VIII-A, L.P., Apax VIII-B, L.P., Apax VIII-1, L.P., Apax VIII-2, L.P., Apax VIII – AIV A, L.P., Apax VIII – AIV B, L.P. and RBW Investment GmbH & Co. KG, or RBW. Apax VIII-A, L.P., Apax VIII-B, L.P., Apax VIII-1, L.P., Apax VIII-2, L.P., Apax VIII – AIV A, L.P. and Apax VIII – AIV B, L.P. are collectively referred to as Apax VIII. Apax VIII GP L.P., Inc. is the general partner of each of Apax VIII, and Apax VIII GP Co. Limited is the general partner of Apax VIII GP L.P., Inc. The directors of Apax VIII GP Co. Limited are Simon Cresswell, Andrew Guille, Martin Halusa, Nicholas Kershaw, Trina LE Noury and David Staples, who have shared voting and dispositive power with respect to shares held by Apax VIII. RBW Investment (GP) Vermogensverwaltung GmbH is the general partner of RBW and its directors are Mark Babbe, George Friedrich Bauer and Gordon Purvis, who have shared voting and dispositive power with respect to the shares held by RBW. The registered address of Apax VIII GP L.P., Inc., Apax VIII GP Co. Limited and Apax VIII is Third Floor Royal Bank Place, 1 Glategny Esplanade, St Peter Port, Guernsey GY1 2HJ . The registered address of RBW and RBW Investment (GP) Vermogensverwaltung GmbH is SOCIO Verwaltungsgesellschaft GmbH, Farbergraben 18, 80331, Munich, Germany. |
129
Table of Contents
The following is a description of the material terms of, and is qualified in its entirety by, our amended and restated certificate of incorporation and amended and restated bylaws, each of which will be in effect upon the consummation of this offering, the forms of which are filed as exhibits to the registration statement of which this prospectus is a part.
Our purpose is to engage in any lawful act or activity for which corporations may now or hereafter be organized under the DGCL. Upon the consummation of this offering, our authorized capital stock will consist of shares of common stock, par value $0.01 per share, and shares of preferred stock, par value $0.01 per share. No shares of preferred stock will be issued or outstanding immediately after the offering contemplated by this prospectus. Unless our board of directors determines otherwise, we will issue all shares of our capital stock in uncertificated form.
Common Stock
Holders of our common stock are entitled to one vote for each share held of record on all matters on which stockholders are entitled to vote generally, including the election or removal of directors, subject to certain limitations. The holders of our common stock do not have cumulative voting rights in the election of directors. Upon our liquidation, dissolution or winding up or the sale of all or substantially all of our assets and after payment in full of all amounts required to be paid to creditors and to the holders of preferred stock having liquidation preferences, if any, the holders of our common stock will be entitled to receive our remaining assets available for distribution on a pro rata basis. Holders of our common stock do not have preemptive, subscription, redemption or conversion rights. The common stock will not be subject to further calls or assessment by us. There will be no redemption or sinking fund provisions applicable to the common stock. All shares of our common stock that will be outstanding at the time of the completion of the offering will be fully paid and non-assessable. The rights, powers, preferences and privileges of holders of our common stock will be subject to those of the holders of any shares of our preferred stock we may authorize and issue in the future.
Preferred Stock
Our amended and restated certificate of incorporation will authorize our board of directors to establish one or more series of preferred stock (including convertible preferred stock). Unless required by law or by NASDAQ, the authorized shares of preferred stock will be available for issuance without further action by you. Our board of directors will be able to determine, with respect to any series of preferred stock, the terms and rights of that series, including:
| • | the designation of the series; |
| • | the number of shares of the series, which our board of directors may, except where otherwise provided in the preferred stock designation, increase (but not above the total number of authorized shares of the class) or decrease (but not below the number of shares then outstanding); |
| • | whether dividends, if any, will be cumulative or non-cumulative and the dividend rate of the series; |
| • | the dates at which dividends, if any, will be payable; |
| • | the redemption rights and price or prices, if any, for shares of the series; |
| • | the terms and amounts of any sinking fund provided for the purchase or redemption of shares of the series; |
| • | the amounts payable on shares of the series in the event of any voluntary or involuntary liquidation, dissolution or winding-up of the affairs of the Company; |
| • | whether the shares of the series will be convertible into shares of any other class or series, or any other security, of the Company or any other corporation and, if so, the specification of the other class or |
130
Table of Contents
| series or other security, the conversion price or prices or rate or rates, any rate adjustments, the date or dates as of which the shares will be convertible and all other terms and conditions upon which the conversion may be made; |
| • | restrictions on the issuance of shares of the same series or of any other class or series; and |
| • | the voting rights, if any, of the holders of the series. |
We will be able to issue a series of preferred stock that could, depending on the terms of the series, impede or discourage an acquisition attempt or other transaction that some, or a majority, of the holders of our common stock might believe to be in their best interests or in which the holders of our common stock might receive a premium for their common stock over the market price of the common stock. In addition, the issuance of preferred stock may adversely affect the holders of our common stock by restricting dividends on the common stock, diluting the voting power of the common stock or subordinating the liquidation rights of the common stock. As a result of these or other factors, the issuance of preferred stock may have an adverse impact on the market price of our common stock.
Dividends
The DGCL permits a corporation to declare and pay dividends out of “surplus” or, if there is no “surplus,” out of its net profits for the fiscal year in which the dividend is declared and/or the preceding fiscal year. “Surplus” is defined as the excess of the net assets of the corporation over the amount determined to be the capital of the corporation by the board of directors. The capital of the corporation is typically calculated to be (and cannot be less than) the aggregate par value of all issued shares of capital stock. Net assets equal the fair value of the total assets minus total liabilities. The DGCL also provides that dividends may not be paid out of net profits if, after the payment of the dividend, capital is less than the capital represented by the outstanding stock of all classes having a preference upon the distribution of assets.
Declaration and payment of any dividend will be subject to the discretion of our board of directors. The time and amount of dividends will be dependent upon our financial condition, operations, cash requirements and availability, debt repayment obligations, capital expenditure needs and restrictions in our debt instruments, industry trends, the provisions of Delaware law affecting the payment of dividends to stockholders and any other factors our board of directors may consider relevant.
Anti-Takeover Effects of Our Amended and Restated Certificate of Incorporation and Amended and Restated Bylaws and Certain Provisions of Delaware Law
Our amended and restated certificate of incorporation, amended and restated bylaws and the DGCL, which are summarized in the following paragraphs, contain provisions that are intended to enhance the likelihood of continuity and stability in the composition of our board of directors. These provisions are intended to avoid costly takeover battles, reduce our vulnerability to a hostile change of control and enhance the ability of our board of directors to maximize stockholder value in connection with any unsolicited offer to acquire us. However, these provisions may have an anti-takeover effect and may delay, deter or prevent a merger or acquisition of the Company by means of a tender offer, a proxy contest or other takeover attempt that a stockholder might consider is in its best interest, including those attempts that might result in a premium over the prevailing market price for the shares of common stock held by stockholders.
Authorized but Unissued Capital Stock
Delaware law does not require stockholder approval for any issuance of authorized shares. However, the listing requirements of NASDAQ, which would apply if and so long as our common stock remains listed on NASDAQ, require stockholder approval of certain issuances equal to or exceeding 20% of the then-outstanding voting power or then-outstanding number of shares of common stock. These additional shares may be used for a variety of corporate purposes, including future public offerings to raise additional capital or to facilitate acquisitions.
131
Table of Contents
Our board of directors may issue shares of preferred stock on terms calculated to discourage, delay or prevent a change of control of the Company or the removal of our management. Moreover, our authorized but unissued shares of preferred stock will be available for future issuances without stockholder approval and could be utilized for a variety of corporate purposes, including future offerings to raise additional capital, acquisitions or employee benefit plans.
One of the effects of the existence of unissued and unreserved common stock or preferred stock may be to enable our board of directors to issue shares to persons friendly to current management, which issuance could render more difficult or discourage an attempt to obtain control of the Company by means of a merger, tender offer, proxy contest or otherwise, and thereby protect the continuity of our management and possibly deprive our stockholders of opportunities to sell their shares of common stock at prices higher than prevailing market prices.
Classified Board of Directors
Our amended and restated certificate of incorporation will provide that our board of directors will be divided into three classes of directors, with the classes to be as nearly equal in number as possible, and with the directors serving three-year terms. As a result, approximately one-third of our board of directors will be elected each year. The classification of directors will have the effect of making it more difficult for stockholders to change the composition of our board of directors. Our amended and restated certificate of incorporation and amended and restated bylaws will provide that, subject to any rights of holders of preferred stock to elect additional directors under specified circumstances, the number of directors will be fixed from time to time exclusively pursuant to a resolution adopted by the board of directors.
Business Combinations
We have opted out of Section 203 of the DGCL; however, our amended and restated certificate of incorporation will contain similar provisions providing that we may not engage in certain “business combinations” with any “interested stockholder” for a three-year period following the time that the stockholder became an interested stockholder, unless:
| • | prior to such time, our board of directors approved either the business combination or the transaction which resulted in the stockholder becoming an interested stockholder; |
| • | upon consummation of the transaction that resulted in the stockholder becoming an interested stockholder, the interested stockholder owned at least 85% of our voting stock outstanding at the time the transaction commenced, excluding certain shares; or |
| • | at or subsequent to that time, the business combination is approved by our board of directors and by the affirmative vote of holders of at least 662/3% of the outstanding voting stock that is not owned by the interested stockholder. |
Generally, a “business combination” includes a merger, asset or stock sale or other transaction resulting in a financial benefit to the interested stockholder. Subject to certain exceptions, an “interested stockholder” is a person who, together with that person’s affiliates and associates, owns, or within the previous three years owned, 15% or more of our voting stock. For purposes of this section only, “voting stock” has the meaning given to it in Section 203 of the DGCL.
Under certain circumstances, this provision will make it more difficult for a person who would be an “interested stockholder” to effect various business combinations with a corporation for a three-year period. This provision may encourage companies interested in acquiring the Company to negotiate in advance with our board of directors because the stockholder approval requirement would be avoided if our board of directors approves either the business combination or the transaction which results in the stockholder becoming an interested stockholder. These provisions also may have the effect of preventing changes in our board of directors and may make it more difficult to accomplish transactions which stockholders may otherwise deem to be in their best interests.
132
Table of Contents
Our amended and restated certificate of incorporation will provide that our Sponsor and its affiliates and any of their respective direct or indirect transferees and any group as to which such persons are a party do not constitute “interested stockholders” for purposes of this provision.
Removal of Directors; Vacancies
Under the DGCL, unless otherwise provided in our amended and restated certificate of incorporation, directors serving on a classified board may be removed by the stockholders only for cause. Our amended and restated certificate of incorporation and amended and restated bylaws will provide that directors may be removed with or without cause upon the affirmative vote of a majority in voting power of all outstanding shares of stock entitled to vote generally in the election of directors, voting together as a single class; provided, however, at any time when our Sponsor and its affiliates beneficially own, in the aggregate, less than 40% of the voting power of all outstanding shares of stock entitled to vote generally in the election of directors, directors may only be removed for cause and only by the affirmative vote of holders of at least 662/3% in voting power of all the then-outstanding shares of stock entitled to vote generally in the election of directors, voting together as a single class. In addition, our amended and restated certificate of incorporation and our amended and restated bylaws will also provide that, subject to the rights granted to one or more series of preferred stock then outstanding or the rights granted to our Sponsor under the stockholders agreement to be entered into in connection with this offering, any vacancies on our board of directors will be filled only by the affirmative vote of a majority of the remaining directors, even if less than a quorum, by a sole remaining director or by the stockholders; provided, however, at any time when our Sponsor and its affiliates beneficially own, in the aggregate, less than 40% of the voting power of all outstanding shares of stock entitled to vote generally in the election of directors, any newly created directorship on the board of directors that results from an increase in the number of directors and any vacancy occurring on the board of directors may only be filled by a majority of the directors then in office, even if less than a quorum, or by a sole remaining director (and not by the stockholders).
No Cumulative Voting
Under Delaware law, the right to vote cumulatively does not exist unless the certificate of incorporation specifically authorizes cumulative voting. Our amended and restated certificate of incorporation will not authorize cumulative voting. Therefore, stockholders holding a majority in voting power of the shares of our stock entitled to vote generally in the election of directors will be able to elect all our directors.
Special Stockholder Meetings
Our amended and restated certificate of incorporation will provide that special meetings of our stockholders may be called at any time only by or at the direction of the board of directors or the chairman of the board of directors; provided, however, that our Sponsor and its affiliates are permitted to call special meetings of our stockholders for so long as they hold, in the aggregate, at least 40% of the voting power of all outstanding shares of stock entitled to vote generally in the election of directors. Our amended and restated bylaws will prohibit the conduct of any business at a special meeting other than as specified in the notice for such meeting. These provisions may have the effect of deferring, delaying or discouraging hostile takeovers, or changes in control or management of the Company.
Requirements for Advance Notification of Director Nominations and Stockholder Proposals
Our amended and restated bylaws will establish advance notice procedures with respect to stockholder proposals and the nomination of candidates for election as directors, other than nominations made by or at the direction of the board of directors or a committee of the board of directors. In order for any matter to be “properly brought” before a meeting, a stockholder will have to comply with advance notice requirements and provide us with certain information. Generally, to be timely, a stockholder’s notice must be received at our principal executive offices not less than 90 days nor more than 120 days prior to the first anniversary date of the
133
Table of Contents
immediately preceding annual meeting of stockholders. Our amended and restated bylaws will also specify requirements as to the form and content of a stockholder’s notice. Our amended and restated bylaws will allow the chairman of the meeting at a meeting of the stockholders to adopt rules and regulations for the conduct of meetings which may have the effect of precluding the conduct of certain business at a meeting if the rules and regulations are not followed. These notice requirements will not apply to our Sponsor and its affiliates for as long as the stockholders agreement to be entered into in connection with this offering remains in effect. These provisions may defer, delay or discourage a potential acquiror from conducting a solicitation of proxies to elect the acquiror’s own slate of directors or otherwise attempting to influence or obtain control of the Company.
Stockholder Action by Written Consent
Pursuant to Section 228 of the DGCL, any action required to be taken at any annual or special meeting of the stockholders may be taken without a meeting, without prior notice and without a vote if a consent or consents in writing, setting forth the action so taken, is signed by the holders of outstanding stock having not less than the minimum number of votes that would be necessary to authorize or take such action at a meeting at which all shares of our stock entitled to vote thereon were present and voted, unless our amended and restated certificate of incorporation provides otherwise. Our amended and restated certificate of incorporation will preclude stockholder action by written consent once our Sponsor and its affiliates beneficially own, in the aggregate, less than 40% of the voting power of all outstanding shares of stock entitled to vote generally in the election of directors.
Supermajority Provisions
Our amended and restated certificate of incorporation and amended and restated bylaws will provide that the board of directors is expressly authorized to make, alter, amend, change, add to, rescind or repeal, in whole or in part, our amended and restated bylaws without a stockholder vote in any matter not inconsistent with the laws of the State of Delaware or our amended and restated certificate of incorporation. For as long as our Sponsor and its affiliates beneficially own, in the aggregate, at least 40% of the voting power of all outstanding shares of stock entitled to vote generally in the election of directors, any amendment, alteration, change, addition, rescission or repeal of our amended and restated bylaws by our stockholders will require the affirmative vote of a majority in voting power of the outstanding shares of our stock present in person or represented by proxy at the meeting of stockholders and entitled to vote on such amendment, alteration, change, addition, rescission or repeal. At any time when our Sponsor and its affiliates beneficially own, in the aggregate, less than 40% of the voting power of all outstanding shares of stock entitled to vote generally in the election of directors, any amendment, alteration, change, addition, rescission or repeal of our amended and restated bylaws by our stockholders will require the affirmative vote of the holders of at least 662/3% in voting power of all the then-outstanding shares of stock entitled to vote generally in the election of directors, voting together as a single class.
The DGCL provides generally that the affirmative vote of a majority of the outstanding shares entitled to vote thereon, voting together as a single class, is required to amend a corporation’s certificate of incorporation, unless the certificate of incorporation requires a greater percentage.
Our amended and restated certificate of incorporation will provide that once our Sponsor and its affiliates beneficially own, in the aggregate, less than 40% of the voting power of all outstanding shares of stock entitled to vote generally in the election of directors, the following provisions in our amended and restated certificate of incorporation may be amended, altered, repealed or rescinded only by the affirmative vote of the holders of at least 662⁄3% in the voting power of all outstanding shares of stock entitled to vote generally in the election of directors, voting together as a single class:
| • | the provision requiring a 662/3% supermajority vote for stockholders to amend our amended and restated bylaws; |
| • | the provisions providing for a classified board of directors (the election and term of our directors); |
134
Table of Contents
| • | the provisions regarding resignation and removal of directors; |
| • | the provisions regarding competition and corporate opportunities; |
| • | the provisions regarding entering into business combinations with interested stockholders; |
| • | the provisions regarding stockholder action by written consent; |
| • | the provisions regarding calling special meetings of stockholders; |
| • | the provisions regarding filling vacancies on our board of directors and newly created directorships; |
| • | the provisions eliminating monetary damages for breaches of fiduciary duty by a director; and |
| • | the amendment provision requiring that the above provisions be amended only with a 662⁄3% supermajority vote. |
The combination of the classification of our board of directors, the lack of cumulative voting and the supermajority voting requirements will make it more difficult for our existing stockholders to replace our board of directors as well as for another party to obtain control of us by replacing our board of directors. Because our board of directors has the power to retain and discharge our officers, these provisions could also make it more difficult for existing stockholders or another party to effect a change in management.
These provisions may have the effect of deterring hostile takeovers, delaying or preventing changes in control of our management or the Company, such as a merger, reorganization or tender offer. These provisions are intended to enhance the likelihood of continued stability in the composition of our board of directors and its policies and to discourage certain types of transactions that may involve an actual or threatened acquisition of the Company. These provisions are designed to reduce our vulnerability to an unsolicited acquisition proposal. The provisions are also intended to discourage certain tactics that may be used in proxy fights. However, such provisions could have the effect of discouraging others from making tender offers for our shares and, as a consequence, they also may inhibit fluctuations in the market price of our shares that could result from actual or rumored takeover attempts. Such provisions may also have the effect of preventing changes in management.
Dissenters’ Rights of Appraisal and Payment
Under the DGCL, with certain exceptions, our stockholders will have appraisal rights in connection with a merger or consolidation of us. Pursuant to the DGCL, stockholders who properly request and perfect appraisal rights in connection with such merger or consolidation will have the right to receive payment of the fair value of their shares as determined by the Delaware Court of Chancery.
Stockholders’ Derivative Actions
Under the DGCL, any of our stockholders may bring an action in our name to procure a judgment in our favor, also known as a derivative action, provided that the stockholder bringing the action is a holder of our shares at the time of the transaction to which the action relates or such stockholder’s stock thereafter devolved by operation of law.
Exclusive Forum
Our amended and restated certificate of incorporation will provide, subject to limited exceptions, that unless we consent to the selection of an alternative forum, the state or federal courts (as appropriate) located within the State of Delaware shall, to the fullest extent permitted by law, be the sole and exclusive forum for any (1) derivative action or proceeding brought on behalf of the Company, (2) action asserting a claim of breach of a fiduciary duty owed by any director, officer or other employee or stockholder of the Company to the Company or our stockholders, creditors or other constituents, (3) action asserting a claim against the Company or any director
135
Table of Contents
or officer of the Company arising pursuant to any provision of the DGCL or our amended and restated certificate of incorporation or our amended and restated bylaws or as to which the DGCL confers jurisdiction on the Court of Chancery of the State of Delaware, (iv) action asserting a claim against the Company or any director or officer of the Company governed by the internal affairs doctrine or (v) action against us or any of our directors or officers involving a claim or defense arising pursuant to the Exchange Act or the Securities Act, in each such case subject to said courts having personal jurisdiction over the indispensable parties named as defendants therein. The enforceability of similar forum provisions in other companies’ certificates of incorporation has been challenged in legal proceedings, and it is possible that a court could find these types of provisions to be unenforceable in whole or in part. Our exclusive forum provision shall not relieve the Company of its duties to comply with the federal securities laws and the rules and regulations thereunder, and our stockholders will not be deemed to have waived our compliance with these laws, rules and regulations. Any person or entity purchasing or otherwise acquiring any interest in shares of capital stock of the Company shall be deemed to have notice of and consented to the forum provisions in our amended and restated certificate of incorporation.
Conflicts of Interest
Delaware law permits corporations to adopt provisions renouncing any interest or expectancy in certain opportunities that are presented to the corporation or its officers, directors or stockholders. Our amended and restated certificate of incorporation will, to the maximum extent permitted from time to time by Delaware law, renounce any interest or expectancy that we have in, or right to be offered an opportunity to participate in, specified business opportunities that are from time to time presented to our officers, directors or stockholders or their respective affiliates, other than those officers, directors, stockholders or affiliates who are our or our subsidiaries’ employees. Our amended and restated certificate of incorporation will provide that, to the fullest extent permitted by law, our Sponsor or any of its affiliates or any director who is not employed by us (including any non-employee director who serves as one of our officers in both his or her director and officer capacities) or his or her affiliates will not have any duty to refrain from (1) engaging in a corporate opportunity in the same or similar lines of business in which we or our affiliates now engage or propose to engage or (2) otherwise competing with us or our affiliates. In addition, to the fullest extent permitted by law, in the event that our Sponsor or any of its affiliates or any non-employee director acquires knowledge of a potential transaction or other business opportunity which may be a corporate opportunity for itself or himself or its or his affiliates or for us or our affiliates, such person will have no duty to communicate or offer such transaction or business opportunity to us or any of our affiliates and they may take any such opportunity for themselves or offer it to another person or entity. Our amended and restated certificate of incorporation will not renounce our interest in any business opportunity that is expressly offered to a non-employee director solely in his or her capacity as a director or officer of the Company. To the fullest extent permitted by law, no business opportunity will be deemed to be a potential corporate opportunity for us unless we would be permitted to undertake the opportunity under our amended and restated certificate of incorporation, we have sufficient financial resources to undertake the opportunity and the opportunity would be in line with our business.
Limitations on Liability and Indemnification of Officers and Directors
The DGCL authorizes corporations to limit or eliminate the personal liability of directors to corporations and their stockholders for monetary damages for breaches of directors’ fiduciary duties, subject to certain exceptions. Our amended and restated certificate of incorporation will include a provision that eliminates the personal liability of directors for monetary damages for any breach of fiduciary duty as a director, except to the extent such exemption from liability or limitation thereof is not permitted under the DGCL. The effect of these provisions will be to eliminate the rights of us and our stockholders, through stockholders’ derivative suits on our behalf, to recover monetary damages from a director for breach of fiduciary duty as a director, including breaches resulting from grossly negligent behavior. However, exculpation will not apply to any director if the director has acted in bad faith, knowingly or intentionally violated the law, authorized illegal dividends or redemptions or derived an improper benefit from his or her actions as a director.
136
Table of Contents
Our amended and restated bylaws will provide that we must generally indemnify, and advance expenses to, our directors and officers to the fullest extent authorized by the DGCL. We also are expressly authorized to carry directors’ and officers’ liability insurance providing indemnification for our directors, officers and certain employees for some liabilities. We also intend to enter into indemnification agreements with our directors, which agreements will require us to indemnify these individuals to the fullest extent permitted under Delaware law against liabilities that may arise by reason of their service to us, and to advance expenses incurred as a result of any proceeding against them as to which they could be indemnified. We believe that these indemnification and advancement provisions and insurance will be useful to attract and retain qualified directors and officers.
The limitation of liability, indemnification and advancement provisions in our amended and restated certificate of incorporation and amended and restated bylaws may discourage stockholders from bringing a lawsuit against directors for breach of their fiduciary duty. These provisions also may have the effect of reducing the likelihood of derivative litigation against directors and officers, even though such an action, if successful, might otherwise benefit us and our stockholders. In addition, your investment may be adversely affected to the extent we pay the costs of settlement and damage awards against directors and officers pursuant to these indemnification provisions.
There is currently no pending material litigation or proceeding involving any of our directors, officers or employees for which indemnification is sought.
Transfer Agent and Registrar
The transfer agent and registrar for our common stock is Computershare Trust Company, N.A.
Listing
We intend to apply to have our common stock listed on NASDAQ under the symbol “CLHN”.
137
Table of Contents
DESCRIPTION OF CERTAIN INDEBTEDNESS
Credit Facilities
On February 1, 2013, Calceus MidCo, Inc., its subsidiary, Calceus Acquisition, Inc., as lead borrower, and its other subsidiaries party thereto as borrowers, entered into the ABL Credit Agreement, as amended by Amendment No. 1 to ABL Credit Agreement, dated as of November 23, 2015, and by Amendment No. 2 to ABL Credit Agreement, dated as of July 11, 2018, with the lenders from time to time party thereto and Wells Fargo Bank, National Association, as administrative agent and collateral agent.
On February 12, 2019, Calceus MidCo, Inc. and Calceus Acquisition, Inc., as borrower, entered into the Term Loan Credit Agreement with the lenders from time to time party thereto and JPMorgan Chase Bank, N.A., as administrative and collateral agent.
Lien priority as between the Term Loan Facility and ABL Credit Facility with respect to the collateral is governed by the Intercreditor Agreement, dated as of February 1, 2013 (as amended by the Intercreditor Agreement Supplement, dated as of February 12, 2019, among JPMorgan Chase Bank, N.A., in its capacity as administrative agent and collateral agent under the Term Loan Facility, Wells Fargo Bank, National Association, in its capacity as administrative agent and collateral agent under the ABL Credit Facility, and the other parties party thereto, or the Intercreditor Agreement) among Calceus MidCo, Inc., Calceus Acquisition, Inc., Wells Fargo Bank, National Association, in its capacity as administrative agent and collateral agent under the ABL Credit Facility, Jefferies Finance LLC, in its capacity as administrative agent and collateral agent under a prior term loan credit facility, and the other parties party thereto.
The following is a summary description of certain terms of the ABL Credit Agreement and the Term Loan Credit Agreement.
ABL Credit Facility
The ABL Credit Agreement provides for an aggregate principal amount of $115.0 million under which the borrowers under the ABL Credit Facility, or the ABL Borrowers, may borrow from time to time, of which up to $20.0 million is available through a subfacility in the form of letters or credit and up to $10.0 million is available through a subfacility for short-term borrowings known as swing line loans, in each case subject to customary conditions and limitations (including the borrowing base limitation described below). In addition, the ABL Borrowers may request one or more incremental increases to the available revolving credit commitments under the ABL Credit Facility in an aggregate amount not to exceed $35.0 million. The lenders under the ABL Credit facility are not under any obligation to provide any such incremental commitments.
Availability under the ABL Credit Facility is subject to a borrowing base calculation. The borrowing base consists of eligible credit card receivables, eligible accounts receivable, eligible inventory, eligible in-transit inventory, and qualified cash, less applicable reserves (and subject, in each case, to applicable advance rates).
Maturity
The ABL Credit Facility will mature, and the commitments thereunder will terminate, on July 11, 2023.
Interest and Fees
At our election, the interest rate per annum applicable to loans under the ABL Credit Facility is based on a rate of interest determined by reference to either (i) a eurocurrency rate determined by reference to the London interbank offered rate for U.S. dollars for the applicable interest period or (ii) an alternate base rate determined by reference to the highest of (a) the rate of interest established by the administrative agent as its “prime rate,”
138
Table of Contents
(b) 0.50% above the federal funds rate and (c) the eurocurrency rate set forth above for an interest period of one month plus 1.00%, in each case plus an applicable margin rate ranging from 1.25%-1.75% in the case of eurocurrency rate loans and 0.25%-0.75% in the case of base rate loans, depending on the average historical excess availability under the ABL Credit Facility.
We may elect interest periods of one, two, three, or six months (or, to the extent agreed to by each lender of the applicable eurocurrency borrowing, nine or twelve months thereafter, as selected by us) for eurocurrency borrowings.
Interest on base rate borrowings is payable in arrears on the last business day of each March, June, September and December and on the maturity date of the ABL Credit Facility. Interest on eurocurrency borrowings is payable in arrears at the end of each applicable interest period or every three months in the case of interest periods in excess of three months. Interest on past due amounts will accrue at 2.0% over the applicable interest rate.
In addition to paying interest on outstanding principal under the ABL Credit Facility, we are required to pay a commitment fee to the lenders in respect of the unutilized commitments thereunder at a rate equal to 0.25% per annum based on the average revolving loan utilization. We must also pay customary letter of credit fees, including a fronting fee of 0.125% per annum of the daily maximum amount available to be drawn under each outstanding letter of credit, and customary administration fees.
Guarantors
The ABL Borrowers’ obligations under the ABL Credit Facility, and any specified secured hedge agreements and cash management arrangements provided by any lender, agent or lead arranger under the ABL Credit Facility, or any of their respective affiliates, are guaranteed by Calceus MidCo, Inc. (in the absence of any intermediate holding company), any intermediate holding company, and each direct and indirect, existing and future, material wholly owned restricted subsidiaries of the ABL Borrowers (subject to certain exceptions and limitations), or collectively, the ABL Guarantors.
Collateral
Subject to the Intercreditor Agreement, the ABL Credit Facility, and any specified secured hedge agreements and cash management arrangements provided by any lender, agent or lead arranger under the ABL Credit Facility, or any of their respective affiliates, are secured by a security interest in (a) substantially all equity interests of the ABL Borrowers and all equity interests held directly by the ABL Borrowers or any ABL Guarantor and (b) substantially all tangible and intangible assets of Calceus MidCo, Inc., each ABL Borrower and each other ABL Guarantor, in each case subject to certain exceptions and limitations.
Prepayments
Outstanding loans under the ABL Credit Facility may be voluntarily repaid in whole or in part at any time without premium or penalty, other than customary “breakage” costs with respect to eurocurrency borrowings.
Covenants
The ABL Credit Agreement contains a number of covenants that, among other things, restrict, subject to certain exceptions, our ability and the ability of our restricted subsidiaries to:
| • | incur additional indebtedness (including guarantee obligations); |
| • | create, incur or assume liens; |
| • | engage in certain fundamental changes; |
139
Table of Contents
| • | sell assets; |
| • | pay dividends and make other payments in respect of capital stock; |
| • | make investments, acquisitions, loans and advances; |
| • | prepay and modify the terms of certain indebtedness; |
| • | engage in certain transactions with affiliates; and |
| • | enter into negative pledge clauses. |
In addition, the ABL Credit Agreement requires the Borrowers and their restricted subsidiaries (on a consolidated basis) to maintain a minimum fixed charge coverage ratio of 1.0:1.0 if excess availability under the ABL Credit Facility is less than the greater of 10% of the maximum borrowing amount and $11.5 million for a certain period of time.
The ABL Credit Agreement also contains certain customary affirmative covenants, including the monthly (or, under certain circumstance, more frequent) delivery of a borrowing base certificate setting forth the calculation of the borrowing base and excess availability under the ABL Credit Facility.
Events of Default
The ABL Credit Agreement contains customary events of default including, but not limited to, failure to pay principal or interest, breaches of representations and warranties, violations of affirmative or negative covenants, cross-defaults to other material indebtedness, a bankruptcy or similar proceeding being instituted by or against us, rendering of certain monetary judgments against us, invalidity of collateral documents, defaults with respect to certain ERISA obligations and changes of control.
Term Loan Facility
The Term Loan Credit Agreement provides for a term loan to Calceus Acquisition, Inc., or in such capacity, the Term Loan Borrower, in an aggregate principal amount of $290.0 million. In addition, the Term Loan Borrower may request to add one or more additional tranches of term loans and/or increase the principal amount of term loans under the Term Loan Facility in an aggregate amount not to exceed the sum of (i) the greater of (a) $45.0 million and (b) 50.0% of consolidated EBITDA of the Term Loan Borrower, (ii) the principal amount of certain voluntary prepayments of the term loans thereunder and certain other indebtedness secured on an equal priority to the term loans thereunder prior to such date and (iii) an additional amount subject to compliance with (a) in the case of incremental indebtedness secured on an equal priority basis to the Term Loan Facility, a first lien leverage ratio not exceeding 3.25:1.00, on a pro forma basis, (b) in the case of incremental indebtedness secured on a junior priority basis to the Term Loan Facility, a total secured leverage ratio not exceeding 3.25:1.00, on a pro forma basis and (c) in the case of unsecured incremental indebtedness, either (x) a total leverage ratio not exceeding 4.00:1.00 or (y) an interest coverage ratio of at least 2.00:1.00, in each case on a pro forma basis. The lenders under the Term Loan Facility are not under any obligation to provide any such incremental indebtedness.
Maturity
The Term Loan Facility will mature on February 12, 2025.
Interest and Fees
At our election, the interest rate per annum applicable to the loans under the Term Loan Facility is based on a rate of interest determined by reference to either (i) a eurocurrency rate determined by reference to the London
140
Table of Contents
interbank offered rate for U.S. dollars for the applicable interest period (not to be less than 0.00%) or (ii) an alternate base rate determined by reference to the highest of (a) the rate of interest published by The Wall Street Journal as the “U.S. Prime Lending Rate” (or, if such rate is negative, 0.00%), (b) 0.50% above the greater of the federal funds effective rate and the overnight bank funding rate (or, if such rate is negative, 0.00%) and (c) the eurocurrency rate set forth above for an interest period of one month plus 1.00%, plus an applicable margin of (x) in the case of eurocurrency rate loans, 5.50% and (y) in the case of base rate loans, 4.50%.
We may elect interest periods of one, two, three, or six months (or, to the extent agreed to by each lender of the applicable eurocurrency borrowing, nine or twelve months thereafter, as selected by us) for eurocurrency borrowings.
Interest on base rate borrowings is payable in arrears on the last business day of each March, June, September and December and on the maturity date of the Term Loan Facility. Interest on eurocurrency borrowings is payable at the end of each applicable interest period or every three months in the case of interest periods in excess of three months. Interest on all past due amounts will accrue at 2.00% over the applicable rate.
We pay certain customary administration fees under the Term Loan Facility.
Guarantors
The Term Loan Borrower’s obligations under the Term Loan Facility and any secured hedge agreements and cash management arrangements provided by any lender, agent or lead arranger under the Term Loan Facility, or any of their respective affiliates, are guaranteed by Calceus MidCo, Inc. (in the absence of any intermediate holding company), any intermediate holding company, and each direct and indirect, existing and future, material wholly owned restricted subsidiary of the Term Loan Borrower (subject to certain exceptions and limitations), or collectively, the Term Loan Guarantors.
Collateral
Subject to the Intercreditor Agreement, the Term Loan Facility, and any secured hedge agreements and cash management arrangements provided by any lender, agent or lead arranger under the Term Loan Facility, or any of their respective affiliates, are secured by a security interest in (a) substantially all equity interests of the Term Loan Borrower and all equity interests held directly by the Term Loan Borrower or any Term Loan Guarantor and (b) substantially all tangible and intangible assets of Calceus MidCo, Inc., the Term Loan Borrower and each other Term Loan Guarantor, in each case subject to certain exceptions and limitations.
Prepayments and Amortization
Outstanding loans under the Term Loan Facility may be voluntarily repaid in whole or in part at any time without premium or penalty, other than customary “breakage” costs with respect to eurocurrency borrowings, provided that if any repricing event occurs prior to February 12, 2020, the Term Loan Borrower shall pay a fee equal to 1.00% of the aggregate principal amount of the loans prepaid or converted in such repricing event or the aggregate principal amount of the loans subject to such repricing event, as applicable.
Subject to certain exceptions, we must make prepayments under the Term Loan Facility equal to: (i) 100% of the net cash proceeds of certain non-ordinary course sales or certain other dispositions of property or assets (including insurance and condemnation proceeds) subject to customary reinvestment provisions and certain other exceptions, (ii) 100% of the net cash proceeds of the issuance or incurrence of certain indebtedness, other than proceeds from debt permitted under the Term Loan Facility (except in respect of certain refinancing debt) and (iii) 50% (with step-downs to 25% and 0% based upon achievement of specified first lien leverage ratios) of annual excess cash flow.
141
Table of Contents
The Term Loan Facility amortizes in installments on the last day of each February, May, August and November prior to the maturity date of the Term Loan Facility equal to (i) with respect to the first twelve quarterly amortization payments, an amount equal to 0.625% of the original principal amount of the Term Loan Facility and (ii) with respect to each quarterly amortization payment thereafter, an amount equal to 1.25% of the original principal amount of the Term Loan Facility.
Covenants
The Term Loan Credit Agreement contains a number of covenants that, among other things, restrict, subject to certain exceptions, our ability and the ability of our restricted subsidiaries to:
| • | incur additional indebtedness (including guarantee obligations); |
| • | create, incur or assume liens; |
| • | engage in certain fundamental changes; |
| • | sell assets; |
| • | pay dividends and make other payments in respect of capital stock; |
| • | make investments, acquisitions, loans and advances; |
| • | prepay and modify the terms of certain indebtedness; |
| • | engage in certain transactions with affiliates; and |
| • | enter into negative pledge clauses. |
The Term Loan Credit Agreement also contains certain customary affirmative covenants.
Events of Default
The Term Loan Credit Agreement contains customary events of default including, but not limited to, failure to pay principal or interest, breaches of representations and warranties, violations of affirmative or negative covenants, cross-defaults to other material indebtedness, a bankruptcy or similar proceeding being instituted by or against us, rendering of certain monetary judgments against us, invalidity of collateral documents, defaults with respect to certain ERISA obligations and changes of control.
142
Table of Contents
SHARES ELIGIBLE FOR FUTURE SALE
Prior to this offering, there has been no public market for shares of our common stock. We cannot predict the effect, if any, future sales of shares of common stock, or the availability for future sale of shares of common stock, will have on the market price of shares of our common stock prevailing from time to time. Future sales of substantial amounts of our common stock in the public market or the perception that such sales might occur may adversely affect market prices of our common stock prevailing from time to time and could impair our future ability to raise capital through the sale of our equity or equity-related securities at a time and price that we deem appropriate. Furthermore, there may be sales of substantial amounts of our common stock in the public market after the existing legal and contractual restrictions lapse. This may adversely affect the prevailing market price and our ability to raise equity capital in the future. See “Risk Factors—Risks Related to this Offering and Ownership of our Common Stock—Future sales, or the perception of future sales, by us or our existing stockholders in the public market following this offering could cause the market price of our common stock to decline.”
Upon completion of this offering, we will have a total of shares of our common stock outstanding. Of the outstanding shares, the shares sold in this offering (or shares if the underwriters exercise in full their option to purchase additional shares) will be freely tradable without restriction or further registration under the Securities Act, except that any shares held by our affiliates, as that term is defined under Rule 144, including our directors, executive officers and other affiliates (including our Sponsor), may be sold only in compliance with the limitations described below.
The remaining outstanding shares of common stock held by our Sponsor and our directors and executive officers after this offering, representing % of the total outstanding shares of our common stock following this offering, will be deemed restricted securities under the meaning of Rule 144 and may be sold in the public market only if registered or if they qualify for an exemption from registration, including the exemptions pursuant to Rule 144 and Rule 701 under the Securities Act, which we summarize below.
Lock-up Agreements
In connection with this offering, we, our executive officers, directors and certain of our significant stockholders, including the selling stockholders, will agree, subject to certain exceptions, not to sell, dispose of or hedge any shares of our common stock or securities convertible into or exchangeable for shares of our common stock, without, in each case, the prior written consent of BofA Securities, Inc. and Morgan Stanley & Co. LLC, for a period of 180 days after the date of this prospectus. See “Underwriting.”
Rule 144
In general, under Rule 144, as currently in effect, once we have been subject to public company reporting requirements for at least 90 days, a person (or persons whose shares are aggregated) who is not deemed to be or have been one of our affiliates for purposes of the Securities Act at any time during 90 days preceding a sale and who has beneficially owned the shares proposed to be sold for at least six months, including the holding period of any prior owner other than an affiliate, is entitled to sell such shares without complying with the manner of sale, volume limitation or notice provisions of Rule 144, subject to compliance with the public information requirements of Rule 144. If such a person has beneficially owned the shares proposed to be sold for at least one year, including the holding period of a prior owner other than an affiliate, then such person is entitled to sell such shares without complying with any of the requirements of Rule 144.
In general, under Rule 144, as currently in effect, our affiliates or persons selling shares of our common stock on behalf of our affiliates, who have met the six month holding period for beneficial ownership of “restricted shares” of our common stock, are entitled to sell upon the expiration of the lock-up agreements
143
Table of Contents
described above, within any three-month period beginning 90 days after the date of this prospectus, a number of shares that does not exceed the greater of:
| • | 1% of the number of shares of our common stock then outstanding, which will equal approximately shares immediately after this offering; or |
| • | the average reported weekly trading volume of our common stock on NASDAQ during the four calendar weeks preceding the filing of a notice on Form 144 with respect to such sale. |
Sales under Rule 144 by our affiliates or persons selling shares on behalf of our affiliates are also subject to certain manner of sale provisions and notice requirements and to the availability of current public information about us. The sale of these shares, or the perception that sales will be made, could adversely affect the price of our common stock after this offering because a great supply of shares would be, or would be perceived to be, available for sale in the public market.
We are unable to estimate the number of shares that will be sold under Rule 144 since this will depend on the market price for our common stock, the personal circumstances of the stockholder and other factors.
Rule 701
In general, under Rule 701 as currently in effect, any of our employees, directors, officers, consultants or advisors who received shares from us in connection with a compensatory stock or option plan or other written agreement before the effective date of this offering are entitled to sell such shares 90 days after the effective date of this offering in reliance on Rule 144, in the case of affiliates, without having to comply with the holding period requirements of Rule 144 and, in the case of non-affiliates, without having to comply with the public information, holding period, volume limitation or notice filing requirements of Rule 144.
Registration Statements on Form S-8
We intend to file one or more registration statements on Form S-8 under the Securities Act to register all shares of stock subject to issuance under our new Omnibus Incentive Plan to be adopted in connection with this offering. Any such Form S-8 registration statement will automatically become effective upon filing. Accordingly shares registered under such registration statements will be available for sale in the open market. We expect that the initial registration statement on Form S-8 will cover shares.
Registration Rights
For a description of rights some holders of common stock will have to require us to register the shares of common stock they own, see “Certain Relationships and Related Party Transactions—Stockholders Agreement.” Registration of these shares under the Securities Act would result in these shares becoming freely tradable immediately upon effectiveness of such registration.
Following completion of this offering, the shares of our common stock covered by registration rights would represent approximately % of our outstanding common stock (or %, if the underwriters exercise in full their option to purchase additional shares). These shares also may be sold under Rule 144, depending on their holding period and subject to restrictions in the case of shares held by persons deemed to be our affiliates.
144
Table of Contents
MATERIAL UNITED STATES FEDERAL INCOME AND ESTATE
TAX CONSEQUENCES TO NON-U.S. HOLDERS
The following is a summary of the material United States federal income and estate tax consequences to a non-U.S. holder (as defined below) of the purchase, ownership and disposition of our common stock as of the date hereof. Except where noted, this summary deals only with common stock that is purchased in this offering and held as a capital asset.
A “non-U.S. holder” means a beneficial owner of our common stock (other than an entity or arrangement treated as a partnership for United States federal income tax purposes) that is not, for United States federal income tax purposes, any of the following:
| • | an individual citizen or resident of the United States; |
| • | a corporation (or any other entity treated as a corporation for United States federal income tax purposes) created or organized in or under the laws of the United States, any state thereof or the District of Columbia; |
| • | an estate the income of which is subject to United States federal income taxation regardless of its source; or |
| • | a trust if it (1) is subject to the primary supervision of a court within the United States and one or more United States persons have the authority to control all substantial decisions of the trust or (2) has a valid election in effect under applicable United States Treasury Regulations to be treated as a United States person. |
This summary is based upon provisions of the Internal Revenue Code of 1986, as amended, or the Code, and the Treasury Regulations promulgated thereunder, rulings and judicial decisions as of the date hereof. Those authorities may be changed, perhaps retroactively, so as to result in United States federal income and estate tax consequences different from those summarized below. We cannot assure you that such a change in law will not alter significantly the tax considerations we describe in this summary. This summary does not address all aspects of United States federal income and estate taxes and does not deal with foreign, state, local or other tax considerations that may be relevant to non-U.S. holders in light of their particular circumstances. In addition, it does not represent a detailed description of the United States federal income and estate tax consequences applicable to you if you are subject to special treatment under the United States federal income tax laws including, without limitation if you are:
| • | a United States expatriate; |
| • | a foreign pension fund; |
| • | a “controlled foreign corporation”; |
| • | a “passive foreign investment company”; |
| • | a bank, insurance company or other financial institution; |
| • | a tax exempt organization or governmental organization; |
| • | a broker, dealer or trader in securities; |
| • | a person subject to the alternative minimum tax; |
| • | a partnership or other pass-through entity for United States federal income tax purposes (or an investor therein); |
| • | a person who holds our common stock as part of a hedge, straddle, or other risk reduction strategy or as part of a conversion transaction or other integrated investment; |
145
Table of Contents
| • | a person required to accelerate the recognition of any item of gross income with respect to our common stock as a result of such income being recognized on an applicable financial statement; |
| • | a person who holds or receives our common stock pursuant to the exercise of any employee stock option or otherwise as compensation; or |
| • | a person deemed to sell our common stock under the constructive sale provisions of the Code. |
If a partnership (or other entity treated as a partnership for United States federal income tax purposes) holds our common stock, the tax treatment of a partner will generally depend upon the status of the partner and the activities of the partnership. If you are a partner of a partnership holding our common stock, you should consult your tax advisors.
If you are considering the purchase of our common stock, you should consult your own tax advisors concerning the particular United States federal income and estate tax consequences to you of the purchase, ownership and disposition of our common stock, as well as the consequences to you arising under other United States federal tax laws and the laws of any other taxing jurisdiction.
Distributions
As discussed above under “Dividend Policy,” we do not currently anticipate paying cash dividends on shares of our common stock in the foreseeable future. If we make distributions of cash or other property (other than certain pro rata distributions of our stock) in respect of our common stock, the distribution will generally be treated as a dividend for United States federal income tax purposes to the extent it is paid from our current or accumulated earnings and profits, as determined under United States federal income tax principles. Any portion of a distribution that exceeds our current and accumulated earnings and profits generally will be treated first as a tax-free return of capital to the extent of the non-U.S. holder’s adjusted tax basis in our common stock, causing a reduction in the adjusted tax basis of such non-U.S. holder’s common stock, but not below zero. To the extent the amount of the distribution exceeds a non-U.S. holder’s adjusted basis in our common stock, the excess will be treated as capital gain, and will be treated as described below under “ —Gain on Disposition of Common Stock.”
Dividends paid to a non-U.S. holder of our common stock generally will be subject to withholding of United States federal income tax at a 30% rate or such lower rate as may be specified by an applicable income tax treaty. However, dividends that are effectively connected with the conduct of a trade or business by the non-U.S. holder within the United States (and, if required by an applicable income tax treaty, are attributable to a United States permanent establishment of the non-U.S. holder) are not subject to such withholding tax, provided certain certification and disclosure requirements are satisfied. Instead, such dividends are subject to United States federal income tax on a net income basis in the same manner as if the non-U.S. holder were a United States person as defined under the Code. Any such effectively connected dividends received by a foreign corporation may be subject to an additional “branch profits tax” at a 30% rate or such lower rate as may be specified by an applicable income tax treaty.
A non-U.S. holder of our common stock who wishes to claim the benefit of an applicable treaty rate and avoid backup withholding, as discussed below, for dividends will be required (a) to provide the applicable withholding agent with a properly executed Internal Revenue Service Form W-8BEN or Form W-8BEN-E (or other applicable form) certifying under penalty of perjury that such holder is not a United States person as defined under the Code and is eligible for treaty benefits or (b) if our common stock is held through certain foreign intermediaries, to satisfy the relevant certification requirements of applicable United States Treasury Regulations. Special certification and other requirements apply to certain non-U.S. holders that are pass-through entities rather than corporations or individuals.
A non-U.S. holder of our common stock eligible for a reduced rate of United States federal withholding tax pursuant to an income tax treaty may obtain a refund of any excess amounts withheld by timely filing an
146
Table of Contents
appropriate claim for refund with the Internal Revenue Service. Non-U.S. holders are urged to consult their own tax advisors regarding their entitlement to the benefits under any applicable income tax treaty.
Gain on Disposition of Common Stock
Subject to the discussion of backup withholding below, any gain realized by a non-U.S. holder on the sale or other taxable disposition of our common stock generally will not be subject to United States federal income tax unless:
| • | the gain is effectively connected with a trade or business of the non-U.S. holder in the United States (and, if required by an applicable income tax treaty, is attributable to a United States permanent establishment of the non-U.S. holder); |
| • | the non-U.S. holder is an individual who is present in the United States for 183 days or more in the taxable year of the disposition, and certain other conditions are met; or |
| • | we are or have been a “United States real property holding corporation” for United States federal income tax purposes and certain other conditions are met. |
An individual non-U.S. holder described in the first bullet point immediately above will be subject to tax on the gain derived from the sale or other taxable disposition under regular graduated United States federal income tax rates. An individual non-U.S. holder described in the second bullet point immediately above will be subject to a tax equal to 30% (or such lower rate as may be specified by an applicable income tax treaty) on the gain derived from the sale or other taxable disposition, which may be offset by United States source capital losses, even though the individual is not considered a resident of the United States, provided that the individual has timely filed United States federal income tax returns with respect to such losses. If a non-U.S. holder that is a foreign corporation falls under the first bullet point immediately above, it will be subject to tax on its gain in the same manner as if it were a United States person as defined under the Code and, in addition, may be subject to the branch profits tax equal to 30% (or such lower rate as may be specified by an applicable income tax treaty) of its effectively connected earnings and profits, subject to adjustments.
We believe we are not and do not anticipate becoming a “United States real property holding corporation” for United States federal income tax purposes.
Federal Estate Tax
Common stock held by an individual non-U.S. holder at the time of death will be included in such holder’s gross estate for United States federal estate tax purposes, unless an applicable estate tax treaty provides otherwise.
Information Reporting and Backup Withholding
Generally, we must report annually to the Internal Revenue Service and to each non-U.S. holder the amount of distributions paid to such holder and the tax withheld with respect to such distributions, regardless of whether withholding was required. Copies of the information returns reporting such distributions and any withholding may also be made available to the tax authorities in the country in which the non-U.S. holder resides under the provisions of an applicable income tax treaty.
A non-U.S. holder will not be subject to backup withholding on dividends received if such holder certifies under penalty of perjury that it is a non-U.S. holder (and the payor does not have actual knowledge or reason to know that such holder is a United States person as defined under the Code), or such holder otherwise establishes an exemption.
147
Table of Contents
Information reporting and, depending on the circumstances, backup withholding will apply to the proceeds of a sale or other disposition of our common stock made within the United States or conducted through certain United States-related financial intermediaries, unless the beneficial owner certifies under penalty of perjury that it is a non-U.S. holder (and the payor does not have actual knowledge or reason to know that the beneficial owner is a United States person as defined under the Code), or such owner otherwise establishes an exemption.
Backup withholding is not an additional tax and any amounts withheld under the backup withholding rules may be allowed as a refund or a credit against a non-U.S. holder’s United States federal income tax liability provided the required information is timely furnished to the Internal Revenue Service.
Additional Withholding Requirements
Under Sections 1471 through 1474 of the Code (such Sections commonly referred to as “FATCA”), a 30% United States federal withholding tax may apply to any dividends paid on our common stock to (i) a “foreign financial institution” (as specifically defined in the Code) which does not provide sufficient documentation, typically on IRS Form W-8BEN-E, evidencing either (x) an exemption from FATCA, or (y) its compliance (or deemed compliance) with certain diligence, reporting and other obligations under FATCA (which may alternatively be in the form of compliance with an applicable intergovernmental agreement with the United States, if any) in a manner which avoids withholding, or (ii) a “non-financial foreign entity” (as specifically defined in the Code) which does not provide sufficient documentation, typically on IRS Form W-8BEN-E, evidencing either (x) an exemption from FATCA, or (y) adequate information regarding certain substantial United States beneficial owners of such entity (if any). If a dividend payment is both subject to withholding under FATCA and subject to the withholding tax discussed above under “ —Distributions,” the withholding under FATCA may be credited against, and therefore reduce, such other withholding tax. You should consult your own tax advisors regarding these requirements and whether they may be relevant to your ownership and disposition of our common stock.
148
Table of Contents
BofA Securities, Inc. and Morgan Stanley & Co. LLC are acting as representatives of each of the underwriters named below. Subject to the terms and conditions set forth in an underwriting agreement among us, the selling stockholders and the underwriters, the selling stockholders have agreed to sell to the underwriters, and each of the underwriters has agreed, severally and not jointly, to purchase from the selling stockholders the number of shares of common stock set forth opposite its name below:
| Underwriter | Number of Shares | |||
| BofA Securities, Inc. |
||||
| Morgan Stanley & Co. LLC |
||||
| J.P. Morgan Securities LLC |
||||
| Goldman Sachs & Co. LLC |
||||
| Jefferies LLC |
||||
| Robert W. Baird & Co. Incorporated |
||||
| Cowen and Company, LLC |
||||
| Piper Sandler & Co. |
||||
| Stifel, Nicolaus & Company, Incorporated |
||||
|
|
|
|||
| Total |
||||
|
|
|
|||
Subject to the terms and conditions set forth in the underwriting agreement, the underwriters have agreed, severally and not jointly, to purchase all of the shares sold under the underwriting agreement if any of these shares are purchased. If an underwriter defaults, the underwriting agreement provides that the purchase commitments of the non-defaulting underwriters may be increased or the underwriting agreement may be terminated.
We, the selling stockholders and the underwriters have agreed to indemnify each other against certain liabilities, including liabilities under the Securities Act, or to contribute to payments that may be required to be made in respect of those liabilities.
The underwriters are offering the shares, subject to prior sale, when, as and if issued to and accepted by them, subject to approval of legal matters by their counsel, including the validity of the shares, and other conditions contained in the underwriting agreement, such as the receipt by the underwriters of officer’s certificates and legal opinions. The underwriters reserve the right to withdraw, cancel or modify offers to the public and to reject orders in whole or in part.
Discounts
The representatives have advised us and the selling stockholders that the underwriters propose initially to offer the shares to the public at the public offering price set forth on the cover page of this prospectus and to dealers at that price less a concession not in excess of $ per share. After the initial offering, the public offering price, concession or any other term of the offering may be changed.
The following table shows the public offering price, underwriting discount and proceeds before expenses to the selling stockholders. The information assumes either no exercise or full exercise by the underwriters of their option to purchase additional shares.
| Per Share | Without Option |
With Option | ||||||||||
| Public offering price |
$ | $ | $ | |||||||||
| Underwriting discount |
$ | $ | $ | |||||||||
| Proceeds, before expenses, to the selling stockholders |
$ | $ | $ | |||||||||
The expenses of the offering, not including the underwriting discount, are estimated at $ and are payable by the selling stockholders. We have agreed to reimburse the underwriters for expense relating to clearance of this offering with the Financial Industry Regulatory Authority up to $ .
149
Table of Contents
Option to Purchase Additional Shares
The selling stockholders have granted an option to the underwriters, exercisable for 30 days after the date of this prospectus, to purchase up to additional shares at the public offering price, less the underwriting discount. If the underwriters exercise this option, each will be obligated, subject to conditions contained in the underwriting agreement, to purchase a number of additional shares proportionate to that underwriter’s initial amount reflected in the above table.
No Sales of Similar Securities
We, our executive officers, directors and certain of our significant stockholders, including the selling stockholders, will agree not to sell or transfer any common stock or securities convertible into, exchangeable for, exercisable for our common stock for 180 days after the date of this prospectus without first obtaining the written consent of BofA Securities, Inc. and Morgan Stanley & Co. LLC, subject to certain exceptions. Specifically, we and these other persons will agree, with certain exceptions, not to directly or indirectly:
| • | offer, pledge, sell or contract to sell any common stock; |
| • | sell any option or contract to purchase any common stock; |
| • | purchase any option or contract to sell any common stock; |
| • | grant any option, right or warrant for the sale of any common stock; |
| • | lend or otherwise dispose of or transfer any common stock; |
| • | request or demand that we publicly file a registration statement related to our common stock; or |
| • | enter into any swap or other agreement that transfers, in whole or in part, the economic consequence of ownership of any common stock, whether any such swap or transaction is to be settled by delivery of shares or other securities, in cash or otherwise. |
This lock-up provision applies to common stock and to securities convertible into or exchangeable or exercisable for common stock. It also applies to common stock owned now or acquired later by the person executing the agreement or for which the person executing the agreement later acquires the power of disposition.
Listing
We expect the shares to be approved for listing on NASDAQ, subject to notice of issuance, under the symbol “CLHN”. In order to meet the requirements for listing on that exchange, the underwriters have undertaken to sell a minimum number of shares to a minimum number of beneficial owners as required by that exchange.
Before this offering, there has been no public market for our common stock. The initial public offering price will be determined through negotiations among the selling stockholders and the representatives. In addition to prevailing market conditions, the factors to be considered in determining the initial public offering price are:
| • | the valuation multiples of publicly traded companies that the representatives believe to be comparable to us; |
| • | our financial information; |
| • | the history of, and the prospects for, our Company and the industry in which we compete; |
| • | an assessment of our management, its past and present operations, and the prospects for, and timing of, our future revenue; |
| • | the present state of our development; and |
150
Table of Contents
| • | the above factors in relation to market values and various valuation measures of other companies engaged in activities similar to ours. |
An active trading market for the shares may not develop. It is also possible that after the offering the shares will not trade in the public market at or above the initial public offering price.
The underwriters do not expect to sell more than 5% of the shares in the aggregate to accounts over which they exercise discretionary authority.
Price Stabilization, Short Positions and Penalty Bids
Until the distribution of the shares is completed, SEC rules may limit underwriters and selling group members from bidding for and purchasing our common stock. However, the representatives may engage in transactions that stabilize the price of the common stock, such as bids or purchases to peg, fix or maintain that price.
In connection with the offering, the underwriters may purchase and sell our common stock in the open market. These transactions may include short sales, purchases on the open market to cover positions created by short sales and stabilizing transactions. Short sales involve the sale by the underwriters of a greater number of shares than they are required to purchase in the offering. “Covered” short sales are sales made in an amount not greater than the underwriters’ option to purchase additional shares described above. The underwriters may close out any covered short position by either exercising their option to purchase additional shares or purchasing shares in the open market. In determining the source of shares to close out the covered short position, the underwriters will consider, among other things, the price of shares available for purchase in the open market as compared to the price at which they may purchase shares through the option granted to them. “Naked” short sales are sales in excess of such option. The underwriters must close out any naked short position by purchasing shares in the open market. A naked short position is more likely to be created if the underwriters are concerned that there may be downward pressure on the price of our common stock in the open market after pricing that could adversely affect investors who purchase in the offering. Stabilizing transactions consist of various bids for or purchases of shares of common stock made by the underwriters in the open market prior to the completion of the offering.
The underwriters may also impose a penalty bid. This occurs when a particular underwriter repays to the underwriters a portion of the underwriting discount received by it because the representatives have repurchased shares sold by or for the account of such underwriter in stabilizing or short covering transactions.
Similar to other purchase transactions, the underwriters’ purchases to cover the syndicate short sales may have the effect of raising or maintaining the market price of our common stock or preventing or retarding a decline in the market price of our common stock. As a result, the price of our common stock may be higher than the price that might otherwise exist in the open market. The underwriters may conduct these transactions on NASDAQ, in the over-the-counter market or otherwise.
Neither we, the selling stockholders nor any of the underwriters make any representation or prediction as to the direction or magnitude of any effect that the transactions described above may have on the price of our common stock. In addition, neither we, the selling stockholders nor any of the underwriters make any representation that the representatives will engage in these transactions or that these transactions, once commenced, will not be discontinued without notice.
Electronic Distribution
In connection with the offering, certain of the underwriters or securities dealers may distribute prospectuses by electronic means, such as e-mail. A prospectus in electronic format may be made available on websites maintained by one or more underwriters, or selling group members, if any, participating in this offering. The
151
Table of Contents
representative may agree to allocate a number of shares of common stock to underwriters for sale to their online brokerage account holders. Internet distributions will be allocated by the representative to underwriters that may make Internet distributions on the same basis as other allocations.
Other Relationships
Some of the underwriters and their affiliates have engaged in, and may in the future engage in, investment banking and other commercial dealings in the ordinary course of business with us, the selling stockholders or our respective affiliates. They have received, or may in the future receive, customary fees and commissions for these transactions.
In addition, in the ordinary course of their business activities, the underwriters and their respective affiliates may make or hold a broad array of investments and actively trade debt and equity securities (or related derivative securities) and financial instruments (including bank loans) for their own account and for the accounts of their customers. Such investments and securities activities may involve securities and/or instruments of ours, the selling stockholders or our respective affiliates. The underwriters and their respective affiliates may also make investment recommendations and/or publish or express independent research views in respect of such securities or financial instruments and may hold, or recommend to clients that they acquire, long and/or short positions in such securities and instruments.
European Economic Area and United Kingdom
In relation to each Member State of the European Economic Area and the United Kingdom (each a “Relevant State”), no offer of shares which are the subject of the offering has been, or will be, made to the public in that Relevant State, other than under the following exemptions under the Prospectus Directive:
| (a) | to any legal entity which is a qualified investor as defined in the Prospectus Directive; |
| (b) | to fewer than 150 natural or legal persons (other than qualified investors as defined in the Prospectus Directive), subject to obtaining the prior consent of the representatives for any such offer; or |
| (c) | in any other circumstances falling within Article 3(2) of the Prospectus Directive; |
provided that no such offer of shares referred to in clause (a) through (c) above shall result in a requirement for us or any underwriter to publish a prospectus pursuant to Article 3 of the Prospectus Directive, or supplement a prospectus pursuant to Article 16 of the Prospectus Directive.
Each person located in a Relevant State to whom any offer of shares is made or who receives any communication in respect of an offer of shares, or who initially acquires any shares, will be deemed to have represented, warranted, acknowledged and agreed to and with us and each underwriter that (1) it is a “qualified investor” within the meaning of the law in that Relevant State implementing Article 2(1)(e) of the Prospectus Directive; and (2) in the case of any shares acquired by it as a financial intermediary as that term is used in Article 3(2) of the Prospectus Directive, the shares acquired by it in the offer have not been acquired on behalf of, nor have they been acquired with a view to their offer or resale to, persons in any Relevant State other than qualified investors, as that term is defined in the Prospectus Directive, or in circumstances in which the prior consent of the representatives has been given to the offer or resale, or where shares have been acquired by it on behalf of persons in any Relevant State other than qualified investors, the offer of those shares to it is not treated under the Prospectus Directive as having been made to such persons.
We, the underwriters and our and their respective affiliates will rely upon the truth and accuracy of the foregoing representations, acknowledgments and agreements.
This prospectus has been prepared on the basis that any offer of shares in any Relevant State will be made pursuant to an exemption under the Prospectus Directive from the requirement to publish a prospectus for offers
152
Table of Contents
of shares. Accordingly, any person making or intending to make an offer in that Relevant State of shares which are the subject of the offering contemplated in this prospectus may only do so in circumstances in which no obligation arises for us or any of underwriter to publish a prospectus pursuant to Article 3 of the Prospectus Directive in relation to such offer. Neither we, the selling stockholders nor the underwriters have authorized, nor do they authorize, the making of any offer of shares in circumstances in which an obligation arises for us or the underwriters to publish a prospectus for such offer.
For the purposes of this provision, the expression an “offer of shares to the public” in relation to any shares in any Relevant State means the communication in any form and by any means of sufficient information on the terms of the offer and the shares to be offered so as to enable an investor to decide to purchase or subscribe for the shares, as the same may be varied in that Relevant State by any measure implementing the Prospectus Directive in that Relevant State. The expression “Prospectus Directive” means Prospectus Regulation (EU) 2017/1129 (as amended) and includes any relevant implementing measure in each Relevant State.
The above selling restriction is in addition to any other selling restrictions set out below.
Notice to Prospective Investors in the United Kingdom
In addition, in the United Kingdom, this document is being distributed only to, and is directed only at, and any offer subsequently made may only be directed at persons who are, “qualified investors” (as defined in the Prospectus Directive) (i) who have professional experience in matters relating to investments falling within Article 19(5) of the Financial Services and Markets Act 2000 (Financial Promotion) Order 2005, as amended, or the Order, and/or (ii) who are high net worth companies (or persons to whom it may otherwise be lawfully communicated) falling within Article 49(2)(a) to (d) of the Order (all such persons together being referred to as “relevant persons”). This document must not be acted on or relied on in the United Kingdom by persons who are not relevant persons. In the United Kingdom, any investment or investment activity to which this prospectus relates is only available to, and will be engaged in with, relevant persons.
Notice to Prospective Investors in Switzerland
The shares may not be publicly offered in Switzerland and will not be listed on the SIX Swiss Exchange, or the SIX, or on any other stock exchange or regulated trading facility in Switzerland. This prospectus has been prepared without regard to the disclosure standards for issuance prospectuses under art. 652a or art. 1156 of the Swiss Code of Obligations or the disclosure standards for listing prospectuses under art. 27 ff. of the SIX Listing Rules or the listing rules of any other stock exchange or regulated trading facility in Switzerland. Neither this prospectus nor any other offering or marketing material relating to the shares or the offering may be publicly distributed or otherwise made publicly available in Switzerland.
Neither this prospectus nor any other offering or marketing material relating to the offering, the Company or the shares have been or will be filed with or approved by any Swiss regulatory authority. In particular, this prospectus will not be filed with, and the offer of shares will not be supervised by, the Swiss Financial Market Supervisory Authority, and the offer of shares has not been and will not be authorized under the Swiss Federal Act on Collective Investment Schemes, or the CISA. The investor protection afforded to acquirers of interests in collective investment schemes under the CISA does not extend to acquirers of shares.
Notice to Prospective Investors in the Dubai International Financial Centre
This prospectus relates to an “Exempt Offer” in accordance with the Offered Securities Rules of the Dubai Financial Services Authority, or the DFSA. This prospectus is intended for distribution only to persons of a type specified in the Offered Securities Rules of the DFSA. It must not be delivered to, or relied on by, any other person. The DFSA has no responsibility for reviewing or verifying any documents in connection with Exempt Offers. The DFSA has neither approved this prospectus nor taken steps to verify the information set forth herein
153
Table of Contents
and has no responsibility for this prospectus. The shares to which this prospectus relates may be illiquid and/or subject to restrictions on their resale. Prospective purchasers of the shares offered should conduct their own due diligence on the shares. If you do not understand the contents of this prospectus you should consult an authorized financial advisor.
Notice to Prospective Investors in Australia
No placement document, prospectus, product disclosure statement or other disclosure document has been lodged with the Australian Securities and Investments Commission in relation to the offering. This prospectus does not constitute a prospectus, product disclosure statement or other disclosure document under the Corporations Act 2001, or the Corporations Act, and does not purport to include the information required for a prospectus, product disclosure statement or other disclosure document under the Corporations Act.
Any offer in Australia of the shares may only be made to persons, or Exempt Investors, who are “sophisticated investors” (within the meaning of section 708(8) of the Corporations Act) or “professional investors” (within the meaning of section 708(11) of the Corporations Act) or otherwise pursuant to one or more exemptions contained in section 708 of the Corporations Act so that it is lawful to offer the shares without disclosure to investors under Chapter 6D of the Corporations Act.
The shares applied for by Exempt Investors in Australia must not be offered for sale in Australia in the period of 12 months after the date of allotment under the offering, except in circumstances where disclosure to investors under Chapter 6D of the Corporations Act would not be required pursuant to an exemption under section 708 of the Corporations Act or otherwise or where the offer is pursuant to a disclosure document that complies with Chapter 6D of the Corporations Act. Any person acquiring shares must observe such Australian on-sale restrictions.
This prospectus contains general information only and does not take account of the investment objectives, financial situation or particular needs of any particular person. It does not contain any securities recommendations or financial product advice. Before making an investment decision, investors need to consider whether the information in this prospectus is appropriate to their needs, objectives and circumstances, and, if necessary, seek expert advice on those matters.
Notice to Prospective Investors in Hong Kong
The shares have not been offered or sold and will not be offered or sold in Hong Kong, by means of any document, other than (a) to “professional investors” as defined in the Securities and Futures Ordinance (Cap. 571) of Hong Kong and any rules made under that Ordinance; or (b) in other circumstances which do not result in the document being a “prospectus” as defined in the Companies Ordinance (Cap. 32) of Hong Kong or which do not constitute an offer to the public within the meaning of that Ordinance. No advertisement, invitation or document relating to the shares has been or may be issued or has been or may be in the possession of any person for the purposes of issue, whether in Hong Kong or elsewhere, which is directed at, or the contents of which are likely to be accessed or read by, the public of Hong Kong (except if permitted to do so under the securities laws of Hong Kong) other than with respect to shares which are or are intended to be disposed of only to persons outside Hong Kong or only to “professional investors” as defined in the Securities and Futures Ordinance and any rules made under that Ordinance.
Notice to Prospective Investors in Japan
The shares have not been and will not be registered under the Financial Instruments and Exchange Law of Japan (Law No. 25 of 1948, as amended) and, accordingly, will not be offered or sold, directly or indirectly, in Japan, or for the benefit of any Japanese Person or to others for re-offering or resale, directly or indirectly, in Japan or to any Japanese Person, except in compliance with all applicable laws, regulations and ministerial
154
Table of Contents
guidelines promulgated by relevant Japanese governmental or regulatory authorities in effect at the relevant time. For the purposes of this paragraph, “Japanese Person” shall mean any person resident in Japan, including any corporation or other entity organized under the laws of Japan.
Notice to Prospective Investors in Singapore
This prospectus has not been registered as a prospectus with the Monetary Authority of Singapore. Accordingly, the shares were not offered or sold or caused to be made the subject of an invitation for subscription or purchase and will not be offered or sold or caused to be made the subject of an invitation for subscription or purchase, and this prospectus or any other document or material in connection with the offer or sale, or invitation for subscription or purchase, of the shares, has not been circulated or distributed, nor will it be circulated or distributed, whether directly or indirectly, to any person in Singapore other than (i) to an institutional investor (as defined in Section 4A of the Securities and Futures Act (Chapter 289) of Singapore, as modified or amended from time to time, or the SFA) pursuant to Section 274 of the SFA, (ii) to a relevant person (as defined in Section 275(2) of the SFA) pursuant to Section 275(1) of the SFA, or any person pursuant to Section 275(1A) of the SFA, and in accordance with the conditions specified in Section 275 of the SFA, or (iii) otherwise pursuant to, and in accordance with the conditions of, any other applicable provision of the SFA.
Where the shares are subscribed for or purchased under Section 275 of the SFA by a relevant person which is:
| (a) | a corporation (which is not an accredited investor (as defined in Section 4A of the SFA)) the sole business of which is to hold investments and the entire share capital of which is owned by one or more individuals, each of whom is an accredited investor; or |
| (b) | a trust (where the trustee is not an accredited investor) whose sole purpose is to hold investments and each beneficiary of the trust is an individual who is an accredited investor, |
securities or securities-based derivatives contracts (each term as defined in Section 2(1) of the SFA) of that corporation or the beneficiaries’ rights and interest (howsoever described) in that corporation or trust shall not be transferred within six months after that corporation or that trust has acquired the shares pursuant to an offer made under Section 275 of the SFA except:
| (a) | to an institutional investor or to a relevant person, or to any person arising from an offer referred to in Section 275(1A) or Section 276(4)(i)(B) of the SFA; |
where no consideration is or will be given for the transfer;
where the transfer is by operation of law; or
as specified in Section 276(7) of the SFA.
Notice to Prospective Investors in Canada
The shares may be sold only to purchasers purchasing, or deemed to be purchasing, as principal that are accredited investors, as defined in National Instrument 45-106 Prospectus Exemptions or subsection 73.3(1) of the Securities Act (Ontario), and are permitted clients, as defined in National Instrument 31-103 Registration Requirements, Exemptions and Ongoing Registrant Obligations. Any resale of the shares must be made in accordance with an exemption from, or in a transaction not subject to, the prospectus requirements of applicable securities laws.
Securities legislation in certain provinces or territories of Canada may provide a purchaser with remedies for rescission or damages if this prospectus (including any amendment thereto) contains a misrepresentation, provided that the remedies for rescission or damages are exercised by the purchaser within the time limit prescribed by the securities legislation of the purchaser’s province or territory. The purchaser should refer to any
155
Table of Contents
applicable provisions of the securities legislation of the purchaser’s province or territory for particulars of these rights or consult with a legal advisor.
Pursuant to section 3A.3 of National Instrument 33-105 Underwriting Conflicts (NI 33-105), the underwriters are not required to comply with the disclosure requirements of NI 33-105 regarding underwriter conflicts of interest in connection with this offering.
156
Table of Contents
The validity of the shares of common stock offered by this prospectus will be passed upon for us by Simpson Thacher & Bartlett LLP, New York, New York. Certain legal matters relating to this offering will be passed upon for the underwriters by Latham & Watkins LLP, Washington, District of Columbia.
The consolidated financial statements as of June 1, 2019 and June 2, 2018 and for each of the two years in the period ended June 1, 2019 included in this prospectus have been so included in reliance on the report of PricewaterhouseCoopers LLP, an independent registered public accounting firm, given on the authority of said firm as experts in auditing and accounting.
WHERE YOU CAN FIND MORE INFORMATION
We have filed a registration statement on Form S-1 under the Securities Act with respect to the common stock offered by this prospectus with the SEC. This prospectus is a part of the registration statement and does not contain all of the information set forth in the registration statement and its exhibits and schedules, portions of which have been omitted as permitted by the rules and regulations of the SEC. For further information about us and our common stock, you should refer to the registration statement and its exhibits and schedules. Statements contained in this prospectus regarding the contents of any contract or other document referred to in those documents are not necessarily complete, and in each instance we refer you to the copy of the contract or other document filed as an exhibit to the registration statement or other document. Each of these statements is qualified in all respects by this reference.
Following the completion of this offering, we will be subject to the informational reporting requirements of the Exchange Act and, in accordance with the Exchange Act, we will file annual, quarterly and current reports, proxy statements and other information with the SEC. Our filings with the SEC will be available to the public on the SEC’s website at http://www.sec.gov. Those filings will also be available to the public on, or accessible through, our website (www.colehaan.com) under the heading “Investor Relations.” The information we file with the SEC or contained on or accessible through our corporate website or any other website that we may maintain is not part of this prospectus or the registration statement of which this prospectus is a part.
We intend to make available to our common stockholders annual reports containing consolidated financial statements audited by an independent registered public accounting firm.
157
Table of Contents
| Page | ||||
| Consolidated Financial Statements |
||||
| F-2 | ||||
| Consolidated Balance Sheets as of June 2, 2018 and June 1, 2019 |
F-3 | |||
| Consolidated Statements of Operations for the fiscal years ended June 2, 2018 and June 1, 2019 |
F-4 | |||
| F-5 | ||||
| F-6 | ||||
| Consolidated Statements of Cash Flows for the fiscal years ended June 2, 2018 and June 1, 2019 |
F-7 | |||
| F-8 | ||||
| Unaudited Condensed Consolidated Financial Statements |
||||
| Condensed Consolidated Balance Sheets as of June 1, 2019 and November 30, 2019 |
F-40 | |||
| F-41 | ||||
| F-42 | ||||
| F-43 | ||||
| F-44 | ||||
| Notes to Unaudited Condensed Consolidated Financial Statements |
F-45 | |||
F-1
Table of Contents

Report of Independent Registered Public Accounting Firm
To the Board of Directors and Stockholders of Cole Haan, Inc.
Opinion on the Financial Statements
We have audited the accompanying consolidated balance sheets of Cole Haan, Inc. and its subsidiaries (the “Company”) as of June 1, 2019 and June 2, 2018, and the related consolidated statements of operations, comprehensive income, stockholders’ equity and cash flows for the years then ended, including the related notes (collectively referred to as the “consolidated financial statements”). In our opinion, the consolidated financial statements present fairly, in all material respects, the financial position of the Company as of June 1, 2019 and June 2, 2018, and the results of its operations and its cash flows for the years then ended in conformity with accounting principles generally accepted in the United States of America.
Change in Accounting Principle
As discussed in Note 2 to the consolidated financial statements, the Company changed the manner in which it accounts for income taxes from intra-entity transfers of assets other than inventory in 2018.
Basis for Opinion
These consolidated financial statements are the responsibility of the Company’s management. Our responsibility is to express an opinion on the Company’s consolidated financial statements based on our audits. We are a public accounting firm registered with the Public Company Accounting Oversight Board (United States) (PCAOB) and are required to be independent with respect to the Company in accordance with the U.S. federal securities laws and the applicable rules and regulations of the Securities and Exchange Commission and the PCAOB.
We conducted our audits of these consolidated financial statements in accordance with the standards of the PCAOB. Those standards require that we plan and perform the audit to obtain reasonable assurance about whether the consolidated financial statements are free of material misstatement, whether due to error or fraud.
Our audits included performing procedures to assess the risks of material misstatement of the consolidated financial statements, whether due to error or fraud, and performing procedures that respond to those risks. Such procedures included examining, on a test basis, evidence regarding the amounts and disclosures in the consolidated financial statements. Our audits also included evaluating the accounting principles used and significant estimates made by management, as well as evaluating the overall presentation of the consolidated financial statements. We believe that our audits provide a reasonable basis for our opinion.
/s/ PricewaterhouseCoopers LLP
Boston, Massachusetts
October 18, 2019
We have served as the Company’s auditor since 2013.
F-2
Table of Contents
Consolidated Balance Sheets
(in thousands, except share and per share amounts)
| June 2, 2018 | June 1, 2019 | |||||||
| Assets |
||||||||
| Current assets: |
||||||||
| Cash |
$ | 23,476 | $ | 37,862 | ||||
| Accounts receivable, net |
37,784 | 43,460 | ||||||
| Inventories, net |
79,649 | 119,234 | ||||||
| Prepaid expenses and other current assets |
9,141 | 12,971 | ||||||
|
|
|
|
|
|||||
| Total current assets |
150,050 | 213,527 | ||||||
| Property and equipment, net |
62,025 | 57,211 | ||||||
| Intangible assets, net |
222,676 | 212,793 | ||||||
| Goodwill |
98,003 | 98,001 | ||||||
| Other long-term assets |
3,310 | 2,988 | ||||||
| Deferred tax assets |
2,585 | 3,338 | ||||||
|
|
|
|
|
|||||
| Total assets |
$ | 538,649 | $ | 587,858 | ||||
|
|
|
|
|
|||||
| Liabilities and Stockholders’ Equity |
||||||||
| Current liabilities: |
||||||||
| Current portion of long-term debt |
$ | 12,502 | $ | 7,250 | ||||
| Accounts payable |
25,175 | 20,983 | ||||||
| Accrued liabilities |
42,036 | 78,859 | ||||||
| Income and other taxes payable |
3,058 | 5,448 | ||||||
|
|
|
|
|
|||||
| Total current liabilities |
82,771 | 112,540 | ||||||
| Long-term debt, net of discount and current portion |
288,345 | 272,997 | ||||||
| Other long-term liabilities |
21,588 | 21,782 | ||||||
| Deferred tax liabilities |
13,393 | 15,750 | ||||||
|
|
|
|
|
|||||
| Total liabilities |
406,097 | 423,069 | ||||||
|
|
|
|
|
|||||
| Commitments and contingencies (Note 14) |
||||||||
| Stockholders’ equity: |
||||||||
| Common stock, $0.01 par value; 1,000 shares authorized as of June 2, 2018 and June 1, 2019; 1,000 shares issued and outstanding as of June 2, 2018 and June 1, 2019 |
— | — | ||||||
| Additional paid-in capital |
238,330 | 238,330 | ||||||
| Accumulated deficit |
(103,890 | ) | (70,753 | ) | ||||
| Accumulated other comprehensive loss |
(1,888 | ) | (2,788 | ) | ||||
|
|
|
|
|
|||||
| Total stockholders’ equity |
132,552 | 164,789 | ||||||
|
|
|
|
|
|||||
| Total liabilities and stockholders’ equity |
$ | 538,649 | $ | 587,858 | ||||
|
|
|
|
|
|||||
The accompanying notes are an integral part of these consolidated financial statements.
F-3
Table of Contents
Consolidated Statements of Operations
(in thousands, except share and per share amounts)
| Year Ended | ||||||||
| June 2, 2018 | June 1, 2019 | |||||||
| Revenue |
$ | 601,566 | $ | 686,576 | ||||
| Cost of sales |
326,218 | 359,372 | ||||||
|
|
|
|
|
|||||
| Gross profit |
275,348 | 327,204 | ||||||
| Selling, general and administrative expense |
249,875 | 264,674 | ||||||
|
|
|
|
|
|||||
| Operating income |
25,473 | 62,530 | ||||||
| Interest expense, net |
20,854 | 21,893 | ||||||
| Loss on debt modification and extinguishment |
— | 3,075 | ||||||
| Other (income), net |
(216 | ) | (342 | ) | ||||
|
|
|
|
|
|||||
| Income before income taxes |
4,835 | 37,904 | ||||||
| Income tax (benefit) expense |
(18,268 | ) | 4,767 | |||||
|
|
|
|
|
|||||
| Net income attributable to common stockholders |
$ | 23,103 | $ | 33,137 | ||||
|
|
|
|
|
|||||
| Earnings per share: |
||||||||
| Net income per share attributable to common stockholders—basic and diluted |
$ | 23,102.82 | $ | 33,136.97 | ||||
| Weighted average common shares outstanding—basic and diluted |
1,000 | 1,000 | ||||||
The accompanying notes are an integral part of these consolidated financial statements.
F-4
Table of Contents
Consolidated Statements of Comprehensive Income
(in thousands)
| Year Ended | ||||||||
| June 2, 2018 | June 1, 2019 | |||||||
| Net income |
$ | 23,103 | $ | 33,137 | ||||
| Other comprehensive income (loss): |
||||||||
| Net changes related to interest rate swap |
||||||||
| Unrealized gains (losses) arising during the period |
1,656 | (309 | ) | |||||
| Reclassification of net realized loss (gain) into earnings |
942 | (320 | ) | |||||
|
|
|
|
|
|||||
| Total net changes related to interest rate swap |
2,598 | (629 | ) | |||||
| Foreign currency translation adjustments |
290 | (278 | ) | |||||
| Pension accrual adjustment |
(149 | ) | 7 | |||||
|
|
|
|
|
|||||
| Other comprehensive income (loss) |
2,739 | (900 | ) | |||||
|
|
|
|
|
|||||
| Comprehensive income |
$ | 25,842 | $ | 32,237 | ||||
|
|
|
|
|
|||||
The accompanying notes are an integral part of these consolidated financial statements.
F-5
Table of Contents
Consolidated Statements of Stockholders’ Equity
(in thousands, except share amounts)
| Common Stock | Accumulated Other Comprehensive Loss |
|||||||||||||||||||||||
| Shares | Amount | Additional Paid-in Capital |
Accumulated Deficit |
Total | ||||||||||||||||||||
| Balance as of June 3, 2017 |
1,000 | $ | — | $ | 238,330 | $ | (113,902 | ) | $ | (4,627 | ) | $ | 119,801 | |||||||||||
| Net income |
— | — | — | 23,103 | — | 23,103 | ||||||||||||||||||
| Other comprehensive income |
— | — | — | — | 2,739 | 2,739 | ||||||||||||||||||
| Cumulative effect of adoption of ASU 2016-16 |
— | — | — | (13,091 | ) | — | (13,091 | ) | ||||||||||||||||
|
|
|
|
|
|
|
|
|
|
|
|
|
|||||||||||||
| Balance as of June 2, 2018 |
1,000 | — | 238,330 | (103,890 | ) | (1,888 | ) | 132,552 | ||||||||||||||||
| Net income |
— | — | — | 33,137 | — | 33,137 | ||||||||||||||||||
| Other comprehensive loss |
— | — | — | — | (900 | ) | (900 | ) | ||||||||||||||||
|
|
|
|
|
|
|
|
|
|
|
|
|
|||||||||||||
| Balance as of June 1, 2019 |
1,000 | $ | — | $ | 238,330 | $ | (70,753 | ) | $ | (2,788 | ) | $ | 164,789 | |||||||||||
|
|
|
|
|
|
|
|
|
|
|
|
|
|||||||||||||
The accompanying notes are an integral part of these consolidated financial statements.
F-6
Table of Contents
Consolidated Statements of Cash Flows
(in thousands)
| Year Ended | ||||||||
| June 2, 2018 | June 1, 2019 | |||||||
| Cash flows from operating activities: |
||||||||
| Net income |
$ | 23,103 | $ | 33,137 | ||||
| Adjustments to reconcile net income to net cash provided by operating activities: |
||||||||
| Depreciation and amortization |
36,577 | 33,883 | ||||||
| Loss on debt extinguishment |
— | 900 | ||||||
| Provision for bad debt and sales returns reserve |
(796 | ) | 837 | |||||
| Deferred rent |
1,943 | (640 | ) | |||||
| Gain on disposals of property and equipment |
(68 | ) | (100 | ) | ||||
| Inventory reserves |
1,073 | (952 | ) | |||||
| Deferred income taxes |
(21,005 | ) | 1,608 | |||||
| Impairment charges |
— | 192 | ||||||
| Unrealized (gain) loss on derivatives |
(133 | ) | 164 | |||||
| Changes in operating assets and liabilities: |
||||||||
| Accounts receivable |
4,466 | (7,190 | ) | |||||
| Inventories |
(7,352 | ) | (38,644 | ) | ||||
| Prepaid expenses and other current assets |
(1,701 | ) | (2,285 | ) | ||||
| Accounts payable |
3,326 | (4,519 | ) | |||||
| Accrued liabilities |
13,660 | 36,077 | ||||||
| Taxes payable |
(2,578 | ) | 2,384 | |||||
| Other, net |
(24 | ) | 316 | |||||
|
|
|
|
|
|||||
| Net cash provided by operating activities |
50,491 | 55,168 | ||||||
|
|
|
|
|
|||||
| Cash used in investing activities: |
||||||||
| Purchases of property and equipment |
(15,521 | ) | (17,069 | ) | ||||
| Other |
(470 | ) | (676 | ) | ||||
|
|
|
|
|
|||||
| Net cash used in investing activities |
(15,991 | ) | (17,745 | ) | ||||
|
|
|
|
|
|||||
| Cash used in financing activities: |
||||||||
| Proceeds from borrowings |
47,400 | 286,375 | ||||||
| Repayment of borrowings |
(70,494 | ) | (306,119 | ) | ||||
| Financing costs |
(125 | ) | (3,185 | ) | ||||
|
|
|
|
|
|||||
| Net cash used in financing activities |
(23,219 | ) | (22,929 | ) | ||||
| Effect of exchange rate changes on cash |
110 | (108 | ) | |||||
|
|
|
|
|
|||||
| Net increase in cash |
11,391 | 14,386 | ||||||
| Cash, beginning of period |
12,085 | 23,476 | ||||||
|
|
|
|
|
|||||
| Cash, end of period |
$ | 23,476 | $ | 37,862 | ||||
|
|
|
|
|
|||||
| Supplemental cash flow information: |
||||||||
| Income taxes paid |
$ | 3,461 | $ | 3,161 | ||||
| Interest paid, net of amount capitalized |
19,108 | 20,168 | ||||||
| Noncash investing and financing activities: |
||||||||
| Purchases of property and equipment included in accounts payable and accrued liabilities |
$ | 3,010 | $ | 2,825 | ||||
| Unpaid finance costs |
— | 302 | ||||||
The accompanying notes are an integral part of these consolidated financial statements.
F-7
Table of Contents
Notes to Consolidated Financial Statements
1. Nature of the Business
Calceus Topco, Inc. (the “Company”) was incorporated in the state of Delaware on November 9, 2012 and is a portfolio company of Apax Partners (the “Sponsor”). The Company is the owner of Cole Haan LLC and its wholly owned subsidiaries, which were acquired on February 1, 2013. The Company changed its name to Cole Haan, Inc. (“Cole Haan”) on October 15, 2019. Cole Haan is a global lifestyle brand serving always-connected, active professionals with innovative footwear and lifestyle accessories, including bags and outerwear, in North America, as well as across regions in Asia, the Middle East, Europe, South America and Central America. Cole Haan generates its revenue by selling its products through a combination of digital, retail, wholesale, international distributor and licensed distribution channels to customers in the premium to moderate spectrum.
2. Summary of Significant Accounting Policies
Basis of Presentation and Fiscal Year
The consolidated financial statements have been prepared in conformity with accounting principles generally accepted in the United States of America (“GAAP”). The consolidated financial statements include the accounts of the Company and its subsidiaries. All significant intercompany transactions have been eliminated in consolidation.
The Company operates on a 52 or 53-week fiscal year, with fiscal years ended on the Saturday closest to May 31. Results for each of the years ended June 2, 2018 and June 1, 2019 consisted of 52 weeks.
Use of Estimates
The preparation of the consolidated financial statements in conformity with generally accepted accounting principles requires management to make estimates, including estimates relating to assumptions that affect the reported amounts of assets and liabilities and the reported amounts of revenue and expenses during the reporting period. Actual results could differ from these estimates. Significant estimates relied upon in preparing these consolidated financial statements include, but are not limited to, the estimates for: (i) development of the sales returns reserve; (ii) impairment assessments for goodwill, intangible assets and long-lived assets; (iii) income taxes, including estimating the valuation allowance and uncertain tax positions; and (iv) stock-based compensation expense.
Revenue Recognition
Revenue transactions associated with the sale of footwear, handbags, accessories and outerwear generally comprise a single performance obligation, which consists of the sale of products to customers either through wholesale or direct to consumer channels. The Company satisfies the performance obligation and records revenue when transfer of control has passed to the customer, based on the terms of sale. Customers are considered to have control once they are able to direct the use and receive substantially all of the benefits of the product. Transfer of control passes to wholesale customers upon shipment. Control passes to retail store customers at the time of sale and to digital commerce customers upon shipment. The transaction price for wholesale revenue is determined based upon the invoiced sales price, less anticipated sales returns, discounts, certain vendor allowances, and miscellaneous claims from customers. The transaction price for direct to consumer revenue is determined based upon invoiced sales price, less anticipated sales returns, and discounts. Payment terms for wholesale and distributor transactions depend on the agreement with the customer and country, and payment is generally required within 60 days of shipment or receipt by the wholesale customer. Payment is due at the time of sale for retail store and digital commerce transactions.
F-8
Table of Contents
Cole Haan, Inc.
Notes to Consolidated Financial Statements
Consideration for trademark licensing contracts is earned through sales-based royalty arrangements and the associated revenue is recognized over the license period at such time that the subsequent sales of the licensed products occur. Licensing revenue for the years ended June 2, 2018 and June 1, 2019 is included in revenue in the consolidated statements of operations.
Gift card breakage income is recognized using the proportional model based upon historical redemption patterns for the balance of gift cards that the Company believes the likelihood of redemption by the customer is remote. During the years ended June 2, 2018 and June 1, 2019, the Company recognized $0.1 million and less than $0.1 million, respectively, of gift card breakage income, which is included in revenue in the consolidated statements of operations.
Taxes assessed by governmental authorities that are both imposed on and concurrent with a specific revenue-producing transaction, and are collected by the Company from a customer, are excluded from revenue and cost of sales in the consolidated statements of income.
The Company evaluates the presentation of revenue on a gross versus net basis. In this evaluation, the Company considers if it obtains control of the specified goods or services before they are transferred to the customer, as well as other indicators such as the party primarily responsible for fulfillment, inventory risk, and discretion in establishing price. The Company has determined gross presentation is appropriate for revenue transactions involving a third party.
Where applicable, the Company has elected the practical expedient to recognize revenue as amounts are invoiced to its customers. The Company has elected not to disclose the remaining transaction price allocated to unsatisfied performance obligations in such contracts or in trademark licensing contracts.
Cost of Sales
Cost of sales includes all costs to make products saleable, such as design and tooling costs, materials, inbound freight, customs charges and duties, purchasing and receiving costs, depreciation, and warehousing and distribution costs, including digital commerce fulfillment fees. Shipping and handling costs associated with outbound freight after control over a product has transferred to a customer are accounted for as fulfillment costs as incurred and are included in cost of sales when the related revenue is recognized.
Income Taxes
The Company accounts for income taxes using the asset and liability method. This approach requires the recognition of deferred tax assets and liabilities for the expected future tax consequences of temporary differences between the carrying amounts and the tax basis of assets and liabilities, using enacted tax rates expected to be applicable in the years in which the temporary differences are expected to reverse. Changes in deferred tax assets and liabilities are recorded in the provision for income taxes. The Company evaluates the realizability of its deferred tax assets and establishes a valuation allowance when it is more likely than not that all or a portion of the deferred tax assets will not be realized. Potential for recovery of deferred tax assets is evaluated by estimating the future taxable profits expected, scheduling of anticipated reversals of taxable temporary differences, and considering prudent and feasible tax planning strategies. If in future periods the Company were to determine that it would be able to realize its deferred tax assets in excess of the net recorded amount, an adjustment to the deferred tax assets, particularly a release of the valuation allowance, would increase income in the period such determination was made.
The Company records liabilities for uncertain income tax positions based on a two-step process. The first step is recognition, where an individual tax position is evaluated as to whether it has a likelihood of greater than
F-9
Table of Contents
Cole Haan, Inc.
Notes to Consolidated Financial Statements
50% of being sustained upon examination based on the technical merits of the position, including resolution of any related appeals or litigation processes. For tax positions that are currently estimated to have less than a 50% likelihood of being sustained, no tax benefit is recorded. For tax positions that have met the recognition threshold in the first step, the Company performs the second step of measuring the benefit to be recorded. The amount of the benefit that may be recognized is the largest amount that has a greater than 50% likelihood of being realized on ultimate settlement. The actual benefits ultimately realized may differ from the estimates. In future periods, changes in facts, circumstances and new information may require the Company to change the recognition and measurement estimates with regard to individual tax positions. Changes in recognition and measurement estimates are recorded in income tax expense and liability in the period in which such changes occur.
The Company’s policy is to classify interest and penalties related to unrecognized tax benefits as a component of income tax expense (benefit) within the consolidated statements of operations. Accrued interest and penalties were $0.4 million and $0.3 million as of June 2, 2018 and June 1, 2019, respectively. The Company reinvests earnings of foreign operations indefinitely and, accordingly, does not provide for income taxes that could result from the remittance of such earnings.
Accounts Receivable, Net
In the normal course of business, the Company extends credit to customers that satisfy pre-defined credit criteria. An allowance for discounts is based on those discounts relating to open invoices where trade discounts have been extended to customers. Costs associated with potential returns of wholesale products as well as allowable customer markdowns and operational charge backs, net of expected recoveries, are included as a reduction to revenue and are part of the provision for allowances included in accounts receivable, net. These provisions result from seasonal negotiations with the Company’s customers as well as historical deduction trends, net of expected recoveries, and the evaluation of current market conditions.
The Company makes ongoing estimates relating to the collectability of its accounts receivable and maintains an allowance for estimated losses resulting from the inability of its customers to make required payments. In determining the amount of the allowance, the Company considers its historical level of credit losses and makes judgments about the creditworthiness of significant customers based on ongoing credit evaluations. The Company’s allowance for uncollectible accounts receivable was $0.2 million as of June 2, 2018 and June 1, 2019.
Inventories, Net
Inventories are stated at lower of standard cost (which approximates actual cost determined using the first-in, first-out cost method) or net realizable value for wholesale, and on an average cost basis for retail and e-commerce. Inventory costs include materials cost, freight, duty and warehousing and distribution costs. The Company continually reviews its inventories and records reserves as necessary to appropriately value slow-turning, obsolete or damaged goods.
Property and Equipment, Net
Property and equipment are recorded at cost. Depreciation is computed using the straight-line method over the estimated useful lives of the related assets. Leasehold improvements are amortized over the shorter of the term of the related lease, or the estimated useful lives of the improvements. Expenditures for repairs and maintenance are charged to expense as incurred. Expenditures for betterments and major improvements that significantly enhance the value and increase the estimated useful life of the asset are capitalized and depreciated over the new estimated useful life. When property and equipment is disposed or retired, the asset cost and accumulated depreciation are removed and a gain or loss is recognized, if any on the consolidated statements of operations.
F-10
Table of Contents
Cole Haan, Inc.
Notes to Consolidated Financial Statements
Computer equipment is depreciated using an estimated useful life of three years and furniture and fixtures are depreciated using estimated useful lives ranging from two to ten years.
The cost of interest that is incurred in connection with ongoing construction projects is capitalized using a weighted average interest rate. These costs are included in property and equipment, net and amortized over the useful life of the related property or equipment.
Long-Lived Assets
Long-lived assets, including property and equipment and definite-lived intangible assets, are evaluated for impairment whenever events or circumstances indicate that the carrying value of the assets may not be recoverable. Conditions that may indicate impairment include, but are not limited to, a significant decrease in the market price of an asset, a significant adverse change in the extent or manner in which an asset is being used or a significant decrease in its physical condition, and operating or cash flow performance that demonstrates continuing losses associated with an asset or asset group.
A potential impairment has occurred if the projected future undiscounted cash flows expected to result from the use and eventual disposition of the asset or asset group are less than the carrying value of the asset or asset group. The estimate of cash flows includes management’s assumptions of cash inflows and outflows directly resulting from the use of the asset in operation. If the carrying value exceeds the sum of the undiscounted cash flows, an impairment charge is recorded equal to the excess of the asset or asset group’s carrying value over its fair value. Fair value is measured using appropriate valuation methodologies that would typically include a projected discounted cash flow model using a discount rate the Company believes is commensurate with the risk inherent in its business. No impairment charge was recognized during the year ended June 2, 2018. The Company recognized a non-cash impairment charge of $0.2 million within selling, general and administrative expense in the consolidated statements of operations during the year ended June 1, 2019.
The Company amortizes its definite-lived intangible assets using the straight-line method. The weighted-average estimated useful lives of the Company’s definite-lived intangible assets are as follows (see Note 4):
| Asset |
Weighted-Average Estimated Useful Life | |
| Favorable leases | Minimum non-cancelable lease term | |
| Distributor relationships | 10.3 years | |
| Other | 9.4 years |
Goodwill and Indefinite-Lived Intangibles
Goodwill and indefinite-lived intangible assets are not amortized, but are reviewed for impairment at least annually, or more frequently when events or changes in circumstances indicate that the carrying value may not be recoverable. The Company assesses goodwill at the reporting unit level. The Company has three reporting units: North America Direct to Consumer, North America Wholesale and Licensing and International.
The Company evaluates goodwill for impairment at least annually on the last day of the fiscal year. The Company may assess its goodwill for impairment initially using a qualitative approach (“step zero”) to determine whether conditions exist to indicate that it is more likely than not that the fair value of a reporting unit is less than its carrying value. If the Company concludes, based on its assessment of relevant events, facts and circumstances that it is more likely than not that a reporting unit’s carrying value is greater than its fair value, then a quantitative analysis will be performed to determine if there is any impairment. The Company may also elect to initially perform a quantitative analysis instead of starting with step zero. The quantitative assessment for
F-11
Table of Contents
Cole Haan, Inc.
Notes to Consolidated Financial Statements
goodwill is a two-step assessment. “Step one” requires comparing the carrying value of a reporting unit, including goodwill, to its fair value. If the fair value of the respective reporting unit exceeds its carrying amount, goodwill is not considered to be impaired and no further testing is required. If the carrying amount of a reporting unit exceeds its fair value, the second step of the goodwill impairment test is to measure the amount of impairment loss, if any. “Step two” compares the implied fair value of goodwill to the carrying amount of goodwill. If the carrying amount of goodwill exceeds the implied fair value, an impairment charge is recorded to write down goodwill to its implied fair value. During the years ended June 2, 2018 and June 1, 2019, the Company did not recognize any goodwill impairment charges.
The Company assesses the recoverability of its indefinite-lived intangible assets at least annually for impairment. Indefinite-lived intangible assets are the trademarks and tradenames owned by the Company (see Note 4). In testing indefinite-lived intangibles for impairment, the Company has the option to first assess qualitative factors to determine whether events or circumstances would indicate that it is more likely than not that an asset’s fair value is less than its carrying amount, or the Company can perform a quantitative impairment analysis to determine the fair value of the indefinite-lived intangible asset without performing a qualitative assessment. Under either approach, if the fair value of the indefinite-lived intangible asset is less than its carrying amount, an impairment charge is recognized in the consolidated statements of operations. During the years ended June 2, 2018 and June 1, 2019, the Company did not recognize any impairment charges related to its indefinite-lived intangible assets.
Operating Leases
The Company leases retail store space, certain distribution and warehouse facilities and office space under operating leases. Operating lease agreements may contain rent escalation clauses, rent holidays or certain landlord incentives, including tenant improvement allowances. Rent expense for non-cancelable operating leases with scheduled rent increases or landlord incentives is recognized on a straight-line basis over the lease term, beginning with the effective lease commencement date, which is generally the date in which the Company takes possession of or controls the physical use of the property. The initial lease term is typically 5-10 years in the United States and 3-10 years internationally.
Certain leases also provide for contingent rent, which is calculated as a percentage of sales in excess of specified levels. A contingent rent liability is recorded in accrued liabilities and the corresponding rent expense recognized when specified levels have been achieved or when the Company determines that achieving the specified levels during the period is probable.
The Company adopted Accounting Standards Update (“ASU”) 2016-02 as of June 2, 2019. See Note 2 for further details.
Marketing Expenses
Marketing expenses consist of advertising and promotional costs, including costs of public relations, digital and print advertising, brand events and retail brand presentation. Marketing costs are included in selling, general and administrative expenses in the consolidated statements of operations. Advertising production costs are expensed as incurred. Advertising placement costs are expensed during the months the advertising appears, while costs related to brand events are expensed when the event occurs. Costs related to retail brand presentations are expensed when the presentation is completed and delivered. Prepayments made under contracts are included in prepaid expenses and other current assets or other long-term assets, depending on the period to which the prepayment applies.
F-12
Table of Contents
Cole Haan, Inc.
Notes to Consolidated Financial Statements
Through cooperative advertising programs, the Company reimburses wholesale customers for certain costs of advertising the Company’s products. The Company records these costs at the point in time when it is obligated to its customers for the costs, which is when the related revenue is recognized. The cooperative advertising reimbursements are included in selling, general and administrative expenses in the consolidated statements of operations.
The Company’s marketing expenses recorded were $26.8 million and $34.9 million for the years ended June 2, 2018 and June 1, 2019, respectively.
Stock-Based Compensation
Certain of the Company’s employees have been granted restricted share unit awards in the form of Class B Units in the Company’s indirect parent, Calceus Topco, L.P. (“Calceus Topco”). Vesting of the Class B Units are contingent upon the occurrence of a liquidity event or a distribution of a specified amount to stockholders, both of which are performance conditions, and the achievement of a specified internal rate of return, which is a market condition.
All of the restricted share unit awards were considered equity-classified awards. As the Class B Units contain both performance and market conditions, the Company will recognize compensation expense for the awards equal to the grant date fair value of all awards for which the performance condition is met and the requisite service period is satisfied regardless of whether the market conditions are ultimately satisfied. The Company determines the grant date fair value of the Class B Units using the Contingent Claims Analysis Model, which uses the risk-free rate, expected term, volatility and dividend yield as inputs. No stock-based compensation expense has been recognized to-date as the Company has not deemed the performance condition to be probable.
Debt Issuance Costs
The Company defers costs directly associated with acquiring third-party financing. Debt issuance costs are deferred and amortized using the effective interest rate method over the term of the related long-term debt agreement and the straight-line method for its credit agreement (see Note 9).
Debt issuance costs related to long-term debt are reflected as a direct deduction of the carrying amount of the long-term debt. Debt issuance costs related to the Company’s credit agreement are recorded as a direct deduction of long-term debt on the consolidated balance sheets.
Segment Reporting
The Company identifies operating segments as components of the Company for which discrete financial information is available and is regularly reviewed by its chief operating decision maker (“CODM”) in making decisions regarding resource allocation and performance assessment. The Company’s Chief Executive Officer has been identified as its CODM. The Company has determined it operates in two distinct operating and reportable segments, North America and International, as the CODM is receiving and using information at these levels to evaluate financial performance and allocate resources.
Foreign Currency Translation and Foreign Currency Transactions
Assets and liabilities denominated in foreign currency are translated into U.S. dollars at the actual rates of exchange at the balance sheet date. Revenue and expenses are translated at the average rates of exchange for the reporting period. The related foreign currency translation adjustments are recorded as a component of
F-13
Table of Contents
Cole Haan, Inc.
Notes to Consolidated Financial Statements
accumulated other comprehensive loss in stockholders’ equity. Transaction gains and losses associated with the Company’s international subsidiaries, which are denominated in currencies other than the Company’s foreign entities’ functional currencies, are recognized in other (income), net within the consolidated statements of operations.
Comprehensive Income
Comprehensive income is a measure of net income and all other changes in equity that result from transactions other than with equity holders, and would normally be recorded in the consolidated statements of stockholders’ equity and the consolidated statements of comprehensive income. Other comprehensive income consists of unrealized gains and losses, reclassification of losses from the Company’s derivative instrument designated as an interest rate swap, foreign currency translation adjustments and pension accrual adjustments.
Income tax expense on the components of other comprehensive income was not significant for the years ended June 2, 2018 and June 1, 2019.
Derivative Financial Instruments
All derivatives are recognized as either assets or liabilities on the consolidated balance sheets and measurement of these instruments is at fair value. If the derivative is designated as a cash flow hedge, the effective portions of changes in the fair value of the derivative are recorded as a component of accumulated other comprehensive loss and are recognized in the consolidated statements of operations when the hedged item affects earnings. Any portion of the change in fair value that is determined to be ineffective is immediately recognized in earnings. Derivative gains or losses included in accumulated other comprehensive loss are reclassified into earnings at the time the hedged transaction occurs.
Fair Value of Financial Instruments
Certain assets and liabilities are carried at fair value in accordance with GAAP. Fair value is defined as the exchange price that would be received for an asset or paid to transfer a liability (an exit price) in the principal or most advantageous market for the asset or liability in an orderly transaction between market participants on the measurement date.
As a basis for determining the fair value of certain of the Company’s financial instruments, the Company utilizes a three-tier value hierarchy, which prioritizes the inputs used in measuring fair value as follows:
| • | Level 1 – Quoted market prices in active markets for identical assets or liabilities. |
| • | Level 2 – Inputs other than Level 1 inputs that are either directly or indirectly observable. |
| • | Level 3 – Unobservable inputs developed using estimates and assumptions developed by the Company, which reflect those that a market participant would use. |
This hierarchy requires the Company to use observable market data, when available, and to minimize the use of unobservable inputs when determining fair value.
Cash
Cash represents bank deposits held by financial institutions.
F-14
Table of Contents
Cole Haan, Inc.
Notes to Consolidated Financial Statements
Financial instruments that potentially subject the Company to concentrations of credit risk principally consist of cash held in financial institutions and accounts receivable. The Company considers the credit risk associated with these financial instruments to be minimal. Cash is held by financial institutions with high credit ratings and the Company has not historically sustained any credit losses associated with its cash balances.
Earnings Per Share
Basic net income per share is calculated by dividing net income available to common stockholders by the weighted average number of shares of common stock outstanding for the period. Diluted net income per share is calculated by dividing net income available to common stockholders by the diluted weighted average number of shares of common stock outstanding for the period. There were no potentially dilutive securities outstanding during the years ended June 2, 2018 and June 1, 2019.
Recently Adopted Accounting Standards
In 2014, the Financial Accounting Standards Board (“FASB”) issued Accounting Standards Update (“ASU”) 2014-09, Revenue from Contracts with Customers (Topic 606). This amendment requires companies to recognize revenue in a way that depicts the transfer of promised goods or services to customers in an amount that reflects the consideration to which the entity expects to be entitled in exchange for those goods or services. In addition, the guidance requires disclosures of the nature, amount, timing and uncertainty of revenue and cash flows arising from contracts with customers. The Company adopted ASU 2014-09 and several associated ASUs, which it collectively refers to as “Topic 606,” as of June 3, 2018, the first day of the Company’s 2019 fiscal year, using the modified retrospective transition method and applied it to contracts not completed on the date of adoption.
Results for interim and annual reporting periods beginning after June 2, 2018 are presented under Topic 606, while prior period amounts are not adjusted and continue to be reported under the accounting standards in effect for the prior period. There was no net impact to the Company’s results of operations or net cash provided by operating activities in the consolidated statements of cash flows for the year ended June 1, 2019 resulting from the adoption of Topic 606.
The Company’s reserve balances for returns and other sales discounts were previously reported net of the estimated cost of inventory for product returns, and as a reduction to accounts receivable, net for wholesale and as a liability for retail on the consolidated balance sheets. Under Topic 606, an asset for the estimated cost of inventory expected to be returned is now recognized separately from the liability for sales-related reserves. The adoption of Topic 606 resulted in a decrease to accounts receivable, net, of $0.6 million, an increase in prepaid expenses and other current assets of $1.4 million and an increase in accrued liabilities of $0.8 million as of June 3, 2018. See Note 3 for more information.
In August 2016, the FASB issued ASU 2016-15, Statement of Cash Flows (Topic 230): Classification of Certain Cash Receipts and Cash Payments, which changes how certain cash receipts and cash payments are presented and classified in the statement of cash flows. For public entities, this guidance is effective for fiscal years beginning after December 15, 2017, including interim periods within those fiscal years. Early adoption is permitted. Entities must apply the guidance retrospectively to all periods presented but may apply it prospectively if retrospective application would be impracticable. The Company adopted ASU 2016-15 retrospectively as of June 4, 2017. The adoption had no material impact on the Company’s consolidated statements of cash flows.
In October 2016, the FASB issued ASU 2016-16, Income Taxes (Topic 740): Intra-Entity Transfers of Assets Other than Inventory, which simplifies the accounting for the income tax consequences of intra-entity
F-15
Table of Contents
Cole Haan, Inc.
Notes to Consolidated Financial Statements
transfers of assets other than inventory. Previous U.S. GAAP guidance prohibited the recognition of current and deferred income taxes for an intra-entity asset transfer until the asset has been sold to an outside party. The new guidance states that an entity should recognize the income tax consequences of an intra-entity transfer of an asset other than inventory when the transfer occurs. Consequently, the amendments in this standard eliminated the exception for an intra-entity transfer of an asset other than inventory. For public entities, this guidance is effective for fiscal years beginning after December 15, 2017, including interim periods within those annual periods. The Company early adopted ASU 2016-16 during the quarter ended September 2, 2017, which resulted in the reclassification of $13.1 million of prepaid taxes from other long-term assets to accumulated deficit. Prior periods were not retrospectively adjusted for this change.
In March 2017, the FASB issued ASU 2017-07, Compensation-Retirement Benefits (Topic 715): Improving the Presentation of Net Periodic Pension Cost and Net Periodic Postretirement Benefit Cost. This amendment is meant to improve the presentation of net periodic pension cost and net periodic postretirement benefit cost. The amendments require that an employer report the service cost component in the same line item or items as other compensation costs arising from services rendered by the pertinent employees during the period. The other components of net benefit cost are required to be presented in the income statement below operating income. Entities must apply the guidance retrospectively to all periods presented, but may elect to use the amounts disclosed in its pension and other postretirement benefit plan note for the prior comparative periods as the estimation basis for applying the retrospective presentation requirements. If an entity elects to use the practical expedient, the entity shall disclose that the practical expedient was used. For public entities, this guidance is effective for fiscal years beginning after December 15, 2017, including interim periods within those annual periods. The retrospective adoption of this guidance on June 3, 2018 had no material impact on the Company’s consolidated financial statements.
In March 2018, the FASB issued ASU 2018-05 Income Taxes (Topic 740): Amendments to SEC Paragraphs Pursuant to SEC Staff Accounting Bulletin No. 118, which provides guidance on accounting for the tax effects of the 2017 Tax Cuts and Jobs Act (the “TCJA”). This guidance allows a company to record a provisional amount when it does not have the necessary information available, prepared, or analyzed in reasonable detail to complete its accounting for the change in the tax law during the measurement period. The measurement period ends when the company has obtained, prepared, and analyzed the information necessary to finalize its accounting, but cannot extend beyond one year. The standard was effective upon issuance. The Company completed its analysis of the financial statement impact of the TJCA in the fourth quarter of fiscal year 2019 and determined there was no material adjustment to the income tax expense or deferred tax liability as compared to the provisional amounts recorded by the Company. Refer to Note 8 for further information.
Recently Issued Accounting Standards
In February 2016, the FASB issued ASU No. 2016-02 (“ASU 2016-02”), Leases (Topic 842), which is intended to increase transparency and comparability among companies that enter into leasing arrangements. ASU 2016-02 requires recognition of lease assets and lease liabilities on the balance sheet for nearly all leases (other than short-term leases), as well as a retrospective recognition and measurement of existing impacted leases. The requirements of the new standard will be effective for annual reporting periods beginning after December 15, 2018. Early adoption is permitted. The new standard can be applied using a modified retrospective approach to each prior reporting period with various optional practical expedients. Additional updates to further clarify the guidance in ASU 2016-02 have been issued by the FASB in ASU 2018-10 and ASU 2018-11, both issued in July 2018, ASU 2018-20, issued in December 2018, and ASU 2019-01, issued in March 2019. The Company adopted these standards, which it collectively refers to as “Topic 842,” on June 2, 2019, the first day of its 2020 fiscal year, using the Effective Date Method of adoption, which permitted entities to initially apply the requirements of the standard in the period of adoption.
F-16
Table of Contents
Cole Haan, Inc.
Notes to Consolidated Financial Statements
The Company has made the following elections provided under the standard:
| • | Package of practical expedients that permits the Company to retain its existing lease assessment and classification; and |
| • | The Company elected not to apply the recognition requirements for short-term operating leases, defined as a term of 12-months or less from the commencement date. |
The Company has evaluated the impact of Topic 842 in relation to its contracts. The Company completed its analysis of the contractual arrangements that may qualify as leases under the new standard and will recognize right-of-use assets and lease liabilities for its retail stores, warehouses and corporate offices. The adoption resulted in the recognition of $134.6 million and $143.2 million of right-of-use assets and lease liabilities, respectively, on the consolidated balance sheet, with no significant change to the consolidated statements of operations. There was no impact to accumulated deficit upon adoption.
In June 2016, the FASB issued ASU No. 2016-13, Measurement of Credit Losses on Financial Instruments, which is intended to provide financial statement users with more decision-useful information about the expected credit losses on financial instruments and other commitments to extend credit held by a reporting entity at each reporting date. ASU 2016-13 replaces the incurred loss impairment methodology with a methodology that reflects expected credit losses and requires consideration of a broader range of reasonable and supportable information to inform credit loss estimates. For public entities, the amendment is effective for fiscal years beginning after December 15, 2020, and interim periods within fiscal years beginning after December 15, 2021. Early adoption is permitted. The Company is currently evaluating the effect the adoption will have on its consolidated financial statements.
In January 2017, the FASB issued ASU 2017-04, Intangibles-Goodwill and Other (Topic 350): Simplifying the Test for Goodwill Impairment, which is intended to simplify the subsequent measurement and impairment of goodwill. The amendment simplifies the complexity of evaluating goodwill for impairment by eliminating the second step of the impairment test. As amended, the goodwill impairment test will consist of one step comparing the fair value of a reporting unit with its carrying amount. Under the simplified model, a goodwill impairment is calculated as the difference between the carrying amount of the reporting unit and its fair value, but not to exceed the carrying amount of goodwill allocated to that reporting unit. For public entities, the amendment is effective for fiscal years beginning after December 15, 2019. Early adoption is permitted and must be applied prospectively. The Company is currently evaluating the impact of the adoption of this guidance on its consolidated financial statements.
In August 2017, the FASB issued ASU 2017-12, Derivatives and Hedging (Topic 815): Targeted Improvements to Accounting for Hedging Activities, which is intended to improve the financial reporting of hedging relationships to better portray the economic results of an entity’s risk management activities in its consolidated financial statements. In addition to that main objective, the amendments in the update make certain targeted improvements to simplify the application of the hedge accounting guidance in current GAAP. For public entities, the amendment is effective for fiscal years beginning after December 15, 2018, and interim periods within those fiscal years. Early application is permitted in any interim period after the issuance of the update. Additional updates to further clarify the guidance in ASU 2017-12 have been issued by the FASB in ASU 2018-16 issued in October 2018. The Company adopted this standard on June 2, 2019, the first day of its 2020 fiscal year, using a modified retrospective approach. The adoption of this standard did not have a significant impact on the Company’s consolidated financial statements.
In June 2018, the FASB issued ASU 2018-07, Compensation – Stock Compensation (Topic 718): Improvements to Nonemployee Share-Based Payment Accounting, which changes how companies account for
F-17
Table of Contents
Cole Haan, Inc.
Notes to Consolidated Financial Statements
certain aspects of share-based payment transactions for acquiring goods and services from nonemployees. For public entities, this guidance is effective for fiscal years beginning after December 15, 2019, and interim periods within fiscal years beginning after December 15, 2020. Early adoption is permitted, but no earlier than an entity’s adoption date of Topic 606. The Company is currently evaluating the impact of the adoption of this guidance on its consolidated financial statements.
In August 2018, the FASB issued ASU 2018-13, Fair Value Measurement (Topic 820): Disclosure Framework – Changes to the Disclosure Requirements for Fair Value Measurement, which changes the disclosure requirements for fair value measurements by removing, modifying, or adding certain disclosures. The amendments in this update are effective for all entities for fiscal years, and interim periods within those fiscal years, beginning after December 15, 2019. Early adoption is permitted. The Company is currently evaluating the impact of the adoption of this guidance on its consolidated financial statements.
In August 2018, the FASB issued ASU 2018-14, Compensation – Retirement Benefits – Defined Benefit Plans – General (Subtopic 715-20): Disclosure Framework – Changes to the Disclosure Requirements for Defined Benefit Plans, which changes the disclosure requirements for employers who sponsor defined benefit pension or other postretirement plans. For public entities, the amendments in this update are effective for fiscal years ending after December 15, 2021. Early adoption is permitted. The Company is currently evaluating the impact the adoption of this guidance will have on its consolidated financial statements.
In August 2018, the FASB issued ASU 2018-15, Intangibles – Goodwill and Other – Internal-Use Software (Subtopic 350-40): Customer’s Accounting for Implementation Costs Incurred in a Cloud Computing Arrangement that Is a Service Contract, which aligns the requirements for capitalizing implementation costs incurred in a hosting arrangement that is a service contract with the requirements for capitalizing implementation costs incurred to develop or obtain internal-use software. The accounting for the service element of a hosting arrangement that is a service contract is not affected. For public entities, the amendments in this update are effective for annual reporting periods beginning after December 15, 2020, and interim periods within annual periods beginning after December 15, 2021. Early adoption is permitted, including adoption in any interim period. The Company is currently evaluating the impact of the adoption of this guidance on its consolidated financial statements.
3. Revenue
Please refer to Note 2 for the impact of Topic 606 as of the adoption date. The following table presents the impact of the adoption of Topic 606 on the consolidated balance sheet at June 1, 2019 (in thousands):
| As Reported | Adjustments | Amounts Excluding Topic 606 Adoption |
||||||||||
| Accounts receivable, net |
$ | 43,460 | $ | 998 | $ | 44,458 | ||||||
| Prepaid expenses and other current assets |
12,971 | (1,892 | ) | 11,079 | ||||||||
| Total assets |
587,858 | (894 | ) | 586,964 | ||||||||
| Accrued liabilities |
78,859 | (894 | ) | 77,965 | ||||||||
| Total liabilities |
423,069 | (894 | ) | 422,175 | ||||||||
| Total liabilities and stockholders’ equity |
587,858 | (894 | ) | 586,964 | ||||||||
F-18
Table of Contents
Cole Haan, Inc.
Notes to Consolidated Financial Statements
Disaggregation of Revenue
The Company disaggregates revenue by geography, major product category and by types of customers. The following tables present revenue disaggregated by segment, major product category and types of customers for the year ended June 1, 2019 (in thousands):
| North America | International | Total | ||||||||||
| Revenue by: |
||||||||||||
| Footwear |
$ | 547,379 | $ | 85,328 | $ | 632,707 | ||||||
| Lifestyle accessories (a) |
40,795 | 13,074 | 53,869 | |||||||||
|
|
|
|
|
|
|
|||||||
| Total revenue |
$ | 588,174 | $ | 98,402 | $ | 686,576 | ||||||
|
|
|
|
|
|
|
|||||||
| Revenue by: |
||||||||||||
| Sales through direct to consumer |
$ | 341,820 | $ | 64,899 | $ | 406,719 | ||||||
| Sales to wholesale and distributor customers (b) |
246,354 | 33,503 | 279,857 | |||||||||
|
|
|
|
|
|
|
|||||||
| Total revenue |
$ | 588,174 | $ | 98,402 | $ | 686,576 | ||||||
|
|
|
|
|
|
|
|||||||
| (a) | Includes handbags, small leather goods, hosiery, shoe care, eyewear, outerwear, suiting and cold weather goods. |
| (b) | Includes licensing revenue. |
All consideration from contracts with customers is included in the amounts presented above.
Reserves for Customers’ Returns, Discounts and Claims
Consideration promised in the Company’s contracts with customers is variable due to anticipated reductions such as sales returns, discounts and miscellaneous claims from customers. The Company estimates the most likely amount it will be entitled to receive and records an anticipated reduction against revenue. The estimated cost of inventory for product returns is recorded in prepaid expenses and other current assets on the consolidated balance sheets. As of June 2, 2018 and June 1, 2019, the Company’s aggregate reserve balances for sales discounts, returns and miscellaneous claims were $3.9 million and $6.7 million, respectively. These reserves are presented as a reduction to accounts receivable on the consolidated balance sheets, with the exception of the allowances for retail sales returns of $1.4 million and $2.6 million, respectively, which are presented in accrued liabilities on the consolidated balance sheets.
A rollforward of the Company’s sales returns reserve of $2.3 million and $4.8 million for the years ended June 2, 2018 and June 1, 2019, respectively, was as follows (in thousands):
| Description |
Balance at Beginning of Period |
Additions Charged to Income |
Additions Charged to Other Accounts |
Adjustments and/or Deductions |
Balance at End of Period |
|||||||||||||||
| Sales Returns Reserve |
||||||||||||||||||||
| Year Ended: |
||||||||||||||||||||
| June 2, 2018 |
$ | 2,970 | $ | 30,647 | $ | — | $ | 31,348 | $ | 2,269 | ||||||||||
| June 1, 2019 |
2,269 | 58,998 | 1,423 | (a) | 57,870 | 4,820 | ||||||||||||||
| (a) | Due to the adoption of Topic 606. |
The Company does not provide express warranties on its products, but occasionally will repair or take a return in the event that a product does not meet the Company’s standards. The impact of such warranties is not
F-19
Table of Contents
Cole Haan, Inc.
Notes to Consolidated Financial Statements
material and is considered in the Company’s process for estimating a returns reserve. Actual returns, discounts and claims in any future period are inherently uncertain and thus may differ from estimates recorded. If actual or expected future returns, discounts or claims were significantly greater or lower than the reserves established, a reduction or increase to net revenue would be recorded in the period in which such determination was made.
Contract Liabilities
Contract liabilities consist of unredeemed gift card balances which are included in accrued liabilities on the consolidated balance sheets. Changes in the contract liabilities balances result from additional purchase and redemption of gift cards. Contract liabilities were $1.8 million as of June 1, 2019 and June 3, 2018. The Company recognized $0.8 million of revenue during the year ended June 1, 2019 that was recorded as a contract liability as of June 3, 2018.
Concentration
One of the Company’s wholesale customers accounted for 10.5% and 12.1% of revenue during the years ended June 2, 2018 and June 1, 2019, respectively, which is included in the Company’s North America segment.
Contract Costs
Management has determined that costs to fulfill a contract including sales commissions do not generate or enhance resources of the Company that will be used in satisfying (or in continuing to satisfy) performance obligations in the future. As the amortization period over which any asset would be recorded is less than one year, the Company has elected the practical expedient to expense such costs as incurred.
4. Goodwill and Intangible Assets, Net
Goodwill
The following table presents the changes in the carrying value of goodwill by segment for the years ended June 2, 2018 and June 1, 2019 (in thousands):
| International | North America |
Total | ||||||||||
| Balance as of June 3, 2017 |
$ | 49,207 | $ | 48,819 | $ | 98,026 | ||||||
| Foreign currency translation adjustment |
(23 | ) | — | (23 | ) | |||||||
|
|
|
|
|
|
|
|||||||
| Balance as of June 2, 2018 |
49,184 | 48,819 | 98,003 | |||||||||
| Foreign currency translation adjustment |
(2 | ) | — | (2 | ) | |||||||
|
|
|
|
|
|
|
|||||||
| Balance as of June 1, 2019 |
$ | 49,182 | $ | 48,819 | $ | 98,001 | ||||||
|
|
|
|
|
|
|
|||||||
The Company performed an annual test for goodwill impairment in the fourth quarter of the years ended June 2, 2018 and June 1, 2019, and determined that goodwill was not impaired.
F-20
Table of Contents
Cole Haan, Inc.
Notes to Consolidated Financial Statements
Intangible Assets
Intangible assets, net as of June 2, 2018 and June 1, 2019 consisted of (in thousands, except years):
| June 2, 2018 | June 1, 2019 | |||||||||||||||||||||||
| Gross Carrying Amount |
Accumulated Amortization |
Net Amount |
Gross Carrying Amount |
Accumulated Amortization |
Net Amount |
|||||||||||||||||||
| Indefinite-lived: |
||||||||||||||||||||||||
| Trademarks and tradenames |
$ | 175,000 | $ | — | $ | 175,000 | $ | 175,000 | $ | — | $ | 175,000 | ||||||||||||
| Definite-lived: |
||||||||||||||||||||||||
| Distributor relationships |
95,000 | (56,745 | ) | 38,255 | 95,000 | (65,671 | ) | 29,329 | ||||||||||||||||
| Favorable leases |
44,863 | (36,707 | ) | 8,156 | 44,863 | (38,239 | ) | 6,624 | ||||||||||||||||
| Other |
1,504 | (239 | ) | 1,265 | 2,295 | (455 | ) | 1,840 | ||||||||||||||||
|
|
|
|
|
|
|
|
|
|
|
|
|
|||||||||||||
| $ | 316,367 | $ | (93,691 | ) | $ | 222,676 | $ | 317,158 | $ | (104,365 | ) | $ | 212,793 | |||||||||||
|
|
|
|
|
|
|
|
|
|
|
|
|
|||||||||||||
Amortization expense is included in selling, general and administrative expenses in the consolidated statements of operations. The Company recognized $11.3 million and $10.7 million of amortization expense related to intangible assets during the years ended June 2, 2018 and June 1, 2019, respectively. The Company estimates that amortization expense related to definite-lived intangible assets will be as follows in each of the next five years and thereafter (in thousands):
| Year Ended | Estimated Future Amortization Expense |
|||
| 2020 |
$ | 9,969 | ||
| 2021 |
9,331 | |||
| 2022 |
8,657 | |||
| 2023 |
7,781 | |||
| 2024 |
1,097 | |||
| Thereafter |
958 | |||
|
|
|
|||
| $ | 37,793 | |||
|
|
|
|||
5. Inventories, Net
The Company’s inventory balances were substantially all finished goods as of June 2, 2018 and June 1, 2019. The Company’s allowance for slow-turning and obsolete inventory, based on lower of cost or net realizable value, was $3.1 million and $2.2 million as of June 2, 2018 and June 1, 2019, respectively.
6. Property and Equipment, Net
Property and equipment, net consisted of the following (in thousands):
| June 2, 2018 | June 1, 2019 | |||||||
| Leasehold improvements |
$ | 70,563 | $ | 73,041 | ||||
| Computer software and equipment |
42,016 | 51,575 | ||||||
| Furniture and fixtures |
24,818 | 25,380 | ||||||
| Construction in progress |
6,697 | 3,679 | ||||||
| Other |
9,615 | 9,383 | ||||||
|
|
|
|
|
|||||
| 153,709 | 163,058 | |||||||
| Less: Accumulated depreciation |
(91,684 | ) | (105,847 | ) | ||||
|
|
|
|
|
|||||
| $ | 62,025 | $ | 57,211 | |||||
|
|
|
|
|
|||||
F-21
Table of Contents
Cole Haan, Inc.
Notes to Consolidated Financial Statements
Depreciation expense related to property and equipment, net was $23.4 million and $21.7 million for the years ended June 2, 2018 and June 1, 2019, respectively.
The Company did not recognize any impairment charges related to property and equipment, net during the year ended June 2, 2018. The Company recorded a $0.2 million impairment charge related to property and equipment, net during the year ended June 1, 2019.
The Company had no capitalized interest costs in connection with construction in progress during the years ended June 2, 2018 and June 1, 2019.
7. Accrued Liabilities
Accrued liabilities consisted of the following (in thousands):
| June 2, 2018 | June 1, 2019 | |||||||
| Goods received not invoiced |
$ | 8,723 | $ | 27,253 | ||||
| Compensation and benefits |
13,156 | 22,251 | ||||||
| Advertising |
1,212 | 4,418 | ||||||
| Rent and tenant improvement allowances |
3,371 | 4,212 | ||||||
| Third party professional services |
2,178 | 4,206 | ||||||
| Allowances for retail sales returns |
1,414 | 2,632 | ||||||
| Freight |
827 | 2,432 | ||||||
| Gift card liability |
1,833 | 1,836 | ||||||
| Property and equipment, net |
2,261 | 1,534 | ||||||
| Other |
7,061 | 8,085 | ||||||
|
|
|
|
|
|||||
| $ | 42,036 | $ | 78,859 | |||||
|
|
|
|
|
|||||
Other accruals primarily consisted of accrued contract labor and e-commerce fees.
8. Income Taxes
On December 22, 2017, the TCJA was signed into United States law. The TCJA included a number of changes to existing tax law, including, among other things, a permanent reduction in the federal corporate income tax rate from a top marginal tax rate of 35% to a flat rate of 21%, effective as of January 1, 2018, as well as limitation of the deduction for net operating losses to 80% of annual taxable income and elimination of net operating loss carrybacks, in each case, for losses arising in taxable years beginning after December 31, 2017 (though any such net operating losses may be carried forward indefinitely). The TCJA also transitions international taxation from a worldwide system to a modified territorial system and includes base erosion prevention measures on non-U.S. earnings. These changes were effective as of January 1, 2018. The TCJA also includes a one-time mandatory deemed repatriation tax on accumulated foreign subsidiaries’ previously untaxed foreign earnings, referred to as the Transition Toll Tax.
Other provisions that became effective during the fiscal year ended June 1, 2019 included: an exemption from U.S. tax on dividends of future foreign earnings, expanded limitations on executive compensation and interest expense, and a minimum tax on certain foreign earnings in excess of 10% of the foreign subsidiaries tangible assets (i.e. global intangible low-taxed income or “GILTI”), and a benefit for foreign derived intangible income (“FDII”).
F-22
Table of Contents
Cole Haan, Inc.
Notes to Consolidated Financial Statements
In connection with the initial analysis of the impact of the TCJA, the Company recorded a benefit of approximately $23.2 million during the fiscal year ended June 2, 2018. This amount consisted of a net benefit of $11.4 million for the remeasurement of deferred taxes net of change in valuation allowance. An additional net benefit of $11.8 million was recorded as of June 2, 2018 for an additional reduction of the valuation allowance on U.S. net deferred tax assets.
In March 2018, the FASB issued ASU 2018-05 to address the application of GAAP in situations when a registrant does not have the necessary information available, prepared or analyzed (including computations) in reasonable detail to complete the accounting for certain income tax effects of the TCJA. As permitted by ASU 2018-05, the Company recorded provisional estimates of the impact of the TCJA for the year ended June 2, 2018. The Company completed its analysis during the fiscal year ended June 1, 2019 and determined there was no material adjustment to the income tax expense previously recorded. The Company recognized current tax related to GILTI during the fiscal year ended June 1, 2019 and will continue to account for GILTI as a period cost when incurred.
Income (loss) before income taxes is as follows (in thousands):
| Year Ended | ||||||||
| June 2, 2018 | June 1, 2019 | |||||||
| United States |
$ | (10,013 | ) | $ | 18,972 | |||
| Foreign |
14,848 | 18,932 | ||||||
|
|
|
|
|
|||||
| $ | 4,835 | $ | 37,904 | |||||
|
|
|
|
|
|||||
Income tax (benefit) expense is as follows (in thousands):
| Year Ended | ||||||||
| June 2, 2018 | June 1, 2019 | |||||||
| Current: |
||||||||
| United States |
||||||||
| Federal |
$ | (78 | ) | $ | (113 | ) | ||
| State |
122 | 90 | ||||||
| Foreign |
2,663 | 3,195 | ||||||
|
|
|
|
|
|||||
| 2,707 | 3,172 | |||||||
| Deferred: |
||||||||
| United States |
||||||||
| Federal |
(22,513 | ) | 2,204 | |||||
| State |
1,371 | 153 | ||||||
| Foreign |
167 | (762 | ) | |||||
|
|
|
|
|
|||||
| (20,975 | ) | 1,595 | ||||||
|
|
|
|
|
|||||
| $ | (18,268 | ) | $ | 4,767 | ||||
|
|
|
|
|
|||||
F-23
Table of Contents
Cole Haan, Inc.
Notes to Consolidated Financial Statements
Reconciliation from the U.S. statutory federal income tax rate to the effective income tax rate is as follows:
| June 2, 2018 | June 1, 2019 | |||||||
| Federal income tax rate |
29.2% | 21.0% | ||||||
| Change in U.S. federal tax rate |
134.4% | — | ||||||
| U.S state taxes, net of federal benefit |
(18.0% | ) | 4.6% | |||||
| Foreign earnings and related taxes |
(34.9% | ) | (4.2% | ) | ||||
| GILTI |
— | 2.2% | ||||||
| Change in uncertain tax positions |
0.1% | 0.2% | ||||||
| Change in valuation allowance |
(491.0% | ) | (11.2% | ) | ||||
| Other, net |
2.3% | — | ||||||
|
|
|
|
|
|||||
| Effective income tax rate |
(377.9% | ) | 12.6% | |||||
|
|
|
|
|
|||||
Deferred tax assets and (liabilities) are as follows (in thousands):
| June 2, 2018 | June 1, 2019 | |||||||
| Deferred tax assets: |
||||||||
| Inventories |
$ | 752 | $ | 856 | ||||
| Sales returns reserve |
1,028 | 1,202 | ||||||
| Deferred compensation |
951 | 1,212 | ||||||
| Reserves and accrued liabilities |
3,885 | 3,024 | ||||||
| Deferred rent |
3,476 | 3,554 | ||||||
| Property and equipment |
7,421 | 5,992 | ||||||
| Operating loss carryforwards |
22,703 | 18,418 | ||||||
| Other |
254 | 631 | ||||||
|
|
|
|
|
|||||
| Total deferred tax assets |
40,470 | 34,889 | ||||||
|
|
|
|
|
|||||
| Deferred tax liabilities: |
||||||||
| Intangible assets |
(21,534 | ) | (22,196 | ) | ||||
| Real estate leases |
(2,240 | ) | (1,803 | ) | ||||
| Other |
(207 | ) | (234 | ) | ||||
|
|
|
|
|
|||||
| Total deferred tax liabilities |
(23,981 | ) | (24,233 | ) | ||||
| Valuation allowance |
(27,297 | ) | (23,068 | ) | ||||
|
|
|
|
|
|||||
| Net deferred tax liabilities after valuation allowance |
$ | (10,808 | ) | $ | (12,412 | ) | ||
|
|
|
|
|
|||||
| Net non-current asset |
$ | 2,585 | $ | 3,338 | ||||
| Net non-current (liability) |
(13,393 | ) | (15,750 | ) | ||||
|
|
|
|
|
|||||
| $ | (10,808 | ) | $ | (12,412 | ) | |||
|
|
|
|
|
|||||
F-24
Table of Contents
Cole Haan, Inc.
Notes to Consolidated Financial Statements
Changes in the valuation allowance for deferred tax assets were as follows (in thousands):
| Year Ended | ||||||||
| June 2, 2018 | June 1, 2019 | |||||||
| Valuation allowance at beginning of year |
$ | 51,032 | $ | 27,297 | ||||
| Decreases recorded to income tax provision |
(11,948 | ) | (4,229 | ) | ||||
| Valuation allowance release recorded to income tax provision |
(11,787 | ) | — | |||||
|
|
|
|
|
|||||
| Valuation allowance at end of year |
$ | 27,297 | $ | 23,068 | ||||
|
|
|
|
|
|||||
The valuation allowance decreased by $4.2 million during fiscal year 2019, primarily as a result of utilization of net operating losses generated in jurisdictions in which the Company had concluded that its deferred tax assets were not more-likely-than-not realizable. The valuation allowance decreased by $23.7 million during fiscal year 2018, primarily as a result of the impact of the TCJA. The Company has assessed, on a jurisdictional basis, the available means of recovering deferred tax assets, including the ability to carry-back net operating losses, the existence of reversing temporary differences, the availability of tax planning strategies and available sources of future taxable income. It has also considered the ability to implement certain strategies that would, if necessary, be implemented to accelerate taxable income and use expiring deferred tax assets. The Company has historical losses and has concluded that maintaining a valuation allowance against certain U.S. Federal and state deferred tax assets is appropriate due to the negative evidence available at June 1, 2019. The Company continues to assess whether any significant changes in circumstances or assumptions have occurred that could materially affect the Company’s ability to realize deferred tax assets. The Company expects to release the valuation allowance when it has sufficient positive evidence, including but not limited to, the magnitude and duration of the Company’s historical losses as compared to recent profits within taxing jurisdictions to overcome such negative evidence.
As of June 1, 2019, the Company has U.S. federal net operating losses of approximately $73.9 million of which $73.3 million will begin to expire in fiscal 2035 and $0.6 million can be carried forward indefinitely. The Company has U.S. state net operating losses of $54.2 million which will begin to expire in fiscal 2025. Utilization of the U.S. federal and state net operating loss carryforwards may be subject to an annual limitation under Section 382 of the Internal Revenue Code of 1986, and corresponding provisions of state law, due to ownership changes that have occurred previously or that could occur in the future. These ownership changes may limit the amount of carryforwards that can be utilized annually to offset future taxable income or tax liabilities. In general, an ownership change, as defined by Section 382, results from transactions increasing the ownership of certain stockholders or public groups in the stock of a corporation by more than 50% over a three-year period. The Company believes that it has not had such an ownership change subsequent to the acquisition of Cole Haan.
As of June 1, 2019, the Company has foreign net operating losses of approximately $4.0 million that are available to reduce future income, of which $2.8 million will begin to expire in fiscal 2033 and $1.2 million can be carried forward indefinitely.
Through June 1, 2019, the Company had not provided deferred income taxes on the undistributed earnings of its foreign subsidiaries as such earnings were intended to be permanently reinvested outside the U.S. As of June 1, 2019, the Company had $55.2 million of undistributed earnings in its foreign subsidiaries. Although the Company does not intend to repatriate earnings of its foreign subsidiaries, the Company has determined that repatriation of such earnings would not result in a material income tax expense.
The Company had gross unrecognized tax benefits including interest and penalties of $3.1 million as of June 1, 2019, which could impact the effective tax rate if recognized.
F-25
Table of Contents
Cole Haan, Inc.
Notes to Consolidated Financial Statements
The following is a reconciliation of the changes in the gross balance of the unrecognized tax benefits, excluding interest and penalties (in thousands):
| June 2, 2018 | June 1, 2019 | |||||||
| Balance at the beginning of the year |
$ | 3,120 | $ | 2,904 | ||||
| Increases as a result of tax positions taken during a prior period |
— | 205 | ||||||
| Decreases as a result of tax positions taken during a prior period |
(115 | ) | (314 | ) | ||||
| Settlements |
— | — | ||||||
| Lapse of statute of limitations |
(101 | ) | (16 | ) | ||||
|
|
|
|
|
|||||
| Balance at the end of the year |
$ | 2,904 | $ | 2,779 | ||||
|
|
|
|
|
|||||
The change in the unrecognized tax benefits in the years ended June 2, 2018 and June 1, 2019 resulted primarily from the adjustment of certain tax attributes against which the unrecognized tax attributes were applied and from the expiration of the statute of limitations for U.S. state taxes for one prior year. The Company’s policy is to classify interest and penalties related to unrecognized tax benefits as a component of income tax expense (benefit) within the consolidated statements of operations. Accrued interest and penalties were $0.4 million and $0.3 million as of June 2, 2018 and June 1, 2019, respectively, and are not included in the amounts above. There was a nominal benefit included in tax expense for accrued interest and penalties during the years ended June 2, 2018 and June 1, 2019.
The Company conducts business globally and, as a result, files federal, state and foreign income tax returns in multiple jurisdictions. In the normal course of business, the Company is subject to examination by taxing authorities throughout the world. Tax years from November 11, 2012 through fiscal year ended June 1, 2019 remain open to U.S. federal, state or local income tax examinations as well as the Netherlands and Hong Kong. Tax years from fiscal year ended June 3, 2017 through June 1, 2019 remain open to examination in Japan. The IRS and other taxing authorities can also subject the Company’s net operating loss carryforwards to further review when such net operating loss carryforwards are utilized. The Company has identified an indirect tax position in the Netherlands that could be challenged by the local regulatory body, but the Company’s management believes there is a remote possibility that this will result in a financial loss.
Although the Company believes its tax estimates are appropriate, the final determination of tax examinations could result in favorable or unfavorable changes in estimates. The Company anticipates the settlement of tax examinations and the expiration of relevant statutes of limitations in the next twelve months could result in a decrease in its unrecognized tax benefits of an amount less than $0.1 million.
9. Debt
The components of Company’s outstanding debt consisted of the following (in thousands):
| June 2, 2018 | June 1, 2019 | |||||||
| Term loan facility |
$ | 304,306 | $ | 288,188 | ||||
| ABL credit facility |
— | — | ||||||
| Japanese credit facility |
— | — | ||||||
| Unamortized discount and debt issuance costs |
(3,459 | ) | (7,941 | ) | ||||
|
|
|
|
|
|||||
| Total debt |
300,847 | 280,247 | ||||||
| Less: Current portion of long-term debt |
(12,502 | ) | (7,250 | ) | ||||
|
|
|
|
|
|||||
| Total long-term debt |
$ | 288,345 | $ | 272,997 | ||||
|
|
|
|
|
|||||
F-26
Table of Contents
Cole Haan, Inc.
Notes to Consolidated Financial Statements
Asset-based Lending (“ABL”) Credit Facility
On February 1, 2013, the Company entered into an ABL credit agreement with Wells Fargo Bank (the “ABL credit facility”) that included a revolving line of credit up to $100.0 million. The ABL credit facility was amended on November 23, 2015 (Amendment No.1) and July 11, 2018 (Amendment No. 2), which resulted in (i) an increase in the borrowing capacity on its revolving line of credit from $100.0 million to $115.0 million, (ii) a reduction in the variable interest rate and base rate borrowings by 25 basis points and (iii) an extension of the maturity date to July 11, 2023.
Borrowings under the ABL credit facility are collateralized by a first lien on the Company’s accounts receivable and inventory, with the available borrowing capacity calculated based on existing accounts receivable, inventory and unrestricted cash balances less borrowings and reserves. The ABL credit facility allowed for either eurocurrency borrowings, bearing interest at the LIBOR rate plus a margin ranging from 1.25% to 1.75%, or base rate borrowings, bearing interest at a rate equal to the greater of (i) the prime rate as announced by Wells Fargo; (ii) the Federal Funds Rate plus 0.5%; and (iii) the one-month eurocurrency rate plus 1.0%, in each case plus a margin ranging from 0.25% to 0.75%.
The effective interest rate was 3.5% and 3.7% for the years ended June 2, 2018 and June 1, 2019, respectively. The Company recorded interest expense associated with the ABL credit facility, inclusive of amortization of debt issuance costs, of $1.4 million and $0.5 million for the years ended June 2, 2018 and June 1, 2019, respectively. Of the interest expense recorded, $0.2 million and $0.1 million related to non-cash interest expense for the years ended June 2, 2018 and June 1, 2019, respectively. The unused line of credit outstanding was $115.0 million as of both June 2, 2018 and June 1, 2019, of which $67.3 million and $103.0 million, respectively, was available for borrowing.
In connection with the ABL credit facility, the Company is subject to various financial reporting, financial and other covenants, including maintaining specific liquidity measurements. In addition, there are negative covenants, including certain restrictions on the Company’s ability to incur additional indebtedness, create liens, make investments, extend a loan or advance, consolidate or merge with other entities, dispose or acquire assets, enter into transactions with affiliates, pay dividends, and make prepayments.
Japanese Credit Facility
Cole Haan Japan maintains a credit facility with Mitsubishi UFJ Financial Group (“MUFG”) which includes a JPY 200 million overdraft facility bearing interest at the Japanese short-term prime rate and a JPY 100 million guarantee line with an annual interest rate of 0.35%. In April 2015, the guarantee line was increased to JPY 150 million. There were no outstanding borrowings on this credit facility as of June 2, 2018 and June 1, 2019.
Term Loan Facility
On February 1, 2013, the Company entered into a credit agreement with Jefferies Finance LLC (“Jefferies”) to borrow up $290.0 million (the “term loan”). The term loan was amended on September 26, 2013 to provide for additional borrowings of up to $31.4 million and a reduction to the minimum variable interest rate for eurocurrency borrowings from 5.75% to 5.00% (the “amended term loan”).
On February 12, 2019, the amended term loan was refinanced, which resulted in (i) the repayment of the existing outstanding balance as of $292.1 million and (ii) the Company entering into a new credit agreement with JPMorgan Chase Bank, N.A. in the amount of $290.0 million (the “refinanced term loan”). The refinanced term loan is a eurocurrency loan which bears interest at a variable rate based on LIBOR plus 5.50%. Principal payments of $1.8 million are due each quarter through February 2022 and increase to $3.6 million thereafter, with the remaining principal due on the maturity date of February 12, 2025.
F-27
Table of Contents
Cole Haan, Inc.
Notes to Consolidated Financial Statements
The Company assessed, on a creditor-by-creditor basis, whether the refinancing should be accounted for as an extinguishment or a modification for each creditor. For existing creditors who were repaid in conjunction with the refinanced term loan, the Company treated the refinancing as a debt extinguishment. For the existing creditors who continued to be creditors in the refinanced term loan, the Company treated the refinancing as a debt modification. Debt issuance costs of $9.1 million were incurred, of which $6.9 million was recorded as a direct reduction to long-term debt in the consolidated balance sheets, and $2.2 million was expensed as debt modification costs and recorded as a loss on debt modification in the consolidated statements of operations. The capitalized costs are being amortized to interest expense over the term of the agreement using the effective interest method.
The unamortized debt issuance costs on the original term loan and Amendment No.1 were $0.4 million and $1.4 million, respectively. Of these amounts, $0.2 million and $0.7 million, respectively, were expensed and are included in loss on debt modification in the consolidated statements of operations. The remaining $0.2 million and $0.7 million of debt issuance costs, respectively, on the term loan and amended term loan are being amortized to interest expense over the term of the refinanced term loan using the effective interest method.
The effective interest rate was 6.50% and 7.98% for the years ended June 2, 2018 and June 1, 2019, respectively. The Company recorded interest expense associated with the term loan, inclusive of the amortization of debt issuance costs and the amortization of the debt discount, of $18.5 million and $21.7 million for the years ended June 2, 2018 and June 1, 2019, respectively. Of the interest expense recorded, $1.7 million related to non-cash interest expense for each of the years ended June 2, 2018 and June 1, 2019.
Principal payments due on the outstanding debt in the next five fiscal years, excluding any potential payments based on excess cash flow levels, are as follows (in thousands):
| Year Ended | Term Loan Facility |
|||
| 2020 |
$ | 7,250 | ||
| 2021 |
7,250 | |||
| 2022 |
9,063 | |||
| 2023 |
14,500 | |||
| 2024 |
14,500 | |||
| Thereafter |
235,625 | |||
|
|
|
|||
| $ | 288,188 | |||
|
|
|
|||
As of June 2, 2018 and June 1, 2019, the Company was in compliance with all covenants.
10. Derivative Financial Instruments
Foreign Currency Contracts
The Company uses derivative financial instruments primarily in the management of its foreign currency exposure to the Japanese yen. The Company does not hold or issue derivative financial instruments for speculative or trading purposes. The Company manages foreign currency exposures through a risk management program that includes the use of derivative financial instruments consisting of foreign currency forward contracts, which are not designated as accounting hedges. The Company records all derivative instruments on its consolidated balance sheets at fair value. Changes in a derivative’s fair value through the settlement date are recognized in current period earnings within other (income), net.
F-28
Table of Contents
Cole Haan, Inc.
Notes to Consolidated Financial Statements
As of June 2, 2018 and June 1, 2019, the fair value of the Company’s foreign currency derivative instruments was $0.1 million and less than ($0.1) million, respectively, and was recorded within prepaid expenses and other current assets and accrued liabilities, respectively. Realized and unrealized gains and losses on the Company’s foreign exchange derivatives are included in other (income), net in the consolidated statements of operations and included within cash flows from operating activities in the consolidated statements of cash flows. During the years ended June 2, 2018 and June 1, 2019, the Company recognized realized gains of $0.1 million and $0.4 million, respectively, and unrealized gains of $0.1 million and unrealized losses of $0.2 million, respectively.
Interest Rate Swap
The Company maintains an interest rate swap to mitigate the variability in cash flows on its LIBOR-indexed term loan interest payments (“the Swap”). The Swap is for a notional amount of $100.0 million (reduced from $150.0 million on February 28, 2019) and requires the Company to pay the counterparty a fixed interest rate of 2.055% and receive from the counterparty a floating interest rate based on one-month LIBOR through its maturity in January 2020.
The Swap qualifies for hedge accounting treatment and is expected to be highly effective at reducing the risk associated with the exposure being hedged. The extent to which the Swap has been and is expected to remain highly effective in achieving offsetting changes in cash flows is assessed and documented by the Company on a quarterly basis. The effective portion of changes in the fair value of the Swap is recognized in accumulated other comprehensive loss. To the extent that the Swap is not considered to be effective, any change in its fair value related to such ineffectiveness is immediately recognized in earnings within other (income), net.
As of June 2, 2018, the fair value of the Swap was $0.8 million and was recorded in prepaid expenses and other current assets and other long-term assets. As of June 1, 2019, the fair value of the Swap was $0.1 million and was recorded within prepaid expenses and other current assets. During the years ended June 2, 2018 and June 1, 2019, the Company recognized unrealized gains of $1.7 million and unrealized losses of $0.3 million in accumulated other comprehensive loss, respectively, and reclassified losses of $0.9 million and gains of $0.3 million, respectively, from accumulated other comprehensive income (loss) to interest expense.
11. Fair Value Measurements
Assets and Liabilities Measured at Fair Value on a Recurring Basis
The fair values of the Company’s derivative instruments are based on quotes received from third-party banks and represent the estimated amount the Company would pay to terminate the agreements taking into consideration current foreign exchange rates and interest rates, volatilities and discount rates as well as the creditworthiness of the counterparties. These derivative instruments are considered to be Level 2.
F-29
Table of Contents
Cole Haan, Inc.
Notes to Consolidated Financial Statements
Financial Assets and Liabilities
The following tables present information about the fair value of the Company’s financial assets and liabilities as of June 2, 2018 and June 1, 2019 and indicate the level of the fair value hierarchy utilized to determine such fair values (in thousands):
| Fair Value Measurements as of June 2, 2018 Using: | ||||||||||||||||
| Level 1 | Level 2 | Level 3 | Total | |||||||||||||
| Assets: |
||||||||||||||||
| Interest rate swap |
$ | — | $ | 758 | $ | — | $ | 758 | ||||||||
| Foreign currency contracts |
— | 136 | — | 136 | ||||||||||||
|
|
|
|
|
|
|
|
|
|||||||||
| $ | — | $ | 894 | $ | — | $ | 894 | |||||||||
|
|
|
|
|
|
|
|
|
|||||||||
| Fair Value Measurements as of June 1, 2019 Using: | ||||||||||||||||
| Level 1 | Level 2 | Level 3 | Total | |||||||||||||
| Assets: |
||||||||||||||||
| Interest rate swap |
$ | — | $ | 128 | $ | — | $ | 128 | ||||||||
|
|
|
|
|
|
|
|
|
|||||||||
| $ | — | $ | 128 | $ | — | $ | 128 | |||||||||
|
|
|
|
|
|
|
|
|
|||||||||
| Liabilities: |
||||||||||||||||
| Foreign currency contracts |
$ | — | $ | (28 | ) | $ | — | $ | (28 | ) | ||||||
|
|
|
|
|
|
|
|
|
|||||||||
| $ | — | $ | (28 | ) | $ | — | $ | (28 | ) | |||||||
|
|
|
|
|
|
|
|
|
|||||||||
The Company values all of its debt, which is variable rate debt, at par as it approximates fair value. These inputs are considered to be Level 1. No other changes in the fair value are noted whether based on changes in credit rating or other factors.
Assets and Liabilities Measured at Fair Value on a Non-Recurring Basis
The Company measures certain non-financial assets and liabilities, including long-lived assets, at fair value on a non-recurring basis. See Note 2 for further information.
The Company believes that the carrying amounts of its other financial instruments, including cash, accounts receivable, and accounts payable approximates their carrying value due to the short-term maturities of these instruments.
During the years ended June 2, 2018 and June 1, 2019 there were no transfers between Level 1, Level 2 and Level 3.
12. Common Stock
As of June 2, 2018 and June 1, 2019, respectively, the Company’s certificate of incorporation, authorized the Company to issue 1,000 shares and 1,000 shares, respectively, of $0.01 par value common stock.
Each share of common stock entitles the holder to one vote for each share of common stock held. Common stockholders are entitled to receive dividends, as declared by the board of directors. Through June 2, 2018 and June 1, 2019, respectively, no cash dividends were declared or paid.
F-30
Table of Contents
Cole Haan, Inc.
Notes to Consolidated Financial Statements
13. Stock-Based Compensation
On February 1, 2013, Calceus Topco executed Unit Purchase and Grant agreements with certain of the Company’s employees. The agreements granted restricted share unit awards in the form of Class B Units. Calceus Topco is authorized to grant up to 1,000,000 of its Class B Units. As of June 1, 2019, there were an aggregate of 6,550 Class B Units available for future issuance. No Class B Units were granted to nonemployees.
The Class B Units were classified as equity awards under ASC 718 – Stock Compensation (“ASC 718”). Vesting of the Class B Units are contingent upon the occurrence of a liquidity event or a distribution of a specified amount to stockholders, both of which are performance conditions, and the achievement of a specified internal rate of return, which is a market condition. The awards can be granted in three separate tranches, each with differing internal rates of return required for vesting. Employees must remain continuously employed with Calceus Topco, or one of its subsidiaries, in order for the Class B Units to vest. If an employee is terminated or the Sponsor no longer holds any equity investment in Calceus Topco, all units that are not fully vested will be automatically terminated and forfeited for no consideration. Calceus Topco has the option to repurchase vested Class B Units of employees that have been terminated at fair value on the date of termination. Solely for purposes of the repurchase option, vested Class B Units shall include units that vest at a monthly rate in accordance with the individual award agreements (“Contingently Vested Units”). Contingently Vested Units were not deemed to have legally vested and are not entitled to any consideration until the market and performance conditions have been met.
As the equity classified Class B Units contain both performance and market conditions, compensation expense recognized for the awards will be equal to the grant date fair value of all awards for which the performance condition is met and the requisite service period is satisfied regardless of whether the market conditions are ultimately satisfied. No compensation expense will be recognized until satisfaction of the performance condition is deemed probable. During the years ended June 2, 2018 and June 1, 2019, no stock-based compensation expense was recognized. The Company assesses the probability of the performance vesting conditions being met at the end of each reporting period. If the performance condition becomes probable, the Company will recognize compensation cost based on the grant-date fair value of the awards.
The Company estimated the fair value using the Contingent Claims Analysis model. The following table presents, on a weighted average basis, the assumptions used in the Contingent Claims Analysis model to determine the grant-date fair value of stock options granted to employees:
| Year Ended | ||||||||
| June 2, 2018 | June 1, 2019 | |||||||
| Risk-free interest rate |
2.6 | % | 2.3 | % | ||||
| Expected term (in years) |
3.0 | 0.7 | ||||||
| Expected volatility |
55.0 | % | 40.0 | % | ||||
| Expected dividend yield |
— | % | — | % | ||||
The risk-free interest rate is interpolated from Constant Maturity Treasury rates as of the valuation date, with maturity equal to the time to liquidity date. The expected volatility is determined based on the historical volatilities of comparable publicly traded companies for the estimated time horizon equal to the time to the liquidity event.
The approximate unrecognized compensation cost as of June 2, 2018 and June 1, 2019 was $10.4 million and $14.8 million, respectively. Estimating fair value requires the use of significant judgment and actual results could differ from these estimates.
F-31
Table of Contents
Cole Haan, Inc.
Notes to Consolidated Financial Statements
The following summarizes the Class B Units discussed above:
| Units | Weighted Average Grant- Date Fair Value |
|||||||
| Class B Units Outstanding as of June 3, 2017 |
846,219 | $ | 11.91 | |||||
| Granted |
31,500 | 14.86 | ||||||
| Forfeited |
(10,765 | ) | 11.54 | |||||
|
|
|
|||||||
| Class B Units Outstanding as of June 2, 2018 |
866,954 | 12.02 | ||||||
|
|
|
|||||||
| Granted |
148,475 | 31.20 | ||||||
| Forfeited |
(21,979 | ) | 13.46 | |||||
|
|
|
|||||||
| Class B Units Outstanding as of June 1, 2019 |
993,450 | 14.85 | ||||||
|
|
|
|||||||
14. Commitments and Contingencies
Leases
The Company leases space for certain offices, warehouses and retail stores under leases having initial or remaining terms of more than one year, which extend through 2028. Many of these leases require that the Company pay taxes, maintenance, insurance, and certain other operating expenses applicable to leased properties, some of which are based upon various escalations, and, in the case of retail leases, the sales of the individual stores above base levels.
Rent expense was $48.5 million and $47.7 million during the years ended June 2, 2018 and June 1, 2019, respectively. The following table summarizes future minimum rental payments required under all noncancelable operating lease obligations as of June 1, 2019 (in thousands):
| Year Ended |
||||
| 2020 |
$ | 36,613 | ||
| 2021 |
33,480 | |||
| 2022 |
25,188 | |||
| 2023 |
23,910 | |||
| 2024 |
21,973 | |||
| Thereafter |
27,243 | |||
|
|
|
|||
| $ | 168,407 | |||
|
|
|
As of June 1,2019, the Company has an additional real estate lease that has not commenced, and therefore is excluded from the above table. The operating lease, which has a 6-year term, will commence in fiscal year 2020 and has future minimum lease payments totaling $1.4 million.
Legal Proceedings
In the ordinary course of its business, the Company is involved in various legal proceedings involving contractual and employment relationships, product liability claims, trademark rights, and a variety of other matters. The Company does not believe there are any pending legal proceedings that will have a material impact on the Company’s financial position or results of operations. The Company’s policy is to accrue for legal expenses as they become probable and reasonably estimable.
F-32
Table of Contents
Cole Haan, Inc.
Notes to Consolidated Financial Statements
15. Related Party Transactions
The Company utilized certain suppliers that were affiliates of the Company. Purchases from these suppliers were arms-length transactions, totaled $1.4 million and $1.3 million in the years ended June 2, 2018 and June 1, 2019, respectively, and were recorded within selling, general and administrative expense in the accompanying consolidated statements of operations. As of both June 2, 2018 and June 1, 2019, the outstanding amount payable to related party suppliers was $0.1 million, which was reflected in accounts payable on the consolidated balance sheets.
16. Benefit Plans
Profit Sharing Plan
The Company has a profit sharing plan available to certain employees based in the U.S. The terms of the plan call for contributions by the Company as determined by the board of directors. No contributions were made under this plan for the years ended June 2, 2018 and June 1, 2019.
401(k) Employee Savings Plan
The Company has a 401(k) employee savings plan available to eligible employees based in the U.S. The Company matches 100% of employee contributions up to 5% of eligible compensation. The Company’s 401(k) contribution expense, which is included in selling, general and administrative expense on the consolidated statements of operations, was $2.5 million and $2.0 million during the years ended June 2, 2018 and June 1, 2019, respectively.
Termination Indemnity Plan
The Company sponsors and/or contributes to a retirement allocation plan for local employees of its Japanese subsidiary (“Termination Indemnity Plan”), whereby eligible employees receive a lump sum calculated benefit associated with years of service when the employee is terminated as a result of retirement, resignation or involuntary termination. There are no plan assets held for the purpose of settling future distributions. On February 10, 2019, the Company froze the Termination Indemnity Plan to future participants. See Note 2 for additional information regarding the Company’s adoption of ASU 2017-07.
Actuarial Assumptions
The following table shows the principal actuarial assumptions used for calculating the Termination Indemnity Plan:
| Assumptions | June 2, 2018 | June 1, 2019 | ||||||
| Discount rate |
0.5 | % | 0.4 | % | ||||
| Rate of compensation increase |
2.0 | % | 2.0 | % | ||||
F-33
Table of Contents
Cole Haan, Inc.
Notes to Consolidated Financial Statements
Obligations and Funded Status
The following table sets forth the changes in the benefit obligations and the fair value assets for the Termination Indemnity Plan (in thousands):
| June 2, 2018 | June 1, 2019 | |||||||
| Benefit obligation, beginning of year |
$ | 2,498 | $ | 3,064 | ||||
| Change due to: |
||||||||
| Service cost with interest |
438 | 497 | ||||||
| Interest cost |
12 | 14 | ||||||
| Actuarial loss |
182 | 38 | ||||||
| Foreign currency translation adjustment |
23 | 3 | ||||||
| Actual benefits paid |
(89 | ) | (173 | ) | ||||
|
|
|
|
|
|||||
| Net change |
566 | 379 | ||||||
| Benefit obligation, end of year |
$ | 3,064 | $ | 3,443 | ||||
|
|
|
|
|
|||||
The Termination Indemnity Plan liabilities recognized in the Company’s consolidated balance sheets were as follows (in thousands):
| June 2, 2018 | June 1, 2019 | |||||||
| Long-term liabilities |
$ | 2,855 | $ | 3,214 | ||||
| Accrued liabilities |
209 | 229 | ||||||
|
|
|
|
|
|||||
| Total |
$ | 3,064 | $ | 3,443 | ||||
|
|
|
|
|
|||||
Components of Net Periodic Benefit Cost (Income)
Under ASU 2017-07, service cost is included with other employee compensation costs within operating income. The other components of net benefit cost are shown below separately and are outside operating income. Net periodic benefit cost (income) for the Company’s Termination Indemnity Plan consisted of the following (in thousands):
| Year Ended | ||||||||
| June 2, 2018 | June 1, 2019 | |||||||
| Service cost |
$ | 438 | $ | 497 | ||||
|
|
|
|
|
|||||
| Net periodic benefit cost reported in operating income |
438 | 497 | ||||||
| Interest cost |
13 | 14 | ||||||
| Amortization of net prior service cost |
15 | 15 | ||||||
| Amortization of net loss |
21 | 30 | ||||||
|
|
|
|
|
|||||
| Net periodic benefit cost reported outside operating income |
49 | 59 | ||||||
|
|
|
|
|
|||||
| Net periodic benefit cost reported in operations |
$ | 487 | $ | 556 | ||||
|
|
|
|
|
|||||
| Amortization of net prior service (cost) credit |
$ | (15 | ) | $ | (15 | ) | ||
| Amortization of net (loss) |
(21 | ) | (30 | ) | ||||
| Net prior service cost |
— | — | ||||||
| Net loss |
185 | 38 | ||||||
|
|
|
|
|
|||||
| Net periodic benefit cost (income) reported in other comprehensive income (loss) |
149 | (7 | ) | |||||
|
|
|
|
|
|||||
| Loss (income) recognized in comprehensive income |
$ | 636 | $ | 549 | ||||
|
|
|
|
|
|||||
F-34
Table of Contents
Cole Haan, Inc.
Notes to Consolidated Financial Statements
The following table provides the amounts in accumulated other comprehensive loss expected to be amortized into the Company’s fiscal year 2020 net periodic benefit cost (in thousands):
| Actuarial losses |
$ | 27 | ||
| Prior service costs |
15 | |||
|
|
|
|||
| Total |
$ | 42 | ||
|
|
|
The average amortization periods to be utilized for 2020 are 9.1 years.
Cash Flow
The expected future cash flows in respect of the Termination Indemnity Plan at June 1, 2019, was as follows (in thousands):
| Expected Future Benefit Payments |
||||
| 2020 |
$ | 229 | ||
| 2021 |
200 | |||
| 2022 |
183 | |||
| 2023 |
177 | |||
| 2024 |
449 | |||
| Thereafter |
2,205 | |||
The above table reflects the total plan benefits projected to be paid from the Termination Indemnity Plan under the current actuarial assumptions used for the calculation of the benefit obligation and, therefore, actual benefit payments may differ from projected benefit payments.
17. Segment Information
The Company has two reportable segments: North America and International. The accounting policies of the reportable segments are the same as those described in Note 2. The Company’s Chief Executive Officer has been identified as the CODM. The Company determined that its measure of segment profitability is Adjusted EBITDA of each reportable segment. Accordingly, the CODM evaluates performance and allocates resources based primarily on Segment Adjusted EBITDA. Segment Adjusted EBITDA excludes from net income: (i) interest expense, net; (ii) income tax (benefit) expense; (iii) depreciation and amortization, net; (iv) impairment charges; (v) (gain) loss on disposals of property and equipment; (vi) loss on debt modification and extinguishment; and (vii) other (income), net. The costs of all corporate departments that serve the respective segment are fully allocated. The Company does not allocate amounts reported below operating income to its reportable segments. The Company’s definition of Segment Adjusted EBITDA may not be comparable to similarly titled measures of other companies. Neither reportable segment is reliant on any single external customer.
F-35
Table of Contents
Cole Haan, Inc.
Notes to Consolidated Financial Statements
The Company determines the geographic location of revenue based on the location of its customers. The Company reports inventories, net at a segment level. The Company does not report total assets or total liabilities based on its operating segments. Revenue by segment was as follows (in thousands):
| Year Ended | ||||||||
| June 2, 2018 | June 1, 2019 | |||||||
| Revenue |
||||||||
| North America (a) |
$ | 506,904 | $ | 588,174 | ||||
| International |
94,662 | 98,402 | ||||||
|
|
|
|
|
|||||
| Total revenue |
$ | 601,566 | $ | 686,576 | ||||
|
|
|
|
|
|||||
| (a) | Includes digital commerce sales from colehaan.com to international customers. |
Inventories, net by segment was as follows (in thousands):
| June 2, 2018 | June 1, 2019 | |||||||
| Inventories, net |
||||||||
| North America |
$ | 70,332 | $ | 108,429 | ||||
| International |
9,317 | 10,805 | ||||||
|
|
|
|
|
|||||
| Total inventories, net |
$ | 79,649 | $ | 119,234 | ||||
|
|
|
|
|
|||||
The following tables provide a reconciliation of Adjusted EBITDA to net income attributable to common stockholders (in thousands):
| Year Ended | ||||||||
| June 2, 2018 | June 1, 2019 | |||||||
| Reportable Segments Adjusted EBITDA: |
||||||||
| North America |
$ | 47,764 | $ | 77,182 | ||||
| International |
12,308 | 17,592 | ||||||
|
|
|
|
|
|||||
| Total Reportable Segments Adjusted EBITDA |
60,072 | 94,774 | ||||||
| Reconciling items: |
||||||||
| Interest expense, net |
20,854 | 21,893 | ||||||
| Income tax (benefit) expense |
(18,268 | ) | 4,767 | |||||
| Depreciation and amortization, net (a) |
34,667 | 32,152 | ||||||
| Impairment charges |
— | 192 | ||||||
| (Gain) on disposals of property and equipment |
(68 | ) | (100 | ) | ||||
| Loss on debt modification and extinguishment |
— | 3,075 | ||||||
| Other (income), net |
(216 | ) | (342 | ) | ||||
|
|
|
|
|
|||||
| Net income attributable to common stockholders |
$ | 23,103 | $ | 33,137 | ||||
|
|
|
|
|
|||||
| (a) | Excludes amortization included in interest expense, net. |
F-36
Table of Contents
Cole Haan, Inc.
Notes to Consolidated Financial Statements
Revenue and Long-Lived Assets by Geographic Area
After allocation of revenue by segment, the Company’s largest concentration of revenue by geographic area is within the United States, Japan and Canada. The Company’s revenue by geographic area was as follows (in thousands):
| Year Ended | ||||||||
| June 2, 2018 | June 1, 2019 | |||||||
| Revenue |
||||||||
| United States |
$ | 488,136 | $ | 569,081 | ||||
| Japan |
68,068 | 68,523 | ||||||
| Canada |
12,919 | 12,649 | ||||||
| Rest of world |
32,443 | 36,323 | ||||||
|
|
|
|
|
|||||
| Total |
$ | 601,566 | $ | 686,576 | ||||
|
|
|
|
|
|||||
The Company’s largest concentrations of long-lived assets consist of property and equipment, such as its corporate offices, distribution facilities and retail stores primarily in the United States and Japan. The remainder of the Company’s long-lived assets include the Company’s definite-lived intangible assets primarily in United States. Long-lived assets attributable to operations in these countries, which are primarily composed of property and equipment, net and definite-lived intangibles, net were as follows (in thousands):
| June 2, 2018 | June 1, 2019 | |||||||
| Long-lived assets |
||||||||
| United States |
$ | 102,866 | $ | 88,662 | ||||
| Japan |
4,526 | 4,321 | ||||||
| Rest of world |
2,309 | 2,021 | ||||||
|
|
|
|
|
|||||
| Total |
$ | 109,701 | $ | 95,004 | ||||
|
|
|
|
|
|||||
18. Earnings Per Share
The following table summarizes the computation of basic and diluted net income per common stockholder for the years ended June 2, 2018 and June 1, 2019 (in thousands, except share and per share data):
| Year Ended | ||||||||
| June 2, 2018 | June 1, 2019 | |||||||
| Numerator |
||||||||
| Net income attributable to common stockholders, basic and diluted |
$ | 23,103 | $ | 33,137 | ||||
| Denominator |
||||||||
| Weighted average common shares outstanding, basic and diluted |
1,000 | 1,000 | ||||||
|
|
|
|
|
|||||
| Net income attributable to common stockholders, basic and diluted |
$ | 23,102.82 | $ | 33,136.97 | ||||
|
|
|
|
|
|||||
There were no potentially dilutive securities outstanding during the years ended June 2, 2018 and June 1, 2019.
F-37
Table of Contents
Cole Haan, Inc.
Notes to Consolidated Financial Statements
19. Condensed Financial Information of Registrant (Parent Company Only)
Cole Haan, Inc.
(Parent Company Only)
Condensed Balance Sheets
(in thousands, except share and per share amounts)
| June 2, 2018 | June 1, 2019 | |||||||
| Assets |
||||||||
| Investment in subsidiaries |
$ | 132,552 | $ | 164,789 | ||||
|
|
|
|
|
|||||
| Stockholders’ Equity |
||||||||
| Common stock, ($0.01 par value, 1,000 shares authorized, issued and outstanding as of June 2, 2018 and June 1, 2019) |
$ | — | $ | — | ||||
| Additional paid-in capital |
238,330 | 238,330 | ||||||
| Accumulated deficit |
(103,890 | ) | (70,753 | ) | ||||
| Accumulated other comprehensive loss |
(1,888 | ) | (2,788 | ) | ||||
|
|
|
|
|
|||||
| Total stockholders’ equity |
$ | 132,552 | $ | 164,789 | ||||
|
|
|
|
|
|||||
The accompanying note is an integral part of these condensed financial statements.
Cole Haan, Inc.
(Parent Company Only)
Condensed Statements of Operations
(in thousands, except share and per share amounts)
| Year Ended | ||||||||
| June 2, 2018 | June 1, 2019 | |||||||
| Equity in net income of subsidiaries |
$ | 23,103 | $ | 33,137 | ||||
|
|
|
|
|
|||||
| Net income |
$ | 23,103 | $ | 33,137 | ||||
|
|
|
|
|
|||||
| Earnings per share: |
||||||||
| Net income per share attributable to common stockholders—basic and diluted: |
$ | 23,102.82 | $ | 33,136.97 | ||||
| Weighted average common shares outstanding—basic and diluted: |
1,000 | 1,000 | ||||||
The accompanying note is an integral part of these condensed financial statements.
Cole Haan, Inc.
(Parent Company Only)
Condensed Statements of Comprehensive Income
(in thousands)
| Year Ended | ||||||||
| June 2, 2018 | June 1, 2019 | |||||||
| Net income |
$ | 23,103 | $ | 33,137 | ||||
| Equity in comprehensive income (loss) of subsidiaries |
2,739 | (900 | ) | |||||
|
|
|
|
|
|||||
| Comprehensive income |
$ | 25,842 | $ | 32,237 | ||||
|
|
|
|
|
|||||
The accompanying note is an integral part of these condensed financial statements.
F-38
Table of Contents
Cole Haan, Inc.
Notes to Consolidated Financial Statements
A statement of cash flows has not been presented as Cole Haan, Inc. (parent company) did not have any cash as of, or for the years ended June 2, 2018 and June 1, 2019.
Note to Condensed Financial Statements of Registrant (Parent Company Only)
Basis of Presentation
These condensed parent company-only financial statements have been prepared in accordance with Rule 12-04, Schedule I of Regulation S-X, as the restricted net assets of the subsidiaries of Cole Haan, Inc. (as defined in Rule 4-08(e)(3) of Regulation S-X) were $129.0 million as of June 1, 2019, which exceeded 25% of the consolidated net assets of the Company. The ability of the Company’s operating subsidiaries to pay dividends may be restricted due to the terms of the subsidiaries’ term loan and asset-based lending credit agreements, as defined in Note 9.
These condensed parent company financial statements have been prepared using the same accounting principles and policies described in the notes to the consolidated financial statements, with the only exception being that the parent company accounts for its subsidiaries using the equity method. These condensed financial statements should be read in conjunction with the consolidated financial statements and related notes thereto included elsewhere in this prospectus.
20. Subsequent Events
For its consolidated financial statements as of June 2, 2018 and June 1, 2019 and for the years then ended, the Company evaluated subsequent events through October 18, 2019, the date on which the financial statements were available to be issued.
F-39
Table of Contents
Condensed Consolidated Balance Sheets
(in thousands, except share and per share amounts)
(unaudited)
| June 1, 2019 | November 30, 2019 | |||||||
| Assets |
||||||||
| Current assets: |
||||||||
| Cash |
$ | 37,862 | $ | 10,786 | ||||
| Accounts receivable, net |
43,460 | 88,633 | ||||||
| Inventories, net |
119,234 | 131,948 | ||||||
| Prepaid expenses and other current assets |
12,971 | 12,442 | ||||||
|
|
|
|
|
|||||
| Total current assets |
213,527 | 243,809 | ||||||
| Property and equipment, net |
57,211 | 54,014 | ||||||
| Operating lease right of use assets |
— | 133,148 | ||||||
| Intangible assets, net |
212,793 | 202,407 | ||||||
| Goodwill |
98,001 | 98,008 | ||||||
| Other long-term assets |
2,988 | 2,305 | ||||||
| Deferred tax assets |
3,338 | 3,338 | ||||||
|
|
|
|
|
|||||
| Total assets |
$ | 587,858 | $ | 737,029 | ||||
|
|
|
|
|
|||||
| Liabilities and Stockholders’ Equity |
||||||||
| Current liabilities: |
||||||||
| Current portion of operating lease liabilities |
$ | — | $ | 30,504 | ||||
| Current portion of long-term debt |
7,250 | 7,250 | ||||||
| Accounts payable |
20,983 | 16,588 | ||||||
| Accrued liabilities |
78,859 | 86,561 | ||||||
| Income and other taxes payable |
5,448 | 3,491 | ||||||
|
|
|
|
|
|||||
| Total current liabilities |
112,540 | 144,394 | ||||||
| Long-term operating lease liabilities |
— | 110,978 | ||||||
| Long-term debt, net of discount and current portion |
272,997 | 270,146 | ||||||
| Other long-term liabilities |
21,782 | 6,133 | ||||||
| Deferred tax liabilities |
15,750 | 16,080 | ||||||
|
|
|
|
|
|||||
| Total liabilities |
423,069 | 547,731 | ||||||
| Commitments and contingencies (Note 11) |
||||||||
| Stockholders’ equity: |
||||||||
| Common stock, $0.01 par value; 1,000 shares authorized as of June 1, 2019 and November 30, 2019; 1,000 shares issued and outstanding as of June 1, 2019 and November 30, 2019 |
— | — | ||||||
| Additional paid-in capital |
238,330 | 238,330 | ||||||
| Accumulated deficit |
(70,753 | ) | (45,988 | ) | ||||
| Accumulated other comprehensive loss |
(2,788 | ) | (3,044 | ) | ||||
|
|
|
|
|
|||||
| Total stockholders’ equity |
164,789 | 189,298 | ||||||
|
|
|
|
|
|||||
| Total liabilities and stockholders’ equity |
$ | 587,858 | $ | 737,029 | ||||
|
|
|
|
|
|||||
The accompanying notes are an integral part of these condensed consolidated financial statements.
F-40
Table of Contents
Condensed Consolidated Statements of Operations
(in thousands, except share and per share amounts)
(unaudited)
| Twenty-Six-Week Period Ended | ||||||||
| December 1, 2018 | November 30, 2019 | |||||||
| Revenue |
$ | 351,462 | $ | 403,083 | ||||
| Cost of sales |
181,499 | 218,200 | ||||||
|
|
|
|
|
|||||
| Gross profit |
169,963 | 184,883 | ||||||
| Selling, general and administrative expense |
128,481 | 145,992 | ||||||
|
|
|
|
|
|||||
| Operating income |
41,482 | 38,891 | ||||||
| Interest expense, net |
10,344 | 12,106 | ||||||
| Other (income), net |
(189 | ) | (127 | ) | ||||
|
|
|
|
|
|||||
| Income before income taxes |
31,327 | 26,912 | ||||||
| Income tax expense |
1,878 | 2,147 | ||||||
|
|
|
|
|
|||||
| Net income attributable to common stockholders |
$ | 29,449 | $ | 24,765 | ||||
|
|
|
|
|
|||||
| Earnings per share: |
||||||||
| Net income per share attributable to common stockholders—basic and diluted |
$ | 29,448.90 | $ | 24,764.66 | ||||
| Weighted average common shares outstanding—basic and diluted |
1,000 | 1,000 | ||||||
The accompanying notes are an integral part of these condensed consolidated financial statements.
F-41
Table of Contents
Condensed Consolidated Statements of Comprehensive Income
(in thousands)
(unaudited)
| Twenty-Six-Week Period Ended | ||||||||
| December 1, 2018 | November 30, 2019 | |||||||
| Net income |
$ | 29,449 | $ | 24,765 | ||||
| Other comprehensive income (loss) |
||||||||
| Net changes related to interest rate swap |
||||||||
| Unrealized gains (losses) |
14 | (200 | ) | |||||
| Reclassification to interest expense |
(59 | ) | (57 | ) | ||||
|
|
|
|
|
|||||
| Total net changes related to interest rate swap |
(45 | ) | (257 | ) | ||||
| Foreign currency translation adjustments |
(758 | ) | 1 | |||||
|
|
|
|
|
|||||
| Other comprehensive (loss) |
(803 | ) | (256 | ) | ||||
|
|
|
|
|
|||||
| Comprehensive income |
$ | 28,646 | $ | 24,509 | ||||
|
|
|
|
|
|||||
The accompanying notes are an integral part of these condensed consolidated financial statements.
F-42
Table of Contents
Condensed Consolidated Statements of Stockholders’ Equity
(in thousands, except share amounts)
(unaudited)
| Common Stock | Additional Paid-in Capital |
Accumulated Deficit |
Accumulated Other Comprehensive Loss |
Total | ||||||||||||||||||||
| Shares | Amount | |||||||||||||||||||||||
| Balance as of June 2, 2018 |
1,000 | $ | — | $ | 238,330 | $ | (103,890 | ) | $ | (1,888 | ) | $ | 132,552 | |||||||||||
| Net income |
— | — | — | 6,921 | — | 6,921 | ||||||||||||||||||
| Other comprehensive loss |
— | — | — | — | (372 | ) | (372 | ) | ||||||||||||||||
|
|
|
|
|
|
|
|
|
|
|
|
|
|||||||||||||
| Balance as of September 1, 2018 |
1,000 | — | 238,330 | (96,969 | ) | (2,260 | ) | 139,101 | ||||||||||||||||
| Net income |
— | — | — | 22,528 | — | 22,528 | ||||||||||||||||||
| Other comprehensive loss |
— | — | — | — | (431 | ) | (431 | ) | ||||||||||||||||
|
|
|
|
|
|
|
|
|
|
|
|
|
|||||||||||||
| Balance as of December 1, 2018 |
1,000 | $ | — | $ | 238,330 | $ | (74,441 | ) | $ | (2,691 | ) | $ | 161,198 | |||||||||||
|
|
|
|
|
|
|
|
|
|
|
|
|
|||||||||||||
| Common Stock | Additional Paid-in Capital |
Accumulated Deficit |
Accumulated Other Comprehensive Loss |
Total | ||||||||||||||||||||
| Shares | Amount | |||||||||||||||||||||||
| Balance as of June 1, 2019 |
1,000 | $ | — | $ | 238,330 | $ | (70,753 | ) | $ | (2,788 | ) | $ | 164,789 | |||||||||||
| Net income |
— | — | — | 17,350 | — | 17,350 | ||||||||||||||||||
| Other comprehensive income |
— | — | — | — | 204 | 204 | ||||||||||||||||||
|
|
|
|
|
|
|
|
|
|
|
|
|
|||||||||||||
| Balance as of August 31, 2019 |
1,000 | — | 238,330 | (53,403 | ) | (2,584 | ) | 182,343 | ||||||||||||||||
| Net income |
— | — | — | 7,415 | — | 7,415 | ||||||||||||||||||
| Other comprehensive loss |
— | — | — | — | (460 | ) | (460 | ) | ||||||||||||||||
|
|
|
|
|
|
|
|
|
|
|
|
|
|||||||||||||
| Balance as of November 30, 2019 |
1,000 | $ | — | $ | 238,330 | $ | (45,988 | ) | $ | (3,044 | ) | $ | 189,298 | |||||||||||
|
|
|
|
|
|
|
|
|
|
|
|
|
|||||||||||||
The accompanying notes are an integral part of these condensed consolidated financial statements.
F-43
Table of Contents
Condensed Consolidated Statements of Cash Flows
(in thousands)
(unaudited)
| Twenty-Six-Week Period Ended | ||||||||
| December 1, 2018 | November 30, 2019 | |||||||
| Cash flows provided by (used in) operating activities: |
||||||||
| Net income |
$ | 29,449 | $ | 24,765 | ||||
| Adjustments to reconcile net income to net cash provided by operating activities: |
||||||||
| Depreciation and amortization |
16,657 | 15,831 | ||||||
| Provision for bad debt and sales returns reserve |
3,571 | 2,461 | ||||||
| Change in operating lease assets and liabilities |
35 | (304 | ) | |||||
| (Gain) on disposals of property and equipment |
(64 | ) | (6 | ) | ||||
| Inventory reserves |
(1,343 | ) | (591 | ) | ||||
| Deferred income taxes |
1,044 | 329 | ||||||
| Impairment charges |
— | 1,643 | ||||||
| Unrealized (gain) on derivatives |
(92 | ) | (118 | ) | ||||
| Changes in operating assets and liabilities: |
||||||||
| Accounts receivable |
(24,747 | ) | (45,001 | ) | ||||
| Inventories |
(13,426 | ) | (12,136 | ) | ||||
| Prepaid expenses and other current assets |
(924 | ) | (1,678 | ) | ||||
| Accounts payable |
(6,824 | ) | (3,820 | ) | ||||
| Accrued liabilities |
25,686 | 6,714 | ||||||
| Taxes payable |
1,334 | (1,976 | ) | |||||
| Other, net |
471 | 1,058 | ||||||
|
|
|
|
|
|||||
| Net cash provided by (used in) operating activities |
30,827 | (12,829 | ) | |||||
|
|
|
|
|
|||||
| Cash used in investing activities: |
||||||||
| Purchases of property and equipment |
(8,414 | ) | (10,107 | ) | ||||
| Other |
(214 | ) | (473 | ) | ||||
|
|
|
|
|
|||||
| Net cash used in investing activities |
(8,628 | ) | (10,580 | ) | ||||
|
|
|
|
|
|||||
| Cash used in financing activities: |
||||||||
| Repayment of borrowings |
(12,187 | ) | (3,625 | ) | ||||
| Financing costs |
(303 | ) | — | |||||
|
|
|
|
|
|||||
| Net cash used in financing activities |
(12,490 | ) | (3,625 | ) | ||||
| Effect of exchange rate changes on cash |
(177 | ) | (42 | ) | ||||
|
|
|
|
|
|||||
| Net increase (decrease) in cash |
9,532 | (27,076 | ) | |||||
| Cash, beginning of period |
23,476 | 37,862 | ||||||
|
|
|
|
|
|||||
| Cash, end of period |
$ | 33,008 | $ | 10,786 | ||||
|
|
|
|
|
|||||
| Supplemental cash flow information: |
||||||||
| Income taxes paid |
$ | 1,635 | $ | 3,752 | ||||
| Interest paid, net of amount capitalized |
9,422 | 11,246 | ||||||
| Noncash investing activities: |
||||||||
| Purchases of property and equipment included in accounts payable and accrued liabilities |
$ | 1,137 | $ | 1,957 | ||||
The accompanying notes are an integral part of these condensed consolidated financial statements.
F-44
Table of Contents
Notes to Unaudited Condensed Consolidated Financial Statements
1. Nature of the Business
Calceus Topco, Inc. (the “Company”) was incorporated in the state of Delaware on November 9, 2012 and is a portfolio company of Apax Partners (the “Sponsor”). The Company is the owner of Cole Haan LLC and its wholly owned subsidiaries, which were acquired on February 1, 2013. The Company changed its name to Cole Haan, Inc. (“Cole Haan”) on October 15, 2019. Cole Haan is a global lifestyle brand serving always-connected, active professionals with innovative footwear and lifestyle accessories, including bags and outerwear, in North America, as well as across regions in Asia, the Middle East, Europe, South America and Central America. Cole Haan generates its revenue by selling its products through a combination of digital, retail, wholesale, international distributor and licensed distribution channels to customers in the premium to moderate spectrum.
2. Summary of Significant Accounting Policies
Basis of Presentation
The accompanying interim condensed consolidated financial statements of Cole Haan are unaudited and, in the opinion of management, reflect all normal recurring adjustments considered necessary for a fair statement of the Company’s financial statements in accordance with accounting principles generally accepted in the United States of America (“GAAP”). The condensed consolidated financial statements include the accounts of the Company and its subsidiaries.
All significant intercompany transactions have been eliminated in consolidation. Certain information and footnote disclosures normally included in annual financial statements prepared in accordance with GAAP have been condensed or omitted, in accordance with the rules and regulations of the Securities and Exchange Commission (the “SEC”); however, the Company believes that its disclosures are adequate to make the information presented not misleading.
The Company’s fiscal year ends on the Saturday closest to May 31. The 2019 fiscal year, ending June 1, 2019, reflects a 52-week period, resulting in a twenty-six-week, six-month period as of December 1, 2018. The 2020 fiscal year, ending May 30, 2020, reflects a 52-week period, resulting in a twenty-six-week, six-month period as of November 30, 2019. The condensed consolidated balance sheet as of June 1, 2019 is derived from the audited consolidated balance sheet for the year then ended. The unaudited results of operations for the twenty-six-week period ended November 30, 2019 are not necessarily indicative of results to be expected for the year ended May 30, 2020.
These interim condensed consolidated financial statements should be read in conjunction with the consolidated financial statements for the year ended June 1, 2019 and the related notes thereto included elsewhere in this prospectus.
Recently Adopted Accounting Standards
The Company adopted Accounting Standards Update (“ASU”) No. 2016-02, Leases (Topic 842), on June 2, 2019, the first day of the 2020 fiscal year, using the modified retrospective method under ASU 2018-11, Leases (Topic 842), Targeted Improvements. In accordance with Topic 842, the Company did not recast comparative periods in transition to Topic 842 and instead reported comparative periods under Accounting Standards Codification Topic 840, Leases. Adoption of the new standard resulted in the initial recognition of right of use (“ROU”) assets and lease liabilities of approximately $134.6 million and $143.2 million, respectively, on the condensed consolidated balance sheet, with no significant change to the condensed consolidated statements of operations. There was no impact to accumulated deficit upon adoption. The Company elected the transition package of practical expedients, permitted within the new standard, which among other things, allowed the
F-45
Table of Contents
Cole Haan, Inc.
Notes to Unaudited Condensed Consolidated Financial Statements
Company to carry forward the historical lease classification. Specifically, the Company elected to not separate non-lease components from the lease components to which they relate and instead to combine them and account for them as a single lease component for all asset classes. The Company elected to not apply the recognition requirements to its short-term leases with a term of twelve months or less and which do not include a purchase option that the Company is reasonably certain to exercise. The Company recognizes the related lease payments on a straight-line basis over the lease term.
Operating leases are included in “Operating lease right of use assets”, “Current portion of operating lease liabilities”, and “Long-term operating lease liabilities” on the Company’s condensed consolidated balance sheet. ROU assets represent the Company’s right to use an underlying asset for the lease term, and lease liabilities represent the Company’s obligation to make lease payments arising from the lease. At the inception of the arrangement, the Company determines if an arrangement is a lease based on assessment of the terms and conditions of the contract. Operating lease ROU assets and lease liabilities are recognized at the commencement date based on the present value of the lease payments over the lease term. The Company’s lessors do not provide an implicit rate, nor is one readily available; therefore, the Company uses an incremental borrowing rate based on the information available at possession date in determining the present value of future lease payments. The incremental borrowing rate is calculated based on the Company’s collateralized borrowings, with suitable benchmarking to public corporate bond data for lease terms that are not captured by the Company’s borrowings. For the Company’s foreign incremental borrowing rates, the Company developed these rates from a group borrowing perspective, adjusted for the impact of foreign currency translation. The operating lease ROU asset also includes, for all leases that have commenced as of November 30, 2019, prepaid rent and intangible assets related to favorable lease terms offset by deferred rent and lease incentives. The lease term reflects options to extend or terminate the lease when it is reasonably certain that the Company will exercise such options. Lease expense is recognized on a straight-line basis over the lease term within “Selling, general and administrative expense” within the condensed consolidated statement of operations.
Impact of Topic 842 on Condensed Consolidated Balance Sheet Line Items
As a result of applying the new lease standard using the modified retrospective method, the following adjustments were made on the consolidated balance sheet as of June 2, 2019 (in thousands):
| As Reported June 1, 2019 |
Adjustments | As Adjusted June 2, 2019 |
||||||||||
| Prepaid expenses and other current assets |
$ | 12,971 | $ | (3,090 | )(a) | $ | 9,881 | |||||
| Operating lease ROU assets |
— | 134,592 | (b) | 134,592 | ||||||||
| Intangible assets, net |
212,793 | (6,624 | )(c) | 206,169 | ||||||||
|
|
|
|
|
|
|
|||||||
| Total assets |
$ | 225,764 | $ | 124,878 | $ | 350,642 | ||||||
|
|
|
|
|
|
|
|||||||
| Accrued liabilities |
$ | 78,859 | $ | (2,308 | )(d) | $ | 76,551 | |||||
| Other long-term liabilities |
21,782 | (16,021 | )(e) | 5,761 | ||||||||
| Total operating lease liabilities |
— | 143,207 | (f) | 143,207 | ||||||||
|
|
|
|
|
|
|
|||||||
| Total liabilities and stockholders’ equity |
$ | 100,641 | $ | 124,878 | $ | 225,519 | ||||||
|
|
|
|
|
|
|
|||||||
| (a) | Represents the reclassification of prepaid rent to operating lease ROU assets. |
| (b) | Represents the capitalization of operating lease ROU assets and reclassification of prepaid rent, intangible assets related to favorable lease terms acquired, lease incentives and deferred rent. |
| (c) | Represents the reclassification of intangible assets related to favorable lease terms acquired to operating lease ROU assets. |
F-46
Table of Contents
Cole Haan, Inc.
Notes to Unaudited Condensed Consolidated Financial Statements
| (d) | Represents the reclassification of short-term deferred rent and lease incentives to operating lease ROU assets. |
| (e) | Represents the reclassification of long-term deferred rent and lease incentives to operating lease ROU assets. |
| (f) | Represents the recognition of short-term and long-term operating lease liabilities. |
See Note 9 for additional information.
Recently Issued Accounting Standards
In June 2016, the Financial Accounting Standards Board (“FASB”) issued ASU No. 2016-13, Measurement of Credit Losses on Financial Instruments, which is intended to provide financial statement users with more decision-useful information about the expected credit losses on financial instruments and other commitments to extend credit held by a reporting entity at each reporting date. ASU 2016-13 replaces the incurred loss impairment methodology with a methodology that reflects expected credit losses and requires consideration of a broader range of reasonable and supportable information to inform credit loss estimates. In November 2019, the FASB issued ASU No. 2019-11, Codification Improvements to Topic 326, Financial Instruments – Credit Losses. For public entities, this guidance is effective for fiscal years beginning after December 15, 2020, and interim periods within fiscal years beginning after December 15, 2021. Early adoption is permitted. The Company is currently evaluating the effect the adoption will have on its consolidated financial statements.
In January 2017, the FASB issued ASU 2017-04, Intangibles-Goodwill and Other (Topic 350): Simplifying the Test for Goodwill Impairment, which is intended to simplify the subsequent measurement and impairment of goodwill. The amendment simplifies the complexity of evaluating goodwill for impairment by eliminating the second step of the impairment test. As amended, the goodwill impairment test will consist of one step comparing the fair value of a reporting unit with its carrying amount. Under the simplified model, a goodwill impairment is calculated as the difference between the carrying amount of the reporting unit and its fair value, but not to exceed the carrying amount of goodwill allocated to that reporting unit. For public entities, the amendment is effective for fiscal years beginning after December 15, 2019. Early adoption is permitted and must be applied prospectively. The Company is currently evaluating the impact of the adoption of this guidance on its consolidated financial statements.
In June 2018, the FASB issued ASU 2018-07, Compensation – Stock Compensation (Topic 718): Improvements to Nonemployee Share-Based Payment Accounting, which changes how companies account for certain aspects of share-based payment transactions for acquiring goods and services from nonemployees. For public entities, this guidance is effective for fiscal years beginning after December 15, 2019, and interim periods within fiscal years beginning after December 15, 2020. Early adoption is permitted, but no earlier than an entity’s adoption date of Topic 606. The Company is currently evaluating the impact of the adoption of this guidance on its consolidated financial statements.
In August 2018, the FASB issued ASU 2018-13, Fair Value Measurement (Topic 820): Disclosure Framework – Changes to the Disclosure Requirements for Fair Value Measurement, which changes the disclosure requirements for fair value measurements by removing, modifying, or adding certain disclosures. The amendments in this update are effective for all entities for fiscal years, and interim periods within those fiscal years, beginning after December 15, 2019. Early adoption is permitted. The Company is currently evaluating the impact of the adoption of this guidance on its consolidated financial statements.
In August 2018, the FASB issued ASU 2018-14, Compensation – Retirement Benefits – Defined Benefit Plans – General (Subtopic 715-20): Disclosure Framework – Changes to the Disclosure Requirements for Defined Benefit Plans, which changes the disclosure requirements for employers who sponsor defined benefit
F-47
Table of Contents
Cole Haan, Inc.
Notes to Unaudited Condensed Consolidated Financial Statements
pension or other postretirement plans. For public entities, the amendments in this update are effective for fiscal years ending after December 15, 2021. Early adoption is permitted. The Company is currently evaluating the impact the adoption of this guidance will have on its consolidated financial statements.
In August 2018, the FASB issued ASU 2018-15, Intangibles – Goodwill and Other – Internal-Use Software (Subtopic 350-40): Customer’s Accounting for Implementation Costs Incurred in a Cloud Computing Arrangement that Is a Service Contract, which aligns the requirements for capitalizing implementation costs incurred in a hosting arrangement that is a service contract with the requirements for capitalizing implementation costs incurred to develop or obtain internal-use software. The accounting for the service element of a hosting arrangement that is a service contract is not affected. For public entities, the amendments in this update are effective for annual reporting periods beginning after December 15, 2020, and interim periods within annual periods beginning after December 15, 2021. Early adoption is permitted, including adoption in any interim period. The Company is currently evaluating the impact of the adoption of this guidance on its consolidated financial statements.
In December 2019, the FASB issued ASU 2019-12, Income Taxes (Topic 740): Simplifying the Accounting for Income Taxes, which removes certain exceptions and simplifies the accounting for income taxes. The amendments in this update are effective for fiscal years, and interim periods within those fiscal years, beginning after December 15, 2020. The amendments in this guidance related to separate financial statements of legal entities that are not subject to tax should be applied on a retrospective basis for all periods presented. The amendments related to franchise taxes that are partially based on income should be applied on either a retrospective basis for all periods presented or a modified retrospective basis through a cumulative-effect adjustment to retained earnings as of the beginning of the fiscal year of adoption. All other amendments should be applied on a prospective basis. The Company is currently evaluating the impact of the adoption of this guidance on its consolidated financial statements.
3. Revenue
The Company disaggregates revenue by geography, major product category and by types of customers. The following tables present revenue disaggregated by segment, major product category and types of customers for the twenty-six-week periods ended December 1, 2018 and November 30, 2019 (in thousands):
| Twenty-Six-Week Period Ended December 1, 2018 | ||||||||||||
| North America |
International | Total | ||||||||||
| Revenue by: |
||||||||||||
| Footwear |
$ | 282,996 | $ | 39,969 | $ | 322,965 | ||||||
| Lifestyle accessories (a) |
21,608 | 6,889 | 28,497 | |||||||||
|
|
|
|
|
|
|
|||||||
| Total revenue |
$ | 304,604 | $ | 46,858 | $ | 351,462 | ||||||
|
|
|
|
|
|
|
|||||||
| Revenue by: |
||||||||||||
| Sales through direct to consumer |
$ | 176,840 | $ | 32,063 | $ | 208,903 | ||||||
| Sales to wholesale and distributor customers (b) |
127,764 | 14,795 | 142,559 | |||||||||
|
|
|
|
|
|
|
|||||||
| Total revenue |
$ | 304,604 | $ | 46,858 | $ | 351,462 | ||||||
|
|
|
|
|
|
|
|||||||
| (a) | Includes handbags, small leather goods, hosiery, shoe care, eyewear, outerwear, suiting and cold weather goods. |
| (b) | Includes licensing revenue. |
F-48
Table of Contents
Cole Haan, Inc.
Notes to Unaudited Condensed Consolidated Financial Statements
| Twenty-Six-Week Period Ended November 30, 2019 | ||||||||||||
| North America |
International | Total | ||||||||||
| Revenue by: |
||||||||||||
| Footwear |
$ | 327,668 | $ | 50,621 | $ | 378,289 | ||||||
| Lifestyle accessories (a) |
19,321 | 5,473 | 24,794 | |||||||||
|
|
|
|
|
|
|
|||||||
| Total revenue |
$ | 346,989 | $ | 56,094 | $ | 403,083 | ||||||
|
|
|
|
|
|
|
|||||||
| Revenue by: |
||||||||||||
| Sales through direct to consumer |
$ | 185,393 | $ | 33,017 | $ | 218,410 | ||||||
| Sales to wholesale and distributor customers (b) |
161,596 | 23,077 | 184,673 | |||||||||
|
|
|
|
|
|
|
|||||||
| Total revenue |
$ | 346,989 | $ | 56,094 | $ | 403,083 | ||||||
|
|
|
|
|
|
|
|||||||
| (a) | Includes handbags, small leather goods, hosiery, shoe care, eyewear, outerwear, suiting and cold weather goods. |
| (b) | Includes licensing revenue. |
All consideration from contracts with customers is included in the amounts presented above.
4. Inventories, Net
The Company’s inventory balances were substantially all finished goods as of June 1, 2019 and November 30, 2019. The Company’s allowance for slow-turning and obsolete inventory, based on lower of cost or net realizable value, was $2.2 million and $1.6 million as of June 1, 2019 and November 30, 2019, respectively.
5. Income Taxes
The effective income tax rate is based on estimated income from continuing operations for the year as well as discrete adjustments, if any, in the applicable quarterly periods. Potential discrete adjustments include tax charges, changes in tax legislation, settlements of tax audits and changes in uncertain tax positions, among others.
The effective rates for income taxes were 6.0% and 8.0% for the twenty-six-week periods ended December 1, 2018 and November 30, 2019, respectively. During the twenty-six-week period ended November 30, 2019, the Company continued to record a valuation allowance on deferred tax assets in certain jurisdictions due to the combination of its history of pretax losses and its inability to carry back tax losses or credits. The Company continues to assess whether any significant changes in circumstances or assumptions have occurred that could materially affect the Company’s ability to realize deferred tax assets. The Company expects to release the valuation allowance when it has sufficient positive evidence, including but not limited to, the magnitude and duration of the Company’s historical losses as compared to recent profits within taxing jurisdictions to overcome such negative evidence.
The Company had gross unrecognized tax benefits including interest and penalties of $3.3 million as of November 30, 2019, which could impact the effective tax rate if recognized. The change in the unrecognized tax benefits for the twenty-six-week period ended November 30, 2019 resulted primarily from the adjustment of certain tax attributes against which the unrecognized tax benefits were applied and current period income in certain jurisdictions against which net operating losses may not be available. Although the Company believes its tax estimates are appropriate, the final determination of tax examinations could result in favorable or unfavorable
F-49
Table of Contents
Cole Haan, Inc.
Notes to Unaudited Condensed Consolidated Financial Statements
changes in estimates. The Company anticipates the settlement of tax examinations and the expiration of relevant statutes of limitations in the next twelve months could result in a decrease in its unrecognized tax benefits of approximately $0.1 million.
6. Debt
The components of the Company’s outstanding debt consisted of the following (in thousands):
| June 1, 2019 | November 30, 2019 | |||||||
| Term loan facility |
$ | 288,188 | $ | 284,563 | ||||
| ABL credit facility |
— | — | ||||||
| Japanese credit facility |
— | — | ||||||
| Unamortized discount and debt issuance costs |
(7,941 | ) | (7,167 | ) | ||||
|
|
|
|
|
|||||
| Total debt |
280,247 | 277,396 | ||||||
| Less: Current portion of long-term debt |
(7,250 | ) | (7,250 | ) | ||||
|
|
|
|
|
|||||
| Total long-term debt |
$ | 272,997 | $ | 270,146 | ||||
|
|
|
|
|
|||||
The Company recorded interest expense of $10.3 million and $12.1 million for the twenty-six-week periods ended December 1, 2018 and November 30, 2019, respectively, of which $1.0 million and $0.8 million was non-cash for the twenty-six-week periods ended December 1, 2018 and November 30, 2019, respectively.
The unused line of credit outstanding was $115.0 million as of both June 1, 2019 and November 30, 2019, of which $103.0 million and $115.0 million, respectively, was available for borrowing.
As of June 1, 2019 and November 30, 2019, the Company was in compliance with all covenants.
7. Derivative Financial Instruments
Foreign Currency Contracts
The Company uses derivative financial instruments primarily in the management of its foreign currency exposure to the Japanese yen. The Company does not hold or issue derivative financial instruments for speculative or trading purposes. The Company manages foreign currency exposures through a risk management program that includes the use of derivative financial instruments consisting of foreign currency forward contracts, which are not designated as accounting hedges. The Company records all derivative instruments on its condensed consolidated balance sheets at fair value. Changes in a derivative’s fair value through the settlement date are recognized in current period earnings within other (income), net.
As of June 1, 2019, and November 30, 2019, the fair value of the Company’s foreign currency derivative instruments was less than $(0.1) million and $0.1 million, respectively, and was recorded within accrued liabilities and prepaid expenses and other current assets, respectively. Realized and unrealized gains and losses on the Company’s foreign exchange derivatives are included in other (income), net in the condensed consolidated statements of operations and included within cash flows from operating activities in the condensed consolidated statements of cash flows. During the twenty-six-week periods ended December 1, 2018 and November 30, 2019, the Company recognized realized gains of $0.2 million and $0.1 million, respectively, and unrealized gains of $0.1 million in each period.
F-50
Table of Contents
Cole Haan, Inc.
Notes to Unaudited Condensed Consolidated Financial Statements
Interest Rate Swap
The Company maintains an interest rate swap to mitigate the variability in cash flows on its LIBOR-indexed term loan interest payments (“the Swap”). The Swap is for a notional amount of $100.0 million (reduced from $150.0 million on February 28, 2019) and requires the Company to pay the counterparty a fixed interest rate of 2.055% and receive from the counterparty a floating interest rate based on one-month LIBOR through its maturity in January 2020.
The Swap qualifies for hedge accounting treatment and is expected to be highly effective at reducing the risk associated with the exposure being hedged. The extent to which the Swap has been and is expected to remain highly effective in achieving offsetting changes in cash flows is assessed and documented by the Company on a quarterly basis. Following the Company’s adoption of ASU 2017-12, Derivatives and Hedging (Topic 815): Targeted Improvements to Accounting for Hedging Activities, on June 2, 2019, all changes in the fair value of the Swap are recognized in accumulated other comprehensive loss.
As of June 1, 2019, the fair value of the Swap was $0.1 million and was recorded in prepaid expenses and other current assets and other long-term assets. As of November 30, 2019, the fair value of the Swap was $(0.1) million and was recorded within accrued liabilities. During the twenty-six-week periods ended December 1, 2018 and November 30, 2019, the Company recognized gains of $0.1 million and losses of $0.1 million in accumulated other comprehensive loss, respectively, and reclassified unrealized gains of $0.1 million in each period from accumulated other comprehensive loss to interest expense.
8. Stock-Based Compensation
The approximate unrecognized compensation cost as of June 1, 2019 and November 30, 2019 was $14.8 million and $14.7 million, respectively. Estimating fair value requires the use of significant judgment and actual results could differ from this estimate.
During the twenty-six-week period ended November 30, 2019, no Class B Units were granted or vested and 719 shares were forfeited. The weighted average grant-date fair value was $14.85 per share as of June 1, 2019 and November 30, 2019.
9. Operating Leases
The Company leases space for offices, warehouses and retail stores with remaining lease terms ranging from one to nine years. The Company also leases equipment. Most of the Company’s leases are retail store operating leases with ten-year terms and options to extend for one or more five-year periods. The exercise of both lease renewal and termination options is at the Company’s sole discretion and is not reasonably certain at lease commencement.
While the majority of leases have fixed payment schedules, some leases have variable lease payments based on a percentage of retail sales over contractual minimum levels. In addition, for real estate leases, the Company is generally required to pay insurance, real estate taxes and other operating expenses including common area maintenance based on proportionate share of area. Variable lease payments are recognized in the period in which the obligation for those payments is incurred. The operating lease ROU assets also reflects any prepaid lease payments and intangible assets related to favorable lease terms and is reduced by lease incentives received and deferred rent. Rent expense is recognized on a straight-line basis over the lease term.
F-51
Table of Contents
Cole Haan, Inc.
Notes to Unaudited Condensed Consolidated Financial Statements
Supplemental balance sheet information related to leases as of November 30, 2019 is as follows:
| November 30, 2019 | ||||
| Weighted-average remaining lease term (in years) |
5.0 | |||
| Weighted-average discount rate |
5.68 | % | ||
Finance leases are not significant and are included in property and equipment, net within the condensed consolidated balance sheets. Related obligations are included in other long-term liabilities on the condensed consolidated balance sheets.
The following table is a summary of the Company’s components of net lease cost for the twenty-six-week period ended November 30, 2019 (in thousands):
| Twenty-Six-Week Period Ended November 30, 2019 |
||||
| Operating lease cost |
$ | 21,046 | ||
| Variable lease cost (a) |
9,259 | |||
| Short term lease cost |
279 | |||
|
|
|
|||
| Total lease cost (b) |
$ | 30,584 | ||
|
|
|
|||
| (a) | Short-term variable lease expense is included in variable lease cost. |
| (b) | All lease costs are classified in selling, general and administrative expense on the condensed consolidated statement of operations. |
Supplemental cash flow information related to leases for the twenty-six-week period ended November 30, 2019 is as follows (in thousands):
| Twenty-Six-Week Period Ended |
||||
| November 30, 2019 | ||||
| Cash paid for amounts included in the measurement of lease liabilities: |
||||
| Operating cash flows paid for operating leases |
$ | 17,935 | ||
| ROU assets obtained in exchange for operating lease liabilities |
15,448 | |||
The following table summarizes the future lease payments under noncancelable operating leases as of November 30, 2019 (in thousands):
| Year Ended | Future Lease Payments |
|||
| Remainder of fiscal year 2020 |
$ | 17,665 | ||
| 2021 |
37,832 | |||
| 2022 |
28,995 | |||
| 2023 |
26,086 | |||
| 2024 |
23,985 | |||
| Thereafter |
29,496 | |||
|
|
|
|||
| Total lease payments (a) |
164,059 | |||
| Less: imputed interest (b) |
(22,577 | ) | ||
|
|
|
|||
| Total lease liabilities (c) |
$ | 141,482 | ||
|
|
|
|||
| (a) | Represents operating lease payments for leases that have commenced as of November 30, 2019 and include options to extend lease terms that are now deemed reasonably certain of being exercised according to the Company’s lease accounting policy. |
F-52
Table of Contents
Cole Haan, Inc.
Notes to Unaudited Condensed Consolidated Financial Statements
| (b) | Calculated using the incremental borrowing rate for each lease. |
| (c) | Total lease liabilities are separated on the condensed consolidated balance sheets between current portion of operating lease liabilities and long-term operating lease liabilities. |
As of November 30, 2019, the Company has two additional real estate operating leases that have not commenced, and therefore are excluded from the above tables. These operating leases, which have 5-6-year lease terms, will commence in fiscal year 2020 and have a total lease obligation of $2.1 million.
The following table represents the Company’s lease commitments under its previous presentation of its operating lease agreements as of June 1, 2019 (in thousands):
| Year Ended | Future Minimum Lease Payments |
|||
| 2020 |
$ | 36,613 | ||
| 2021 |
33,480 | |||
| 2022 |
25,188 | |||
| 2023 |
23,910 | |||
| 2024 |
21,973 | |||
| Thereafter |
27,243 | |||
|
|
|
|||
| $ | 168,407 | |||
|
|
|
|||
10. Fair Value Measurements
Assets and Liabilities Measured at Fair Value on a Recurring Basis
The fair values of the Company’s derivative instruments are based on quotes received from third-party banks and represent the estimated amount the Company would pay to terminate the agreements taking into consideration current foreign exchange rates and interest rates, volatilities and discount rates as well as the creditworthiness of the counterparties. These derivative instruments are considered to be Level 2.
Financial Assets and Liabilities
The following tables present information about the fair value of the Company’s financial assets and liabilities as of June 1, 2019 and November 30, 2019 and indicate the level of the fair value hierarchy utilized to determine such fair values (in thousands):
| Fair Value Measurements as of June 1, 2019 | ||||||||||||||||
| Level 1 | Level 2 | Level 3 | Total | |||||||||||||
| Assets: |
||||||||||||||||
| Interest rate swap |
$ | — | $ | 128 | $ | — | $ | 128 | ||||||||
|
|
|
|
|
|
|
|
|
|||||||||
| $ | — | $ | 128 | $ | — | $ | 128 | |||||||||
|
|
|
|
|
|
|
|
|
|||||||||
| Liabilities: |
||||||||||||||||
| Foreign currency contracts |
$ | — | $ | (28 | ) | $ | — | $ | (28 | ) | ||||||
|
|
|
|
|
|
|
|
|
|||||||||
| $ | — | $ | (28 | ) | $ | — | $ | (28 | ) | |||||||
|
|
|
|
|
|
|
|
|
|||||||||
F-53
Table of Contents
Cole Haan, Inc.
Notes to Unaudited Condensed Consolidated Financial Statements
| Fair Value Measurements as of November 30, 2019 | ||||||||||||||||
| Level 1 | Level 2 | Level 3 | Total | |||||||||||||
| Assets: |
||||||||||||||||
| Foreign currency contracts |
$ | — | $ | 90 | $ | — | $ | 90 | ||||||||
|
|
|
|
|
|
|
|
|
|||||||||
| $ | — | $ | 90 | $ | — | $ | 90 | |||||||||
|
|
|
|
|
|
|
|
|
|||||||||
| Liabilities: |
||||||||||||||||
| Interest rate swap |
$ | — | $ | (71 | ) | $ | — | $ | (71 | ) | ||||||
|
|
|
|
|
|
|
|
|
|||||||||
| $ | — | $ | (71 | ) | $ | — | $ | (71 | ) | |||||||
|
|
|
|
|
|
|
|
|
|||||||||
The Company values all of its debt, which is variable rate debt, at par as it approximates fair value. These inputs are considered to be Level 1. No other changes in the fair value are noted whether based on changes in credit rating or other factors.
Assets and Liabilities Measured at Fair Value on a Non-Recurring Basis
The Company measures certain non-financial assets and liabilities, including long-lived assets, at fair value on a non-recurring basis. As a result of a decline in the respective future anticipated cash flows of certain retail locations, the Company determined that a portion of the carrying values of such assets exceeded their fair values and recognized non-cash impairment charges of $1.6 million related to property and equipment, net and operating lease right of use assets within selling, general and administrative expense in the condensed consolidated statements of operations during the twenty-six-week period ended November 30, 2019.
The Company believes that the carrying amounts of its other financial instruments, including cash, accounts receivable and accounts payable approximates their carrying value due to the short-term maturities of these instruments.
During the year ended June 1, 2019 and the twenty-six-week period ended November 30, 2019 there were no transfers between Level 1, Level 2 and Level 3.
11. Commitments and Contingencies
Legal Proceedings
In the ordinary course of its business, the Company is involved in various legal proceedings involving contractual and employment relationships, product liability claims, trademark rights and a variety of other matters. The Company does not believe there are any pending legal proceedings that will have a material impact on the Company’s financial position or results of operations. The Company’s policy is to accrue for legal expenses as they become probable and reasonably estimable.
12. Related Party Transactions
The Company utilized certain suppliers that were affiliates of the Company. Purchases from these suppliers were arms-length transactions and totaled $0.4 million and $0.6 million for the twenty-six-week periods ended December 1, 2018 and November 30, 2019, respectively, and were recorded within selling, general and administrative expense in the accompanying condensed consolidated statement of operations. As of both June 1, 2019 and November 30, 2019, the outstanding amount payable to related party suppliers was $0.1 million, which was reflected in accounts payable and accrued liabilities on the condensed consolidated balance sheets.
F-54
Table of Contents
Cole Haan, Inc.
Notes to Unaudited Condensed Consolidated Financial Statements
13. Segment Information
The Company has two reportable segments: North America and International. The accounting policies of the reportable segments are the same as those described in Note 2. The Company’s Chief Executive Officer has been identified as the chief operating decision maker (“CODM”). The Company determined that its measure of segment profitability is Adjusted EBITDA of each reportable segment. Accordingly, the CODM evaluates performance and allocates resources based primarily on Segment Adjusted EBITDA. Segment Adjusted EBITDA excludes: (i) interest expense, net; (ii) income tax expense; (iii) depreciation and amortization, net; (iv) impairment charges; (v) (gain) on disposals of property and equipment; (vi) other (income), net; and (vii) certain initial public offering (“IPO”) costs. The costs of all corporate departments that serve the respective segment are fully allocated. The Company does not allocate amounts reported below operating income to its reportable segments. The Company’s definition of Segment Adjusted EBITDA may not be comparable to similarly titled measures of other companies. Neither reportable segment is reliant on any single external customer.
The Company determines the geographic location of revenue based on the location of its customers. The Company reports inventories, net at a segment level. The Company does not report total assets or total liabilities based on its operating segments. Revenue by segment was as follows (in thousands):
| Twenty-Six-Week Period Ended | ||||||||
| December 1, 2018 | November 30, 2019 | |||||||
| Revenue |
||||||||
| North America (a) |
$ | 304,604 | $ | 346,989 | ||||
| International |
46,858 | 56,094 | ||||||
|
|
|
|
|
|||||
| Total revenue |
$ | 351,462 | $ | 403,083 | ||||
|
|
|
|
|
|||||
| (a) | Includes digital commerce sales from colehaan.com to international customers. |
Inventories, net by segment was as follows (in thousands):
| June 1, 2019 | November 30, 2019 | |||||||
| Inventories, net |
||||||||
| North America |
$ | 108,429 | $ | 119,215 | ||||
| International |
10,805 | 12,733 | ||||||
|
|
|
|
|
|||||
| Total inventories, net |
$ | 119,234 | $ | 131,948 | ||||
|
|
|
|
|
|||||
F-55
Table of Contents
Cole Haan, Inc.
Notes to Unaudited Condensed Consolidated Financial Statements
The following table provides a reconciliation to net income attributable to common stockholders (in thousands):
| Twenty-Six-Week Period Ended | ||||||||
| December 1, 2018 | November 30, 2019 | |||||||
| Reportable Segments Adjusted EBITDA: |
||||||||
| North America |
$ | 48,344 | $ | 48,771 | ||||
| International |
8,773 | 13,599 | ||||||
|
|
|
|
|
|||||
| Total Reportable Segments Adjusted EBITDA |
57,117 | 62,370 | ||||||
| Reconciling items: |
||||||||
| Interest expense, net |
10,344 | 12,106 | ||||||
| Income tax expense |
1,878 | 2,147 | ||||||
| Depreciation and amortization, net (a) |
15,699 | 15,768 | ||||||
| Impairment charges |
— | 1,643 | ||||||
| (Gain) on disposals of property and equipment |
(64 | ) | (6 | ) | ||||
| Other (income), net |
(189 | ) | (127 | ) | ||||
| IPO costs (b) |
— | 6,074 | ||||||
|
|
|
|
|
|||||
| Net income attributable to common stockholders |
$ | 29,449 | $ | 24,765 | ||||
|
|
|
|
|
|||||
| (a) | Excludes amortization included in interest expense, net. |
| (b) | Represents non-recurring expenses primarily comprised of legal, accounting and professional fees incurred in connection with the Company’s IPO, which are included within selling, general and administrative expense on the condensed consolidated statements of operations. |
14. Earnings Per Share
The following table summarizes the computation of basic and diluted net income per common stockholder for the twenty-six-week periods ended December 1, 2018 and November 30, 2019 (in thousands, except share and per share data):
| Twenty-Six-Week Period Ended | ||||||||
| December 1, 2018 | November 30, 2019 | |||||||
| Numerator |
||||||||
| Net income attributable to common stockholders, basic and diluted |
$ | 29,449 | $ | 24,765 | ||||
| Denominator |
||||||||
| Weighted average common shares outstanding, basic and diluted |
1,000 | 1,000 | ||||||
|
|
|
|
|
|||||
| Net income attributable to common stockholders, basic and diluted |
$ | 29,448.90 | $ | 24,764.66 | ||||
|
|
|
|
|
|||||
There were no potentially dilutive securities outstanding during the twenty-six-week periods ended December 1, 2018 and November 30, 2019.
15. Subsequent Events
For its condensed consolidated financial statements as of November 30, 2019 and for the twenty-six-week period then ended, the Company evaluated subsequent events through February 14, 2020, the date on which those interim financial statements were available to be issued.
F-56
Table of Contents
shares
Cole Haan, Inc.
Common Stock
Prospectus
BofA Securities
Morgan Stanley
J.P. Morgan
Goldman Sachs & Co. LLC
Jefferies
Baird
Cowen
Piper Sandler
Stifel
, 2020
Through and including the 25th day after the date of this prospectus, all dealers that effect transactions in these securities, whether or not participating in this offering, may be required to deliver a prospectus. This is in addition to the dealers’ obligations to deliver a prospectus when acting as underwriters and with respect to their unsold allotments or subscriptions.
Table of Contents
PART II
INFORMATION NOT REQUIRED IN PROSPECTUS
Item 13. Other Expenses of Issuance and Distribution
The following table sets forth all the costs and expenses, other than the underwriting discount, payable by the Registrant expected to be incurred in connection with the distribution of common stock being registered hereby. All of such expenses are estimates, except for the Securities and Exchange Commission, or the SEC, registration fee, the Financial Industry Regulatory Authority Inc., or FINRA, filing fee and the NASDAQ listing fee.
| (dollars in thousands) | ||||
| SEC registration fee |
$ | 12,980 | ||
| FINRA filing fee |
15,500 | |||
| NASDAQ listing fee |
* | |||
| Printing fees and expenses |
* | |||
| Legal fees and expenses |
* | |||
| Accounting fees and expenses |
* | |||
| Blue Sky fees and expenses (including legal fees) |
* | |||
| Transfer agent and registrar fees and expenses |
* | |||
| Miscellaneous expenses |
* | |||
|
|
|
|||
| Total |
$ | * | ||
|
|
|
|||
| * | To be completed by amendment. |
Item 14. Indemnification of Directors and Officers
Section 102(b)(7) of the Delaware General Corporation Law, or the DGCL, allows a corporation to provide in its certificate of incorporation that a director of the corporation will not be personally liable to the corporation or its stockholders for monetary damages for breach of fiduciary duty as a director, except where the director breached the duty of loyalty, failed to act in good faith, engaged in intentional misconduct or knowingly violated a law, authorized the payment of a dividend or approved a stock repurchase in violation of Delaware corporate law or obtained an improper personal benefit. Our amended and restated certificate of incorporation will provide for this limitation of liability.
Section 145 of the DGCL, or Section 145, provides, among other things, that a Delaware corporation may indemnify any person who was, is or is threatened to be made, party to any threatened, pending or completed action, suit or proceeding, whether civil, criminal, administrative or investigative (other than an action by or in the right of such corporation), by reason of the fact that such person is or was an officer, director, employee or agent of such corporation or is or was serving at the request of such corporation as a director, officer, employee or agent of another corporation or enterprise. The indemnity may include expenses (including attorneys’ fees), judgments, fines and amounts paid in settlement actually and reasonably incurred by such person in connection with such action, suit or proceeding, provided such person acted in good faith and in a manner he or she reasonably believed to be in or not opposed to the corporation’s best interests and, with respect to any criminal action or proceeding, had no reasonable cause to believe that his or her conduct was unlawful. A Delaware corporation may indemnify any persons who were or are a party to any threatened, pending or completed action or suit by or in the right of the corporation by reason of the fact that such person is or was a director, officer, employee or agent of another corporation or enterprise. The indemnity may include expenses (including attorneys’ fees) actually and reasonably incurred by such person in connection with the defense or settlement of such action or suit, provided such person acted in good faith and in a manner he or she reasonably believed to be in or not opposed to the corporation’s best interests, provided further that no indemnification is permitted without
II-1
Table of Contents
judicial approval if the officer, director, employee or agent is adjudged to be liable to the corporation. Where an officer or director is successful on the merits or otherwise in the defense of any action referred to above, the corporation must indemnify him or her against the expenses (including attorneys’ fees) which such officer or director has actually and reasonably incurred.
Section 145 further authorizes a corporation to purchase and maintain insurance on behalf of any person who is or was a director, officer, employee or agent of the corporation or is or was serving at the request of the corporation as a director, officer, employee or agent of another corporation or enterprise, against any liability asserted against such person and incurred by such person in any such capacity, or arising out of his or her status as such, whether or not the corporation would otherwise have the power to indemnify such person under Section 145.
Our amended and restated bylaws will provide that we must indemnify, and advance expenses to, our directors and officers to the full extent authorized by the DGCL. We also intend to enter into indemnification agreements with our directors, which agreements will require us to indemnify these individuals to the fullest extent permitted under Delaware law against liabilities that may arise by reason of their service to us, and to advance expenses incurred as a result of any proceeding against them as to which they could be indemnified.
The indemnification rights set forth above shall not be exclusive of any other right which an indemnified person may have or hereafter acquire under any statute, provision of our amended and restated certificate of incorporation, our amended and restated bylaws, agreement, vote of stockholders or disinterested directors or otherwise. Notwithstanding the foregoing, we shall not be obligated to indemnify a director or officer in respect of a proceeding (or part thereof) instituted by such director or officer, unless such proceeding (or part thereof) has been authorized by our board of directors pursuant to the applicable procedure outlined in the amended and restated bylaws.
Section 174 of the DGCL provides, among other things, that a director, who willfully or negligently approves of an unlawful payment of dividends or an unlawful stock purchase or redemption, may be held jointly and severally liable for such actions. A director who was either absent when the unlawful actions were approved or dissented at the time may avoid liability by causing his or her dissent to such actions to be entered in the books containing the minutes of the meetings of the board of directors at the time such action occurred or immediately after such absent director receives notice of the unlawful acts.
We expect to maintain standard policies of insurance that provide coverage (1) to our directors and officers against loss rising from claims made by reason of breach of duty or other wrongful act and (2) to us with respect to indemnification payments that we may make to such directors and officers.
The underwriting agreement provides for indemnification by the underwriters of us and our officers and directors, and by us of the underwriters, for certain liabilities arising under the Securities Act or otherwise in connection with this offering.
Insofar as indemnification for liabilities arising under the Securities Act may be permitted to directors, officers or persons controlling us under any of the foregoing provisions, in the opinion of the SEC, such indemnification is against public policy as expressed in the Securities Act and is therefore unenforceable.
Item 15. Recent Sales of Securities
Within the past three years, the Registrant has granted or issued the following securities of the Registrant which were not registered under the Securities Act:
None
II-2
Table of Contents
Item 16. Exhibits and Financial Statement Schedules
(a) Exhibits.
See the Exhibit Index immediately preceding the signature pages hereto, which is incorporated by reference as if fully set forth herein.
(b) Financial Statement Schedules.
None
Item 17. Undertakings.
(1) Insofar as indemnification for liabilities arising under the Securities Act may be permitted to directors, officers and controlling persons of the Registrant pursuant to the foregoing provisions, or otherwise, the Registrant has been advised that in the opinion of the Securities and Exchange Commission such indemnification is against public policy as expressed in the Securities Act and is, therefore, unenforceable. In the event that a claim for indemnification against such liabilities (other than the payment by the Registrant of expenses incurred or paid by a director, officer or controlling person of the Registrant in the successful defense of any action, suit or proceeding) is asserted by such director, officer or controlling person in connection with the securities being registered, the Registrant will, unless in the opinion of its counsel the matter has been settled by controlling precedent, submit to a court of appropriate jurisdiction the question of whether such indemnification by it is against public policy as expressed in the Securities Act and will be governed by the final adjudication of such issue.
(2) The undersigned Registrant hereby undertakes that:
(A) For purposes of determining any liability under the Securities Act, the information omitted from the form of prospectus filed as part of this registration statement in reliance upon Rule 430A and contained in a form of prospectus filed by the Registrant pursuant to Rule 424(b) (1) or (4) or 497(h) under the Securities Act shall be deemed to be part of this registration statement as of the time it was declared effective.
(B) For the purpose of determining any liability under the Securities Act, each post-effective amendment that contains a form of prospectus shall be deemed to be a new registration statement relating to the securities offered therein, and the offering of such securities at that time shall be deemed to be the initial bona fide offering thereof.
II-3
Table of Contents
EXHIBITS
| Exhibit |
Description | |
| 1.1* | Form of Underwriting Agreement. | |
| 3.1* | Form of Amended and Restated Certificate of Formation of the Registrant. | |
| 3.2* | Form of Amended and Restated Bylaws of the Registrant. | |
| 4.1* | Specimen Stock Certificate evidencing shares of Common Stock. | |
| 4.2* | Form of Stockholders Agreement. | |
| 5.1* | Opinion of Simpson Thacher & Bartlett LLP regarding validity of the shares of common stock registered. | |
| 10.1* | Credit Agreement, dated as of February 12, 2019, among Calceus Midco, Inc., Calceus Acquisition, Inc., JPMorgan Chase Bank, N.A., as Administrative Agent and Collateral Agent and the lenders and others party thereto. | |
| 10.2* | ABL Credit Agreement, dated as of February 1, 2013, among Calceus Midco, Inc., Calceus Acquisition, Inc., the other borrowers party thereto, Wells Fargo Bank, National Association, as Administrative Agent and Collateral Agent, the other lenders party thereto and Wells Fargo Bank, National Association, as Lead Arranger and Bookrunner. | |
| 10.3* | Amendment No. 1 to ABL Credit Agreement, dated as of November 23, 2015, among Calceus Acquisition, Inc., the other borrowers party thereto, Calceus Midco, Inc., the other guarantors party thereto, the financial institutions party thereto and Wells Fargo Bank, National Association, as administrative agent. | |
| 10.4* | Amendment No. 2 to ABL Credit Agreement, dated as of July 11, 2018, among Calceus Acquisition, Inc., the other borrowers party thereto, Calceus Midco, Inc., the other guarantors party thereto, the financial institutions party thereto and Wells Fargo Bank, National Association, as administrative agent. | |
| 10.5†* | Form of Omnibus Incentive Plan. | |
| 21.1 | Subsidiaries of the Registrant. | |
| 23.1 | Consent of PricewaterhouseCoopers LLP. | |
| 23.2* | Consent of Simpson Thacher & Bartlett LLP (included as part of Exhibit 5.1). | |
| 24.1 | Power of Attorney (included on signature pages to this Registration Statement). | |
| * | To be filed by amendment. |
| † | Compensatory arrangements for director(s) and/or executive officer(s). |
II-4
Table of Contents
Pursuant to the requirements of the Securities Act of 1933, as amended, the Registrant has duly caused this registration statement to be signed on its behalf by the undersigned, thereunto duly authorized, in the City of New York, New York, on February 14, 2020.
| COLE HAAN, INC. | ||
| By: | /s/ Jack A. Boys | |
| Name: Jack A. Boys | ||
| Title: Chief Executive Officer | ||
POWER OF ATTORNEY
KNOW ALL MEN BY THESE PRESENTS, that each person whose signature appears below hereby constitutes and appoints Jack A. Boys, Thomas J. Linko and Laura W. Kelley and each of them, the true and lawful attorneys-in-fact and agents of the undersigned, with full power of substitution and resubstitution, for and in the name, place and stead of the undersigned, to sign in any and all capacities (including, without limitation, the capacities listed below), the registration statement, any and all amendments (including post-effective amendments) to the registration statement and any and all successor registration statements of Cole Haan, Inc., including any filings pursuant to Rule 462(b) under the Securities Act of 1933, as amended, and to file the same, with all exhibits thereto, and all other documents in connection therewith, with the Securities and Exchange Commission, and hereby grants to such attorneys-in-fact and agents, and each of them, full power and authority to do and perform each and every act and anything necessary to be done to enable Cole Haan, Inc. to comply with the provisions of the Securities Act and all the requirements of the Securities and Exchange Commission, as fully to all intents and purposes as the undersigned might or could do in person, hereby ratifying and confirming all that said attorneys-in-fact and agents, or any of them, or their or his or her substitute, or substitutes, may lawfully do or cause to be done by virtue hereof.
Pursuant to the requirements of the Securities Act of 1933, as amended, this registration statement has been signed by the following person in the capacities indicated on February 14, 2020:
| Signatures |
Title | |
| /s/ Jack A. Boys Jack A. Boys |
Director and Chief Executive Officer (principal executive officer) | |
| /s/ Thomas J. Linko Thomas J. Linko |
Chief Financial Officer (principal financial officer) | |
| /s/ Michael Ragusa Michael Ragusa |
Chief Accounting Officer (principal accounting officer) | |
| /s/ James Brett James Brett |
Director | |
| /s/ Ashwin Cadambi Ashwin Cadambi |
Director | |
| /s/ Marsden Cason Marsden Cason |
Director | |
II-5
Table of Contents
| Signatures |
Title | |
| /s/ Calvin McDonald Calvin McDonald |
Director | |
| /s/ Alex Pellegrini Alex Pellegrini |
Director | |
| /s/ E. Lee Wyatt, Jr. E. Lee Wyatt, Jr. |
Director | |
II-6