Attached files
| file | filename |
|---|---|
| 8-K - 8-K - Armour Residential REIT, Inc. | arr8-kjanuarycompanyup.htm |
ARMOUR RESIDENTIAL REIT, Inc. Company Update 2/14/20 ARMOUR seeks to create shareholder value through thoughtful investment and risk management that produces current yield and superior risk adjusted returns over the long term. Our focus on residential real estate finance supports home ownership for a broad and diverse spectrum of Americans by bringing private capital into the mortgage markets.
PLEASE READ: Important Regulatory and Yield Estimate Risk Disclosures 2 • Certain statements made in this presentation regarding ARMOUR Residential REIT, Inc. (“ARMOUR” or the “Company”), and any other statements regarding ARMOUR’s future expectations, beliefs, goals or prospects constitute forward-looking statements made within the meaning of Section 21E of the Securities Exchange Act of 1934. Any statements that are not statements of historical fact (including statements containing the words “believes,” “plans,” “anticipates,” “expects,” “estimates” and similar expressions) should also be considered forward-looking statements. Forward-looking statements include but are not limited to statements regarding the projections for ARMOUR’s business and plans for future growth and operational improvements. A number of important factors could cause actual results or events to differ materially from those indicated by such forward-looking statements. ARMOUR assumes no obligation to update the information in this communication, except as otherwise required by law. Readers are cautioned not to place undue reliance on these forward-looking statements, which speak only as of the date hereof. • This material is for information purposes only and does not constitute an offer to sell, a solicitation of an offer to buy, or a recommendation for any securities or financial instruments. The statements, information and estimates contained herein are based on information that the company believes to be reliable as of today's date unless otherwise indicated, but cannot be represented that such statements, information or estimates are complete or accurate. • Actual realized yields, durations and net durations described herein will depend on a number of factors that cannot be predicted with certainty. Estimated yields do not reflect any of the costs of operation of ARMOUR. • THE INFORMATION PRESENTED HEREIN IS UNAUDITED AND UNREVIEWED.
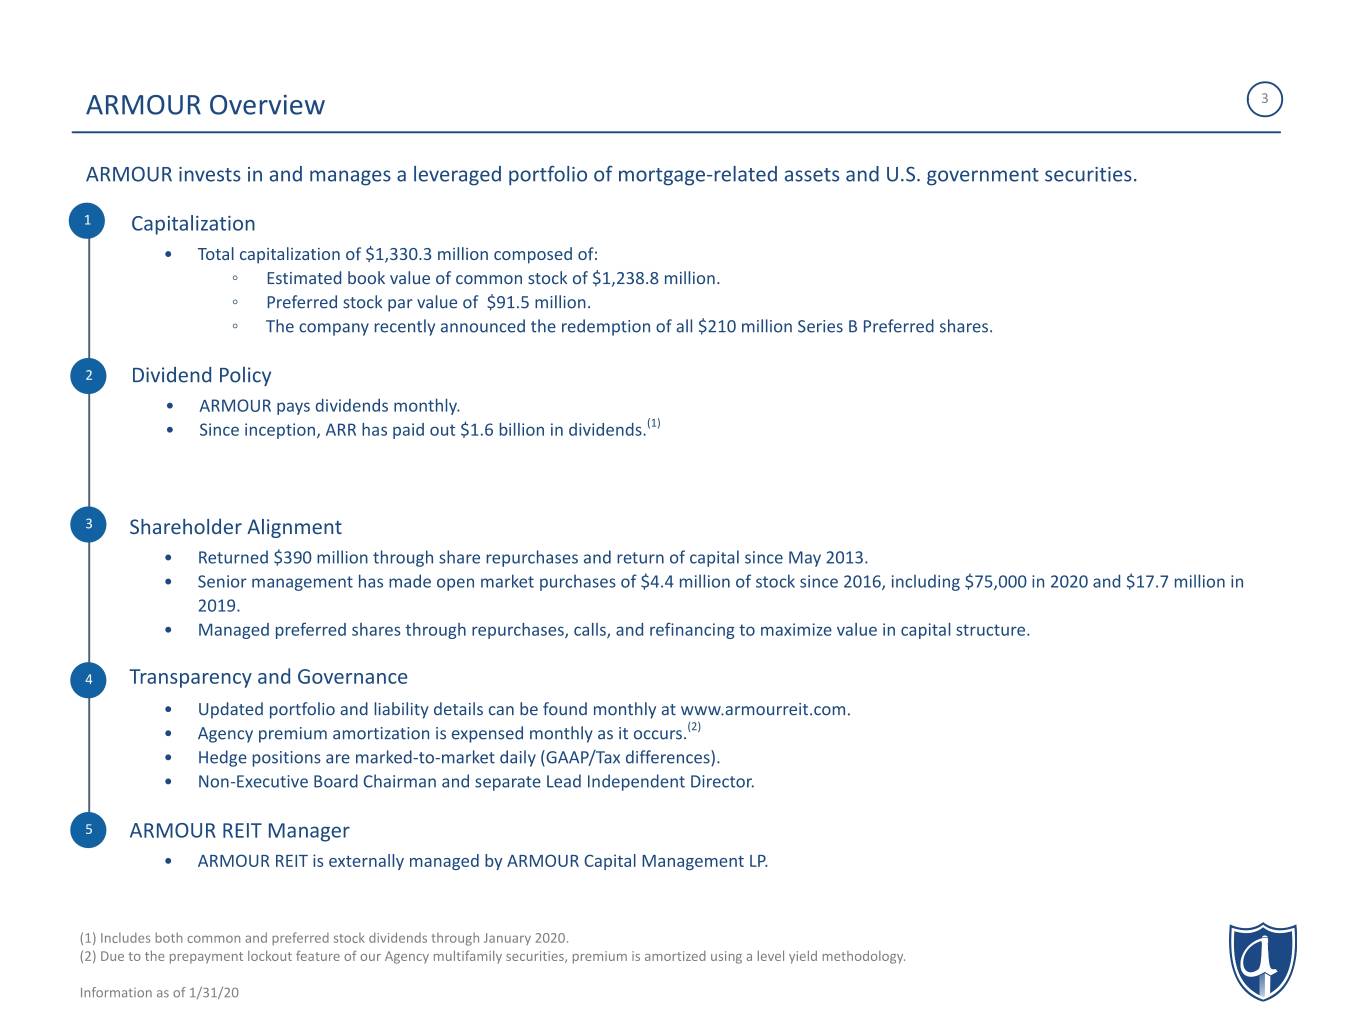
ARMOUR Overview 3 ARMOUR invests in and manages a leveraged portfolio of mortgage-related assets and U.S. government securities. 1 Capitalization • Total capitalization of $1,330.3 million composed of: ◦ Estimated book value of common stock of $1,238.8 million. ◦ Preferred stock par value of $91.5 million. ◦ The company recently announced the redemption of all $210 million Series B Preferred shares. 2 Dividend Policy • ARMOUR pays dividends monthly. • Since inception, ARR has paid out $1.6 billion in dividends.(1) 3 Shareholder Alignment • Returned $390 million through share repurchases and return of capital since May 2013. • Senior management has made open market purchases of $4.4 million of stock since 2016, including $75,000 in 2020 and $17.7 million in 2019. • Managed preferred shares through repurchases, calls, and refinancing to maximize value in capital structure. 4 Transparency and Governance • Updated portfolio and liability details can be found monthly at www.armourreit.com. • Agency premium amortization is expensed monthly as it occurs.(2) • Hedge positions are marked-to-market daily (GAAP/Tax differences). • Non-Executive Board Chairman and separate Lead Independent Director. 5 ARMOUR REIT Manager • ARMOUR REIT is externally managed by ARMOUR Capital Management LP. (1) Includes both common and preferred stock dividends through January 2020. (2) Due to the prepayment lockout feature of our Agency multifamily securities, premium is amortized using a level yield methodology. Information as of 1/31/20
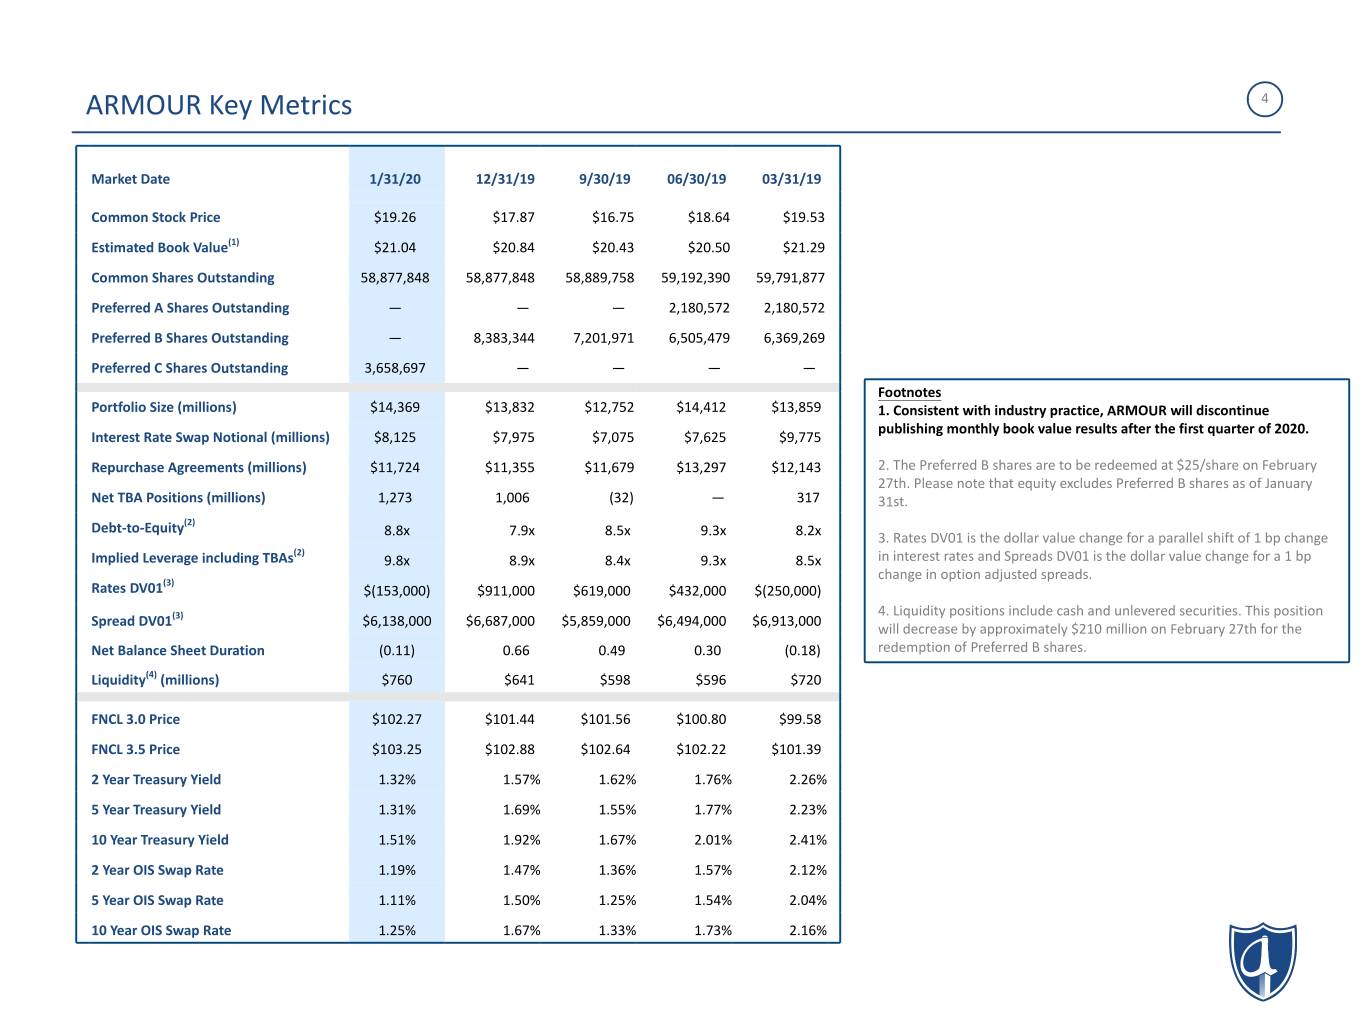
ARMOUR Key Metrics 4 Market Date 1/31/20 12/31/19 9/30/19 06/30/19 03/31/19 Common Stock Price $19.26 $17.87 $16.75 $18.64 $19.53 Estimated Book Value(1) $21.04 $20.84 $20.43 $20.50 $21.29 Common Shares Outstanding 58,877,848 58,877,848 58,889,758 59,192,390 59,791,877 Preferred A Shares Outstanding — — — 2,180,572 2,180,572 Preferred B Shares Outstanding — 8,383,344 7,201,971 6,505,479 6,369,269 Preferred C Shares Outstanding 3,658,697 — — — — Footnotes Portfolio Size (millions) $14,369 $13,832 $12,752 $14,412 $13,859 1. Consistent with industry practice, ARMOUR will discontinue publishing monthly book value results after the first quarter of 2020. Interest Rate Swap Notional (millions) $8,125 $7,975 $7,075 $7,625 $9,775 Repurchase Agreements (millions) $11,724 $11,355 $11,679 $13,297 $12,143 2. The Preferred B shares are to be redeemed at $25/share on February 27th. Please note that equity excludes Preferred B shares as of January Net TBA Positions (millions) 1,273 1,006 (32) — 317 31st. Debt-to-Equity(2) 8.8x 7.9x 8.5x 9.3x 8.2x 3. Rates DV01 is the dollar value change for a parallel shift of 1 bp change (2) Implied Leverage including TBAs 9.8x 8.9x 8.4x 9.3x 8.5x in interest rates and Spreads DV01 is the dollar value change for a 1 bp change in option adjusted spreads. (3) Rates DV01 $(153,000) $911,000 $619,000 $432,000 $(250,000) 4. Liquidity positions include cash and unlevered securities. This position Spread DV01(3) $6,138,000 $6,687,000 $5,859,000 $6,494,000 $6,913,000 will decrease by approximately $210 million on February 27th for the Net Balance Sheet Duration (0.11) 0.66 0.49 0.30 (0.18) redemption of Preferred B shares. Liquidity(4) (millions) $760 $641 $598 $596 $720 FNCL 3.0 Price $102.27 $101.44 $101.56 $100.80 $99.58 FNCL 3.5 Price $103.25 $102.88 $102.64 $102.22 $101.39 2 Year Treasury Yield 1.32% 1.57% 1.62% 1.76% 2.26% 5 Year Treasury Yield 1.31% 1.69% 1.55% 1.77% 2.23% 10 Year Treasury Yield 1.51% 1.92% 1.67% 2.01% 2.41% 2 Year OIS Swap Rate 1.19% 1.47% 1.36% 1.57% 2.12% 5 Year OIS Swap Rate 1.11% 1.50% 1.25% 1.54% 2.04% 10 Year OIS Swap Rate 1.25% 1.67% 1.33% 1.73% 2.16%
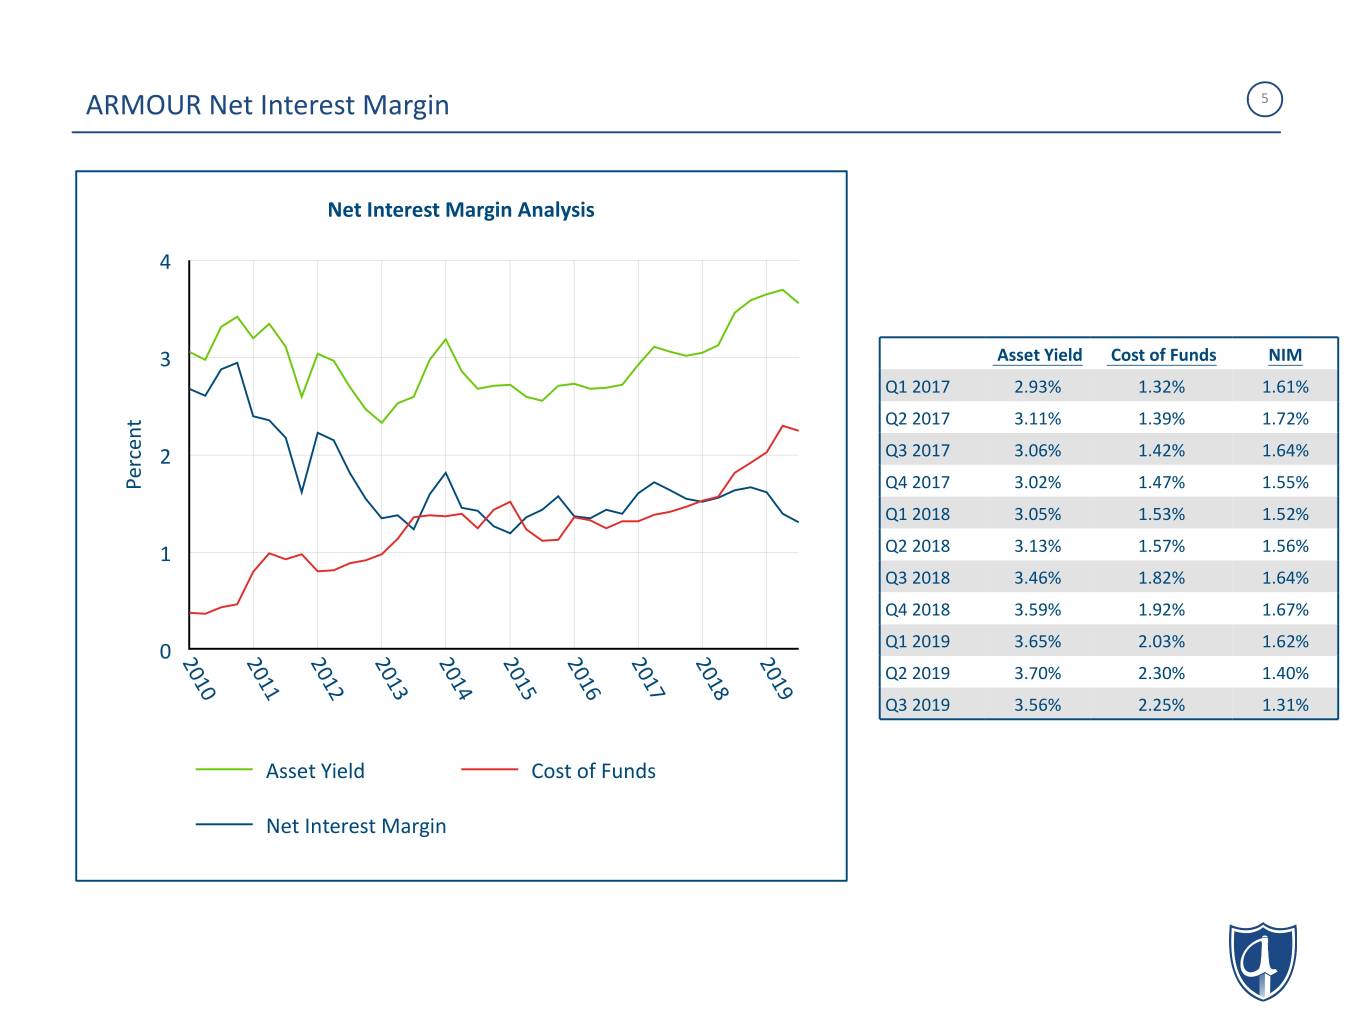
ARMOUR Net Interest Margin 5 Net Interest Margin Analysis 4 3 Asset Yield Cost of Funds NIM Q1 2017 2.93% 1.32% 1.61% t Q2 2017 3.11% 1.39% 1.72% n e c Q3 2017 3.06% 1.42% 1.64% r 2 e P Q4 2017 3.02% 1.47% 1.55% Q1 2018 3.05% 1.53% 1.52% 1 Q2 2018 3.13% 1.57% 1.56% Q3 2018 3.46% 1.82% 1.64% Q4 2018 3.59% 1.92% 1.67% Q1 2019 3.65% 2.03% 1.62% 0 2 2 2 2 2 2 2 2 2 2 0 0 0 0 0 0 0 0 0 0 1 1 1 1 1 1 1 1 1 1 Q2 2019 3.70% 2.30% 1.40% 0 1 2 3 4 5 6 7 8 9 Q3 2019 3.56% 2.25% 1.31% Asset Yield Cost of Funds Net Interest Margin

ARMOUR Portfolio 6 Estimated % of Current Value Weighted Average Weighted Average Weighted Average Effective Securities Portfolio (millions) Book Price Market Price Net/Gross Coupon Duration Agency ARMs & Hybrids 0.3% $36.6 104.8% 103.2% 3.78/4.37 0.99 Agency Multifamily Ballooning in 120 Months or Less 19.2% $2,754.3 101.8% 110.0% 3.46/4.51 6.31 Agency Fixed Rates Maturing Between 0 and 180 Months 11.5% $1,658.3 103.2% 105.8% 3.66/4.24 3.18 Agency Fixed Rates Maturing Between 181 and 240 Months 0.0% $1.1 107.9% 108.1% 4.25/5.37 3.08 Agency Fixed Rates Maturing Between 241 and 360 Months 52.4% $7,526.6 102.5% 105.5% 3.81/4.42 0.92 US Treasury 2.1% $306.2 101.3% 102.1% 1.75/1.75 8.95 Agency & US Treasury Portfolio 85.5% $12,283.3 102.4% 106.5% 3.66/4.35 2.64 Agency 15Y TBA Long Positions 5.4% $769.3 101.8% 102.6% 2.83/ N/A 1.81 Agency 30Y TBA Long Positions 3.5% $503.9 99.3% 100.8% 2.50/ N/A 2.96 Net TBA Positions 8.9% $1,273.2 Legacy Non-Agency Assets 0.4% $63.8 74.4% 82.7% 5.55/4.59 2.73 New Issue Prime Fixed Non-Agency 0.1% $15.8 95.0% 102.3% 3.68/3.95 3.41 Credit Risk Transfer 5.1% $732.6 99.3% 106.6% 5.61/4.11 -3.10 Credit Risk & Non-Agency Portfolio 5.7% $812.2 96.8% 104.1% 5.57/4.14 -2.52 Total Portfolio 100.0% $14,368.6 102.0% 105.9% 3.68/4.27 2.31 • Approximately 92% of ARMOUR's Agency portfolio (excluding TBA positions) benefits from favorable prepayment characteristics, including: ◦ 23% have prepayment penalties (DUS). ◦ 51% have loan balances less than or equal to 225k. ◦ 18% have loan-to-value ratios greater than 95%, FICO scores of less than 700 or seasoning of greater than 24 months. Information as of 01/31/2020. Portfolio value is based on independent third-party pricing. Information includes estimates of the effect of forward settling trades. Some totals may not foot due to rounding.
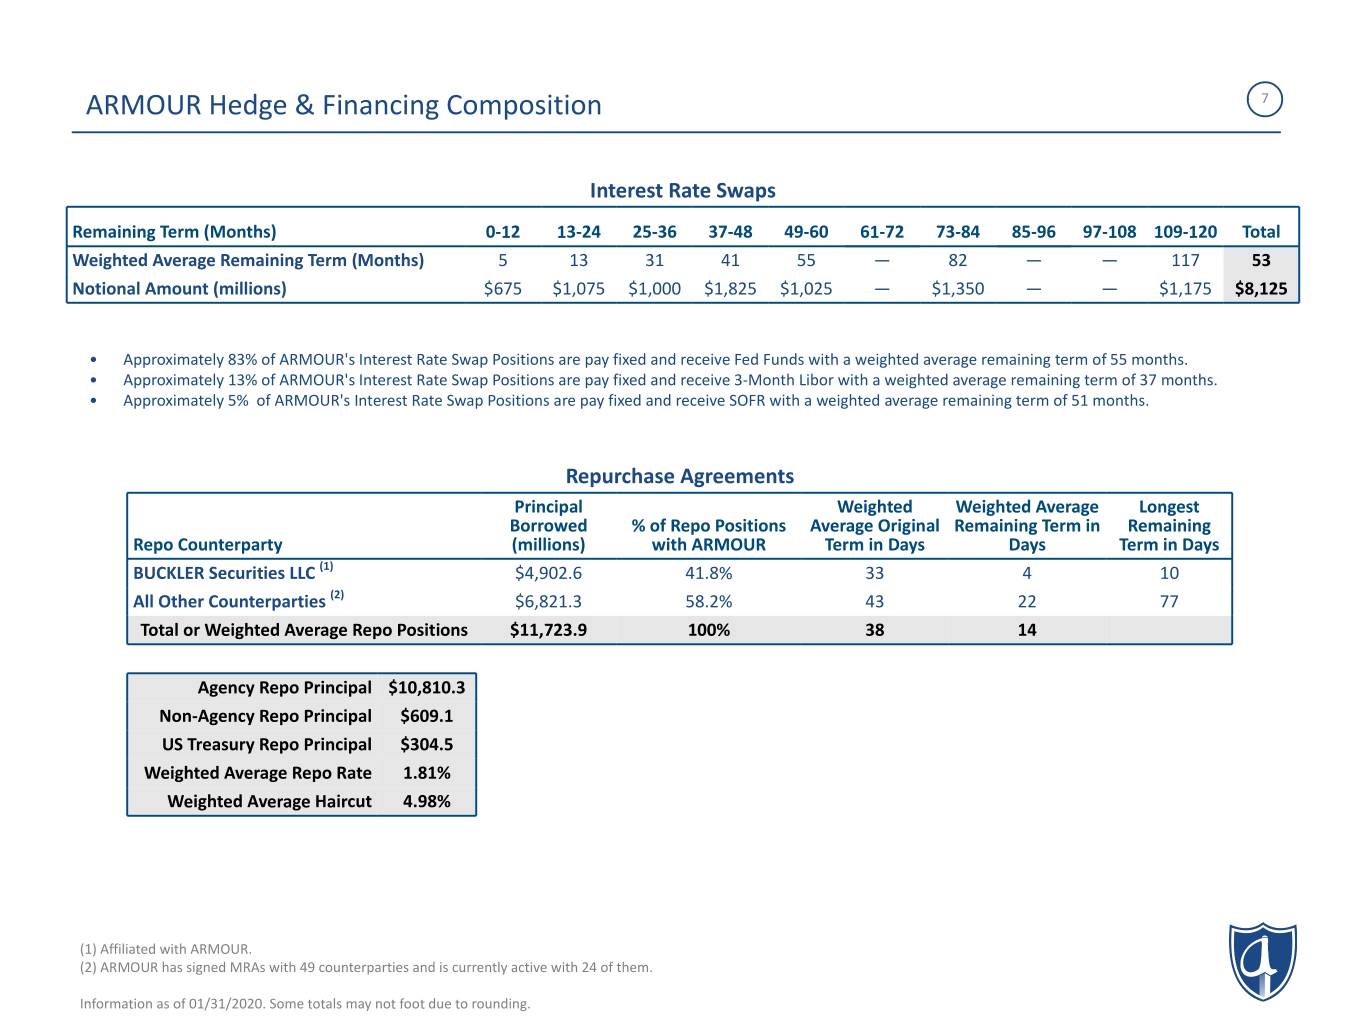
ARMOUR Hedge & Financing Composition 7 Interest Rate Swaps Remaining Term (Months) 0-12 13-24 25-36 37-48 49-60 61-72 73-84 85-96 97-108 109-120 Total Weighted Average Remaining Term (Months) 5 13 31 41 55 — 82 — — 117 53 Notional Amount (millions) $675 $1,075 $1,000 $1,825 $1,025 — $1,350 — — $1,175 $8,125 • Approximately 83% of ARMOUR's Interest Rate Swap Positions are pay fixed and receive Fed Funds with a weighted average remaining term of 55 months. • Approximately 13% of ARMOUR's Interest Rate Swap Positions are pay fixed and receive 3-Month Libor with a weighted average remaining term of 37 months. • Approximately 5% of ARMOUR's Interest Rate Swap Positions are pay fixed and receive SOFR with a weighted average remaining term of 51 months. Repurchase Agreements Principal Weighted Weighted Average Longest Borrowed % of Repo Positions Average Original Remaining Term in Remaining Repo Counterparty (millions) with ARMOUR Term in Days Days Term in Days BUCKLER Securities LLC (1) $4,902.6 41.8% 33 4 10 All Other Counterparties (2) $6,821.3 58.2% 43 22 77 Total or Weighted Average Repo Positions $11,723.9 100% 38 14 Agency Repo Principal $10,810.3 Non-Agency Repo Principal $609.1 US Treasury Repo Principal $304.5 Weighted Average Repo Rate 1.81% Weighted Average Haircut 4.98% (1) Affiliated with ARMOUR. (2) ARMOUR has signed MRAs with 49 counterparties and is currently active with 24 of them. Information as of 01/31/2020. Some totals may not foot due to rounding.
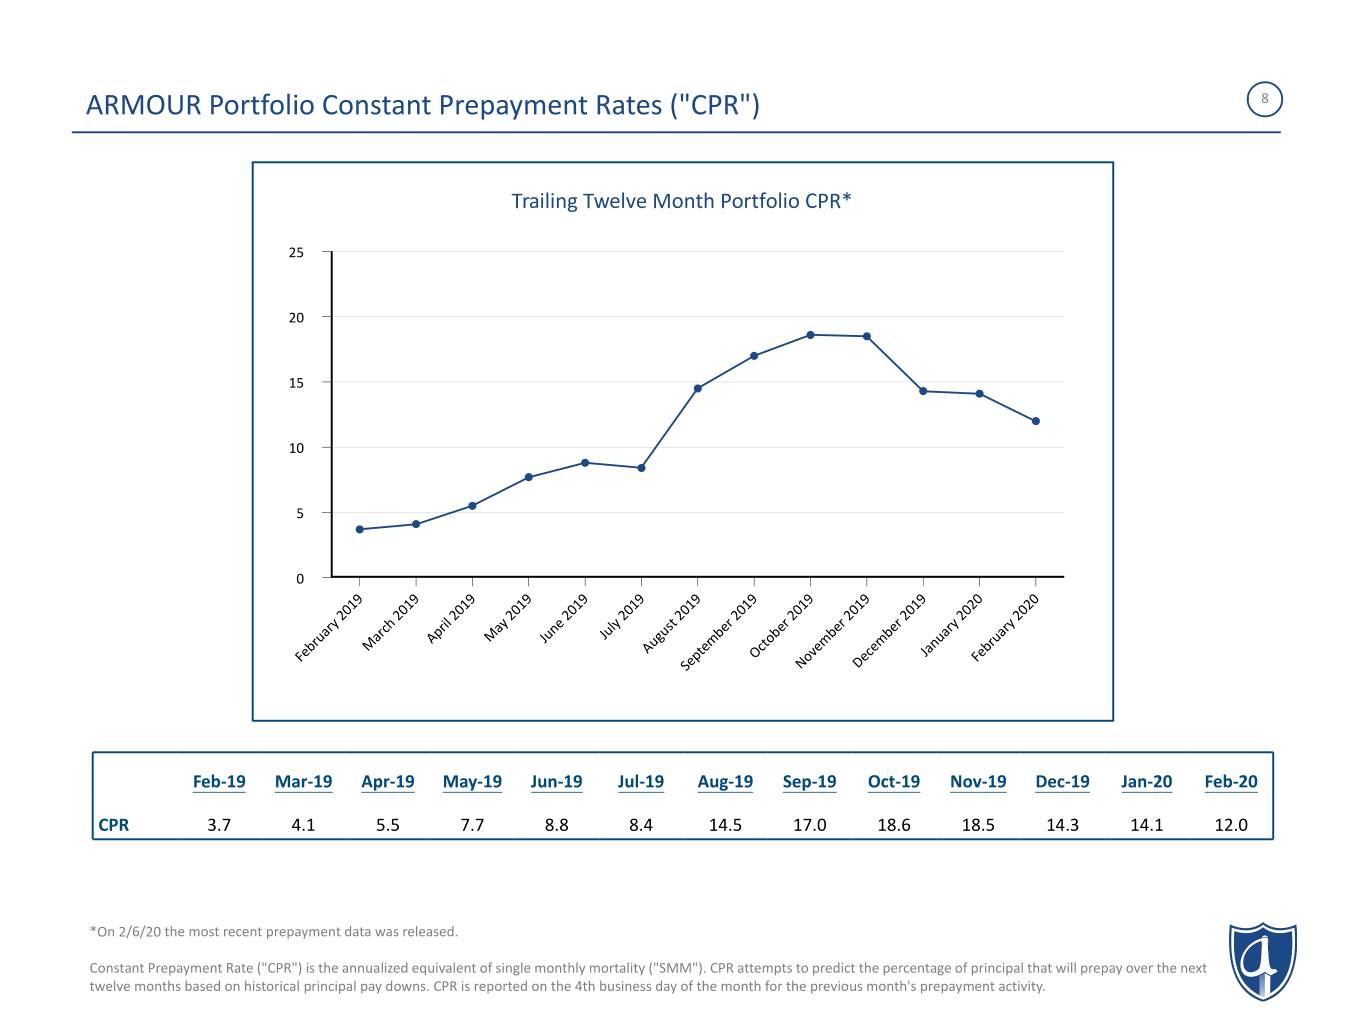
ARMOUR Portfolio Constant Prepayment Rates ("CPR") 8 Trailing Twelve Month Portfolio CPR* 25 20 15 10 5 0 9 9 9 9 9 9 9 9 9 9 9 0 0 1 1 1 1 1 1 1 1 1 1 1 2 2 0 0 0 0 0 0 0 0 0 0 0 0 0 2 2 2 2 2 2 2 2 2 2 2 2 2 y h il y e ly st r r r r y y ar rc r a n u u e e e e ar ar u a p M u J g b b b b u u r A J u m to m m n r b M A te c ve ce a b Fe p O o e J Fe Se N D Feb-19 Mar-19 Apr-19 May-19 Jun-19 Jul-19 Aug-19 Sep-19 Oct-19 Nov-19 Dec-19 Jan-20 Feb-20 CPR 3.7 4.1 5.5 7.7 8.8 8.4 14.5 17.0 18.6 18.5 14.3 14.1 12.0 *On 2/6/20 the most recent prepayment data was released. Constant Prepayment Rate ("CPR") is the annualized equivalent of single monthly mortality ("SMM"). CPR attempts to predict the percentage of principal that will prepay over the next twelve months based on historical principal pay downs. CPR is reported on the 4th business day of the month for the previous month's prepayment activity.
ARMOUR Residential REIT, Inc. 3001 Ocean Drive Suite 201 Vero Beach, FL 32963 armourreit.com 772-617-4340
