Attached files
| file | filename |
|---|---|
| 8-K - 8-K - TRICO BANCSHARES / | tcbk-20200213.htm |

KBW Winter Financial Services Symposium Boca Raton, Florida February 2020 Richard P. Smith – President & Chief Executive Officer John S. Fleshood – EVP & Chief Operating Officer

KBW Winter Financial Services Symposium SAFE HARBOR STATEMENT The statements contained herein that are not historical facts are forward-looking statements based on management’s current expectations and beliefs concerning future developments and their potential effects on the Company. Such statements involve inherent risks and uncertainties, many of which are difficult to predict and are generally beyond our control. There can be no assurance that future developments affecting us will be the same as those anticipated by management. We caution readers that a number of important factors could cause actual results to differ materially from those expressed in, or implied or projected by, such forward- looking statements. These risks and uncertainties include, but are not limited to, the following: the strength of the United States economy in general and the strength of the local economies in which we conduct operations; the effects of, and changes in, trade, monetary and fiscal policies and laws, including interest rate policies of the Board of Governors of the Federal Reserve System; inflation, interest rate, market and monetary fluctuations; the impact of changes in financial services policies, laws and regulations; technological changes; weather, natural disasters and other catastrophic events that may or may not be caused by climate change; the costs or effects of mergers, acquisitions of dispositions we may make; the future operating or financial performance of the company, including our outlook for future growth, changes in the level of our nonperforming assets and charge-offs; the appropriateness of the allowance for credit losses including the timing and effects of the implementation of the current expected credit losses model; any deterioration in values of California real estate, both residential and commercial; the effect of changes in accounting standards and practices; possible other-than-temporary impairment of securities held by us; changes in consumer spending, borrowing and savings habits; our ability to attract deposits and other sources of liquidity; changes in the financial performance and/or condition of our borrowers; our noninterest expense and the efficiency ratio; competition and innovation with respect to financial products and services by banks, financial institutions and non-traditional providers including retail businesses and technology companies; the challenges of integrating and retaining key employees; unanticipated regulatory or judicial proceedings; cybersecurity threats and the cost of defending against them, unanticipated regulatory or legal proceedings; and our ability to manage the risks involved in the foregoing. Additional factors that could cause results to differ materially from those described above can be found in our Annual Report on Form 10-K for the year ended December 31, 2018, which is on file with the Securities and Exchange Commission (the “SEC”) and available in the “Investor Relations” section of our website, https://www.tcbk.com/investor-relations and in other documents we file with the SEC. Annualized, pro forma, projections and estimates are not forecasts and may not reflect actual results. 2 February 2020

KBW Winter Financial Services Symposium AGENDA • Most Recent Quarter Recap • Company Overview • Lending Overview • Deposit Overview • Financials 3 February 2020

KBW Winter Financial Services Symposium MOST RECENT QUARTER HIGHLIGHTS • Q4 2019 return on average assets of 1.40% versus 1.46% in Q4 2018 and 1.44% in the linked Earnings Consistency quarter. • Average yield on earning assets of 4.65% in Q4 2019 compared to 4.78% in Q4 2018 and 4.72% in the linked quarter. • Net interest margin of 4.39% for Q4 2019 versus 4.49% in Q4 2018 and 4.44% in the linked Industry Leading Net quarter. Interest Margin • Loan to deposit ratio increased to 80% at Q4 2019 compared to 79% in the linked quarter and improved from 75% at Q4 2018. • Nonperforming loans to total loans of 0.39% and 0.44% at Q4 2019 and Q3 2019, respectively is Superior Credit Quality considered low and continues to improve as compared to 0.68% at Q4 2019. • Loan repayments and charge-offs of various long duration impaired loans facilitated the Q4 2019 improvements. • Total non-interest income increased 12.6% from the same quarter in the prior year. Non-interest Income • Gain on sale of mortgage loans nearly doubled as compared to the same quarter in the prior year Diversity and Expansion as a result of the declining rate environment. • Costs of interest bearing liabilities decreased to 0.41% in Q4 2019 as compared to Q4 2018 of Diverse Deposit Base 0.44%, and 0.45% from the linked quarter; however, opportunity for reductions in Q4 2019 and beyond are likely. • Current capital levels all for opportunistic acquisitive growth while continuing our organic growth Capital Strength and expansion. • Consistent payment of quarterly cash dividend with a history of periodic increases. 4 February 2020

KBW Winter Financial Services Symposium COMPANY OVERVIEW 5 February 2020

KBW Winter Financial Services Symposium COMPANY OVERVIEW Asset Size: $6.5 Billion Founded: 1975 Deposits: $5.4 Billion Loans (net): $4.3 Billion Bank Branches: 76 ATMs: 99 Market Area: TriCo currently serves 29 counties throughout Northern and Central California. These counties represent over 30% of California’s population. 6 February 2020

KBW Winter Financial Services Symposium COMPANY OVERVIEW Nasdaq: TCBK Stock Price*: $37.79 Market Capitalization: $1.15 billion Price to Book stated: 1.3x Price to TBVPS 1.7x Rank (Total Assets) among CA Publicly Traded Banks: 12 (Source: SNL Financial) _________________________________________________________________________ *as of 1/24/2020 COB 7 February 2020
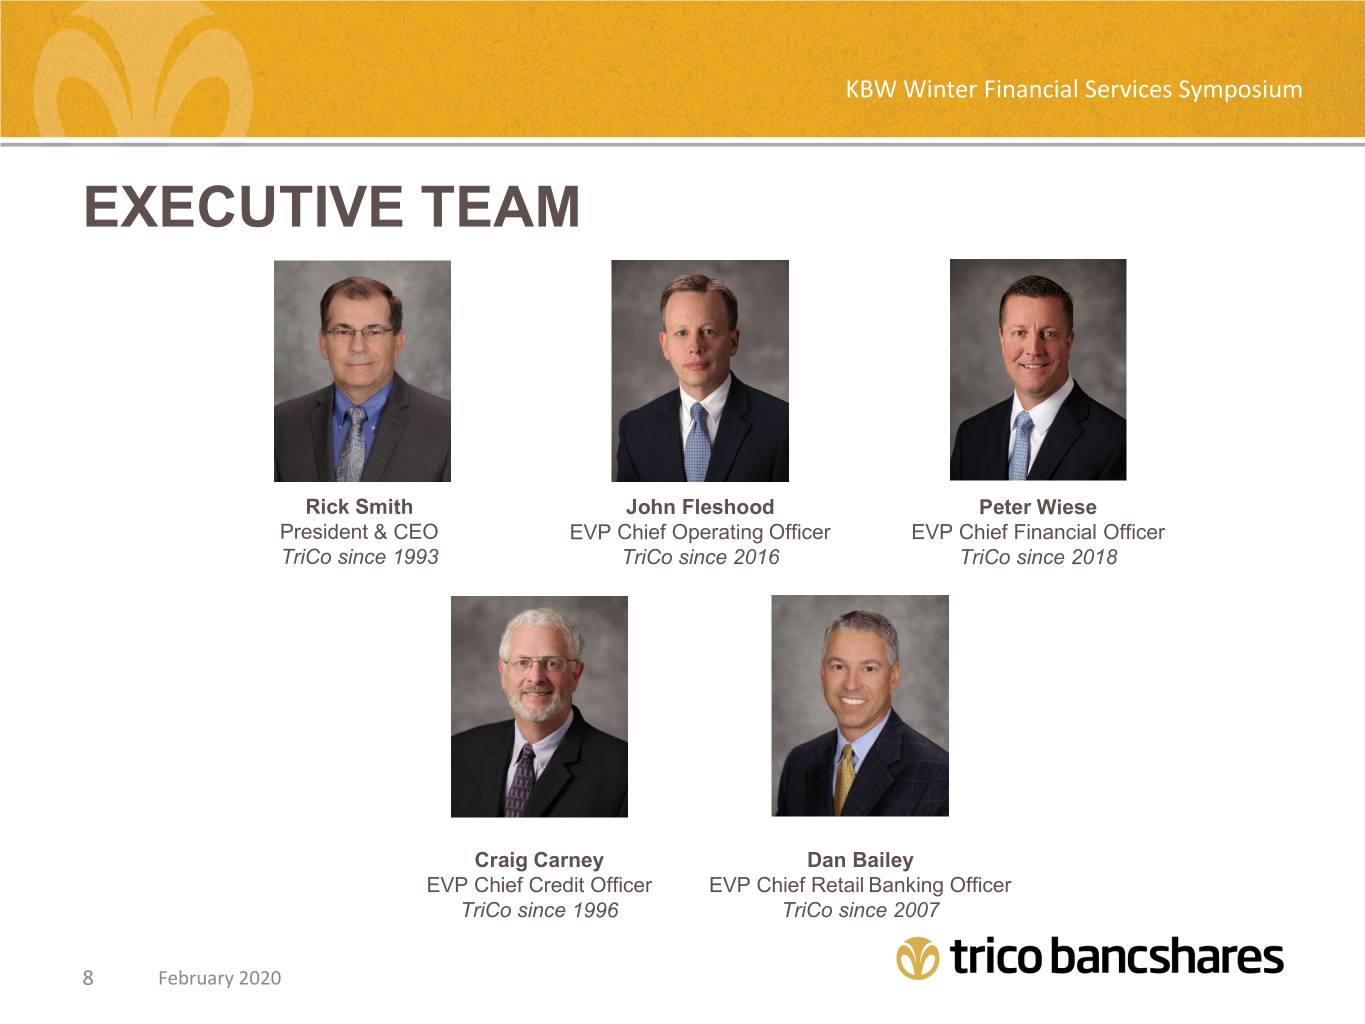
KBW Winter Financial Services Symposium EXECUTIVE TEAM Rick Smith John Fleshood Peter Wiese President & CEO EVP Chief Operating Officer EVP Chief Financial Officer TriCo since 1993 TriCo since 2016 TriCo since 2018 Craig Carney Dan Bailey EVP Chief Credit Officer EVP Chief Retail Banking Officer TriCo since 1996 TriCo since 2007 8 February 2020

KBW Winter Financial Services Symposium CONSISTENT EARNINGS TRACK RECORD $0.80 $24 $22 $0.70 $20 $0.60 $18 $16 $0.50 $14 $0.40 $12 $0.30 $10 (Diluted) E.P.S Earnings (in (in Millions) Earnings $8 $0.20 $6 $0.10 $4 $2 $0.00 Q3 Q4 Q1 Q2 Q3 Q4 * Q1 Q2 Q3 Q4 Q1 Q2 Q3 Q4 2016 2016 2017 2017 2017 2017 2018 2018 2018 2018 2019 2019 2019 2019 Earnings $12.2 $12.5 $12.1 $13.6 $11.9 $3.0 $13.9 $15.0 $16.2 $23.2 $22.7 $23.1 $23.4 $22.9 E.P.S. (Diluted) $0.53 $0.54 $0.52 $0.58 $0.51 $0.13 $0.60 $0.65 $0.53 $0.76 $0.74 $0.75 $0.76 $0.75 * Impact of the Tax Cut and Jobs Act. 9 February 2020
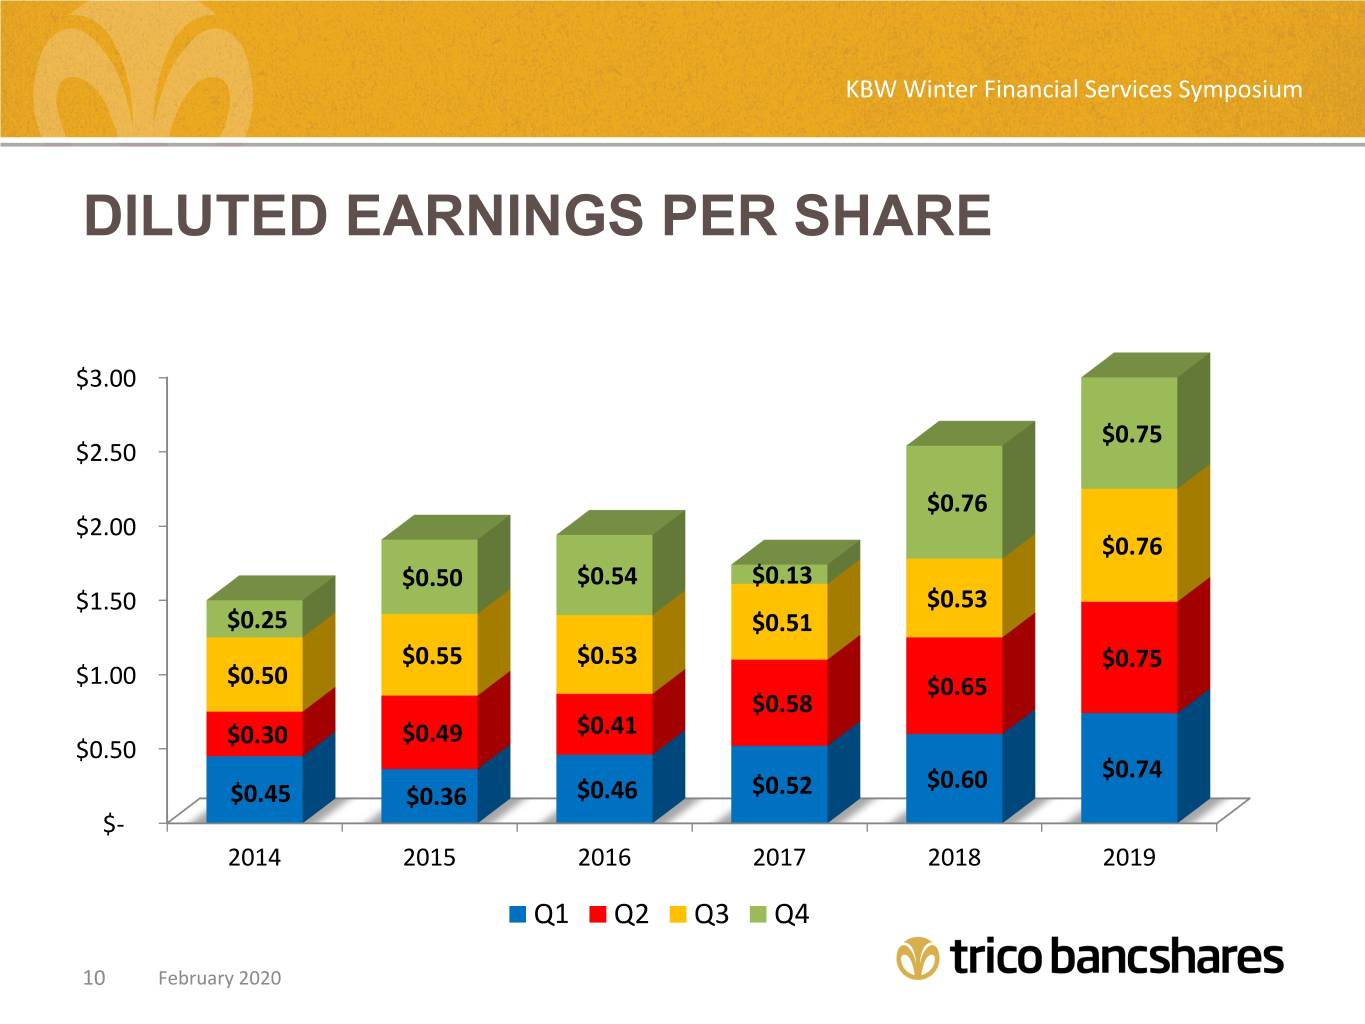
KBW Winter Financial Services Symposium DILUTED EARNINGS PER SHARE $3.00 $0.75 $2.50 $0.76 $2.00 $0.76 $0.50 $0.54 $0.13 $1.50 $0.53 $0.25 $0.51 $0.55 $0.53 $0.75 $1.00 $0.50 $0.65 $0.58 $0.30 $0.49 $0.41 $0.50 $0.60 $0.74 $0.45 $0.36 $0.46 $0.52 $- 2014 2015 2016 2017 2018 2019 Q1 Q2 Q3 Q4 10 February 2020

KBW Winter Financial Services Symposium CONSISTENT ORGANIC GROWTH AND DISCIPLINED ACQUIRER CAGR 5 yrs. 10.6% 10 yrs.11.6% *Total Assets for years ending 2002-2019. 11 February 2020

KBW Winter Financial Services Symposium WHAT KEEPS US UP AT NIGHT? • Aggressive and Irrational Competitors • Duration of Lower Rate Environment • The Cost of Regulatory Compliance • Technology Costs and Limited Vendor Competition • Domestic Policy and International Relationships 12 February 2020

KBW Winter Financial Services Symposium LOANS 13 February 2020
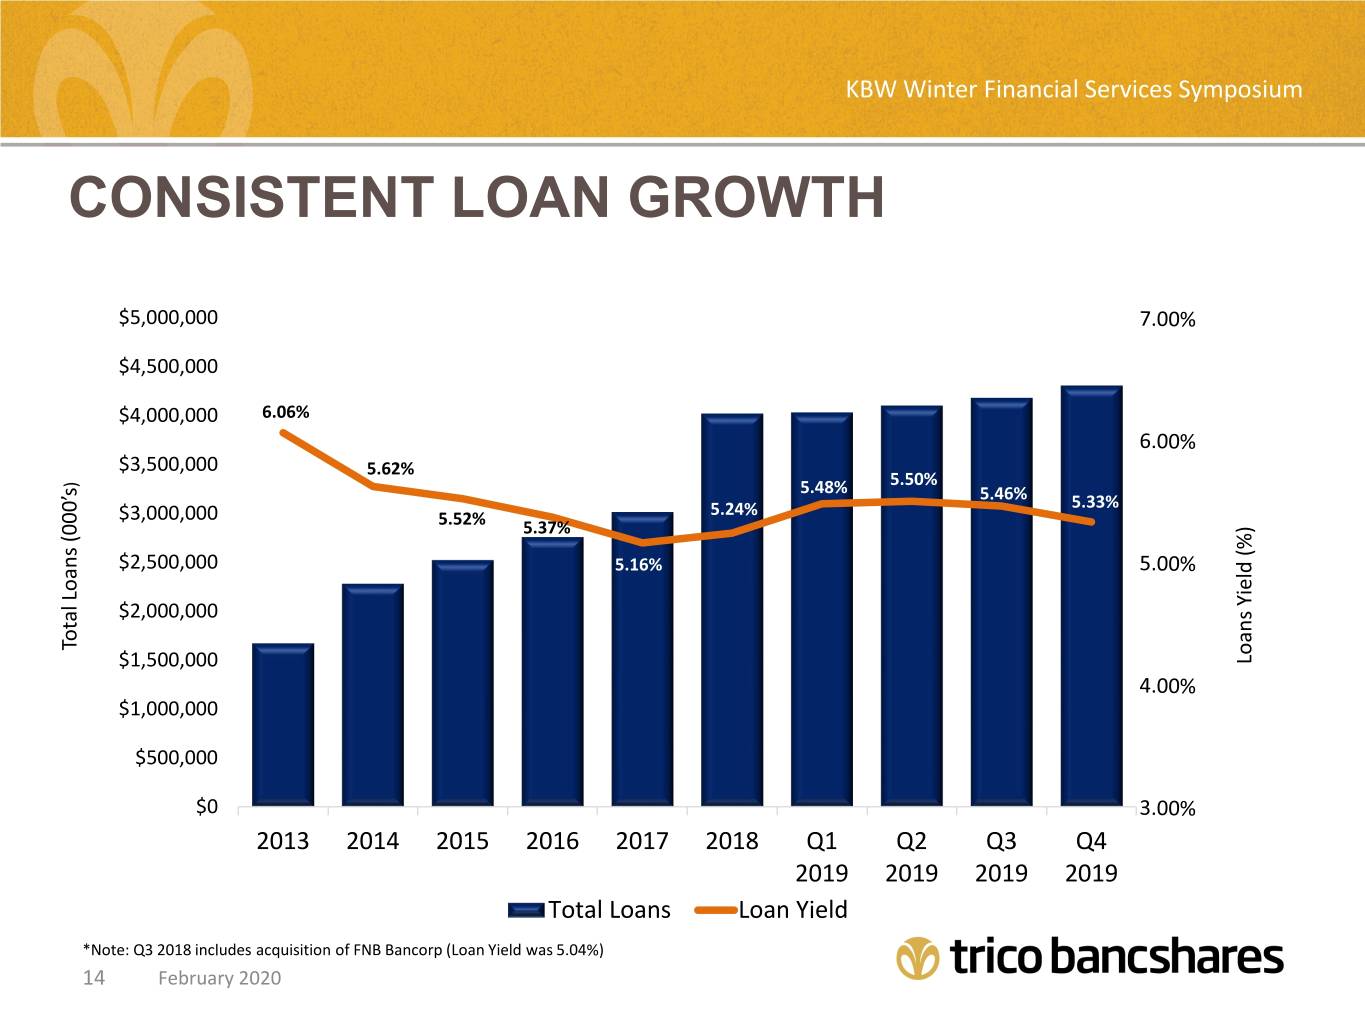
KBW Winter Financial Services Symposium CONSISTENT LOAN GROWTH $5,000,000 $4,500,000 $4,000,000 6.06% $3,500,000 5.62% ) 5.50% 5.48% 5.46% $3,000,000 5.24% 5.33% 5.52% 5.37% $2,500,000 5.16% $2,000,000 Total Loans Loans (000’s Total $1,500,000 (%) Loans Yield $1,000,000 $500,000 $0 2013 2014 2015 2016 2017 2018 Q1 Q2 Q3 Q4 2019 2019 2019 2019 Total Loans Loan Yield *Note: Q3 2018 includes acquisition of FNB Bancorp (Loan Yield was 5.04%) 14 February 2020

KBW Winter Financial Services Symposium LOAN PORTFOLIO MIX: Consumer Loans, $82,657, 2% CRE - Non-Owner 1st Lien Closed-End Occupied, $1,609,556, Loans, $538,094, 13% Argri Production, 39% $32,663, 1% Farmland, $145,067, 3% Commercial & Industrial, $251,074, 6% CRE - Owner Occupied, Total Construction, $546,435, 13% CRE - Multifamily, $517,725, 13% $249,827, 6% Revolving LOC, $145,067, 4% *Excluding loans held-for-sale 15 February 2020

KBW Winter Financial Services Symposium DIVERSIFIED CRE & CONSTRUCTION PORTFOLIO Gas Station /Convenience, $146,303, 5% Restaurant, Self Storage, $99,615, 3% Loan Size $48,784, 2% Property Type Avg. Loan Amount SFR (1-4/Condo) $54,693 Hospitality $2,679,000 Hospitality 2% $240,840 Light Industrial Self Storage $2,034,000 Warehouse, 8% $84,787 $282,754, 10% Commerical - Other, 3% Multifamily Residence $1,595,000 $282,943, 10% Gas Station/Convenience $1,391,000 Retail Building $457,373 Retail Building $940,000 15% Office Building $556,713 Office Building $871,000 19% Warehouse $761,000 Multifamily Residence $668,306 Light Industrial $639,000 23% Commercial - Other $661,000 Restaurant $507,000 SFR (1-4) $732,000 16 February 2020

KBW Winter Financial Services Symposium CONSERVATIVE CONSTRUCTION AND CRE UNDERWRITING CULTURE – LTV DISTRIBUTION 35% 30% 29% Loan to Value Avg. Loan Amount 25% 23% <50% $852,631 20% 51%-60% $660,145 18% 61%-65% $516,384 15% 15% 66%-70% $431,068 % of Portfolio 11% 71%-75% $321.485 10% 76%-80% $86,103 81%-90% $39,606 5% 3% >90% $15,691 1% 1% 0% LTV Range 17 February 2020

KBW Winter Financial Services Symposium DIVERSIFIED GEOGRAPHY – CRE & CONSTRUCTION Outstanding Balance Commitments Average Loan Oustanding County Principal City % of CRE-Related (Millions) (Millions) (Millions) SACRAMENTO Sacramento $296,604 $349,552 10% $1,241 SAN FRANCISCO San Francisco $251,611 $283,524 9% $1,176 KERN Bakersfield $231,885 $278,179 8% $1,506 SAN MATEO Daly City $199,516 $237,188 7% $1,073 BUTTE Chico $167,572 $224,488 6% $555 FRESNO Fresno $128,942 $167,482 4% $955 PLACER Roseville $145,879 $149,979 5% $1,020 SHASTA Redding $138,387 $149,903 5% $558 STANISLAUS Modesto $133,058 $136,754 5% $930 NEVADA Grass Valley $90,271 $106,545 3% $575 ALL OTHER COUNTIES N/A $1,133,069 $1,223,847 39% $836 TOTAL $2,916,794 $3,307,441 AVG. $890 18 February 2020

KBW Winter Financial Services Symposium NON-PERFORMING ASSETS & NET CHARGE OFFS 2.50% 0.25% 0.20% 2.00% 0.15% 0.10% 1.50% 0.10% 0.08% 1.34% 0.06% (annualized) 0.05% 1.01% 0.01% 1.00% 0.00% <-0.03%> 0.58% <-0.05%> 0.53% <Recoveries> Offs 0.50% 0.47% 0.46% <-0.07%> Performing Assets as % of Total Assets Assets as % Assets of Total Performing 0.34%0.35% 2015 - 0.31% 0.30% <-0.10%> <-0.10%> <-0.11%> Non <-0.13%> Net Charge Charge Net <-0.15% 0.00% 2014 2015 2016 2017 2018 Q1 Q2 Q3 Q4 2014 2015 2016 2017 2018 Q1 Q1 Q2 Q3 Q4 2019 2019 2019 2019 2019 2019 2019 2019 2019 19 February 2020

KBW Winter Financial Services Symposium HOME EQUITY LOANS OUTSTANDING $400,000 $390,000 $383,898 $380,000 $370,000 $362,854 $360,000 $350,000 $340,000 $334,300 $331,537 $331,719 $330,900 $331,872 $326,577 Loans (000's) $330,000 $318,252 $320,000 $310,000 $300,000 2014 2015 2016 2017 2018 Q1 2019 Q2 2019 Q3 2019 Q4 2019 20 February 2020

KBW Winter Financial Services Symposium DEPOSITS 21 February 2020

KBW Winter Financial Services Symposium CONSISTENT AND BALANCED CORE DEPOSIT FUNDING* Time Deposits 8% Wtd.Avg. Rate - 1.27% Non Interest Bearing Savings 34% 35% Wtd.Avg. Rate - 0.27% Interest Demand 23% Wtd.Avg. Rate - 0.07% *Weighted average costs of deposits for the quarter ended 12/31/2019 22 February 2020
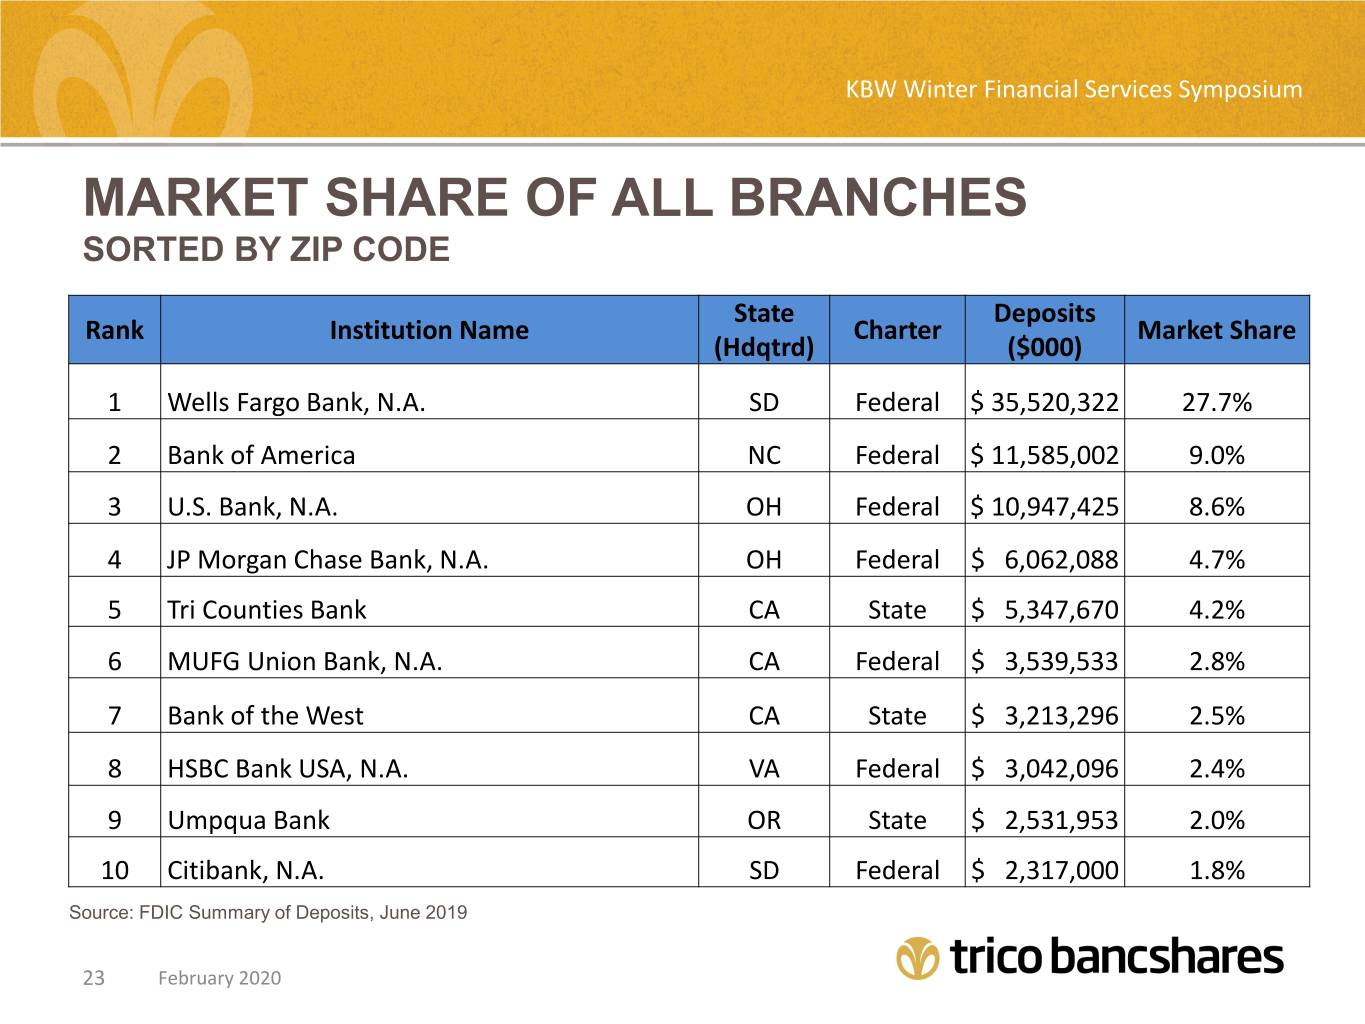
KBW Winter Financial Services Symposium MARKET SHARE OF ALL BRANCHES SORTED BY ZIP CODE State Deposits Rank Institution Name Charter Market Share (Hdqtrd) ($000) 1 Wells Fargo Bank, N.A. SD Federal $ 35,520,322 27.7% 2 Bank of America NC Federal $ 11,585,002 9.0% 3 U.S. Bank, N.A. Wtd. Avg. OH Federal $ 10,947,425 8.6% Rate – 0.92% 4 JP Morgan Chase Bank, N.A. OH Federal $ 6,062,088 4.7% Wtd. Avg. Rate – 0.18% 5 Tri Counties Bank CA State $ 5,347,670 4.2% 6 MUFG Union Bank, N.A. CA Federal $ 3,539,533 2.8% 7 Bank of the West CA State $ 3,213,296 2.5% Wtd. Avg. Rate – 0.09% 8 HSBC Bank USA, N.A. VA Federal $ 3,042,096 2.4% 9 Umpqua Bank OR State $ 2,531,953 2.0% 10 Citibank, N.A. SD Federal $ 2,317,000 1.8% Source: FDIC Summary of Deposits, June 2019 23 February 2020

KBW Winter Financial Services Symposium CONSISTENT DEPOSIT GROWTH – ATTRACTIVE COST $6,000,000 CAGR – TO 12/31/2019 0.50% 5 yrs. 9.7% 10 yrs. 11.4% $5,000,000 0.40% $4,000,000 0.30% 0.23% $3,000,000 0.22% 0.22% 0.20% 0.20% Deposits (000’s) 0.20% $2,000,000 0.15% 0.16% Total 0.12% of Deposits Cost Total 0.10% 0.11% 0.10% 0.09% 0.12% 0.10% $1,000,000 $0 0.00% 2013 2014 2015 2016 2017 Q1 Q2 Q3 Q4 Q1 Q2 Q3 Q4 2018 2018 2018 2018 2019 2019 2019 2019 Total Deposits Cost of Deposits *Note: Q3 2018 includes acquisition of FNB Bancorp (Deposit cost of 0.28%) 24 February 2020

KBW Winter Financial Services Symposium FINANCIALS 25 February 2020

KBW Winter Financial Services Symposium NET INTEREST MARGIN – CONTRIBUTION FROM DISCOUNT ACCRETION 5.00% 0.12% 0.13% 0.14% 0.16% 0.16% 0.10% 0.14% 0.09% 0.16% 0.06% 0.05% 4.52% 4.50% 4.00% 4.49% 4.39% 4.44% 4.39% 4.30% 4.29% 4.23% 4.27% 3.00% 4.22% 2.00% 1.00% 2015 2016 2017 Q1 Q2 Q3 Q4 Q1 Q2 Q3 Q4 2018 2018 2018 2018 2019 2019 2019 2019 Net Interest Margin Effect of Loan Discount Accretion 26 February 2020

KBW Winter Financial Services Symposium RETURN ON AVERAGE ASSETS 1.45% 1.43% 1.44% 1.40% 1.40% 1.24% 1.20% 1.11% 1.03% 1.00% 0.89% 0.80% 0.60% 0.40% 0.20% 0.00% 2015 2016 2017 2018 Q1 2019 Q2 2019 Q3 2019 Q4 2019 27 February 2020

KBW Winter Financial Services Symposium RETURN ON AVERAGE SHAREHOLDER’S EQUITY 12.00% 10.93% 10.75% 10.68% 10.42% 10.04% 10.03% 10.00% 9.47% 8.10% 8.00% 6.00% 4.00% 2.00% 2015 2016 2017 2018 Q1 2019 Q2 2019 Q3 2019 Q4 2019 28 February 2020
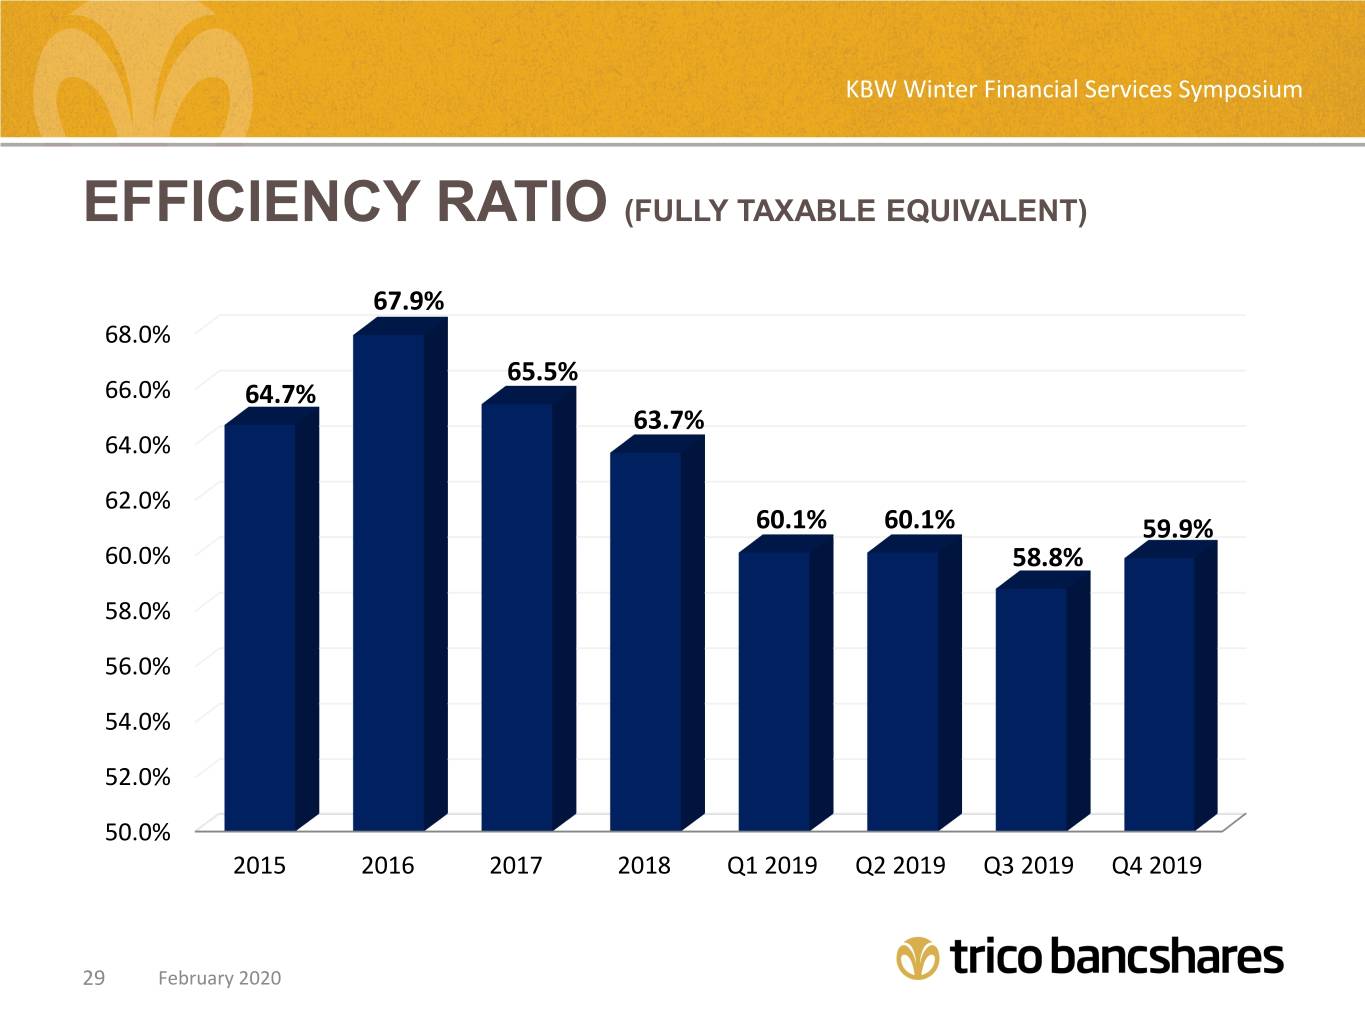
KBW Winter Financial Services Symposium EFFICIENCY RATIO (FULLY TAXABLE EQUIVALENT) 67.9% 68.0% 65.5% 66.0% 64.7% 63.7% 64.0% 62.0% 60.1% 60.1% 59.9% 60.0% 58.8% 58.0% 56.0% 54.0% 52.0% 50.0% 2015 2016 2017 2018 Q1 2019 Q2 2019 Q3 2019 Q4 2019 29 February 2020

KBW Winter Financial Services Symposium DIVIDENDS PAID $0.90 $0.75 0.22 0.19 $0.60 0.17 0.15 0.22 $0.45 0.15 0.17 0.17 0.11 0.15 $0.30 0.13 0.19 0.11 0.17 0.15 0.17 $0.15 0.11 0.13 0.17 0.19 0.11 0.11 0.15 0.15 $0.00 2014 2015 2016 2017 2018 2019 Annual $0.44 $0.52 $0.60 $0.66 $0.70 $0.82 Dividends 30 February 2020

KBW Winter Financial Services Symposium CAPITAL RATIOS ($000’S) 15.7% 16.0% 15.1% 15.2% 15.1% 14.8% 14.9% 14.4% 14.4% 14.5% 14.4% 14.1% 14.1% 14.2% 13.8% 13.7% 13.6% 14.0% 13.2% 13.2% 13.4% 13.3% 13.0% 12.5% 12.2% 12.2% 11.7% 11.7% 12.0% 10.6% 10.6% 10.2% 9.5% 9.7% 10.0% 9.1% 9.2% 9.1% 9.3% 8.0% 6.0% 4.0% 2.0% 0.0% 2014 2015 2016 2017 2018 Q1 2019 Q2 2019 Q3 2019 Q4 2019 Common Equity Tier 1 Tier 1 Total Risk Based Tangible Common 31 February 2020

KBW Winter Financial Services Symposium TRICO BANCSHARES IS COMMITTED TO: Improving the financial success and well-being of our shareholders, customers, communities and employees. 32 FebruaryFebruary 2020 2020
