Attached files
| file | filename |
|---|---|
| EX-99.2 - EXHIBIT 99.2 - FEDERAL NATIONAL MORTGAGE ASSOCIATION FANNIE MAE | q42019financialsupplemen.htm |
| 8-K - 8-K - FEDERAL NATIONAL MORTGAGE ASSOCIATION FANNIE MAE | a2019q48kv1.htm |

Contact: Pete Bakel Resource Center: 1-800-732-6643
202-752-2034 Exhibit 99.1
Date: February 13, 2020
Fannie Mae Reports Net Income of $14.2 Billion for 2019
and $4.4 Billion for Fourth Quarter 2019
Fourth Quarter and Full Year 2019 Results | |||||||||||
• | Fannie Mae reported 2019 net income of $14.2 billion and fourth quarter 2019 net income of $4.4 billion. Fannie Mae’s solid financial performance reflects its strong business fundamentals and stable single-family and multifamily guaranty books. | “Our results further demonstrate the strength and earnings power of Fannie Mae’s business in 2019, including our ability to manage risk and generate solid returns in both our Single-Family and Multifamily business lines. We continue to fulfill our mission to provide liquidity to the mortgage market and meet our housing goals, while growing our guaranty fee income and managing expense growth. We begin 2020 with a net worth of $14.6 billion, thanks to strong retained earnings and prudent risk management.” Hugh R. Frater, Chief Executive Officer | |||||||||
Business Highlights | |||||||||||
• | Fannie Mae’s net worth increased to $14.6 billion as of December 31, 2019, as the company continues to retain quarterly earnings and restore its capital base. Based on the current agreement with the U.S. Department of the Treasury and the Federal Housing Finance Agency (FHFA), the company may retain quarterly earnings until its net worth reaches $25 billion. | ||||||||||
• | Fannie Mae provided more than $650 billion in liquidity to the mortgage market in 2019, helping families across the country to own or rent a home through the financing of more than 3 million home purchases, refinancings, and rental units. | ||||||||||
• | Fannie Mae was the largest issuer of single-family mortgage-related securities in the secondary market during 2019 with an estimated market share of single-family mortgage-related securities issuances of 37%. Fannie Mae has financed approximately 1 in 4 single-family mortgages in the United States. | ||||||||||
• | Fannie Mae provided $70 billion in multifamily financing in 2019, which enabled the financing of 726,000 units of multifamily housing. More than 90% of the multifamily units the company financed in 2019 were affordable to families earning at or below 120% of the area median income, providing support for both affordable and workforce housing. Fannie Mae finances one fifth of the multifamily mortgage debt outstanding in the United States. | ||||||||||
Fannie Mae continued its ongoing capital management and risk reduction efforts in 2019: | |||||||||||
• | Fannie Mae made changes to its Single-Family credit risk transfer structures in 2019, increasing the company’s capital relief and reducing the company’s risk. Fannie Mae also began obtaining credit protection on single-family reference pools containing seasoned loans, increasing the percentage of the company’s book covered by credit risk transfer, reducing the company’s capital requirements, and further reducing risk. | ||||||||||
• | Fannie Mae also enhanced its risk transfer capabilities through the company’s first Multifamily Connecticut Avenue Securities (MCAS™) transaction in the fourth quarter of 2019, while remaining committed to lender risk-sharing through its Delegated Underwriting and Servicing (DUS®) program. These and other multifamily credit enhancements through 2019 have reduced the company’s conservatorship capital requirement for credit risk on multifamily loans acquired in 2018 by more than 70%. | ||||||||||
• | Fannie Mae’s retained mortgage portfolio decreased to $153.6 billion as of December 31, 2019 from $179.2 billion as of December 31, 2018, due primarily to a decrease in the company’s loss mitigation portfolio driven by sales of reperforming loans. | ||||||||||

Fourth Quarter and Full Year 2019 Results | 1 | |
WASHINGTON, DC — Fannie Mae (FNMA/OTCQB) reported annual net income of $14.2 billion and annual comprehensive income of $14.0 billion, compared with net income of $16.0 billion and comprehensive income of $15.6 billion for 2018. The decrease in net income for 2019 was driven primarily by a shift to fair value losses in 2019 from fair value gains in 2018 as a result of decreasing interest rates throughout most of 2019. For the fourth quarter of 2019, Fannie Mae reported net income of $4.4 billion and comprehensive income of $4.3 billion, compared with net income of $4.0 billion and comprehensive income of $4.0 billion for the third quarter of 2019. The increase in net income for the fourth quarter of 2019 was due primarily to an increase in net interest income from the amortization of upfront fees as a result of elevated prepayment rates, an increase in investment gains, and a shift to fair value gains from fair value losses in the third quarter of 2019, partially offset by a decrease in credit-related income.
Summary of Financial Results |
(Dollars in millions) | 4Q19 | 3Q19 | Variance | 2019 | 2018 | Variance | ||||||||||||||||||
Net interest income | $ | 5,850 | $ | 5,229 | $ | 621 | $ | 20,962 | $ | 20,951 | $ | 11 | ||||||||||||
Fee and other income | 301 | 402 | (101 | ) | 1,176 | 979 | 197 | |||||||||||||||||
Net revenues | 6,151 | 5,631 | 520 | 22,138 | 21,930 | 208 | ||||||||||||||||||
Investment gains, net | 923 | 253 | 670 | 1,770 | 952 | 818 | ||||||||||||||||||
Fair value gains (losses), net | 84 | (713 | ) | 797 | (2,214 | ) | 1,121 | (3,335 | ) | |||||||||||||||
Administrative expenses | (786 | ) | (749 | ) | (37 | ) | (3,023 | ) | (3,059 | ) | 36 | |||||||||||||
Credit-related income | ||||||||||||||||||||||||
Benefit for credit losses | 279 | 1,857 | (1,578 | ) | 4,011 | 3,309 | 702 | |||||||||||||||||
Foreclosed property expense | (151 | ) | (96 | ) | (55 | ) | (515 | ) | (617 | ) | 102 | |||||||||||||
Total credit-related income | 128 | 1,761 | (1,633 | ) | 3,496 | 2,692 | 804 | |||||||||||||||||
Temporary Payroll Tax Cut Continuation Act of 2011 (“TCCA”) fees | (626 | ) | (613 | ) | (13 | ) | (2,432 | ) | (2,284 | ) | (148 | ) | ||||||||||||
Other expenses, net | (644 | ) | (571 | ) | (73 | ) | (2,158 | ) | (1,253 | ) | (905 | ) | ||||||||||||
Income before federal income taxes | 5,230 | 4,999 | 231 | 17,577 | 20,099 | (2,522 | ) | |||||||||||||||||
Provision for federal income taxes | (865 | ) | (1,036 | ) | 171 | (3,417 | ) | (4,140 | ) | 723 | ||||||||||||||
Net income | $ | 4,365 | $ | 3,963 | $ | 402 | $ | 14,160 | $ | 15,959 | $ | (1,799 | ) | |||||||||||
Total comprehensive income | $ | 4,266 | $ | 3,977 | $ | 289 | $ | 13,969 | $ | 15,611 | $ | (1,642 | ) | |||||||||||
Net revenues, which consist of net interest income and fee and other income, were $6.2 billion for the fourth quarter of 2019, compared with $5.6 billion for the third quarter of 2019. For the year, net revenues were $22.1 billion, compared with $21.9 billion in 2018.
Net interest income was $5.9 billion for the fourth quarter of 2019, compared with $5.2 billion for the third quarter of 2019. The increase in net interest income for the fourth quarter was due primarily to higher amortization income driven by an increase in mortgage prepayment activity as a result of the declining interest rate environment for most of 2019. For 2019, net interest income was $21.0 billion, substantially unchanged from 2018.
Fourth Quarter and Full Year 2019 Results | 2 | |
Net Interest Income
(Dollars in Billions)
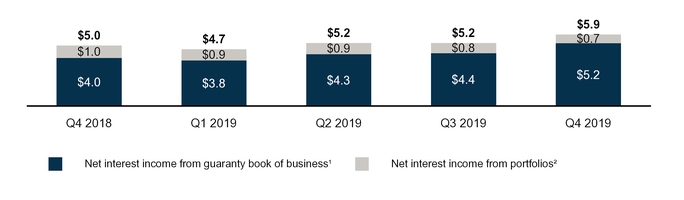
(1) | Includes revenues generated by the 10 basis point guaranty fee increase the company implemented pursuant to the TCCA, the incremental revenue from which is remitted to Treasury and not retained by us. |
(2) | Includes interest income from assets held in the company’s retained mortgage portfolio and other investments portfolio, as well as other assets used to generate lender liquidity. Also includes interest expense on the company’s outstanding corporate debt and Connecticut Avenue Securities® debt. |
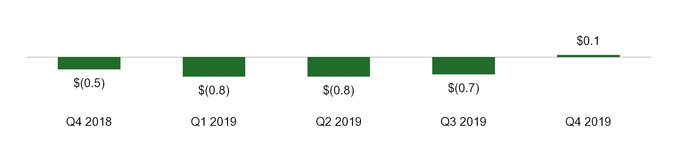
Net fair value gains were $84 million in the fourth quarter of 2019, compared with $713 million in losses in the third quarter of 2019. Net fair value gains in the fourth quarter of 2019 were driven primarily by gains on risk management derivatives due to increases in interest rates in the fourth quarter of 2019. For the year, net fair value losses were $2.2 billion, compared with $1.1 billion in gains in 2018. Net fair value losses for 2019 were due primarily to decreases in interest rates throughout the first nine months of 2019, compared to increases in interest rates throughout most of 2018. Fannie Mae is developing capabilities to implement fair value hedge accounting to reduce the impact of interest-rate volatility on the company’s financial results. Once implemented, derivative fair value gains and losses resulting from changes in certain benchmark interest rates may be reduced by offsetting gains and losses in the fair value of designated hedged mortgage loans or debt. Therefore, the company expects the volatility of its financial results associated with changes in interest rates will be reduced substantially while fair value gains and losses driven by other factors, such as credit spreads, will remain.
Net Fair Value Gains (Losses)
(Dollars in Billions)
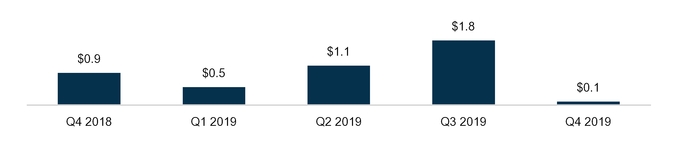
Credit-related income consists of a benefit or provision for credit losses and foreclosed property expense. Credit-related income was $128 million in the fourth quarter of 2019, compared with $1.8 billion in the third quarter of 2019. The decrease in credit-related income in the fourth quarter was driven primarily by a benefit in the third quarter of 2019 due to the company’s enhancement of its model to estimate cash flows for individually impaired single-family loans within the company’s loan loss allowance for single-family loans. Credit-related income was $3.5 billion in 2019, compared with $2.7 billion in 2018. The increase in credit-related income for the year was driven primarily by the third-quarter enhancement to the company’s model and a benefit from decreases in interest rates for most of 2019, compared with increases in interest rates for most of 2018.
Fourth Quarter and Full Year 2019 Results | 3 | |
Credit-Related Income
(Dollars in Billions)
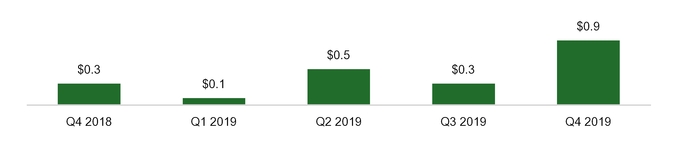
Investment gains were $923 million in the fourth quarter of 2019, compared with $253 million in the third quarter of 2019. Investment gains were $1.8 billion in 2019, compared with $952 million in 2018. The increase in investment gains for the fourth quarter of 2019 and for the year was driven primarily by an increase in gains from sales of single-family held-for-sale loans and available-for-sale securities.
Investment Gains
(Dollars in Billions)
Fourth Quarter and Full Year 2019 Results | 4 | |
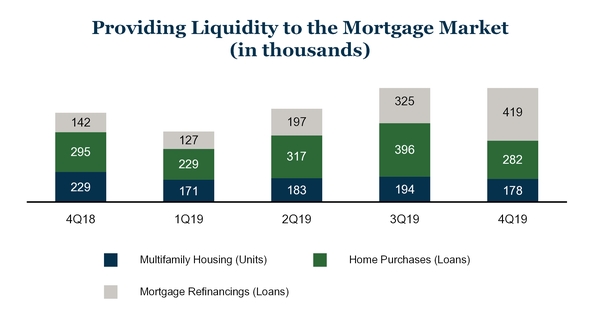
Providing Liquidity and Support to the Market |
Fannie Mae’s mission is to provide a stable source of liquidity to support housing for low-and moderate-income Americans. In 2019, more than 90% of the multifamily units the company financed were affordable to families earning at or below 120% of the area median income, providing support for both affordable and workforce housing.
Fannie Mae provided more than $650 billion in liquidity to the mortgage market in 2019, including approximately $207 billion in liquidity in the fourth quarter of 2019. Through its purchases and guarantees of mortgage loans in 2019, Fannie Mae acquired approximately 2.3 million single-family mortgage loans. Fannie Mae also financed approximately 726,000 units of multifamily housing in 2019, including approximately 178,000 in the fourth quarter of 2019.
Fourth Quarter and Full Year 2019 Results | 5 | |
Business Segments |
Fannie Mae’s two reportable business segments—Single-Family and Multifamily—engage in complementary business activities to provide liquidity, access to credit, and affordability in all U.S. housing markets at all times, while effectively managing risk.
Single-Family Business |
(Dollars in millions) | 4Q19 | 3Q19 | Variance | 2019 | 2018 | Variance | ||||||||||||||||||
Net interest income | $ | 5,071 | $ | 4,484 | $ | 587 | $ | 18,013 | $ | 18,162 | $ | (149 | ) | |||||||||||
Fee and other income | 103 | 156 | (53 | ) | 453 | 450 | 3 | |||||||||||||||||
Net revenues | 5,174 | 4,640 | 534 | 18,466 | 18,612 | (146 | ) | |||||||||||||||||
Investment gains, net | 880 | 198 | 682 | 1,589 | 850 | 739 | ||||||||||||||||||
Fair value gains (losses), net | 148 | (719 | ) | 867 | (2,216 | ) | 1,210 | (3,426 | ) | |||||||||||||||
Administrative expenses | (666 | ) | (634 | ) | (32 | ) | (2,565 | ) | (2,631 | ) | 66 | |||||||||||||
Credit-related income | 124 | 1,747 | (1,623 | ) | 3,515 | 2,709 | 806 | |||||||||||||||||
TCCA fees | (626 | ) | (613 | ) | (13 | ) | (2,432 | ) | (2,284 | ) | (148 | ) | ||||||||||||
Other expenses, net | (482 | ) | (424 | ) | (58 | ) | (1,661 | ) | (1,012 | ) | (649 | ) | ||||||||||||
Income before federal income taxes | 4,552 | 4,195 | 357 | 14,696 | 17,454 | (2,758 | ) | |||||||||||||||||
Provision for federal income taxes | (734 | ) | (872 | ) | 138 | (2,859 | ) | (3,708 | ) | 849 | ||||||||||||||
Net income | $ | 3,818 | $ | 3,323 | $ | 495 | $ | 11,837 | $ | 13,746 | $ | (1,909 | ) | |||||||||||
Serious delinquency rate | 0.66 | % | 0.68 | % | ||||||||||||||||||||
Financial Results
• | Single-Family net income was $3.8 billion in the fourth quarter of 2019, compared with $3.3 billion in the third quarter of 2019. The increase in net income in the fourth quarter was driven primarily by: |
◦ | higher net interest income driven primarily by higher amortization income in the fourth quarter, resulting from increased mortgage prepayment rates; |
◦ | an increase in investment gains driven primarily by an increase in gains from sales of single-family held-for-sale loans and available-for-sale securities; and |
◦ | fair value gains in the fourth quarter compared to fair value losses in the third quarter, driven by increases in interest rates in the fourth quarter. |
◦ | The increase in net income was partially offset by a decrease in credit-related income in the fourth quarter driven primarily by a benefit in the third-quarter due to the company’s enhancement of the its single-family loan loss allowance model. |
• | For the year, single-family net income was $11.8 billion, compared with $13.7 billion in 2018. The decrease in single-family net income in 2019 was driven primarily by a shift to fair value losses in 2019 from fair value gains in 2018 as a result of decreasing interest rates throughout most of 2019. |
Business Highlights
• | The average single-family conventional guaranty book of business increased by $21.6 billion during the fourth quarter of 2019, while the average charged guaranty fee, net of Temporary Payroll Tax Cut Continuation Act of 2011 (TCCA) fees, on the single-family conventional guaranty book remained relatively flat at 44 basis points compared with the third quarter of 2019. |
• | Changes to Fannie Mae's Desktop Underwriter® eligibility guidelines to further limit risk layering improved the credit profile of the company's new acquisitions in 2019, particularly with respect to loans with debt-to-income (DTI) ratios above 45%. The updates to Desktop Underwriter and a higher percentage of refinance acquisitions decreased the share of acquisitions with DTI ratios above 45% from 25% in 2018 to 19% in 2019. |
Fourth Quarter and Full Year 2019 Results | 6 | |
• | The single-family serious delinquency rate was 0.66% as of December 31, 2019, a decrease from 0.76% as of December 31, 2018. Single-family seriously delinquent loans are loans that are 90 days or more past due or in the foreclosure process. |
Multifamily Business |
(Dollars in millions) | 4Q19 | 3Q19 | Variance | 2019 | 2018 | Variance | ||||||||||||||||||
Net interest income | $ | 779 | $ | 745 | $ | 34 | $ | 2,949 | $ | 2,789 | $ | 160 | ||||||||||||
Fee and other income | 198 | 246 | (48 | ) | 723 | 529 | 194 | |||||||||||||||||
Net revenues | 977 | 991 | (14 | ) | 3,672 | 3,318 | 354 | |||||||||||||||||
Fair value losses, net | (64 | ) | 6 | (70 | ) | 2 | (89 | ) | 91 | |||||||||||||||
Administrative expenses | (120 | ) | (115 | ) | (5 | ) | (458 | ) | (428 | ) | (30 | ) | ||||||||||||
Credit-related income (expense) | 4 | 14 | (10 | ) | (19 | ) | (17 | ) | (2 | ) | ||||||||||||||
Other income (expense) | (119 | ) | (92 | ) | (27 | ) | (316 | ) | (139 | ) | (177 | ) | ||||||||||||
Income before federal income taxes | 678 | 804 | (126 | ) | 2,881 | 2,645 | 236 | |||||||||||||||||
Provision for federal income taxes | (131 | ) | (164 | ) | 33 | (558 | ) | (432 | ) | (126 | ) | |||||||||||||
Net income | $ | 547 | $ | 640 | $ | (93 | ) | $ | 2,323 | $ | 2,213 | $ | 110 | |||||||||||
Serious delinquency rate | 0.04 | % | 0.06 | % | ||||||||||||||||||||
Financial Results
• | Multifamily net income was $547 million in the fourth quarter of 2019, compared with $640 million in the third quarter of 2019. The decrease in net income in the fourth quarter of 2019 was due primarily to: |
◦ | a decrease in fee and other income resulting from a decrease in prepayment volume; and |
◦ | fair value losses in the fourth quarter compared with fair value gains in the third quarter, driven primarily by losses on commitments as a result of rising interest rates during commitment periods in the fourth quarter; |
◦ | partially offset by an increase in guaranty fee revenue as the multifamily book grew during the quarter. |
• | Multifamily net income was $2.3 billion in 2019, compared with $2.2 billion in 2018. The increase in multifamily net income in 2019 was attributable primarily to an increase in yield maintenance revenue driven by higher prepayment volumes and an increase in guaranty fee income as a result of growth on the company’s multifamily guaranty book of business, partially offset by a decrease in charged guaranty fees on the multifamily guaranty book. |
Business Highlights
• | The average multifamily guaranty book of business increased by approximately $8 billion during the fourth quarter of 2019 to $334 billion, while the average charged guaranty fee on the multifamily book remained relatively flat at 72 basis points compared with the third quarter of 2019. |
• | New multifamily business volume was $18 billion in the fourth quarter of 2019. On September 13, 2019, the Federal Housing Finance Agency’s (FHFA) revised the multifamily business volume cap structure setting a $100 billion cap for the five-quarter period ending December 31, 2020. Approximately $82 billion of new business capacity remains under the revised cap structure. |
• | The multifamily serious delinquency rate was 0.04% as of December 31, 2019, a decrease from 0.06% as of December 31, 2018. Multifamily seriously delinquent loans are loans that are 60 days or more past due. |
Fourth Quarter and Full Year 2019 Results | 7 | |
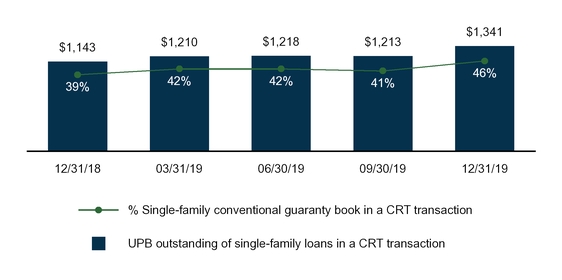
Credit Risk Transfer Transactions |
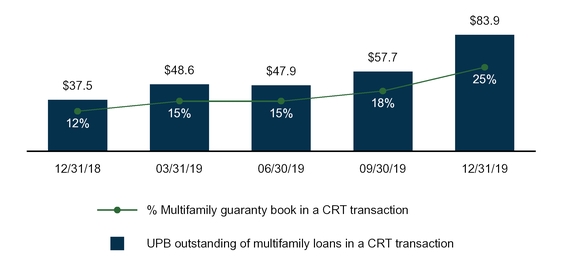
Fannie Mae continues to support the growth of the credit risk transfer market and expand the types of loans covered by its credit risk transfer structures. Fannie Mae enters into credit-risk transfer transactions when it is economically advantageous to do so. Because they reduce credit risk, the company’s credit-risk transfer transactions and other credit enhancements also help the company manage capital. For single-family loans, the company offers Fannie Mae’s benchmark Connecticut Avenue Securities® (CAS) REMIC™ transactions and its Credit Insurance Risk Transfer™ (CIRT™) transactions. In the fourth quarter of 2019, Fannie Mae began obtaining credit protection on single-family reference pools containing seasoned loans, including loans made under the company’s Refi Plus™ program and the Home Affordable Refinance Program. For multifamily mortgages, nearly 100% of the company’s new multifamily business volume in 2019 had lender risk-sharing, primarily through the company’s Delegated Underwriting and Servicing (DUS®) program, as in prior years. To complement the company’s front-end lender loss sharing program through DUS, Fannie Mae also engages in back-end credit risk transfer transactions through its multifamily CIRT transactions and through Multifamily Connecticut Avenue Securities (MCAS™) transactions. Fannie Mae completed its first MCAS transaction in the fourth quarter of 2019.
Fannie Mae continually evaluates loans in its single-family guaranty book of business without credit enhancement to determine whether it makes economic sense to include them in a future CAS or CIRT transaction. The company targets over 90% of acquisitions in the following loan categories for credit risk transfer transactions: fixed-rate single-family conventional loans with terms greater than 20 years that meet certain additional, minimum criteria; loans that are non-Refi Plus; and loans with LTV ratios between 60% and 97%. This criteria covers over 60% of the company’s recent single-family acquisitions. Loans are generally included in reference pools for CAS and CIRT transactions on a lagged basis. In recent years, Fannie Mae has shortened this lag for a majority of target loans to typically less than six months after the company initially acquires the loans. The portion of the company’s single-family loan acquisitions it includes in credit risk transfer transactions can vary from period to period based on market conditions and other factors. Fannie Mae also is evaluating its seasoned loan portfolio, which includes loans that were initially acquired prior to the start of our CAS and CIRT programs, for inclusion in these transactions.
Single-Family Credit Risk Transfer
(Dollars in Billions)
Fourth Quarter and Full Year 2019 Results | 8 | |
Multifamily Credit Risk Transfer
(Dollars in Billions)
Treasury Housing Reform Plan |
On September 5, 2019, Treasury released a plan recommending administrative and legislative reforms to the housing finance system. The Treasury Housing Reform Plan recommends ending Fannie Mae’s conservatorship, considering additional restrictions and requirements on Fannie Mae’s business, and many other matters.
For more information on Treasury’s Housing Reform Plan and risks associated with the plan, as well as the letter agreement with Treasury, see “Business—Conservatorship, Treasury Agreements and Housing Finance Reform” and “Risk Factors” in the company’s 2019 Form 10-K.
Net Worth, Treasury Funding, and Senior Preferred Stock Dividends |
Treasury has made a commitment under a senior preferred stock purchase agreement to provide funding to Fannie Mae under certain circumstances if the company has a net worth deficit. Pursuant to this agreement and the senior preferred stock Fannie Mae issued to Treasury in 2008, the company paid dividends to Treasury on the senior preferred stock on a quarterly basis for every dividend period for which dividends were payable since the company entered conservatorship in 2008.
On September 27, 2019, Fannie Mae and Treasury entered into a letter agreement modifying the terms of the senior preferred stock held by Treasury to permit Fannie Mae to retain up to $25 billion in capital, effective with the third quarter 2019 dividend period. The letter agreement also provides that the liquidation preference of the senior preferred stock increases at the end of each quarter by the increase, if any, in Fannie Mae’s net worth during the immediately prior fiscal quarter, until the liquidation preference has increased by $22 billion pursuant to this provision.
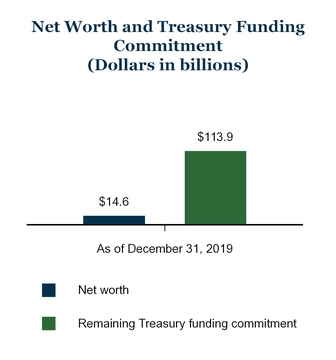
Under the terms of the senior preferred stock, Fannie Mae will not owe dividends to Treasury until it has accumulated over $25 billion in net worth as of the end of a quarter. Accordingly, no dividends were payable to Treasury for the fourth quarter of 2019, and none are payable for the first quarter of 2020. As of December 31, 2019, Fannie Mae’s net worth was $14.6 billion.
Changes in the company’s net worth can be significantly impacted by market conditions that affect its net interest income, fluctuations in the estimated fair value of the company’s derivatives and other financial instruments that the company marks to market through its earnings, developments that affect the company’s loss reserves such as changes in interest rates, home prices or accounting standards, or events such as natural disasters, and other factors, as the company discusses in “Risk Factors” and “ MD&A—Consolidated Results of Operations” in the company’s 2019 Form 10-K.
Fourth Quarter and Full Year 2019 Results | 9 | |
The charts below show information about Fannie Mae’s net worth, the remaining amount of Treasury’s funding commitment to Fannie Mae, senior preferred stock dividends the company has paid Treasury, and funds the company has drawn from Treasury pursuant to its funding commitment.
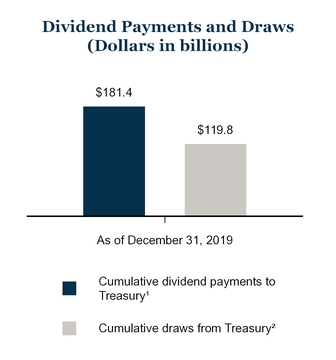
(1) | Aggregate amount of dividends the company has paid to Treasury on the senior preferred stock from 2008 through December 31, 2019. Under the terms of the senior preferred stock purchase agreement, dividend payments the company makes to Treasury do not offset its draws of funds from Treasury. |
(2) | Aggregate amount of funds the company has drawn from Treasury pursuant to the senior preferred stock purchase agreement from 2008 through December 31, 2019. |
The aggregate liquidation preference of the senior preferred stock increased from $127.2 billion as of September 30, 2019 to $131.2 billion as of December 31, 2019 due to the increase in our net worth during the third quarter of 2019. The aggregate liquidation preference of the senior preferred stock will further increase to $135.4 billion as of March 31, 2020 due to the increase in our net worth during the fourth quarter of 2019.
For a description of the terms of the senior preferred stock purchase agreement and the senior preferred stock, see “Business—Conservatorship, Treasury Agreements and Housing Finance Reform” in the company’s 2019 Form 10-K.
Fannie Mae’s financial statements for the full year of 2019 are available in the accompanying Annex; however, investors and interested parties should read the company’s 2019 Form 10-K for a discussion of its financial results and condition, credit performance, and other matters. The Form 10-K was filed today with the Securities and Exchange Commission and is available on Fannie Mae’s website, www.fanniemae.com. Additional information about the company’s credit performance, the characteristics of its guaranty book of business, its foreclosure-prevention efforts, and other measures is contained in the “Q4 and Full Year 2019 Financial Supplement” at www.fanniemae.com.
# # #
In this release, the company has presented a number of estimates, forecasts, expectations, and other forward-looking statements, including statements regarding: the stability of the company’s guaranty books and strength of its business fundamentals; the liquidity the company will provide; the company’s housing goals performance; the company’s future guaranty fees, expenses, retained earnings and capital; other measures of the company’s future profitability, financial condition, and results of operations and the factors that will affect them; the company’s work to implement hedge accounting and the impact of that work; the company’s future dividend payments to Treasury; the future liquidation preference of the senior preferred stock; and the company’s plans relating to and the effects of the company’s credit risk transfer transactions.
Fourth Quarter and Full Year 2019 Results | 10 | |
These estimates, forecasts, expectations, and statements are forward-looking statements based on the company’s current assumptions regarding numerous factors. Actual results, and future projections, could be materially different from what is set forth in the forward-looking statements as a result of: the uncertainty of the company’s future; future legislative or regulatory requirements or changes that have a significant impact on the company’s business, such as the enactment of housing finance reform legislation (including all or any portion of the Treasury Housing Reform Plan), including changes that limit the company’s business activities or footprint; home price changes; interest rate and credit spread changes; macroeconomic factors such as U.S. gross domestic product, unemployment rates, personal income, and the volume of mortgage originations; the size and the company’s share of the U.S. mortgage market and the factors that affect them, including population growth and household formation; the company’s future serious delinquency rates; the company’s and its competitors’ future guaranty fee pricing and the impact of that pricing on the company’s guaranty fee revenues and competitive environment; credit availability; changes in borrower behavior; the effectiveness of its loss mitigation strategies; significant changes in modification and foreclosure activity; the volume and pace of future nonperforming and reperforming loan sales and their impact on the company’s results and serious delinquency rates; the effectiveness of its management of its real estate owned inventory and pursuit of contractual remedies; changes in the fair value of its assets and liabilities; the company’s reliance on Common Securitization Solutions, LLC (CSS) and the common securitization platform for the operation of a majority of its single-family securitization activities; the stability and adequacy of the systems and infrastructure that impact the company’s operations, including the company’s and those of CSS, its other counterparties and other third parties on which the business relies; actions by FHFA, Treasury, the Department of Housing and Urban Development, the Consumer Financial Protection Bureau or other regulators, or Congress, that affect the company’s business, including new capital requirements that become applicable to the company or changes in the ability-to-repay rule to replace the qualified mortgage patch for GSE-eligible loans; the size, composition and quality of the company’s guaranty book of business and retained mortgage portfolio; the competitive landscape in which the company operates, including the impact of legislative or other developments on levels of competition in its industry and other factors affecting its market share; the life of the loans in the company’s guaranty book of business; the company’s reliance on and future updates it makes to its models, including the assumptions used by these models; changes in generally accepted accounting principles; changes to the company’s accounting policies; effects from activities the company takes to support the mortgage market and help borrowers; the company’s future objectives and activities in support of those objectives, including actions the company may take to reach additional underserved creditworthy borrowers; actions the company may be required to take by FHFA, in its role as the company’s conservator or as its regulator, such as changes in the type of business the company does; limitations on the company’s business imposed by FHFA, in its role as the company’s conservator or as its regulator; the conservatorship, including any changes to or termination (by receivership or otherwise) of the conservatorship and its effect on the company’s business; the investment by Treasury, including potential changes to the terms of the senior preferred stock purchase agreement or senior preferred stock, and its effect on the company’s business, including restrictions imposed on the company by the terms of the senior preferred stock purchase agreement, the senior preferred stock and Treasury’s warrant, as well as the possibility that these or other restrictions on the company’s business and activities may be applied to the company through other mechanisms even if the company ceases to be subject to these agreements and instruments; the possibility that future changes in leadership at FHFA or the Administration may result in changes in FHFA’s or Treasury’s willingness to pursue the administrative reform recommendations in the Treasury plan; challenges the company faces in retaining and hiring qualified executives and other employees; the deteriorated credit performance of many loans in the company’s guaranty book of business; a decrease in the company’s credit ratings; defaults by one or more institutional counterparties; resolution or settlement agreements the company may enter into with its counterparties; the impact of increasing interdependence between the single-family mortgage securitization programs of Fannie Mae and Freddie Mac in connection with uniform mortgage-backed securities; operational control weaknesses; changes in the fiscal and monetary policies of the Federal Reserve; changes in the structure and regulation of the financial services industry; the company’s ability to access the debt markets; changes in the demand for Fannie Mae MBS; disruptions or instability in the housing and credit markets; uncertainties relating to the potential phasing out of LIBOR, or other market changes that could impact the loans the company owns or guarantees or its MBS; the company’s need to rely on third parties to fully achieve some of its corporate objectives; the company’s reliance on mortgage servicers; domestic and global political risks and uncertainties; natural disasters, environmental disasters, terrorist attacks, pandemics, or other major disruptive events; cyber attacks or other information security breaches or threats; and many other factors, including those discussed in the “Risk Factors” and “Forward-Looking Statements” sections of and elsewhere in the company’s annual report on Form 10-K for the year ended December 31, 2019, and elsewhere in this release.
Fannie Mae provides website addresses in its news releases solely for readers’ information. Other content or information appearing on these websites is not part of this release.
Fannie Mae helps make the 30-year fixed-rate mortgage and affordable rental housing possible for millions of Americans. We partner with lenders to create housing opportunities for families across the country. We are driving positive changes in housing finance to make the home buying process easier, while reducing costs and risk. To learn more, visit fanniemae.com and follow us on twitter.com/fanniemae.
Fourth Quarter and Full Year 2019 Results | 11 | |
ANNEX
FANNIE MAE
(In conservatorship)
Consolidated Balance Sheets
(Dollars in millions)
As of December 31, | |||||||||||
2019 | 2018 | ||||||||||
ASSETS | |||||||||||
Cash and cash equivalents | $ | 21,184 | $ | 25,557 | |||||||
Restricted cash (includes $33,294 and $17,849, respectively, related to consolidated trusts) | 40,223 | 23,866 | |||||||||
Federal funds sold and securities purchased under agreements to resell or similar arrangements | 13,578 | 32,938 | |||||||||
Investments in securities: | |||||||||||
Trading, at fair value (includes $3,037 and $3,061, respectively, pledged as collateral) | 48,123 | 41,867 | |||||||||
Available-for-sale, at fair value | 2,404 | 3,429 | |||||||||
Total investments in securities | 50,527 | 45,296 | |||||||||
Mortgage loans: | |||||||||||
Loans held for sale, at lower of cost or fair value | 6,773 | 7,701 | |||||||||
Loans held for investment, at amortized cost: | |||||||||||
Of Fannie Mae | 94,911 | 113,039 | |||||||||
Of consolidated trusts | 3,241,494 | 3,142,858 | |||||||||
Total loans held for investment (includes $7,825 and $8,922, respectively, at fair value) | 3,336,405 | 3,255,897 | |||||||||
Allowance for loan losses | (9,016 | ) | (14,203 | ) | |||||||
Total loans held for investment, net of allowance | 3,327,389 | 3,241,694 | |||||||||
Total mortgage loans | 3,334,162 | 3,249,395 | |||||||||
Deferred tax assets, net | 11,910 | 13,188 | |||||||||
Accrued interest receivable, net (includes $8,172 and $7,928, respectively, related to consolidated trusts) | 8,604 | 8,490 | |||||||||
Acquired property, net | 2,366 | 2,584 | |||||||||
Other assets | 20,765 | 17,004 | |||||||||
Total assets | $ | 3,503,319 | $ | 3,418,318 | |||||||
LIABILITIES AND EQUITY | |||||||||||
Liabilities: | |||||||||||
Accrued interest payable (includes $9,361 and $9,133, respectively, related to consolidated trusts) | $ | 10,228 | $ | 10,211 | |||||||
Debt: | |||||||||||
Of Fannie Mae (includes $5,687 and $6,826, respectively, at fair value) | 182,247 | 232,074 | |||||||||
Of consolidated trusts (includes $21,880 and $23,753, respectively, at fair value) | 3,285,139 | 3,159,846 | |||||||||
Other liabilities (includes $376 and $356, respectively, related to consolidated trusts) | 11,097 | 9,947 | |||||||||
Total liabilities | 3,488,711 | 3,412,078 | |||||||||
Commitments and contingencies (Note 16) | — | — | |||||||||
Fannie Mae stockholders’ equity: | |||||||||||
Senior preferred stock (liquidation preference of $131,178 and $123,836, respectively) | 120,836 | 120,836 | |||||||||
Preferred stock, 700,000,000 shares are authorized—555,374,922 shares issued and outstanding | 19,130 | 19,130 | |||||||||
Common stock, no par value, no maximum authorization—1,308,762,703 shares issued and 1,158,087,567 shares outstanding | 687 | 687 | |||||||||
Accumulated deficit | (118,776 | ) | (127,335 | ) | |||||||
Accumulated other comprehensive income | 131 | 322 | |||||||||
Treasury stock, at cost, 150,675,136 shares | (7,400 | ) | (7,400 | ) | |||||||
Total stockholders’ equity (See Note 1: Senior Preferred Stock Purchase Agreement, Senior Preferred Stock and Warrant for information on the related dividend obligation and liquidation preference) | 14,608 | 6,240 | |||||||||
Total liabilities and equity | $ | 3,503,319 | $ | 3,418,318 | |||||||
See Notes to Consolidated Financial Statements in 2019 Form 10-K
Fourth Quarter and Full Year 2019 Results | 12 | |
FANNIE MAE
(In conservatorship)
Consolidated Statements of Operations and Comprehensive Income
(Dollars in millions, except per share amounts)
For the Year Ended December 31, | |||||||||||||||||
2019 | 2018 | 2017 | |||||||||||||||
Interest income: | |||||||||||||||||
Trading securities | $ | 1,627 | $ | 1,336 | $ | 706 | |||||||||||
Available-for-sale securities | 175 | 230 | 335 | ||||||||||||||
Mortgage loans | 116,764 | 114,605 | 108,319 | ||||||||||||||
Federal funds sold and securities purchased under agreements to resell or similar arrangements | 843 | 742 | 373 | ||||||||||||||
Other | 163 | 136 | 123 | ||||||||||||||
Total interest income | 119,572 | 117,049 | 109,856 | ||||||||||||||
Interest expense: | |||||||||||||||||
Short-term debt | (501 | ) | (468 | ) | (250 | ) | |||||||||||
Long-term debt | (98,109 | ) | (95,630 | ) | (88,873 | ) | |||||||||||
Total interest expense | (98,610 | ) | (96,098 | ) | (89,123 | ) | |||||||||||
Net interest income | 20,962 | 20,951 | 20,733 | ||||||||||||||
Benefit for credit losses | 4,011 | 3,309 | 2,041 | ||||||||||||||
Net interest income after benefit for credit losses | 24,973 | 24,260 | 22,774 | ||||||||||||||
Investment gains, net | 1,770 | 952 | 1,522 | ||||||||||||||
Fair value gains (losses), net | (2,214 | ) | 1,121 | (1,211 | ) | ||||||||||||
Fee and other income | 1,176 | 979 | 2,227 | ||||||||||||||
Non-interest income | 732 | 3,052 | 2,538 | ||||||||||||||
Administrative expenses: | |||||||||||||||||
Salaries and employee benefits | (1,486 | ) | (1,451 | ) | (1,328 | ) | |||||||||||
Professional services | (967 | ) | (1,032 | ) | (933 | ) | |||||||||||
Other administrative expenses | (570 | ) | (576 | ) | (476 | ) | |||||||||||
Total administrative expenses | (3,023 | ) | (3,059 | ) | (2,737 | ) | |||||||||||
Foreclosed property expense | (515 | ) | (617 | ) | (521 | ) | |||||||||||
Temporary Payroll Tax Cut Continuation Act of 2011 (“TCCA”) fees | (2,432 | ) | (2,284 | ) | (2,096 | ) | |||||||||||
Other expenses, net | (2,158 | ) | (1,253 | ) | (1,511 | ) | |||||||||||
Total expenses | (8,128 | ) | (7,213 | ) | (6,865 | ) | |||||||||||
Income before federal income taxes | 17,577 | 20,099 | 18,447 | ||||||||||||||
Provision for federal income taxes | (3,417 | ) | (4,140 | ) | (15,984 | ) | |||||||||||
Net income | 14,160 | 15,959 | 2,463 | ||||||||||||||
Other comprehensive loss: | |||||||||||||||||
Changes in unrealized gains on available-for-sale securities, net of reclassification adjustments and taxes | (179 | ) | (344 | ) | (206 | ) | |||||||||||
Other, net of taxes | (12 | ) | (4 | ) | — | ||||||||||||
Total other comprehensive loss | (191 | ) | (348 | ) | (206 | ) | |||||||||||
Total comprehensive income | $ | 13,969 | $ | 15,611 | $ | 2,257 | |||||||||||
Net income | $ | 14,160 | $ | 15,959 | $ | 2,463 | |||||||||||
Dividends distributed or amounts attributable to senior preferred stock | (13,969 | ) | (12,613 | ) | (8,944 | ) | |||||||||||
Net income (loss) attributable to common stockholders | $ | 191 | $ | 3,346 | $ | (6,481 | ) | ||||||||||
Earnings (loss) per share: | |||||||||||||||||
Basic | $ | 0.03 | $ | 0.58 | $ | (1.12 | ) | ||||||||||
Diluted | 0.03 | 0.57 | (1.12 | ) | |||||||||||||
Weighted-average common shares outstanding: | |||||||||||||||||
Basic | 5,762 | 5,762 | 5,762 | ||||||||||||||
Diluted | 5,893 | 5,893 | 5,762 | ||||||||||||||
See Notes to Consolidated Financial Statements in 2019 Form 10-K
Fourth Quarter and Full Year 2019 Results | 13 | |
FANNIE MAE
(In conservatorship)
Consolidated Statements of Cash Flows
(Dollars in millions)
For the Year Ended December 31, | ||||||||||||
2019 | 2018 | 2017 | ||||||||||
Cash flows provided by (used in) operating activities: | ||||||||||||
Net income | $ | 14,160 | $ | 15,959 | $ | 2,463 | ||||||
Reconciliation of net income to net cash provided by operating activities: | ||||||||||||
Amortization of cost basis adjustments | (6,002 | ) | (5,949 | ) | (6,641 | ) | ||||||
Benefit for credit losses | (4,011 | ) | (3,309 | ) | (2,041 | ) | ||||||
Valuation gains | (1,809 | ) | (911 | ) | (1,573 | ) | ||||||
Current and deferred federal income taxes | 1,517 | 3,680 | 14,369 | |||||||||
Net gains related to the disposition of acquired property and preforeclosure sales, including credit enhancements | (917 | ) | (1,785 | ) | (2,426 | ) | ||||||
Other, net | (98 | ) | 440 | (406 | ) | |||||||
Net change in trading securities | (1,630 | ) | (5,454 | ) | 4,511 | |||||||
Interest payment on discounted debt | (5,964 | ) | (423 | ) | (4,043 | ) | ||||||
Net cash provided by (used in) operating activities | (4,754 | ) | 2,248 | 4,213 | ||||||||
Cash flows provided by investing activities: | ||||||||||||
Proceeds from maturities and paydowns of trading securities held for investment | 58 | 182 | 1,206 | |||||||||
Proceeds from sales of trading securities held for investment | 49 | 96 | 241 | |||||||||
Proceeds from maturities and paydowns of available-for-sale securities | 469 | 695 | 2,009 | |||||||||
Proceeds from sales of available-for-sale securities | 537 | 760 | 1,990 | |||||||||
Purchases of loans held for investment | (261,808 | ) | (172,155 | ) | (189,593 | ) | ||||||
Proceeds from repayments of loans acquired as held for investment of Fannie Mae | 12,508 | 15,082 | 22,557 | |||||||||
Proceeds from sales of loans acquired as held for investment of Fannie Mae | 17,794 | 17,511 | 10,241 | |||||||||
Proceeds from repayments and sales of loans acquired as held for investment of consolidated trusts | 552,135 | 401,045 | 435,637 | |||||||||
Advances to lenders | (141,395 | ) | (108,294 | ) | (123,687 | ) | ||||||
Proceeds from disposition of acquired property and preforeclosure sales | 7,425 | 9,321 | 12,221 | |||||||||
Net change in federal funds sold and securities purchased under agreements to resell or similar arrangements | 19,360 | (13,468 | ) | 10,945 | ||||||||
Other, net | (80 | ) | 78 | 641 | ||||||||
Net cash provided by investing activities | 207,052 | 150,853 | 184,408 | |||||||||
Cash flows used in financing activities: | ||||||||||||
Proceeds from issuance of debt of Fannie Mae | 789,572 | 789,355 | 1,034,742 | |||||||||
Payments to redeem debt of Fannie Mae | (834,294 | ) | (834,366 | ) | (1,082,427 | ) | ||||||
Proceeds from issuance of debt of consolidated trusts | 435,235 | 357,846 | 383,793 | |||||||||
Payments to redeem debt of consolidated trusts | (575,706 | ) | (471,151 | ) | (514,637 | ) | ||||||
Payments of cash dividends on senior preferred stock to Treasury | (5,601 | ) | (9,372 | ) | (12,015 | ) | ||||||
Proceeds from senior preferred stock purchase agreement with Treasury | — | 3,687 | — | |||||||||
Other, net | 480 | 63 | 6 | |||||||||
Net cash used in financing activities | (190,314 | ) | (163,938 | ) | (190,538 | ) | ||||||
Net increase (decrease) in cash, cash equivalents and restricted cash | 11,984 | (10,837 | ) | (1,917 | ) | |||||||
Cash, cash equivalents and restricted cash at beginning of period | 49,423 | 60,260 | 62,177 | |||||||||
Cash, cash equivalents and restricted cash at end of period | $ | 61,407 | $ | 49,423 | $ | 60,260 | ||||||
Cash paid during the period for: | ||||||||||||
Interest | $ | 121,542 | $ | 110,415 | $ | 109,480 | ||||||
Income taxes | 1,900 | 460 | 3,090 | |||||||||
Non-cash activities: | ||||||||||||
Net mortgage loans acquired by assuming debt | $ | 273,174 | $ | 231,478 | $ | 258,312 | ||||||
Net transfers from mortgage loans of Fannie Mae to mortgage loans of consolidated trusts | 248,463 | 185,310 | 193,809 | |||||||||
Transfers from advances to lenders to loans held for investment of consolidated trusts | 128,272 | 102,865 | 118,282 | |||||||||
Net transfers from mortgage loans to acquired property | 6,681 | 8,131 | 10,262 | |||||||||
See Notes to Consolidated Financial Statements in 2019 Form 10-K
Fourth Quarter and Full Year 2019 Results | 14 | |
FANNIE MAE
(In conservatorship)
Consolidated Statements of Changes in Equity (Deficit)
(Dollars and shares in millions, except per share amounts)
Fannie Mae Stockholders’ Equity (Deficit) | |||||||||||||||||||||||||||||||||||||
Shares Outstanding | Senior Preferred Stock | Preferred Stock | Common Stock | Accumulated Deficit | Accumulated Other Comprehensive Income | Treasury Stock | Total Equity (Deficit) | ||||||||||||||||||||||||||||||
Senior Preferred | Preferred | Common | |||||||||||||||||||||||||||||||||||
Balance as of December 31, 2016 | 1 | 556 | 1,158 | $ | 117,149 | $ | 19,130 | $ | 687 | $ | (124,253 | ) | $ | 759 | $ | (7,401 | ) | $ | 6,071 | ||||||||||||||||||
Senior preferred stock dividends paid | — | — | — | — | — | — | (12,015 | ) | — | — | (12,015 | ) | |||||||||||||||||||||||||
Comprehensive income: | |||||||||||||||||||||||||||||||||||||
Net income | — | — | — | — | — | — | 2,463 | — | — | 2,463 | |||||||||||||||||||||||||||
Other comprehensive income, net of tax effect: | |||||||||||||||||||||||||||||||||||||
Changes in net unrealized gains on available-for-sale securities (net of taxes of $28) | — | — | — | — | — | — | — | 53 | — | 53 | |||||||||||||||||||||||||||
Reclassification adjustment for gains included in net income (net of taxes of $139) | — | — | — | — | — | — | — | (259 | ) | — | (259 | ) | |||||||||||||||||||||||||
Total comprehensive income | 2,257 | ||||||||||||||||||||||||||||||||||||
Other | — | — | — | — | — | — | — | — | 1 | 1 | |||||||||||||||||||||||||||
Balance as of December 31, 2017 | 1 | 556 | 1,158 | $ | 117,149 | $ | 19,130 | $ | 687 | $ | (133,805 | ) | $ | 553 | $ | (7,400 | ) | $ | (3,686 | ) | |||||||||||||||||
Senior preferred stock dividends paid | — | — | — | — | — | — | (9,372 | ) | — | — | (9,372 | ) | |||||||||||||||||||||||||
Increase to senior preferred stock | — | — | — | 3,687 | — | — | — | — | — | 3,687 | |||||||||||||||||||||||||||
Comprehensive income: | |||||||||||||||||||||||||||||||||||||
Net income | — | — | — | — | — | — | 15,959 | — | — | 15,959 | |||||||||||||||||||||||||||
Other comprehensive income, net of tax effect: | |||||||||||||||||||||||||||||||||||||
Changes in net unrealized gains on available-for-sale securities (net of taxes of $21) | — | — | — | — | — | — | — | (79 | ) | — | (79 | ) | |||||||||||||||||||||||||
Reclassification adjustment for gains included in net income (net of taxes of $70) | — | — | — | — | — | — | — | (265 | ) | — | (265 | ) | |||||||||||||||||||||||||
Other (net of taxes of $0) | — | — | — | — | — | — | — | (4 | ) | — | (4 | ) | |||||||||||||||||||||||||
Total comprehensive income | 15,611 | ||||||||||||||||||||||||||||||||||||
Reclassification related to Tax Cuts and Jobs Act | — | — | — | — | — | — | (117 | ) | 117 | — | — | ||||||||||||||||||||||||||
Balance as of December 31, 2018 | 1 | 556 | 1,158 | $ | 120,836 | $ | 19,130 | $ | 687 | $ | (127,335 | ) | $ | 322 | $ | (7,400 | ) | $ | 6,240 | ||||||||||||||||||
Senior preferred stock dividends paid | — | — | — | — | — | — | (5,601 | ) | — | — | (5,601 | ) | |||||||||||||||||||||||||
Comprehensive income: | |||||||||||||||||||||||||||||||||||||
Net income | — | — | — | — | — | — | 14,160 | — | — | 14,160 | |||||||||||||||||||||||||||
Other comprehensive income, net of tax effect: | |||||||||||||||||||||||||||||||||||||
Changes in net unrealized gains on available-for-sale securities (net of taxes of $0) | — | — | — | — | — | — | — | 1 | — | 1 | |||||||||||||||||||||||||||
Reclassification adjustment for gains included in net income (net of taxes of $48) | — | — | — | — | — | — | — | (180 | ) | — | (180 | ) | |||||||||||||||||||||||||
Other (net of taxes of $3) | — | — | — | — | — | — | — | (12 | ) | — | (12 | ) | |||||||||||||||||||||||||
Total comprehensive income | 13,969 | ||||||||||||||||||||||||||||||||||||
Balance as of December 31, 2019 | 1 | 556 | 1,158 | $ | 120,836 | $ | 19,130 | $ | 687 | $ | (118,776 | ) | $ | 131 | $ | (7,400 | ) | $ | 14,608 | ||||||||||||||||||
See Notes to Consolidated Financial Statements in 2019 Form 10-K
Fourth Quarter and Full Year 2019 Results | 15 | |