Attached files
| file | filename |
|---|---|
| 8-K - FORM 8-K - CF Industries Holdings, Inc. | tm207769-1_8k.htm |
Exhibit 99.1

1 1 2017 Third Quarter Financial Results November 1, 2017 NYSE: CF 2019 Fourth Quarter Financial Results February 12, 2020 NYSE: CF

2 Safe harbor s tatement All statements in this communication by CF Industries Holdings, Inc. (together with its subsidiaries, the “Company”), other t han those relating to historical facts, are forward - looking statements. Forward - looking statements can generally be identified by their use of terms s uch as “anticipate,” “believe,” “could,” “estimate,” “expect,” “intend,” “may,” “plan,” “predict,” “project,” “will” or “would” and similar terms and phrases, including references to assumptions. Forward - looking statements are not guarantees of future performance and are subject to a number of as sumptions, risks and uncertainties, many of which are beyond the Company’s control, which could cause actual results to differ materiall y f rom such statements. These statements may include, but are not limited to, statements about strategic plans and statements about futur e f inancial and operating results. Important factors that could cause actual results to differ materially from those in the forward - looking statements include, among others, the cyclical nature of the Company’s business and the impact of global supply and demand on the Company’s selling prices; the global commodity nature of the Company’s fertilizer products, the conditions in the international market for nitrogen products, and the intense global competition from other fertilizer producers; conditions in the U.S. and European agricultural industry; the volatility of nat ura l gas prices in North America and Europe; difficulties in securing the supply and delivery of raw materials, increases in their costs or delays or int erruptions in their delivery; reliance on third party providers of transportation services and equipment; the significant risks and hazards invol ved in producing and handling the Company’s products against which the Company may not be fully insured; the Company’s ability to manage its indeb ted ness; operating and financial restrictions imposed on the Company by the agreements governing the Company’s senior secured indebted nes s; risks associated with the Company’s incurrence of additional indebtedness; the Company's ability to maintain compliance with covena nts under the agreements governing its indebtedness; downgrades of the Company’s credit ratings; risks associated with cyber security; weat her conditions; risks associated with changes in tax laws and disagreements with taxing authorities; the Company’s reliance on a limited number of key facilities; potential liabilities and expenditures related to environmental, health and safety laws and regulations and permitting requir eme nts; future regulatory restrictions and requirements related to greenhouse gas emissions; risks associated with expansions of the Company’s business , i ncluding unanticipated adverse consequences and the significant resources that could be required; the seasonality of the fertilizer bu sin ess; the impact of changing market conditions on the Company’s forward sales programs; risks involving derivatives and the effectiveness of the Com pany’s risk measurement and hedging activities; risks associated with the operation or management of the strategic venture with CHS Inc. (the "CHS Strategic Venture "), risks and uncertainties relating to the market prices of the fertilizer products that are the subject of the supply agreement wi th CHS Inc. over the life of the supply agreement and the risk that any challenges related to the CHS Strategic Venture will harm the Com pan y's other business relationships; risks associated with the Company’s Point Lisas Nitrogen Limited joint venture; acts of terrorism and regulati ons to combat terrorism; risks associated with international operations; and deterioration of global market and economic conditions. More detailed information about factors that may affect the Company’s performance and could cause actual results to differ materially from those in any forward - looking statements may be found in CF Industries Holdings, Inc.’s filings with the Securities and Exchange Commission, including CF Industries Holdings , I nc.’s most recent annual and quarterly reports on Form 10 - K and Form 10 - Q, which are available in the Investor Relations section of the Company’s website . Forward - looking statements are given only as of the date of this presentation and the Company disclaims any obligation to update or revise the forward - looking statements, whether as a result of new information, future events or otherwise, except as required by law.

3 Note regarding non - GAAP financial measures The Company reports its financial results in accordance with U.S. generally accepted accounting principles (GAAP). Management believes that EBITDA, adjusted EBITDA, free cash flow, free cash flow to Adjusted EBITDA conversion, and free cash flow yield, which are non - GAAP financial measures, provide additional meaningful information regarding the Company's performance and financial strength. Non - GAAP financial measures should be viewed in addition to, and not as an alternative for, the Company's reported results prepared in accordance with GAAP. In addition, because not all companies use identical calculations, EBITDA, adjusted EBITDA, free cash flow, and free cash flow yield included in this presentation may not be comparable to similarly titled measures of other companies. Reconciliations of EBITDA, adjusted EBITDA, free cash flow, and free cash flow yield to the most directly comparable GAAP measures are provided in the tables accompanying this presentation. EBITDA is defined as net earnings attributable to common stockholders plus interest expense - net, income taxes, and depreciation and amortization. Other adjustments include the elimination of loan fee amortization that is included in both interest and amortization, and the portion of depreciation that is included in noncontrolling interests. The Company has presented EBITDA because management uses the measure to track performance and believes that it is frequently used by securities analysts, investors and other interested parties in the evaluation of companies in the industry. Adjusted EBITDA is defined as EBITDA adjusted with the selected items included in EBITDA as summarized in the tables accompanying this presentation. The Company has presented adjusted EBITDA because management uses adjusted EBITDA, and believes it is useful to investors, as a supplemental financial measure in the comparison of year - over - year performance . Free cash flow is defined as net cash provided by operating activities, as stated in the consolidated statements of cash flows, reduced by capital expenditures and distributions to noncontrolling interests. Free cash flow to Adjusted EBITDA conversion is defined as free cash flow divided by Adjusted EBITDA. Free cash flow yield is defined as free cash flow divided by market value of equity (market cap). The Company has presented free cash flow, free cash flow to Adjusted EBITDA conversion, and free cash flow yield because management uses these measures and believes they are useful to investors, as indications of the strength of the Company and its ability to generate cash and to evaluate the Company’s cash generation ability relative to its industry competitors. It should not be inferred that the entire free cash flow amount is available for discretionary expenditures.
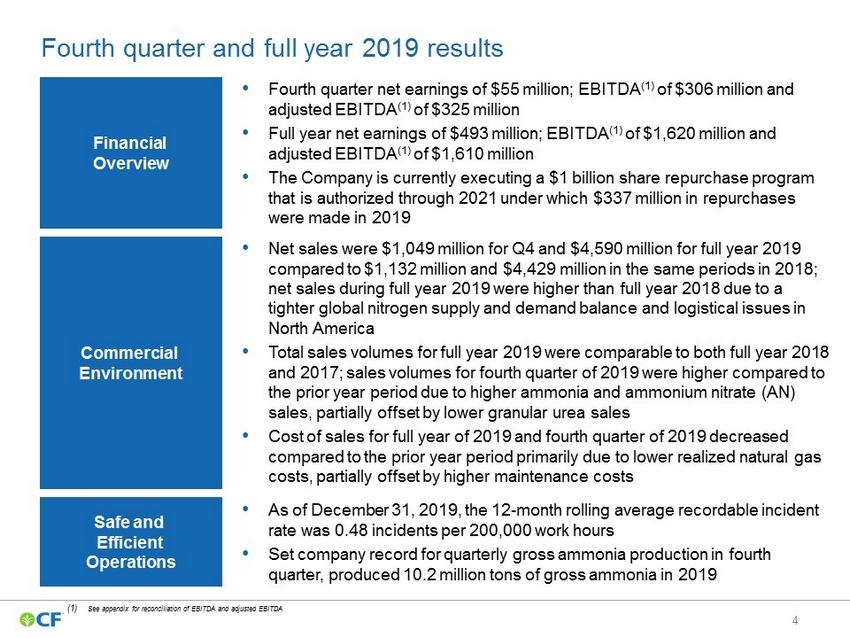
4 Fourth quarter and full year 2019 results (1) See appendix for reconciliation of EBITDA and adjusted EBITDA • Fourth quarter net earnings of $55 million; EBITDA (1 ) of $306 million and adjusted EBITDA (1) of $325 million • Full year net earnings of $493 million; EBITDA (1) of $1,620 million and adjusted EBITDA (1) of $1,610 million • The Company is currently executing a $1 billion share repurchase program that is authorized through 2021 under which $337 million in repurchases were made in 2019 Financial Overview Safe and Efficient Operations • As of December 31, 2019, the 12 - month rolling average recordable incident rate was 0.48 incidents per 200,000 work hours • Set company record for quarterly gross ammonia production in fourth quarter, produced 10.2 million tons of gross ammonia in 2019 Commercial Environment • Net sales were $1,049 million for Q4 and $4,590 million for full year 2019 compared to $1,132 million and $4,429 million in the same periods in 2018; net sales during full year 2019 were higher than full year 2018 due to a tighter global nitrogen supply and demand balance and logistical issues in North America • Total sales volumes for full year 2019 were comparable to both full year 2018 and 2017; sales volumes for fourth quarter of 2019 were higher compared to the prior year period due to higher ammonia and ammonium nitrate (AN) sales, partially offset by lower granular urea sales • Cost of sales for full year of 2019 and fourth quarter of 2019 decreased compared to the prior year period primarily due to lower realized natural gas costs, partially offset by higher maintenance costs

5 Financial results - fourth quarter and full year 2019 I n millions, except percentages, per MMBtu and EPS Q4 201 9 Q4 201 8 Full year 201 9 Full year 201 8 Net sales $ 1,049 $ 1,132 $ 4,590 $ 4,429 Gross margin 227 242 1,174 917 - As percent age of net sales 21.6 % 21.4 % 25.6 % 20.7 % Net earnings attributable to common stockholders (1) 55 49 493 290 Net earnings p er diluted share 0.25 0.21 2.23 1.24 EBITDA ( 2 ) 306 349 1,620 1,429 Adjusted EBITDA ( 2 ) 325 341 1,610 1,403 Diluted weighted - average common shares outstanding 219.0 230.6 221.6 233.8 Natural g as (per MMBtu): Natural gas costs in cost of sales ( 3 ) $ 2.37 $ 3.30 $ 2.75 $ 3.15 Realized derivatives (gain) loss (4 ) (0.01) (0.06) (0.01) 0.01 Cost of natural gas in cost of sales 2.36 3.24 2.74 3.16 Unrealized net mark - to - market loss (gain) on natural gas derivatives 11 (2) 14 (13) (1) Depreciation and amortization wa s $212 million and $875 million for the three and twelve months ended December 31, 2019, respectively, and $221 million and $888 million for the three and twelve months ended December 31, 2018, respectively (2) See appendix for reconciliation of EBITDA and adjusted EBITDA (3) Includes the cost of natural gas and related transportation that is included in cost of sales during the period under the first - in, first - out inventory cost method (4) Includes realized gains and losses on natural gas derivatives settled during the period. Excludes unrealized mark - to - market gains and lo sses on natural gas derivatives

6 (1) Market capitalization is calculated as shares outstanding as of the end of each respective period multiplied by the closing s har e price of each company on February 11, 2020; see appendix for the calculation of market capitalization (2) Represents c ash p rovided by operating a ctivities (cash from operations) less capital expenditures less distributions to noncontrolling interests; see appendix for reconciliation of free cash flow (3) Represents LTM free cash flow divided by LTM Adjusted EBITDA (or EBITDA excluding special items); see appendix for the calcul ati on of free cash flow and for reconciliation of CF LTM (Full year 2019) adjusted EBITDA 915 840 1,545 218 (252) (400) (200) - 200 400 600 800 1,000 1,200 1,400 1,600 CF Yara Nutrien OCI Mosaic CF continues to generate significant free cash flow Free cash flow compared to peers (2) USD in millions LTM 4Q19 Cash from operations (millions) Market Cap (1) (millions ) CF $1,505 Mosaic $968 OCI $537 Nutrien $3,214 Yara $1,907 $9,109 $11,366 $24,824 $4,008 $7,649 LTM 3 Q19 (14.4%) 27.9% 36.1% 38.8% 56.8% FCF to Adjusted EBITDA Conversion (3)

7 7.9 6.8 8.3 6.7 10.3 0 2 4 6 8 10 12 10.0% 7.4% 6.2% 5.4% (3.3%) -4% -2% 0% 2% 4% 6% 8% 10% CF YAR NTR OCI MOS CF offers investors industry best free cash flow yield CF YAR NTR OCI MOS EV / Adj. EBITDA (2)(3) FCF Yield (1) LTM 4Q19 LTM 4Q19 (1) Represents LTM free cash flow divided by market value of equity (market cap) as of February 11, 2020, LTM free cash flow for CF Industries and Yara International is the 12 - month period ending December 31, 2019 and LTM free cash flow for Nutrien , OCI N.V., and Mosaic is the 12 - month period ending September 30, 2019 (2) Enterprise value (EV) is calculated as the sum of market cap and net debt; see appendix for calculation of EV (3) Represents LTM adjusted EBITDA (or EBITDA excluding special items) as reported by CF Industries, Yara International, Nutrien, OCI N.V., and Mosaic; see appendix for reconciliation of CF LTM (Full year 2019) adjusted EBITDA Source : Capital IQ February 11, 2020 LTM 3 Q19 LTM 3 Q19

8 0.0 0.5 1.0 1.5 2.0 2.5 3.0 3.5 4.0 4.5 2011 2012 2013 2014 2015 2016 2017 2018 2019 Exceptional o perational performance… Lowest year - end recordable incident rate Superior c apacity u tilization compared to North American peers (1) 5 yr Rolling Avg. Percent of Capacity Incidents per 200,000 work hours 80% 82% 84% 86% 88% 90% 92% 94% 96% 98% 100% Five Years Ending 2019 • CF’s 12% greater capacity utilization yields an additional ~1.1 million tons of ammonia annually (4) CF North America (2) North America Excl. CF (3) (1) Data taken from the December 20, 2019 CRU Ammonia Database (2) CF represents CF historical North American production and CRU’s capacity estimates for CF (3) North America Excl. CF is calculated by removing CF’s annual reported production and capacity from the CRU data for all North Am erican ammonia production peer group (4) ~1.1 million tons represents the difference between CF’s actual trailing 5 year average ammonia production of 8.8 million ton s a t 96% of capacity utilization and the 7.7 million tons CF would have produced if operated at the 84% CRU North American benchmark excluding CF Note: CRU North American peer group includes AdvanSix , Austin Powder (US Nitrogen), BASF & Yara International, Carbonair , CF Industries, Chevron, CVR Partners, Dakota Gasification Co, Dyno Nobel, Fortigen , Incitec Pivot, Koch Industries, LSB Industries, LSB Industries/Cherokee Nitrogen, Mississippi Power, Mosiac , Nutrien , OCI N.V., RenTech Nitrogen, Sherritt International Corp, Shoreline Chemical, Simplot, and Yara International 96% 84% CF International Fertilizer Industry Association (IFA) U.S. Bureau of Labor Statistics (BLS) – Fertilizer Manufacturing

9 -25% -20% -15% -10% -5% 0% 5% 10% 15% CF Yara Nutrien OCI Mosaic 0 100 200 300 400 500 600 700 800 900 Debt Reduction Return to Shareholders …yields strong results Strong free cash flow supports capital allocation strategy in 2019 Highest 2019 TSR (3) among fertilizer peers Total Shareholder Return $ millions 750 265 Cash Dividends Share Repurchases (2) 602 337 (1) Represents the face value of the 2019 debt reduction and does not include $19 million in make - whole provisions (2) Reflects $337 million of shares repurchased in 2019 and does not include $33 million of shares repurchased in 2018 but cash settled in 2019 (3) Total shareholder return measured from 12/31/2018 to 12/31/2019 ~ $1.35 Billion (1)

10 -100% -50% 0% 50% 100% 150% 200% 250% 0 0.5 1 1.5 2 2.5 3 3.5 4 4.5 5 CF Mosaic Peer Group Index (1) Peers include: Yara International, OCI N.V., Mosaic, Nutrien , Potash - Nutrien , Agrium - Nutrien , LSB Industries, CVR Partners, and Incitec Pivot (2) For purposes of calculating the TSR of CF Industries and the peer group index for the 1, 3, 5, 7, and 10 - year periods ending Dec ember 31, 2019, the beginning stock price for each peer group company was established by its respective closing price on the last trading day immediately preceding January 1 of the first fiscal year of the applicable measurement period. The returns of the peer group companies were weighted according to their respective market capitalizations as of the date used to establish the beginning stock price. For the international peers, Yara International, Incitec Pivot and OCI N.V., we used their respective home exchange stock prices, converted into U.S. dollars for TSR calculation purposes Note: Agrium, Inc. (Agrium) and Potash Corporation of Saskatchewan Inc. (Potash Corp) are included in the peer group companies from December 31, 2009 thr oug h December 31, 2017. On January 2, 2018, Agrium and Potash Corp completed a merger of equals transaction to form Nutrien , Ltd ( Nutrien ) . The cumulative investment in each of Agrium and Potash Corp, assuming dividend reinvestments up to December 31, 2017, was convert ed into shares of Nutrien on January 2, 2018 using the exchange ratio in the merger of equals transaction consummated on that date. Nutrien was included in the peer group companies for the period from January 2, 2018 through December 31, 2019. CVR Partners and OCI N.V. were excluded from the calculation of the 10 - year total shareholder return because they each had less than 10 years of trading history . OCI N.V. was excluded from the calculation of the 7 - year total shareholder return because it has less than 7 years of trading history CF TSR beats all Fertilizer Peers in 1, 3, 7, 10 year periods Total Shareholder Return 1 year 3 year 5 year 7 year 10 year CF Individual Peers (1) Peer Group Index (2)
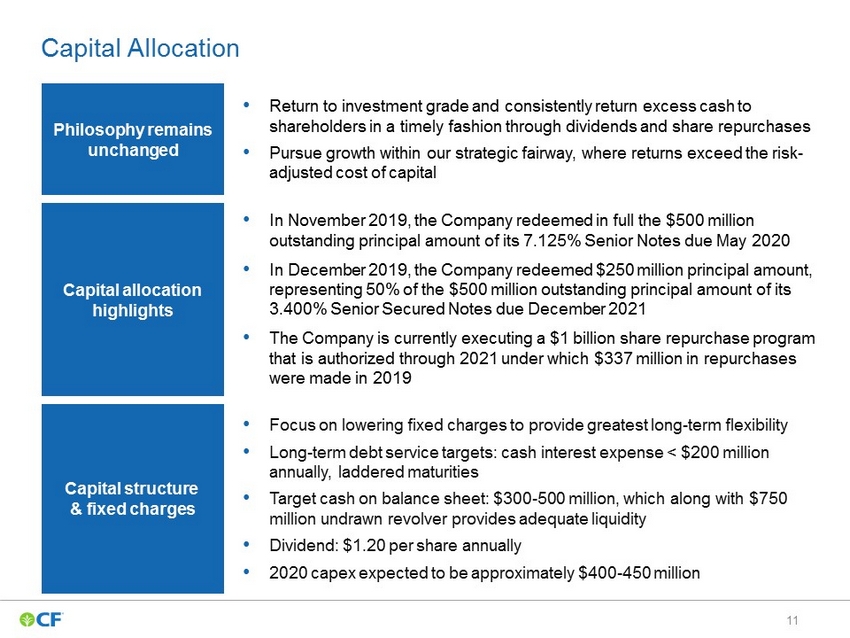
11 Capital Allocation • In November 2019, the Company redeemed in full the $500 million outstanding principal amount of its 7.125% Senior Notes due May 2020 • In December 2019, the Company redeemed $250 million principal amount, representing 50% of the $500 million outstanding principal amount of its 3.400% Senior Secured Notes due December 2021 • The C ompany is currently executing a $1 billion share repurchase program that is authorized through 2021 under which $337 million in repurchases were made in 2019 Capital allocation h ighlights Capital structure & f ixed charges • Focus on lowering fixed charges to provide greatest long - term flexibility • Long - term debt service targets: cash interest exp ense < $200 million annually, laddered maturities • Target cash on balance sheet: $300 - 500 million, which along with $750 million undrawn revolver provides adequate liquidity • Dividend: $1.20 per share annually • 2020 capex expected to be approximately $400 - 450 million Philosophy remains unchanged • Return to investment grade and consistently return excess cash to shareholders in a timely fashion through dividends and share repurchases • Pursue growth within our strategic fairway, where returns exceed the risk - adjusted cost of capital

12 2.6 6.0 (1) 6.0 6.1 6.6 (2) 6.6 7.0 (3) 8.1 (4) 8.1 8.2 (5) 8.2 All N production numbers based on year end figures per 10 - K filings. (1) Beginning in 2010 includes capacity from Terra Industries acquisition (2) Beginning in 2013 includes incremental 34% of Medicine Hat production to reflect CF acquisition of Viterra's interests (3) Beginning in 2015 includes incremental 50% interest in CF Fertilisers UK acquired from Yara (4) Beginning in 2016 excludes nitrogen equivalent of 1.1 million tons of urea and 0.58 million tons of UAN under CHS supply agreement and includes expansion project capacity at Donaldsonville and Port Neal (5) Beginning in 2018 includes incremental 15% of Verdigris production to reflect CF’s acquisition of publicly traded TNH units (6) Share count based on end of year common shares outstanding. Share count prior to 2015 based on 5 - for - 1 split - adjusted shares Production Capacity (M nutrient tons) Annual Nitrogen Equivalent Tons per 1,000 Shares Outstanding CF Industries’ Nitrogen Volumes and Shares Outstanding as of Year - end Million shares Outstanding (6) 2009 – 2019 Nitrogen per share CAGR: 13.5% Capacity growth coupled with share repurchases continue to drive nitrogen participation per share 11 17 18 19 24 27 30 35 35 37 38 0 50 100 150 200 250 300 350 400 0 5 10 15 20 25 30 35 40 45 2009 2010 2011 2012 2013 2014 2015 2016 2017 2018 2019
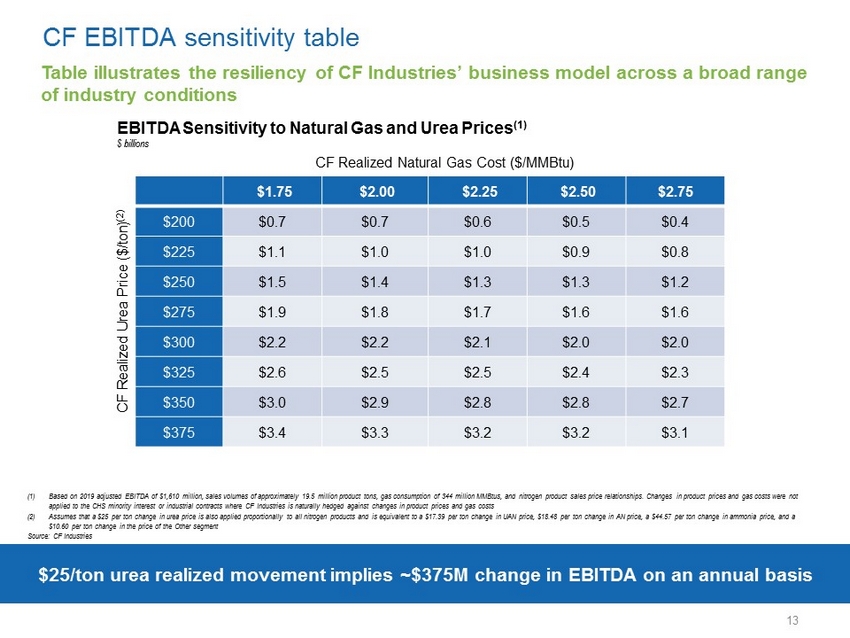
13 (1) Based on 2019 adjusted EBITDA of $ 1,610 million, sales volumes of approximately 19.5 million product tons, gas consumption of 344 million MMBtus, and nitrogen product sales price relationships. Changes in product prices and gas costs were not applied to the CHS minority interest or industrial contracts where CF Industries is naturally hedged against changes in product prices and gas costs (2) Assumes that a $25 per ton change in urea price is also applied proportionally to all nitrogen products and is equivalent to a $ 17.39 per ton change in UAN price, $ 18.48 per ton change in AN price, a $44.57 per ton change in ammonia price, and a $ 10.60 per ton change in the price of the Other segment Source: CF Industries CF EBITDA sensitivity table $25/ton urea realized movement implies ~$ 375M change in EBITDA on an annual basis Table illustrates the resiliency of CF Industries’ business model across a broad range of industry conditions CF Realized Natural Gas Cost ($/MMBtu ) CF Realized Urea Price ($/ ton ) (2) $ billions $1.75 $2.00 $2.25 $2.50 $2.75 $200 $0.7 $0.7 $0.6 $0.5 $0.4 $225 $1.1 $1.0 $1.0 $0.9 $0.8 $250 $1.5 $1.4 $1.3 $1.3 $1.2 $275 $1.9 $1.8 $1.7 $1.6 $1.6 $300 $2.2 $2.2 $2.1 $2.0 $2.0 $325 $2.6 $2.5 $2.5 $2.4 $2.3 $350 $3.0 $2.9 $2.8 $2.8 $2.7 $375 $3.4 $3.3 $3.2 $3.2 $3.1 EBITDA Sensitivity to Natural Gas and Urea Prices (1)

14 Chinese production Outlook Industry fundamentals Global Market Overview • Near - term , global nitrogen demand will be positive as application seasons develop in different regions of the world • Longer - term, the Company expects that the global nitrogen market will tighten as industry fundamentals underpinning the global nitrogen cost curve continue to improve • Chinese coal - based nitrogen complexes expected to remain the global marginal urea producer and thus set the global price • Net Chinese - produced urea exports are likely to be in a range of 2 - 3 million metric tons annually, with additional Chinese export tons possible if urea supply is needed worldwide and global nitrogen prices support positive margins for Chinese marginal urea producers • CF projects global demand growth for nitrogen over the next four years will outpace net capacity additions given the limited number of facilities currently under construction around the world • Demand for urea in Brazil is expected to be positive in 2020, supported by lower domestic urea production • Producers in North America are expected to remain on the low - end of the global cost curve due to access to low - cost North American natural gas • Forward energy curves suggest the cost advantage per metric ton of urea for North American producers should remain well over $100 compared to Chinese anthracite - coal based producers

15 50 100 150 200 250 300 350 400 2016 2017 2018 2019 2020 0 2 4 6 8 10 12 14 16 2016 2017 2018 2019 2020 Henry Hub Natural Gas TTF Natural Gas Chinese Anthacite Coal - Lump Brent Crude Oil CF production cost remains advantaged due to energy cost differentials (1) North American ammonia production assumed to be 37.2 MMBtu per tonne of ammonia for feedstock and fuel, European production assumed to be 37.8 MMBtu per tonne for feedstock and fuel, Chinese production assumed to be 1.2 tonnes of coal and 1300 KWH for feedstock and power (2) Advantage per tonne based on annualized settled prices through January 2020 and forward curve/projections February to December 2020 based on forward curve and projections as of February 6, 2020 (3) North American urea production assumed to be 25 MMBtu per tonne of urea for feedstock and fuel, European production assumed at 26 MMBtu per tonne for feedstock and fuel, Chinese production assumed to be 0.7 tonnes of coal and 929 KWH for feedstock and power (4) Forecast Chinese anthracite coal prices based on WoodMac thermal coal price forecast Note: dotted lines represent forward price curves Source: ICE, Bloomberg, SX Coal, WoodMac Global Energy Price 2016 - 2020F USD/MMBtu Energy Cost per tonne of Ammonia (1) 2016 - 2020F USD/ tonne 2016 2017 2018 2019 2020F TTF $79 $105 $175 $86 $60 Anthracite (4) $133 $157 $200 $198 $214 North American production advantage per tonne (2) of ammonia North American production advantage per tonne (2 )(3) of urea 2016 2017 2018 2019 2020F TTF $ 56 $74 $122 $60 $42 Anthracite (4) $ 81 $93 $117 $118 $129

16 Appendix

17 Non - GAAP: reconciliation of Net Earnings to EBITDA and Adjusted EBITDA (1) For the three and twelve months ended December 31, 2019 and the three months ended December 31, 2018, amount relates only to CF Industries Nitrogen, LLC (CFN) as we purchased the remaining publicly traded common units of Terra Nitrogen Company, L.P. (TNCLP) on April 2, 2018; for the twelve months ended December 31, 2018, amount includes $83 million related to CF N and $4 million related to TNCLP (2) Loan fee amortization is included in both interest expense – net and depreciation and amortization (3) Represents proceeds related to a property insurance claim at one of our nitrogen complexes (4) Represents a charge in the twelve months ended December 31, 2019 on the books of Point Lisas Nitrogen Limited (PLNL), the Company’s Trinidad joint venture, for a tax withholding matter. Amount reflects our 50 percent equity interest in PLNL In millions Q4 201 9 Q4 2018 Full year 2019 Full year 2018 Net earnings $ 94 $ 95 $ 646 $ 428 Less: Net earnings attributable to noncontrolling interests (39) (46) (153) (138) Net earnings attributable to common stockholders 55 49 493 290 Interest expense – net 47 57 217 228 Income tax provision 13 46 126 119 Depreciation and amortization 212 221 875 888 Less other adjustments: Depreciation and amortization in noncontrolling interests (1) (19) (21) (82) (87) Loan fee amortization (2) (2) (3) (9) (9) EBITDA $ 306 $ 349 $ 1,620 $ 1,429 Unrealized net mark - to - market loss (gain) on natural gas derivatives 11 (2) 14 (13) Gain on foreign currency transactions including intercompany loans (13) (6) (1) (5) Gain on sale of Pine Bend facility - - (45) - Property insurance proceeds (3) - - (15) (10) Costs related to acquisition of TNCLP units - - - 2 PLNL withholding tax charge (4) - - 16 - Loss on debt extinguishment 21 - 21 - Total adjustments $ 19 $ (8) $ (10) $ (26) Adjusted EBITDA $ 325 $ 341 $ 1,610 $ 1,403

18 Non - GAAP: reconciliation of LTM cash from operations to free cash flow and free cash flow yield In millions , except percentages , share price, and ratios CF Yara Nutrien OCI Mosaic Cash provided by operating activities (1) $ 1,505 $ 1,907 $ 3,214 $ 537 $ 968 C apital expenditures (404) (1,066) (1,669) (313) (1,220) Noncontrolling interests (186) (1) - (6) - Free cash flow (2) $ 915 $ 840 $ 1,545 $ 218 $ (252) Free cash flow yield (3) 10.0% 7.4% 6.2% 5.4% (3.3%) Free cash flow to Ad justed EBITDA conversion (4) 56.8% 38.8% 36.1% 27.9% (14.4%) Shares outstanding (5) 216.0 271.0 572.9 210.3 380.0 2/11/2020 Share price – US dollars (6) 42.17 41.94 43.33 19.06 20.13 Market Cap $ 9,109 $ 11,366 $ 24,824 $ 4,008 $ 7,649 Short - term and long - term debt 3,957 3,590 11,343 4,627 4,664 Cash and cash equivalents 287 300 568 568 641 Net Debt (7) $ 3,670 $ 3,290 $ 10,775 $ 4,059 $ 4,023 Enterprise Value (market cap + net debt) 12,779 14,656 35,599 8,067 11,672 Adjusted EBITDA (8) 1,610 2,165 4,279 781 1,748 EV / Adjusted EBITDA 7.9 6.8 8.3 10.3 6.7 (1) LTM cash provided by operating activities (cash from operations) for CF Industries and Yara International is the 12 - month period ending December 31, 2019 and LTM cash provided by operating activities (cash from operations) for Nutrien , OCI N.V., and Mosaic is the 12 - month period ending September 30, 2019 (2) Represents c ash provided by operating activities less capital expenditures less distributions to noncontrolling interests calculated from the December 31, 2019 consolidated s tatement of cash f lows for CF Industries and Yara International and the September 30, 2019 consolidated statement of cash flows for Nutrien , OCI N.V., and Mosaic (3) Represents LTM free cash flow at the end of each respective period divided by market value of equity (market cap) as of February 11, 2020 (4) Represents LTM free cash flow divided by LTM Adjusted EBITDA (5) Shares outstanding taken from the December 31, 2019 balance sheets of CF Industries and Yara International and the September 30, 2019 balance sheets of Nutrien , OCI N.V., and Mosaic (6) Share prices in USD as of February 11, 2020 using historical spot exchange rates, Source Capital IQ (7) Represents short - term debt, current portion of long - term debt, and long - term debt less cash and cash equivalents from the December 31, 2019 balance sheets of CF Industries and Yara International and the September 30, 2019 balance sheets of Nutrien , OCI N.V., and Mosaic (8) Adjusted EBITDA for CF Industries and Yara International is the 12 - month period ending December 31, 2019 and adjusted EBTIDA for Nutrien , OCI N.V., and Mosaic is the 12 - month period ending September 30, 2019

19 0 400 800 1,200 1,600 2,000 2,400 12/31/2018 Net cash provided by operating activities CAPEX Debt Redemption Cash Dividends Share Repurchases NCI & other net cash activity 12/31/2019 682 1,505 (404) 287 (370) (769) $1.5B cash from operations supports capital allocation strategy CF Cash & Cash Equivalents $769 million debt redemption and $635 million returned to shareholders $ millions (265) Cash returned to Shareholders: ($635M) (92) (1) Represents the face value of the 2019 debt reduction of ($750) million and an additional ($19) million in make - whole provisions (2) Reflects ($337) million of shares repurchased in 2019 and ($33) million of shares repurchased in 2018 but cash settled in 201 9 (3) Comprised of: distributions to noncontrolling interests of ($186) million, proceeds from sale of property, plant and equipment of $70 million, insurance proceeds for property, plant and equipment of $15 million, and other investing and financing cash activities (3) ( 2 ) ( 1 )

20 Management actions will result in $188 million reduction in annual fixed charges compared to 2017 (1) 2017 Fixed charges comprised of $350 million CAPEX for new activities in 2017 (excludes $123 million for activities performed in 2016 but paid in 2017), $300 million interest expense on debt, $131 million distributions to noncontrolling interests, and $280 million annual dividends (2) Cash interest expense total includes $55 million from 6.875% senior notes due 2018, $57 million from 7.125% senior notes due 202 0, and $9 million from $250 million portion of 3.400% senior secured notes due 2021 (3) Based on average of 2015 - 2017 cash distributions paid to TNH publicly traded unit holders plus the average of estimated benefit cost savings and network optimization (4) Difference of 2017 annual dividends of $280 million and annualized pro forma dividends of $259 million calculated as 216.0 mi lli on shares outstanding as of December 31, 2019 at $ 1.20 per share annually 1,061 (1) 873 121 (2) 46 (3) 21 (4) 600 700 800 900 1,000 1,100 2017 Fixed charges Cash interest expense TNH cash distribution Annualized dividend Pro forma fixed charges USD in millions Reductions in Annual Fixed Charges $188 Million