Attached files
| file | filename |
|---|---|
| 8-K - 8-K - QUALYS, INC. | d881563d8k.htm |
Exhibit 99.1

Qualys Announces Fourth Quarter and Full Year 2019 Financial Results
2019 Revenue Growth of 15% Year-Over-Year
Q4 Revenue Growth of 14% Year-Over-Year
2019 GAAP EPS: $1.68; 2019 Non-GAAP EPS: $2.33
Q4 GAAP EPS: $0.50; Q4 Non-GAAP EPS: $0.64
Foster City, Calif., – February 12, 2020 – Qualys, Inc. (NASDAQ: QLYS), a pioneer and leading provider of cloud-based security and compliance solutions, today announced financial results for the fourth quarter and full year ended December 31, 2019. For the quarter, the Company reported revenues of $84.7 million, net income under United States Generally Accepted Accounting Principles (“U.S. GAAP”) of $20.7 million, non-GAAP net income of $26.0 million, Adjusted EBITDA of $37.6 million, GAAP earnings per diluted share of $0.50, and non-GAAP earnings per diluted share of $0.64. For the full year ended December 31, 2019, the Company reported revenues of $321.6 million, GAAP net income of $69.3 million, non-GAAP net income of $96.4 million, Adjusted EBITDA of $140.8 million, GAAP earnings per diluted share of $1.68 and non-GAAP earnings per diluted share of $2.33.
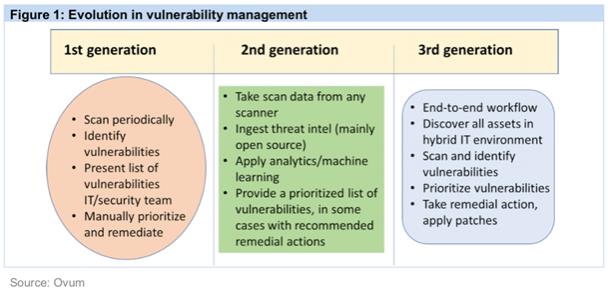
“We are pleased to finish 2019 with another strong quarter that exhibited robust growth in Qualys Cloud Agent subscriptions and multiproduct adoption. Importantly, this year we delivered an impressive suite of new applications to our Qualys Cloud Platform, including Patch Management, Global IT Asset Discovery and Inventory, and Indication of Compromise 2.0, while producing record margins. The 2020 release of our Vulnerability Management, Detection and Response (VMDR) app will elevate Qualys’ market-leading vulnerability management solution to the next level by providing customers with one streamlined workflow to scan, investigate, prioritize and neutralize threats,” said Philippe Courtot, chairman and CEO of Qualys. “Prominent industry analyst, Ovum, recently reported that VMDR represents the next generation of vulnerability management, drastically reducing the time to remediation, while also reducing the operational and licensing costs.”
https://www.qualys.com/forms/whitepapers/ovum/
Fourth Quarter 2019 Financial Highlights
Revenues: Revenues for the fourth quarter of 2019 increased by 14% to $84.7 million compared to $74.2 million for the same quarter in 2018.
Gross Profit: GAAP gross profit for the fourth quarter of 2019 increased by 19% to $67.5 million compared to $56.7 million for the same quarter in 2018. GAAP gross margin percentage was 80% for the fourth quarter of 2019 compared to 76% for the same quarter in 2018. Non-GAAP gross profit for the fourth quarter of 2019 increased by 19% to $69.6 million compared to $58.6 million for the same quarter in 2018. Non-GAAP gross margin percentage was 82% for the fourth quarter of 2019 compared to 79% for the same quarter in 2018.
Operating Income: GAAP operating income for the fourth quarter of 2019 increased by 51% to $19.5 million compared to $12.9 million for the same quarter in 2018. As a percentage of revenues, GAAP operating income was 23% for the fourth quarter of 2019 compared to 17% for the same quarter in 2018. Non-GAAP operating income for the fourth quarter of 2019 increased by 37% to $31.4 million compared to $22.8 million for the same quarter in 2018. As a percentage of revenues, non-GAAP operating income was 37% for the fourth quarter of 2019 compared to 31% for the same quarter in 2018.
Net Income: GAAP net income for the fourth quarter of 2019 was $20.7 million, or $0.50 per diluted share, compared to $14.4 million, or $0.35 per diluted share, for the same quarter in 2018. Non-GAAP net income for the fourth quarter of 2019 was $26.0 million, or $0.64 per diluted share, compared to non-GAAP net income of $21.3 million, or $0.51 per diluted share, for the same quarter in 2018.
Adjusted EBITDA: Adjusted EBITDA (a non-GAAP financial measure) for the fourth quarter of 2019 increased by 29% to $37.6 million compared to $29.1 million for the same quarter in 2018. As a percentage of revenues, adjusted EBITDA was 44% for the fourth quarter of 2019 compared to 39% for the same quarter in 2018.
Operating Cash Flow: Operating cash flow for the fourth quarter of 2019 increased by 26% to $33.7 million compared to $26.6 million for the same quarter in 2018. As a percentage of revenues, operating cash flow was 40% for the fourth quarter of 2019 compared to 36% for the same quarter in 2018.
Fourth Quarter 2019 Business Highlights
Select New Customers:
Circle K, City of Coral Springs, Computer Generated Solutions, Department for International Development, Electronics for Imaging, First National of Nebraska, Genius Sports, Roblox Corporation, Saudi Electricity Company, Schneider Electric, Southwest Gas Corp, Veon Amsterdam B.V., and Waystar.
Business Highlights:
| • | Introduced Qualys VMDR - Vulnerability Management, Detection and Response, a next-level solution delivering a continuous cycle of protection from a single pane of glass with built-in orchestration workflows and real-time vulnerability detection to prioritize, remediate and audit across hybrid IT environments. |
| • | Partnered with Microsoft to integrate Qualys Vulnerability Management and Qualys Container Security into Microsoft Azure providing the capabilities to all Azure Security Center Standard Edition customers for virtual machines and to customers using Azure Security Center’s Advanced Threat Protection for Azure Kubernetes Services. |
| • | Launched a partnership with Google to natively embed the Qualys Cloud Agent into the Google Cloud Platform, delivering one-click integration that automatically installs the Qualys Cloud Agent and reports vulnerabilities directly into the Google Security Command Center. |
| • | Released the Global IT Asset Discovery and Inventory app, built on the Qualys FedRAMP-authorized Cloud Platform, to federal government customers. |
Full Year 2019 Financial Highlights
Revenues: Revenues for 2019 increased by 15% to $321.6 million compared to $278.9 million for 2018.
Gross Profit: GAAP gross profit for 2019 increased by 19% to $252.1 million compared to $212.7 million for 2018. GAAP gross margin percentage was 78% for 2019 compared to 76% for 2018. Non-GAAP gross profit increased by 19% to $260.3 million for 2019 compared to $218.8 million for 2018. Non-GAAP gross margin percentage was 81% for 2019 compared to 78% for 2018.
Operating Income: GAAP operating income for 2019 was $72.3 million compared to $50.4 million for 2018. As a percentage of revenues, GAAP operating income was 22% for 2019 compared to 18% for 2018. Non-GAAP operating income for 2019 was $115.7 million compared to $87.2 million for 2018. As a percentage of revenues, non-GAAP operating income was 36% for 2019 compared to 31% for 2018.
Net Income: GAAP net income for 2019 was $69.3 million, or $1.68 per diluted share, compared to $57.3 million, or $1.37 per diluted share, for 2018. Non-GAAP net income for 2019 was $96.4 million, or $2.33 per diluted share, compared to non-GAAP net income of $73.4 million, or $1.75 per diluted share, for 2018.
Adjusted EBITDA: Adjusted EBITDA (a non-GAAP financial measure) for 2019 increased by 25% to $140.8 million compared to $112.4 million for 2018. As a percentage of revenues, Adjusted EBITDA was 44% for 2019 compared to 40% for 2018.
Operating Cash Flow: Operating cash flow for 2019 was $160.6 million compared to $125.5 million for 2018. As a percentage of revenues, operating cash flow was 50% in 2019 compared to 45% in 2018.
Full Year 2019 Business Highlights
Market Recognition
| • | Recognized by IDC for the fourth year in a row as the revenue share leader in the $1.1 billion Worldwide Device Vulnerability Assessment Market, and as having the fifth largest market share in the $9.3 billion Worldwide Cybersecurity Analytics, Intelligence, Response, and Orchestration Revenue Market for 2018. |
| • | Computing named Qualys the winner of its Enterprise Security Award, recognizing the Qualys Cloud Platform and associated apps for simplifying IT security operations and lowering the cost of compliance by delivering critical security intelligence on demand. |
Products & Features
| • | Introduced Qualys VMDR - Vulnerability Management, Detection and Response, a next-level solution delivering a continuous cycle of protection from a single pane of glass with built-in orchestration workflows and real-time vulnerability detection to prioritize, remediate and audit across hybrid IT environments. |
| • | Launched the Qualys Global IT Asset Discovery and Inventory app as a free service, which provides Security and IT teams a single source of truth to analyze their complex and interconnected global IT environments and enables collaboration on critical security remediation efforts quickly. |
| • | Released Patch Management (PM), a new Cloud App that provides automated patch deployment capabilities, enabling customers to transparently orchestrate full-lifecycle vulnerability management of operating systems and third-party software across global hybrid environments. |
| • | Introduced the Qualys Indication of Compromise (IOC) 2.0 app, which leverages the Qualys Cloud Agent to provide enhanced attack detection, investigation and response for security analysts, incident responders, and managed security service providers. |
| • | Released the Global IT Asset Discovery and Inventory app, built on the Qualys FedRAMP-authorized Cloud Platform, to federal government customers. |
| • | Unveiled a new Cloud Agent Gateway (CAG) Service, an extension of the Cloud Agent Platform, that drastically simplifies large-scale deployments across on-premises and hybrid cloud environments. |
| • | Acquired the software assets of Adya, Inc., enabling Qualys to provide companies of all sizes with the ability to consolidate administration of their Software as a Service (SaaS) applications into one console, manage license costs across SaaS applications, set and enforce security policies in one place, and report and audit on all activity with a single tool. |
Business Development
| • | Partnered with Microsoft to integrate Qualys Vulnerability Management and Qualys Container Security Apps into Microsoft Azure, providing the capabilities to all Azure Security Center Standard Edition customers for virtual machines and to customers using Azure Security Center’s Advanced Threat Protection for Azure Kubernetes Services. |
| • | Launched a partnership with Google to natively embed the Qualys Cloud Agent into the Google Cloud Platform, delivering one-click integration that automatically installs the Qualys Cloud Agent and reports vulnerabilities directly into the Google Security Command Center. |
| • | Expanded the Qualys Global Cloud Platform to the Canadian market, bringing the total number of global operations sites to eight locations on three continents. |
| • | Announced that X-Force Red, IBM Security’s team of veteran hackers, will integrate Qualys’ new dynamic Patch Management solution with X-Force Red’s Vulnerability Management Services to automate vulnerability prioritization and patching, enabling clients to simplify vulnerability remediation and fix their most critical vulnerabilities using less resources and time. |
| • | Partnered with Proficio, a global managed security service provider, who integrated the Qualys suite of cloud-based solutions into its managed detection and response capabilities. |
| • | Selected by the Center for Internet Security (CIS) to provide its members with continuous monitoring of internet-facing digital certificates and SSL/TLS configurations. |
| • | Established a partnership with Coalfire to integrate Qualys vulnerability management and continuous monitoring capabilities into Coalfire’s Secure Cloud Automation Services (SCAS). |
Financial Performance Outlook
First Quarter 2020 Guidance: Management expects revenues for the first quarter of 2020 to be in the range of $85.7 million to $86.4 million, representing 14% to 15% growth over the same quarter in 2019. GAAP net income per diluted share is expected to be in the range of $0.35 to $0.37, which assumes an effective income tax rate of 24%. Non-GAAP net income per diluted share is expected to be in the range of $0.60 to $0.62, which assumes non-GAAP effective income tax rate of 21%. First quarter 2020 earnings per share estimates are based on approximately 40.9 million weighted average diluted shares outstanding for the quarter.
Full Year 2020 Guidance: Management expects revenues for the full year 2020 to be in the range of $364 million to $369 million, representing 13% to 15% growth over 2019. GAAP net income per diluted share is expected to be in the range of $1.60 to $1.65, which assumes an effective income tax rate of 24%. Non-GAAP net income per diluted share is expected to be in the range of $2.57 to $2.62, which assumes a non-GAAP effective income tax rate of 21%. Full year 2020 earnings per share estimates are based on approximately 40.9 million weighted average diluted shares outstanding.
Investor Conference Call
Qualys will host a conference call and live webcast to discuss its fourth quarter and full year 2019 financial results at 4:45 p.m. Eastern Time (1:45 p.m. Pacific Time) on Wednesday, February 12, 2020. To access the conference call, dial (877) 881-2609 in the U.S. or (970) 315-0463 for international participants with conference ID #3389315. A live webcast of the earnings conference call, investor presentation, prepared remarks, and supplemental historical financial spreadsheet can be accessed at https://investor.qualys.com/events-presentations. A replay of the conference call will be available through the same webcast link following the end of the call.
Investor Contact
Vinayak Rao
Vice President, Corporate Development and Investor Relations
(650) 801-6210
ir@qualys.com
About Qualys, Inc.
Qualys, Inc. (NASDAQ: QLYS) is a pioneer and leading provider of cloud-based IT, security and compliance solutions with over 15,700 active customers in more than 130 countries, including a majority of each of the Forbes Global 100 and Fortune 100. Qualys helps organizations streamline and consolidate their IT, security and compliance solutions in a single platform and build security into digital transformation initiatives for greater agility, better business outcomes and substantial cost savings. The Qualys Cloud Platform and its integrated Cloud Apps deliver businesses critical security intelligence continuously, enabling them to automate the full spectrum of auditing, compliance and protection for IT systems and web applications across on premises, endpoints, cloud, containers, and mobile environments. Founded in 1999 as one of the first SaaS security companies, Qualys has established strategic partnerships with leading cloud providers like Amazon Web Services, Microsoft Azure and the Google Cloud Platform, and managed service providers and consulting organizations including Accenture, BT, Cognizant Technology Solutions, Deutsche Telekom, DXC Technology, Fujitsu, HCL Technologies, IBM, Infosys, NTT, Optiv, SecureWorks, Tata Communications, Verizon and Wipro. The company is also a founding member of the Cloud Security Alliance. For more information, please visit www.qualys.com.
Qualys and the Qualys logo are proprietary trademarks of Qualys, Inc. All other products or names may be trademarks of their respective companies.
Legal Notice Regarding Forward-Looking Statements
This press release contains forward-looking statements within the meaning of Section 27A of the Securities Act of 1933 and Section 21E of the Securities Exchange Act of 1934. Forward-looking statements generally relate to future events or our future financial or operating performance. Forward-looking statements in this press release include, but are not limited to, statements related to: our expectations regarding our Qualys Cloud Platform innovation and the capabilities of our platform; our expectations regarding the growth and market acceptance of our Vulnerability Management, Detection, and Response application; the benefits of our strategic acquisitions; the benefits of our new products, integrations, collaborations and joint solutions; our strategy and our business model and our ability to execute such strategy; our guidance for revenues, GAAP EPS and non-GAAP EPS for the first quarter and full year 2020, and our expectations for the number of weighted average diluted shares outstanding
and the GAAP and non-GAAP effective income tax rate for the first quarter and full year 2020. Our expectations and beliefs regarding these matters may not materialize, and actual results in future periods are subject to risks and uncertainties that could cause actual results to differ materially from those projected. These risks include our ability to continue to develop platform capabilities and solutions; the ability of our platform and solutions to perform as intended; customer acceptance and purchase of our existing solutions and new solutions; real or perceived defects, errors or vulnerabilities in our products or services; our ability to retain existing customers and generate new customers; the budgeting cycles, seasonal buying patterns and length of our sales cycle; our ability to manage costs as we increase our customer base and the number of our platform solutions; the market for cloud solutions for IT security and compliance not increasing at the rate we expect; competition from other products and services; fluctuations in currency exchange rates, unexpected fluctuations in our effective income tax rate on a GAAP and non-GAAP basis, our ability to effectively manage our rapid growth and our ability to anticipate future market needs and opportunities; any unanticipated accounting charges; and general market, political, economic and business conditions in the United States as well as globally. The forward-looking statements contained in this press release are also subject to other risks and uncertainties, including those more fully described in our filings with the Securities and Exchange Commission, including our Quarterly Report on Form 10-Q for the quarter ended September 30, 2019, filed with the Securities and Exchange Commission on October 31, 2019.
The forward-looking statements in this press release are based on information available to Qualys as of the date hereof, and Qualys disclaims any obligation to update any forward-looking statements, except as required by law.
Non-GAAP Financial Measures
In addition to reporting financial results in accordance with GAAP, Qualys provides investors with certain non-GAAP financial measures, including non-GAAP gross profit, non-GAAP gross margin, non-GAAP operating expenses, non-GAAP operating income, non-GAAP net income, non-GAAP net income per diluted share, adjusted EBITDA (defined as earnings before interest expense, interest income and other income (expense), net, taxes, depreciation, amortization, stock-based compensation, non-recurring expenses, and acquisition-related expenses that do not reflect ongoing costs of operating the business) and non-GAAP free cash flows (defined as cash provided by operating activities less purchases of property and equipment and principal payments under capital lease).
In computing non-GAAP financial measures, Qualys excludes the effects of stock-based compensation expense, non-recurring expenses and acquisition-related expenses that do not reflect ongoing costs of operating the business. Qualys believes that these non-GAAP financial measures help illustrate underlying trends in its business that could otherwise be masked by the effect of the income or expenses, as well as the related tax effects, that are excluded in non-GAAP gross profit, non-GAAP gross margin, non-GAAP operating expenses, non-GAAP operating income, non-GAAP net income, non-GAAP net income per diluted share, adjusted EBITDA and non-GAAP free cash flows.
Furthermore, Qualys uses some of these non-GAAP financial measures to establish budgets and operational goals for managing its business and evaluating its performance. Qualys believes that non-GAAP gross profit, non-GAAP gross margin, non-GAAP operating expenses, non-GAAP operating income, non-GAAP net income, non-GAAP net income per diluted share, adjusted EBITDA and non-GAAP free cash flows provide additional tools for investors to use in comparing its recurring core business operating results over multiple periods with other companies in its industry.
Although Qualys does not focus on quarterly billings, Qualys provides calculated current billings (defined as total revenue recognized in a period plus the sequential change in current deferred revenue in the corresponding period) to assist investors and analysts in assessing its operating performance.
Qualys has not reconciled non-GAAP net income per diluted share guidance to GAAP net income per diluted share guidance because Qualys does not provide guidance on the various reconciling cash and non-cash items between GAAP net income and non-GAAP net income (i.e., stock-based compensation and non-recurring expenses). The actual dollar amount of reconciling items in the first quarter and full year 2020 is likely to have a significant impact on the Company’s GAAP net income per diluted share in the first quarter and full year 2020. Accordingly, a reconciliation of the non-GAAP net income per diluted share guidance to the GAAP net income per diluted share guidance is not available without unreasonable effort.
In order to provide a more complete picture of recurring core operating business results, the Company’s non-GAAP net income and non-GAAP net income per diluted share include tax adjustments required to achieve the effective income tax rate on a non-GAAP basis, which could differ from the GAAP effective income tax rate. The Company believes its estimated non-GAAP effective income tax rate of 21% in 2020 is a reasonable estimate under its global operating structure. The Company may adjust this rate during the year to take into account events or trends that it believes materially impact the estimated annual rate. The non-GAAP effective income tax rate could be subject to change for a number of reasons, including but not limited to, significant changes resulting from tax legislation, material changes in geographic mix of revenues and expenses and other significant events.
The presentation of this non-GAAP financial information is not intended to be considered in isolation or as a substitute for results prepared in accordance with GAAP. A reconciliation of the non-GAAP financial measures discussed in this press release to the most directly comparable GAAP financial measures is included with the financial statements contained in this press release. Management uses both GAAP and non-GAAP information in evaluating and operating its business internally and as such has determined that it is important to provide this information to investors.
Qualys, Inc.
CONDENSED CONSOLIDATED STATEMENTS OF OPERATIONS
(Unaudited)
(in thousands, except per share data)
| Three Months Ended December 31, | Twelve Months Ended December 31, | |||||||||||||||
| 2019 | 2018 | 2019 | 2018 | |||||||||||||
| Revenues |
$ | 84,664 | $ | 74,200 | $ | 321,607 | $ | 278,889 | ||||||||
| Cost of revenues (1) |
17,163 | 17,525 | 69,517 | 66,185 | ||||||||||||
|
|
|
|
|
|
|
|
|
|||||||||
| Gross profit |
67,501 | 56,675 | 252,090 | 212,704 | ||||||||||||
| Operating expenses: |
||||||||||||||||
| Research and development (1) |
17,808 | 15,073 | 68,239 | 53,255 | ||||||||||||
| Sales and marketing (1) |
19,344 | 19,341 | 70,833 | 70,039 | ||||||||||||
| General and administrative (1) |
10,804 | 9,318 | 40,765 | 39,049 | ||||||||||||
|
|
|
|
|
|
|
|
|
|||||||||
| Total operating expenses |
47,956 | 43,732 | 179,837 | 162,343 | ||||||||||||
|
|
|
|
|
|
|
|
|
|||||||||
| Income from operations |
19,545 | 12,943 | 72,253 | 50,361 | ||||||||||||
| Other income (expense), net: |
||||||||||||||||
| Interest expense |
(8 | ) | (60 | ) | (106 | ) | (171 | ) | ||||||||
| Interest income |
2,052 | 1,887 | 8,443 | 6,080 | ||||||||||||
| Other income (expense), net |
(287 | ) | 35 | (607 | ) | (802 | ) | |||||||||
|
|
|
|
|
|
|
|
|
|||||||||
| Total other income (expense), net |
1,757 | 1,862 | 7,730 | 5,107 | ||||||||||||
|
|
|
|
|
|
|
|
|
|||||||||
| Income before income taxes |
21,302 | 14,805 | 79,983 | 55,468 | ||||||||||||
| Provision (benefit) for income taxes |
638 | 405 | 10,647 | (1,836 | ) | |||||||||||
|
|
|
|
|
|
|
|
|
|||||||||
| Net income |
$ | 20,664 | $ | 14,400 | $ | 69,336 | $ | 57,304 | ||||||||
|
|
|
|
|
|
|
|
|
|||||||||
| Net income per share: |
||||||||||||||||
| Basic |
$ | 0.53 | $ | 0.37 | $ | 1.77 | $ | 1.47 | ||||||||
|
|
|
|
|
|
|
|
|
|||||||||
| Diluted |
$ | 0.50 | $ | 0.35 | $ | 1.68 | $ | 1.37 | ||||||||
|
|
|
|
|
|
|
|
|
|||||||||
| Weighted average shares used in computing net income per share: |
||||||||||||||||
| Basic |
39,003 | 39,200 | 39,075 | 38,876 | ||||||||||||
|
|
|
|
|
|
|
|
|
|||||||||
| Diluted |
40,921 | 41,580 | 41,345 | 41,897 | ||||||||||||
|
|
|
|
|
|
|
|
|
|||||||||
| (1) Includes stock-based compensation as follows: |
||||||||||||||||
| Cost of revenues |
$ | 588 | $ | 601 | $ | 2,262 | $ | 2,489 | ||||||||
| Research and development |
3,276 | 2,207 | 11,151 | 7,961 | ||||||||||||
| Sales and marketing |
1,395 | 981 | 4,984 | 4,650 | ||||||||||||
| General and administrative |
4,470 | 3,629 | 16,495 | 14,990 | ||||||||||||
|
|
|
|
|
|
|
|
|
|||||||||
| Total stock-based compensation |
$ | 9,729 | $ | 7,418 | $ | 34,892 | $ | 30,090 | ||||||||
|
|
|
|
|
|
|
|
|
|||||||||
Qualys, Inc.
CONDENSED CONSOLIDATED BALANCE SHEETS
(Unaudited)
(in thousands)
| December 31, 2019 |
December 31, 2018 |
|||||||
| Assets |
||||||||
| Current assets: |
||||||||
| Cash and cash equivalents |
$ | 87,559 | $ | 41,026 | ||||
| Short-term marketable securities |
211,331 | 248,140 | ||||||
| Accounts receivable, net |
78,034 | 75,825 | ||||||
| Prepaid expenses and other current assets |
18,692 | 13,974 | ||||||
|
|
|
|
|
|||||
| Total current assets |
395,616 | 378,965 | ||||||
| Long-term marketable securities |
119,508 | 76,710 | ||||||
| Property and equipment, net |
60,579 | 61,442 | ||||||
| Operating leases - right of use asset |
40,551 | — | ||||||
| Deferred tax assets, net |
18,830 | 26,387 | ||||||
| Intangible assets, net |
16,795 | 21,976 | ||||||
| Goodwill |
7,447 | 7,225 | ||||||
| Restricted cash |
1,200 | 1,200 | ||||||
| Other noncurrent assets |
15,082 | 11,775 | ||||||
|
|
|
|
|
|||||
| Total assets |
$ | 675,608 | $ | 585,680 | ||||
|
|
|
|
|
|||||
| Liabilities and Stockholders’ Equity |
||||||||
| Current liabilities: |
||||||||
| Accounts payable |
$ | 848 | $ | 5,588 | ||||
| Accrued liabilities |
22,784 | 26,695 | ||||||
| Deferred revenues, current |
192,172 | 164,624 | ||||||
| Operating lease liability, current |
7,663 | — | ||||||
|
|
|
|
|
|||||
| Total current liabilities |
223,467 | 196,907 | ||||||
| Deferred revenues, noncurrent |
20,935 | 20,423 | ||||||
| Operating lease liability, noncurrent |
44,015 | — | ||||||
| Other noncurrent liabilities |
388 | 10,361 | ||||||
|
|
|
|
|
|||||
| Total liabilities |
288,805 | 227,691 | ||||||
| Stockholders’ equity: |
||||||||
| Common stock |
39 | 39 | ||||||
| Additional paid-in capital |
362,408 | 330,572 | ||||||
| Accumulated other comprehensive income (loss) |
1,162 | (586 | ) | |||||
| Retained earnings |
23,194 | 27,964 | ||||||
|
|
|
|
|
|||||
| Total stockholders’ equity |
386,803 | 357,989 | ||||||
|
|
|
|
|
|||||
| Total liabilities and stockholders’ equity |
$ | 675,608 | $ | 585,680 | ||||
|
|
|
|
|
|||||
Qualys, Inc.
CONDENSED CONSOLIDATED STATEMENT OF CASH FLOWS
(Unaudited)
(in thousands)
| Twelve Months Ended December 31, |
||||||||
| 2019 | 2018 | |||||||
| Cash flow from operating activities: |
||||||||
| Net income |
$ | 69,336 | $ | 57,304 | ||||
| Adjustments to reconcile net income to net cash provided by |
||||||||
| operative activities: |
||||||||
| Depreciation and amortization expense |
31,201 | 28,904 | ||||||
| Bad debt expense |
247 | 86 | ||||||
| Loss on disposal of property and equipment |
202 | 9 | ||||||
| Stock-based compensation |
34,892 | 30,090 | ||||||
| Amortization of premiums and accretion of discounts on marketable securities |
(1,597 | ) | (1,136 | ) | ||||
| Deferred income taxes |
7,095 | (2,521 | ) | |||||
| Changes in operating assets and liabilities: |
||||||||
| Accounts receivable |
(2,456 | ) | (11,467 | ) | ||||
| Prepaid expenses and other assets |
(6,012 | ) | (4,970 | ) | ||||
| Accounts payable |
(1,076 | ) | 3,515 | |||||
| Accrued liabilities |
715 | 1,426 | ||||||
| Deferred revenues |
28,060 | 24,725 | ||||||
| Other noncurrent liabilities |
— | (501 | ) | |||||
|
|
|
|
|
|||||
| Net cash provided by operating activities |
160,607 | 125,464 | ||||||
|
|
|
|
|
|||||
| Cash flow from investing activities: |
||||||||
| Purchases of marketable securities |
(331,131 | ) | (339,862 | ) | ||||
| Sales and maturities of marketable securities |
328,350 | 285,224 | ||||||
| Purchases of property and equipment |
(27,573 | ) | (22,775 | ) | ||||
| Business combinations |
(4,050 | ) | (13,633 | ) | ||||
| Purchase of privately-held investment |
(625 | ) | (2,500 | ) | ||||
|
|
|
|
|
|||||
| Net cash used in investing activities |
(35,029 | ) | (93,546 | ) | ||||
|
|
|
|
|
|||||
| Cash flow from financing activities: |
||||||||
| Proceeds from exercise of stock options |
24,831 | 24,053 | ||||||
| Payments for taxes related to net share settlement of equity awards |
(15,743 | ) | (14,879 | ) | ||||
| Principal payments under capital lease obligations |
(1,709 | ) | (1,617 | ) | ||||
| Repurchase of common stock |
(86,424 | ) | (85,040 | ) | ||||
|
|
|
|
|
|||||
| Net cash used in financing activities |
(79,045 | ) | (77,483 | ) | ||||
|
|
|
|
|
|||||
| Net increase in cash, cash equivalents and restricted cash |
46,533 | (45,565 | ) | |||||
| Cash, cash equivalents and restricted cash at beginning of period |
42,226 | 87,791 | ||||||
|
|
|
|
|
|||||
| Cash, cash equivalents and restricted cash at end of period |
$ | 88,759 | $ | 42,226 | ||||
|
|
|
|
|
|||||
Qualys, Inc.
RECONCILIATION OF NON-GAAP DISCLOSURES
EBITDA AND ADJUSTED EBITDA
(Unaudited)
(in thousands)
| Three Months Ended December 31, | Twelve Months Ended December 31, | |||||||||||||||
| 2019 | 2018 | 2019 | 2018 | |||||||||||||
| Net income |
$ | 20,664 | $ | 14,400 | $ | 69,336 | $ | 57,304 | ||||||||
| Depreciation and amortization of property and equipment |
6,195 | 6,317 | 25,121 | 25,179 | ||||||||||||
| Amortization of intangible assets |
1,520 | 1,364 | 6,080 | 3,725 | ||||||||||||
| Provision for (Benefit from) income taxes |
638 | 405 | 10,647 | (1,836 | ) | |||||||||||
| Stock-based compensation |
9,729 | 7,418 | 34,892 | 30,090 | ||||||||||||
| Other income (expense), net |
(1,757 | ) | (1,862 | ) | (7,730 | ) | (5,107 | ) | ||||||||
| Acquisition-related expenses (1) (2) (3) (4) |
585 | 1,099 | 2,439 | 3,025 | ||||||||||||
|
|
|
|
|
|
|
|
|
|||||||||
| Adjusted EBITDA |
$ | 37,574 | $ | 29,141 | $ | 140,785 | $ | 112,380 | ||||||||
|
|
|
|
|
|
|
|
|
|||||||||
| (1) | For three months ended December 31, 2019, includes $0.1 million and $0.4 million of compensation related to acquisitions in 2019 and 2018, respectively. |
| (2) | For twelve months ended December 31, 2019, includes $0.7 million, $3.0 million and $0.1 million of compensation related to acquisitions in 2019, 2018 and 2017, respectively, offset by $1.4 million of reversals of previous obligations. |
| (3) | For three months ended December 31, 2018, includes $1.0 million and $0.04 million of compensation related to acquisitions in 2018 and 2017, respectively. |
| (4) | For twelve months ended December 31, 2018, includes $1.0 million and $2.0 million of compensation related to acquisitions in 2018 and 2017, respectively. |
Qualys, Inc.
RECONCILIATION OF NON-GAAP DISCLOSURES
(Unaudited)
(in thousands, except per share data)
| Three Months Ended December 31, |
Twelve Months Ended December 31, |
|||||||||||||||
| 2019 | 2018 | 2019 | 2018 | |||||||||||||
| GAAP Cost of revenues |
$ | 17,163 | $ | 17,525 | $ | 69,517 | $ | 66,185 | ||||||||
| Less: Stock-based compensation |
(588 | ) | (601 | ) | (2,262 | ) | (2,489 | ) | ||||||||
| Less: Acquisition-related expenses (1) |
— | — | (3 | ) | — | |||||||||||
| Less: Amortization of intangible assets |
(1,495 | ) | (1,339 | ) | (5,980 | ) | (3,625 | ) | ||||||||
|
|
|
|
|
|
|
|
|
|||||||||
| Non-GAAP Cost of revenues |
$ | 15,080 | $ | 15,585 | $ | 61,272 | $ | 60,071 | ||||||||
|
|
|
|
|
|
|
|
|
|||||||||
| GAAP Gross profit |
$ | 67,501 | $ | 56,675 | $ | 252,090 | $ | 212,704 | ||||||||
| Plus: Stock-based compensation |
588 | 601 | 2,262 | 2,489 | ||||||||||||
| Plus: Acquisition-related expenses (1) |
— | — | 3 | — | ||||||||||||
| Plus: Amortization of intangible assets |
1,495 | 1,339 | 5,980 | 3,625 | ||||||||||||
|
|
|
|
|
|
|
|
|
|||||||||
| Non-GAAP Gross Profit |
$ | 69,584 | $ | 58,615 | $ | 260,335 | $ | 218,818 | ||||||||
|
|
|
|
|
|
|
|
|
|||||||||
| GAAP Research and development |
$ | 17,808 | $ | 15,073 | $ | 68,239 | $ | 53,255 | ||||||||
| Less: Stock-based compensation |
(3,276 | ) | (2,207 | ) | (11,151 | ) | (7,961 | ) | ||||||||
| Less: Acquisition-related expenses (1) |
(584 | ) | (1,099 | ) | (2,431 | ) | (1,223 | ) | ||||||||
| Less: Amortization of intangible assets |
(25 | ) | (25 | ) | (100 | ) | (100 | ) | ||||||||
|
|
|
|
|
|
|
|
|
|||||||||
| Non-GAAP Research and development |
$ | 13,923 | $ | 11,742 | $ | 54,557 | $ | 43,971 | ||||||||
|
|
|
|
|
|
|
|
|
|||||||||
| GAAP Sales and marketing |
$ | 19,344 | $ | 19,341 | $ | 70,833 | $ | 70,039 | ||||||||
| Less: Stock-based compensation |
(1,395 | ) | (981 | ) | (4,984 | ) | (4,650 | ) | ||||||||
| Less: Acquisition-related expenses (1) |
(1 | ) | — | (5 | ) | (1,802 | ) | |||||||||
|
|
|
|
|
|
|
|
|
|||||||||
| Non-GAAP Sales and marketing |
$ | 17,948 | $ | 18,360 | $ | 65,844 | $ | 63,587 | ||||||||
|
|
|
|
|
|
|
|
|
|||||||||
| GAAP General and administrative |
$ | 10,804 | $ | 9,318 | $ | 40,765 | $ | 39,050 | ||||||||
| Less: Stock-based compensation |
(4,470 | ) | (3,629 | ) | (16,495 | ) | (14,990 | ) | ||||||||
|
|
|
|
|
|
|
|
|
|||||||||
| Non-GAAP General and administrative |
$ | 6,334 | $ | 5,689 | $ | 24,270 | $ | 24,060 | ||||||||
|
|
|
|
|
|
|
|
|
|||||||||
| GAAP Operating expenses |
$ | 47,956 | $ | 43,732 | $ | 179,837 | $ | 162,344 | ||||||||
| Less: Stock-based compensation |
(9,141 | ) | (6,817 | ) | (32,630 | ) | (27,601 | ) | ||||||||
| Less: Acquisition-related expenses (1) |
(585 | ) | (1,099 | ) | (2,436 | ) | (3,025 | ) | ||||||||
| Less: Amortization of intangible assets |
(25 | ) | (25 | ) | (100 | ) | (100 | ) | ||||||||
|
|
|
|
|
|
|
|
|
|||||||||
| Non-GAAP Operating expenses |
$ | 38,205 | $ | 35,791 | $ | 144,671 | $ | 131,618 | ||||||||
|
|
|
|
|
|
|
|
|
|||||||||
| GAAP Income from operations |
$ | 19,545 | $ | 12,943 | $ | 72,253 | $ | 50,361 | ||||||||
| Plus: Stock-based compensation |
9,729 | 7,418 | 34,892 | 30,090 | ||||||||||||
| Plus: Acquisition-related expenses (1) |
585 | 1,099 | 2,439 | 3,025 | ||||||||||||
| Plus: Amortization of intangible assets |
1,520 | 1,364 | 6,080 | 3,725 | ||||||||||||
|
|
|
|
|
|
|
|
|
|||||||||
| Non-GAAP Income from operations |
$ | 31,379 | $ | 22,824 | $ | 115,664 | $ | 87,201 | ||||||||
|
|
|
|
|
|
|
|
|
|||||||||
| GAAP Net income |
$ | 20,664 | $ | 14,400 | $ | 69,336 | $ | 57,304 | ||||||||
| Plus: Stock-based compensation |
9,729 | 7,418 | 34,892 | 30,090 | ||||||||||||
| Plus: Acquisition-related expenses (1) |
585 | 1,099 | 2,439 | 3,025 | ||||||||||||
| Plus: Amortization of intangible assets |
1,520 | 1,364 | 6,080 | 3,725 | ||||||||||||
| Less: Tax adjustment |
(6,506 | ) | (2,945 | ) | (16,367 | ) | (20,723 | ) | ||||||||
|
|
|
|
|
|
|
|
|
|||||||||
| Non-GAAP Net income |
$ | 25,992 | $ | 21,336 | $ | 96,380 | $ | 73,421 | ||||||||
|
|
|
|
|
|
|
|
|
|||||||||
| Non-GAAP Net income per share: |
||||||||||||||||
| Basic |
$ | 0.67 | $ | 0.54 | $ | 2.47 | $ | 1.89 | ||||||||
|
|
|
|
|
|
|
|
|
|||||||||
| Diluted |
$ | 0.64 | $ | 0.51 | $ | 2.33 | $ | 1.75 | ||||||||
|
|
|
|
|
|
|
|
|
|||||||||
| Weighted average shares used in non-GAAP net income per share: |
|
|||||||||||||||
| Basic |
39,003 | 39,200 | 39,075 | 38,876 | ||||||||||||
|
|
|
|
|
|
|
|
|
|||||||||
| Diluted |
40,921 | 41,580 | 41,345 | 41,897 | ||||||||||||
|
|
|
|
|
|
|
|
|
|||||||||
| (1) | Relates to compensation expense from the acquisition of Adya, Layered Insight, 1Mobility and NetWatcher. |
Qualys, Inc.
RECONCILIATION OF NON-GAAP DISCLOSURES
FREE CASH FLOWS
(Unaudited)
(in thousands)
| Twelve Months Ended December 31, |
||||||||
| 2019 | 2018 | |||||||
| GAAP Cash flows provided by operating activities (1) |
$ | 160,607 | $ | 125,464 | ||||
|
|
|
|
|
|||||
| Less: |
||||||||
| Purchases of property and equipment |
(27,573 | ) | (22,775 | ) | ||||
| Principal payments under capital lease obligations |
(1,709 | ) | (1,617 | ) | ||||
|
|
|
|
|
|||||
| Non-GAAP Free cash flows |
$ | 131,325 | $ | 101,072 | ||||
|
|
|
|
|
|||||
| (1) | Includes $4.5 million and $2.0 million of acquisition related expenses paid during the twelve months ended December 31, 2019 and 2018, respectively. |
Qualys, Inc.
RECONCILIATION OF NON-GAAP DISCLOSURES
CALCULATED CURRENT BILLINGS
(Unaudited)
(in thousands)
| Three Months Ended December 31, | ||||||||
| 2019 | 2018 | |||||||
| GAAP Revenue |
$ | 84,664 | $ | 74,200 | ||||
| Plus: Current deferred revenue at December 31 |
192,172 | 164,624 | ||||||
| Less: Current deferred revenue at September 30 |
(180,304 | ) | (155,115 | ) | ||||
|
|
|
|
|
|||||
| Non-GAAP Calculated current billings |
$ | 96,532 | $ | 83,709 | ||||
|
|
|
|
|
|||||
| Calculated current billings growth compared to same quarter of prior year |
15 | % | 13 | % | ||||