Attached files
| file | filename |
|---|---|
| 8-K - 8-K - Lonestar Resources US Inc. | a8-kx2122020xenercomdallas.htm |

Lonestar Resources US Inc. Presentation to Investors February 2020

Disclaimer and Forward Looking Statements Forward Looking Statements The information in this presentation includes “forward‐looking statements” that are made pursuant to the Safe Harbor Provisions of the Private Securities Litigation Reform Act of 1995. All statements, other than statements of historical fact included in this presentation, regarding our strategy, future operations, financial position, projected costs, prospects, plans and objectives of management are forward‐looking statements. When used in this presentation, the words “could,” “believe,” “anticipate,” “intend,” “estimate,” “expect,” “may,” “continue,” “predict,” “potential,” “project” and similar expressions are intended to identify forward‐looking statements, although not all forward‐looking statements contain such identifying words. These forward‐ looking statements are based on Lonestar Resources US Inc.’s (“LONE” or the “Company”) current expectations and assumptions about future events and are based on currently available information as to the outcome and timing of future events. We caution you that these forward‐looking statements are subject to all of the risks and uncertainties, most of which are difficult to predict and many of which are beyond our control, incident to the exploration for and development, production, gathering and sale of oil and natural gas. These risks include, but are not limited to, variations in the market demand for, and prices of, crude oil, NGLs and natural gas, lack of proved reserves, estimates of crude oil, NGLs and natural gas data, the adequacy of our capital resources and liquidity including, but not limited to, access to additional borrowing, borrowing capacity under our credit facilities, general economic and business conditions, failure to realize expected value creation from property acquisitions, uncertainties about our ability to replace reserves and economically develop our reserves, risks related to the concentration of our operations, drilling results, potentialfinanciallossesorearningsreductionsfromourcommoditypricerisk management programs, potential adoption of new governmental regulations, our ability to satisfy future cash obligationsandenvironmentalcostsandtheriskfactorsdiscussedinorreferencedinourfilingswiththeUnitedStatesSecuritiesandExchangeCommission (“SEC”), including our Annual Report on Form 10‐K, our Quarterly Reports on Form 10‐Q and our Current Reports on Form 8‐K in each case as amended. You are cautioned not to place undue reliance on any forward‐looking statements, which speak only as of the date of this presentation. Except as otherwise required by applicable law, we disclaim any duty to update any forward‐looking statements, all of which are expressly qualified by the statements in this section, to reflect events or circumstances after the date of this presentation. Our production forecasts and expectations for future periods are dependent upon many assumptions, including estimates of production decline rates from existing wells and the undertaking and outcome of future drilling activity, which may be affected by significant commodity price declines or cost increases. Reconciliation of Non‐GAAP Financial Measure EBITDAX is a financial measure that is not presented in accordance with generally accepted accounting principles in the United States (“GAAP”). Reconciliations of this non‐ GAAP financial measure can be found in this presentation. Industry and Market Data This presentation has been prepared by LONE and includes market data and other statistical information from third‐party sources, including independent industry publications, government publications or other published independent sources. Although LONE believes these third‐party sources are reliable as of their respective dates, LONE has not independently verified the accuracy or completeness of this information. Some data are also based on the LONE’s good faith estimates, which are derived from its review of internal sources as well as the third‐party sources described above. This document and any related presentation do not constitute an offer or invitation to subscribe for or purchase any securities, and it should not be construed as an offering document. Any decision to purchase securities in the context of a proposed offering, if any, should be made on the basis of information contained in the offering document related to such an offering. This presentation does not constitute a recommendation regarding any securities of Lonestar Resources America, Inc. or Lonestar Resources US Inc. 2

Company Profile Share Price . Pure Play Eagle Ford Operator… • +57,000 Net Acres in the Crude Oil Window of the Eagle Ford Shale $12.00 500 • Unfettered access to oil and gas transportation infrastructure $11.00 $10.00 400 • Technical leader with 100% focus in the Eagle Ford, drilling extended $9.00 reach laterals with proprietary targeting and completion techniques, $8.00 300 $7.00 Shares) yielding differential results (US$) $1.54 $6.00 ('000 Price $5.00 .…With Track Record of Rapidly Increasing Value Per Share 200 $4.00 • Share Proved reserves increased at CAGR of 52% to 93.4 MMBOE $3.00 Volume 100 • 3‐year All‐Sources Finding & Onstream costs of $7.53 per Boe $2.00 • Proved PV‐10 increased at CAGR of 27% to $8.54/share in 2018 $1.00 $0.00 0 • Proved & Probable PV‐10 increased at CAGR of 19% to $12.00/share in 2018 . Focused Capital Program in Areas of Success Volume LONE Equity Price • 2019 & 2020 Programs largely being drilled in areas where LONE registered significant success & returns in 2018 Enterprise Value • IRR’s of 55‐70% at $55/$2.75 flat Ticker (NASDAQ:NMS) LONE . Continued Growth in Production & EBITDAX Share Price2 $1.54 5 • 2019 Production Guidance‐ 14,800‐15,000 boe/d (+34% vs. 2018) Shares Out (Fully Diluted) 3 40.1 MM • 2020 Production Target‐ 17,000 – 18,300 boe/d Market Cap $62 MM .Free Cash Generation With Price Protection 3 • 2019 Program Has Generated Outstanding Production Results Cash $3.4 MM • 2020 Production Targets Can Be Met With Less Spending ($90‐$115 MM) Long Term Debt3 $495 MM • Generates $5‐$20 MM of Free Cash Flow in 2020 ($55 oil / $2.50 gas) Enterprise Value $553 MM • 90+% of 2020 Oil Hedged at ~$57 WTI / 50‐60% Gas Hedged at $2.58 HH 1Based on YE18 Reserve Report 2Feb 10, 2020 3As of Sep 30, 2019 4At the mid‐point of guidance 5Our production estimates are based on, among other things, our current planned capital expenditures and drilling program, our ability to drill and complete wells in a manner consistent with prior performance, certain drilling, completion and equipping cost assumptions and certain well performance assumptions. In addition, achieving these production estimates and maintaining the required capital expenditures and drilling activity to achieve these estimates will depend on the availability of capital, regulatory approval and the existing regulatory environment, realized commodity prices, rig and service availability, actual drilling results as well as other factors. Investors should also recognize that the reliability of any guidance diminishes the farther in the future that the data is forecast, and it is thus increasingly likely that our actual results will differ materially from our guidance. 3

Consistent & Significant Growth Proved Reserves Year End Proved & Probable Reserves By Product 100.0 200 177 120.0 261 300 90.0 170 180 242 80.0 160 100.0 250 70.0 140 (MMBOE) 80.0 200 (MMBOE) 60.0 120 50.0 100 75 60.0 150 Locations 116 40.0 80 Locations # Reserves Probable # 30.0 60 40.0 100 & 20.0 40 Proved 10.0 20 20.0 50 Proved 0.0 0 0.0 0 2016 2017 2018 2016 2017 2018 OIL NGLS GAS Locations OIL NGLS GAS Locations Proved PV‐10 @ $55 Oil / $2.75 Gas Proved & Probable PV‐10 @ $55 Oil / $2.75 Gas $900 $1,000 $939 $800 $801 $900 $700 $800 $625 $729 $600 $700 $600 $500 ($MM) ($MM) $500 10 $400 10 $404 ‐ $335 ‐ $400 PV $300 PV $300 $200 $200 $100 $100 $0 $0 2016 2017 2018 2016 2017 2018 PDP PUD PDP PUD PROB 4 1 All reserves and economic data sourced from Lonestar’s 12/31/18 reserve report, independently engineered by WD Von Gonten & Co. Assumes $55 flat oil price and $2.75 flat gas deck.

Lonestar’s Eagle Ford Footprint Engineered Region Net Acres Locations Avg. WI HBP Western 14,340 49 89% 95% Central 35,830 193 71% 97% Eastern 7,321 31 62% 86% Eastern Total 57,491 273 74% 95% Marquis Central Hawkeye Cyclone Western Georg Sooner Horned Frog Lonestar Acreage* 5 1 Acreage values at of 12/31/18. * Please see the reserves disclosures at the end of this presentation

Geo‐Engineered Completions Continue to Improve Results Technical Process Application Experience • Vertical Pilot Logs Used To Select Geo‐target to Optimize Both Reservoir & Mechanical Properties Horned Frog (2015,2018,2019) . Reservoir Properties ‐ Porosity, Total Organic Content, Clay Volume Cyclone (2016, 2017,2018) . Mechanical Properties ‐ Young’s Modulus, Poisson’s Ratio, Minimum In‐situ Stress Karnes (2018,2019) Results of Analysis Determine Geosteering Target Sooner (2019) • Utilize Geophysical Analysis to Improve Targeting Horned Frog (2019) . 3D Pre‐Stack Depth Migration to facilitate long laterals through more highly faulted areas Sooner (2019) . High frequency seismic inversion to assist in target transition in long laterals • Azimuthal Gamma Ray LWD Tool to Assist in Geosteering Cyclone/Hawkeye (2016, 2017, 2018) . Multi‐planar Gamma ray data determines dip angle and direction in real time Wildcat (2016, 2019) • Lateral “Thru‐Bit” Logs Run to TD for Detailed Rock Properties Analysis Horned Frog (2018,2019) . Triple Combo Log with Spectral Gamma Ray and Dipole Sonic Logs Karnes (2018,2019) Sooner (2019) • Mangrove Stimulation Design . Utilize Thru‐Bit Log Data For Reservoir Characterization Horned Frog (2015, 2018, 2019) . Models Key Mechanical Properties To Optimize Stimulation Beall Ranch (2015, 2016) . Vertical and lateral rock heterogeneity & identify planar & non‐planar fractures Cyclone/Hawkeye (2016, 2017, 2018) . Account for multi‐well stress shadows to optimize zipper fracs Karnes (2018,2019) Facilitates Design of Engineered (Non‐Geometric) Completion, Usually Yielding 150’ Stages Cyclone/Hawkeye (2016, 2017, 2018) • Increased Use of Diverters, Both Near‐Field and Far‐Field . Engineered fibrous pill designed to create near‐wellbore isolation to augment frac efficacy across all Karnes (2018,2019) perforations, maximizing wellbore coverage Horned Frog (2018,2019) . Increase efficiency through fewer pumped stages, coiled tubing plug drill outs Sooner (2018,2019) • Employ Extended Reach Laterals to Drive Efficiencies and Returns Horned Frog (2015, 2018,2019) . Acquire Leasehold in Geometries That Allow For 8,000’ to 13,000’ laterals Wildcat (2016,2019) . Use technology to ensure hole straightness to facilitate logging, casing Cyclone/Hawkeye (2016, 2017, 2018) . LONE has drilled 20 wells over 8,000’ Karnes (2018,2019) • Engineered Flowback Beall Ranch (2016. 2017) . Lonestar has increasingly applied controlled flowbacks Cyclone/Hawkeye (2016, 2017, 2018) . Implement solids and fluids analysis to avoid negative impact of hydraulic fractures and assess Horned Frog (2018,2019) success of completion strategies Wildcat (2017) 6

Extended Reach Laterals Are Driving Well Economics 5,000' 6,750' Product Mix Sooner Capital Cost : $7.0 MM Capital Cost : $8.2 MM Oil 15% Gross Reserves940 MBOE Gross Reserves1,355 MBOE NGL's 38% IRR : 44% IRR :67% Gas 47% Product Mix 5,000' 7,700' Capital Cost : $4.9 MM Capital Cost : $6.4 MM Oil 92% Karnes Gross Reserves365 MBOE Gross Reserves615 MBOE NGL's 5% IRR :42%IRR :70% Gas 3% Horned Frog Horned Frog NW Product Mix Product Mix 5,000' 12,000' Oil 12% Oil 28% Capital Cost : $5.7 MM Capital Cost : $9.1 MM NGL's 44% NGL's 36% Horned Gross Reserves975 MBOE Gross Reserves2,300 MBOE Frog IRR :29%IRR :67% Gas 44% Gas 36% Product Mix 5,000' 12,000' Cyclone Capital Cost : $5.2 MM Capital Cost : $8.2 MM Oil 86% Gross Reserves320 MBOE Gross Reserves755 MBOE NGL's 8% Hawkeye IRR :18%IRR : 55% Gas 6% 1,000’ 2,000’ 3,000’ 4,000’ 5,000’ 6,000’ 7,000’ 8,000’ 9,000’ 10,000’ 11,000’ 12,000’ 7 1 All reserves and economic data sourced from Lonestar’s 12/31/18 reserve report, independently engineered by WD Von Gonten & Co. Assumes $55 flat oil price and $2.75 flat gas deck.

2019 Capital Program Areas of Focus

Karnes County Wilson B A Karnes GEORG #3H‐#6H Placed into flowback May 2019 Product Mix Legend Type Curve Actuals Eagle Ford Oil 92% 86% 2019 Wells NGL's 5% 9% Austin Chalk Gas 3% 5% LONE Acreage 9

Karnes County EUR/ft vs. Offsets Karnes County Highlights 80 . Lonestar acquired its Karnes County leasehold in 2017 as 70 B C part of its Battlecat acquisition 60 . Lonestar holds 16 remaining gross PUD’s in the area A 50 Ft . Recent leasehold acquisitions allowed for extended Per 40 laterals into higher quality rock . In 2018, Lonestar completed 6 wells on A&B pads EUR 30 • Max‐30 IP’s averaged 888 boe/d (6,100’ lat. length) Oil 20 • 2018 Well Cost: $6.4MM 10 . In 2019, Lonestar completed 4 wells in Karnes County 0 • Max‐30 IP’s averaged 1,045 boe/d (7,231’ lat. length) 0 500 1,000 1,500 2,000 2,500 • Outperforming Type Curve • 2019 Well Cost: $6.4MM Lbs Proppant Per Ft . Type Curve IRR‐ 51% ($55/$2.50) LONE 18H‐20H LONE 24H‐26H Offsets Georg 3H‐6H Georg 3H‐6H Actuals vs. Type Curve Karnes County 270 Analysis 10,000 1,000 100 800 80 68 69 69 (Boepd) (Boe/d) 600 60 1,000 (Boepd) 1,000' Avg. Per Stream ‐ 400 40 3 Day Avg. 270 Day EUR‐ 0.5 MMBOE 200 20 100 270 0 0 Actuals Boepd Curve Boepd 10 1 Lonestar EUR data sourced from Lonestar’s 12/31/18 reserve report, independently engineered by WD Von Gonten & Co. 2 Offset wells engineered internally Offset wells include all pad-drilled completions at similar depths

Horned Frog Northwest (La Salle County) LaSalle Product Mix Legend Type Curve Actual Eagle Ford Oil 36% 48% 2019 Wells NGL's 32% 26% Austin Chalk Gas 33% 26% LONE Acreage 11

Horned Frog Northwest (La Salle County) EUR/ft vs. Offsets Property Highlights 175 5H . Lonestar has acquired its 7,380 gross acres in the Horned Frog area over the last 4 years 150 4H . Lonestar drilled 2 wells at NW in 2018 125 3H 2H • Max‐30 IP’s averaged 1,080 boe/d (7,400’ lat. length) (Boe) • 2018 Actual Well Cost: $8.1MM 100 Ft . Petrophysically‐derived target increased EUR’s vs. offsets Per 75 • 104% higher EUR than offset average (Boe) EUR • 50 146% higher EUR than offset (oil) . In 2019, Lonestar completed 2 9,700’ laterals 25 • Max‐30‐ 1,482 Boe/d 0 • 90‐day rates exceed offset parent wells (EUR / ft) 0 500 1,000 1,500 2,000 2,500 • Currently oil rates are 88% higher‐than‐forecast • Type Curve IRR‐ >100% Lbs Proppant Per Ft Lonestar Offsets Horned Frog NW 4H –5H (avg) vs Type Curve Longer “Child” Laterals Producing at Higher Rate / Foot 1,000 10,000 1,400 125 1,120 120 117 (Boepd) (Bopd) 840 115 (Boepd) 100 1,000 (Mcfpd) 1,000' Per Gas Avg. Crude 560 110 Day Avg. EUR‐ 1.2 MMBOE 270 105 Day 280 105 10 100 270 0 100 Oil Actuals Oil Curve Gas Actuals Gas Curve 12

Horned Frog Northwest (“Parent / Child”) Horned Frog NW 2H – Recovery From Frac Hit Horned Frog NW Frac Hits 450 2,500 . “Child” wells (#4H & #5H), were completed in 2019 and 400 have outperformed the “Parent” wells in 2018 (#2H & 350 2,000 #3H) 300 . & 1,500 Prior to being shut‐in for Child fracs, the #2H #3H had 250 (Mcfpd) outperformed third‐party type curve by 10% (Bopd) 200 1,000 Gas . After being placed back online, Parent wells continue to Oil 150 outperform Type Curve, and follow production decline Nat 100 500 trends exhibited prior to shut‐in, at higher rates: 50 . Spacing 0 0 . Targeting 19 18 19 19 19 19 19 19 18 19 19 19 19 18 19 20 20 ‐ ‐ ‐ ‐ ‐ ‐ ‐ ‐ ‐ ‐ ‐ ‐ ‐ ‐ ‐ ‐ ‐ . Stimulation Design Jul Jan Jun Oct Oct Feb Apr Jan Sep Dec Dec Nov Feb Nov Aug Mar May . Choke Management Oil Curve Oil Actuals Gas Curve Gas Actuals Horned Frog NW 3H – Recovery From Frac Hit Horned Frog NW 2H & 3H Average Recovery 450 2,500 450 3,000 400 400 2,500 350 2,000 350 300 300 2,000 1,500 250 250 (Mcfpd) (Mcfpd) 1,500 (Bopd) (Bopd) 200 200 Gas 1,000 Gas Oil Oil 150 150 1,000 Nat Nat 100 500 100 500 50 50 0 0 0 0 19 19 18 19 19 18 19 19 19 19 19 19 19 19 19 19 18 19 19 18 19 19 19 19 18 19 18 19 19 19 20 20 20 20 ‐ ‐ ‐ ‐ ‐ ‐ ‐ ‐ ‐ ‐ ‐ ‐ ‐ ‐ ‐ ‐ ‐ ‐ ‐ ‐ ‐ ‐ ‐ ‐ ‐ ‐ ‐ ‐ ‐ ‐ ‐ ‐ ‐ ‐ Jul Jul Jan Jan Jun Jun Oct Oct Oct Oct Feb Feb Apr Apr Jan Jan Sep Sep Dec Dec Dec Dec Feb Feb Nov Nov Nov Nov Aug Aug Mar Mar May May Oil Curve Oil Actuals Gas Curve Gas Actuals Oil Curve Oil Actuals Gas Curve Gas Actuals 13

Horned Frog South (La Salle County) LaSalle Product Mix Legend Type Curve Actuals Eagle Ford 2019 Wells Oil 12% 32% Austin Chalk NGL's 44% 24% LONE Acreage Gas 44% 43% 14

Horned Frog South (La Salle County) Multi‐Bench Targeting Yields Highest Effective Porosity Yet Property Highlights 8.0% . In 2018, Lonestar drilled 2 wells 6.9% 7.1% • Max‐30 IP’s averaged 2,155 boe/d (11,300’ lat. length) 7.0% 6.7% 6.2% 6.2% 6.4% • 2018 Well Cost: $9.5 MM ) 6.0% 5.6% ɸ . In 2019, Lonestar has drilled 2 12,000+’ laterals in 2019 ( 4.8% • 5.0% Multi‐bench targeting yields highest effective porosity yet 4.0% • Testing higher proppant loading 4.0% Porosity • 2019 wells have generated highest Max‐30’s, and oilier 3.0% • 3.0% Through 60 days, new wells have cum’d 4% more per/ft 1 2.0% . New Wells Move The Needle on Oil Recoveries 2.0% Effective • 44% more than Type Curve 1.0% • 17% more than 2018 wells . Targeting Has Been Critical In Encountering Higher O 0.0% . Type Curve IRR‐ 73% ($55/$2.50) Horned Frog F A & B Wells Outperforming Type Curve Horned Frog South 180 Day Analysis 10,000 10,000 2,500 175 164 162 2,000 160 1,000' Per 1,000 1,000 Boepd 1,500 145 (Bopd) (Mcfpd) Oil Boepd Avg. Gas 132 1,000 130 Day Avg. 180 Day 500 115 100 100 180 0 100 Oil Actuals Oil Curve Gas Actuals Gas Curve A1H B1H G1H H1H FA1H FB1H 15 1Through 180 days

Cyclone / Hawkeye Region Map Property Highlights Product Mix Oil 86% . Lonestar has acquired its 11,800 gross acres in the NGL's 8% Cyclone/Hawkeye area over the last 4 years Gas 6% . Lonestar holds 53 gross / 29 net locations in the area . Lonestar has drilled multiple well‐pairs across its leasehold • 2016‐ Early wells generate EUR’s > 50 boe/ft • 2018‐ Hawkeye wells outpacing 3rd party EUR’s ~66 boe/ft • Avg. 2018 Well Cost: $9.1MM (10,400’ lat. length) . Lonestar plans up to 3 wells in 2019 • Lat. Lengths‐ 9,000’ to 12,000’ • Est. AFE: $6.9MM to $8.3MM • Type Curve IRR‐ >55% ($55/$2.50) Property Map EUR/ft vs. Offsets Legend 80 Eagle Ford 2019 Wells 70 Austin Chalk LONE Acreage 60 50 (Boe) Ft 40 Per 30 EUR 20 10 0 0 500 1,000 1,500 2,000 Lbs Proppant Per Ft Lonestar Offsets 16

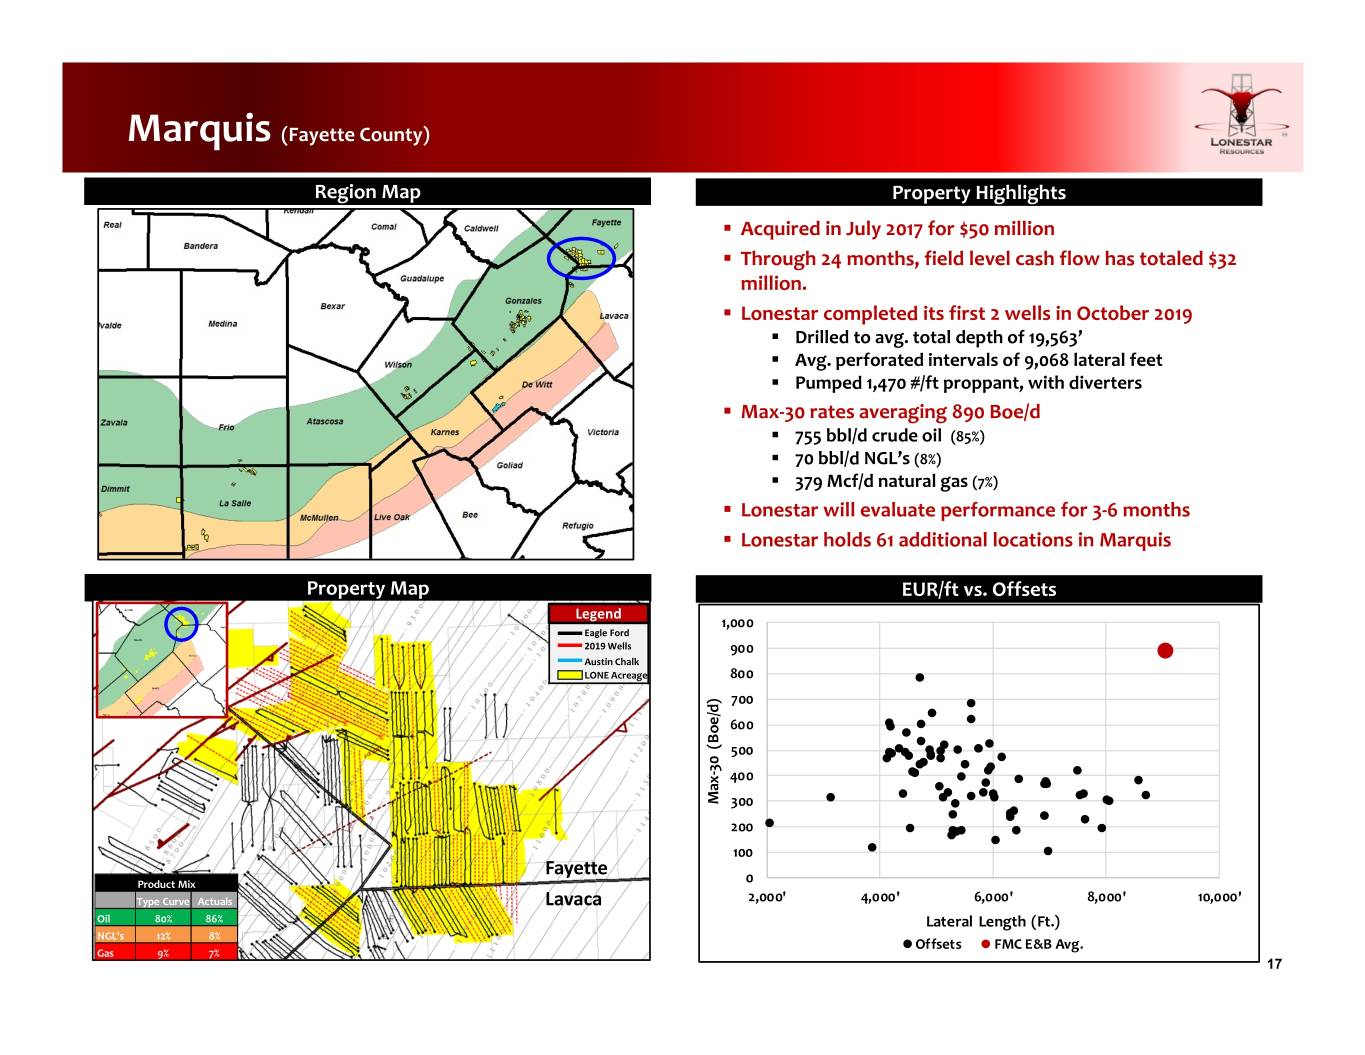
Marquis (Fayette County) Region Map Property Highlights . Acquired in July 2017 for $50 million . Through 24 months, field level cash flow has totaled $32 million. . Lonestar completed its first 2 wells in October 2019 . Drilled to avg. total depth of 19,563’ . Avg. perforated intervals of 9,068 lateral feet . Pumped 1,470 #/ft proppant, with diverters . Max‐30 rates averaging 890 Boe/d . 755 bbl/d crude oil (85%) . 70 bbl/d NGL’s (8%) . 379 Mcf/d natural gas (7%) . Lonestar will evaluate performance for 3‐6 months . Lonestar holds 61 additional locations in Marquis Property Map EUR/ft vs. Offsets Legend 1,000 Eagle Ford 2019 Wells 900 Austin Chalk LONE Acreage 800 700 600 (Boe/d) 500 30 ‐ 400 Max 300 200 100 Fayette Product Mix 0 Type Curve Actuals Lavaca 2,000' 4,000' 6,000' 8,000' 10,000' Oil 80% 86% Lateral Length (Ft.) NGL's 12% 8% Offsets FMC E&B Avg. Gas 9% 7% 17

Sooner (DeWitt County) DeWitt Product Mix Legend Type Curve Actuals Eagle Ford Oil 20% 16% 2019 Wells NGL's 34% 38% Austin Chalk LONE Acreage Gas 46% 46% 18

Sooner Geologic Summary Lonestar Resources Gross Thickness, in ft. (Eagle Ford Shale) T Bird #1H Pilot Hole Log Upper Eagle Ford 81’ Lower Eagle Ford 246 ’ Lower Eagle Ford Shale on the acquired leasehold is among the thickest in Sugarkane Field 19

Sooner –Original Development Plan AA’ A A’ Original Plan – 4,100’ to 5,000’ laterals • 5,100’ laterals = 41% IRR Seismic in Dataroom 20

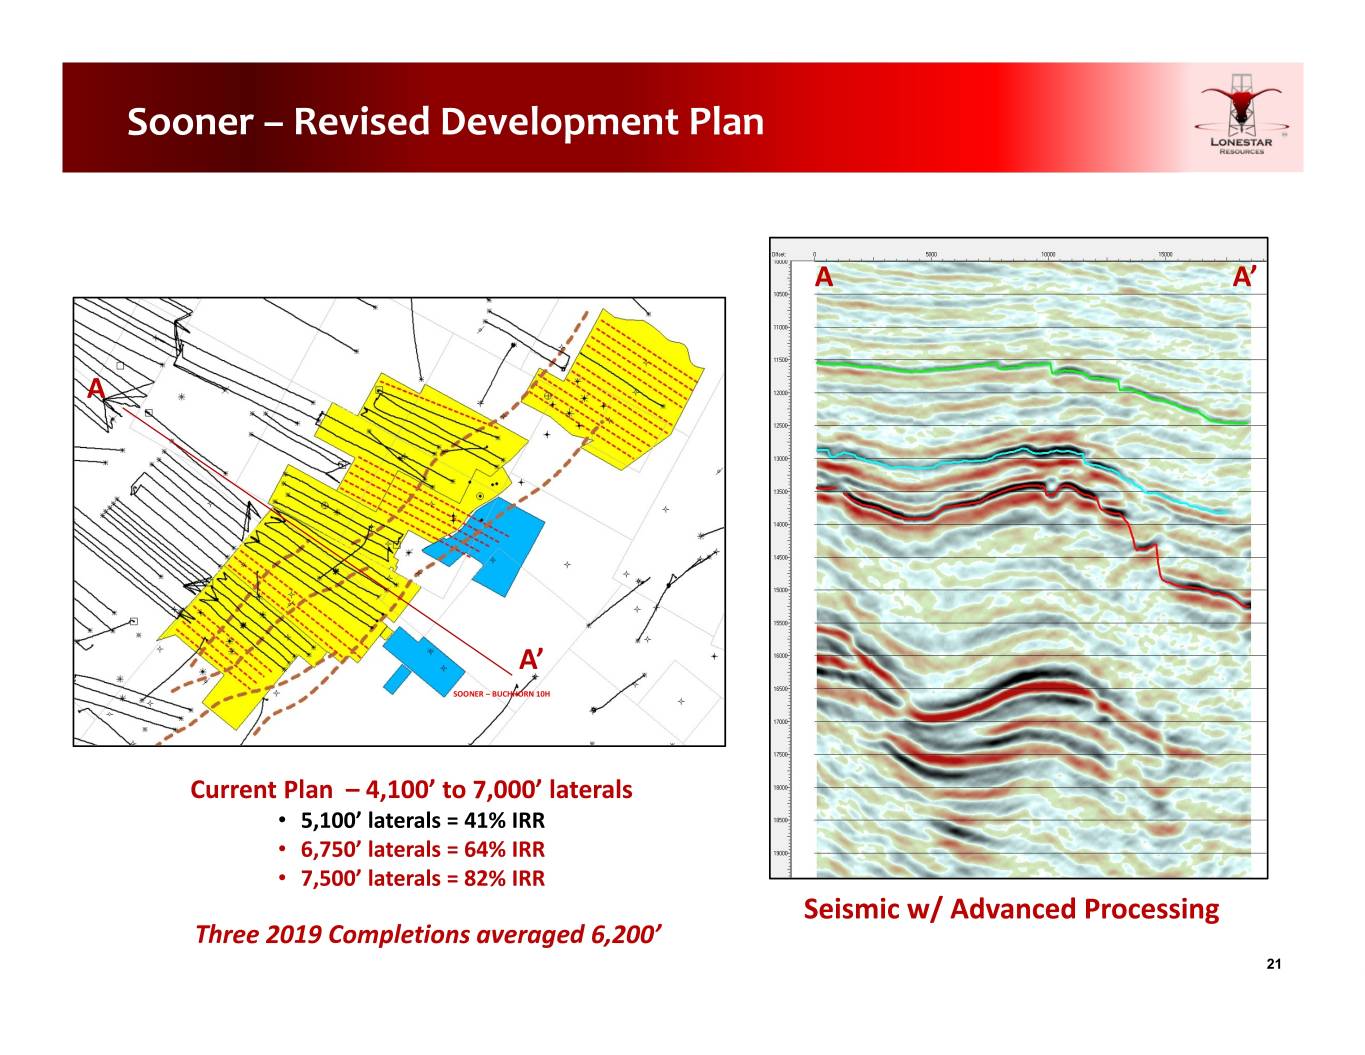
Sooner – Revised Development Plan AA’ A A’ SOONER – BUCHHORN 10H Current Plan – 4,100’ to 7,000’ laterals • 5,100’ laterals = 41% IRR • 6,750’ laterals = 64% IRR • 7,500’ laterals = 82% IRR Seismic w/ Advanced Processing Three 2019 Completions averaged 6,200’ 21

Sooner (De Witt County) Sooner Activity Map Sooner Highlights . Buchhorn#4H‐#6H commenced flowback in July . Seismic Interpretation allowed for extending laterals through previously mapped faults . Added leasehold to further extend laterals by ~1,000’ . Added $1.7 MM to pad cost . Proppant / Ft. ~2,000# . Initial Flowing Tubing Pressures @7,900 psi . Max 30‐day production averaged of 2,494 Boe/d . 351 bbl/d oil . 951 bbl/d NGL’s Product Mix Legend . Type Curve Actuals Eagle Ford 7,150 Mcf/d natural gas Oil 20% 16% 2019 Wells . Lonestar currently plans activity here in 2020 NGL's 34% 38% Austin Chalk Gas 46% 46% LONE Acreage . To date, cums are 8% higher than forecast Geoscience and Leasing Extend Operated Lateral Lengths Sooner Buchhorn #4H‐#6H vs. Offsets 8,000 3,500 7,000 3,000 6,000 (Boe/d) 2,500 (Ft) 5,000 2,000 4,000 1,500 Length Production 3,000 1,000 Lateral 2,000 Stream 500 ‐ 3 1,000 0 161121181241301361 0 1H Days On Production 7H 5H 5H 3H 2H 6H 6H 4H 4H 11H 17H 15H 13H 12H 21H 16H 19H 14H 18H 23H 25H 22H 26H 20H 24H Well Buchhorn Actuals WDVG Curve 22

Hedging Summary – Crude Oil Crude Oil Contracts % of Production 64%85% 74% 88% 89% Hedged 1 8,000 7,480 $90 7,000 6,588 $80 6,021 $70 6,000 5,000 $60 (bopd) 5,000 $50 Bbl 4,000 / $ Hedged 3,213 $40 2,753 3,000 2,698 $30 Volume 2,000 $56.95 $85.76 $71.02 $53.36 $55.50 $54.31 $54.16 $20 1,000 $10 0 $0 2015 2016 2017 2018 2019 2020 2021 Volume Hedged 23

Hedging Summary –Natural Gas Natural Gas Contracts % of Production 100% 53% 62% Hedged 1 25,000 $5.00 20,000 20,000 $4.00 15,000 (Mcfpd) 15,000 $3.00 Mcf / $ Hedged 10,000 $2.00 7,000 6,723 Volume 5,000 $1.00 $3.36 $3.15 $3.04 $2.58 Volume Hedged 0 $0.00 2017 2018 2019 2020 Volume Hedged 24
