Attached files
| file | filename |
|---|---|
| EX-99.1 - PRESS RELEASE - Atomera Inc | atomera_ex9901.htm |
| 8-K - FORM 8-K - Atomera Inc | atomera_8k-021220.htm |
Exhibit 99.2

Q4 2019 Conference Call February 12, 2020 1

2 Safe Harbor This presentation contains forward - looking statements concerning Atomera Incorporated (““Atomera,” the “Company,” “we,” “us,” and “our”). The words “believe,” “may,” “will,” “potentially,” “estimate,” “continue,” “anticipate,” “intend,” “could,” “would,” “project,” “plan,” “expect” and similar expressions that convey uncertainty of future events or outcomes are intended to identify forward - looking statements. These forward - looking statements are subject to a number of risks, uncertainties and assumptions, including those disclosed in the section "Risk Factors" included in our Prospectus Supplement filed with the SEC on May 30, 2019. In light of these risks, uncertainties and assumptions, the forward - looking events and circumstances discussed in this presentation may not occur and actual results could differ materially and adversely from those anticipated or implied in our forward - looking statements. You should not rely upon forward - looking statements as predictions of future events. Although we believe that the expectations reflected in our forward - looking statements are reasonable, we cannot guarantee that the future results, levels of activity, performance or events and circumstances described in the forward - looking statements will be achieved or occur. This presentation contains only basic information concerning Atomera. The Company’s filings with the Securities Exchange Commission, including the Prospectus Supplement , include more information about factors that could affect the Company’s operating and financial results. We assume no obligation to update information contained in this presentation. Although this presentation may remain available on the Company's website or elsewhere, its continued availability does not indicate that we are reaffirming or confirming any of the information contained herein.

Mears Silicon Technology (MST®) Quantum Engineered Materials 3 Company Overview Strong, Growing and Defensible Patent Portfolio High Leverage IP Licensing Business Model Top Tier Management Team Transistor enhancement technology for the $450B semiconductor market 3

4 Customer engagements • 19 customers, 25 engagements • Working with 50% of the world’s top semiconductor makers* 0 3 6 9 12 15 18 21 24 27 IPO 3Q 16 4Q 16 1Q 17 2Q 17 3Q 17 4Q 17 1Q 18 2Q 18 3Q 18 4Q 18 1Q 19 2Q 19 3Q 19 4Q 19 Number of Customer Engagements Phase 1 Phase 2 Phase 3 * 10 of the top 20 (IC Insights, McClean Report 2019)
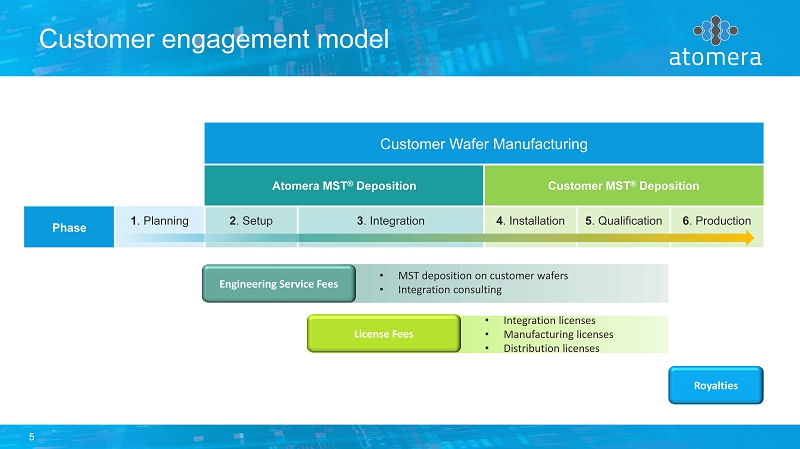
5 Customer engagement model v Customer Wafer Manufacturing Atomera MST ® Deposition Customer MST ® Deposition Phase 1 . Planning 2 . Setup 3 . Integration 4 . Installation 5 . Qualification 6 . Production Royalties Engineering Service Fees • MST deposition on customer wafers • Integration consulting License Fees • Integration licenses • Manufacturing licenses • Distribution licenses

6 MST - SP progress 0.0 0.5 1.0 1.5 2.0 2.5 3.0 Feb-19 May-19 Aug-19 Dec-19 Mar-20 Jun-20 Sep-20 MST SP Progress Control MST SP Industry Top Runner R SP (m Ω - mm 2 ) May 2019 Result Atomera R&D fab Current Result Atomera R&D fab Industry top - runners Projected Current Result Advanced fab

7 MST matching performance Transistor mismatch is an industry problem Certain circuit designs benefit from mismatch reduction A - D convertors SRAM Flash DRAM sense amplifiers MST can reduce mismatch by more than 50% Details available at Atomera’s website blog.atomera.com 0 5 10 15 20 25 30 35 0 1 2 3 4 σ Δ V t h [ m V ] 1/(WL)^0.5 [1/μm] Si control MST process 1.8VNMOS data Smaller devices better matching

8 Financial review Q4 '18 Q1 '19 Q2 '19 Q3 '19 Q4 '19 FY 2019 GAAP Results Revenue $0.15M $0.07M $0.07M $0.25M $0.14M $0.53M Gross Profit $0.12M $0.07M $0.05M $0.05M $0.11M $0.28M Operating Expense R&D $2.0 $2.1 $2.1 $1.7 $1.8 $7.7 G&A $1.2 $1.3 $1.5 $1.2 $1.2 $5.2 S&M $0.3 $0.2 $0.2 $0.2 $0.2 $1.0 Total Operating Expense ($3.4M) $3.7M $3.8M $3.2M $3.2M $13.9M Net Loss ($3.2M) ($3.5M) ($3.6M) ($3.1M) ($3.0M) ($13.3M) Loss Per Share ($0.22) ($0.24) ($0.24) ($0.19) ($0.18) ($0.84) Reconciliation between GAAP & Non-GAAP Net Loss (GAAP) ($3.2M) ($3.5M) ($3.6M) ($3.1M) ($3.0M) ($13.3M) Stock-Based Compensation $0.6M $0.7M $0.8M $0.8M $0.6M $2.9M Other income (expense) ($0.1M) ($0.1M) ($0.1M) ($0.1M) ($0.0M) ($0.3M) Adjusted EBITDA (Non-GAAP)* ($2.6M) ($2.9M) ($2.9M) ($2.4M) ($2.4M) ($10.7M) *Adjusted EBITDA is a non-GAAP financial measure. A full reconciliation of GAAP and non-GAAP results is contained in our Q4 press release. Some totals reflect rounding. Cash $14.9M Debt - Shares Outstanding 17.1M Balance Sheet 12/31/19

Thank You 9