Attached files
| file | filename |
|---|---|
| 8-K - FORM 8-K - FIRST HAWAIIAN, INC. | tm207221-1_8k.htm |
Exhibit 99.1

0 Investor Presentation February/March 2020
DISCLAIMER Forward - Looking Statements This presentation contains, and from time - to - time in connection with this presentation our management may make, forward - looking statements within the meaning of the Private Securities Litigation Reform Act of 1995. These forward looking statements refl ect our views at such time with respect to, among other things, future events and our financial performance. These statements are of ten , but not always, made through the use of words or phrases such as “may,” “might,” “should,” “could,” “predict,” “potential,” “believe ,” “expect,” “continue,” “will,” “anticipate,” “seek,” “estimate,” “intend,” “plan,” “projection,” “would,” “annualized,” and “outlook,” or the negative version of these words or other comparable words or phrases of a future or forward - looking nature. These forward - looking statem ents are not historical facts and are based on current expectations, estimates and projections about our industry, management’s be lie fs and certain assumptions made by management, and any such forward - looking statements are subject to risks, assumptions, estimates and uncertainties that are difficult to predict. Actual results may prove to be materially different from the results expressed o r i mplied by the forward - looking statements. Factors that could cause our actual results to differ materially from those described in the forward - looking statements can be found in our SEC filings, including, but not limited to, our Annual Report on Form 10 - K for the year ended Dec ember 31, 2018, and our Quarterly Report on Form 10 - Q for the quarter ended September 30, 2019, which are available on our website (www.fhb.com) and the SEC’s website (www.sec.gov). Any forward - looking statement speaks only as of the date on which it is made, and we do not undertake any obligation to update or review any forward - looking statement, whether as a result of new information , future developments or otherwise, except as required by applicable law. Use of Non - GAAP Financial Measures The information provided herein includes certain non - GAAP financial measures. We believe that these core measures provide usefu l information about our operating results and enhance the overall understanding of our past performance and future performance. Although these non - GAAP financial measures are frequently used by stakeholders in the evaluation of a company, they have limitat ions as analytical tools and should not be considered in isolation or as a substitute for analysis of our results or financial con dit ion as reported under GAAP. Investors should consider our performance and financial condition as reported under GAAP and all other relevant information when assessing our performance or financial condition. The reconciliation of such measures to the comparable GAA P figures are included in the appendix of this presentation. Other References to “we,” “us,” “our,” “FHI,” “FHB,” “Company,” and “First Hawaiian” refer to First Hawaiian, Inc. and its consolid ate d subsidiaries. 1

4Q 2019 HIGHLIGHTS (1) Core measurements are non - GAAP financial measurements. Core excludes certain gains, expenses and one - time items. See non - GAAP reconciliations of core net income, core diluted EPS, and core efficiency ratio to the comparable GAAP measurements in the appendix of this slide presentation. (2) ROATA and ROATCE are non GAAP financial measures. A reconciliation of average tangible assets and average tangible stockhold ers ’ equity to the comparable GAAP measurements is provided in the appendix of this slide presentation. (3) Declared on January 22, 2020. Payable March 6, 2020 to shareholders of record at close of business on February 24, 2020. 2 • 2.9% loan growth • Improved deposit mix • Disciplined expense management • Continued excellent credit quality • Repurchased 1.3 million shares, returning $37 million in capital to shareholders » Good loan and deposit growth » Moderated decline in NIM Reported Core 1 Net Income ($mm) $67.8 $71.3 Diluted Earnings Per Share $0.52 $0.54 Net Interest Margin 3.15% 3.15% Efficiency Ratio 48.9% 47.7% ROA / ROATA 2 1.34% / 1.41% 1.41% / 1.48% ROE / ROATCE 2 10.21% / 16.40% 10.72% / 17.22 % Tier 1 Leverage Ratio CET 1 Capital Ratio Total Capital ratio 8.79% 11.88% 12.81% Dividend 3 $0.26 / share » Continued expense management » Excellent credit quality

INVESTMENT HIGHLIGHTS 3 Best - in - class Financial Performance Leading Position In Attractive Market High Quality Balance Sheet Proven Through The Cycle Performance Well - Capitalized With Healthy Dividend $150 mm 2019 Stock Repurchase Program 1 2 3 4 5 6
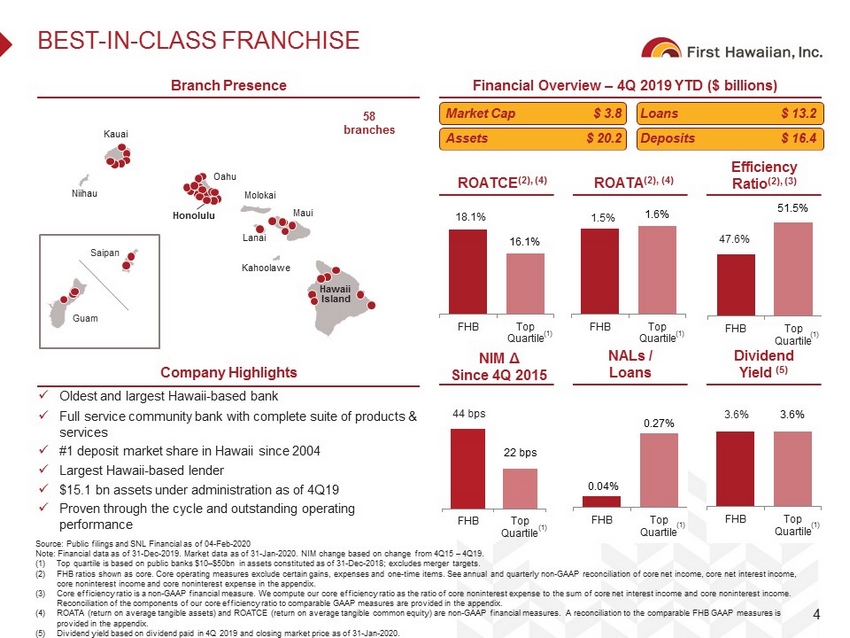
NALs / Loans FHB Top Quartile 47.6% 51.5% FHB Top Quartile 18.1% 16.1% BEST - IN - CLASS FRANCHISE 4 Branch Presence Financial Overview – 4Q 2019 YTD ($ billions) Source: Public filings and SNL Financial as of 04 - Feb - 2020 Note: Financial data as of 31 - Dec - 2019. Market data as of 31 - Jan - 2020. NIM change based on change from 4Q15 – 4Q19. (1) Top quartile is based on public banks $10 – $50bn in assets constituted as of 31 - Dec - 2018; excludes merger targets. (2) FHB ratios shown as core. Core operating measures exclude certain gains, expenses and one - time items. See annual and quarterly n on - GAAP reconciliation of core net income, core net interest income, core noninterest income and core noninterest expense in the appendix. (3) Core efficiency ratio is a non - GAAP financial measure. We compute our core efficiency ratio as the ratio of core noninterest exp ense to the sum of core net interest income and core noninterest income. Reconciliation of the components of our core efficiency ratio to comparable GAAP measures are provided in the appendix. (4) ROATA (return on average tangible assets) and ROATCE (return on average tangible common equity) are non - GAAP financial measures. A reconciliation to the comparable FHB GAAP measures is provided in the appendix. (5) Dividend yield based on dividend paid in 4Q 2019 and closing market price as of 31 - Jan - 2020. Company Highlights x Oldest and largest Hawaii - based bank x Full service community bank with complete suite of products & services x #1 deposit market share in Hawaii since 2004 x Largest Hawaii - based lender x $15.1 bn assets under administration as of 4Q19 x Proven through the cycle and outstanding operating performance Efficiency Ratio (2), (3) ROATCE (2), (4) Dividend Yield (5) Maui Kahoolawe Lanai Oahu Kauai Niihau Honolulu Hawaii Island Molokai FHB Top Quartile 3.6% 3.6% FHB Top Quartile 0.04% 0.27% Market Cap $ 3.8 Loans $ 13.2 Assets $ 20.2 Deposits $ 16.4 58 branches Guam Saipan (1) (1) (1) (1) FHB Top Quartile 44 bps 22 bps NIM Δ Since 4Q 2015 (1) FHB Top Quartile 1.5% 1.6% ROATA (2), (4) (1)
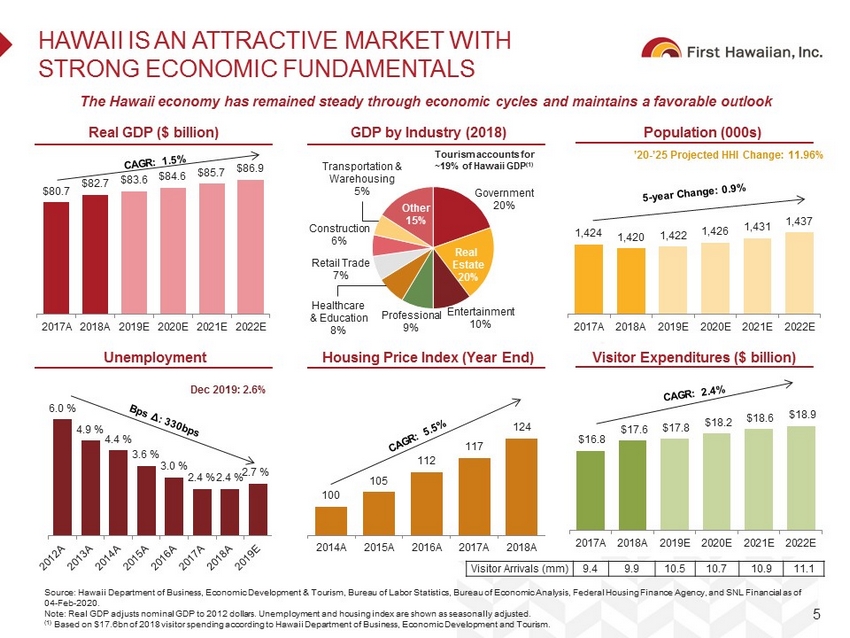
$16.8 $17.6 $17.8 $18.2 $18.6 $18.9 2017A 2018A 2019E 2020E 2021E 2022E Government 20% Real Estate 20% Residential RE 23% Other 15% Transportation & Warehousing 5% Entertainment 10% Professiona l 9 % Construction 6% Retail Trade 7 % Healthcare & Education 8% 6.0 % 4.9 % 4.4 % 3.6 % 3.0 % 2.4 % 2.4 % 2.7 % 100 105 112 117 124 2014A 2015A 2016A 2017A 2018A HAWAII IS AN ATTRACTIVE MARKET WITH STRONG ECONOMIC FUNDAMENTALS 5 Real GDP ($ billion) Population (000s) Source: Hawaii Department of Business, Economic Development & Tourism, Bureau of Labor Statistics, Bureau of Economic Analysi s, Federal Housing Finance Agency, and SNL Financial as of 04 - Feb - 2020. Note: Real GDP adjusts nominal GDP to 2012 dollars. Unemployment and housing index are shown as seasonally adjusted. (1) Based on $17.6bn of 2018 visitor spending according to Hawaii Department of Business, Economic Development and Tourism. The Hawaii economy has remained steady through economic cycles and maintains a favorable outlook GDP by Industry (2018) $80.7 $82.7 $83.6 $84.6 $85.7 $86.9 2017A 2018A 2019E 2020E 2021E 2022E Unemployment 1,424 1,420 1,422 1,426 1,431 1,437 2017A 2018A 2019E 2020E 2021E 2022E Housing Price Index (Year End) Visitor Expenditures ($ billion) ’20 - ’25 Projected HHI Change: 11.96% Visitor Arrivals (mm) 9.4 9.9 10.5 10.7 10.9 11.1 Tourism accounts for ~19% of Hawaii GDP (1) Dec 2019: 2.6%
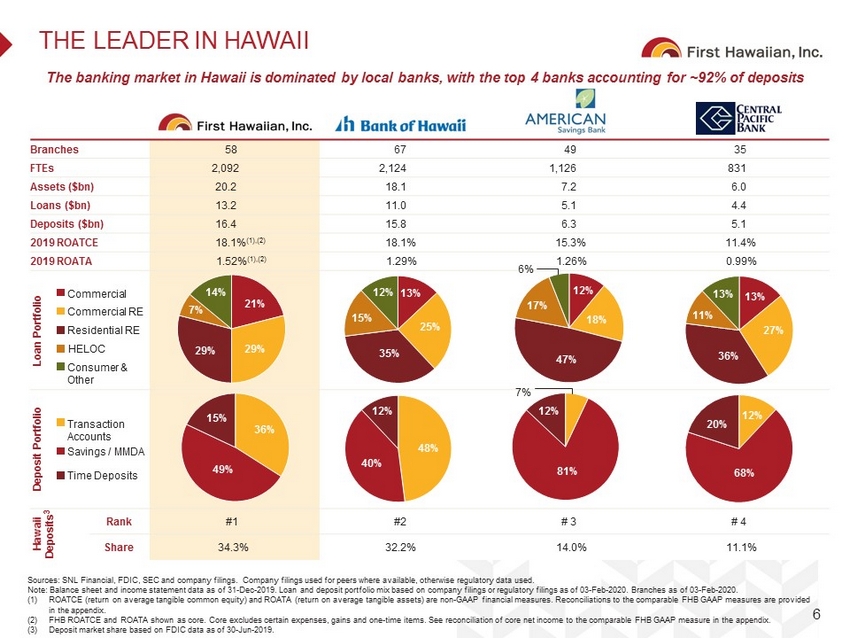
THE LEADER IN HAWAII 6 The banking market in Hawaii is dominated by local banks, with the top 4 banks accounting for ~92% of deposits Sources: SNL Financial, FDIC, SEC and company filings. Company filings used for peers where available, otherwise regulatory dat a used. Note: Balance sheet and income statement data as of 31 - Dec - 2019. Loan and deposit portfolio mix based on company filings or regu latory filings as of 03 - Feb - 2020. Branches as of 03 - Feb - 2020. (1) ROATCE (return on average tangible common equity) and ROATA (return on average tangible assets) are non - GAAP financial measures. Reconciliations to the comparable FHB GAAP measures are provided in the appendix. (2) FHB ROATCE and ROATA shown as core. Core excludes certain expenses, gains and one - time items. See reconciliation of core net inc ome to the comparable FHB GAAP measure in the appendix. (3) Deposit market share based on FDIC data as of 30 - Jun - 2019. Branches 58 67 49 35 FTEs 2,092 2,124 1,126 831 Assets ($bn) 20.2 18.1 7.2 6.0 Loans ($bn) 13.2 11.0 5.1 4.4 Deposits ($bn) 16.4 15.8 6.3 5.1 2019 ROATCE 18.1% (1),(2) 18.1% 15.3% 11.4% 2019 ROATA 1.52% (1),(2) 1.29% 1.26% 0.99% Loan Portfolio Deposit Portfolio Hawaii Deposits 3 Rank #1 #2 # 3 # 4 Share 34.3% 32.2% 14.0% 11.1 % Commercial Commercial RE Residential RE Consumer & Other Transaction Accounts Savings / MMDA Time Deposits 14% 21% 29% 29% 12% 13% 25% 35% 15% 6 % 12% 18% 47% 17% 13% 13% 27% 36% 11% 15% 36% 49% 12% 48% 40% 7 % 81% 12% 20% 12% 68% 7% HELOC

$ 133 $ 135 $ 140 $ 141 $ 141 $ 144 $ 145 $ 146 $ 143 $ 140 3.23 % 3.29 % 3.47 % 3.58 % 3.61 % 3.77 % 3.85 % 3.88 % 3.79 % 3.66 % 0.28 % 0.31 % 0.35 % 0.40 % 0.47 % 0.48 % 0.56 % 0.57 % 0.54 % 0.44 % 2.96 % 2.99 % 3.13 % 3.18 % 3.11 % 3.23 % 3.23 % 3.25 % 3.19 % 3.15 % – % 0.50 % 1.00 % 1.50 % 2.00 % 2.50 % 3.00 % 3.50 % 4.00 % 3Q17 4Q17 1Q18 2Q18 3Q18 4Q18 1Q19 2Q19 3Q19 4Q19 Net Int Inc. Earning Asset Yield Cost of Deposits NIM MANAGING NIM THROUGH A CHALLENGING INTEREST RATE ENVIRONMENT 7 Strategic Balance Sheet Management, Proactive Funding Management ▪ Investment portfolio restructured in Jan 2019 ▪ Sold $409mm of libor - indexed SNC loans in 3Q 2019 at a weighted average price of 99.7% ▪ Proceeds used to reduce non - core funding, including public time deposits, and support $50mm increase in 2019 stock repurchase authorization ▪ Active management of total funding portfolio ▪ Significant reduction of public time deposits ▪ Active repricing of high - cost commercial and consumer deposit accounts following September and October rate cuts ▪ Cost of deposits declined 10 basis points to 44 basis points in 4Q 2019 ▪ Hawaii banks experience more favorable deposit behavior than national banks across all rate cycles (see slide 17) Deposit Repricing Actions Helped Limit 4Q 2019 NIM Compression

Source: Public filings and SNL Financial as of 04 - Feb - 2020 Note: Financial data as of 31 - Dec - 2019. $10 – $50bn banks constituted as of 31 - Dec - 2018; excludes merger targets. (1) FHB ratios shown as core. Core excludes certain gains, expenses and one - time items. See annual and quarterly non - GAAP reconcilia tions of core net income, core net interest income, core noninterest income and core noninterest expense used to calculate core ratios in the appendix. (2) ROATCE (return on average tangible common equity) is a non - GAAP financial measure. A reconciliation to the comparable FHB GAAP measure is provided in the appendix. 12.0% 18.1% 8.8% 14.8% 8.0% 10.0% 12.0% 14.0% 16.0% 18.0% 20.0% 22.0% '11 '12 '13 '14 '15 '16 '17 '18 '19 46.7% 50.2% 47.6% 61.7% 63.9% 56.2% 40.0% 45.0% 50.0% 55.0% 60.0% 65.0% '11 '12 '13 '14 '15 '16 '17 '18 '19 STRONG PERFORMANCE THROUGH THE CYCLE 8 Through the Cycle Credit Performer Strong Expense Mgmt. Culture (1) Consistent Record of Profitability (1) Consistent Deposit Growth ($ bn ) Steady, Balanced Loan Growth ($ bn ) $9.1 $16.4 '07 '08 '09 '10 '11 '12 '13 '14 '15 '16 '17 '18 '19 $6.5 $13.2 '07 '08 '09 '10 '11 '12 '13 '14 '15 '16 '17 '18 '19 NPAs + 90s / Loans + OREO Efficiency Ratio ROATCE (2) 4Q19 Cost of Deposits: 0.44% First Hawaiian, Inc. Public U.S. Banks with $10-$50bn of Assets 0.16% 0.63% 0.14% 0.41% 3.18% 0.64% 0.00% 0.50% 1.00% 1.50% 2.00% 2.50% 3.00% 3.50% '06 '07 '08 '09 '10 '11 '12 '13 '14 '15 '16 '17 '18 '19

1.39% 1.30% 1.31% 1.22% 1.10% 1.18% 1.22% 1.49% 1.51% 0.87% 1.02% 1.06% 1.07% 1.04% 1.07% 1.05% 1.37% 1.36% 0.75% 1.00% 1.25% 1.50% 1.75% 2011 2012 2013 2014 2015 2016 2017 2018 2019 CONSISTENT TRACK RECORD OF STRONG PROFITABILITY 9 Source: Public filings and SNL Financial, as of 04 - Feb - 2020 Note: Financial data as of 31 - Dec - 2019. $10 – $50bn banks constituted as of 31 - Dec - 2018; excludes merger targets. (1) FHB measures shown as core. Core excludes certain gains, expenses and one - time items. See annual and quarterly non - GAAP reconcil iations of core net income, core net interest income, core noninterest income and core noninterest expense used to calculate core ratios in the appendix. (2) ROATA (return on average tangible assets) and ROATCE (return on average tangible common equity) are non - GAAP financial measures. A reconciliation to the comparable FHB GAAP measures is provided in the appendix. 12.0% 11.8% 12.3% 11.8% 11.3% 13.8% 14.9% 19.6% 18.1% 8.8% 10.9% 11.7% 11.4% 11.5% 11.6% 11.3% 15.0% 14.8% 8.0% 10.0% 12.0% 14.0% 16.0% 18.0% 20.0% 22.0% 2011 2012 2013 2014 2015 2016 2017 2018 2019 Year Ended December 31 Consistent Core Earnings ($mm) (1) ROATA (1),(2) Stable Earnings Drivers ROATCE (1),(2) Year Ended December 31 Consistent Earnings Peer Leading Profitability First Hawaiian, Inc. Public U.S. Banks with $10-$50bn of Assets $ 198 $ 197 $ 205 $ 202 $ 196 $ 217 $ 230 $ 287 $ 292 2011 2012 2013 2014 2015 2016 2017 2018 2019 Year Ended December 31 ▪ Leading loan and deposit position in attractive market ▪ Demonstrated history of disciplined expense management ▪ Consistent underwriting standards with proven performance through the credit cycle ▪ Stable local economy
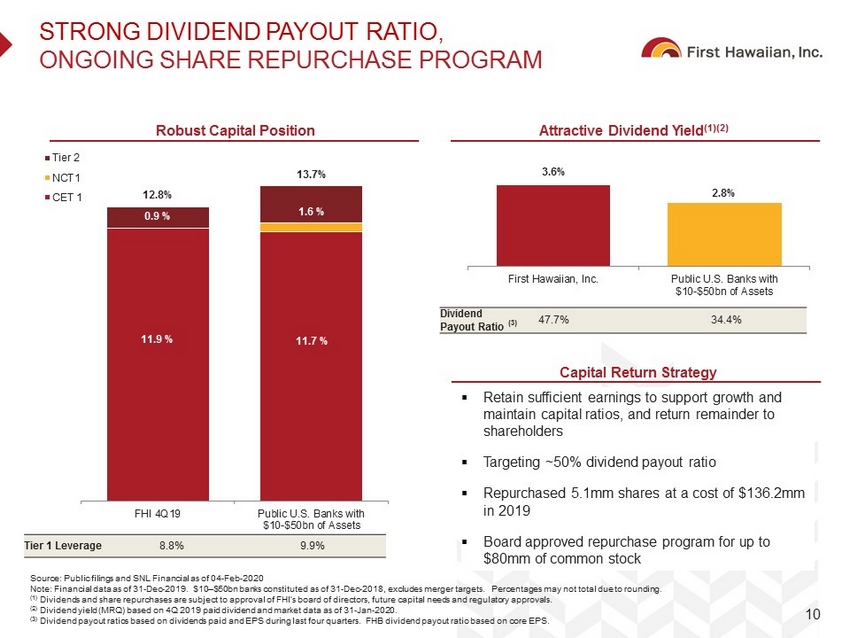
3.6% 2.8% First Hawaiian, Inc. Public U.S. Banks with $10-$50bn of Assets STRONG DIVIDEND PAYOUT RATIO , ONGOING SHARE REPURCHASE PROGRAM 10 Source: Public filings and SNL Financial as of 04 - Feb - 2020 Note: Financial data as of 31 - Dec - 2019. $10 – $50bn banks constituted as of 31 - Dec - 2018, excludes merger targets. Percentages m ay not total due to rounding. (1) Dividends and share repurchases are subject to approval of FHI’s board of directors, future capital needs and regulatory appr ov als. (2) Dividend yield (MRQ) based on 4Q 2019 paid dividend and market data as of 31 - Jan - 2020. (3) Dividend payout ratios based on dividends paid and EPS during last four quarters. FHB dividend payout ratio based on core EP S. Robust Capital Position Attractive Dividend Yield (1)(2) Dividend Payout Ratio (3) 47.7% 34.4% Capital Return Strategy 11.9 % 11.7 % 0.9 % 1.6 % 12.8% 13.7% FHI 4Q19 Public U.S. Banks with $10-$50bn of Assets Tier 2 NCT1 CET 1 Tier 1 Leverage 8.8% 9.9% ▪ Retain sufficient earnings to support growth and maintain capital ratios, and return remainder to shareholders ▪ Targeting ~50% dividend payout ratio ▪ Repurchased 5.1mm shares at a cost of $136.2mm in 2019 ▪ Board approved repurchase program for up to $80mm of common stock

11 Appendix
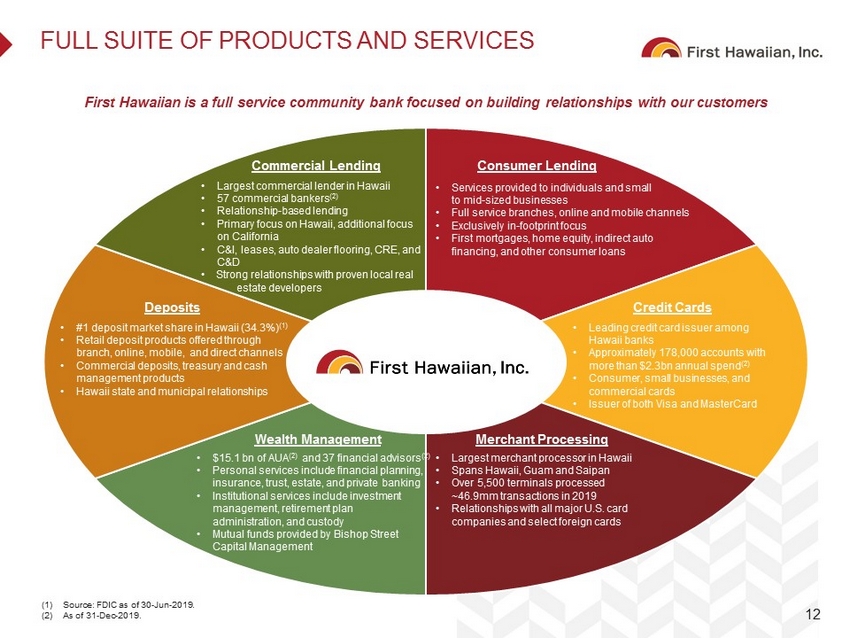
FULL SUITE OF PRODUCTS AND SERVICES 12 • Largest commercial lender in Hawaii • 57 commercial bankers (2) • Relationship - based lending • Primary focus on Hawaii, additional focus on California • C&I, leases, auto dealer flooring, CRE, and C&D • Strong relationships with proven local real estate developers • $15.1 bn of AUA (2) and 37 financial advisors (2) • Personal services include financial planning, insurance, trust, estate, and private banking • Institutional services include investment management, retirement plan administration, and custody • Mutual funds provided by Bishop Street Capital Management • #1 deposit market share in Hawaii (34.3%) (1) • Retail deposit products offered through branch, online, mobile, and direct channels • Commercial deposits, treasury and cash management products • Hawaii state and municipal relationships Commercial Lending Wealth Management Deposits • Services provided to individuals and small to mid - sized businesses • Full service branches, online and mobile channels • Exclusively in - footprint focus • First mortgages, home equity, indirect auto financing, and other consumer loans Consumer Lending • Leading credit card issuer among Hawaii banks • Approximately 178,000 accounts with more than $2.3bn annual spend (2) • Consumer, small businesses, and commercial cards • Issuer of both Visa and M asterCard Credit Cards • Largest merchant processor in Hawaii • Spans Hawaii, Guam and Saipan • Over 5,500 terminals processed ~46.9mm transactions in 2019 • Relationships with all major U.S. card companies and select foreign cards Merchant Processing First Hawaiian is a full service community bank focused on building relationships with our customers (1) Source: FDIC as of 30 - Jun - 2019. (2) As of 31 - Dec - 2019.

Demand 36% Money Market 19% Savings 27% Time 12% $8.9 $9.1 $9.4 $10.2 $10.5 $12.2 $12.9 $13.6 $14.7 $16.1 $16.8 $17.6 $17.2 $16.4 '06 '07 '08 '09 '10 '11 '12 '13 '14 '15 '16 '17 '18 '19 SOLID, LOW - COST CORE DEPOSIT BASE Strong brand, deep ties to the community and a leading market share position have driven an attractive, low - cost deposit base 13 Deposits: $16.4bn 4Q19 Deposit Cost: 0.44% Year Ended December 31 Deposit Portfolio Composition Consistent Deposit Growth ($bn) Best - in - Class Cost of Deposits 0.87 % 1.92 % 0.53 % 1.70 % 2.98 % 0.84 % – % 0.50 % 1.00 % 1.50 % 2.00 % 2.50 % 3.00 % 3.50 % '05 '06 '07 '08 '09 '10 '11 '12 '13 '14 '15 '16 '17 '18 '19 First Hawaiian, Inc. Public U.S. Banks with $10-$50bn of Assets Year Ended December 31 Source: Public filings and SNL Financial, as of 04 - Feb - 2020 Note: Financial data as of 31 - Dec - 2019. $10 – $50bn banks constituted as of 31 - Dec - 2018; excludes merger targets. ~6% of Total Deposits are Public Deposits Public Savings 3% $1.5 bn reduction in Public Time Deposits in 2018 and 2019 Public Time 3%
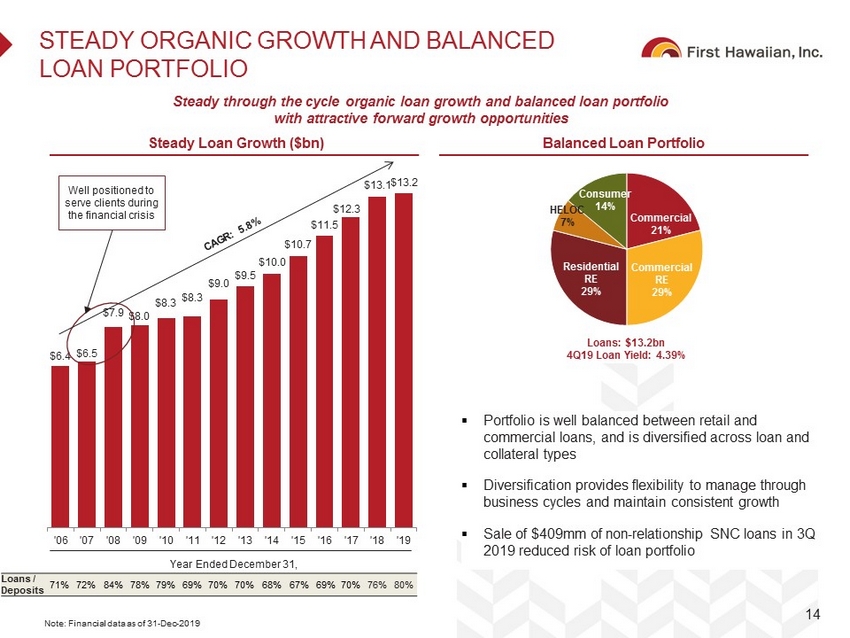
$6.4 $6.5 $7.9 $8.0 $8.3 $8.3 $9.0 $9.5 $10.0 $10.7 $11.5 $12.3 $13.1 $13.2 '06 '07 '08 '09 '10 '11 '12 '13 '14 '15 '16 '17 '18 '19 STEADY ORGANIC GROWTH AND BALANCED LOAN PORTFOLIO Steady through the cycle organic loan growth and balanced loan portfolio with attractive forward growth opportunities 14 Well positioned to serve clients during the financial crisis Commercial 21% Consumer 14% Residential RE 29% Commercial RE 29% HELOC 7% Loans: $13.2bn 4Q19 Loan Yield: 4.39% Loans / Deposits 71% 72% 84% 78% 79% 69% 70% 70% 68% 67% 69% 70% 76% 80% Year Ended December 31, Balanced Loan Portfolio Steady Loan Growth ($bn) Note: Financial data as of 31 - Dec - 2019 ▪ Portfolio is well balanced between retail and commercial loans, and is diversified across loan and collateral types ▪ Diversification provides flexibility to manage through business cycles and maintain consistent growth ▪ Sale of $409mm of non - relationship SNC loans in 3Q 2019 reduced risk of loan portfolio

PROVEN, CONSISTENT, AND CONSERVATIVE CREDIT RISK MANAGEMENT Strong through the cycle credit performance driven by conservative approach to credit risk management 15 Year Ended December 31 0.16% 0.63% 0.14% 0.41% 3.18% 0.64% 0.00% 0.50% 1.00% 1.50% 2.00% 2.50% 3.00% 3.50% '06 '07 '08 '09 '10 '11 '12 '13 '14 '15 '16 '17 '18 '19 As of December 31 1.43% 0.99% 1.16% 2.11% 0.79% 0.50% 1.00% 1.50% 2.00% 2.50% '06 '07 '08 '09 '10 '11 '12 '13 '14 '15 '16 '17 '18 '19 71.4x 23.9x 3.2x 1.7x '06 '07 '08 '09 '10 '11 '12 '13 '14 '15 '16 '17 '18 '19 As of December 31 As of December 31 First Hawaiian, Inc. Public U.S. Banks with $10-$50bn of Assets Source: Public filings and SNL Financial, available as of 04 - Feb - 2020 Note: Financial data as of 31 - Dec - 2019. $10 – $50bn banks constituted as of 31 - Dec - 2018; excludes merger targets. NCOs / Average Loans NPAs + 90s / Loans + OREO Reserves / Loans Reserves / Non - Accrual Loans 75.0x 30.0x 20.0x 10.0x 40.0x 0.21% 0.73% 0.19% 0.13% 1.18% 0.11% 0.00% 0.50% 1.00% 1.50% '06 '07 '08 '09 '10 '11 '12 '13 '14 '15 '16 '17 '18 '19

46.7% 46.8% 46.4% 47.9% 50.2% 47.9% 47.0% 46.6% 47.6% 61.7% 63.0% 63.9% 62.8% 61.4% 60.0% 58.3% 56.4% 56.2% 40.0% 45.0% 50.0% 55.0% 60.0% 65.0% 2011 2012 2013 2014 2015 2016 2017 2018 2019 First Hawaiian, Inc. Public U.S. Banks with $10-$50bn of Assets 2.04% 1.87% 1.78% 1.74% 1.74% 1.71% 1.72% 1.77% 1.81% 2.98% 2.99% 2.93% 2.78% 2.72% 2.60% 2.52% 2.45% 2.37% 1.50% 2.00% 2.50% 3.00% 3.50% 2011 2012 2013 2014 2015 2016 2017 2018 2019 DEMONSTRATED HISTORY OF DISCIPLINED EXPENSE MANAGEMENT 16 Source: Public filings and SNL Financial, as of 04 - Feb - 2020 Note: Financial data as of 31 - Dec - 2019. $10 – $50bn banks constituted as of 31 - Dec - 2018; excludes merger targets. (1) FHB measures shown as core. Core excludes certain gains, expenses and one - time items. See annual and quarterly non - GAAP reconcil iations of core net income, core net interest income, core noninterest income and core noninterest expense used to calculate core ratios in the appendix. (2) Core efficiency ratio is a non - GAAP financial measure. We compute our core efficiency ratio as the ratio of core noninterest exp ense to the sum of core net interest income and core noninterest income. Reconciliation of the components of our core efficiency ratio to comparable GAAP measures are provided in the appendi x. Year Ended December 31, Year Ended December 31, Noninterest Expense / Average Assets (1) Well Managed Core Noninterest Expense ($mm) (1),(2) Efficiency Ratio (1),(2) 2020 Expense Outlook • 2019 core expenses plus ~6% • Loss of $6.5mm reimbursement: 1.8% • Inflation: 2% - 3% • Technology investments: 1% - 2% $ 312 $ 301 $ 296 $ 304 $ 327 $ 331 $ 342 $ 359 $ 368 46.7% 46.8% 46.4% 47.9% 50.2% 47.9% 47.0% 46.6% 47.6% '11 '12 '13 '14 '15 '16 '17 '18 19 Core Noninterest Expense Core Efficiency Ratio CAGR: 2.1% Year Ended December 31,

HAWAII BANKS HAVE A SIGNIFICANT DEPOSIT ADVANTAGE 17 Source: SNL Financial and the Federal Reserve website (1) Deposit beta is defined as the change in deposit costs as a percentage of the change in Fed Funds over a particular period. D ep osit cost uses starting point (2Q04) to peak (3Q07); one quarter lag. (2) Includes First Hawaiian, Bank of Hawaii, American Savings, Central Pacific, Territorial Bancorp, Hawaii National. 3Q19 cost o f deposits based on public company reported information. 3Q19 excludes private companies and undisclosed public company information. (3) Includes all U.S. bank holding companies excluding Hawaii - based banks. 3Q19 cost of deposits based on public company reported i nformation. 3Q19 excludes private companies and undisclosed public company information. Hawaii banks experience more favorable deposit behavior across all rate cycles; Hawaii banks experienced a deposit beta ( ¹ ) of ~34% vs. ~47% for broader U.S. banks during the last rising rate cycle 0.00 % 0.50 % 1.00 % 1.50 % 2.00 % 2.50 % 3.00 % 3.50 % 4.00 % 4.50 % 5.00 % 5.50 % 6.00 % 1Q 2Q 3Q 4Q 1Q 2Q 3Q 4Q 1Q 2Q 3Q 4Q 1Q 2Q 3Q 4Q 1Q 2Q 3Q 4Q 1Q 2Q 3Q 4Q 1Q 2Q 3Q 4Q 1Q 2Q 3Q 4Q 1Q 2Q 3Q 4Q 1Q 2Q 3Q 4Q 1Q 2Q 3Q 4Q 1Q 2Q 3Q 4Q 1Q 2Q 3Q 4Q 1Q 2Q 3Q 4Q 1Q 2Q 3Q 4Q 1Q 2Q 3Q Hawaii Banks² U.S. Banks³ Fed Funds 40bps Current Funding Advantage 3.34 % 1.98 % 0.88 % 0.48 % 5.25 % 136bps Funding Advantage 2.20 % 2004 2005 2006 2007 2008 2009 2010 2011 2012 2013 2014 2015 2016 2017 2018 2019
GAAP TO NON - GAAP RECONCILIATIONS We present net interest income, noninterest income, noninterest expense, efficiency ratio, net income, basic and diluted earn ing s per share and the related ratios described below, on an adjusted, or ‘‘core,’’ basis, each a non - GAAP financial measure. These core measures exclude from the corresponding GAAP measure the impact of certain items that we do not believe are representative of our financial results. We believe that the presentation of these non - GAAP financial measures helps identif y underlying trends in our business from period to period that could otherwise be distorted by the effect of certain expenses, gains and other items included in our operating results. We believe that these core measures provide useful information about our operating results and enhance the overall understanding of our past performance and future performance. I nvestors should consider our performance and financial condition as reported under GAAP and all other relevant information when assessing our performance or financial condition. Core net interest margin, core efficiency ratio, core return on average total assets and core return on average total stockho lde rs’ equity are non - GAAP financial measures. We compute our core net interest margin as the ratio of core net interest income to average earning assets. We compute our core efficien cy ratio as the ratio of core noninterest expense to the sum of core net interest income and core noninterest income. We compute our core return on average total assets as the ratio of core ne t income to average total assets. We compute our core return on average total stockholders’ equity as the ratio of core net income to average total stockholders’ equity. Return on average tangible stockholders’ equity, core return on average tangible stockholders’ equity, return on average tang ibl e assets, core return on average tangible assets and average tangible stockholders’ equity to average tangible assets are non - GAAP financial measures. We compute our return on avera ge tangible stockholders’ equity as the ratio of net income to average tangible stockholders’ equity, which is calculated by subtracting (and thereby effectively excluding) amoun ts related to the effect of goodwill from our average total stockholders’ equity. We compute our core return on average tangible stockholders’ equity as the ratio of core net income to ave rage tangible stockholders’ equity, which is calculated by subtracting (and thereby effectively excluding) amounts related to the effect of goodwill from our average total stockholders ’ e quity. We compute our return on average tangible assets as the ratio of net income to average tangible assets, which is calculated by subtracting (and thereby effectively excluding) am oun ts related to the effect of goodwill from our average total assets. We compute our core return on average tangible assets as the ratio of core net income to average tangible assets. We com pute our average tangible stockholders’ equity to average tangible assets as the ratio of average tangible stockholders’ equity to average tangible assets, each of which we ca lcu late by subtracting (and thereby effectively excluding) the value of our goodwill. We compute our tangible book value per share as the ratio of tangible stockholders’ equity to outstand ing shares. We believe that these measurements are useful for investors, regulators, management and others to evaluate financial performance and capital adequacy relative to other fin anc ial institutions. Although these non - GAAP financial measures are frequently used by stakeholders in the evaluation of a company, they have limitations as analytical tools and sh oul d not be considered in isolation or as a substitute for analysis of our results or financial condition as reported under GAAP. The following tables provide a reconciliation of these non - GAAP financial measures with their most directly comparable GAAP meas ures. 18

GAAP TO NON - GAAP RECONCILIATION 19 ( 1) Annualized for the three months ended December 31, 2019, September 30, 2019 and December 31, 2018. (dollars in thousands, except per share amounts) Income Statement Data: Net income $ 67,836 $ 74,199 $ 59,995 $ 284,392 $ 264,394 Core net income $ 71,250 $ 75,871 $ 77,914 $ 291,785 $ 286,711 Average total stockholders' equity $ 2,636,651 $ 2,648,428 $ 2,437,504 $ 2,609,432 $ 2,457,771 Less: average goodwill 995,492 995,492 995,492 995,492 995,492 Average tangible stockholders' equity $ 1,641,159 $ 1,652,936 $ 1,442,012 $ 1,613,940 $ 1,462,279 Average total assets $ 20,089,601 $ 20,332,457 $ 20,069,988 $ 20,325,697 $ 20,247,135 Less: average goodwill 995,492 995,492 995,492 995,492 995,492 Average tangible assets $ 19,094,109 $ 19,336,965 $ 19,074,496 $ 19,330,205 $ 19,251,643 Return on average total stockholders' equity(1) 10.21 % 11.12 % 9.77 % 10.90 % 10.76 % Core return on average total stockholders' equity (non-GAAP)(1) 10.72 % 11.37 % 12.68 % 11.18 % 11.67 % Return on average tangible stockholders' equity (non-GAAP)(1) 16.40 % 17.81 % 16.51 % 17.62 % 18.08 % Core return on average tangible stockholders' equity (non-GAAP)(1) 17.22 % 18.21 % 21.44 % 18.08 % 19.61 % Return on average total assets(1) 1.34 % 1.45 % 1.19 % 1.40 % 1.31 % Core return on average total assets (non-GAAP)(1) 1.41 % 1.48 % 1.54 % 1.44 % 1.42 % Return on average tangible assets (non-GAAP)(1) 1.41 % 1.52 % 1.25 % 1.47 % 1.37 % Core return on average tangible assets (non-GAAP)(1) 1.48 % 1.56 % 1.62 % 1.51 % 1.49 % 2019 2019 2018 2019 2018 For the Three Months Ended For the Year Ended December 31, September 30, December 31, December 31, Balance Sheet Data: Total stockholders' equity $ 2,640,258 $ 2,654,558 $ 2,524,839 Less: goodwill 995,492 995,492 995,492 Tangible stockholders' equity $ 1,644,766 $ 1,659,066 $ 1,529,347 Total assets $ 20,166,734 $ 20,598,220 $ 20,695,678 Less: goodwill 995,492 995,492 995,492 Tangible assets $ 19,171,242 $ 19,602,728 $ 19,700,186 Shares outstanding 129,928,479 131,260,900 134,874,302 Total stockholders' equity to total assets 13.09 % 12.89 % 12.20 % 8.58 % 8.46 % 7.76 % Book value per share $ 20.32 $ 20.22 $ 18.72 Tangible book value per share (non-GAAP) $ 12.66 $ 12.64 $ 11.34 2019 2019 2018 Tangible stockholders' equity to tangible assets (non-GAAP) As of As of As of December 31, September 30, December 31,

GAAP TO NON - GAAP RECONCILIATION 20 1) The Company reached an agreement in principle to resolve a putative class action lawsuit alleging that the Bank improperly ch arg ed certain overdraft fees. In connection with the settlement agreement, the Company recorded an expense of approximately $4.1 million during the year ended December 31, 2018. 2) One - time items for all periods shown included nonrecurring offering costs. Additionally, one - time items for the three months end ed September 30, 2019 and twelve months ended December 31, 2019 included costs related to a nonrecurring payment to a former executive of the Company pursuant to the Bank’s Executive Change - in - Control Retention Plan and the loss on o ur funding swap as a result of a 2019 decrease in the conversion rate of our Visa Class B restricted shares sold in 2016. One - time items for the year ended December 31, 2018 included the loss on our funding swap as a result of a 2018 decrease in the conversion rate of our Visa Class B restricted shares sold in 2016. 3) Represents the adjustments to net income, tax effected at the Company’s effective tax rate for the respective period. (dollars in thousands, except per share amounts) Net interest income $ 139,619 $ 143,081 $ 143,985 $ 573,402 $ 566,318 Core net interest income (non-GAAP) $ 139,619 $ 143,081 $ 143,985 $ 573,402 $ 566,318 Noninterest income $ 46,708 $ 49,980 $ 33,091 $ 192,533 $ 178,993 Loss on sale of securities 123 — — 2,715 — Costs associated with the sale of stock 4,500 — — 4,500 — OTTI losses on available-for-sale debt securities — — 24,085 — 24,085 Core noninterest income (non-GAAP) $ 51,331 $ 49,980 $ 57,176 $ 199,748 $ 203,078 Noninterest expense $ 91,058 $ 93,466 $ 89,354 $ 370,437 $ 364,953 Loss on litigation settlement (1) — — — — (4,125) One-time items (2) (48) (2,244) (435) (2,814) (2,267) Core noninterest expense (non-GAAP) $ 91,010 $ 91,222 $ 88,919 $ 367,623 $ 358,561 Net income $ 67,836 $ 74,199 $ 59,995 $ 284,392 $ 264,394 Loss on sale of securities 123 — — 2,715 — Costs associated with the sale of stock 4,500 — — 4,500 — OTTI losses on available-for-sale debt securities — — 24,085 — 24,085 Loss on litigation settlement (1) — — — — 4,125 One-time noninterest expense items (2) 48 2,244 435 2,814 2,267 Tax adjustments (3) (1,257) (572) (6,601) (2,636) (8,160) Total core adjustments 3,414 1,672 17,919 7,393 22,317 Core net income (non-GAAP) $ 71,250 $ 75,871 $ 77,914 $ 291,785 $ 286,711 Basic earnings per share $ 0.52 $ 0.56 $ 0.44 $ 2.14 $ 1.93 Diluted earnings per share $ 0.52 $ 0.56 $ 0.44 $ 2.13 $ 1.93 Efficiency ratio 48.86 % 48.41 % 50.45 % 48.36 % 48.96 % Core basic earnings per share (non-GAAP) $ 0.55 $ 0.57 $ 0.58 $ 2.19 $ 2.09 Core diluted earnings per share (non-GAAP) $ 0.54 $ 0.57 $ 0.58 $ 2.19 $ 2.09 Core efficiency ratio (non-GAAP) 47.65 % 47.25 % 44.19 % 47.55 % 46.59 % 2019 2019 2018 2019 2018 For the Three Months Ended For the Year Ended December 31, September 30, December 31, December 31,
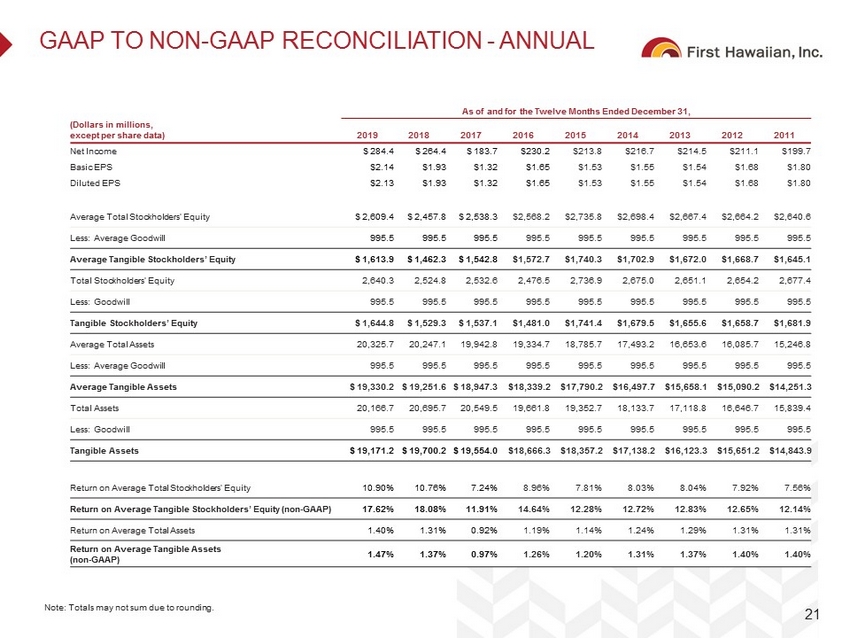
GAAP TO NON - GAAP RECONCILIATION - ANNUAL 21 Note: Totals may not sum due to rounding. As of and for the Twelve Months Ended December 31, (Dollars in millions, except per share data) 2019 2018 2017 2016 2015 2014 2013 2012 2011 Net Income $ 284.4 $ 264.4 $ 183.7 $230.2 $213.8 $216.7 $214.5 $211.1 $199.7 Basic EPS $2.14 $1.93 $1.32 $1.65 $1.53 $1.55 $1.54 $1.68 $1.80 Diluted EPS $2.13 $1.93 $1.32 $1.65 $1.53 $1.55 $1.54 $1.68 $1.80 Average Total Stockholders’ Equity $ 2,609.4 $ 2,457.8 $ 2,538.3 $2,568.2 $2,735.8 $2,698.4 $2,667.4 $2,664.2 $2,640.6 Less: Average Goodwill 995.5 995.5 995.5 995.5 995.5 995.5 995.5 995.5 995.5 Average Tangible Stockholders’ Equity $ 1,613.9 $ 1,462.3 $ 1,542.8 $1,572.7 $1,740.3 $1,702.9 $1,672.0 $1,668.7 $1,645.1 Total Stockholders’ Equity 2,640.3 2,524.8 2,532.6 2,476.5 2,736.9 2,675.0 2,651.1 2,654.2 2,677.4 Less: Goodwill 995.5 995.5 995.5 995.5 995.5 995.5 995.5 995.5 995.5 Tangible Stockholders’ Equity $ 1,644.8 $ 1,529.3 $ 1,537.1 $1,481.0 $1,741.4 $1,679.5 $1,655.6 $1,658.7 $1,681.9 Average Total Assets 20,325.7 20,247.1 19,942.8 19,334.7 18,785.7 17,493.2 16,653.6 16,085.7 15,246.8 Less: Average Goodwill 995.5 995.5 995.5 995.5 995.5 995.5 995.5 995.5 995.5 Average Tangible Assets $ 19,330.2 $ 19,251.6 $ 18,947.3 $18,339.2 $17,790.2 $16,497.7 $15,658.1 $15,090.2 $14,251.3 Total Assets 20,166.7 20,695.7 20,549.5 19,661.8 19,352.7 18,133.7 17,118.8 16,646.7 15,839.4 Less: Goodwill 995.5 995.5 995.5 995.5 995.5 995.5 995.5 995.5 995.5 Tangible Assets $ 19,171.2 $ 19,700.2 $ 19,554.0 $18,666.3 $18,357.2 $17,138.2 $16,123.3 $15,651.2 $14,843.9 Return on Average Total Stockholders’ Equity 10.90% 10.76% 7.24% 8.96% 7.81% 8.03% 8.04% 7.92% 7.56% Return on Average Tangible Stockholders’ Equity (non - GAAP) 17.62% 18.08% 11.91% 14.64% 12.28% 12.72% 12.83% 12.65% 12.14% Return on Average Total Assets 1.40% 1.31% 0.92% 1.19% 1.14% 1.24% 1.29% 1.31% 1.31% Return on Average Tangible Assets (non - GAAP) 1.47% 1.37% 0.97% 1.26% 1.20% 1.31% 1.37% 1.40% 1.40%

GAAP TO NON - GAAP RECONCILIATION - ANNUAL 22 Note: Totals may not sum due to rounding. (1) Noninterest income and expenses prior to 2017 have been revised from the amounts previously reported to reflect the reclassif ica tions described in the footnote to Table 1 of the fourth quarter 2017 earnings release. (2) Adjustments that are not material to our financial results have not been presented for certain periods. (3) Other adjustments include a one - time MasterCard signing bonus and a recovery of an investment that was previously written down. (4) One - time items for the year ended December 31, 2019 included a nonrecurring payment to a former executive of the Company pursuan t to the Bank’s Executive Change - in - Control Retention Plan, nonrecurring offering costs and the loss on our funding swap as a re sult of a 2019 decrease in the conversion rate of our Visa Class B restricted shares sold in 2016. One - time items for the year ended December 31, 2018 included public company transition - related costs, the loss on our funding swap as a result of a 2018 decrease in the co nversion rate of the aforementioned Visa Class B restricted shares and nonrecurring offering costs. One - time items for the year - ended December 31, 2 017 included salaries and benefits stemming from the Tax Act, nonrecurring offering costs and public company transition - related costs. One - time items for the year - ended December 31, 2016 included public company transition - related costs and nonrecurring offering costs. (5) Represents the adjustments to net income, tax effected at the Company’s effective tax rate, exclusive of one - time tax reform bil l expense, for the respective period. For the Fiscal Year Ended December 31, (Dollars in millions, except per share data) 2019 2018 2017 2016 2015 2014 2013 2012 2011 Net Interest Income $ 573.4 $ 566.3 $ 528.8 $491.7 $461.3 $443.8 $439.0 $447.5 $470.0 Accounting Change (ASC 310 Adjustment) – – – – – – (4.3) – – Early Buyout on Lease – – – – – (3.1) – – – Early Loan Termination (2) – – – – (4.8) – – – – Core Net Interest Income (Non - GAAP) $ 573.4 $ 566.3 $ 528.8 $491.7 $456.5 $440.7 $434.7 $447.5 $470.0 Noninterest Income (1) $ 192.5 $ 179.0 $ 205.6 $226.0 $219.1 $216.0 $214.4 $219.1 $200.2 OTTI Losses on Available - For - Sale Securities – 24.1 – – – – – – – Gain on Sale of Securities 2.7 – – (4.6) (7.7) – (0.2) (16.7) (1.7) Gain on Sale of Stock (Visa/MasterCard) 4.5 – – (22.7) (4.6) (20.8) (11.1) – – Gain on Sale of Bank Properties – – (6.9) – (3.4) – (0.4) (6.4) – Other Adjustments (2),(3) – – – – (7.5) – – – (0.9) Core Noninterest Income (Non - GAAP) $199.7 $203.1 $198.7 $198.8 $195.9 $195.1 $202.7 $196.0 $197.6 Noninterest Expense (1) $ 370.4 $ 365.0 $ 347.6 $337.3 $327.3 $304.4 $296.7 $301.9 $311.7 Loss on Litigation Settlement – (4.1) – – – – – – – Non - Recurring Items (4) (2.8) (2.3) (5.5) (6.2) – – (0.7) (0.7) – Core Noninterest Expense (Non - GAAP) $ 367.6 $ 358.6 $ 342.1 $331.1 $327.3 $304.4 $296.0 $301.2 $311.7 Net Income $ 284.4 $ 264.4 $ 183.7 $230.2 $213.8 $216.7 $214.5 $211.1 $199.7 OTTI Losses on Available - For - Sale Debt Securities – 24.1 – – – – – – – Accounting Change (ASC 310 Adjustment) – – – – – – (4.3) – – Early Buyout on Lease – – – – – (3.1) – – – Early Loan Termination – – – – (4.8) – – – – Gain on Sale of Securities 2.7 – – (4.6) (7.7) – (0.2) (16.7) (1.7) Gain on Sale of Stock (Visa/MasterCard) 4.5 – – (22.7) (4.6) (20.8) (11.1) – – Gain on Sale of Real Estate – – (6.9) – (3.4) – (0.4) (6.4) – Loss on Litigation Settlement – 4.1 – – – – – – – Other Adjustments (2),(3) – – – – (7.5) – – – (0.9) Non - Recurring Items (4) 2.8 2.3 5.5 6.2 – – 0.7 0.7 – Tax reform Bill – – 47.6 – – – – – – Tax Adjustments (5) (2.6) (8.2) 0.6 8.0 10.6 8.9 5.8 8.1 1.0 Total Core Adjustments 7.4 22.3 46.7 (13.1) (17.5) (15.0) (9.5) (14.3) (1.7) Core Net Income (Non - GAAP) $ 291.8 $ 286.7 $ 230.4 $217.1 $196.3 $201.6 $205.0 $196.7 $198.0 Core Basic EPS (Non - GAAP) $ 2.14 $ 2.09 $ 1.65 $1.56 $1.41 $1.45 $1.47 $1.57 $1.79 Core Diluted EPS (Non - GAAP) $ 2.13 $ 2.09 $ 1.65 $1.56 $1.41 $1.45 $1.47 $1.57 $1.79