Attached files
| file | filename |
|---|---|
| 8-K - FORM 8-K - FIRST BUSINESS FINANCIAL SERVICES, INC. | fbiz4q19ceoletter8-k.htm |
Exhibit 99.1

FIRST BUSINESS CEO REPORT
Fourth Quarter 2019
Dear Shareholders and Friends of First Business,
It was an extraordinary year by many measures for First Business in 2019. We reported record levels of earnings and top line revenue, as well as solid loan growth and improved credit quality metrics. Deposits grew to an all-time high, benefiting from exceptional in-market deposit gathering efforts by our team. During 2019 we also made important investments in talent and infrastructure that allowed us to achieve these very strong operating results and position us well for solid financial performance in the future.
EXCEPTIONAL PERFORMANCE
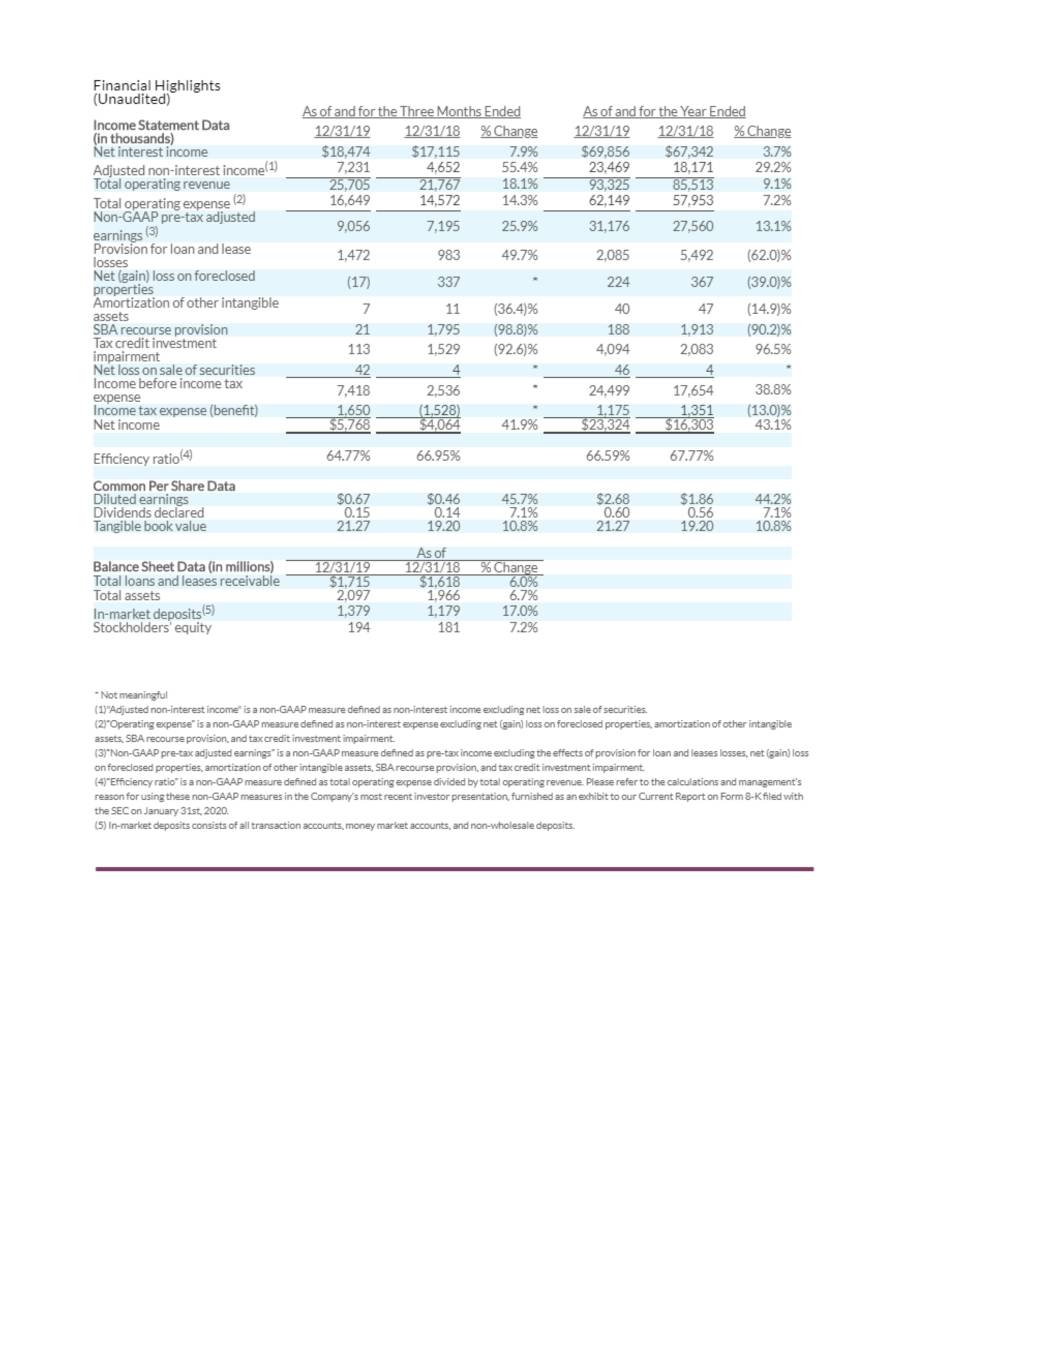
If these achievements illustrate anything, it’s that by adhering to our strategic plan, we are clearly charting the right course. Net income grew by 43% to a record $23.3 million, or $2.68 per share, in 2019, from $16.3 million, or $1.86 per share, in 2018. This earnings growth rate places our Company among the top decile of peers, with net income growing at more than four times the rate of growth the median peer bank achieved during 2019.1
We achieved a return on average assets (ROAA) of 1.14% and a return on average equity (ROAE) of 12.55% for 2019, benefiting from growth in net operating revenue and lower levels of provisioning during the year. We’re pleased with our progress towards our long-term targets of 1.15% ROAA and 13.50% ROAE and with our improvement over 2018, when we reported 0.86% ROAA and 9.41% ROAE.
First Business’s performance and prospects are also increasingly recognized by the market, with one-year cumulative total return to shareholders of nearly 39% through December 31, 2019, outperforming the S&P 500, Dow Jones Industrial Average, and NASDAQ Composite, and placing us in the top decile among our peers.2
NON-INTEREST INCOME EXPANSION AND DIVERSIFICATION DRIVE REVENUES
Top line revenue, the sum of net interest income and non-interest income, totaled $93.3 million for 2019, an increase of approximately $7.8 million, or 9%, from $85.5 million for prior year. We are pleased with this robust revenue growth, which was positively impacted by non-interest income expansion of 29% year-over-year to $23.4 million, compared to $18.2 million in 2018. Swap fee income more than doubled from the prior year, while returns from mezzanine investment funds and growth in private wealth management income also contributed to the annual increase. These results reflect an ongoing focus on diversifying our fee income streams, which helps to moderate the quarter-to-quarter variability experienced by some of our business lines, enhance return on equity, and mitigate reliance on net interest income to drive top line revenue growth. Our efforts resulted in non-interest income contributing 25% of top line revenue in 2019, up from 21% in the prior year and hitting our long-term strategic plan target.
The primary contributor to annual non-interest income continues to be trust and investment services fee income, which totaled $8.2 million in 2019 and represented 35% of non-interest income, for the year. The majority of the growth in 2019 came from our Madison market. Moving forward, we expect to grow this business at a faster pace, as the multiple private wealth management experts we hired in 2019 continue to build momentum and we expand to our other markets in Wisconsin and the greater Kansas City area.
Fees generated from commercial loan interest rate swaps contributed $4.2 million to our non-interest income in 2019, up more than 149% from the $1.7 million earned in 2018. As a percentage of total non-interest income, swap fees grew to 18% in the recent year from 9% in the prior year. While we do not expect the same level of activity in 2020, given the current rate environment, we do expect commercial real estate clients will continue to leverage our swap offering in the coming quarters.
Gains on the sale of SBA loans generated $1.5 million in 2019, consistent with the prior year. SBA activity has increased during each of the last three quarters, and we believe our experienced production team is positioned to maximize the opportunities in our pipeline. Notably, during the fourth quarter of 2019 alone our SBA team closed $11.6 million in new commitments, which marks the largest quarter of production since we rebuilt the platform.
Other sources of fee income, which largely refers to non-loan and deposit-related business activities, totaled $4.8 million in 2019, compared to $2.5 million in 2018. The primary drivers of this 94% annual growth were returns on investments made in mezzanine funds, along with gains recognized on end-of-term buyout agreements related to the Company’s equipment financing business line. We’re pleased with the strong returns generated by our mezzanine fund investments this year, and the returns from prior periods dating back to 2011, when we began investing in this space with an experienced partner in the industry. Also of note, we recently launched a new business line, First Business Consulting Services (FBCS), which provides investment portfolio administration and asset/liability management services to community banks. FBCS contributed over $100,000 in fee income to our record top line performance in 2019 and we are optimistic about its future growth prospects.
INTEREST RATE RISK MANAGEMENT
Fourth quarter 2019 net interest margin expanded by 33 basis points on a linked quarter basis to 3.73% and four basis points year-over-year, reflecting a reduction in the rate paid on average deposits and an increase in loan fees in lieu of interest3, which typically come from the prepayment of loans in our asset-based lending business line. This compares very favorably to the median peer bank reporting eight and 16 basis points of reduction in net interest margin on a linked quarter basis and year-over-year, respectively. We are encouraged by our fourth quarter margin expansion, which we believe reflects our ability to produce a solid and consistent margin over time.
In addition to our disciplined, relationship-based pricing, our management team continues to employ active balance sheet management to maintain a strong net interest margin, including exercising call options on subordinated debt and brokered deposits as we replace them with in-market4 or wholesale funds at lower costs.
PRUDENT EXPENSE MANAGEMENT
Annual operating expenses totaled $62.1 million, a 7% increase over 2018 expenses of $58.0 million. The largest portion of our expense is compensation, which increased by approximately 12% year-over-year, reflecting our investment in 14 net new employees and an increase in performance-based bonus compensation driven by our exceptional 2019 results.
Even as we have invested in our business, we remain mindful of expenses in relation to our revenue growth. Our ability to grow revenues at a faster pace than expenses resulted in a 118-basis-point improvement in the Company’s efficiency ratio year-over-year to 66.59%, from 67.77% in 2018. What’s more, our quarterly efficiency ratio has steadily improved during each of the last three quarters. We remain focused on prudent expense management in order to drive positive operating leverage over the long term as we strive to grow top line revenue 10% per year on average, outpacing expenses for continued investments in our business.
SOLID BALANCE SHEET EXPANSION
Average loans and leases totaled a record $1.7 billion for the year ended December 31, 2019, increasing 8% from the year prior. Period-end loans and leases at December 31, 2019 were up 6% from the prior year-end to $1.7 billion and were impacted by a high level of payoffs late in the fourth quarter of 2019. Based on the high quality lending team we have assembled, we are confident in our ability to continue to grow loans in the upper single digits in 2020.
Looking ahead, we believe our ongoing focus on businesses and individuals with sophisticated financial needs will continue to benefit both our clients and shareholders. We will continue to invest in products and services that broaden and deepen our relationships across our commercial banking markets and specialty finance business lines.
Our efforts to strategically expand in-market deposits were a resounding success in 2019, as this valuable, lower-cost funding source hit new record levels and more than fully funded net loan growth. Period-end in-market deposits increased $199 million to a record $1.4 billion, or 75.5% of total bank funding at December 31, 2019, compared to 68.2% one year earlier.
We expect ongoing strong deposit gathering from our treasury management and private wealth management teams in 2020 as we continue to focus on growing lower-cost, in-market deposits by expanding relationships with existing clients and introducing new ones to our high-touch, client-centric approach at First Business.
ASSET QUALITY IMPOVEMENT
Our ability to deliver solid financial results in 2019 was supported by our continued focus on improving our credit quality metrics. Non-performing assets declined to $23.5 million, or 1.12% of total assets, from $27.8 million, or 1.42% of total assets, one year prior. Most importantly, our provision for loan and lease losses declined significantly to $2.1 million for the year ended December 31, 2019, including a provision benefit during the first half of the year, compared to $5.5 million for 2018 primarily due to the continued reduction of our legacy SBA portfolio and a decrease in charge-offs.
Our team remains very focused on strong credit management as we continue to resolve issues within our legacy portfolio of SBA loans originated before 2017, which has been nearly cut in half to $74.1 million in total on- and off-balance sheet legacy loans, down from $145.1 million at December 31, 2017. As we’ve shared with you, we expect losses in this business to continue to decline in frequency and magnitude as the portfolio matures and amortizes down.
FOCUSED ON THE FUTURE
Our 2019 performance reflects the success of our client-centered business model and the investments we’ve made in people and infrastructure. In 2019, we generated revenue per employee5 of approximately $324,000, 30% greater than the median peer bank.6 Importantly, of the 14 net new employees we added in 2019, eight are producers who joined First Business during the second half of the year. They have hit the ground running and we believe that going into 2020, our expanded team is well-positioned and supported to capitalize on the opportunities we see throughout our footprint.
Thank you for your continued interest in and support of First Business. I look forward to sharing our first quarter results with you in the coming months.
Sincerely,
Corey Chambas, President and CEO
1. | The median year-over-year net income growth rate of publicly traded banks with total assets of $1B to $3B was 10.5%, based on data from S&P Global Market Intelligence as of January 26, 2020. |
2. | Median cumulative total return to shareholders including reinvestment of dividends of $1B to $3B asset banks of 14.6% through December 31, 2019 based on data from S&P Global Market Intelligence. Indices reported total returns of 31.5% for S&P 500, 25.3% for Dow Jones Industrial Average, and 36.7% for NASDAQ in 2019. |
3. | "Fees in Lieu of Interest" are defined as prepayment fees, asset-based loan fees, and non-accrual interest. |
4. | "In-market deposits" are defined as all transaction accounts, money market accounts, and non-wholesale deposits originated within our primary markets of Wisconsin, Kansas, and Missouri. |
5. | Full-time equivalent employees (FTE) of 288 at December 31, 2019. |
6. | The median publicly traded bank with total assets of $1B to $3B had revenue per FTE of approximately $220,000 based on most recent year data available from S&P Global Market Intelligence as of January 26, 2020. |
This letter includes “forward-looking statements” related to First Business Financial Services, Inc. (the “Company”) that can generally be identified as describing the Company’s future plans, objectives, goals or expectations. Such forward-looking statements are subject to risks and uncertainties that could cause actual results or outcomes to differ materially from those currently anticipated. These forward-looking statements are made pursuant to the safe harbor provisions of the Private Securities Litigation Reform Act of 1995. For further information about the factors that could affect the Company’s future results, please see the Company’s most recent annual report on Form 10-K, quarterly reports on Form 10-Q and other filings with the Securities and Exchange Commission. We do not intend to, and specifically disclaim any obligation to, update any forward-looking statements.