Attached files
| file | filename |
|---|---|
| EX-99.2 - EX-99.2 - Premier, Inc. | d883238dex992.htm |
| EX-99.1 - EX-99.1 - Premier, Inc. | d883238dex991.htm |
| 8-K - 8-K - Premier, Inc. | d883238d8k.htm |
Second-Quarter Fiscal 2020 Financial Results and Update February 4, 2020 Exhibit 99.3
Forward-looking statements and non-GAAP financial measures Forward-looking statements – Statements made in this presentation that are not statements of historical or current facts, such as those related to the current market environment and uncertainties, expected financial performance, non-GAAP free cash flow generation, share repurchases, if any, under our current and future stock repurchase program, the success of our incremental investments in growth opportunities, the statements related to fiscal 2020 outlook and guidance and the assumptions underlying such guidance, and the expected closing date and anticipated financial and operational impact of the acquisitions of the Acurity and Nexera businesses are “forward-looking statements” within the meaning of the Private Securities Litigation Reform Act of 1995. Forward-looking statements may involve known and unknown risks, uncertainties and other factors that may cause the actual results, performance or achievements of Premier to be materially different from historical results or from any future results or projections expressed or implied by such forward-looking statements. Accordingly, readers should not place undue reliance on any forward-looking statements. In addition to statements that explicitly describe such risks and uncertainties, readers are urged to consider statements in the conditional or future tenses or that include terms such as “believes,” “belief,” “expects,” “estimates,” “intends,” “anticipates” or “plans” to be uncertain and forward-looking. Forward-looking statements may include comments as to Premier’s beliefs and expectations as to future events and trends affecting its business and are necessarily subject to uncertainties, many of which are outside Premier’s control. More information on potential factors that could affect Premier’s financial results is included from time to time in the “Cautionary Note Regarding Forward-Looking Statements,” “Risk Factors” and “Management’s Discussion and Analysis of Financial Condition and Results of Operations” sections of Premier’s periodic and current filings with the SEC, including those discussed under the “Risk Factors” and “Cautionary Note Regarding Forward-Looking Statements” section of Premier’s Form 10-K for the year ended June 30, 2019 and Form 10-Q for the quarter ended December 31, 2019, expected to be filed with the SEC shortly after the date of this presentation and also made available on Premier’s website at investors.premierinc.com. Forward-looking statements speak only as of the date they are made, and Premier undertakes no obligation to publicly update or revise any forward-looking statements, whether as a result of new information or future events that occur after that date, or otherwise. Non-GAAP financial measures – This presentation and accompanying webcast includes certain “non-GAAP financial measures” as defined in Regulation G under the Securities Exchange Act of 1934. Schedules are attached that reconcile the non-GAAP financial measures included in this presentation to the most directly comparable financial measures calculated and presented in accordance with Generally Accepted Accounting Principles in the United States. You should carefully read Premier’s periodic and current filings with the SEC for definitions and further explanation and disclosure regarding our use of non-GAAP financial measures and such filings should be read in conjunction with this presentation.

Q2 Overview and Business Update Susan DeVore Chief Executive Officer Premier, Inc.
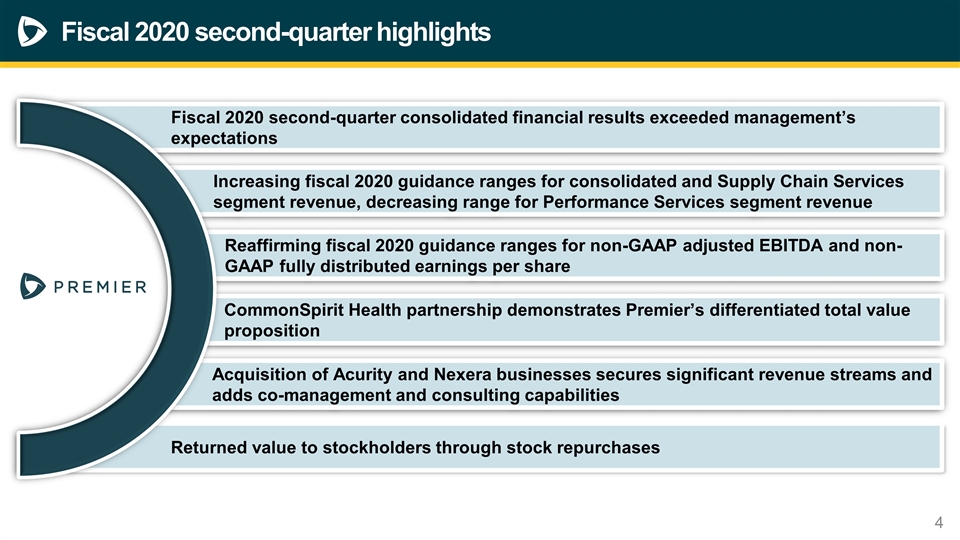
Fiscal 2020 second-quarter highlights *See non-GAAP Adjusted EBITDA, non-GAAP Adjusted Fully Distributed Earnings Per Share and non-GAAP Free Cash Flow reconciliations to GAAP equivalents in Appendix. Reaffirming fiscal 2020 guidance ranges for non-GAAP adjusted EBITDA and non-GAAP fully distributed earnings per share Increasing fiscal 2020 guidance ranges for consolidated and Supply Chain Services segment revenue, decreasing range for Performance Services segment revenue CommonSpirit Health partnership demonstrates Premier’s differentiated total value proposition Acquisition of Acurity and Nexera businesses secures significant revenue streams and adds co-management and consulting capabilities Returned value to stockholders through stock repurchases Fiscal 2020 second-quarter consolidated financial results exceeded management’s expectations
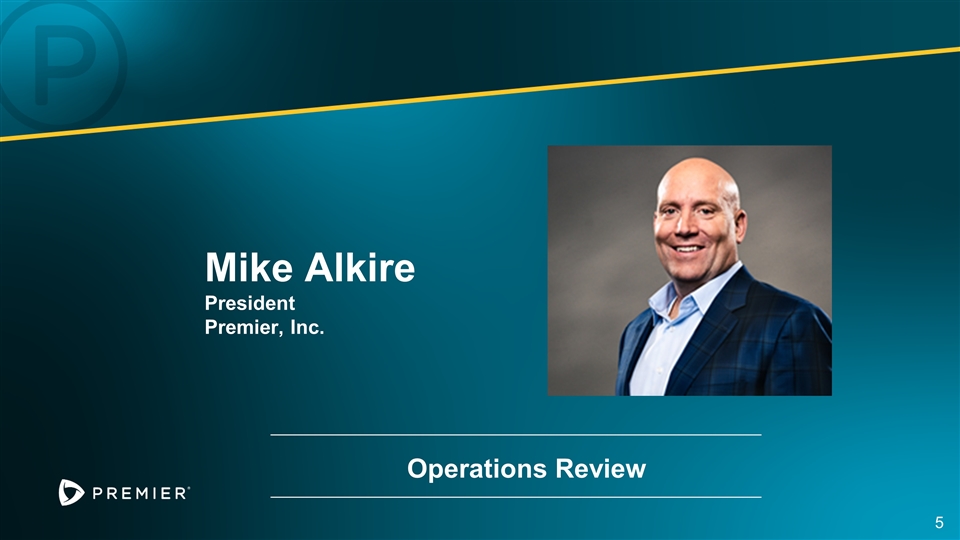
Operations Review Mike Alkire President Premier, Inc.
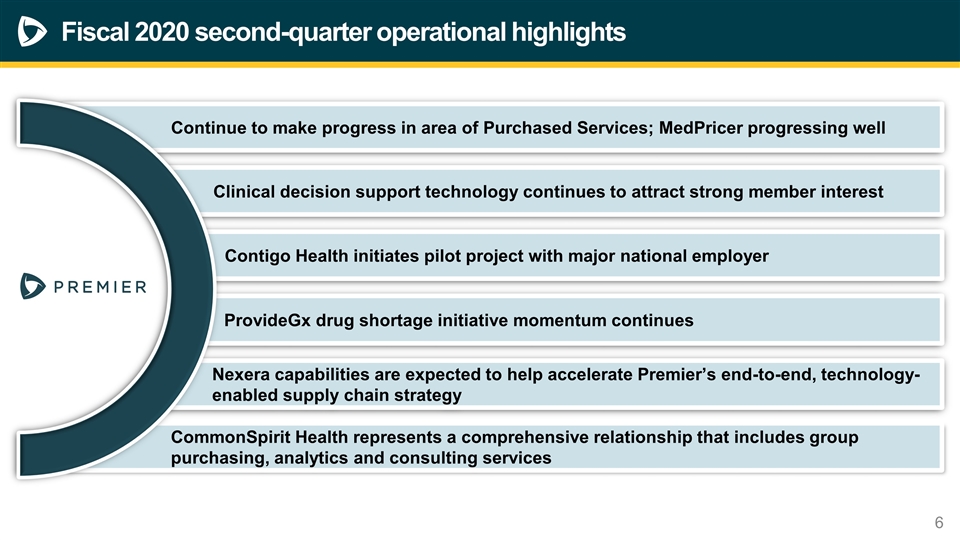
Fiscal 2020 second-quarter operational highlights *See non-GAAP Adjusted EBITDA, non-GAAP Adjusted Fully Distributed Earnings Per Share and non-GAAP Free Cash Flow reconciliations to GAAP equivalents in Appendix. Contigo Health initiates pilot project with major national employer Clinical decision support technology continues to attract strong member interest ProvideGx drug shortage initiative momentum continues Nexera capabilities are expected to help accelerate Premier’s end-to-end, technology-enabled supply chain strategy CommonSpirit Health represents a comprehensive relationship that includes group purchasing, analytics and consulting services Continue to make progress in area of Purchased Services; MedPricer progressing well

Financial Review Craig McKasson Chief Administrative and Financial Officer Premier, Inc.
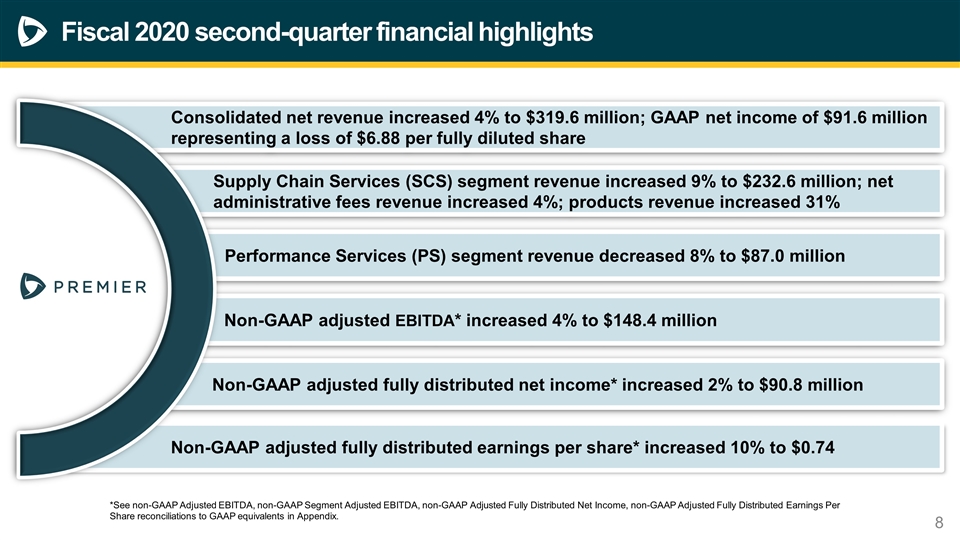
Fiscal 2020 second-quarter financial highlights *See non-GAAP Adjusted EBITDA, non-GAAP Adjusted Fully Distributed Earnings Per Share and non-GAAP Free Cash Flow reconciliations to GAAP equivalents in Appendix. Performance Services (PS) segment revenue decreased 8% to $87.0 million Supply Chain Services (SCS) segment revenue increased 9% to $232.6 million; net administrative fees revenue increased 4%; products revenue increased 31% Non-GAAP adjusted EBITDA* increased 4% to $148.4 million Non-GAAP adjusted fully distributed net income* increased 2% to $90.8 million Non-GAAP adjusted fully distributed earnings per share* increased 10% to $0.74 Consolidated net revenue increased 4% to $319.6 million; GAAP net income of $91.6 million representing a loss of $6.88 per fully diluted share *See non-GAAP Adjusted EBITDA, non-GAAP Segment Adjusted EBITDA, non-GAAP Adjusted Fully Distributed Net Income, non-GAAP Adjusted Fully Distributed Earnings Per Share reconciliations to GAAP equivalents in Appendix.
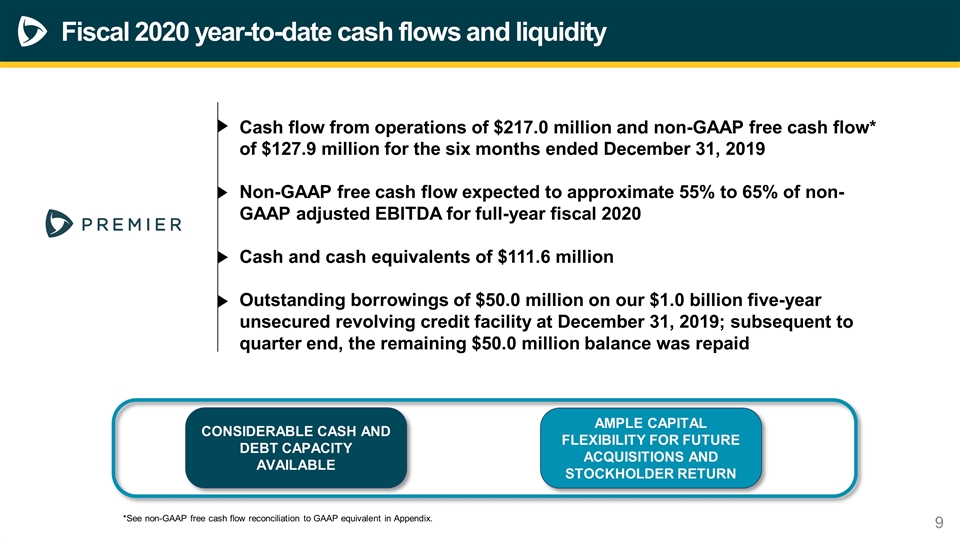
Fiscal 2020 year-to-date cash flows and liquidity Cash flow from operations of $217.0 million and non-GAAP free cash flow* of $127.9 million for the six months ended December 31, 2019 Non-GAAP free cash flow expected to approximate 55% to 65% of non-GAAP adjusted EBITDA for full-year fiscal 2020 Cash and cash equivalents of $111.6 million Outstanding borrowings of $50.0 million on our $1.0 billion five-year unsecured revolving credit facility at December 31, 2019; subsequent to quarter end, the remaining $50.0 million balance was repaid CONSIDERABLE CASH AND DEBT CAPACITY AVAILABLE AMPLE CAPITAL FLEXIBILITY FOR FUTURE ACQUISITIONS AND STOCKHOLDER RETURN *See non-GAAP free cash flow reconciliation to GAAP equivalent in Appendix.
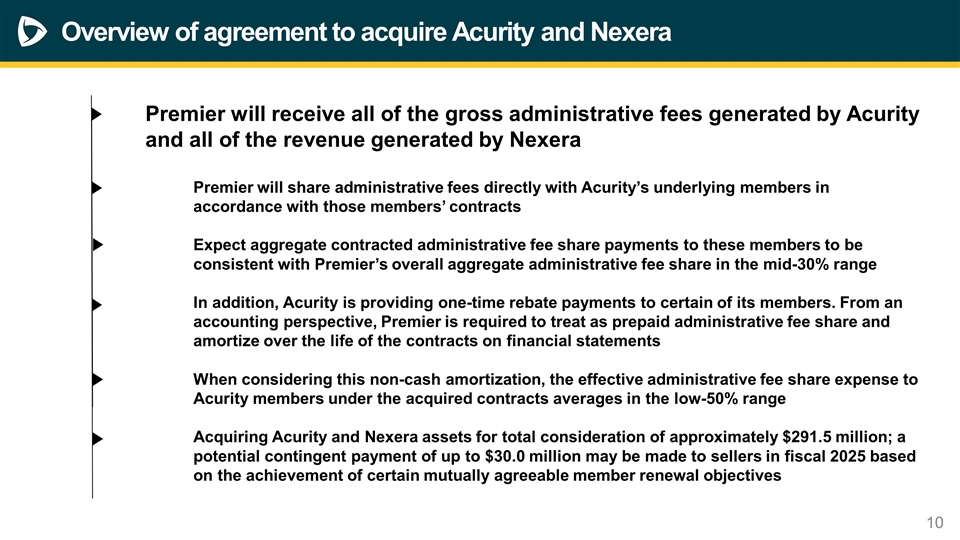
Overview of agreement to acquire Acurity and Nexera Premier will receive all of the gross administrative fees generated by Acurity and all of the revenue generated by Nexera Premier will share administrative fees directly with Acurity’s underlying members in accordance with those members’ contracts Expect aggregate contracted administrative fee share payments to these members to be consistent with Premier’s overall aggregate administrative fee share in the mid-30% range In addition, Acurity is providing one-time rebate payments to certain of its members. From an accounting perspective, Premier is required to treat as prepaid administrative fee share and amortize over the life of the contracts on financial statements When considering this non-cash amortization, the effective administrative fee share expense to Acurity members under the acquired contracts averages in the low-50% range Acquiring Acurity and Nexera assets for total consideration of approximately $291.5 million; a potential contingent payment of up to $30.0 million may be made to sellers in fiscal 2025 based on the achievement of certain mutually agreeable member renewal objectives
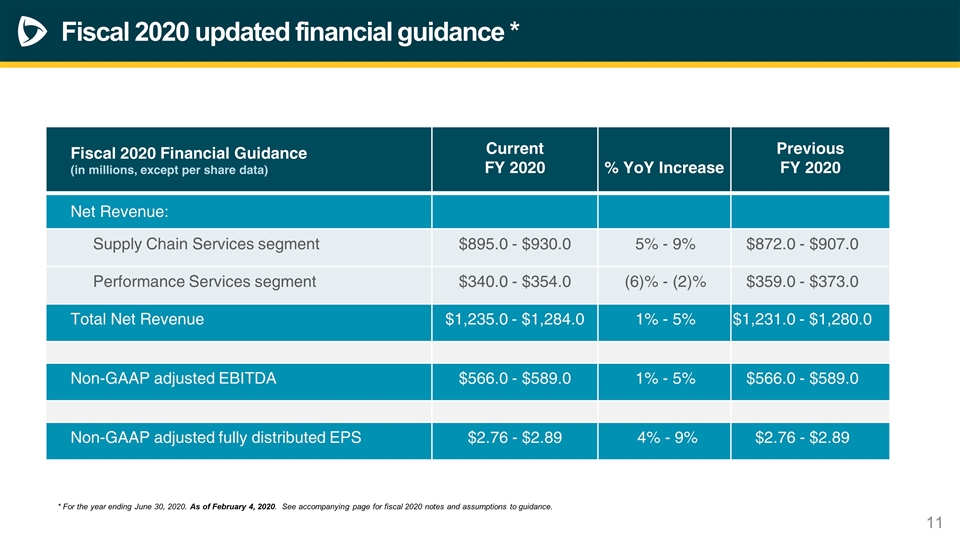
Fiscal 2020 updated financial guidance * Fiscal 2020 Financial Guidance (in millions, except per share data) Current FY 2020 % YoY Increase Previous FY 2020 Net Revenue: Supply Chain Services segment $895.0 - $930.0 5% - 9% $872.0 - $907.0 Performance Services segment $340.0 - $354.0 (6)% - (2)% $359.0 - $373.0 Total Net Revenue $1,235.0 - $1,284.0 1% - 5% $1,231.0 - $1,280.0 Non-GAAP adjusted EBITDA $566.0 - $589.0 1% - 5% $566.0 - $589.0 Non-GAAP adjusted fully distributed EPS $2.76 - $2.89 4% - 9% $2.76 - $2.89 * For the year ending June 30, 2020. As of February 4, 2020. See accompanying page for fiscal 2020 notes and assumptions to guidance.
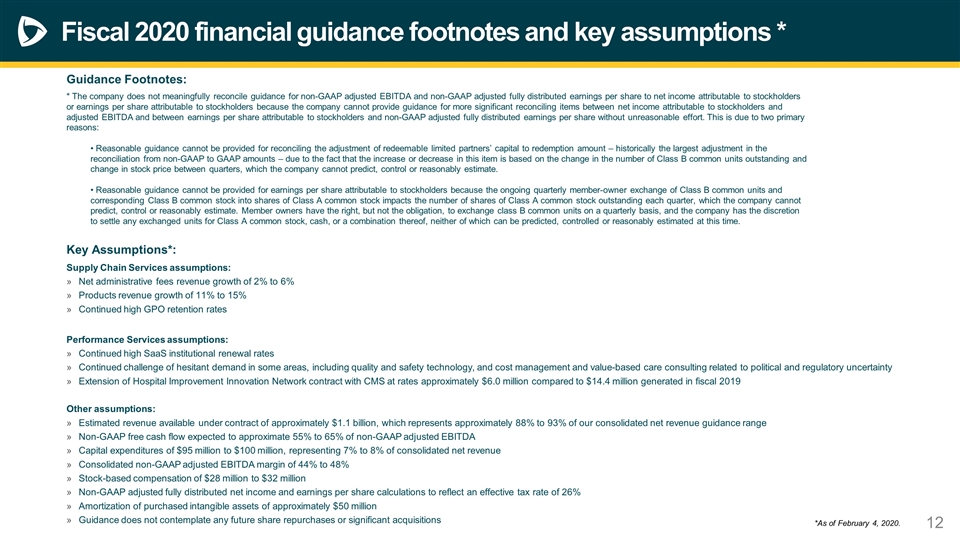
Fiscal 2020 financial guidance footnotes and key assumptions * Guidance Footnotes: * The company does not meaningfully reconcile guidance for non-GAAP adjusted EBITDA and non-GAAP adjusted fully distributed earnings per share to net income attributable to stockholders or earnings per share attributable to stockholders because the company cannot provide guidance for more significant reconciling items between net income attributable to stockholders and adjusted EBITDA and between earnings per share attributable to stockholders and non-GAAP adjusted fully distributed earnings per share without unreasonable effort. This is due to two primary reasons: • Reasonable guidance cannot be provided for reconciling the adjustment of redeemable limited partners’ capital to redemption amount – historically the largest adjustment in the reconciliation from non-GAAP to GAAP amounts – due to the fact that the increase or decrease in this item is based on the change in the number of Class B common units outstanding and change in stock price between quarters, which the company cannot predict, control or reasonably estimate. • Reasonable guidance cannot be provided for earnings per share attributable to stockholders because the ongoing quarterly member-owner exchange of Class B common units and corresponding Class B common stock into shares of Class A common stock impacts the number of shares of Class A common stock outstanding each quarter, which the company cannot predict, control or reasonably estimate. Member owners have the right, but not the obligation, to exchange class B common units on a quarterly basis, and the company has the discretion to settle any exchanged units for Class A common stock, cash, or a combination thereof, neither of which can be predicted, controlled or reasonably estimated at this time. Key Assumptions*: Supply Chain Services assumptions: Net administrative fees revenue growth of 2% to 6% Products revenue growth of 11% to 15% Continued high GPO retention rates Performance Services assumptions: Continued high SaaS institutional renewal rates Continued challenge of hesitant demand in some areas, including quality and safety technology, and cost management and value-based care consulting related to political and regulatory uncertainty Extension of Hospital Improvement Innovation Network contract with CMS at rates approximately $6.0 million compared to $14.4 million generated in fiscal 2019 Other assumptions: Estimated revenue available under contract of approximately $1.1 billion, which represents approximately 88% to 93% of our consolidated net revenue guidance range Non-GAAP free cash flow expected to approximate 55% to 65% of non-GAAP adjusted EBITDA Capital expenditures of $95 million to $100 million, representing 7% to 8% of consolidated net revenue Consolidated non-GAAP adjusted EBITDA margin of 44% to 48% Stock-based compensation of $28 million to $32 million Non-GAAP adjusted fully distributed net income and earnings per share calculations to reflect an effective tax rate of 26% Amortization of purchased intangible assets of approximately $50 million Guidance does not contemplate any future share repurchases or significant acquisitions *As of February 4, 2020.
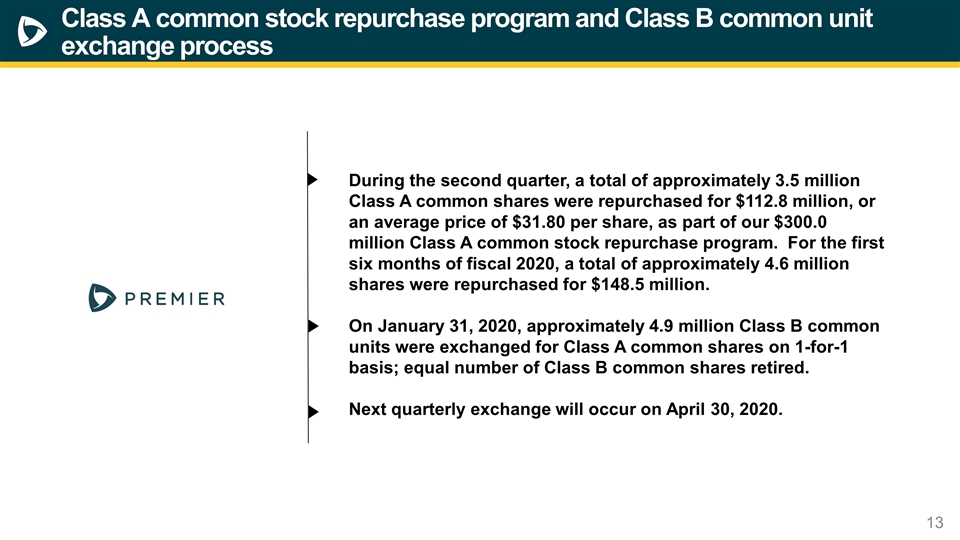
Class A common stock repurchase program and Class B common unit exchange process During the second quarter, a total of approximately 3.5 million Class A common shares were repurchased for $112.8 million, or an average price of $31.80 per share, as part of our $300.0 million Class A common stock repurchase program. For the first six months of fiscal 2020, a total of approximately 4.6 million shares were repurchased for $148.5 million. On January 31, 2020, approximately 4.9 million Class B common units were exchanged for Class A common shares on 1-for-1 basis; equal number of Class B common shares retired. Next quarterly exchange will occur on April 30, 2020.

Questions

Appendix
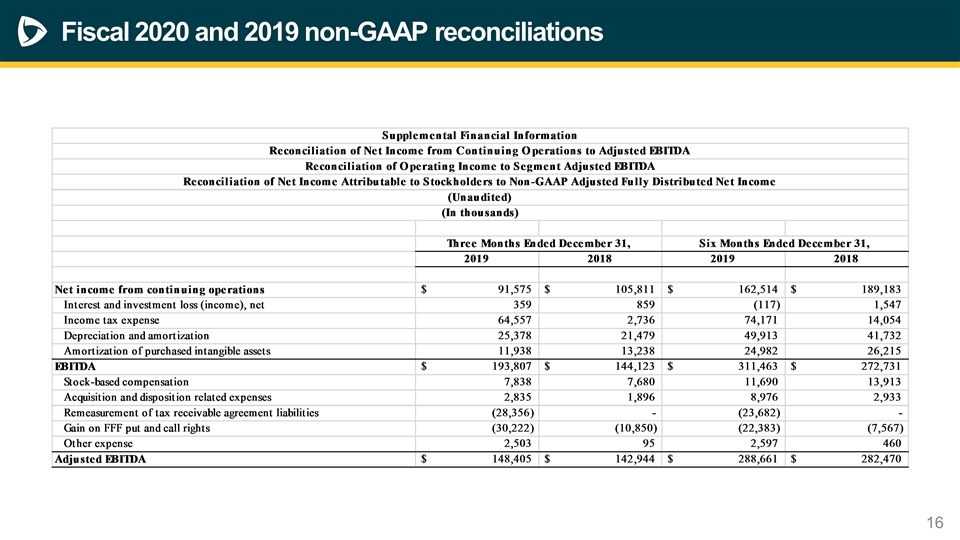
Fiscal 2020 and 2019 non-GAAP reconciliations
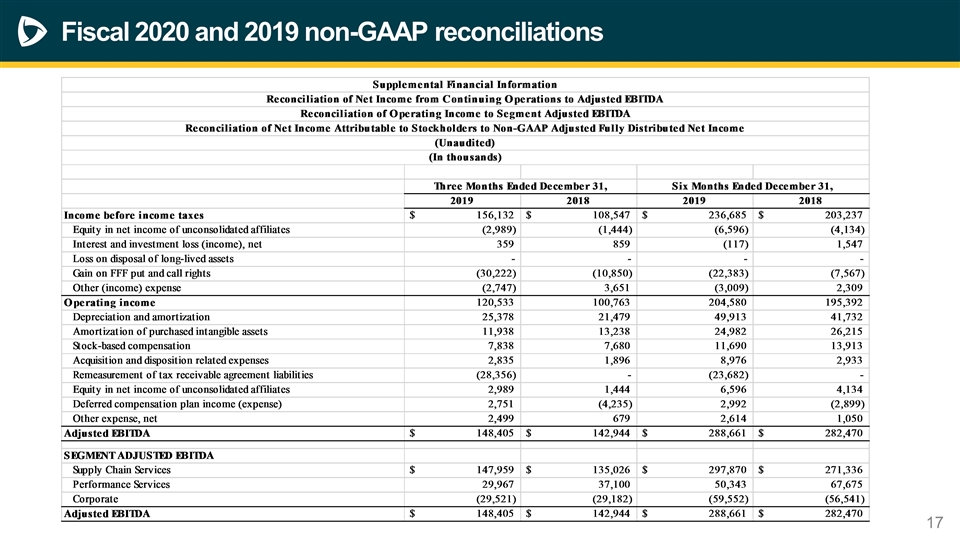
Fiscal 2020 and 2019 non-GAAP reconciliations
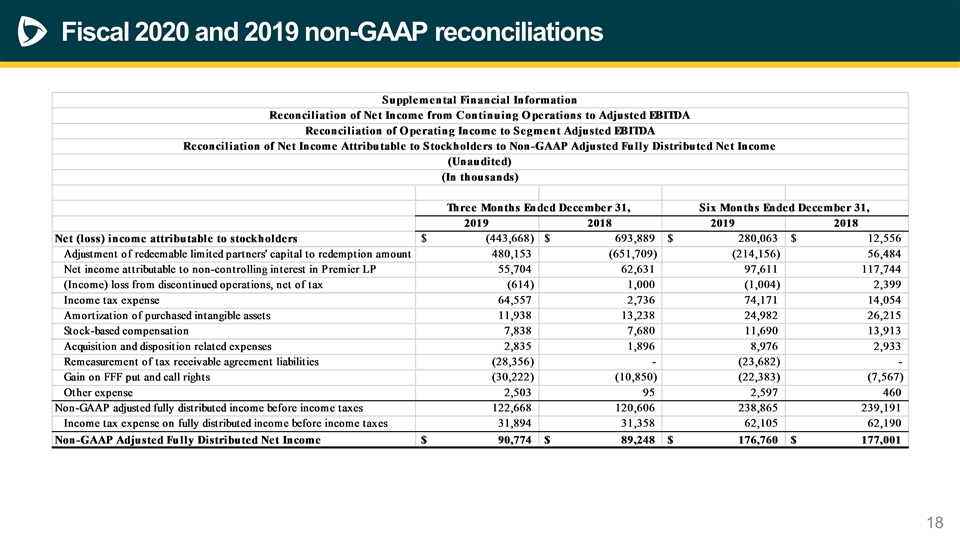
Fiscal 2020 and 2019 non-GAAP reconciliations
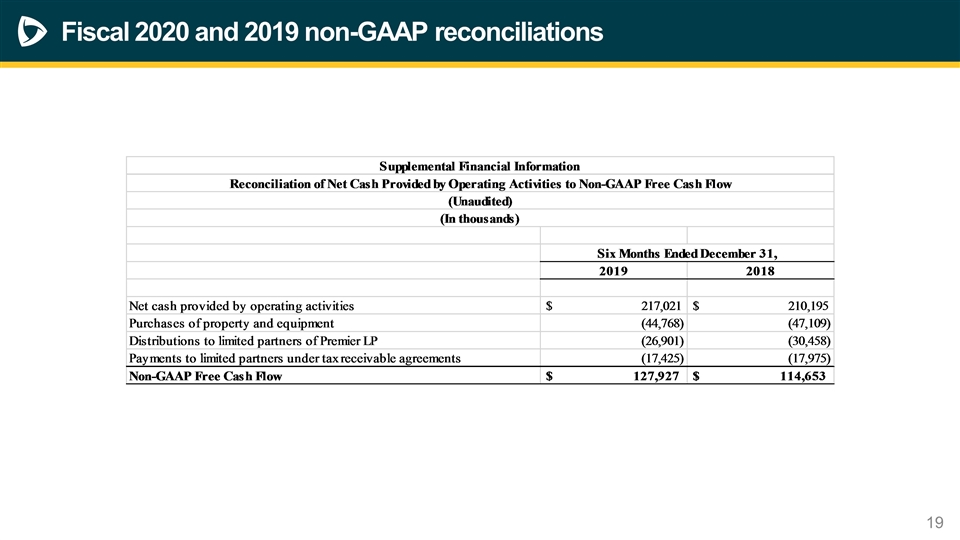
Fiscal 2020 and 2019 non-GAAP reconciliations
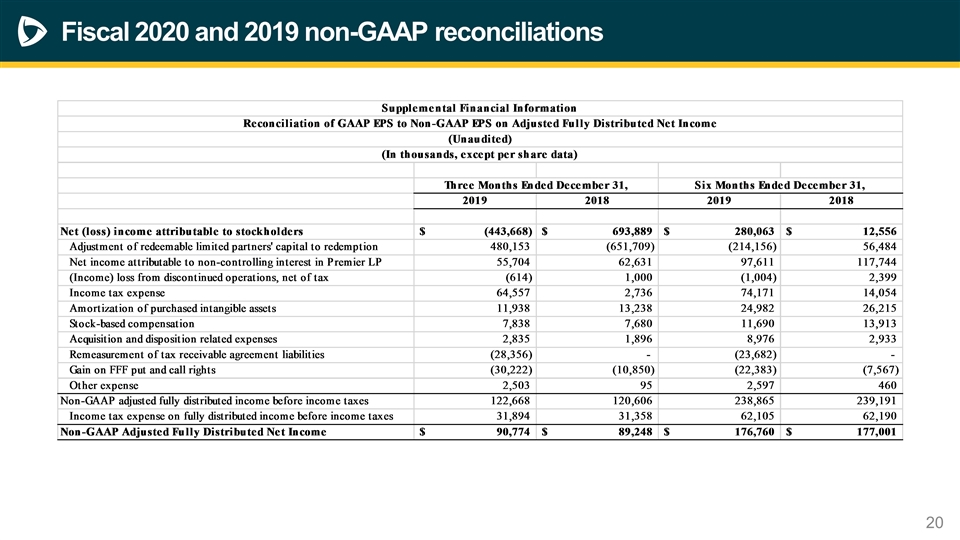
Fiscal 2020 and 2019 non-GAAP reconciliations
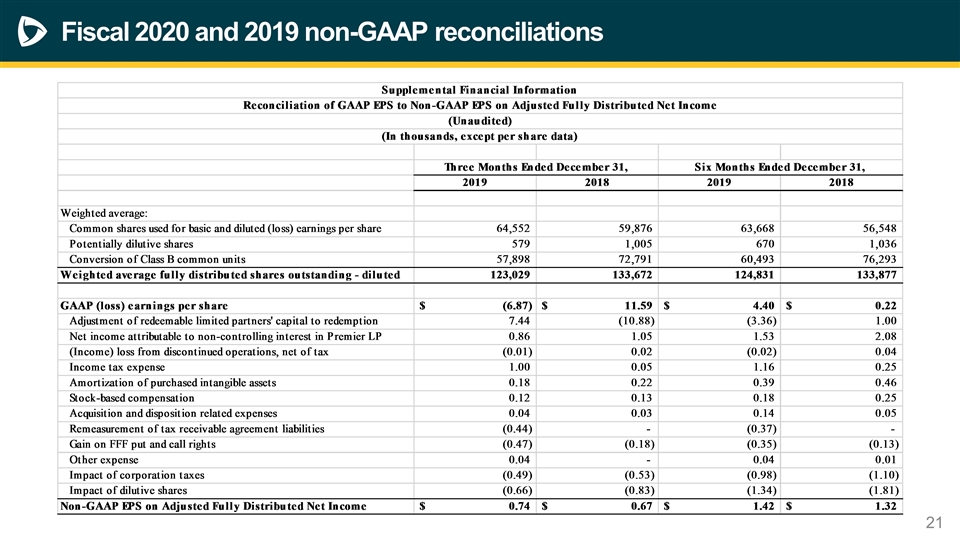
Fiscal 2020 and 2019 non-GAAP reconciliations
