Attached files
| file | filename |
|---|---|
| EX-32.1 - EX-32.1 - MEI Pharma, Inc. | d879582dex321.htm |
| EX-31.2 - EX-31.2 - MEI Pharma, Inc. | d879582dex312.htm |
| EX-31.1 - EX-31.1 - MEI Pharma, Inc. | d879582dex311.htm |
UNITED STATES
SECURITIES AND EXCHANGE COMMISSION
Washington, D.C. 20549
FORM 10-Q
| ☒ | QUARTERLY REPORT PURSUANT TO SECTION 13 OR 15(d) OF THE SECURITIES EXCHANGE ACT OF 1934 |
For the quarterly period ended December 31, 2019
OR
| ☐ | TRANSITION REPORT PURSUANT TO SECTION 13 OR 15(d) OF THE SECURITIES EXCHANGE ACT OF 1934 |
For the transition period from to
Commission File Number: 000-50484
MEI Pharma, Inc.
(Exact name of registrant as specified in its charter)
| DELAWARE | 51-0407811 | |
| (State or other jurisdiction of incorporation or organization) |
(I.R.S. Employer Identification No.) |
3611 Valley Centre Drive, San Diego, CA 92130
(Address of principal executive offices) (Zip Code)
(858) 369-7100
(Registrant’s telephone number, including area code)
Securities registered pursuant to Section 12(b) of the Act:
| Title of each class |
Trading Symbol |
Name of each exchange on which registered | ||
| Common Stock, $0.00000002 par value | MEIP | The NASDAQ Stock Market LLC |
Indicate by check mark whether the registrant (1) has filed all reports required to be filed by Section 13 or 15(d) of the Securities Exchange Act of 1934 during the preceding 12 months (or for such shorter period that the registrant was required to file such reports), and (2) has been subject to such filing requirements for the past 90 days. Yes ☒ No ☐
Indicate by check mark whether the registrant has submitted electronically every Interactive Data File required to be submitted pursuant to Rule 405 of Regulation S-T (§232.405 of this chapter) during the preceding 12 months (or for such shorter period that the registrant was required to submit such files). Yes ☒ No ☐
Indicate by check mark whether the registrant is a large accelerated filer, an accelerated filer, a non-accelerated filer, a smaller reporting company, or an emerging growth company. See definitions of “large accelerated filer,” “accelerated filer,” “smaller reporting company,” and “emerging growth company” in Rule 12b-2 of the Exchange Act.
| Large accelerated filer | ☐ | Non-accelerated filer | ☐ | |||
| Accelerated filer | ☒ | Smaller reporting company | ☒ | |||
| Emerging growth company | ☐ | |||||
If an emerging growth company, indicate by checkmark if the registrant has elected not to use the extended transition period for complying with any new or revised financial accounting standards provided pursuant to Section 13(a) of the Exchange Act. ☐
Indicate by check mark whether the registrant is a shell company (as defined in Rule 12b-2 of the Exchange Act). Yes ☐ No ☒
As of February 3, 2020, the number of shares outstanding of the issuer’s common stock, $0.00000002 par value, was 105,998,677.
MEI PHARMA, INC.
Table of Contents
2
Item 1: Condensed Financial Statements – Unaudited
MEI PHARMA, INC.
(In thousands, except per share amounts)
| December 31, 2019 |
June 30, 2019 |
|||||||
| (unaudited) | ||||||||
| ASSETS |
| |||||||
| Current assets: |
||||||||
| Cash and cash equivalents |
$ | 8,638 | $ | 9,590 | ||||
| Short-term investments |
95,243 | 64,899 | ||||||
|
|
|
|
|
|||||
| Total cash, cash equivalents and short-term investments |
103,881 | 74,489 | ||||||
| Common stock proceeds receivable (Note 10) |
— | 5,274 | ||||||
| Prepaid expenses and other current assets |
2,564 | 2,435 | ||||||
|
|
|
|
|
|||||
| Total current assets |
106,445 | 82,198 | ||||||
| Intangible assets, net |
244 | 261 | ||||||
| Property and equipment, net |
416 | 204 | ||||||
|
|
|
|
|
|||||
| Total assets |
$ | 107,105 | $ | 82,663 | ||||
|
|
|
|
|
|||||
| LIABILITIES AND STOCKHOLDERS’ EQUITY |
| |||||||
| Current liabilities: |
||||||||
| Accounts payable |
$ | 3,038 | $ | 4,787 | ||||
| Accrued liabilities |
3,835 | 4,559 | ||||||
| Deferred revenue |
3,056 | 4,955 | ||||||
|
|
|
|
|
|||||
| Total current liabilities |
9,929 | 14,301 | ||||||
| Deferred revenue, long-term |
3,108 | 2,819 | ||||||
| Warrant liability |
16,783 | 17,613 | ||||||
|
|
|
|
|
|||||
| Total liabilities |
29,820 | 34,733 | ||||||
|
|
|
|
|
|||||
| Commitments and contingencies (Note 7) |
||||||||
| Stockholders’ equity: |
||||||||
| Preferred stock, $0.01 par value; 100 shares authorized; none outstanding |
— | — | ||||||
| Common stock, $0.00000002 par value; 226,000 shares authorized; 105,999 and 73,545 shares issued and outstanding at December 31, 2019 and June 30, 2019, respectively |
— | — | ||||||
| Additional paid-in capital |
331,714 | 279,148 | ||||||
| Accumulated deficit |
(254,429 | ) | (231,218 | ) | ||||
|
|
|
|
|
|||||
| Total stockholders’ equity |
77,285 | 47,930 | ||||||
|
|
|
|
|
|||||
| Total liabilities and stockholders’ equity |
$ | 107,105 | $ | 82,663 | ||||
|
|
|
|
|
|||||
See accompanying notes to condensed financial statements.
3
MEI PHARMA, INC.
CONDENSED STATEMENTS OF OPERATIONS
(In thousands, except per share amounts)
(Unaudited)
| Three Months Ended December 31, |
Six Months Ended December 31, |
|||||||||||||||
| 2019 | 2018 | 2019 | 2018 | |||||||||||||
| Revenue |
$ | 1,008 | $ | 2,048 | $ | 2,165 | $ | 2,536 | ||||||||
|
|
|
|
|
|
|
|
|
|||||||||
| Operating expenses: |
||||||||||||||||
| Cost of revenue |
641 | 1,009 | 1,329 | 1,998 | ||||||||||||
| Research and development |
8,281 | 9,066 | 17,243 | 15,197 | ||||||||||||
| General and administrative |
4,195 | 3,821 | 8,325 | 7,222 | ||||||||||||
|
|
|
|
|
|
|
|
|
|||||||||
| Total operating expenses |
13,117 | 13,896 | 26,897 | 24,417 | ||||||||||||
|
|
|
|
|
|
|
|
|
|||||||||
| Loss from operations |
(12,109 | ) | (11,848 | ) | (24,732 | ) | (21,881 | ) | ||||||||
| Other income (expense): |
||||||||||||||||
| Change in fair value of warrant liability |
(8,439 | ) | 23,437 | 830 | 18,475 | |||||||||||
| Interest and dividend income |
318 | 436 | 692 | 890 | ||||||||||||
| Other income (expense) |
13 | — | (1 | ) | (1 | ) | ||||||||||
|
|
|
|
|
|
|
|
|
|||||||||
| Net (loss) income |
$ | (20,217 | ) | $ | 12,025 | $ | (23,211 | ) | $ | (2,517 | ) | |||||
|
|
|
|
|
|
|
|
|
|||||||||
| Net (loss) income: |
||||||||||||||||
| Basic |
$ | (20,217 | ) | $ | 12,025 | $ | (23,211 | ) | $ | (2,517 | ) | |||||
|
|
|
|
|
|
|
|
|
|||||||||
| Diluted |
$ | (20,217 | ) | $ | (11,412 | ) | $ | (23,211 | ) | $ | (25,954 | ) | ||||
|
|
|
|
|
|
|
|
|
|||||||||
| Net (loss) income per share: |
||||||||||||||||
| Basic |
$ | (0.26 | ) | $ | 0.17 | $ | (0.30 | ) | $ | (0.04 | ) | |||||
|
|
|
|
|
|
|
|
|
|||||||||
| Diluted |
$ | (0.26 | ) | $ | (0.15 | ) | $ | (0.30 | ) | $ | (0.36 | ) | ||||
|
|
|
|
|
|
|
|
|
|||||||||
| Shares used in computing net (loss) income per share: |
||||||||||||||||
| Basic |
78,577 | 71,124 | 76,103 | 71,005 | ||||||||||||
|
|
|
|
|
|
|
|
|
|||||||||
| Diluted |
78,577 | 73,951 | 76,103 | 72,418 | ||||||||||||
|
|
|
|
|
|
|
|
|
|||||||||
See accompanying notes to condensed financial statements.
4
MEI PHARMA, INC.
CONDENSED STATEMENTS OF STOCKHOLDERS’ EQUITY
(In thousands)
(Unaudited)
| Common Shares |
Additional Paid-In Capital |
Accumulated Deficit |
Total Stockholders’ Equity |
|||||||||||||
| Balance at June 30, 2019 |
73,545 | $ | 279,148 | $ | (231,218 | ) | $ | 47,930 | ||||||||
| Net loss |
— | — | (2,994 | ) | (2,994 | ) | ||||||||||
| Issuance of common stock |
64 | 159 | — | 159 | ||||||||||||
| Exercise of stock options |
46 | 72 | — | 72 | ||||||||||||
| Share-based compensation expense |
— | 2,113 | — | 2,113 | ||||||||||||
|
|
|
|
|
|
|
|
|
|||||||||
| Balance at September 30, 2019 |
73,655 | 281,492 | (234,212 | ) | 47,280 | |||||||||||
| Net loss |
— | — | (20,217 | ) | (20,217 | ) | ||||||||||
| Issuance of common stock |
32,344 | 48,451 | — | 48,451 | ||||||||||||
| Share-based compensation expense |
— | 1,771 | — | 1,771 | ||||||||||||
|
|
|
|
|
|
|
|
|
|||||||||
| Balance at December 31, 2019 |
105,999 | $ | 331,714 | $ | (254,429 | ) | $ | 77,285 | ||||||||
|
|
|
|
|
|
|
|
|
|||||||||
| Common Shares |
Additional Paid-In Capital |
Accumulated Deficit |
Total Stockholders’ Equity |
|||||||||||||
| Balance at June 30, 2018 |
70,406 | $ | 264,858 | $ | (214,399 | ) | $ | 50,459 | ||||||||
| Net loss |
— | — | (14,542 | ) | (14,542 | ) | ||||||||||
| Issuance of common stock for vested restricted stock units |
246 | (324 | ) | — | (324 | ) | ||||||||||
| Exercise of warrants |
440 | 2,186 | — | 2,186 | ||||||||||||
| Exercise of stock options |
23 | 43 | — | 43 | ||||||||||||
| Share-based compensation expense |
— | 1,937 | — | 1,937 | ||||||||||||
|
|
|
|
|
|
|
|
|
|||||||||
| Balance at September 30, 2018 |
71,115 | 268,700 | (228,941 | ) | 39,759 | |||||||||||
| Net income |
— | — | 12,025 | 12,025 | ||||||||||||
| Exercise of stock options |
16 | 24 | — | 24 | ||||||||||||
| Share-based compensation expense |
— | 1,663 | — | 1,663 | ||||||||||||
|
|
|
|
|
|
|
|
|
|||||||||
| Balance at December 31, 2018 |
71,131 | $ | 270,387 | $ | (216,916 | ) | $ | 53,471 | ||||||||
|
|
|
|
|
|
|
|
|
|||||||||
See accompanying notes to condensed financial statements.
5
MEI PHARMA, INC.
CONDENSED STATEMENTS OF CASH FLOWS
(In thousands)
(Unaudited)
| Six Months Ended December 31, |
||||||||
| 2019 | 2018 | |||||||
| Cash flows from operating activities: |
||||||||
| Net loss |
$ | (23,211 | ) | $ | (2,517 | ) | ||
| Adjustments to reconcile net loss to net cash used in operating activities: |
||||||||
| Change in fair value of warrant liability |
(830 | ) | (18,475 | ) | ||||
| Share-based compensation |
3,884 | 3,600 | ||||||
| Depreciation and amortization |
60 | 28 | ||||||
| Changes in operating assets and liabilities: |
||||||||
| Prepaid expenses and other current assets |
(129 | ) | (833 | ) | ||||
| Accounts payable |
(1,749 | ) | (1,485 | ) | ||||
| Accrued liabilities |
(974 | ) | 1,312 | |||||
| Deferred revenue |
(1,610 | ) | 8,353 | |||||
|
|
|
|
|
|||||
| Net cash used in operating activities |
(24,559 | ) | (10,017 | ) | ||||
|
|
|
|
|
|||||
| Cash flows from investing activities: |
||||||||
| Purchases of property and equipment |
(5 | ) | (172 | ) | ||||
| Purchases of short-term investments |
(70,199 | ) | (19,770 | ) | ||||
| Proceeds from maturity of short-term investments |
39,855 | 24,537 | ||||||
|
|
|
|
|
|||||
| Net cash (used in) provided by investing activities |
(30,349 | ) | 4,595 | |||||
|
|
|
|
|
|||||
| Cash flows from financing activities: |
||||||||
| Proceeds from exercise of stock options |
72 | 67 | ||||||
| Proceeds from exercise of warrants |
— | 1,118 | ||||||
| Proceeds from issuance of common stock |
48,610 | — | ||||||
| Collection of common stock proceeds receivable |
5,274 | — | ||||||
| Payment of RSU tax withholdings in exchange for common shares surrendered by RSU holders |
— | (324 | ) | |||||
|
|
|
|
|
|||||
| Net cash provided by financing activities |
53,956 | 861 | ||||||
|
|
|
|
|
|||||
| Net decrease in cash and cash equivalents |
(952 | ) | (4,561 | ) | ||||
| Cash and cash equivalents at beginning of the period |
9,590 | 13,309 | ||||||
|
|
|
|
|
|||||
| Cash and cash equivalents at end of the period |
$ | 8,638 | $ | 8,748 | ||||
|
|
|
|
|
|||||
| Supplemental cash flow information: |
||||||||
| Income taxes paid |
$ | (1 | ) | $ | (1 | ) | ||
|
|
|
|
|
|||||
| Non-cash financing activities: |
||||||||
| Change in fair value of warrants exercised |
$ | — | $ | 1,068 | ||||
See accompanying notes to condensed financial statements.
6
MEI PHARMA, INC.
NOTES TO CONDENSED FINANCIAL STATEMENTS
(Unaudited)
Note 1. The Company and Summary of Significant Accounting Policies
We are a late-stage pharmaceutical company focused on leveraging our extensive development and oncology expertise to identify and advance new therapies intended to meaningfully improve the treatment of cancer. Our portfolio of drug candidates contains four clinical-stage candidates, including one candidate in an ongoing Phase 3 global registration trial and another candidate in an ongoing Phase 2 clinical trial that we intend to submit to the U.S. Food and Drug Administration (“FDA”) to support accelerated approval of a marketing application. Our common stock is listed on the NASDAQ Capital Market under the symbol “MEIP”.
Clinical Development Programs
Our approach to building our pipeline is to license promising cancer agents and build value in programs through development, commercialization and strategic partnerships, as appropriate. Our drug candidate pipeline includes:
| • | ME-401, an oral phosphatidylinositol 3-kinase delta (“PI3Kd”) inhibitor; |
| • | Voruciclib, an oral cyclin-dependent kinase (“CDK”) inhibitor; |
| • | ME-344, a mitochondrial inhibitor targeting the oxidative phosphorylation (“OXPHOS”) complex; and |
| • | Pracinostat, an oral histone deacetylase (“HDAC”) inhibitor. |
Liquidity
We have accumulated losses of $254.4 million since inception and expect to incur operating losses and generate negative cash flows from operations for the foreseeable future. As of December 31, 2019, we had $103.9 million in cash and cash equivalents and short-term investments, which we believe will be sufficient to meet obligations and fund our liquidity and capital expenditure requirements for at least the next 12 months from the issuance of these financial statements. Our current business operations are focused on continuing the clinical development of our drug candidates. Changes to our research and development plans or other changes affecting our operating expenses may affect actual future use of existing cash resources. Our research and development expenses are expected to increase in the foreseeable future. We cannot determine with certainty costs associated with ongoing and future clinical trials or the regulatory approval process. The duration, costs and timing associated with the development of our product candidates will depend on a variety of factors, including uncertainties associated with the results of our clinical trials.
To date, we have obtained cash and funded our operations primarily through equity financings and license agreements. In order to continue the development of our drug candidates, we expect to pursue one or more capital transactions, whether through the sale of equity securities, debt financing, license agreements or entry into strategic partnerships. There can be no assurance that we will be able to continue to raise additional capital in the future.
Basis of Presentation
The accompanying unaudited financial statements have been prepared in accordance with accounting principles generally accepted in the United States (“U.S. GAAP”) for interim financial information and in accordance with the instructions to Form 10-Q and Article 10 of Regulation S-X. Accordingly, the accompanying financial statements do not include all of the information and notes required by U.S. GAAP for complete financial statements. In the opinion of management, the accompanying financial statements reflect all adjustments (consisting of normal recurring adjustments) that are necessary for a fair statement of the financial position, results of operations and cash flows for the periods presented. We have evaluated subsequent events through the date the financial statements were issued.
The accompanying unaudited financial statements should be read in conjunction with the audited financial statements and notes thereto as of and for the fiscal year ended June 30, 2019, included in our Annual Report on Form 10-K (“2019 Annual Report”) filed with the Securities and Exchange Commission (“SEC”) on August 28, 2019. Interim results are not necessarily indicative of results for a full year.
Use of Estimates
The preparation of financial statements in conformity with U.S. GAAP requires management to make estimates and assumptions that affect the amounts reported in the financial statements and disclosures made in the accompanying notes to the financial statements. We use estimates that affect the reported amounts (including assets, liabilities, revenues and expenses) and related disclosures. Actual results could materially differ from those estimates.
7
Revenue Recognition
We recognize revenue when control of the promised goods or services is transferred to our customers, in an amount that reflects the consideration we expect to be entitled to in exchange for those goods or services. To determine revenue recognition, we perform the following five steps: (i) identify the contract(s) with a customer; (ii) identify the performance obligations in the contract; (iii) determine the transaction price; (iv) allocate the transaction price to the performance obligations in the contract; and (v) recognize revenue when (or as) the entity satisfies a performance obligation. See Note 5 for further discussion.
Cost of revenue primarily includes external costs paid to third-party contractors to perform research, conduct clinical trials and develop and manufacture drug materials, and internal compensation and related personnel expenses to support our research and development performance obligations.
Research and Development Costs
Research and development costs are expensed as incurred and include costs paid to third-party contractors to perform research, conduct clinical trials and develop and manufacture drug materials. Clinical trial costs, including costs associated with third-party contractors, are a significant component of research and development expenses. We expense research and development costs based on work performed. In determining the amount to expense, management relies on estimates of total costs based on contract components completed, the enrollment of subjects, the completion of trials, and other events. Costs incurred related to the purchase or licensing of in-process research and development for early-stage products or products that are not commercially viable and ready for use, or have no alternative future use, are charged to expense in the period incurred.
Share-Based Compensation
Share-based compensation expense for employees and directors is recognized in the Condensed Statement of Operations based on estimated amounts, including the grant date fair value and the expected service period. For stock options, we estimate the grant date fair value using a Black-Scholes valuation model, which requires the use of multiple subjective inputs including estimated future volatility, expected forfeitures and the expected term of the awards. We estimate the expected future volatility based on the stock’s historical price volatility. The stock’s future volatility may differ from the estimated volatility at the grant date. For restricted stock unit (“RSU”) equity awards, we estimate the grant date fair value using our closing stock price on the date of grant. We recognize the effect of forfeitures in compensation expense when the forfeitures occur. The estimated forfeiture rates may differ from actual forfeiture rates which would affect the amount of expense recognized during the period. We recognize the value of the awards over the awards’ requisite service or performance periods. The requisite service period is generally the time over which our share-based awards vest.
Income Taxes
Our income tax expense consists of current and deferred income tax expense or benefit. Current income tax expense or benefit is the amount of income taxes expected to be payable or refundable for the current year. A deferred income tax asset or liability is recognized for the future tax consequences attributable to tax credits and loss carryforwards and to differences between the financial statement carrying amounts of existing assets and liabilities and their respective tax bases. Deferred tax assets are reduced by a valuation allowance when, in the opinion of management, it is more likely than not that some portion or all of the deferred tax assets will not be realized. As of December 31, 2019 and June 30, 2019, we have established a valuation allowance to fully reserve our net deferred tax assets. Changes in our ownership may limit the amount of net operating loss carry-forwards that can be utilized in the future to offset taxable income.
The Financial Accounting Standards Board (“FASB”) Topic on Income Taxes prescribes a recognition threshold and measurement attribute criteria for the financial statement recognition and measurement of tax positions taken or expected to be taken in a tax return. For those benefits to be recognized, a tax position must be more-likely-than-not to be sustained upon examination by taxing authorities. An uncertain income tax position will not be recognized if it has less than a 50% likelihood of being sustained. There were no unrecognized tax benefits as of December 31, 2019 or June 30, 2019.
There have been no material changes in our unrecognized tax benefits since June 30, 2019, and, as such, the disclosures included in our 2019 Annual Report continue to be relevant for the six month period ended December 31, 2019.
Recent Accounting Pronouncements
Adopted Accounting Standards
In February 2016, the FASB issued ASU No. 2016-02, Leases. The new standard establishes a right-of-use (“ROU”) model that requires a lessee to record a ROU asset and a lease liability on the balance sheet for all leases with terms longer than 12 months. Leases are classified as either finance or operating, with classification affecting the pattern of expense recognition in the income statement. The new standard is effective for fiscal years beginning after July 1, 2019, including interim periods within those fiscal years. See Note 8 for further discussion.
8
Note 2. Fair Value Measurements
Fair value is defined as the exchange price that would be received for an asset or paid to transfer a liability (an exit price) in the principal or most advantageous market for the asset or liability in an orderly transaction between market participants on the measurement date. Valuation techniques used to measure fair value must maximize the use of observable inputs and minimize the use of unobservable inputs. The fair value hierarchy based on three levels of inputs, of which the first two are considered observable and the last unobservable, that may be used to measure fair value is as follows:
| • | Level 1 | — | Observable inputs such as quoted prices in active markets for identical assets or liabilities. | |||
| • | Level 2 | — | Inputs other than Level 1 that are observable, either directly or indirectly, such as quoted prices for similar assets or liabilities; quoted prices in markets that are not active; or other inputs that are observable or can be corroborated by observable market data for substantially the full term of the assets or liabilities. | |||
| • | Level 3 | — | Unobservable inputs that are supported by little or no market activity and that are significant to the fair value of the assets or liabilities. | |||
We measure the following financial instruments at fair value on a recurring basis. The fair values of these financial instruments were as follows (in thousands):
| December 31, 2019 | June 30, 2019 | |||||||||||||||||||||||
| Level 1 | Level 2 | Level 3 | Level 1 | Level 2 | Level 3 | |||||||||||||||||||
| Warrant liability |
$ | — | $ | — | $ | (16,783 | ) | $ | — | $ | — | $ | (17,613 | ) | ||||||||||
|
|
|
|
|
|
|
|
|
|
|
|
|
|||||||||||||
| Total |
$ | — | $ | — | $ | (16,783 | ) | $ | — | $ | — | $ | (17,613 | ) | ||||||||||
|
|
|
|
|
|
|
|
|
|
|
|
|
|||||||||||||
The carrying amounts of financial instruments such as cash equivalents, short-term investments and accounts payable approximate the related fair values due to the short-term maturities of these instruments. We invest our excess cash in financial instruments which are readily convertible into cash, such as money market funds and U.S. government securities. Cash equivalents, where applicable, and short-term investments are classified as Level 1 as defined by the fair value hierarchy.
In May 2018, we issued warrants in connection with our private placement of shares of common stock. Pursuant to the terms of the warrants, we could be required to settle the warrants in cash in the event of an acquisition of the Company and, as a result, the warrants are required to be measured at fair value and reported as a liability in the Condensed Balance Sheet. We recorded the fair value of the warrants upon issuance using the Black-Scholes valuation model and are required to revalue the warrants at each reporting date with any changes in fair value recorded on our Condensed Statement of Operations. The valuation of the warrants is considered under Level 3 of the fair value hierarchy due to the need to use assumptions in the valuation that are both significant to the fair value measurement and unobservable. Inputs used to determine estimated fair value of the warrant liabilities include the estimated fair value of the underlying stock at the valuation date, the estimated term of the warrants, risk-free interest rates, expected dividends and the expected volatility of the underlying stock. The significant unobservable inputs used in the fair value measurement of the warrant liabilities were the volatility rate and the estimated term of the warrants. Generally, increases (decreases) in the fair value of the underlying stock and estimated term would result in a directionally similar impact to the fair value measurement. The change in the fair value of the Level 3 warrant liability is reflected in the Condensed Statement of Operations for the three and six months ended December 31, 2019.
To calculate the fair value of the warrant liability, the following assumptions were used:
| December 31, 2019 |
June 30, 2019 |
|||||||
| Risk-free interest rate |
1.6 | % | 1.7 | % | ||||
| Expected life (years) |
3.4 | 3.8 | ||||||
| Expected volatility |
59.1 | % | 56.8 | % | ||||
| Dividend yield |
0.0 | % | 0.0 | % | ||||
| Black-Scholes Fair Value |
$ | 1.04 | $ | 1.10 | ||||
9
The following table sets forth a summary of changes in the estimated fair value of our Level 3 warrant liability for the six months ended December 31, 2019 and 2018 (in thousands):
| Fair Value of Warrants Using Significant Unobservable Inputs (Level 3) |
||||||||
| 2019 | 2018 | |||||||
| Balance at July 1, |
$ | 17,613 | $ | 46,313 | ||||
| Reclassification of warrant liability to equity upon exercise of warrants |
— | (1,068 | ) | |||||
| Change in estimated fair value of liability classified warrants |
(830 | ) | (18,475 | ) | ||||
|
|
|
|
|
|||||
| Balance at December 31, |
$ | 16,783 | $ | 26,770 | ||||
|
|
|
|
|
|||||
Note 3. License Agreements
KKC License Agreement
In October 2018, we entered into a license agreement with Kyowa Kirin Company (formerly “Kyowa Hakko Kirin Co., Ltd.”) (“KKC”), a Japanese life sciences company, for ME-401 (the “KKC License Agreement”). Under the terms of the KKC License Agreement, KKC was granted the exclusive right to develop and commercialize ME-401 in Japan. We also granted KKC the right to purchase supply of ME-401 for commercial requirements at cost plus a pre-negotiated percentage, as well as manufacturing rights in Japan. In return, we received an upfront payment of $10.0 million and are also eligible to receive up to $87.5 million in additional development and commercialization milestones, as well as royalties on net sales of ME-401 in Japan extending into the mid-teens. The KKC License Agreement expires at the end of the royalty term, that is, upon the last to occur of (a) expiration of our patents in Japan, (b) expiration of regulatory exclusivity for ME-401 in Japan or (c) 10 years from the first commercial sale of ME-401 in Japan.
We assessed the KKC License Agreement in accordance with ASC 606 and determined that our performance obligations comprise the license, research and development obligations, and our obligation to provide clinical trial materials to KKC. We determined that the transaction price amounts to the upfront payment of $10.0 million. Future milestone payments are fully contingent as the risk of significant revenue reversal will only be resolved depending on future research and development and/or regulatory approval outcomes. We will re-evaluate the likelihood of achieving future milestones at the end of each reporting period.
We determined that control of the license was transferred to KKC during the year ended June 30, 2019. Revenue allocated to the research and development obligations is recognized based on the proportional performance of these research and development activities, which we expect to recognize through fiscal year 2022. Revenue allocated to providing clinical trial materials is recognized upon delivery.
Helsinn License Agreement
In August 2016, we entered into an exclusive worldwide license, development, manufacturing and commercialization agreement with Helsinn Healthcare SA, a Swiss pharmaceutical corporation (“Helsinn”) for pracinostat in acute myeloid leukemia (“AML”), myelodysplastic syndrome (“MDS”) and other potential indications (the “Helsinn License Agreement”). Under the terms of the agreement, Helsinn was granted a worldwide exclusive license to develop, manufacture and commercialize pracinostat, and is primarily responsible for funding its global development and commercialization. As compensation for such grant of rights, we received payments of $20.0 million. In addition, we are eligible to receive up to $444 million in potential regulatory and sales-based milestones, along with royalty payments on the net sales of pracinostat, which, in the U.S., are tiered and begin in the mid-teens.
We determined that the agreement contains multiple performance obligations for purposes of revenue recognition. Revenue related to the research and development elements of the arrangement is recognized based on the extent of progress toward completion of each performance obligation. Revenue is recognized on a gross basis as we are the primary obligor and have discretion in supplier selection. During the six months ended December 31, 2019, our only remaining performance obligation under the agreement is the conduct of a Phase 2 dose-optimization study of pracinostat in combination with azacitidine in patients with high and very high risk MDS who are previously untreated with hypomethylating agents (the “POC study”), for which Helsinn has agreed to share third-party expenses.
Presage License Agreement
In September 2017, we entered into a license agreement with Presage Biosciences, Inc. (“Presage”). Under the terms of such license agreement (the “Presage License Agreement”), Presage granted to us exclusive worldwide rights to develop, manufacture and commercialize voruciclib, a clinical-stage, oral and selective CDK inhibitor, and related compounds. In exchange, we paid $2.9 million. With respect to the first indication, an incremental $2.0 million payment, due upon dosing of the first subject in the first registration trial, will be owed to Presage, for total payments of $4.9 million prior to receipt of marketing approval of the first indication in the U.S., E.U. or Japan. Additional potential payments of up to $179 million will be due upon the achievement of certain
10
development, regulatory and commercial milestones. We will also pay mid-single-digit tiered royalties on the net sales of any product successfully developed. As an alternative to milestone and royalty payments related to countries in which we sublicense product rights, we will pay to Presage a tiered percent (which decreases as product development progresses) of amounts received from such sublicensees.
CyDex License Agreement
We are party to a license agreement with CyDex Pharmaceuticals, Inc. (“CyDex”). Under the license agreement, CyDex granted to us an exclusive, nontransferable license to intellectual property rights relating to Captisol® for use with our isoflavone-based drug compounds (currently ME-344). We agreed to pay to CyDex a non-refundable license issuance fee, future milestone payments, and royalties at a low, single-digit percentage rate on future sales of our approved drugs utilizing Captisol. Contemporaneously with the license agreement, CyDex entered into a commercial supply agreement with us, pursuant to which we agreed to purchase 100% of our requirements for Captisol from CyDex. We may terminate both the license agreement and the supply agreement at any time upon 90 days’ prior written notice.
Note 4. BeiGene Collaboration
In October 2018, we entered into a clinical collaboration with BeiGene, Ltd. (“BeiGene”) to evaluate the safety and efficacy of ME-401 in combination with BeiGene’s zanubrutinib (marketed as Brukinsa®), an inhibitor of Bruton’s tyrosine kinase (“BTK”), for the treatment of patients with B-cell malignancies. Under the terms of the clinical collaboration agreement, we amended our ongoing Phase 1b trial to include evaluation of ME-401 in combination with zanubrutinib in patients with B-cell malignancies. Study costs are being shared equally by the parties, and we agreed to supply ME-401 and BeiGene agreed to supply zanubrutinib. We record the costs reimbursed by BeiGene as a reduction of our research and development expenses. We retained full commercial rights for ME-401 and BeiGene retained full commercial rights for zanubrutinib.
Note 5. Revenue Recognition
Payments received under commercial arrangements, such as licensing technology rights, may include non-refundable fees at the inception of the arrangements, milestone payments for specific achievements designated in the agreements, and royalties on the sale of products. At the inception of arrangements that include milestone payments, we use judgment to evaluate whether the milestones are probable of being achieved and we estimate the amount to include in the transaction price using the most likely method. If it is probable that a significant revenue reversal will not occur, the estimated amount is included in the transaction price. Milestone payments that are not within our or the licensee’s control, such as regulatory approvals, are not included in the transaction price until those approvals are received. At the end of each reporting period, we re-evaluate the probability of achievement of development milestones and any related constraint and, as necessary, we adjust our estimate of the overall transaction price. Any adjustments are recorded on a cumulative catch-up basis, which would affect revenues and earnings in the period of adjustment. To date, we have not recognized any material cumulative catch-up adjustments from changes in our estimate of the transaction price.
We develop estimates of the stand-alone selling price for each distinct performance obligation and allocate the overall transaction price to each accounting unit based on a relative stand-alone selling price approach. We develop assumptions that require judgment to determine the stand-alone selling price for license-related performance obligations, which may include forecasted revenues, development timelines, reimbursement rates for personnel costs, discount rates and probabilities of technical, regulatory and commercial success. We estimate stand-alone selling price for research and development performance obligations by forecasting the expected costs of satisfying a performance obligation plus an appropriate margin.
In the case of a license that is a distinct performance obligation, we recognize revenue from non-refundable, up-front fees at the point in time when the license is transferred to the licensee and the licensee can use and benefit from the license. For licenses that are bundled with other obligations, we use judgment to assess the nature of the combined performance obligation to determine whether the combined performance obligation is satisfied over time or at a point in time and, if over time, the appropriate method of measuring progress for purposes of recognizing revenue. If the performance obligation is satisfied over time, we evaluate the measure of progress each reporting period and, if necessary, adjust the measure of performance and related revenue recognition.
The selection of the method to measure progress towards completion requires judgment and is based on the nature of the products or services to be provided. Revenue is recorded proportionally as costs are incurred. We generally use the cost-to-cost measure of progress because it best depicts the transfer of control to the customer which occurs as we incur costs. Under the cost-to-cost measure of progress, the extent of progress towards completion is measured based on the ratio of costs incurred to date to the total estimated costs at completion of the performance obligation (an “input method” under ASC 606). We use judgment to estimate the total cost expected to complete the research and development performance obligations, which include subcontractors’ costs, labor, materials, other direct costs and an allocation of indirect costs. We evaluate these cost estimates and the progress each reporting period and, as necessary, we adjust the measure of progress and related revenue recognition. To date, we have not recognized any material cumulative catch-up adjustments from changes in our estimate of the measure of progress.
11
For arrangements that include sales-based or usage-based royalties, we recognize revenue at the later of (i) when the related sales occur or (ii) when the performance obligation to which some or all of the royalty has been allocated has been satisfied or partially satisfied. To date, we have not recognized any sales-based royalty revenue from license agreements.
We recognized revenue associated with the following license agreements (in thousands):
| Three Months Ended December 31, |
Six Months Ended December 31, |
|||||||||||||||
| 2019 | 2018 | 2019 | 2018 | |||||||||||||
| KKC License Agreement |
$ | 673 | $ | 1,361 | $ | 1,470 | $ | 1,361 | ||||||||
| Helsinn License Agreement |
335 | 687 | 695 | 1,175 | ||||||||||||
|
|
|
|
|
|
|
|
|
|||||||||
| $ | 1,008 | $ | 2,048 | $ | 2,165 | $ | 2,536 | |||||||||
|
|
|
|
|
|
|
|
|
|||||||||
| Timing of Revenue Recognition: |
||||||||||||||||
| License transferred at a point in time |
$ | — | $ | 879 | $ | — | $ | 879 | ||||||||
| Services performed over time |
1,008 | 1,169 | 2,165 | 1,657 | ||||||||||||
|
|
|
|
|
|
|
|
|
|||||||||
| $ | 1,008 | $ | 2,048 | $ | 2,165 | $ | 2,536 | |||||||||
|
|
|
|
|
|
|
|
|
|||||||||
Revenue for the three and six months ended December 31, 2019 and 2018 included revenue related to the KKC License Agreement (Note 3). Based on the characteristics of the KKC License Agreement, delivery of the license is a distinct performance obligation, and we recognized related revenue when the license was transferred to the licensee and the licensee could use and benefit from the license. The KKC License Agreement included other distinct performance obligations that will be satisfied over time, and accordingly we recognized revenue related to our progress toward satisfying those obligations during the three and six months ended December 31, 2019 and 2018.
Revenue for the three and six months ended December 31, 2019 and 2018 included revenue related to the Helsinn License Agreement (Note 3). The Helsinn License Agreement included distinct performance obligations that will be satisfied over time, and accordingly we recognized revenue related to our progress toward satisfying those obligations during the three and six months ended December 31, 2019 and 2018.
As of December 31, 2019, we had $6.2 million of deferred revenue associated with our remaining performance obligations under the KKC and Helsinn License Agreements. We expect to recognize approximately $3.1 million of deferred revenue in the next 12 months, and an additional $3.1 million thereafter.
Contract Balances
The following table presents changes in contract assets and contract liabilities during the six months ended December 31, 2019 (in thousands):
| As of June 30, 2019 |
Net Change | As of December 31, 2019 |
||||||||||
| Receivables |
$ | — | $ | 96 | $ | 96 | ||||||
| Contract Assets |
$ | 686 | $ | (205 | ) | $ | 481 | |||||
| Contract Liabilities |
$ | 7,774 | $ | (1,610 | ) | $ | 6,164 | |||||
The timing of revenue recognition, invoicing and cash collections results in billed accounts receivable and unbilled receivables (contract assets), which are classified as “prepaid expenses and other current assets” on our Condensed Balance Sheet, and deferred revenue (contract liabilities). We invoice our customers in accordance with agreed-upon contractual terms, typically at periodic intervals or upon achievement of contractual milestones. Invoicing may occur subsequent to revenue recognition, resulting in contract assets. We may receive advance payments from our customers before revenue is recognized, resulting in contract liabilities. The contract assets and liabilities reported on the Condensed Balance Sheet relate to the KKC and Helsinn License Agreements.
Note 6. Net (Loss) Income Per Share
Basic and diluted net (loss) income per share are computed using the weighted-average number of shares of common stock outstanding during the period, less any shares subject to repurchase or forfeiture. There were no shares of common stock subject to repurchase or forfeiture for the three and six months ended December 31, 2019 and 2018. Diluted net loss per share is computed based on the sum of the weighted average number of common shares and potentially dilutive common shares outstanding during the period.
12
The following table presents the calculation of net (loss) income used to calculate basic (loss) income and diluted loss per share (in thousands):
| Three Months Ended December 31, |
Six Months Ended December 31, |
|||||||||||||||
| 2019 | 2018 | 2019 | 2018 | |||||||||||||
| Net (loss) income - basic |
$ | (20,217 | ) | $ | 12,025 | $ | (23,211 | ) | $ | (2,517 | ) | |||||
| Change in fair value of warrant liability |
— | (23,437 | ) | — | (23,437 | ) | ||||||||||
|
|
|
|
|
|
|
|
|
|||||||||
| Net loss - diluted |
$ | (20,217 | ) | $ | (11,412 | ) | $ | (23,211 | ) | $ | (25,954 | ) | ||||
|
|
|
|
|
|
|
|
|
|||||||||
Our potentially dilutive shares, which include outstanding stock options, restricted stock units, and warrants, are considered to be common stock equivalents and are only included in the calculation of diluted net loss per share when their effect is dilutive.
The following table presents weighted-average potentially dilutive shares (in thousands) that have been excluded from the calculation of net (loss) income per share because of their anti-dilutive effect:
| Three Months Ended December 31, |
Six Months Ended December 31, |
|||||||||||||||
| 2019 | 2018 | 2019 | 2018 | |||||||||||||
| Stock options |
10,929 | 8,160 | 10,930 | 7,967 | ||||||||||||
| Restricted stock units |
— | — | — | 65 | ||||||||||||
| Warrants |
16,062 | — | 16,062 | 8,093 | ||||||||||||
|
|
|
|
|
|
|
|
|
|||||||||
| Total anti-dilutive shares |
26,991 | 8,160 | 26,992 | 16,125 | ||||||||||||
|
|
|
|
|
|
|
|
|
|||||||||
Note 7. Commitments and Contingencies
We have contracted with various consultants and third parties to assist us in pre-clinical research and development and clinical trials work for our leading drug compounds. The contracts are terminable at any time, but obligate us to reimburse the providers for any time or costs incurred through the date of termination. We also have employment agreements with certain of our current employees that provide for severance payments and accelerated vesting for share-based awards if their employment is terminated under specified circumstances.
Presage License Agreement
As discussed in Note 3, we are party to a license agreement with Presage under which we may be required to make future payments upon the achievement of certain development, regulatory and commercial milestones, as well as potential future royalties based upon net sales. As of December 31, 2019, we have not accrued any amounts for potential future payments.
S*Bio Purchase Agreement
We are party to a definitive asset purchase agreement with S*Bio, pursuant to which we acquired certain assets comprised of intellectual property and technology including rights to pracinostat. We agreed to make certain milestone payments to S*Bio based on the achievement of certain clinical, regulatory and net sales-based milestones, as well as to make certain contingent earnout payments to S*Bio. Milestone payments will be made to S*Bio up to an aggregate amount of $74.5 million if certain U.S., E.U. and Japanese regulatory approvals are obtained and if certain net sales thresholds are met in North America, the E.U. and Japan. As of December 31, 2019, we have not accrued any amounts for potential future payments.
CyDex License Agreement
As discussed in Note 3, we are party to a license agreement with CyDex under which we may be required to make future payments upon the achievement of certain milestones, as well as potential future royalties based upon net sales. Contemporaneously with the license agreement, CyDex entered into a commercial supply agreement with us, pursuant to which we agreed to purchase 100% of our requirements for Captisol from CyDex. As of December 31, 2019, we have not accrued any amounts for potential future payments.
Note 8. Leases
As of July 1, 2019, we adopted ASU No. 2016-02, Leases, using a modified retrospective basis method under which prior comparative periods are not restated.
The new standard establishes an ROU model that requires a lessee to record a ROU asset and a lease liability on the balance sheet for all leases with terms longer than 12 months. Leases will be classified as either finance or operating, with classification affecting the pattern of expense recognition in the income statement. In addition, the FASB issued ASU No. 2018-10, Codification Improvements to Topic 842, ASU No. 2018-11, Targeted Improvements, and ASU No. 2018-20, Narrow-Scope Improvements for
13
Lessors, to clarify and amend the guidance in ASU No. 2016-02. We elected the following as practical expedients from within these ASUs: 1) an entity need not reassess whether any expired or existing contracts are or contain leases, 2) an entity need not reassess the lease classification for any expired or existing leases, and 3) an entity need not reassess initial direct costs for any existing leases.
As of July 1, 2019, we had an operating lease for our office located in San Diego, California. We have leased approximately 20,800 square feet of office space under a lease which expires in May 2020.
As of July 1, 2019, our remaining minimum lease payments were approximately $0.7 million. Using a discount rate of 8% and a remaining lease term of ten months, we determined the ROU asset and corresponding lease liability at the date of adoption was $0.7 million. There was no cumulative adjustment to our beginning accumulated deficit balance. As of December 31, 2019, our remaining minimum lease payments were approximately $0.3 million, our lease liability was $0.3 million, classified as “accrued liabilities” on our Condensed Balance Sheet, and our right-of-use asset was $0.2 million, classified as “property and equipment, net” on our Condensed Balance Sheet.
In December 2019, we entered into a lease agreement for approximately 32,800 square feet of office space in San Diego, California. The contractual lease term begins on June 1, 2020 and will expire in January 2028. The average annual lease payments over the term of the lease will approximate $1.5 million, plus a pro rata share of certain building expenses. Our total contractual obligation over the term of the lease is approximately $11.5 million.
Note 9. Short-Term Investments
As of December 31, 2019 and June 30, 2019, our short-term investments consisted of $95.2 million and $64.9 million, respectively, in U.S. government securities. The short-term investments held as of December 31, 2019 and June 30, 2019 had maturity dates of less than one year, are considered to be “held to maturity” and are carried at amortized cost. As of December 31, 2019 and June 30, 2019, the gross holding gains and losses were immaterial.
Note 10. Stockholders’ Equity
Equity Transactions
Underwritten Registered Offering
In December 2019, we completed an underwritten registered offering of 32,343,750 shares of common stock at a price per share of $1.60. We received net cash proceeds of $48.5 million associated with the offering, after costs of $3.3 million.
At-The-Market Equity Offering
In November 2017, we entered into an At-The-Market Equity Offering Sales Agreement (the “ATM Sales Agreement”), pursuant to which we may sell an aggregate of up to $30.0 million of our common stock. During the year ended June 30, 2019, we sold 2,214,658 shares under the ATM Sales Agreement for $5.4 million, after deducting offering costs; $5.2 million of these proceeds were received on July 2, 2019 and were recorded as common stock proceeds receivable as of June 30, 2019. During the six months ended December 31, 2019, we sold 63,684 shares under the ATM Sales Agreement for $0.2 million, after deducting offering costs.
Shelf Registration Statement
We have a shelf registration statement that permits us to sell, from time to time, up to $150.0 million of common stock, preferred stock and warrants. Shares sold in the underwritten registered offering in December 2019 and shares sold under the ATM Sales Agreement were issued pursuant to the shelf registration statement. As of December 31, 2019, there is $92.5 million aggregate value of securities available under the shelf registration statement, including up to $24.3 million remaining available under the ATM Sales Agreement.
Warrants
As of December 31, 2019, we have outstanding warrants to purchase 16,061,602 shares of our common stock. The warrants are fully vested, exercisable at a price of $2.54 per share and expire in May 2023. In the event of a sale of the Company, the terms of the warrants require us to use our best efforts to ensure the holders of such warrants will have a continuing right to purchase shares of the acquirer and, if our efforts are unsuccessful, to make a payment to such warrant holders based on a Black-Scholes valuation (using variables as specified in the warrants). Therefore, we are required to account for the warrants as liabilities and record them at fair value. The warrants were revalued as of June 30, 2019 at $17.6 million and as of December 31, 2019 at $16.8 million; the changes in fair value were recorded in our Condensed Statement of Operations. No warrants were exercised during the six months ended December 31, 2019. During the six months ended December 31, 2018, warrants were exercised for 440,043 shares of common stock, and we received proceeds of $1.1 million.
Note 11. Share-based Compensation
We use equity-based compensation programs to provide long-term performance incentives for our employees. These incentives consist primarily of stock options and RSUs.
14
Our 2008 Stock Omnibus Equity Compensation Plan (the “2008 Plan”) provides for the grant of options and/or other share-based or share-denominated awards to our non-employee directors, officers, employees and advisors. The 2008 Plan was initially adopted in 2008 and was amended and restated in 2011, 2013, 2014, 2015, 2016 and 2018. There are 19,089,794 shares of common stock authorized for issuance under the 2008 Plan. As of December 31, 2019, there were 6,853,920 shares available for future grant under the 2008 Plan.
Total share-based compensation expense for all stock awards consists of the following, (in thousands):
| Three Months Ended December 31, |
Six Months Ended December 31, |
|||||||||||||||
| 2019 | 2018 | 2019 | 2018 | |||||||||||||
| Research and development |
$ | 743 | $ | 554 | $ | 1,524 | $ | 1,184 | ||||||||
| General and administrative |
1,028 | 1,109 | 2,360 | 2,416 | ||||||||||||
|
|
|
|
|
|
|
|
|
|||||||||
| Total share-based compensation |
$ | 1,771 | $ | 1,663 | $ | 3,884 | $ | 3,600 | ||||||||
|
|
|
|
|
|
|
|
|
|||||||||
Stock Options
Stock option activity for the six months ended December 31, 2019 was as follows:
| Number of Options |
Weighted- Average Exercise Price |
Weighted-Average Remaining Contractual Term (in years) |
Aggregate Intrinsic Value |
|||||||||||||
| Outstanding at June 30, 2019 |
8,356,961 | $ | 3.20 | |||||||||||||
| Granted |
3,263,333 | 2.46 | ||||||||||||||
| Exercised |
(46,667 | ) | 1.54 | |||||||||||||
| Forfeited / Cancelled |
(72,519 | ) | 2.04 | |||||||||||||
| Expired |
(557,890 | ) | 6.89 | |||||||||||||
|
|
|
|||||||||||||||
| Outstanding at December 31, 2019 |
10,943,218 | 2.80 | 8.2 | $ | 2,627,706 | |||||||||||
|
|
|
|||||||||||||||
| Vested and exercisable at December 31, 2019 |
4,548,951 | 2.55 | 7.2 | $ | 2,186,903 | |||||||||||
The fair value of each stock option granted during the six months ended December 31, 2019 is estimated on the grant date under the fair value method using a Black-Scholes valuation model. Stock options granted to employees during the six months ended December 31, 2019 vest 25% one year from the date of grant and ratably each month thereafter for a period of 36 months and expire ten years from the date of grant. Stock options granted to directors during the six months ended December 31, 2019 vest ratably each month for a period of 12 or 36 months from the date of grant and expire ten years from the date of grant. The estimated fair values of the stock options, including the effect of estimated forfeitures, are expensed over the service period.
The following weighted-average assumptions were used to determine the fair value of options granted during the period:
| Six Months Ended December 31, |
||||||||
| 2019 | 2018 | |||||||
| Risk-free interest rate |
1.8 | % | 2.8 | % | ||||
| Expected life (years) |
6.0 | 6.0 | ||||||
| Expected volatility |
73.5 | % | 85.7 | % | ||||
| Dividend yield |
0.0 | % | 0.0 | % | ||||
| Weighted-average grant date fair value |
$ | 1.60 | $ | 3.05 | ||||
As of December 31, 2019, there was $6.9 million of unrecognized compensation expense related to the unvested portion of stock options. Such compensation expense is expected to be recognized over a weighted-average period of 1.7 years.
Restricted Stock Units
In June 2016, we granted 364,726 RSUs to employees. Each RSU represented the contingent right to receive one share of our common stock. The RSUs vested in August 2018, and we released 332,193 RSU shares. We issued 245,782 shares of common stock to RSU holders; 86,411 shares were surrendered to us by RSU holders as payment for the employee portion of the required withholding of associated payroll taxes.
15
Item 2: Management’s Discussion and Analysis of Financial Condition and Results of Operations
This Quarterly Report on Form 10-Q includes forward-looking statements within the meaning of Section 27A of the Securities Act of 1933, as amended (the “Securities Act”) and Section 21E of the Securities Exchange Act of 1934, as amended (the “Exchange Act”). All statements other than statements of historical facts contained in this Quarterly Report, including statements regarding the future financial position, business strategy and plans and objectives of management for future operations, are forward-looking statements. The words “believe,” “may,” “will,” “estimate,” “continue,” “anticipate,” “intend,” “should,” “plan,” “expect,” and similar expressions, as they relate to us, are intended to identify forward-looking statements. We have based these forward-looking statements largely on current expectations and projections about future events and financial trends that we believe may affect our financial condition, results of operations, business strategy and financial needs. These forward-looking statements are subject to a number of risks, uncertainties and assumptions, including, without limitation, those described in “Risk Factors” in our 2019 Annual Report, and elsewhere in this report, including, among other things:
| • | our inability to obtain required additional financing or financing available to us on acceptable terms, or at all, which may cause us to delay, scale-back or eliminate plans related to development of our drug candidates; |
| • | parties with which we have entered into collaboration, license, development and/or commercialization agreements may not satisfy their obligations under the agreements which could impact future revenues; |
| • | our payment obligations under the Presage License Agreement and the S*Bio Purchase Agreement, which may reduce our cash available for other development efforts, and other obligations and risks related to the Presage License Agreement and the S*Bio Purchase Agreement; |
| • | clinical studies by their nature typically have a high level of risk and may not produce successful results; |
| • | the results of pre-clinical studies and completed clinical trials are not necessarily predictive of future results, and our current drug candidates may not have favorable results in later studies or trials; |
| • | our inability to maintain or enter into, and the risks resulting from our dependence upon, contractual arrangements necessary for the clinical development, manufacture, commercialization, marketing, sales and distribution of our product candidates; |
| • | costs and delays in our clinical development programs and/or receipt of FDA or other required foreign and domestic governmental or regulatory approvals, or the failure to obtain such approvals, for our product candidates; |
| • | the FDA’s interpretation and our interpretation of data from preclinical and clinical studies may differ significantly; |
| • | our failure to successfully commercialize our product candidates; |
| • | pricing regulations, third-party reimbursement practices and healthcare reform initiatives; |
| • | the failure of any products to gain market acceptance; |
| • | our reliance on third parties to conduct our clinical trials and manufacture our products; |
| • | our inability to control the costs of manufacturing our products; |
| • | our reliance on acquisitions or licenses from third parties to expand our pipeline of drug candidates; |
| • | competition and competitive factors; |
| • | our inability to protect our patents or proprietary rights and obtain necessary rights to third party patents and intellectual property to operate our business; |
| • | our inability to operate our business without infringing the patents and proprietary rights of others; |
| • | costs stemming from our defense against third party intellectual property infringement claims; |
| • | our exposure to potential product liability claims and other claims, may exceed our insurance limits; |
| • | our ability to attract and retain key employees; |
| • | technological changes; |
| • | cybersecurity; |
| • | general economic conditions; |
| • | government regulation generally; |
| • | changes in industry practice; and |
| • | one-time events. |
These risks are not exhaustive. Other sections of this report and our other filings with the SEC include additional factors which could adversely impact our business and financial performance. Moreover, we operate in a very competitive and rapidly changing environment. New risk factors emerge from time to time and it is not possible for us to predict all risk factors, nor can we assess the impact of all factors on our business or the extent to which any factor, or combination of factors, may cause actual results to differ materially from those contained in any forward-looking statements.
You should not rely upon forward-looking statements as predictions of future events. We cannot assure you that the events and circumstances reflected in the forward-looking statements will be achieved or occur. Although we believe that the expectations reflected in the forward-looking statements are reasonable, we cannot guarantee future results, levels of activity, performance or achievements. Past performance may not be an indicator of future results. The following discussion is qualified in its entirety by, and should be read in conjunction with, the more detailed information set forth in the financial statements and the notes thereto appearing elsewhere in this Quarterly Report on Form 10-Q and the audited financial statements and notes thereto included in our 2019 Annual Report, as filed with the SEC. Operating results are not necessarily indicative of results that may occur in future periods.
16
Overview and Recent Developments
We are a late-stage pharmaceutical company focused on leveraging our extensive development and oncology expertise to identify and advance new therapies intended to meaningfully improve the treatment of cancer. Our portfolio of drug candidates contains four clinical-stage candidates, including one candidate in an ongoing Phase 3 global registration trial and another candidate in an ongoing Phase 2 clinical trial intended to support an accelerated approval of a marketing application with the FDA under 21 CFR Part 314.500. Our common stock is listed on the NASDAQ Capital Market under the symbol “MEIP.”
Clinical Development Programs
Our approach to building our pipeline is to license promising cancer agents and build value in programs through development, commercialization and strategic partnerships, as appropriate. Our drug candidate pipeline includes:
| • | ME-401, an oral PI3Kd inhibitor; |
| • | Voruciclib, an oral CDK inhibitor; |
| • | ME-344, a mitochondrial inhibitor targeting the OXPHOS complex; and |
| • | Pracinostat, an oral HDAC inhibitor. |
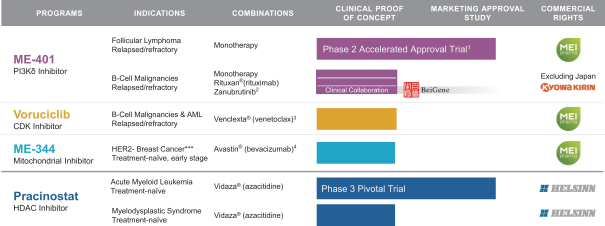
1. Phase 2 study intended to support an accelerated approval marketing application with FDA.
2. Study arm initiated under clinical collaboration with BeiGene, Ltd.
3. Initiation of clinical studies is subject to opening of a new Investigational New Drug application with FDA.
4. Investigator-initiated trial.
ME-401: PI3Kd Inhibitor in a Phase 2 Trial Intended to Support an Accelerated Approval in Relapsed or Refractory Follicular Lymphoma
ME-401 is an oral, once-daily, selective PI3Kd inhibitor in clinical development for the treatment of B-cell malignancies. We maintain worldwide rights to ME-401 in all geographies except Japan, which we licensed to Kyowa Kirin Company (“KKC”) in October 2018.
We are conducting two ongoing studies evaluating ME-401. The first is TIDAL (Trials of PI3K DeltA in Non-Hodgkin’s Lymphoma), a Phase 2 clinical trial evaluating ME-401 as a monotherapy for the treatment of adults with relapsed or refractory follicular lymphoma (“FL”) after failure of at least two prior systemic therapies including chemotherapy and an anti-CD20 antibody. Subject to the results, upon completion of TIDAL, we are planning a submission with the FDA to support an accelerated approval of a marketing application under 21 CFR Part 314.500, Subpart H. The second is a multi-arm, open-label, Phase 1b dose escalation and expansion trial evaluating ME-401 as a monotherapy and in combination with other therapies in patients with relapsed or refractory B-cell malignancies.
While PI3Kd inhibitors as a group are a clinically validated class for the treatment of B-cell malignancies, the FDA approved orally administered products, idelalisib (marketed as Zydelig®) and duvelisib (marketed as COPIKTRA®), and the intravenously administered PI3Kd/α inhibitor copanlisib (marketed as Aliqopa®), are challenged by dose-limiting toxicities. We believe this provides an opportunity for the development of a next-generation candidate with pharmaceutical properties that may better maximize the biological potential of PI3Kd inhibition by limiting toxicities, which hinder clinical utility.
17
The molecular structure and pharmacodynamic characteristics of ME-401 are distinct from the FDA approved PI3Kd inhibitors. ME-401 is characterized by prolonged target binding, preferential cellular accumulation, high volume of distribution throughout the body tissues, and an approximately 28-hour half-life suitable for once daily oral administration. These properties of ME-401 allow exploration of flexible dosing regimens such as an intermittent dosing schedule, which has the potential to maintain clinical benefit while minimizing immune-related toxicities common to other PI3Kd agents, either as a monotherapy or in combination with other therapies.
ME-401 Scientific Overview: at the Crossroads of B-cell Signaling Pathways
The PI3K/AKT/mTOR pathway is an important signaling pathway for many cellular functions such as cell survival, cell cycle progression and cellular growth. PI3Ks are a family of enzymes within this pathway that have been shown to play a critical role in the proliferation and survival of certain cancer cells. Specifically, the PI3Kd isoform is at the crossroads of B-cell receptor signaling pathways that are major drivers of survival and proliferation of many B-cell malignancies. Because the d isoform is largely restricted to leukocytes, it is an attractive target for selectively inhibiting the PI3K pathway in B-cell malignancies.
PI3Kd Inhibitors and B-Cell Malignancies
Clinical Program
We are conducting two ongoing studies: TIDAL, a global Phase 2 trial evaluating patients with relapsed or refractory FL intended to support an accelerated approval of a marketing application with the FDA under 21 CFR Part 314.500, Subpart H, and a multi-arm, open-label, Phase 1b dose escalation and expansion trial as a monotherapy and in combination with other therapies or investigational agents in patients with FL and other B-cell malignancies.
Phase 1b Multi-arm Trial
In October 2019, we reported updated interim data from the ongoing Phase 1b clinical trial evaluating ME-401 as a monotherapy and in combination with rituximab in patients with relapsed or refractory B-cell malignancies. Ninety-six patients were enrolled at the time of the update, of which data on 73 patients were reported on for response: 55 patients with relapsed or refractory FL and 18 with relapsed or refractory chronic lymphocytic leukemia or small lymphocytic lymphoma (“CLL/SLL”).
ME-401 is administered once daily at 60 mg for two 28-day cycles and then on an intermittent schedule (i.e. IS) of once daily dosing for the first seven days of each subsequent 28-day cycle. A previous cohort of monotherapy patients in the trial was treated with ME-401 at 60 to 180 mg administered continuously once daily (i.e. CS) or were switched to the IS in later cycles.
The overall response rate, a secondary objective, was 81% among the 73 evaluable r/r FL and r/r CLL/SLL patients. The overall response rate was 78% and 89% in the 55 and 18 patients with FL or CLL/SLL, respectively. Responses appeared durable with a median observation time between 7.4 and 24.5 months, depending on the dosing schedule, the subject’s disease state, and whether ME-401 was used as a monotherapy or combination therapy. Overall response rates and durability of response appeared consistent across various groups, including dosing schedule, dosing regimen and number of prior systemic therapies received.
| FL | CLL/SLL | |||||||||||
| Overall | Overall | |||||||||||
| Number | Response | Number | Response | |||||||||
| Evaluable | Rate | Evaluable | Rate | |||||||||
| All patients |
55 | 43 (78%) | 18 | 16 (89%) | ||||||||
| By regimen: |
||||||||||||
| ME-401 alone |
39 | 31 (79%) | 11 | 11 (100%) | ||||||||
| ME-401 + rituximab |
16 | 12 (75%) | 7 | 5 (71%) | ||||||||
| By schedule: |
||||||||||||
| IS |
29 | 23 (79%) | 8 | 6 (75%) | ||||||||
| CS |
26 | 20 (70%) | 10 | 10 (100%) | ||||||||
ME-401 was generally well-tolerated and no grade 4 or grade 5 adverse events of special interest have been observed in the Phase 1b trial. Among drug related grade 3 adverse events of special interest, the most common was diarrhea/colitis at 5.0% (3/57) on IS dosing and 23% (9/39) on CS dosing. Grade 3 elevations in ALT and AST were transient and in each case were associated with grade 3 diarrhea or rash. The discontinuation rate for treatment emergent adverse events was 4%.
18
| Grade 3 Drug Related Adverse Events of Special Interest |
CS Group (N = 39) n (%) |
IS Group (N = 57) n (%) | ||
| Diarrhea/Colitis |
9 (23%) | 3 (5%) | ||
| Rash, all types |
3 (8%) | 0 | ||
| ALT/AST increased |
3 (8%) | 1 (2%) | ||
| Mucositis |
1 (3%) | 0 | ||
| Pneumonia/Pneumonitis |
4 (10%) | 1 (2%) |
The Phase 1b trial is additionally evaluating ME-401 (60 mg) in combination with zanubrutinib (marketed as Brukinsa®), an inhibitor of Bruton’s tyrosine kinase (“BTK”) developed by BeiGene, Ltd. (“BeiGene”). Pursuant to a collaboration initiated with BeiGene in October 2018, we began evaluating the safety and efficacy of ME-401 in combination with zanubrutinib for the treatment of patients with various relapsed or refractory B-cell malignancies. The cost of the combination trial is being equally shared. Each company is supplying its own investigational agent. We retain all commercial rights to ME-401 and BeiGene retains all commercial rights to zanubrutinib.
Phase 2 Trial Intended to Support an Accelerated Approval Marketing Application
We are recruiting patients in TIDAL, a global Phase 2 trial evaluating the efficacy, safety, and tolerability of ME-401 in patients with FL after failure of at least two prior systemic therapies including chemotherapy and anti-CD20 antibody. This study is intended to support an FDA accelerated approval New Drug Application. The study was initially designed to evaluate both the CS and IS dosing regimens; in one arm, ME-401 was administered once daily continuously and in the other arm, ME-401 was administered once daily for two cycles (i.e., eight weeks) followed by an intermittent schedule whereby ME-401 was administered once daily for the first seven days of a 28-day cycle followed by 21 days of placebo. Based on maturing data from the Phase 1b trial, which suggested that clinical responses and durability in the IS regimen appeared to be equivalent to the CS regimen, and at the same time was also associated with improved tolerability, in December 2019 we amended the protocol to continue enrollment in the IS regimen only. Approximately 120 patients will be enrolled in the IS arm and the primary efficacy endpoint will be the rate of objective responses to therapy and tolerability of ME-401. We currently estimate completion of enrollment in summer 2020.
Voruciclib: CDK Inhibitor with CDK9 Inhibition in Phase 1 Studies
Voruciclib is an orally administered CDK inhibitor differentiated by its potent in vitro inhibition of CDK9 in addition to CDK6, 4 and 1. Voruciclib is being evaluated in a Phase 1b trial evaluating dose and schedule in patients with acute myeloid leukemia (“AML”) and B-cell malignancies.
Voruciclib Scientific Overview: Cell Cycle Signaling
The CDK family of proteins are important cell cycle regulators. CDK9 is a transcriptional regulator of the myeloid leukemia cell differentiation protein (“MCL1”), a member of the family of anti-apoptotic proteins which, when elevated, may prevent the cell from undergoing cell death. Inhibition of CDK9 blocks the production of MCL1, which is an established resistance mechanism to the B-cell lymphoma (“BCL2”) inhibitor venetoclax (marketed as Venclexta®).
In pre-clinical studies voruciclib shows dose-dependent suppression of MCL1; in December 2017 a study of voruciclib published in the journal Nature Scientific Reports reported that the combination of voruciclib plus the BCL-2 inhibitor venetoclax was capable of inhibiting two master regulators of cell survival, MCL-1 and BCL-2, and achieved synergistic antitumor effect in an aggressive subset of DLBCL pre-clinical models. (Scientific Reports. (2017) 7:18007. DOI:10.1038/s41598-017-18368-w).
Additionally, at the 2018 American Society of Hematology (“ASH”) annual meeting we presented results from pre-clinical studies demonstrating that voruciclib synergizes with venetoclax to induce apoptosis in both venetoclax sensitive and resistant AML cells. The pre-clinical data further demonstrated that voruciclib transiently downregulates MCL1 and that MCL1 downregulation is likely responsible for the bulk of the synergy between voruciclib and venetoclax.
CDK9 is also a transcriptional regulator of MYC, a transcription factor regulating cell proliferation and growth which contributes to many human cancers and is frequently associated with poor prognosis and unfavorable patient survival. Targeting MYC directly has historically been difficult, but CDK9 is a transcriptional regulator of MYC and is a promising approach to target this oncogene.
Clinical Program
We are evaluating patients with hematological malignancies in a Phase 1b clinical trial evaluating the dose and schedule of voruciclib. The trial is initially intended to evaluate the dose and schedule of voruciclib as a monotherapy in patients with relapsed and/or refractory B-cell malignancies or AML after failure of prior standard therapies to determine the safety, preliminary efficacy and maximum tolerated dose. In parallel, subject to FDA agreement, we also plan to evaluate the dose and schedule of voruciclib in combination with a BCL2 inhibitor such as venetoclax to assess synergies and the opportunity for combination treatments, initially in patients with AML and subsequently across multiple indications.
Voruciclib was previously evaluated in more than 70 patients in multiple Phase 1 studies with a tolerability profile consistent with other drugs in its class. In pre-clinical studies, voruciclib shows dose-dependent suppression of MCL1 at concentrations achievable with doses that appear to be generally well tolerated in earlier Phase 1 studies. Pre-clinical studies additionally show inhibition of MYC protein expression.
19
ME-344: Mitochondrial Inhibitor with Combinatorial Potential
ME-344 is our novel and tumor selective, isoflavone-derived mitochondrial inhibitor drug candidate. It directly targets the OXPHOS complex 1, a pathway involved in ATP production in the mitochondria. ME-344 was recently studied in an investigator-initiated, multi-center, randomized clinical trial in combination with the vascular endothelial growth factor (“VEGF”) inhibitor bevacizumab (marketed as Avastin ®) in a total of 42 patients with HER2 negative breast cancer.
ME-344 Scientific Overview: Cancer Metabolism
Tumor cells often display a high metabolic rate to support cell division and growth. This heightened metabolism requires a continual supply of energy in the form of adenosine triphosphate (“ATP”). The two major sources of ATP are the specialized cellular organelles termed mitochondria and through the metabolism of carbohydrates, proteins and lipids.
ME-344 was identified through a screen of more than 400 new chemical structures originally created based on the central design of naturally occurring plant isoflavones. We believe that some of these synthetic compounds, including our drug candidate ME-344, interact with specific mitochondrial enzyme targets, resulting in the inhibition of ATP generation. When these compounds interact with their target, a rapid reduction in ATP occurs, which leads to a cascade of biochemical events within the cell and ultimately to cell death.
Clinical Program
ME-344 demonstrated evidence of single agent activity against refractory solid tumors in a Phase 1 trial, and in pre-clinical studies tumor cells treated with ME-344 resulted in a rapid loss of ATP and cancer cell death. In addition to single agent activity, ME-344 may also have significant potential in combination with anti-angiogenic therapeutics. In pre-clinical studies, it was shown that one outcome of anti-angiogenics was to reduce the rate of glycolysis in tumors as a mechanism to slow tumor growth. However, tumor metabolism was able to shift to mitochondrial metabolism for energy production to support continued tumor proliferation. In such cases of tumor plasticity in the presence of treatment with anti-angiogenics, targeting the alternative metabolic source with ME-344 may open an important therapeutic opportunity.
Support for this combinatorial use of ME-344 was first published in the June 2016 edition of Cell Reports; pre-clinical data from a collaboration with the Spanish National Cancer Research Centre in Madrid demonstrated mitochondria-specific effects of ME-344 in cancer cells, including substantially enhanced anti-tumor activity when combined with agents that inhibit the activity of VEGF. These data demonstrating the potential anti-cancer effects of combining ME-344 with a VEGF inhibitor due to an inhibition of both mitochondrial and glycolytic metabolism provided a basis for commencement of an investigator-initiated trial of ME-344 in combination with bevacizumab in HER2 negative breast cancer patients.
Results published in the November 2019 issue of Clinical Cancer Research from a multicenter, investigator-initiated, randomized, open-label, clinical trial that evaluated the combination of ME-344 and bevacizumab in 42 women with early HER2-negative breast cancer further support for the combinatorial use of ME-344 with anti-angiogenic therapeutics.
The primary objective of the trial was to show proof of ME-344 biologic activity as measured by Ki67 reductions (a measure of cell proliferation that is highly correlated with tumor response) from day 0 to 28 compared to the control group who received bevacizumab alone. Secondary objectives included determining whether ME-344 biologic activity correlates with vascular normalization. The data demonstrate significant biologic activity in the ME-344 treatment group:
| • | In ME-344 treated patients, mean absolute Ki67 decreases were 13.3 compared to an increase of 1.1 in the bevacizumab monotherapy group (P=0.01). |
| • | In ME-344 treated patients, mean relative Ki67 decreases were 23% compared to an increase of 186% in the bevacizumab monotherapy group (P < 0.01). |
| • | The mean relative Ki67 reduction in patients experiencing vascular normalization in the ME-344 treated patients was 33%, compared to an increase of 11.8% in normalized patients from the bevacizumab monotherapy group (P=0.09). Approximately one-third of patients in each arm had vascular normalization. |
Treatment was generally well tolerated; three Grade 3 adverse events of high blood pressure were reported, two in the ME-344 arm and one in the bevacizumab monotherapy arm.
Results from our earlier, first-in-human, single-agent Phase 1 clinical trial of ME-344 in patients with refractory solid tumors were published in the April 1, 2015 issue of Cancer. The results indicated that eight of 21 evaluable patients (38%) treated with ME-344 achieved stable disease or better, including five who experienced progression-free survival that was at least twice the duration of their last prior treatment before entry into the trial. In addition, one of these patients, a heavily pre-treated patient with small cell lung cancer, achieved a confirmed partial response and remained on study for two years. ME-344 was generally well tolerated at doses equal to or less than 10 mg/kg delivered on a weekly schedule for extended durations. Treatment-related adverse events included nausea, dizziness and fatigue. Dose-limiting toxicities were observed at both the 15 mg/kg and 20 mg/kg dose levels, consisting primarily of grade three peripheral neuropathy.
20
Pracinostat: HDAC Inhibitor Candidate in a Phase 3 Global Registration Clinical Trial
Pracinostat is an oral HDAC inhibitor being evaluated in a pivotal Phase 3 global registration clinical trial for the treatment of adults with newly diagnosed AML who are unfit to receive intensive chemotherapy. Pracinostat is also being evaluated in a Phase 2 trial in patients with high or very high-risk myelodysplastic syndrome (“MDS”). In August 2016, we entered into an exclusive worldwide license, development, manufacturing and commercialization agreement with Helsinn Healthcare SA, a Swiss pharmaceutical corporation (“Helsinn”) for pracinostat in AML, MDS and other potential indications (the “Helsinn License Agreement”). Under the agreement, Helsinn is primarily responsible for funding global development and commercialization costs for pracinostat. We are responsible for conducting the Phase 2 MDS trial, the cost of which is being shared equally with Helsinn.
Breakthrough Therapy Designation for pracinostat was granted by the FDA in 2016, and in January 2018 the European Medicines Agency granted Orphan Drug Designation to pracinostat for the treatment of AML. The designations in the US and European Union (“EU”) are supported by data from a Phase 2 trial of pracinostat plus azacitidine (marketed as Vidaza®) in elderly patients with newly diagnosed AML who are not candidates for induction chemotherapy. The trial showed a median overall survival of 19.1 months and a complete remission (“CR”) rate of 42% (21 of 50 patients). These data compare favorably to an international Phase 3 trial of azacitidine (AZA-001; Dombret et al. Blood. 2015 May 18), which showed a median overall survival of 10.4 months with azacitidine alone and a CR rate of 19.5% in a similar patient population. The combination of pracinostat and azacitidine was generally well tolerated, with no unexpected toxicities. The most common grade 3/4 treatment-emergent adverse events included febrile neutropenia, thrombocytopenia, anemia and fatigue.
Pracinostat Scientific Overview; Epigenetics
HDACs play a key role in epigenetic regulation of gene expression by regulating chromatin structure. Acetylation of positively charged lysine residues present in histone proteins by the histone acetyltransferase (“HATs”) reduces the affinity between histones and negatively charged DNA, resulting in the opening of the chromatin structure. This makes it easier for the transcriptional machinery to access the DNA, enhancing RNA transcription. Conversely, deacetylation by the HDACs closes the chromatin structure leading to a repression of gene transcription. In normal cells, HDACs and HATs together control histone acetylation levels to maintain a balance. In diseases such as cancer, this regulation can be disturbed. HDAC inhibitors cause accumulation of acetylated histones, enhance transcription and result in changes to a variety of cellular responses including differentiation, proliferation, migration, survival and response to metabolic and hypoxic stress. In general, tumor cells are more susceptible than normal cells to the anti-proliferative and pro-apoptotic effects of HDAC inhibitors.
There are currently three HDAC inhibitors, one oral and two injectable, approved by the FDA for the treatment of T-cell lymphoma and a fourth orally administered HDAC inhibitor approved for multiple myeloma. Other HDAC inhibitors are being evaluated in clinical trials as monotherapies and in combination for the treatment of various hematologic diseases and solid tumors.
Pracinostat is an orally available, potent HDAC inhibitor with potentially improved physicochemical, pharmaceutical and pharmacokinetic properties when compared to other compounds of this class, including increased bioavailability and increased half-life.
Clinical Program
The ongoing pivotal Phase 3 registration trial, which is being run by Helsinn and was initiated in June 2017, is a randomized, double-blind, placebo-controlled study that will enroll worldwide approximately 500 adults with newly diagnosed AML who are unfit to receive intensive chemotherapy. Patients are randomized 1:1 to receive pracinostat or placebo with azacitidine as background therapy. The primary endpoint of the trial is overall survival. Secondary endpoints include morphologic CR rate, event-free survival and duration of CR.
Additionally, pracinostat is being investigated in a Phase 2 dose optimization trial evaluating patients with high and very high-risk MDS who are previously untreated with hypomethylating agents. This patient group represents the highest unmet need in MDS, with median survival estimates of 1.6 years and 0.8 years, respectively (Greenberg et al, Blood 2012). The ongoing Phase 2 open-label trial is evaluating a 45 mg dose of pracinostat in combination with the standard dose of azacitidine. The trial is designed to evaluate tolerability of the combination, with the intent of maintaining patient enrollment longer than in an earlier Phase 2 trial evaluating a 60 mg dose. A prolonged treatment may result in a systemic exposure to pracinostat and azacitidine sufficient to achieve the desired treatment effect; data from the earlier Phase 2 trial suggested that insufficient exposure to treatment may have limited the treatment effect of the combination.
A pre-planned interim analysis of the ongoing Phase 2 MDS trial demonstrated a 10% discontinuation rate among the first 20 evaluable patients treated, meeting the predefined threshold in the first 3 treatment cycles. The 10% rate is consistent with the discontinuation rate for azacitidine given as a monotherapy in earlier studies with pracinostat. Having met this threshold, the trial expanded open-label enrollment to a total of 60 patients in the study. An interim analysis presented at the 2018 ASH meeting demonstrated a discontinuation rate due to adverse events in the first 3 months of 4%, substantially lower than the rate of 26% reported in the Company’s prior Phase 2 trial. The Phase 2 trial has completed enrollment and patients will be followed for one year to evaluate safety and efficacy. The primary endpoints of the trial are 1) safety and tolerability and 2) overall response rate, defined as CR, partial remission (“PR”) and marrow CR. Secondary endpoints include CR rate, overall hematologic improvement (“HI”)
21
response rate, clinical benefit rate (defined as rate of CR + PR + HI + Marrow CR), rate of cytogenetic complete response/remission, duration of response, rate of leukemic transformation, event-free survival, progression-free survival and overall survival. If the Phase 2 open-label trial is successful, Helsinn intends to initiate a global registration trial. All future development and commercialization costs after the completion of the Phase 2 trial are the responsibility of Helsinn. Pracinostat has been previously investigated in more than 300 patients in multiple Phase 1 and Phase 2 clinical trials and found to be generally well tolerated with manageable side effects often associated with drugs of this class, including fatigue, myelosuppression and gastrointestinal toxicity.
Results of Operations
Comparison of Three Months Ended December 31, 2019 and 2018
We had a loss from operations of $12.1 million for the three months ended December 31, 2019 compared to a loss from operations of $11.8 million for the three months ended December 31, 2018.
Revenue: The following is a summary of our revenue to supplement the more detailed discussion below. The dollar values in the following table are in thousands.
| Three Months Ended December 31, | ||||||||
| 2019 | 2018 | |||||||
| KKC License Agreement |
$ | 673 | $ | 1,361 | ||||
| Helsinn License Agreement |
335 | 687 | ||||||
|
|
|
|
|
|||||
| $ | 1,008 | $ | 2,048 | |||||
|
|
|
|
|
|||||
| Timing of Revenue Recognition: |
||||||||
| License transferred at a point in time |
$ | — | $ | 879 | ||||
| Services performed over time |
1,008 | 1,169 | ||||||
|
|
|
|
|
|||||
| $ | 1,008 | $ | 2,048 | |||||
|
|
|
|
|
|||||
We recognized revenue of $1.0 million for the three months ended December 31, 2019 compared to $2.0 million for the three months ended December 31, 2018. Revenue decreased primarily due to our license agreement with KKC. Revenue related to the license agreement with KKC was $0.7 million for the three months ended December 31, 2019 compared to $1.3 million for the three months ended December 31, 2018. During the three months ended December 31, 2018, revenue related to the KKC license agreement included $0.9 million from the transfer of the license. Revenue also includes recognition of amounts allocated to performance obligations in accordance with the Helsinn License Agreement. Revenue related the Helsinn License Agreement was $0.3 million for the three months ended December 31, 2019 compared to $0.7 million for the three months ended December 31, 2018.
Cost of Revenue: We recognized cost of revenue of $0.6 million for the three months ended December 31, 2019 compared to $1.0 million for the three months ended December 31, 2018. The cost of revenue includes external costs paid to third-party contractors to perform research, conduct clinical trials and develop and manufacture drug materials, and internal compensation and related personnel expenses associated with pracinostat. Costs of revenue relate to expenses for pracinostat incurred in connection with our development activities in accordance with the Helsinn License Agreement, including both Helsinn’s share and our share of costs related to the POC study, which we are responsible for conducting.
Research and Development: The following is a summary of our research and development expenses to supplement the more detailed discussion below. The dollar values in the following table are in thousands.
| Three Months Ended December 31, | ||||||||
| 2019 | 2018 | |||||||
| Research and development expenses |
||||||||
| ME-401 |
$ | 4,217 | $ | 5,324 | ||||
| Voruciclib |
457 | 1,069 | ||||||
| ME-344 |
9 | 100 | ||||||
| Other |
3,598 | 2,573 | ||||||
|
|
|
|
|
|||||
| Total research and development expenses |
$ | 8,281 | $ | 9,066 | ||||
|
|
|
|
|
|||||
Research and development expenses consist primarily of clinical trial costs (including payments to clinical research organizations), pre-clinical study costs, and costs to manufacture our drug candidates for non-clinical and clinical studies. Other research and development expenses consist primarily of salaries and personnel costs, share-based compensation, legal costs, and other costs not allocated to specific drug programs. Research and development expenses were $8.3 million for the three months ended December 31, 2019 compared to $9.1 million for the three months ended December 31, 2018. Costs related to ME-401 were lower for the three months ended December 31, 2019 due to $2.1 million of decreased drug manufacturing costs offset by $1.0 million of increased clinical trial costs as a result of the TIDAL study. Costs related to voruciclib decreased due primarily to reduced clinical trial and drug manufacturing costs. Other research and development costs increased for the three months ended December 31, 2019 due to increased headcount to support our clinical activities.
22
General and Administrative: General and administrative expenses increased by $0.4 million to $4.2 million for the three months ended December 31, 2019 compared to $3.8 million for the three months ended December 31, 2018. The increase is primarily due to increased headcount to support our activities, and $0.1 million in increased professional services expenses.
Other income or expense: We recorded a non-cash expense of $8.4 million during the three months ended December 31, 2019, compared to a non-cash gain of $23.4 million during the three months ended December 31, 2018, due to a change in the fair value of our warrant liability. The change in the warrant liability fair value is primarily due to changes in our stock price. Additionally, we received interest and dividend income of $0.3 million for the three months ended December 31, 2019 compared to $0.4 million for the three months ended December 31, 2018. The decrease was due to lower investment balances during the three months ended December 31, 2019 compared to the three months ended December 31, 2018.
Comparison of Six Months Ended December 31, 2019 and 2018
We had a loss from operations of $24.7 million for the six months ended December 31, 2019 compared to a loss from operations of $21.9 million for the six months ended December 31, 2018.
Revenue: The following is a summary of our revenue to supplement the more detailed discussion below. The dollar values in the following table are in thousands.
| Six Months Ended December 31, | ||||||||
| 2019 | 2018 | |||||||
| KKC License Agreement |
$ | 1,470 | $ | 1,361 | ||||
| Helsinn License Agreement |
695 | 1,175 | ||||||
|
|
|
|
|
|||||
| $ | 2,165 | $ | 2,536 | |||||
|
|
|
|
|
|||||
| Timing of Revenue Recognition: |
||||||||
| License transferred at a point in time |
$ | — | $ | 879 | ||||
| Services performed over time |
2,165 | 1,657 | ||||||
|
|
|
|
|
|||||
| $ | 2,165 | $ | 2,536 | |||||
|
|
|
|
|
|||||
We recognized revenue of $2.2 million for the six months ended December 31, 2019 compared to $2.5 million for the six months ended December 31, 2018. Revenue decreased primarily due to our Helsinn License Agreement. Revenue related to the license agreement with KKC was $1.5 million for the six months ended December 31, 2019 compared to $1.3 million for the six months ended December 31, 2018. During the six months ended December 31, 2018, revenue related to the KKC license agreement included $0.9 million from the transfer of the license. Revenue also includes recognition of amounts allocated to performance obligations in accordance with the Helsinn License Agreement. Revenue related the Helsinn License Agreement was $0.7 million for the six months ended December 31, 2019 compared to $1.2 million for the six months ended December 31, 2018.
Cost of Revenue: We recognized cost of revenue of $1.3 million for the six months ended December 31, 2019 compared to $2.0 million for the six months ended December 31, 2018. The cost of revenue includes external costs paid to third-party contractors to perform research, conduct clinical trials and develop and manufacture drug materials, and internal compensation and related personnel expenses associated with pracinostat. Costs of revenue relate to expenses for pracinostat incurred in connection with our development activities in accordance with the Helsinn License Agreement, including both Helsinn’s share and our share of costs related to the POC study, which we are responsible for conducting.
Research and Development: The following is a summary of our research and development expenses to supplement the more detailed discussion below. The dollar values in the following table are in thousands.
| Six Months Ended December 31, | ||||||||
| 2019 | 2018 | |||||||
| Research and development expenses |
||||||||
| ME-401 |
$ | 9,169 | $ | 7,829 | ||||
| Voruciclib |
1,000 | 2,079 | ||||||
| ME-344 |
9 | 304 | ||||||
| Other |
7,065 | 4,985 | ||||||
|
|
|
|
|
|||||
| Total research and development expenses |
$ | 17,243 | $ | 15,197 | ||||
|
|
|
|
|
|||||
Research and development expenses consist primarily of clinical trial costs (including payments to clinical research organizations), pre-clinical study costs, and costs to manufacture our drug candidates for non-clinical and clinical studies. Other research and development expenses consist primarily of salaries and personnel costs, share-based compensation, legal costs, and other
23
costs not allocated to specific drug programs. Research and development expenses were $17.2 million for the six months ended December 31, 2019 compared to $15.2 million for the six months ended December 31, 2018. Costs related to ME-401 were higher for the six months ended December 31, 2019 due primarily to $4.2 million of increased clinical trial costs as a result of the TIDAL study offset by a $2.8 million decrease in drug manufacturing costs. Costs related to voruciclib decreased due primarily to reduced clinical trials and drug manufacturing costs. Costs related to ME-344 decreased due to completion of the investigator-initiated clinical trial. Other research and development costs increased for the six months ended December 31, 2019 due to increased headcount to support our clinical activities, as well as to increased legal and consulting fees ($0.2 million).
General and Administrative: General and administrative expenses increased by $1.1 million to $8.3 million for the six months ended December 31, 2019 compared to $7.2 million for the six months ended December 31, 2018. The increase is primarily due to increased headcount to support our activities, and $0.3 million in increased professional services expenses.
Other income or expense: We recorded a non-cash gain of $0.8 million during the six months ended December 31, 2019, compared to a non-cash gain of $18.5 million during the six months ended December 31, 2018, due to a change in the fair value of our warrant liability. The change in the warrant liability fair value is primarily due to changes in our stock price. Additionally, we received interest and dividend income of $0.7 million for the six months ended December 31, 2019 compared to $0.9 million for the six months ended December 31, 2018. The decrease was due to lower investment balances during the six months ended December 31, 2019 compared to the six months ended December 31, 2018.
Liquidity and Capital Resources
We have accumulated losses of $254.4 million since inception and expect to incur operating losses and generate negative cash flows from operations for the foreseeable future. As of December 31, 2019, we had $103.9 million in cash and cash equivalents and short-term investments, which we believe will be sufficient to fund our operations for at least the next 12 months from the issuance of these financial statements. Our current business operations are focused on continuing the clinical development of our drug candidates. Changes to our research and development plans or other changes affecting our operating expenses may affect actual future use of existing cash resources. To date, we have obtained cash and funded our operations primarily through equity financings and license payments. In order to continue the development of our drug candidates, we expect to pursue one or more capital transactions, whether through the sale of equity securities, debt financing, license agreements or entry into strategic partnerships.
Sources and Uses of Our Cash
Net cash used in operating activities for the six months ended December 31, 2019 was $24.6 million. This compares to $10.0 million used in operating activities for the six months ended December 31, 2018, reflecting $20.0 million used in operating activities offset by the $10.0 million upfront payment from KKC. The increase in cash used in operating activities reflects increased costs in our clinical development programs, including costs related to the ME-401 TIDAL study.
Net cash used in investing activities for the six months ended December 31, 2019 was $30.3 million compared to net cash provided by investing activities of $4.6 million in the six months ended December 31, 2018. Cash used in investing activities represents purchases of investments in short-term U.S. government securities in excess of maturities. Cash provided by investing activities represents maturities of investments in short-term U.S. government securities in excess of purchases.
Net cash provided by financing activities for the six months ended December 31, 2019 was $54.0 million compared to $0.9 million for the six months ended December 31, 2018. Cash provided during the six months ended December 31, 2019 represents the $48.5 million net proceeds raised through the issuance of common stock in our December 2019 underwritten registered offering, the collection of $5.3 million of amounts receivable as of June 30, 2019 from the issuance of common stock and exercise of stock options during the year ended June 30, 2019, as well as $0.2 million of proceeds received from the issuance of common stock and exercise of stock options during the six months ended December 31, 2019.
Contractual Obligations
We have contracted with various consultants and third parties to assist us in pre-clinical research and development and clinical trials work for our leading drug compounds. The contracts are terminable at any time, but obligate us to reimburse the providers for any time or costs incurred through the date of termination. Additionally, we have employment agreements with certain of our current employees that provide for severance payments and accelerated vesting for share-based awards if their employment is terminated under specified circumstances.
We have leased approximately 20,800 square feet of office space, located at 3611 Valley Centre Drive, San Diego, California. The location houses our executive and administrative offices. The lease commenced in July 2017 and expires in May 2020. The monthly rental rate is approximately $68,000 per month over the remaining term of the lease, plus a pro rata share of certain building expenses. The remaining contractual obligations are approximately $0.3 million.
In December 2019, we entered into a lease agreement for approximately 32,800 square feet of office space in San Diego, California. The contractual lease term begins on June 1, 2020 and will expire in January 2028. The average annual lease payments over the term of the lease will approximate $1.5 million, plus a pro rata share of certain building expenses. Our total contractual obligation over the term of the lease is approximately $11.5 million.
24
Presage License Agreement
In September 2017, we entered into the Presage License Agreement. Under the terms of the Presage License Agreement, Presage granted to us exclusive worldwide rights to develop, manufacture and commercialize voruciclib, a clinical-stage, oral and selective CDK inhibitor, and related compounds. In exchange, we paid Presage $2.9 million. With respect to the first indication, an incremental $2.0 million payment, due upon dosing the first subject in the first registration trial will be owed to Presage, for total payments of $4.9 million prior to receipt of marketing approval of the first indication in the U.S., E.U. or Japan. Additional potential payments of up to $179 million will be due upon the achievement of certain development, regulatory and commercial milestones. We will also pay mid-single-digit tiered royalties on the net sales of any product successfully developed. As an alternative to milestone and royalty payments related to countries in which we sublicense product rights, we will pay to Presage a tiered percent (which decreases as product development progresses) of amounts received from such sublicensees. As of December 31, 2019, we have not accrued any amounts for potential future payments.
S*Bio Purchase Agreement
We are party to a definitive asset purchase agreement with S*Bio, pursuant to which we acquired certain assets comprised of intellectual property and technology including rights to pracinostat. We agreed to make certain milestone payments to S*Bio based on the achievement of certain clinical, regulatory and net sales-based milestones, as well as to make certain contingent earnout payments to S*Bio. Milestone payments will be made to S*Bio up to an aggregate amount of $74.5 million if certain U.S., E.U. and Japanese regulatory approvals are obtained and if certain net sales thresholds are met in North America, the E.U. and Japan. The first milestone payment of $200,000 plus 166,527 shares of our common stock having a value of $500,000 was paid in August 2017 upon the first dosing of a patient in a Phase 3 clinical trial. Subsequent milestone payments will be due upon certain regulatory approvals and sales-based events. As of December 31, 2019, we have not accrued any amounts for potential future payments.
CyDex License Agreement
We are party to a license agreement with CyDex. Under the license agreement, CyDex granted to us an exclusive, nontransferable license to intellectual property rights relating to Captisol® for use with our two isoflavone-based drug compounds (currently ME-344). We agreed to pay to CyDex a non-refundable license issuance fee, future milestone payments, and royalties at a low, single-digit percentage rate on future sales of our approved drugs utilizing Captisol. Contemporaneously with the license agreement, CyDex entered into a commercial supply agreement with us, pursuant to which we agreed to purchase 100% of our requirements for Captisol from CyDex. We may terminate both the license agreement and the supply agreement for convenience at any time upon 90 days’ prior written notice. As of December 31, 2019, we have not accrued any amounts for potential future payments.
Critical Accounting Policies and Management Estimates
We describe our significant accounting policies in Note 1, The Company and Summary of Significant Accounting Policies, of the notes to the financial statements included in our 2019 Annual Report. We discuss our critical accounting estimates in Item 7, Management’s Discussion and Analysis of Financial Condition and Results of Operations, in our 2019 Annual Report. Except for the adoption of ASC 842, there have been no changes in our significant accounting policies or critical accounting estimates since June 30, 2019.
Recent Accounting Pronouncements
See Note 1 to the Financial Statements included in Item 1 of this Quarterly Report.
Item 3: Quantitative and Qualitative Disclosures about Market Risk
Our exposure to market interest rates relates primarily to the investment of cash balances and short-term investments. We have cash reserves held in U.S. dollars and we place funds on deposit with financial institutions, which are readily available. Our short-term investments consist solely of U.S. government securities with a maturity of three to twelve months.
We place our cash deposits with high credit quality financial institutions and by policy limit the amount of credit exposure to any one corporation or bank. These deposits are in excess of the FDIC insurance limits. We are adverse to principal loss and we ensure the safety and preservation of our invested funds by limiting default risk, market risk and reinvestment risk. We seek to mitigate default risk by depositing funds with high credit quality financial institutions, by limiting the amount of credit exposure to any one corporation or bank, by purchasing short-term investments consisting of U.S. government securities, and by positioning our portfolio to respond appropriately to a significant reduction in a credit rating of any such financial institution.
We do not consider the effects of interest rate movements to be a material risk to our financial condition.
25
Item 4: Controls and Procedures
At the end of the period covered by this Quarterly Report on Form 10-Q, our management, with the participation of our Chief Executive Officer and Chief Financial Officer, evaluated the effectiveness of our disclosure controls and procedures. Disclosure controls and procedures include, without limitation, controls and procedures designed to ensure that information required to be disclosed by an issuer in the reports that it files or submits under the Exchange Act is accumulated and communicated to the issuer’s management, including its principal executive and principal financial officers, or persons performing similar functions, as appropriate to allow timely decisions regarding required disclosure. Based on that evaluation, our Chief Executive Officer and Chief Financial Officer concluded that our disclosure controls and procedures were effective to ensure that the information required to be disclosed by us in reports that we file or submit under the Exchange Act is recorded, processed, summarized and reported within the time periods specified in the SEC’s rules and forms.
There were no changes in our internal control over financial reporting during the period covered by this Quarterly Report that have materially affected, or are reasonably likely to materially affect, our internal control over financial reporting.
None.
There have been no material changes in our risk factors from those included in our 2019 Annual Report.
Item 2: Unregistered Sales of Equity Securities and Use of Proceeds
None.
Item 3: Defaults upon Senior Securities
None.
Item 4: Mine Safety Disclosures
Not applicable.
None.
26
Exhibit Index
Exhibits
| 31.1 | Rule 13a-14(a) or Rule 15d-14(a) Certification of Principal Executive Officer | |
| 31.2 | Rule 13a-14(a) or Rule 15d-14(a) Certification of Principal Financial Officer | |
| 32.1 | Certification of Principal Executive Officer and Principal Financial Officer required by Rule 13a-14(b) or Rule 15d-14(b) and Section 1350 of Chapter 63 of Title 18 of the United States Code (18 U.S.C 1350). | |
| 101.INS
101.SCH
101.CAL
101.DEF
101.LAB |
XBRL Instance Document.
XBRL Taxonomy Extension Schema Document
XBRL Taxonomy Extension Calculation Linkbase Document
XBRL Taxonomy Extension Definition Linkbase Document
XBRL Taxonomy Extension Label Linkbase Document | |
| 101.PRE | XBRL Taxonomy Extension Presentation Linkbase Document | |
27
Pursuant to the requirements of the Securities Exchange Act of 1934, the Registrant has duly caused this Quarterly Report to be signed on its behalf by the undersigned, thereunto duly authorized.
| MEI Pharma, Inc. |
| /s/ Daniel P. Gold |
| Daniel P. Gold |
| President and Chief Executive Officer |
| Date: February 6, 2020 |
28