Attached files
| file | filename |
|---|---|
| EX-99.1 - EX-99.1 - MEDICAL PROPERTIES TRUST INC | d881788dex991.htm |
| 8-K - FORM 8-K - MEDICAL PROPERTIES TRUST INC | d881788d8k.htm |
Exhibit 99.2

Medical Properties Trust FOURTH QUARTER 2019 Supplemental Information

TABLE OF CONTENTS COMPANY OVERVIEW Company Information 3 FINANCIAL INFORMATION Reconciliation of Net Income to Funds from Operations 5 Debt Summary 6 Debt Maturity Schedule 7 Pro Forma Net Debt /Annualized Adjusted EBITDA 8 PORTFOLIO INFORMATION Lease and Loan Maturity Schedule 9 Total Pro Forma Gross Assets and Actual Revenue by Asset Type, Operator, State and Country 10 EBITDARM to Rent Coverage 13 Summary of Acquisitions and Development Projects 14 FINANCIAL STATEMENTS Consolidated Statements of Income 15 Consolidated Balance Sheets 16 Unconsolidated Joint Venture Investments 17 MEDICALPROPERTIESTRUST.COM FORWARD-LOOKING STATEMENT Forward-looking statements involve known and unknown risks, uncertainties and other factors that may cause the actual results of the Company or future events to differ materially from those expressed in or underlying such forward-looking statements, including without limitation: Normalized FFO per share; expected payout ratio, the amount of acquisitions of healthcare real estate, if any; estimated debt metrics, portfolio diversification, capital markets conditions, the repayment of debt arrangements; statements concerning the additional income to the Company as a result of ownership interests in certain hospital operations and the timing of such income; the payment of future dividends, if any; completion of additional debt arrangement, and additional investments; national and international economic, business, real estate and other market conditions; the competitive environment in which the Company operates; the execution of the Company’s business plan; financing risks; the Company’s ability to maintain its status as a REIT for federal income tax purposes; acquisition and development risks; potential environmental and other liabilities; and other factors affecting the real estate industry generally or healthcare real estate in particular. For further discussion of the factors that could affect outcomes, please refer to the “Risk Factors” section of the Company’s Annual Report on Form 10-K for the year ended December 31, 2018, and as updated by the Company’s subsequently filed Quarterly Reports on Form 10-Q and other SEC filings. Except as otherwise required by the federal securities laws, the Company undertakes no obligation to update the information in this report. Certain information in the supplemental package is shown pro forma for the consummation of pending transactions. The pro forma adjustments are based upon available information and assumptions that we believe are reasonable. There is no assurance that the pending transactions will occur. On the cover: Clinique Valmont, an acute care hospital in Switzerland owned by Infracore SA. MPT owns a minority interest in Infracore. On page 2: Clinique de Genolier, an acute care hospital in Switzerland owned by Infracore SA. Q4 2019 | SUPPLEMENTAL INFORMATION

COMPANY OVERVIEW Medical Properties Trust, Inc. is a self-advised real estate investment trust formed in 2003 to acquire and develop net-leased hospital facilities. From its inception in Birmingham, Alabama, the Company has grown to become one of the world’s largest owners of hospitals with 389 facilities and approximately 41,000 licensed beds in eight countries and across three continents. MPT’s financing model facilitates acquisitions and recapitalizations and allows operators of hospitals to unlock the value of their real estate assets to fund facility improvements, technology upgrades and other investments in operations. Edward K. Aldag, Jr. Chairman, President and Chief Executive Officer R. Steven Hamner Executive Vice President and Chief Financial Officer Emmett E. McLean Executive Vice President, Chief Operating Officer and Secretary J. Kevin Hanna Vice President, Controller and Chief Accounting Officer Rosa H. Hooper Vice President, Managing Director of Asset Management and Underwriting R. Lucas Savage Vice President, International Acquisitions Charles R. Lambert Treasurer and Managing Director of Capital Markets BOARD OF DIRECTORS Edward K. Aldag, Jr. G. Steven Dawson R. Steven Hamner Elizabeth N. Pitman D. Paul Sparks, Jr. Michael G. Stewart C. Reynolds Thompson, III CORPORATE HEADQUARTERS Medical Properties Trust, Inc. 1000 Urban Center Drive, Suite 501 Birmingham, AL 35242 (205) 969-3755 (205) 969-3756 (fax) www.medicalpropertiestrust.com MPT Officers: R. Steven Hamner, Emmett E. McLean, Edward K. Aldag, Jr., Rosa H. Hooper, J. Kevin Hanna and Charles R. Lambert. Not pictured: R. Lucas Savage. Q4 2019 | SUPPLEMENTAL INFORMATION 3

COMPANY OVERVIEW (continued) INVESTOR RELATIONS Tim Berryman Director of Investor Relations (205) 397-8589 tberryman@medicalpropertiestrust.com CAPITAL MARKETS Charles Lambert Treasurer and Managing Director of Capital Markets (205) 397-8897 clambert@medicalpropertiestrust.com TRANSFER AGENT American Stock Transfer and Trust Company 6201 15th Avenue Brooklyn, NY 11219 STOCK EXCHANGE LISTING AND TRADING SYMBOL New York Stock Exchange (NYSE): MPW SENIOR UNSECURED DEBT RATINGS Moody’s – Ba1 Standard & Poor’s – BBB- Q4 Above: Clinique de Valère, an acute care hospital in Switzerland owned by Infracore SA. MEDICALPROPERTIESTRUST.COM Q4 2019 | SUPPLEMENTAL INFORMATION 4

FINANCIAL INFORMATION RECONCILIATION OF NET INCOME TO FUNDS FROM OPERATIONS (Unaudited) (Amounts in thousands, except per share data) December 31, 2019 December 31, 2018 December 31, 2019 December 31, 2018 FFO INFORMATION: Net income attributable to MPT common stockholders $ 129,638 $ 78,483 $ 374,684 $ 1,016,685 Participating securities’ share in earnings (954) (2,877) (2,308) (3,685) Net income, less participating securities’ share in earnings $ 128,684 $ 75,606 $ 372,376 $ 1,013,000 Depreciation and amortization 53,497 39,406 183,921 143,720 (Gain) loss on sale of real estate and other, net (20,467) 1,437 (20,529) (671,385) Funds from operations $ 161,714 $ 116,449 $ 535,768 $ 485,335 Write-off of straight-line rent and other, net of tax benefit 8,307 387 15,539 18,002 Unutilized financing fees 1,233 — 6,106 — Release of income tax valuation allowance — (4,405) — (4,405) Acquisition costs, net of tax benefit — — — 2,072 Normalized funds from operations Share-based compensation 10,069 4,810 32,188 16,505 Debt costs amortization 2,761 1,991 9,675 7,534 Straight-line rent revenue and other (48,836) (30,528) (145,598) (105,072) Adjusted funds from operations $ 135,248 $ 88,704 $ 453,678 $ 419,971 PER DILUTED SHARE DATA: Net income, less participating securities’ share in earnings $ 0.26 $ 0.21 $ 0.87 $ 2.76 Depreciation and amortization 0.11 0.11 0.43 0.39 (Gain) loss on sale of real estate and other, net (0.04) — (0.05) (1.83) Funds from operations $ 0.33 $ 0.32 $ 1.25 $ 1.32 Write-off of straight-line rent and other, net of tax benefit 0.02 — 0.04 0.05 Unutilized financing fees — — 0.01 — Release of income tax valuation allowance — (0.01) — (0.01) Acquisition costs, net of tax benefit — — — 0.01 Normalized funds from operations Share-based compensation 0.02 0.01 0.08 0.05 Debt costs amortization 0.01 0.01 0.02 0.02 Straight-line rent revenue and other (0.11) (0.09) (0.34) (0.29) Adjusted funds from operations $ 0.27 $ 0.24 $ 1.06 $ 1.15 Notes: (A) Certain line items above (such as real estate depreciation) include our share of such income/expense from unconsolidated joint ventures. These amounts are included with the activity of all of our equity interests in the “Earnings from equity interests” line on the consolidated statements of income. (B) Investors and analysts following the real estate industry utilize funds from operations, or FFO, as a supplemental performance measure. FFO, reflecting the assumption that real estate asset values rise or fall with market conditions, principally adjusts for the effects of GAAP depreciation and amortization of real estate assets, which assumes that the value of real estate diminishes predictably over time. We compute FFO in accordance with the definition provided by the National Association of Real Estate Investment Trusts, or NAREIT, which represents net income (loss) (computed in accordance with GAAP), excluding gains (losses) on sales of real estate and impairment charges on real estate assets, plus real estate depreciation and amortization and after adjustments for unconsolidated partnerships and joint ventures. In addition to presenting FFO in accordance with the NAREIT definition, we also disclose normalized FFO, which adjusts FFO for items that relate to unanticipated or non-core events or activities or accounting changes that, if not noted, would make comparison to prior period results and market expectations less meaningful to investors and analysts. We believe that the use of FFO, combined with the required GAAP presentations, improves the understanding of our operating results among investors and the use of normalized FFO makes comparisons of our operating results with prior periods and other companies more meaningful. While FFO and normalized FFO are relevant and widely used supplemental measures of operating and financial performance of REITs, they should not be viewed as a substitute measure of our operating performance since the measures do not reflect either depreciation and amortization costs or the level of capital expenditures and leasing costs necessary to maintain the operating performance of our properties, which can be significant economic costs that could materially impact our results of operations. FFO and normalized FFO should not be considered an alternative to net income (loss) (computed in accordance with GAAP) as indicators of our financial performance or to cash flow from operating activities (computed in accordance with GAAP) as an indicator of our liquidity. We calculate adjusted funds from operations, or AFFO, by subtracting from or adding to normalized FFO (i) non-cash revenue, (ii) non-cash share-based compensation expense, and (iii) amortization of deferred financing costs. AFFO is an operating measurement that we use to analyze our results of operations based on the receipt, rather than the accrual, of our rental revenue and on certain other adjustments. We believe that this is an important measurement because our leases generally have significant contractual escalations of base rents and therefore result in recognition of rental income that is not collected until future periods, and costs that are deferred or are non-cash charges. Our calculation of AFFO may not be comparable to AFFO or similarly titled measures reported by other REITs. AFFO should not be considered as an alternative to net income (calculated pursuant to GAAP) as an indicator of our results of operations or to cash flow from operating activities (calculated pursuant to GAAP) as an indicator of our liquidity. Q4 2019 | SUPPLEMENTAL INFORMATION 5
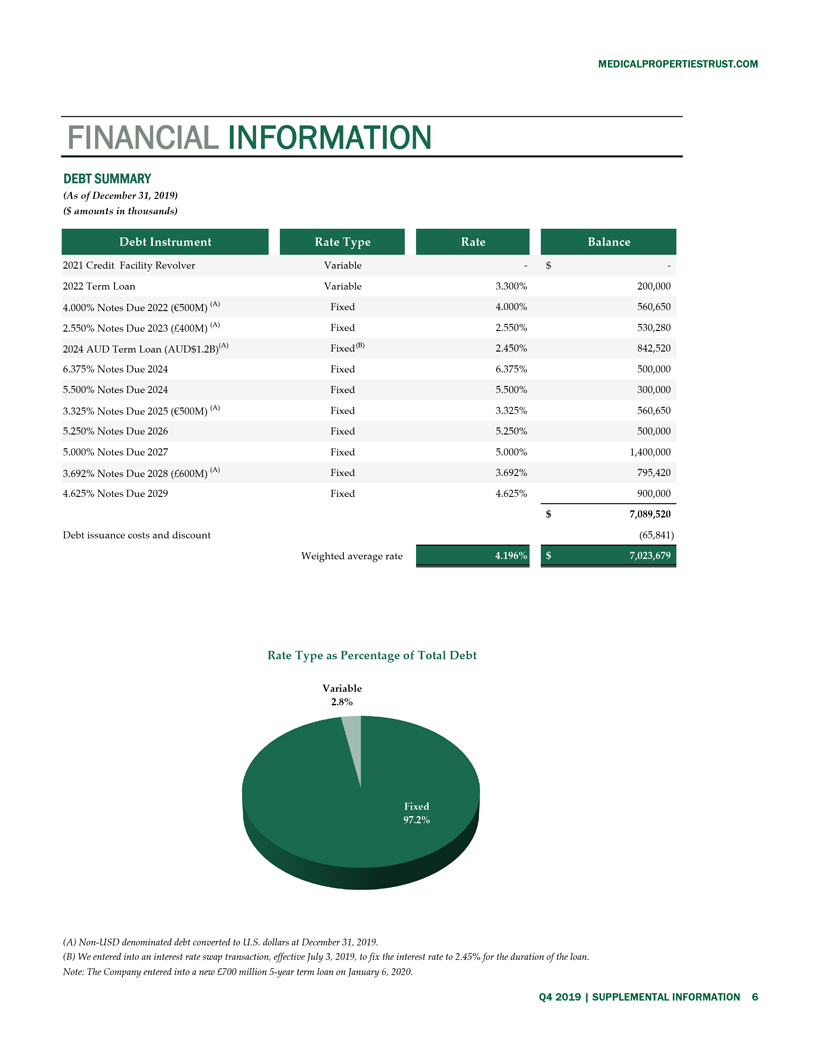
FINANCIAL INFORMATION DEBT SUMMARY (As of December 31, 2019) ($ amounts in thousands) Rate Type RateBalance
2021 Credit Facility Revolver Variable — $ — 2022 Term Loan Variable 3.300% 200,000 4.000% Notes Due 2022 (€500M) (A) Fixed 4.000% 560,650 2.550% Notes Due 2023 (£400M) (A) Fixed 2.550% 530,280 2024 AUD Term Loan (AUD$1.2B)(A) Fixed 2.450% 842,520 6.375% Notes Due 2024 Fixed 6.375% 500,000 5.500% Notes Due 2024 Fixed 5.500% 300,000 3.325% Notes Due 2025 (€500M) (A) Fixed 3.325% 560,650 5.250% Notes Due 2026 Fixed 5.250% 500,000 5.000% Notes Due 2027 Fixed 5.000% 1,400,000 3.692% Notes Due 2028 (£600M) (A) Fixed 3.692% 795,420 4.625% Notes Due 2029 Fixed 4.625% 900,000 $ 7,089,520 Debt issuance costs and discount (65,841) Weighted average rate Rate Type as Percentage of Total Debt Variable 2.8% (A) Non-USD denominated debt converted to U.S. dollars at December 31, 2019. (B) We entered into an interest rate swap transaction, effective July 3, 2019, to fix the interest rate to 2.45% for the duration of the loan. Note: The Company entered into a new £700 million 5-year term loan on January 6, 2020.
FINANCIAL INFORMATION
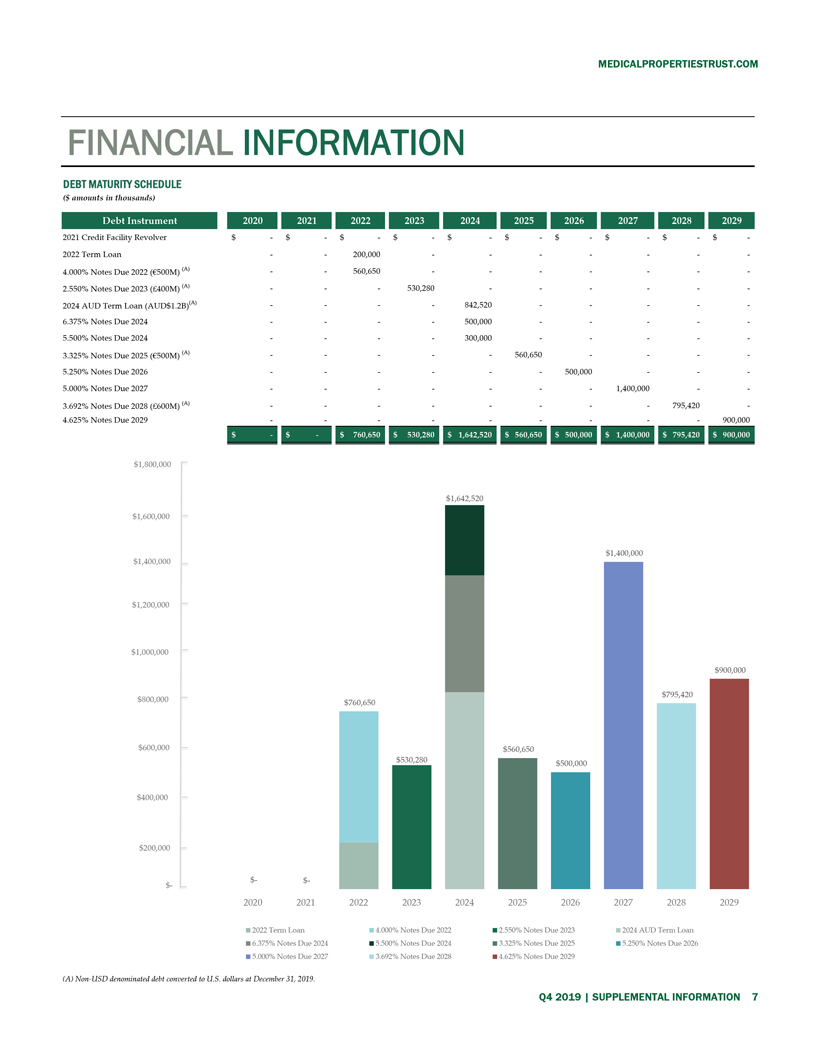
DEBT MATURITY SCHEDULE ($ amounts in thousands)
| 2021 Credit Facility Revolver |
$ |
— |
|
$ |
— |
|
$ |
— |
|
$ |
— |
|
$ |
— |
|
$ |
— |
|
$ |
— |
|
$ |
— |
|
$ |
— |
|
$ |
— |
| ||||||||||
| 2022 Term Loan |
|
— |
|
|
— |
|
|
200,000 |
|
|
— |
|
|
— |
|
|
— |
|
|
— |
|
|
— |
|
|
— |
|
|
— |
| ||||||||||
| 4.000% Notes Due 2022 (€500M) (A) |
|
— |
|
|
— |
|
|
560,650 |
|
|
— |
|
|
— |
|
|
— |
|
|
— |
|
|
— |
|
|
— |
|
|
— |
| ||||||||||
| 2.550% Notes Due 2023 (£400M) (A) |
|
— |
|
|
— |
|
|
— |
|
|
530,280 |
|
|
— |
|
|
— |
|
|
— |
|
|
— |
|
|
— |
|
|
— |
| ||||||||||
| 2024 AUD Term Loan (AUD$1.2B)(A) |
|
— |
|
|
— |
|
|
— |
|
|
— |
|
|
842,520 |
|
|
— |
|
|
— |
|
|
— |
|
|
— |
|
|
— |
| ||||||||||
| 6.375% Notes Due 2024 |
|
— |
|
|
— |
|
|
— |
|
|
— |
|
|
500,000 |
|
|
— |
|
|
— |
|
|
— |
|
|
— |
|
|
— |
| ||||||||||
| 5.500% Notes Due 2024 |
|
— |
|
|
— |
|
|
— |
|
|
— |
|
|
300,000 |
|
|
— |
|
|
— |
|
|
— |
|
|
— |
|
|
— |
| ||||||||||
| 3.325% Notes Due 2025 (€500M) (A) |
|
— |
|
|
— |
|
|
— |
|
|
— |
|
|
— |
|
|
560,650 |
|
|
— |
|
|
— |
|
|
— |
|
|
— |
| ||||||||||
| 5.250% Notes Due 2026 |
|
— |
|
|
— |
|
|
— |
|
|
— |
|
|
— |
|
|
— |
|
|
500,000 |
|
|
— |
|
|
— |
|
|
— |
| ||||||||||
| 5.000% Notes Due 2027 |
|
— |
|
|
— |
|
|
— |
|
|
— |
|
|
— |
|
|
— |
|
|
— |
|
|
1,400,000 |
|
|
— |
|
|
— |
| ||||||||||
| 3.692% Notes Due 2028 (£600M) (A) |
|
— |
|
|
— |
|
|
— |
|
|
— |
|
|
— |
|
|
— |
|
|
— |
|
|
— |
|
|
795,420 |
|
|
— |
| ||||||||||
| 4.625% Notes Due 2029 |
|
— |
|
|
— |
|
|
— |
|
|
— |
|
|
— |
|
|
— |
|
|
— |
|
|
— |
|
|
— |
|
|
900,000 |
| ||||||||||
(A) Non-USD denominated debt converted to U.S. dollars at December 31, 2019.
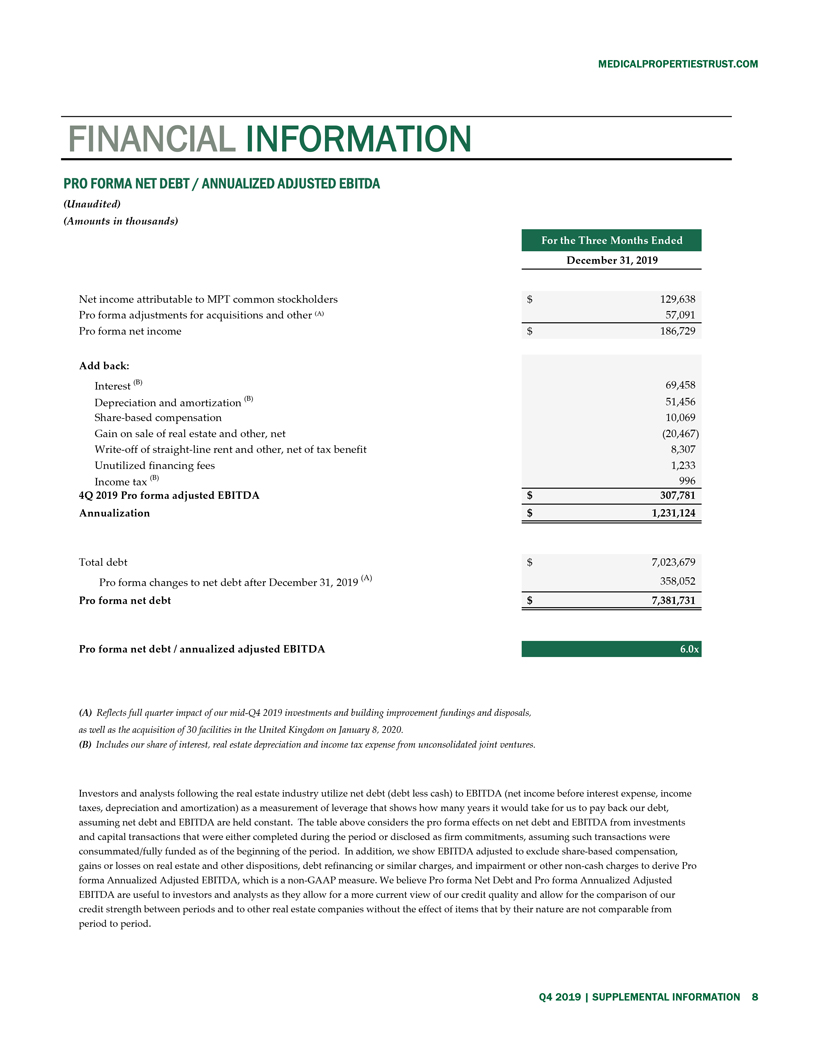
MEDICALPROPERTIESTRUST.COMFINANCIAL INFORMATION PRO FORMA NET DEBT / ANNUALIZED ADJUSTED EBITDA (Unaudited) (Amounts in thousands) December 31, 2019 Net income attributable to MPT common stockholders $ 129,638 Pro forma adjustments for acquisitions and other â½á´¬â¾ 57,091 Pro forma net income $ 186,729 Add back: Interest (B) 69,458 Depreciation and amortization (B) 51,456 Share-based compensation 10,069 Gain on sale of real estate and other, net (20,467) Impairment and other charges Write-off of straight-line rent and other, net of tax benefit 8,307 Unutilized financing fees 1,233 Income tax (B) 996 4Q 2019 Pro forma adjusted EBITDA $ 307,781 Annualization $ 1,231,124 Total debt $ 7,023,679 Pro forma changes to net debt after December 31, 2019 (A) 358,052 Pro forma net debt $ 7,381,731 Pro forma net debt / annualized adjusted EBITDA (A) Reflects full quarter impact of our mid-Q4 2019 investments and building improvement fundings and disposals, as well as the acquisition of 30 facilities in the United Kingdom on January 8, 2020. (B) Includes our share of interest, real estate depreciation and income tax expense from unconsolidated joint ventures. Investors and analysts following the real estate industry utilize net debt (debt less cash) to EBITDA (net income before interest expense, income taxes, depreciation and amortization) as a measurement of leverage that shows how many years it would take for us to pay back our debt, assuming net debt and EBITDA are held constant. The table above considers the pro forma effects on net debt and EBITDA from investments and capital transactions that were either completed during the period or disclosed as firm commitments, assuming such transactions were consummated/fully funded as of the beginning of the period. In addition, we show EBITDA adjusted to exclude share-based compensation, gains or losses on real estate and other dispositions, debt refinancing or similar charges, and impairment or other non-cash charges to derive Pro forma Annualized Adjusted EBITDA, which is a non-GAAP measure. We believe Pro forma Net Debt and Pro forma Annualized Adjusted EBITDA are useful to investors and analysts as they allow for a more current view of our credit quality and allow for the comparison of our credit strength between periods and to other real estate companies without the effect of items that by their nature are not comparable from period to period.Q4 2019 | SUPPLEMENTAL INFORMATION 8
PORTFOLIO INFORMATION
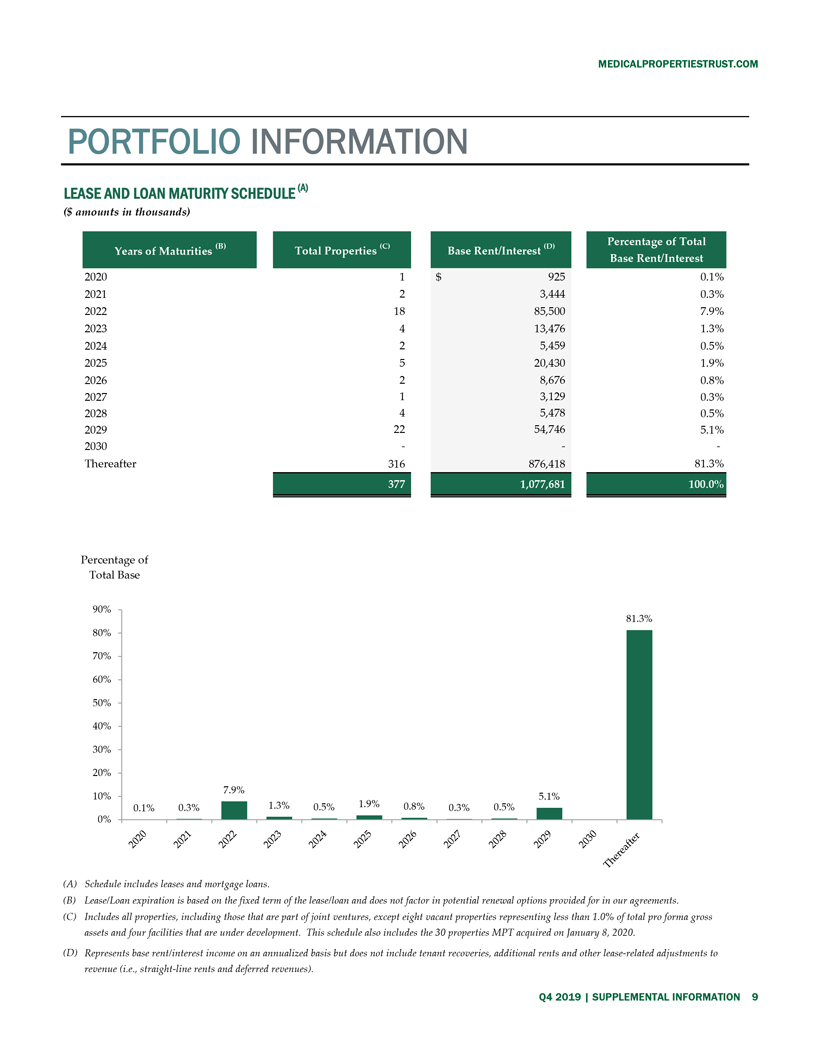
LEASE AND LOAN MATURITY SCHEDULE (A)
($ amounts in thousands)
2020
1
$ 925
0.1%
2021
2
3,444
0.3%
2022
18
85,500
7.9%
2023
4
13,476
1.3%
2024
2
5,459
0.5%
2025
5
20,430
1.9%
2026
2
8,676
0.8%
2027
1
3,129
0.3%
2028
4
5,478
0.5%
2029
22
54,746
5.1%
2030
—
—
—
Thereafter
316
876,418
81.3%
Percentage of Total Base Rent/Interest
(A) Schedule includes leases and mortgage loans.
(B) Lease/Loan expiration is based on the fixed term of the lease/loan and does not factor in potential renewal options provided for in our agreements.
(C) Includes all properties, including those that are part of joint ventures, except eight vacant properties representing less than 1.0% of total pro forma gross assets and four facilities that are under development. This schedule also includes the 30 properties MPT acquired on January 8, 2020.
(D) Represents base rent/interest income on an annualized basis but does not include tenant recoveries, additional rents and other lease-related adjustments to revenue (i.e., straight-line rents and deferred revenues).
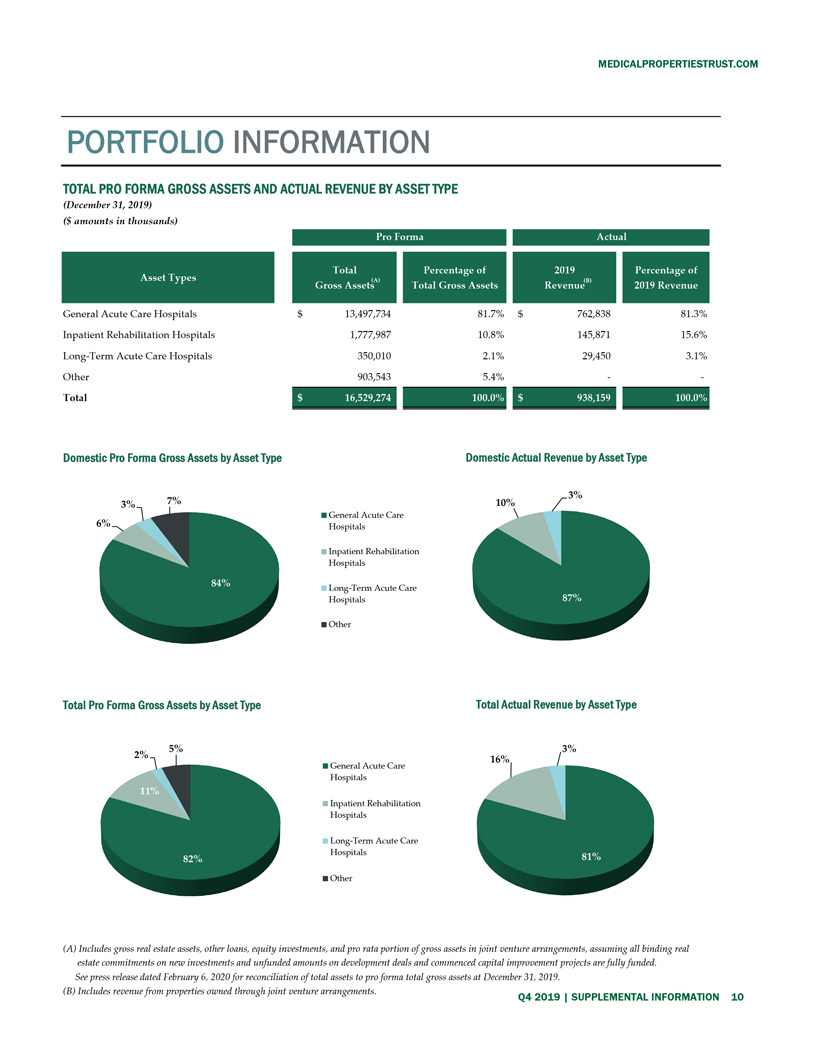
10 PORTFOLIO INFORMATION TOTAL PRO FORMA GROSS ASSETS AND ACTUAL REVENUE BY ASSET TYPE (December 31, 2019) ($ amounts in thousands) General Acute Care Hospitals $ 13,497,734 81.7% $ 762,838 81.3% Inpatient Rehabilitation Hospitals 1,777,987 10.8% 145,871 15.6% Long-Term Acute Care Hospitals 350,010 2.1% 29,450 3.1% Other 903,543 5.4% — — Total Domestic Pro Forma Gross Assets by Asset Type Domestic Actual Revenue by Asset Type Total Pro Forma Gross Assets by Asset Type Total Actual Revenue by Asset Type (A) Includes gross real estate assets, other loans, equity investments, and pro rata portion of gross assets in joint venture arrangements, assuming all binding real estate commitments on new investments and unfunded amounts on development deals and commenced capital improvement projects are fully funded. See press release dated February 6, 2020 for reconciliation of total assets to pro forma total gross assets at December 31, 2019. (B) Includes revenue from properties owned through joint venture arrangements. Q4 2019 | SUPPLEMENTAL INFORMATION 10 MEDICALPROPERTIESTRUST.COM
MEDICALPROPERTIESTRUST.COM
PORTFOLIO INFORMATION
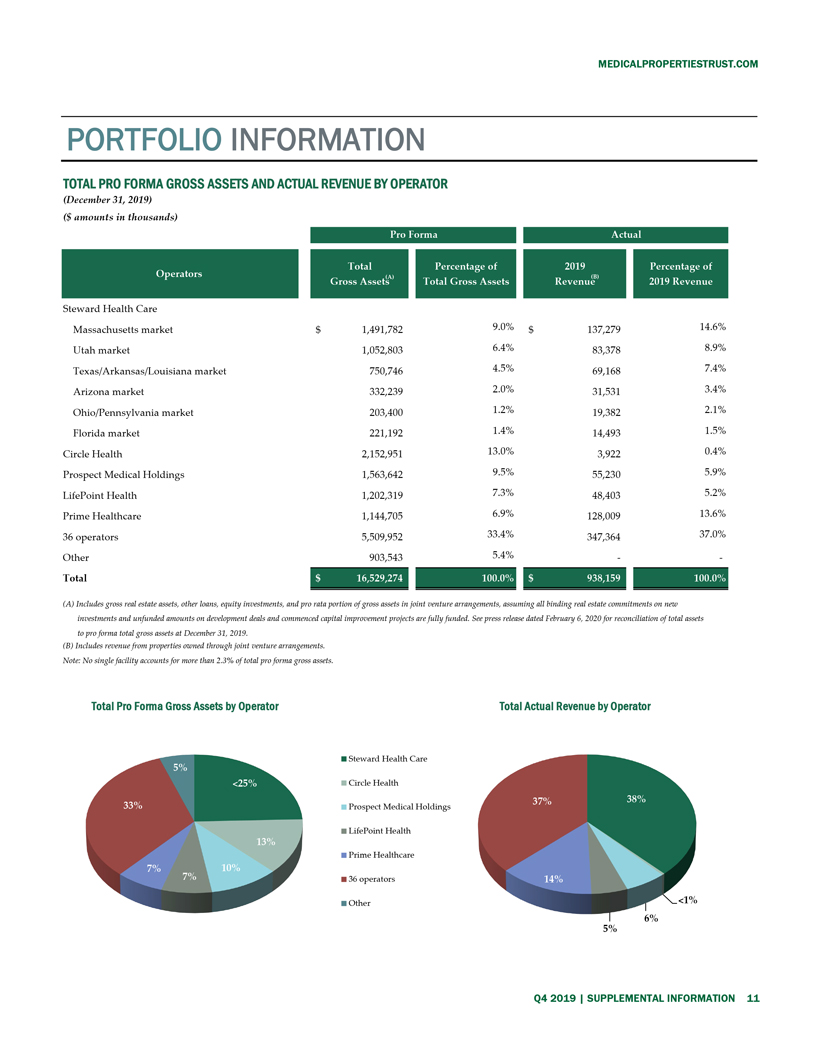
TOTAL PRO FORMA GROSS ASSETS AND ACTUAL REVENUE BY OPERATOR
(December 31, 2019)
($ amounts in thousands)
Steward Health Care
Massachusetts market
$ 1,491,782
9.0%
$ 137,279
14.6%
Utah market
1,052,803
6.4%
83,378
8.9%
Texas/Arkansas/Louisiana market
750,746
4.5%
69,168
7.4%
Arizona market
332,239
2.0%
31,531
3.4%
Ohio/Pennsylvania market
203,400
1.2%
19,382
2.1%
Florida market
221,192
1.4%
14,493
1.5%
Circle Health
2,152,951
13.0%
3,922
0.4%
Prospect Medical Holdings
1,563,642
9.5%
55,230
5.9%
LifePoint Health
1,202,319
7.3%
48,403
5.2%
Prime Healthcare
1,144,705
6.9%
128,009
13.6%
36 operators
5,509,952
33.4%
347,364
37.0%
Other
903,543
5.4%
—
—
Total
(A) Includes gross real estate assets, other loans, equity investments, and pro rata portion of gross assets in joint venture arrangements, assuming all binding real estate commitments on new investments and unfunded amounts on development deals and commenced capital improvement projects are fully funded. See press release dated February 6, 2020 for reconciliation of total assets to pro forma total gross assets at December 31, 2019.
(B) Includes revenue from properties owned through joint venture arrangements.
Note: No single facility accounts for more than 2.3% of total pro forma gross assets.
Total Pro Forma Gross Assets by Operator
Total Actual Revenue by Operator
Q4 2019 SUPPLEMENTAL INFORMATION 11
MEDICALPROPERTIESTRUST.COM
Q4 2019 | SUPPLEMENTAL INFORMATION 12
PORTFOLIO INFORMATION
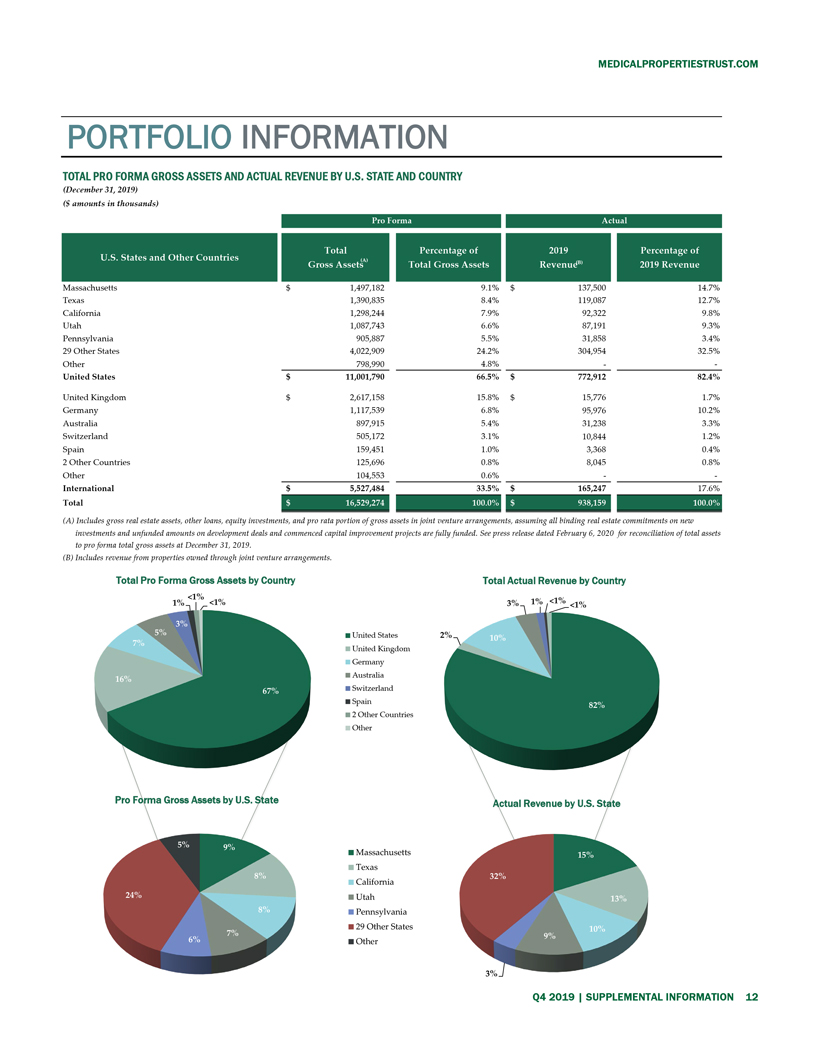
TOTAL PRO FORMA GROSS ASSETS AND ACTUAL REVENUE BY U.S. STATE AND COUNTRY
(December 31, 2019)
($ amounts in thousands)
| Massachusetts |
$ |
1,497,182 |
|
|
9.1 |
% |
$ |
|
|
|
14.7 |
% | ||||
| Texas |
|
1,390,835 |
|
|
8.4 |
% |
|
119,087 |
|
|
12.7 |
% | ||||
| California |
|
1,298,244 |
|
|
7.9 |
% |
|
92,322 |
|
|
9.8 |
% | ||||
| Utah |
|
1,087,743 |
|
|
6.6 |
% |
|
87,191 |
|
|
9.3 |
% | ||||
| Pennsylvania |
|
905,887 |
|
|
5.5 |
% |
|
31,858 |
|
|
3.4 |
% | ||||
| 29 Other States |
|
4,022,909 |
|
|
24.2 |
% |
|
304,954 |
|
|
32.5 |
% | ||||
| Other |
|
798,990 |
|
|
4.8 |
% |
|
— |
|
|
— |
| ||||
| United States |
$ |
|
|
|
66.5 |
% |
$ |
|
|
|
82.4 |
% | ||||
| United Kingdom |
$ |
2,617,158 |
|
|
15.8 |
% |
$ |
15,776 |
|
|
1.7 |
% | ||||
| Germany |
|
1,117,539 |
|
|
6.8 |
% |
|
95,976 |
|
|
10.2 |
% | ||||
| Australia |
|
897,915 |
|
|
5.4 |
% |
|
31,238 |
|
|
3.3 |
% | ||||
| Switzerland |
|
505,172 |
|
|
3.1 |
% |
|
10,844 |
|
|
1.2 |
% | ||||
| Spain |
|
159,451 |
|
|
1.0 |
% |
|
3,368 |
|
|
0.4 |
% | ||||
| 2 Other Countries |
|
125,696 |
|
|
0.8 |
% |
|
8,045 |
|
|
0.8 |
% | ||||
| Other |
|
104,553 |
|
|
0.6 |
% |
|
— |
|
|
— |
| ||||
| International |
$ |
5,527,484 |
|
|
33.5 |
% |
$ |
165,247 |
|
|
17.6 |
% | ||||
| Total |
||||||||||||||||
(A) Includes gross real estate assets, other loans, equity investments, and pro rata portion of gross assets in joint venture arrangements, assuming all binding real estate commitments on new
investments and unfunded amounts on development deals and commenced capital improvement projects are fully funded. See press release dated February 6, 2020 for reconciliation of total assets to pro forma total gross assets at December 31, 2019.
(B) Includes revenue from properties owned through joint venture arrangements.
| Total Pro Forma Gross Assets by Country |
|
Total |
|
PORTFOLIO INFORMATION
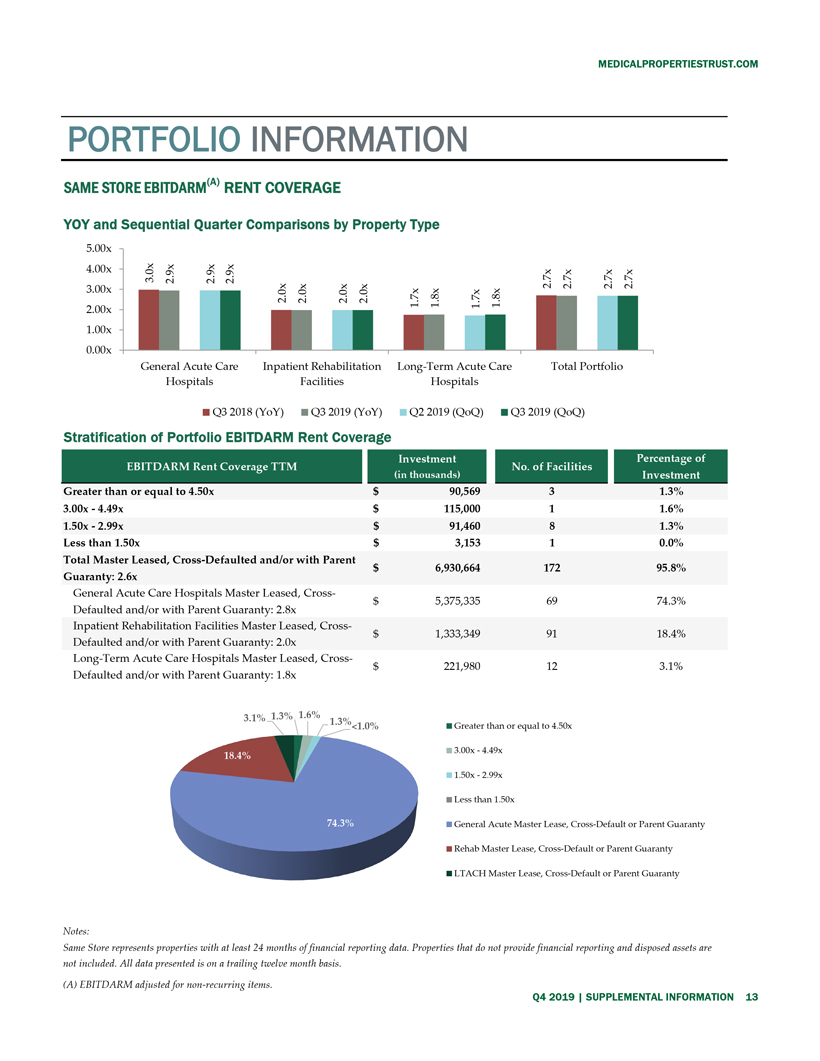
SAME STORE EBITDARM(A) RENT COVERAGE
YOY and Sequential Quarter Comparisons by Property Type
Stratification of Portfolio EBITDARM Rent Coverage
Greater than or equal to 4.50x
$ 90,569
3
1.3%
3.00x—4.49x
$ 115,000
1
1.6%
1.50x—2.99x
$ 91,460
8
1.3%
Less than 1.50x
$ 3,153
1
0.0%
Total Master Leased, Cross-Defaulted and/or with Parent Guaranty: 2.6x
$ 6,930,664
172
95.8%
General Acute Care Hospitals Master Leased, Cross-Defaulted and/or with Parent Guaranty: 2.8x
$ 5,375,335
69
74.3%
Inpatient Rehabilitation Facilities Master Leased, Cross-Defaulted and/or with Parent Guaranty: 2.0x
$ 1,333,349
91
18.4%
Long-Term Acute Care Hospitals Master Leased, Cross-Defaulted and/or with Parent Guaranty: 1.8x
$ 221,980
12
3.1%
Notes:
Same Store represents properties with at least 24 months of financial reporting data. Properties that do not provide financial reporting and disposed assets are not included. All data presented is on a trailing twelve month basis.
(A) EBITDARM adjusted for non-recurring items.

MEDICALPROPERTIESTRUST.COM
PORTFOLIO INFORMATION
SUMMARY OF COMPLETED ACQUISITIONS / DEVELOPMENT PROJECTS FOR THE TWELVE MONTHS ENDED DECEMBER 31, 2019
(Amounts in thousands)
MEDIAN
Germany
$ 6,064
2/10/2019
Acquisition
BMI Healthcare
United Kingdom
45,124
4/3/2019
Acquisition
Steward Health Care
Texas
26,000
4/12/2019
Acquisition
Swiss Medical Network
Switzerland
283,844
5/27/2019
Acquisition
Healthscope
Australia
846,431
6/7/2019
Acquisition
Saint Luke’s Health System
Kansas
145,371
6/10/2019
Acquisition
Ramsay Health Care
United Kingdom
422,816
8/16/2019
Acquisition
Prospect Medical Holdings
California, Connecticut & Pennsylvania
1,550,000
8/23/2019
Acquisition
Vibra Healthcare
U.S.—Various
268,400
8/30/2019
Acquisition
Halsen Healthcare
California
55,000
9/30/2019
Acquisition
José de Mello
Portugal
31,200
11/28/2019
Acquisition
HM Hospitales
Spain
130,000
12/3/2019
Acquisition
LifePoint Health
U.S.—Various
700,000
12/17/2019
Acquisition
SUMMARY OF CURRENT INVESTMENT COMMITMENTS AS OF DECEMBER 31, 2019
(Amounts in thousands)
Circle Health
United Kingdom
$ 1,950,000
Acquisition
SUMMARY OF CURRENT DEVELOPMENT PROJECTS AS OF DECEMBER 31, 2019
(Amounts in thousands)
Circle Health
United Kingdom
$ 47,532
$ 41,920
Q2 2020
Circle Health Rehabilitation
United Kingdom
21,427
17,385
Q2 2020
Surgery Partners
Idaho
113,468
96,639
Q1 2020
NeuroPsychiatric Hospitals
Texas
27,500
12,268
Q4 2020
(A) Excludes transaction costs, including real estate transfer and other taxes.
(B) Reflects our acquisition of a minority interest in Infracore SA and a 4.9% stake in Aevis.
(C) Reflects our acquisition of a 45% interest in real estate joint ventures.
(D) The Circle transaction was completed on January 8, 2020, for £1.5 billion.
(E) Represents £35.9 million commitment converted to USD at December 31, 2019.
(F) Represents £16.2 million commitment converted to USD at December 31, 2019.
Q4 2019 SUPPLEMENTAL INFORMATION
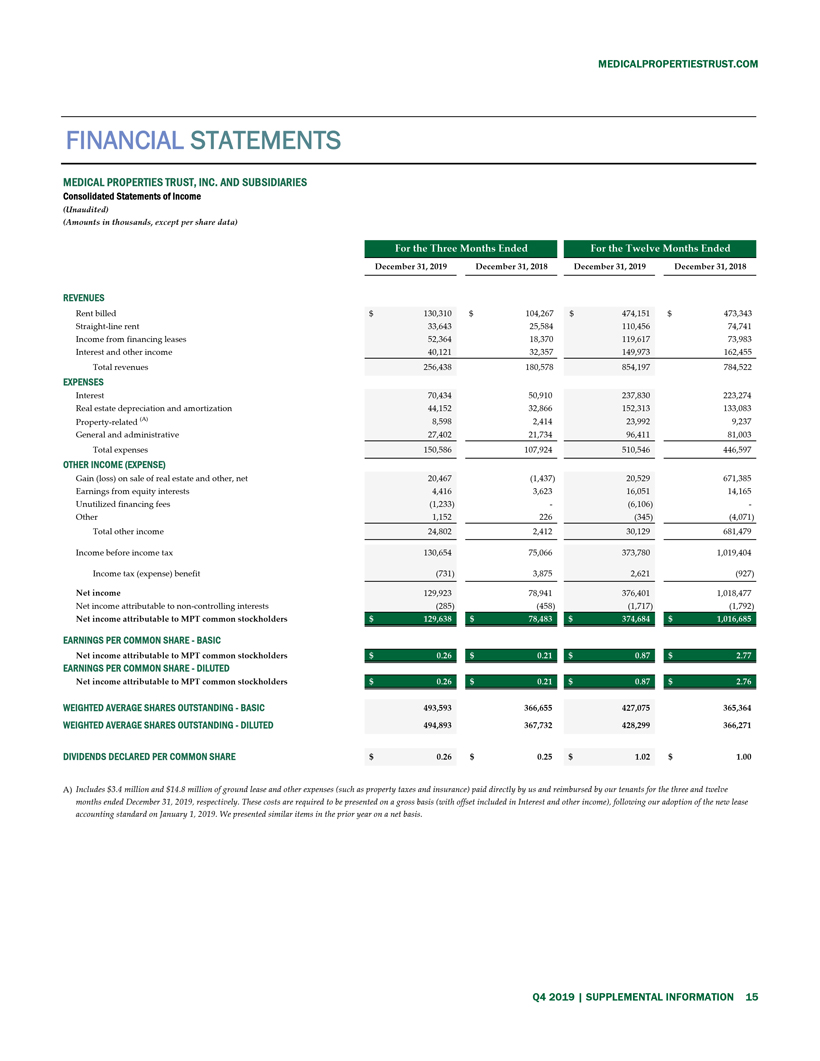
FINANCIAL STATEMENTS MEDICAL PROPERTIES TRUST, INC. AND SUBSIDIARIES Consolidated Statements ofIncome (Unaudited) (Amounts in thousands, except per share data) December 31, 2019 December 31, 2018 December 31,2019 December 31, 2018 REVENUES Rent billed $ 130,310 $ 104,267 $ 474,151 $ 473,343
Straight-line rent
33,643
25,584
110,456
74,741
Income from financing leases
52,364
18,370
119,617
73,983
Interest and other income
40,121
32,357
149,973
162,455
Total revenues
256,438
180,578
854,197
784,522
EXPENSES
Interest
70,434
50,910
237,830
223,274
Real estate depreciation and amortization
44,152
32,866
152,313
133,083
Property-related (A)
8,598
2,414
23,992
9,237
General and administrative
27,402
21,734
96,411
81,003
Total expenses
150,586
107,924
510,546
446,597
OTHER INCOME (EXPENSE) Gain (loss) on sale of real estate and other, net
20,467
(1,437)
20,529
671,385
Earnings from equity interests
4,416
3,623
16,051
14,165
Unutilized financing fees
(1,233)
—
(6,106)
—
Other
1,152
226
(345)
(4,071)
Total other income
24,802
2,412
30,129
681,479
Income before income tax
130,654
75,066
373,780
1,019,404
Income tax (expense) benefit
(731)
3,875
2,621
(927)
Net income
129,923
78,941
376,401
1,018,477
Net income attributable to non-controlling interests
(285)
(458)
(1,717)
(1,792)
Net income attributable to MPT common stockholders
EARNINGS PER COMMON SHARE—BASIC
Net income attributable to MPT common stockholders
EARNINGS PER COMMON SHARE—DILUTED
Net income attributable to MPT common stockholders
WEIGHTED AVERAGE SHARES OUTSTANDING—BASIC
493,593
366,655
427,075
365,364
WEIGHTED AVERAGE SHARES OUTSTANDING—DILUTED
494,893
367,732
428,299
366,271
DIVIDENDS DECLARED PER COMMON SHARE
$ 0.26
$ 0.25
$ 1.02
$ 1.00 A) Includes $3.4 million and $14.8 million of ground lease and other expenses (such as property taxes and insurance) paid directly by us and reimbursed by our tenants for the three and twelve months ended December 31, 2019, respectively. These costs are required to be presented on a gross basis (with offset included in Interest and other income), following our adoption of the new lease accounting standard on January 1, 2019. We presented similar items in the prior year on a net basis.
MEDICALPROPERTIESTRUST.COM
FINANCIAL STATEMENTS
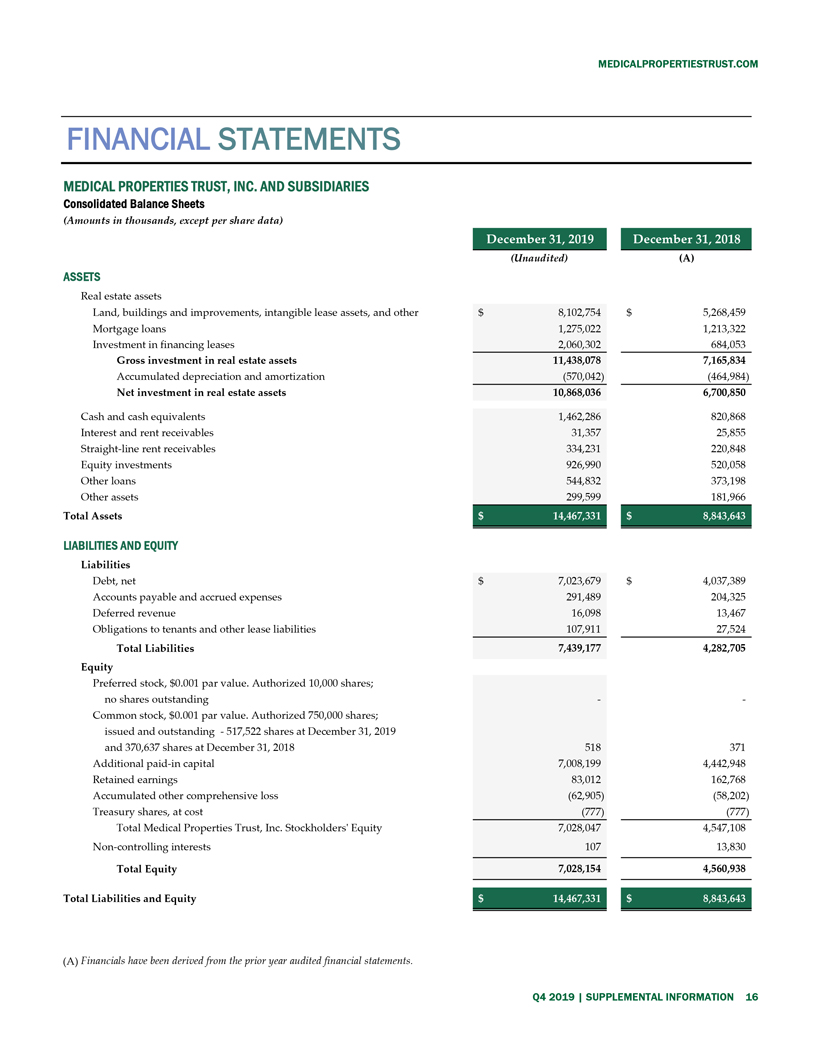
MEDICAL PROPERTIES TRUST, INC. AND SUBSIDIARIES
Consolidated Balance Sheets
(Amounts in thousands, except per share data)
(Unaudited)
(A)
ASSETS
Real estate assets
Land, buildings and improvements, intangible lease assets, and other
$ 8,102,754
$ 5,268,459
Mortgage loans
1,275,022
1,213,322
Investment in financing leases
2,060,302
684,053
Gross investment in real estate assets
11,438,078
7,165,834
Accumulated depreciation and amortization
(570,042)
(464,984)
Net investment in real estate assets
10,868,036
6,700,850
Cash and cash equivalents
1,462,286
820,868
Interest and rent receivables
31,357
25,855
Straight-line rent receivables
334,231
220,848
Equity investments
926,990
520,058
Other loans
544,832
373,198
Other assets
299,599
181,966
Total Assets
LIABILITIES AND EQUITY
Liabilities
Debt, net
$ 7,023,679
$ 4,037,389
Accounts payable and accrued expenses
291,489
204,325
Deferred revenue
16,098
13,467
Obligations to tenants and other lease liabilities
107,911
27,524
Total Liabilities
7,439,177
4,282,705
Equity
Preferred stock, $0.001 par value. Authorized 10,000 shares;
no shares outstanding
—
—
Common stock, $0.001 par value. Authorized 750,000 shares;
issued and outstanding —517,522 shares at December 31, 2019
and 370,637 shares at December 31, 2018
518
371
Additional paid-in capital
7,008,199
4,442,948
Retained earnings
83,012
162,768
Accumulated other comprehensive loss
(62,905)
(58,202)
Treasury shares, at cost
(777)
(777)
Total Medical Properties Trust, Inc. Stockholders’ Equity
7,028,047
4,547,108
Non-controlling interests
107
13,830
Total Equity
7,028,154
4,560,938
Total Liabilities and Equity
(A) Financials have been derived from the prior year audited financial statements.
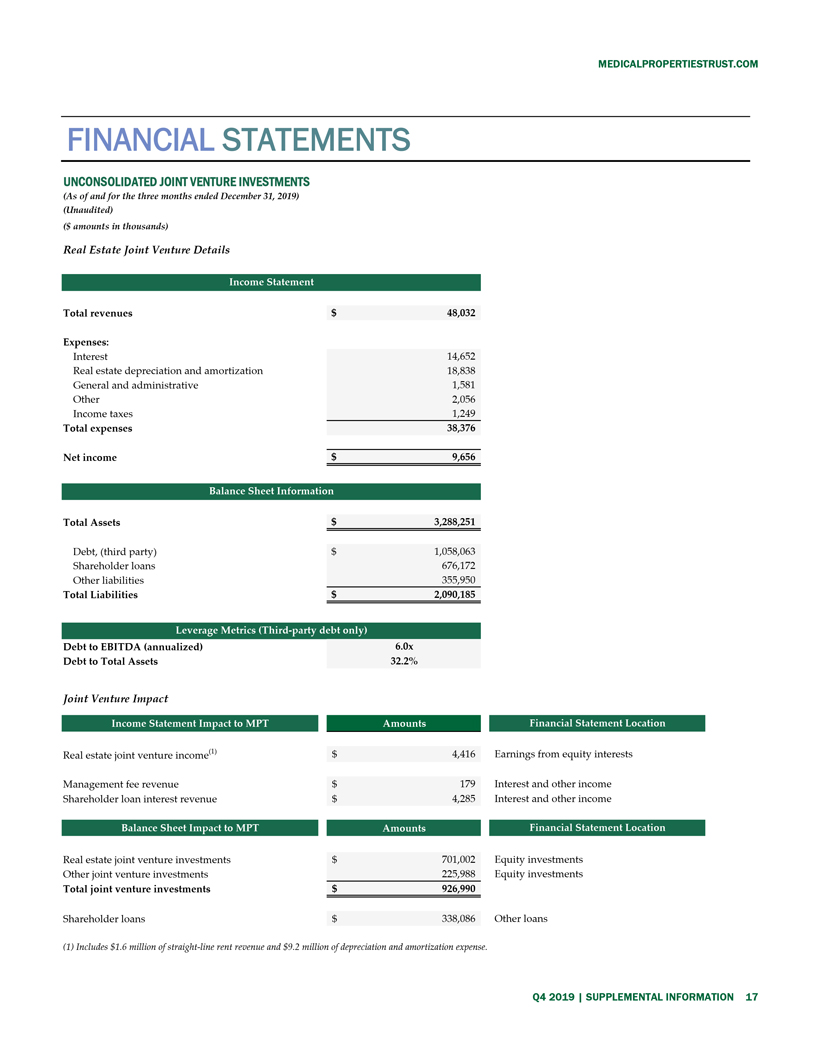
FINANCIAL STATEMENTS
UNCONSOLIDATED JOINT VENTURE INVESTMENTS
(As of and for the three months ended December 31, 2019)
(Unaudited)
($ amounts in thousands)
Real Estate Joint Venture Details
Total revenues
$ 48,032
Expenses:
Interest
14,652
Real estate depreciation and amortization
18,838
General and administrative
1,581
Other
2,056
Income taxes
1,249
Total expenses
38,376
Net income
$ 9,656
Total Assets
$ 3,288,251
Debt, (third party)
$ 1,058,063
Shareholder loans
676,172
Other liabilities
355,950
Total Liabilities
$ 2,090,185
Debt to EBITDA (annualized)
6.0x
Debt to Total Assets
32.2%
Joint Venture Impact
Real estate joint venture income(1)
$ 4,416
Earnings from equity interests
Management fee revenue
$ 179
Interest and other income
Shareholder loan interest revenue
$ 4,285
Interest and other income
Real estate joint venture investments
$ 701,002
Equity investments
Other joint venture investments
225,988
Equity investments
Total joint venture investments
$ 926,990
Shareholder loans
$ 338,086
Other loans
(1) Includes $1.6 million of straight-line rent revenue and $9.2 million of depreciation and amortization expense.

1000 Urban Center Drive, Suite 501 Birmingham, AL 35242 (205) 969-3755 NYSE: MPW www.medicalpropertiestrust.com Contact: Tim Berryman, Director of Investor Relations (205) 397-8589 or tberryman@medicalpropertiestrust.com or Charles Lambert, Treasurer and Managing Director of Capital Markets (205) 397-8897 or clambert@medicalpropertiestrust.com AT THE VERY HEART OF HEALTHCARE.®