Attached files
| file | filename |
|---|---|
| 8-K - 8-K - ALLEGHENY TECHNOLOGIES INC | d875322d8k.htm |
Fourth Quarter and Full Year 2019 Earnings Presentation Feb. 4, 2020 Exhibit 99.1
This presentation contains forward-looking statements. Actual results may differ materially from results anticipated in the forward-looking statements due to various known and unknown risks, many of which we are unable to predict or control. These and additional risk factors are described from time to time in the Company’s filings with the Securities and Exchange Commission, including its Annual Report on Form 10-K for the year ended December 31, 2018. Forward Looking Statements
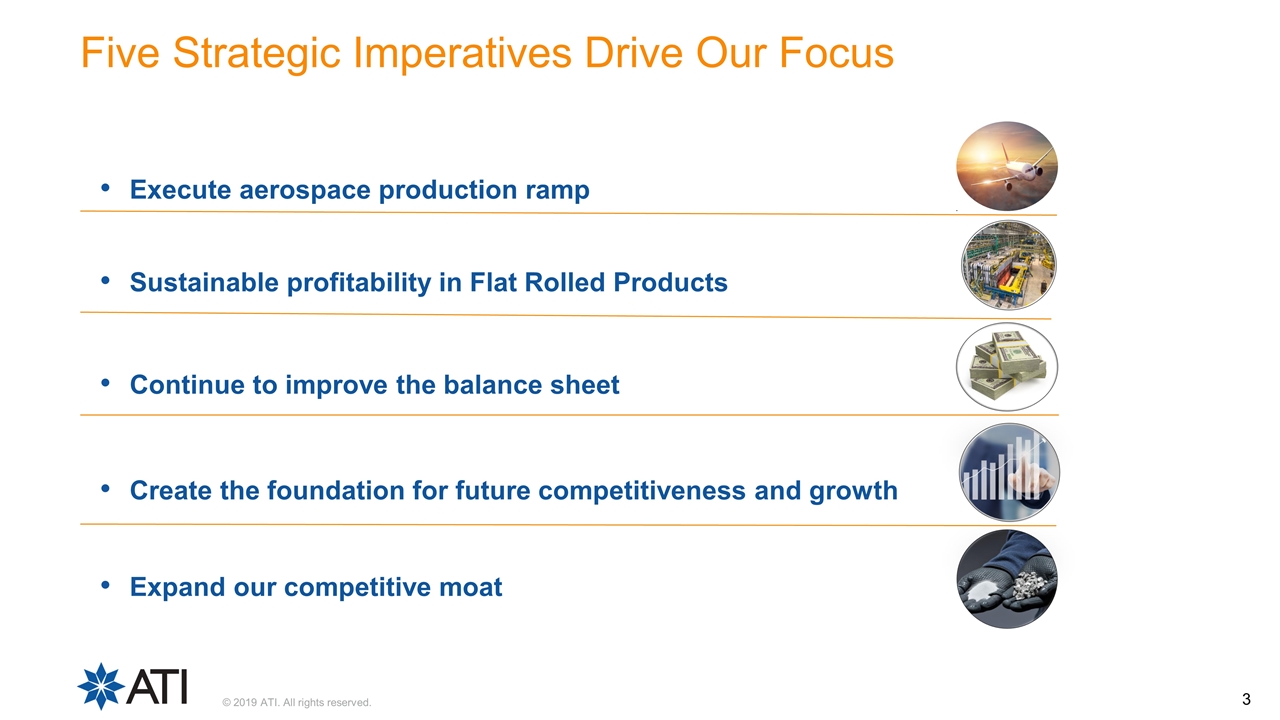
Five Strategic Imperatives Drive Our Focus Execute aerospace production ramp Sustainable profitability in Flat Rolled Products Continue to improve the balance sheet Create the foundation for future competitiveness and growth Expand our competitive moat
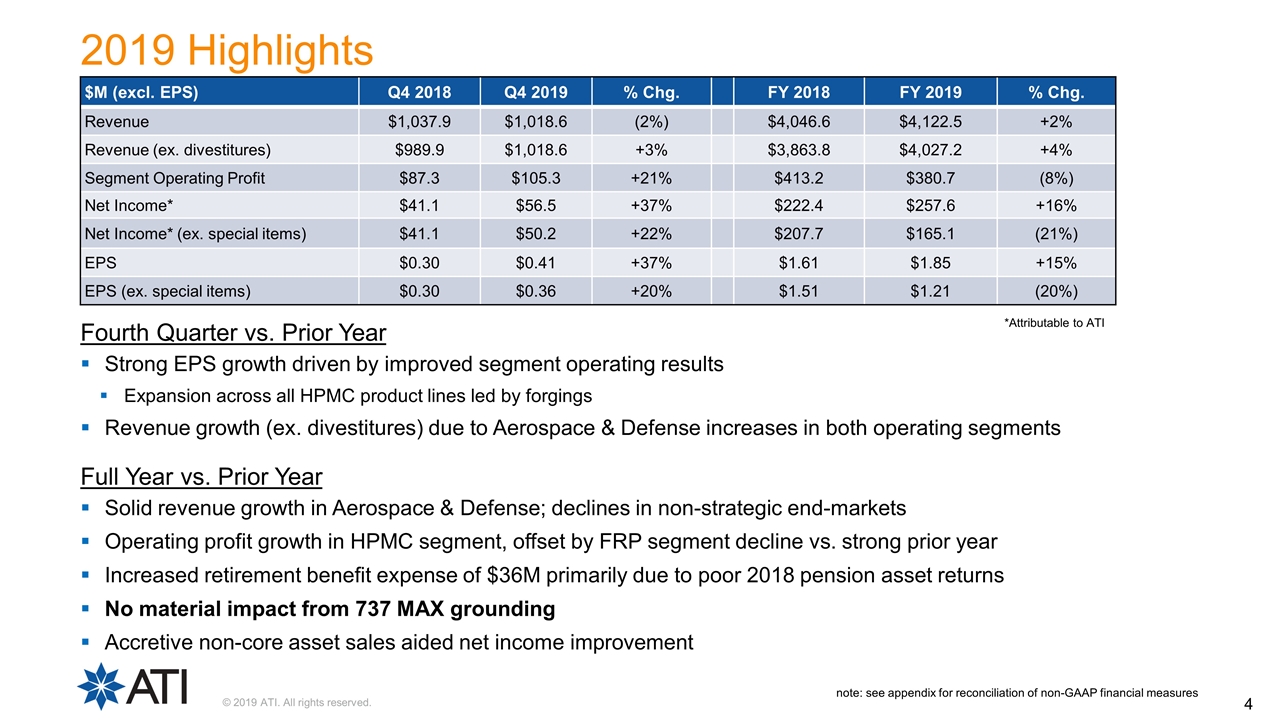
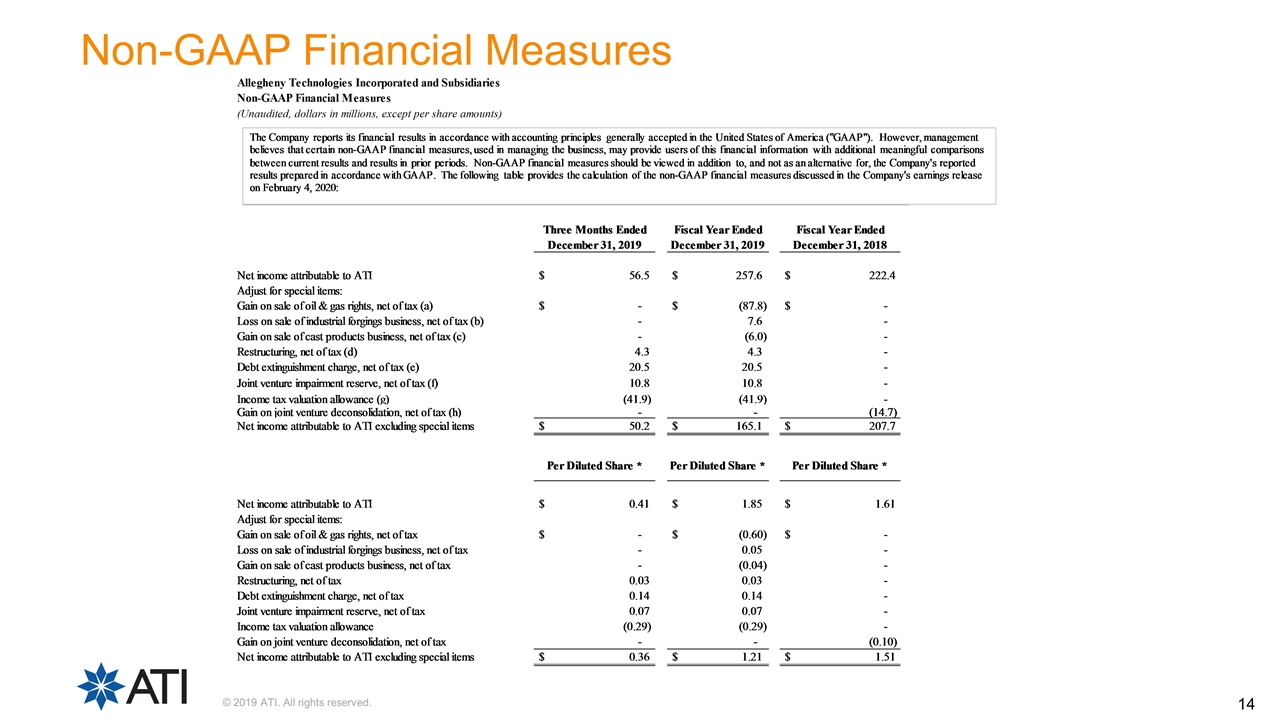
$M (excl. EPS) Q4 2018 Q4 2019 % Chg. FY 2018 FY 2019 % Chg. Revenue $1,037.9 $1,018.6 (2%) $4,046.6 $4,122.5 +2% Revenue (ex. divestitures) $989.9 $1,018.6 +3% $3,863.8 $4,027.2 +4% Segment Operating Profit $87.3 $105.3 +21% $413.2 $380.7 (8%) Net Income* $41.1 $56.5 +37% $222.4 $257.6 +16% Net Income* (ex. special items) $41.1 $50.2 +22% $207.7 $165.1 (21%) EPS $0.30 $0.41 +37% $1.61 $1.85 +15% EPS (ex. special items) $0.30 $0.36 +20% $1.51 $1.21 (20%) *Attributable to ATI note: see appendix for reconciliation of non-GAAP financial measures 2019 Highlights Fourth Quarter vs. Prior Year Strong EPS growth driven by improved segment operating results Expansion across all HPMC product lines led by forgings Revenue growth (ex. divestitures) due to Aerospace & Defense increases in both operating segments Full Year vs. Prior Year Solid revenue growth in Aerospace & Defense; declines in non-strategic end-markets Operating profit growth in HPMC segment, offset by FRP segment decline vs. strong prior year Increased retirement benefit expense of $36M primarily due to poor 2018 pension asset returns No material impact from 737 MAX grounding Accretive non-core asset sales aided net income improvement
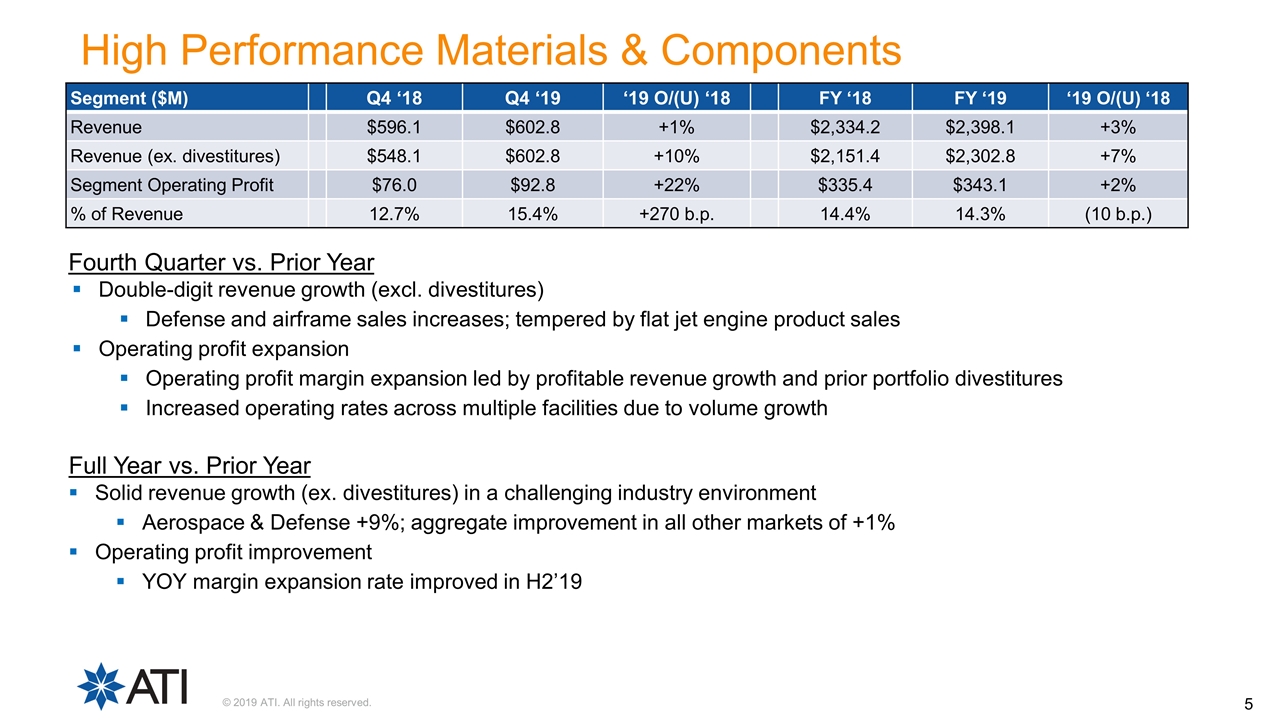
Segment ($M) Q4 ‘18 Q4 ‘19 ‘19 O/(U) ‘18 FY ‘18 FY ‘19 ‘19 O/(U) ‘18 Revenue $596.1 $602.8 +1% $2,334.2 $2,398.1 +3% Revenue (ex. divestitures) $548.1 $602.8 +10% $2,151.4 $2,302.8 +7% Segment Operating Profit $76.0 $92.8 +22% $335.4 $343.1 +2% % of Revenue 12.7% 15.4% +270 b.p. 14.4% 14.3% (10 b.p.) High Performance Materials & Components Fourth Quarter vs. Prior Year Double-digit revenue growth (excl. divestitures) Defense and airframe sales increases; tempered by flat jet engine product sales Operating profit expansion Operating profit margin expansion led by profitable revenue growth and prior portfolio divestitures Increased operating rates across multiple facilities due to volume growth Full Year vs. Prior Year Solid revenue growth (ex. divestitures) in a challenging industry environment Aerospace & Defense +9%; aggregate improvement in all other markets of +1% Operating profit improvement YOY margin expansion rate improved in H2’19
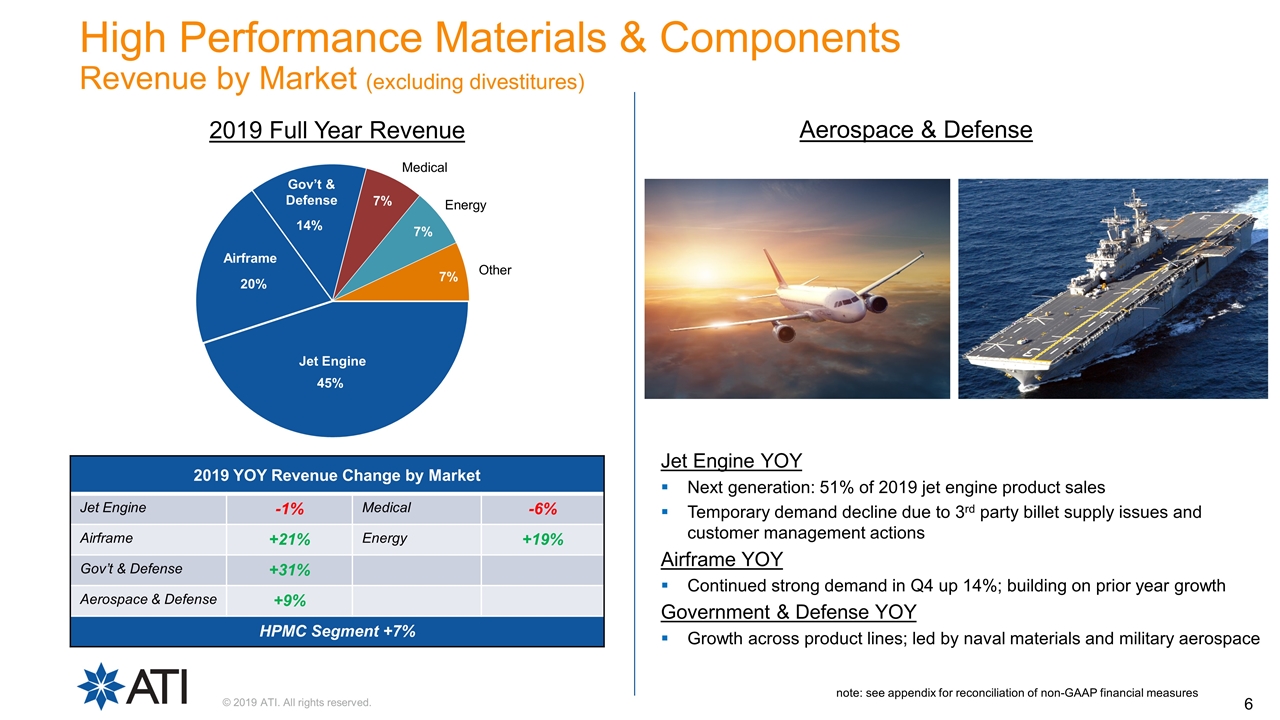
2019 Full Year Revenue Other Gov’t & Defense High Performance Materials & Components Revenue by Market (excluding divestitures) 2019 YOY Revenue Change by Market Jet Engine -1% Medical -6% Airframe +21% Energy +19% Gov’t & Defense +31% Aerospace & Defense +9% HPMC Segment +7% Airframe Aerospace & Defense Jet Engine YOY Next generation: 51% of 2019 jet engine product sales Temporary demand decline due to 3rd party billet supply issues and customer management actions Airframe YOY Continued strong demand in Q4 up 14%; building on prior year growth Government & Defense YOY Growth across product lines; led by naval materials and military aerospace note: see appendix for reconciliation of non-GAAP financial measures
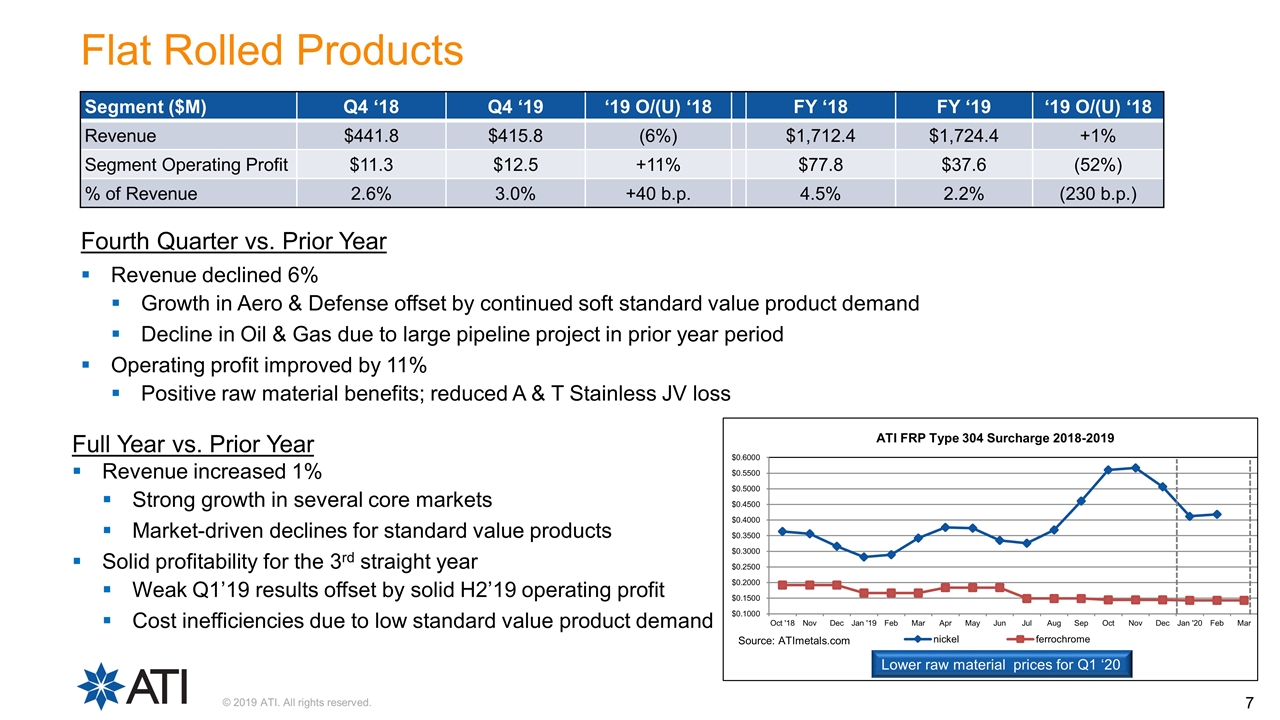
Fourth Quarter vs. Prior Year Revenue declined 6% Growth in Aero & Defense offset by continued soft standard value product demand Decline in Oil & Gas due to large pipeline project in prior year period Operating profit improved by 11% Positive raw material benefits; reduced A & T Stainless JV loss Lower raw material prices for Q1 ‘20 Source: ATImetals.com Segment ($M) Q4 ‘18 Q4 ‘19 ‘19 O/(U) ‘18 FY ‘18 FY ‘19 ‘19 O/(U) ‘18 Revenue $441.8 $415.8 (6%) $1,712.4 $1,724.4 +1% Segment Operating Profit $11.3 $12.5 +11% $77.8 $37.6 (52%) % of Revenue 2.6% 3.0% +40 b.p. 4.5% 2.2% (230 b.p.) Flat Rolled Products Full Year vs. Prior Year Revenue increased 1% Strong growth in several core markets Market-driven declines for standard value products Solid profitability for the 3rd straight year Weak Q1’19 results offset by solid H2’19 operating profit Cost inefficiencies due to low standard value product demand
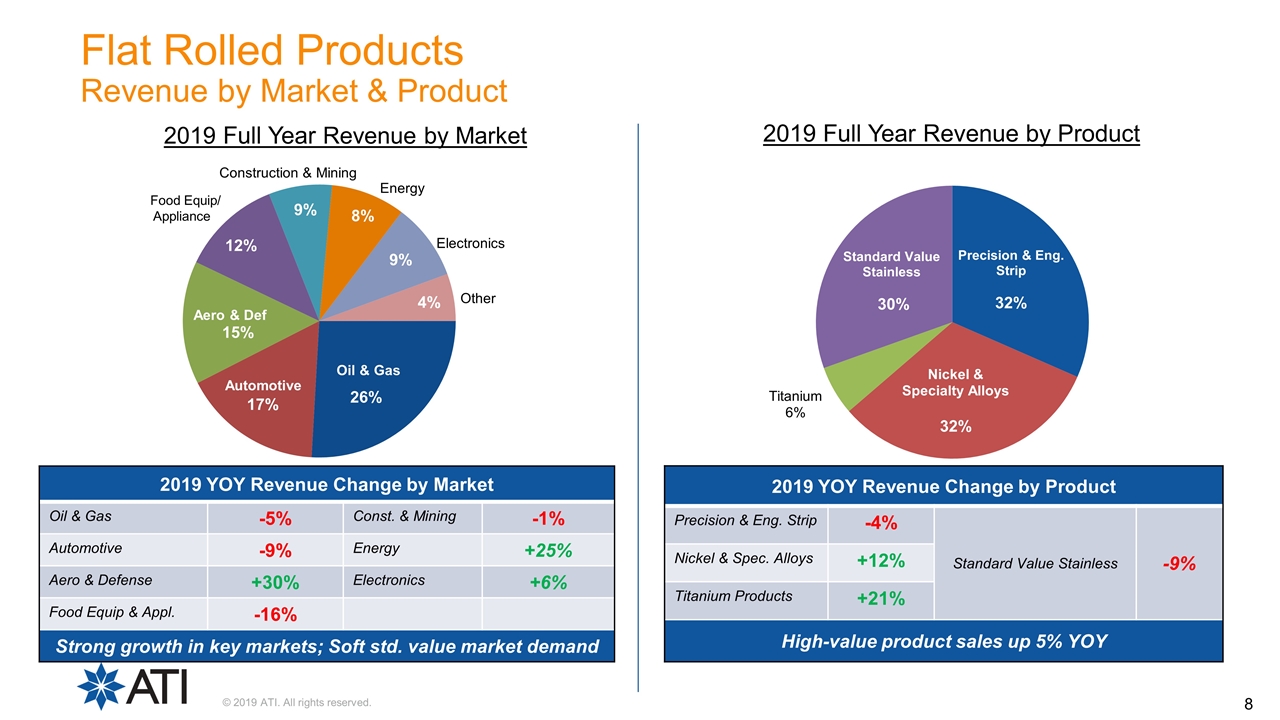
2019 Full Year Revenue by Market Oil & Gas Automotive Other Flat Rolled Products Revenue by Market & Product 2019 YOY Revenue Change by Market Oil & Gas -5% Const. & Mining -1% Automotive -9% Energy +25% Aero & Defense +30% Electronics +6% Food Equip & Appl. -16% Strong growth in key markets; Soft std. value market demand 2019 YOY Revenue Change by Product Precision & Eng. Strip -4% Standard Value Stainless -9% Nickel & Spec. Alloys +12% Titanium Products +21% High-value product sales up 5% YOY 2019 Full Year Revenue by Product
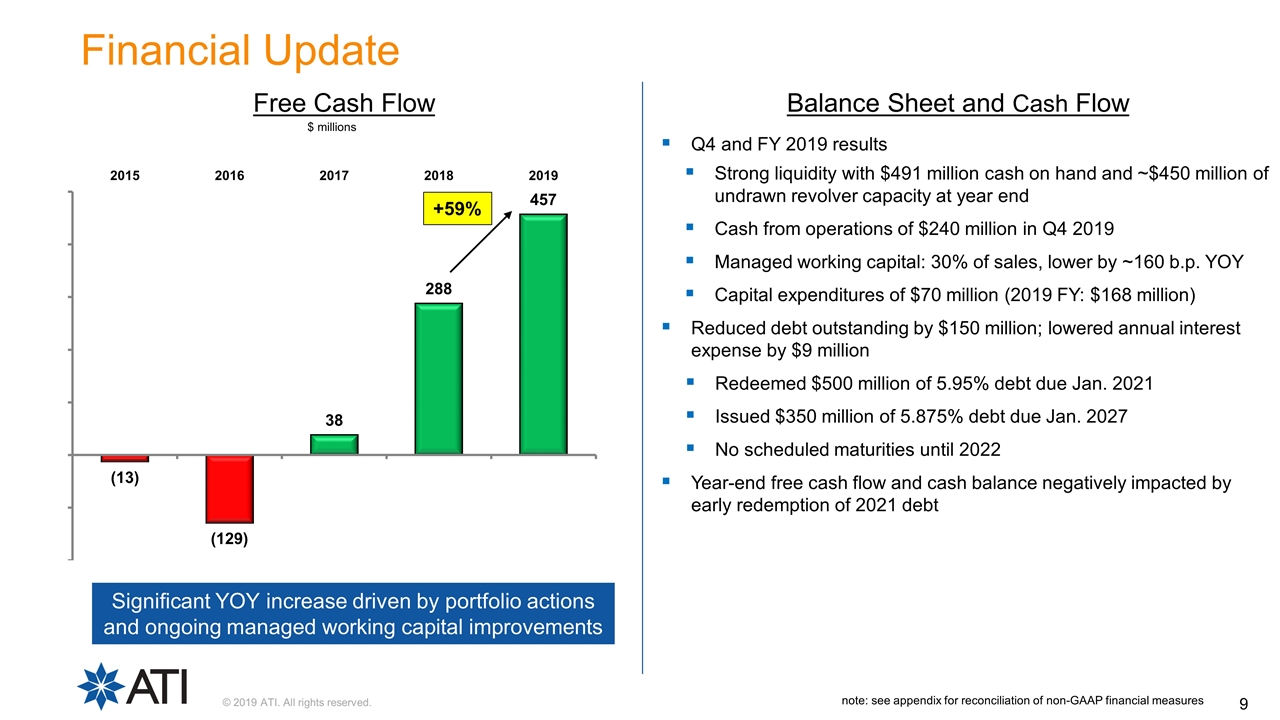
Free Cash Flow Balance Sheet and Cash Flow note: see appendix for reconciliation of non-GAAP financial measures Q4 and FY 2019 results Strong liquidity with $491 million cash on hand and ~$450 million of undrawn revolver capacity at year end Cash from operations of $240 million in Q4 2019 Managed working capital: 30% of sales, lower by ~160 b.p. YOY Capital expenditures of $70 million (2019 FY: $168 million) Reduced debt outstanding by $150 million; lowered annual interest expense by $9 million Redeemed $500 million of 5.95% debt due Jan. 2021 Issued $350 million of 5.875% debt due Jan. 2027 No scheduled maturities until 2022 Year-end free cash flow and cash balance negatively impacted by early redemption of 2021 debt $ millions Financial Update Significant YOY increase driven by portfolio actions and ongoing managed working capital improvements +59%
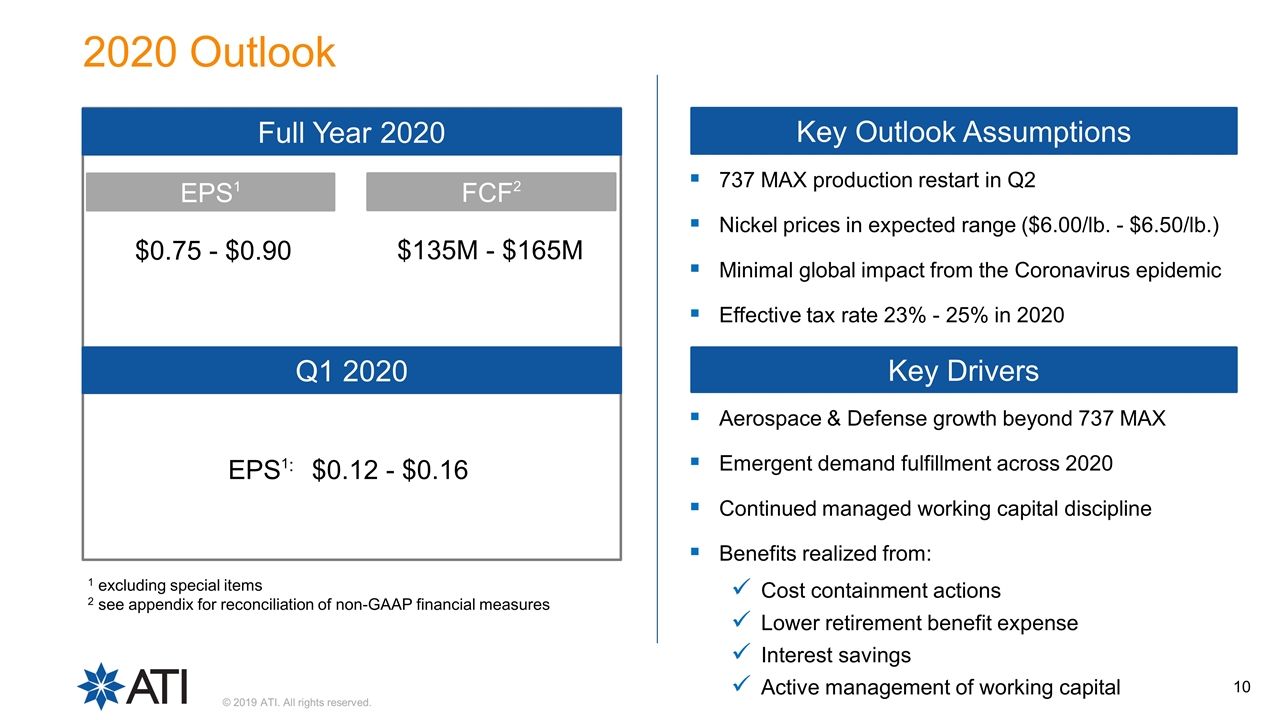
2020 Outlook Full Year 2020 EPS1 FCF2 $0.75 - $0.90 $135M - $165M EPS1: $0.12 - $0.16 Q1 2020 737 MAX production restart in Q2 Nickel prices in expected range ($6.00/lb. - $6.50/lb.) Minimal global impact from the Coronavirus epidemic Effective tax rate 23% - 25% in 2020 Key Outlook Assumptions Key Drivers Aerospace & Defense growth beyond 737 MAX Emergent demand fulfillment across 2020 Continued managed working capital discipline Benefits realized from: Cost containment actions Lower retirement benefit expense Interest savings Active management of working capital 1 excluding special items 2 see appendix for reconciliation of non-GAAP financial measures
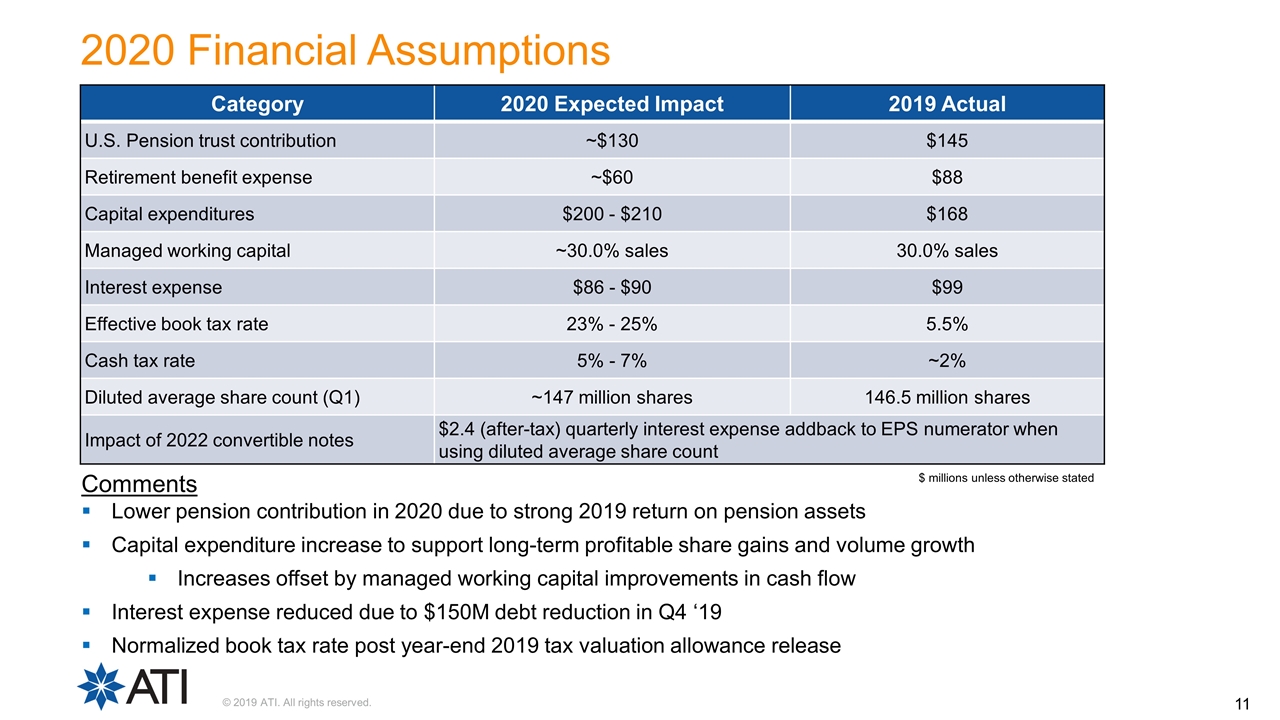
Category 2020 Expected Impact 2019 Actual U.S. Pension trust contribution ~$130 $145 Retirement benefit expense ~$60 $88 Capital expenditures $200 - $210 $168 Managed working capital ~30.0% sales 30.0% sales Interest expense $86 - $90 $99 Effective book tax rate 23% - 25% 5.5% Cash tax rate 5% - 7% ~2% Diluted average share count (Q1) ~147 million shares 146.5 million shares Impact of 2022 convertible notes $2.4 (after-tax) quarterly interest expense addback to EPS numerator when using diluted average share count $ millions unless otherwise stated 2020 Financial Assumptions Comments Lower pension contribution in 2020 due to strong 2019 return on pension assets Capital expenditure increase to support long-term profitable share gains and volume growth Increases offset by managed working capital improvements in cash flow Interest expense reduced due to $150M debt reduction in Q4 ‘19 Normalized book tax rate post year-end 2019 tax valuation allowance release
Fourth Quarter and Full Year 2019 Earnings Presentation Q & A

Additional Materials Appendix
Non-GAAP Financial Measures
Non-GAAP Financial Measures
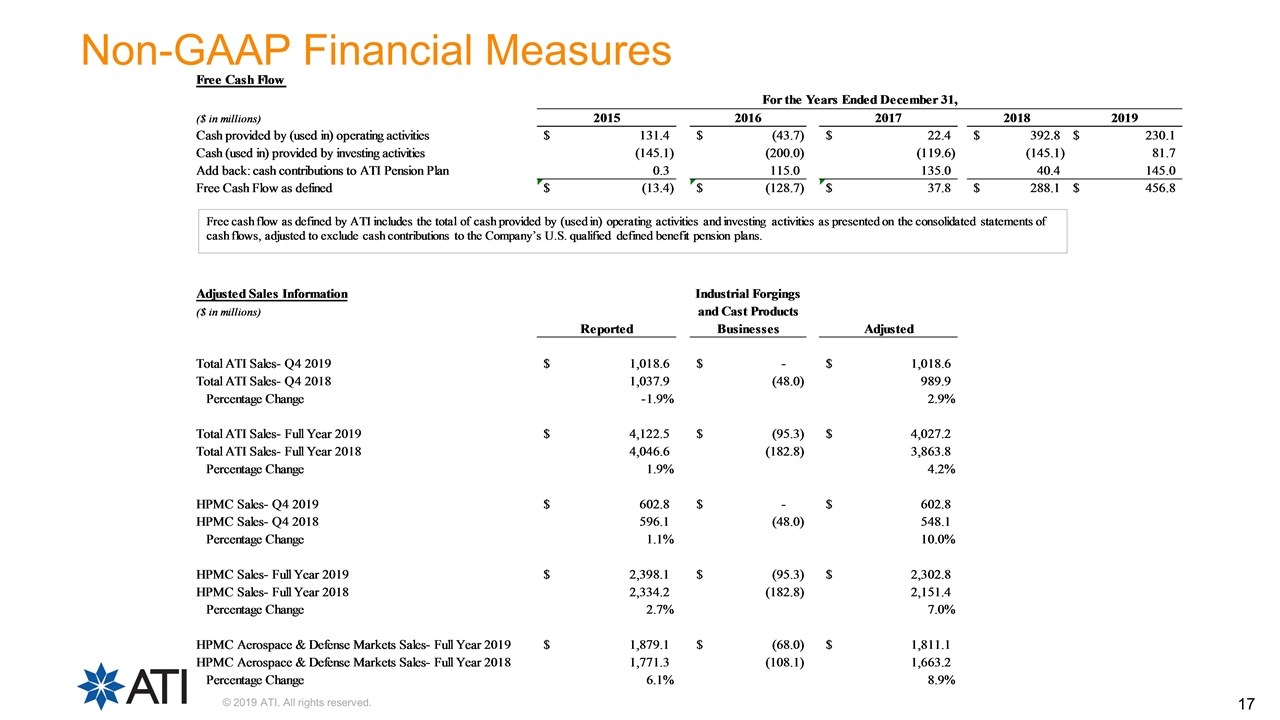
Non-GAAP Financial Measures Free Cash Flow For the Years Ended December 31, ($ in millions) 2015 2016 2017 2018 2019 Cash provided by (used in) operating activities $ 131.4 $ (43.7) $ 22.4 $ 392.8 $ 230.1 Cash (used in) provided by investing activities (145.1) (200.0) (119.6) (145.1) 81.7 Add back: cash contributions to ATI Pension Plan 0.3 115.0 135.0 40.4 145.0 Free Cash Flow as defined $ (13.4) $ (128.7) $ 37.8 $ 288.1 $ 456.8 Free cash flow as defined by ATI includes the total of cash provided by (used in) operating activities and investing activities as presented on the consolidated statements of cash flows, adjusted to exclude cash contributions to the Company’s U.S. qualified defined benefit pension plans.
Non-GAAP Financial Measures Free Cash Flow For the Years Ended December 31, ($ in millions) 2015 2016 2017 2018 2019 Cash provided by (used in) operating activities $ 131.4 $ (43.7) $ 22.4 $ 392.8 $ 230.1 Cash (used in) provided by investing activities (145.1) (200.0) (119.6) (145.1) 81.7 Add back: cash contributions to ATI Pension Plan 0.3 115.0 135.0 40.4 145.0 Free Cash Flow as defined $ (13.4) $ (128.7) $ 37.8 $ 288.1 $ 456.8 Free cash flow as defined by ATI includes the total of cash provided by (used in) operating activities and investing activities as presented on the consolidated statements of cash flows, adjusted to exclude cash contributions to the Company’s U.S. qualified defined benefit pension plans.
Non-GAAP Financial Measures Free Cash Flow For the Years Ended December 31, ($ in millions) 2015 2016 2017 2018 2019 Cash provided by (used in) operating activities $ 131.4 $ (43.7) $ 22.4 $ 392.8 $ 230.1 Cash (used in) provided by investing activities (145.1) (200.0) (119.6) (145.1) 81.7 Add back: cash contributions to ATI Pension Plan 0.3 115.0 135.0 40.4 145.0 Free Cash Flow as defined $ (13.4) $ (128.7) $ 37.8 $ 288.1 $ 456.8 Free cash flow as defined by ATI includes the total of cash provided by (used in) operating activities and investing activities as presented on the consolidated statements of cash flows, adjusted to exclude cash contributions to the Company’s U.S. qualified defined benefit pension plans.
