Attached files
| file | filename |
|---|---|
| EX-99.1 - EXHIBIT 99.1 - TE Connectivity Ltd. | tm205755d1_ex99-1.htm |
| 8-K - 8-K - TE Connectivity Ltd. | tm205755d1_8k.htm |
Exhibit 99.2

Q1 2020 Earnings January 29, 2020

TE Connectivity Confidential & Proprietary. Do not reproduce or distribute. Forward - Looking Statements and Non - GAAP Financial Measures 2 Forward - Looking Statements This presentation contains certain “forward - looking statements” within the meaning of the U.S. Private Securities Litigation Ref orm Act of 1995. These statements are based on management’s current expectations and are subject to risks, uncertainty and changes in circumstances, which may cause actual results, performance, financial condition or achievements to differ materially from ant ici pated results, performance, financial condition or achievements. All statements contained herein that are not clearly historical in nature a re forward - looking and the words “anticipate,” “believe,” “expect,” “estimate,” “plan,” and similar expressions are generally intended to identi fy forward - looking statements. We have no intention and are under no obligation to update or alter (and expressly disclaim any such intention or ob ligation to do so) our forward - looking statements whether as a result of new information, future events or otherwise, except to the extent requ ired by law. The forward - looking statements in this presentation include statements addressing our future financial condition and operating r esults. Examples of factors that could cause actual results to differ materially from those described in the forward - looking statements include, among others, business, economic, competitive and regulatory risks, such as conditions affecting demand for products, particu lar ly in the automotive and data and devices industries; competition and pricing pressure; fluctuations in foreign currency exchange rates an d commodity prices; natural disasters and political, economic and military instability in countries in which we operate; develo pme nts in the credit markets; future goodwill impairment; compliance with current and future environmental and other laws and regulations; and the possible effects on us of changes in tax laws, tax treaties and other legislation, including the effects of Swiss tax reform. Mo re detailed information about these and other factors is set forth in TE Connectivity Ltd.’s Annual Report on Form 10 - K for the fiscal year ended Sept. 27, 2019 as well as in our Quarterly Reports on Form 10 - Q, Current Reports on Form 8 - K and other reports filed by us with the U. S. Securities and Exchange Commission. Non - GAAP Financial Measures Where we have used non - GAAP financial measures, reconciliations to the most comparable GAAP measure are provided, along with a disclosure on the usefulness of the non - GAAP financial measure, in this presentation.
TE Connectivity Confidential & Proprietary. Do not reproduce or distribute. Sales and Adjusted EPS exceeded guidance midpoint • Sales of $3.2B, down 5% on a reported & organic basis Y/Y; outperforming markets with content growth • Transportation down 6% organically, as expected, driven by production declines in the auto and commercial transportation markets • Industrial grew 1% organically, ahead of guidance, driven by AD&M, Energy and Medical • Communications down 14% organically, as expected, driven by continued distribution destocking • Sales included an approximate headwind of $45M from currency exchange rates • Orders grew sequentially, with a book to bill of 1.02 • Adjusted EPS of $1.21, exceeding the high end of guidance due to higher sales and cost initiatives • Strong Free Cash Flow of ~ $245M with ~$300M returned to shareholders Increasing full year guidance driven by Q1 strength • Sales of $13.05B, which includes a ~$200M Y/Y headwind from currency exchange rates • Content growth enabling market outperformance • Raising Adjusted EPS to $5.10 • Includes a ~$0.30 Y/Y headwind from currency and tax impacts • Continue to execute cost reduction & footprint consolidation plans, while investing for long term growth Q1 Highlights 3 Organic Net Sales Growth (Decline), Adjusted EPS, and Free Cash Flow are non - GAAP financial measures; see Appendix for descripti ons and reconciliations.
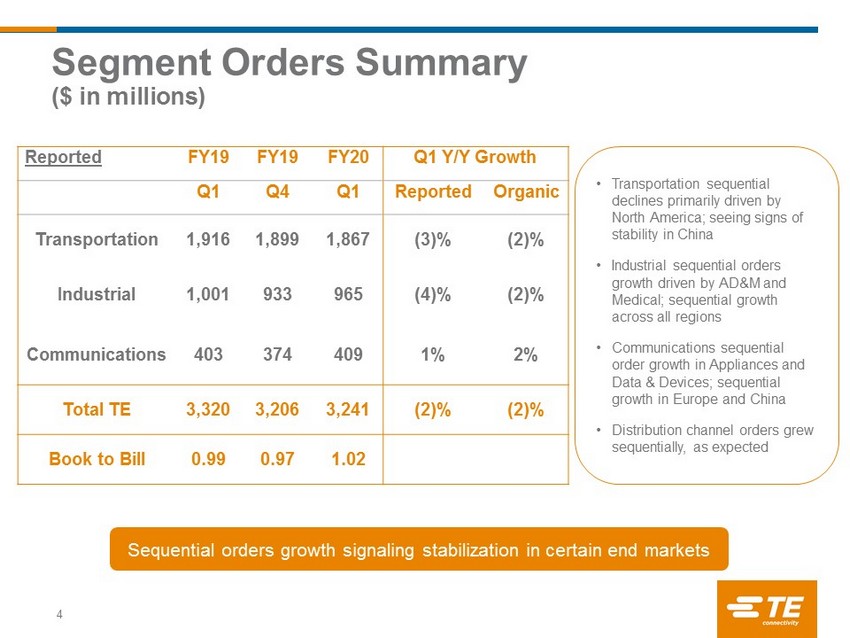
TE Connectivity Confidential & Proprietary. Do not reproduce or distribute. Reported FY19 FY19 FY20 Q1 Y/Y Growth Q1 Q4 Q1 Reported Organic Transportation 1,916 1,899 1,867 (3)% (2)% Industrial 1,001 933 965 (4)% (2)% Communications 403 374 409 1% 2% Total TE 3,320 3,206 3,241 (2)% (2)% Book to Bill 0.99 0.97 1.02 Segment Orders Summary ($ in millions) 4 • Transportation sequential declines primarily driven by North America; seeing signs of stability in China • Industrial sequential orders growth driven by AD&M and Medical; sequential growth across all regions • Communications sequential order growth in Appliances and Data & Devices; sequential growth in Europe and China • Distribution channel orders grew sequentially, as expected Sequential orders growth signaling stabilization in certain end markets
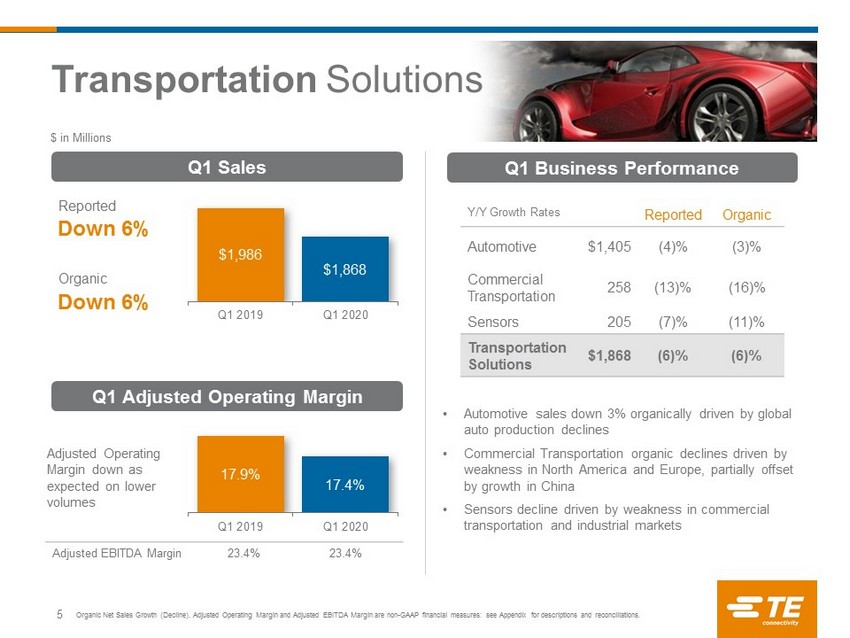
TE Connectivity Confidential & Proprietary. Do not reproduce or distribute. Y/Y Growth Rates Reported Organic Automotive $1,405 (4)% (3)% Commercial Transportation 258 (13)% (16)% Sensors 205 (7)% (11)% Transportation Solutions $1,868 (6)% (6)% $ in Millions Q1 Sales Q1 Business Performance Reported Down 6% Organic Down 6% Q1 Adjusted Operating Margin Transportation Solutions 5 Adjusted EBITDA Margin 23.4% 23.4% • Automotive sales down 3% organically driven by global auto production declines • Commercial Transportation organic declines driven by weakness in North America and Europe, partially offset by growth in China • Sensors decline driven by weakness in commercial transportation and industrial markets Organic Net Sales Growth (Decline), Adjusted Operating Margin and Adjusted EBITDA Margin are non - GAAP financial measures: see Ap pendix for descriptions and reconciliations. Adjusted Operating Margin down as expected on lower volumes $1,986 $1,868 Q1 2019 Q1 2020 17.9% 17.4% Q1 2019 Q1 2020
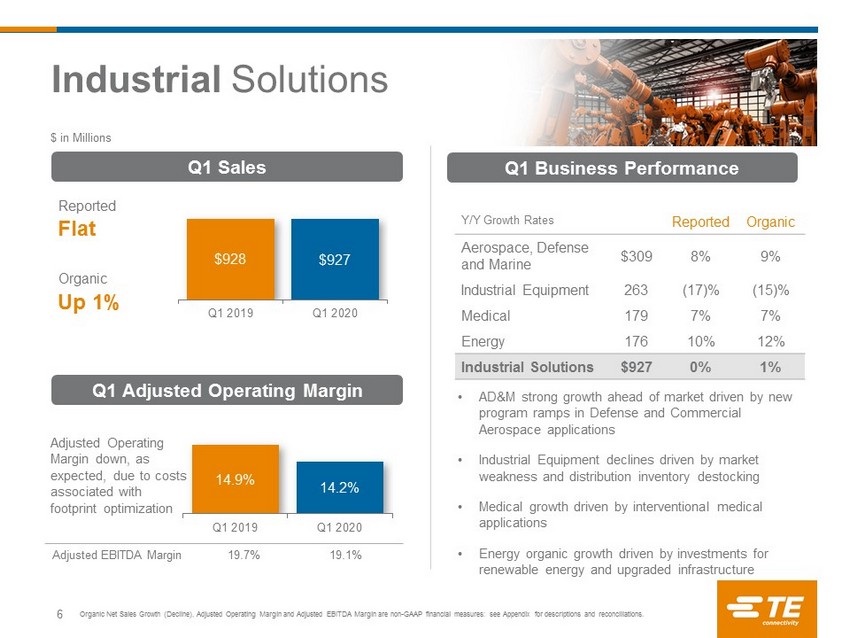
TE Connectivity Confidential & Proprietary. Do not reproduce or distribute. Y/Y Growth Rates Reported Organic Aerospace , Defense and Marine $309 8% 9% Industrial Equipment 263 (17)% (15)% Medical 179 7% 7% Energy 176 10% 12% Industrial Solutions $927 0% 1% $ in Millions Q1 Sales • AD &M strong growth ahead of market driven by new program ramps in Defense and Commercial Aerospace applications • Industrial Equipment declines driven by market weakness and distribution inventory destocking • Medical growth driven by interventional medical applications • Energy organic growth driven by investments for renewable energy and upgraded infrastructure Q1 Business Performance Reported Flat Organic Up 1% Q1 Adjusted Operating Margin Industrial Solutions 6 $928 $927 Q1 2019 Q1 2020 14.9% 14.2% Q1 2019 Q1 2020 Adjusted Operating Margin down, as expected, due to footprint optimization activities Adjusted EBITDA Margin 19.7% 19.1% Organic Net Sales Growth (Decline), Adjusted Operating Margin and Adjusted EBITDA Margin are non - GAAP financial measures: see Ap pendix for descriptions and reconciliations.
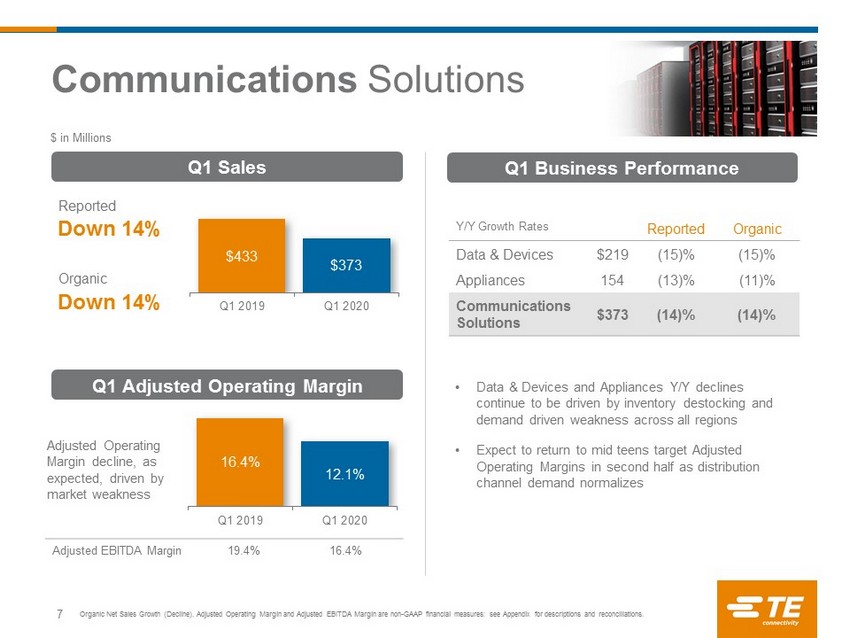
TE Connectivity Confidential & Proprietary. Do not reproduce or distribute. 16.4% 12.1% Q1 2019 Q1 2020 $433 $373 Q1 2019 Q1 2020 Y/Y Growth Rates Reported Organic Data & Devices $219 (15)% (15)% Appliances 154 (13)% (11)% Communications Solutions $373 (14)% (14)% $ in Millions Q1 Sales • Data & Devices and Appliances Y/Y declines continue to be driven by inventory destocking and demand driven weakness across all regions • Expect to return to mid teens target Adjusted Operating Margins in second half as distribution channel demand normalizes Q1 Business Performance Reported Down 14% Organic Down 14% Q1 Adjusted Operating Margin Adjusted Operating Margin decline, as expected, driven by market weakness 7 Communications Solutions Adjusted EBITDA Margin 19.4% 16.4% Organic Net Sales Growth (Decline), Adjusted Operating Margin and Adjusted EBITDA Margin are non - GAAP financial measures: see Ap pendix for descriptions and reconciliations.

TE Connectivity Confidential & Proprietary. Do not reproduce or distribute. ($ in Millions, except per share amounts) Q1 FY19 Q1 FY20 Net Sales $ 3,347 $ 3,168 Operating Income $ 484 $ 471 Operating Margin 14.5% 14.9% Acquisition Related Charges 6 7 Restructuring & Other Charges, net 75 24 Adjusted Operating Income $ 565 $ 502 Adjusted Operating Margin 16.9% 15.8% Earnings Per Share* $ 1.11 $ 0.07 Acquisition Related Charges 0.01 0.02 Restructuring & Other Charges, net 0.16 0.07 Tax Items** - 1.05 Adjusted EPS $ 1.29 $ 1.21 Q1 Financial Summary 8 *Represents Diluted Earnings Per Share from Continuing Operations ** Income tax expense related to the tax impacts of certain measures of Swiss tax reform Adjusted Operating Income, Adjusted Operating Margin and Adjusted EPS are non - GAAP financial measures; see Appendix for descript ions and reconciliations.
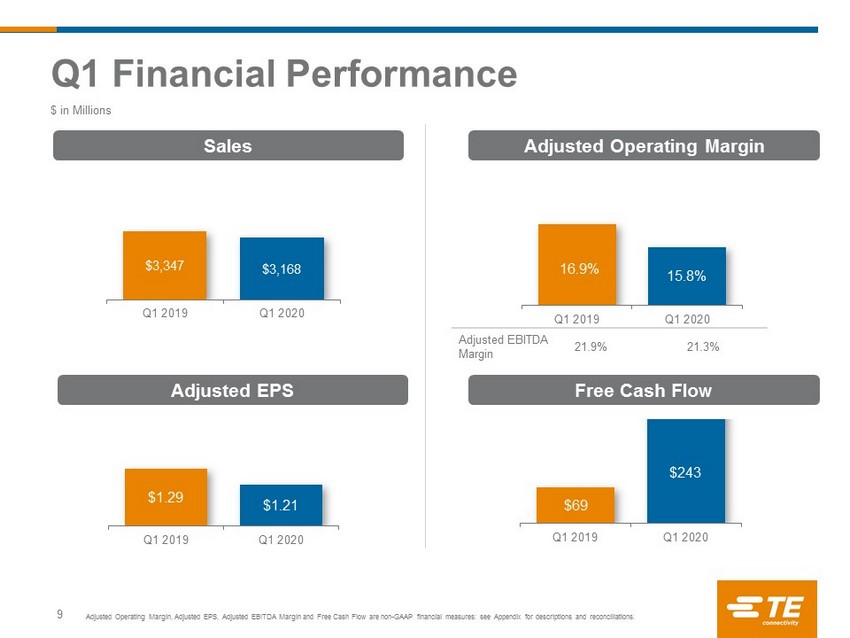
TE Connectivity Confidential & Proprietary. Do not reproduce or distribute. Q1 Financial Performance 9 Adjusted Operating Margin Free Cash Flow $69 $243 Q1 2019 Q1 2020 $3,347 $3,168 Q1 2019 Q1 2020 Sales $ in Millions Adjusted Operating Margin, Adjusted EPS, Adjusted EBITDA Margin and Free Cash Flow are non - GAAP financial measures: see Appendix for descriptions and reconciliations. Adjusted EPS $1.29 $1.21 Q1 2019 Q1 2020 Adjusted EBITDA Margin 21.9% 21.3% 16.9% 15.8% Q1 2019 Q1 2020
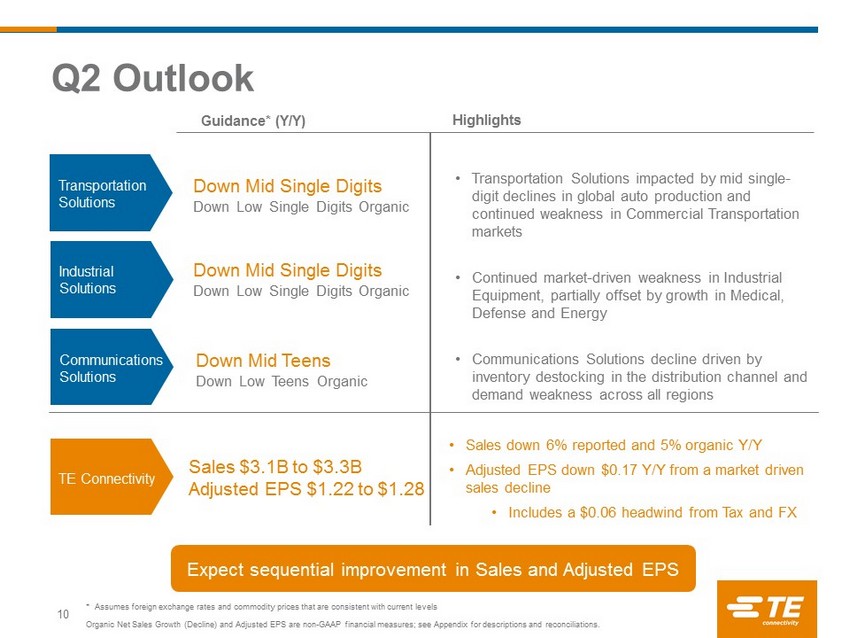
TE Connectivity Confidential & Proprietary. Do not reproduce or distribute. Guidance* (Y/Y) Transportation Solutions Industrial Solutions Communications Solutions TE Connectivity Highlights Sales $3.1B to $3.3B Adjusted EPS $1.22 to $1.28 • Sales down 6% reported and 5% organic Y/Y • Adjusted EPS down $0.17 Y/Y from a market driven sales decline • Includes a $0.06 headwind from Tax and FX Down Mid Single Digits Down Low Single Digits Organic Down Mid Teens Down Low Teens Organic Down Mid Single Digits Down Low Single Digits Organic Q2 Outlook 10 • Transportation Solutions impacted by mid single - digit declines in global auto production and continued weakness in Commercial Transportation markets • Continued market - driven weakness in Industrial Equipment, partially offset by growth in Medical, Defense and Energy • Communications Solutions decline driven by inventory destocking in the distribution channel and demand weakness across all regions * Assumes foreign exchange rates and commodity prices that are consistent with current levels Organic Net Sales Growth (Decline) and Adjusted EPS are non - GAAP financial measures; see Appendix for descriptions and reconcili ations. Expect sequential improvement in Sales and Adjusted EPS
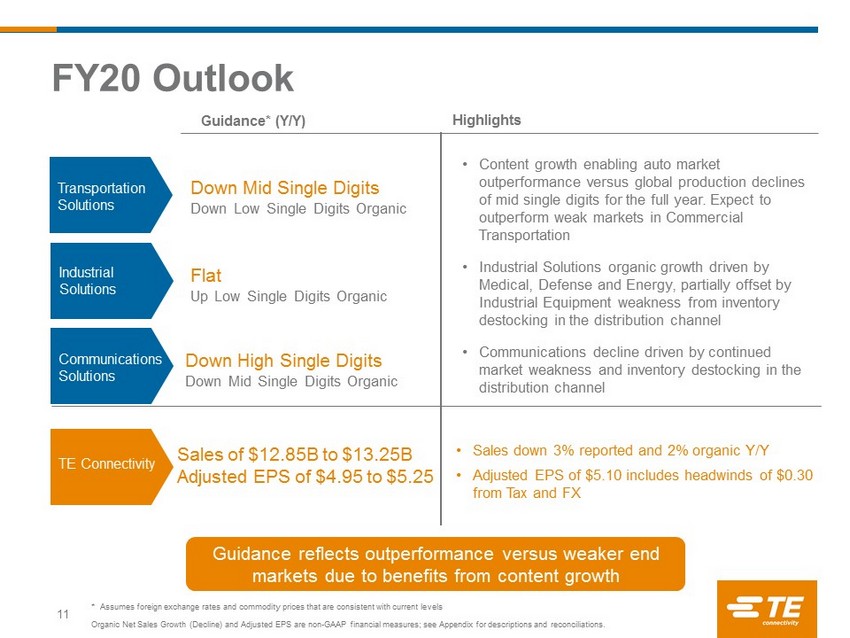
TE Connectivity Confidential & Proprietary. Do not reproduce or distribute. * Assumes foreign exchange rates and commodity prices that are consistent with current levels Organic Net Sales Growth (Decline) and Adjusted EPS are non - GAAP financial measures; see Appendix for descriptions and reconcili ations. Guidance reflects outperformance versus weaker end markets due to benefits from content growth Sales of $12.85B to $13.25B Adjusted EPS of $4.95 to $5.25 • Sales down 3% reported and 2% organic Y/Y • Adjusted EPS of $5.10 includes headwinds of $0.30 from Tax and FX Down Mid Single Digits Down Low Single Digits Organic Down High Single Digits Down Mid Single Digits Organic Flat Up Low Single Digits Organic FY20 Outlook Guidance* (Y/Y) Transportation Solutions Industrial Solutions TE Connectivity Highlights 11 Communications Solutions • Content growth enabling auto market outperformance versus global production declines of mid single digits for the full year. Expect to outperform weak markets in Commercial Transportation • Industrial Solutions organic growth driven by Medical, Defense and Energy, partially offset by Industrial Equipment weakness from inventory destocking in the distribution channel • Communications decline driven by continued market weakness and inventory destocking in the distribution channel

TE Connectivity Confidential & Proprietary. Do not reproduce or distribute. Additional Information 12

TE Connectivity Confidential & Proprietary. Do not reproduce or distribute. Y/Y Q1 2020 13 Sales (in millions) Adjusted EPS Q1 2019 Results $3,347 $1.29 Operational Performance (136) (0.05) FX Impact (43) (0.02) Tax Rate Impact - (0.01) Q1 2020 Results $3,168 $1.21 Adjusted EPS is a non - GAAP financial measure; See Appendix for description and reconciliation.

TE Connectivity Confidential & Proprietary. Do not reproduce or distribute. Y/Y Q2 2020 14 Sales (in millions) Adjusted EPS Q2 2019 Results $3,412 $1.42 Operational Performance (135) (0.11) FX Impact (77) (0.04) Tax Rate Impact - (0.02) Q2 2020 Guidance $3,200 $1.25 Guidance Range: Sales of $3.1B - $3.3B Adjusted EPS of $1.22 – $1.28 Adjusted EPS is a non - GAAP financial measure; See Appendix for description and reconciliation.
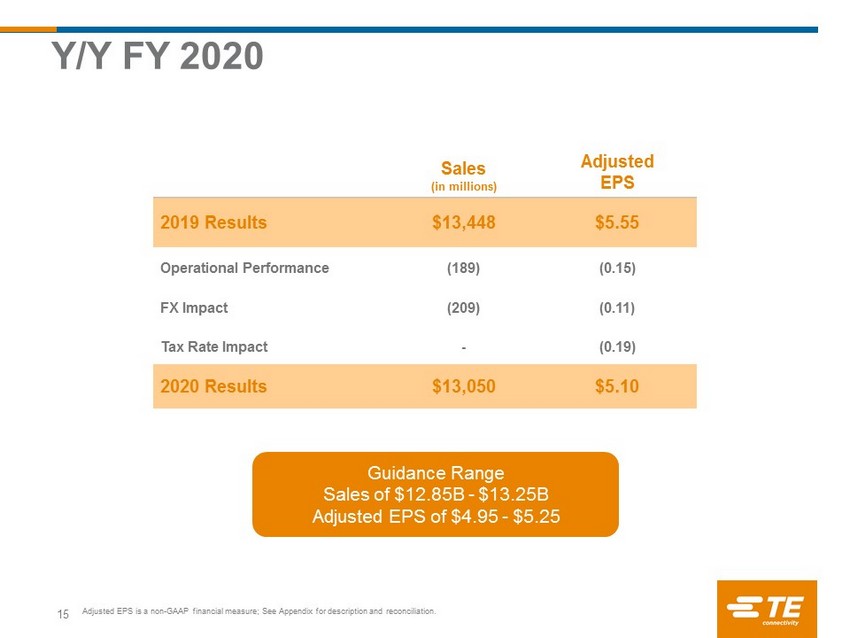
TE Connectivity Confidential & Proprietary. Do not reproduce or distribute. Y/Y FY 2020 15 Guidance Range Sales of $12.85B - $13.25B Adjusted EPS of $4.95 - $5.25 Adjusted EPS is a non - GAAP financial measure; See Appendix for description and reconciliation. Sales (in millions) Adjusted EPS 2019 Results $13,448 $5.55 Operational Performance (189) (0.15) FX Impact (209) (0.11) Tax Rate Impact - (0.19) 2020 Results $13,050 $5.10

TE Connectivity Confidential & Proprietary. Do not reproduce or distribute. ($ in Millions) Q1 2019 Q1 2020 Beginning Cash Balance $848 $927 Free Cash Flow 69 243 Dividends (150) (154) Share repurchases (519) (139) Net decrease in debt (28) (9) Proceeds from the sale of discontinued operation, net 288 0 Acquisition of businesses, net of cash acquired 0 (115) Other (3) (11) Ending Cash Balance $505 $742 Total Debt $3,967 $3,973 A/R $2,380 $2,338 Days Sales Outstanding* 64 66 Inventory $1,986 $2,003 Days on Hand* 80 81 Accounts Payable $1,538 $1,433 Days Outstanding* 62 60 Free Cash Flow is a non - GAAP financial measure, see Appendix for description and reconciliation * Adjusted to exclude the impact of acquisitions Free Cash Flow and Working Capital Liquidity, Cash & Debt Q1 Balance Sheet & Cash Flow Summary 16 ($ in Millions) Q1 2019 Q1 2020 Cash from Continuing Operations $328 $411 Capital expenditures, net Cash (collected) paid pursuant to collateral requirements related to cross - currency swap contracts (209) (50) (174) 6 Free Cash Flow $69 $243
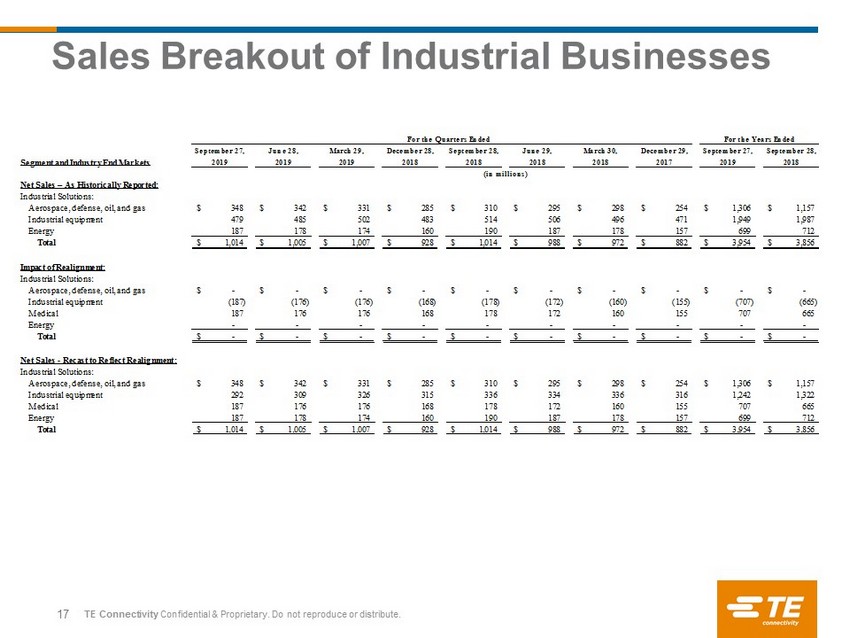
TE Connectivity Confidential & Proprietary. Do not reproduce or distribute. Sales Breakout of Industrial Businesses 17 September 27, June 28, March 29, December 28, September 28, June 29, March 30, December 29, September 27, September 28, Segment and Industry End Markets 2019 2019 2019 2018 2018 2018 2018 2017 2019 2018 Net Sales – As Historically Reported: Industrial Solutions: Aerospace, defense, oil, and gas 348$ 342$ 331$ 285$ 310$ 295$ 298$ 254$ 1,306$ 1,157$ Industrial equipment 479 485 502 483 514 506 496 471 1,949 1,987 Energy 187 178 174 160 190 187 178 157 699 712 Total 1,014$ 1,005$ 1,007$ 928$ 1,014$ 988$ 972$ 882$ 3,954$ 3,856$ Impact of Realignment: Industrial Solutions: Aerospace, defense, oil, and gas -$ -$ -$ -$ -$ -$ -$ -$ -$ -$ Industrial equipment (187) (176) (176) (168) (178) (172) (160) (155) (707) (665) Medical 187 176 176 168 178 172 160 155 707 665 Energy - - - - - - - - - - Total -$ -$ -$ -$ -$ -$ -$ -$ -$ -$ Net Sales - Recast to Reflect Realignment: Industrial Solutions: Aerospace, defense, oil, and gas 348$ 342$ 331$ 285$ 310$ 295$ 298$ 254$ 1,306$ 1,157$ Industrial equipment 292 309 326 315 336 334 336 316 1,242 1,322 Medical 187 176 176 168 178 172 160 155 707 665 Energy 187 178 174 160 190 187 178 157 699 712 Total 1,014$ 1,005$ 1,007$ 928$ 1,014$ 988$ 972$ 882$ 3,954$ 3,856$ For the Quarters Ended (in millions) For the Years Ended
TE Connectivity Confidential & Proprietary. Do not reproduce or distribute. Appendix 18
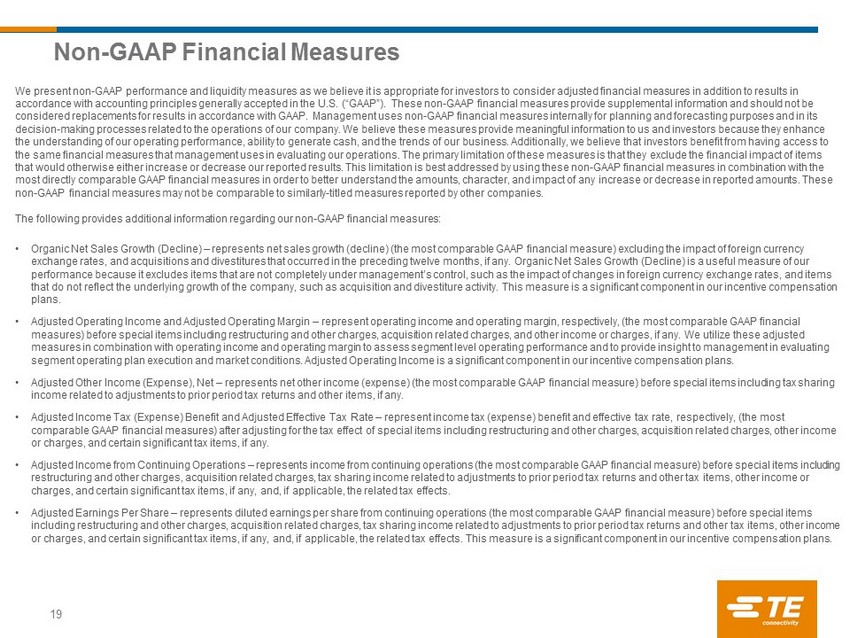
TE Connectivity Confidential & Proprietary. Do not reproduce or distribute. 19 Non - GAAP Financial Measures We present non - GAAP performance and liquidity measures as we believe it is appropriate for investors to consider adjusted financ ial measures in addition to results in accordance with accounting principles generally accepted in the U.S. (“GAAP”). These non - GAAP financial measures provide supplem ental information and should not be considered replacements for results in accordance with GAAP. Management uses non - GAAP financial measures internally for planning and forecasting purposes and in its decision - making processes related to the operations of our company. We believe these measures provide meaningful information to us and investors because they enhance the understanding of our operating performance, ability to generate cash, and the trends of our business. Additionally, we be lie ve that investors benefit from having access to the same financial measures that management uses in evaluating our operations. The primary limitation of these measures is th at they exclude the financial impact of items that would otherwise either increase or decrease our reported results. This limitation is best addressed by using these non - GAAP financial measures in combination with the most directly comparable GAAP financial measures in order to better understand the amounts, character, and impact of any incr eas e or decrease in reported amounts. These non - GAAP financial measures may not be comparable to similarly - titled measures reported by other companies. The following provides additional information regarding our non - GAAP financial measures: • Organic Net Sales Growth (Decline) – represents net sales growth (decline) (the most comparable GAAP financial measure) excludin g the impact of foreign currency exchange rates, and acquisitions and divestitures that occurred in the preceding twelve months, if any. Organic Net Sales Gro wth (Decline) is a useful measure of our performance because it excludes items that are not completely under management’s control, such as the impact of changes in fo rei gn currency exchange rates, and items that do not reflect the underlying growth of the company, such as acquisition and divestiture activity. This measure is a sig nif icant component in our incentive compensation plans. • Adjusted Operating Income and Adjusted Operating Margin – represent operating income and operating margin, respectively, (the mo st comparable GAAP financial measures) before special items including restructuring and other charges, acquisition related charges, and other income or ch arg es, if any. We utilize these adjusted measures in combination with operating income and operating margin to assess segment level operating performance and to provi de insight to management in evaluating segment operating plan execution and market conditions. Adjusted Operating Income is a significant component in our incentive co mpensation plans. • Adjusted Other Income (Expense), Net – represents net other income (expense) (the most comparable GAAP financial measure) before special items including tax sharing income related to adjustments to prior period tax returns and other items, if any. • Adjusted Income Tax (Expense) Benefit and Adjusted Effective Tax Rate – represent income tax (expense) benefit and effective tax rate, respectively, (the most comparable GAAP financial measures) after adjusting for the tax effect of special items including restructuring and other cha rge s, acquisition related charges, other income or charges, and certain significant tax items, if any. • Adjusted Income from Continuing Operations – represents income from continuing operations (the most comparable GAAP financial me asure) before special items including restructuring and other charges, acquisition related charges, tax sharing income related to adjustments to prior period tax r etu rns and other tax items, other income or charges, and certain significant tax items, if any, and, if applicable, the related tax effects. • Adjusted Earnings Per Share – represents diluted earnings per share from continuing operations (the most comparable GAAP financi al measure) before special items including restructuring and other charges, acquisition related charges, tax sharing income related to adjustments to prior pe rio d tax returns and other tax items, other income or charges, and certain significant tax items, if any, and, if applicable, the related tax effects. This measure is a signifi can t component in our incentive compensation plans.
TE Connectivity Confidential & Proprietary. Do not reproduce or distribute. 20 • Adjusted EBITDA and Adjusted EBITDA Margin - represent net income and net income as a percentage of net sales, respectively, (th e most comparable GAAP financial measures) before interest expense, interest income, income taxes, depreciation, and amortization, as adjusted for net other i nco me, income from discontinued operations, and special items including restructuring and other charges, acquisition related charges, and other income or charges, if any . • Free Cash Flow (FCF) – is a useful measure of our ability to generate cash. The difference between net cash provided by continui ng operating activities (the most comparable GAAP financial measure) and Free Cash Flow consists mainly of significant cash outflows and inflows that we believ e a re useful to identify. We believe Free Cash Flow provides useful information to investors as it provides insight into the primary cash flow metric used by managemen t t o monitor and evaluate cash flows generated from our operations. Free Cash Flow is defined as net cash provided by continuing operating activities excluding voluntary pension contributions a nd the cash impact of special items, if any, minus net capital expenditures. Voluntary pension contributions are excluded from the GAAP financial measure because this act ivi ty is driven by economic financing decisions rather than operating activity. Certain special items, including net payments related to pre - separation tax matters an d cash paid (collected) pursuant to collateral requirements related to cross - currency swap contracts, are also excluded by management in evaluating Free Cash Flow. Net capital expenditures consist of capital expenditures less proceeds from the sale of property, plant, and equipment. These items are subtracted because they represent lo ng - term commitments. In the calculation of Free Cash Flow, we subtract certain cash items that are ultimately within management’s and the Board of Di rectors’ discretion to direct and may imply that there is less or more cash available for our programs than the most comparable GAAP financial measure indicates. It shou ld not be inferred that the entire Free Cash Flow amount is available for future discretionary expenditures, as our definition of Free Cash Flow does not consider certain no n - discretionary expenditures, such as debt payments. In addition, we may have other discretionary expenditures, such as discretionary dividends, share repurchases, and bus iness acquisitions, that are not considered in the calculation of Free Cash Flow. • Adjusted Return on Invested Capital (ROIC) – represents adjusted net operating profit after tax divided by average invested capi tal. We use Adjusted Return on Invested Capital as an indicator of our capital efficiency. Adjusted Return on Invested Capital is not a measure defined by GAAP. It is calculated by us, in part, using non - GAAP financial measures. We are providing our calculation of Adjusted Return on Invested Capital as this measure may not be defined and calculated by other companies in the same manner. Non - GAAP Financial Measures (cont.)
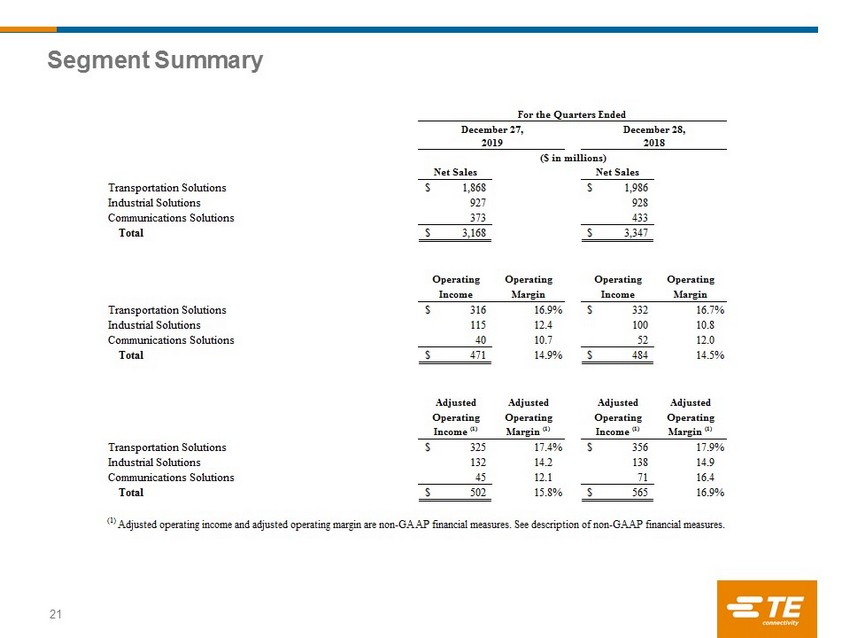
TE Connectivity Confidential & Proprietary. Do not reproduce or distribute. 21 Segment Summary Net Sales Net Sales Transportation Solutions 1,868$ 1,986$ Industrial Solutions 927 928 Communications Solutions 373 433 Total 3,168$ 3,347$ Operating Operating Operating Operating Income Margin Income Margin Transportation Solutions 316$ 16.9% 332$ 16.7% Industrial Solutions 115 12.4 100 10.8 Communications Solutions 40 10.7 52 12.0 Total 471$ 14.9% 484$ 14.5% Adjusted Adjusted Adjusted Adjusted Operating Operating Operating Operating Income (1) Margin (1) Income (1) Margin (1) Transportation Solutions 325$ 17.4% 356$ 17.9% Industrial Solutions 132 14.2 138 14.9 Communications Solutions 45 12.1 71 16.4 Total 502$ 15.8% 565$ 16.9% ($ in millions) (1) Adjusted operating income and adjusted operating margin are non-GAAP financial measures. See description of non-GAAP financial measures. For the Quarters Ended December 27, December 28, 2019 2018
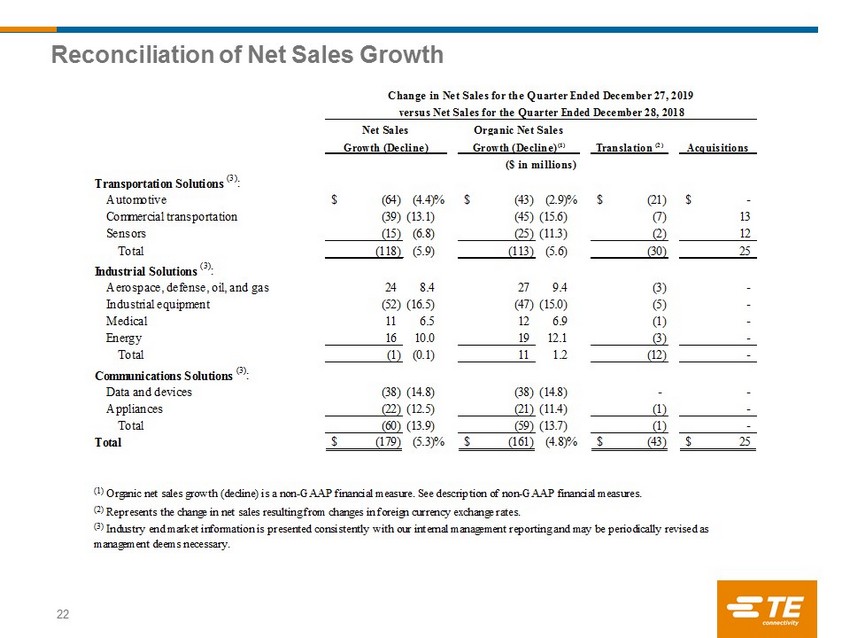
TE Connectivity Confidential & Proprietary. Do not reproduce or distribute. Reconciliation of Net Sales Growth 22 Translation (2) Acquisitions Transportation Solutions (3) : Automotive (64)$ (4.4)% (43)$ (2.9)% (21)$ -$ Commercial transportation (39) (13.1) (45) (15.6) (7) 13 Sensors (15) (6.8) (25) (11.3) (2) 12 Total (118) (5.9) (113) (5.6) (30) 25 Industrial Solutions (3) : Aerospace, defense, oil, and gas 24 8.4 27 9.4 (3) - Industrial equipment (52) (16.5) (47) (15.0) (5) - Medical 11 6.5 12 6.9 (1) - Energy 16 10.0 19 12.1 (3) - Total (1) (0.1) 11 1.2 (12) - Communications Solutions (3) : Data and devices (38) (14.8) (38) (14.8) - - Appliances (22) (12.5) (21) (11.4) (1) - Total (60) (13.9) (59) (13.7) (1) - Total (179)$ (5.3)% (161)$ (4.8)% (43)$ 25$ (1) Organic net sales growth (decline) is a non-GAAP financial measure. See description of non-GAAP financial measures. (2) Represents the change in net sales resulting from changes in foreign currency exchange rates. (3) Industry end market information is presented consistently with our internal management reporting and may be periodically revised as management deems necessary. Organic Net Sales Change in Net Sales for the Quarter Ended December 27, 2019 Growth (Decline)(1) ($ in millions) Growth (Decline) Net Sales versus Net Sales for the Quarter Ended December 28, 2018

TE Connectivity Confidential & Proprietary. Do not reproduce or distribute. Reconciliation of Non - GAAP Financial Measures to GAAP Financial Measures for the Quarter Ended December 27, 2019 23 Acquisition- Restructuring Related and Other Adjusted U.S. GAAP Charges(1) Charges, Net (1) Tax Items (2) (Non-GAAP) (3) Operating income: Transportation Solutions 316$ 5$ 4$ -$ 325$ Industrial Solutions 115 2 15 - 132 Communications Solutions 40 - 5 - 45 Total 471$ 7$ 24$ -$ 502$ Operating margin 14.9% 15.8% Other income, net 5$ -$ -$ -$ 5$ Income tax expense (447)$ (1)$ -$ 355$ (93)$ Effective tax rate 95.1% 18.6% Income from continuing operations 23$ 6$ 24$ 355$ 408$ Diluted earnings per share from continuing operations 0.07$ 0.02$ 0.07$ 1.05$ 1.21$ (3) See description of non-GAAP financial measures. ($ in millions, except per share data) (1) The tax effect of each non-GAAP adjustment is calculated based on the jurisdictions in which the expense (income) is incurred and the tax laws in effect for each such jurisdiction. Adjustments (2) Income tax expense related to the tax impacts of certain measures of Swiss tax reform.
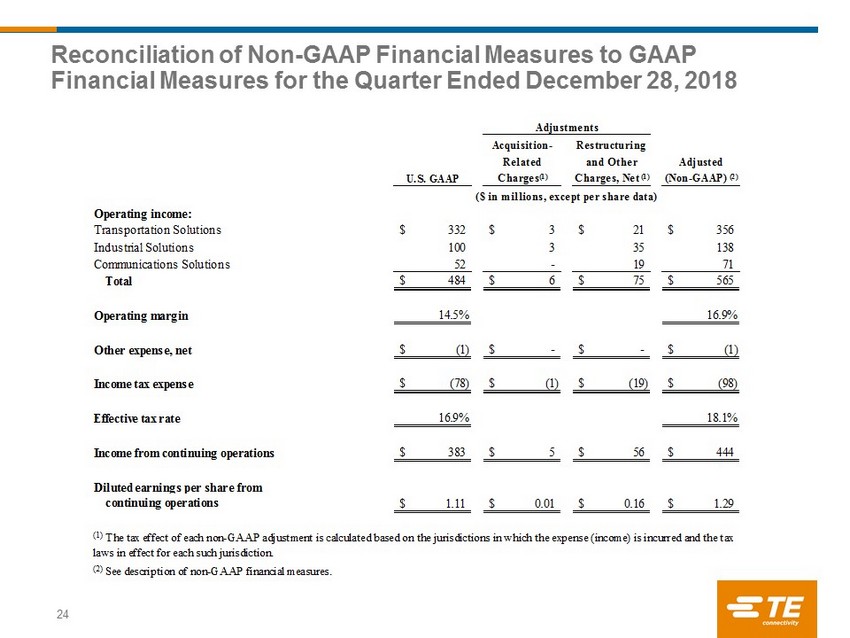
TE Connectivity Confidential & Proprietary. Do not reproduce or distribute. Reconciliation of Non - GAAP Financial Measures to GAAP Financial Measures for the Quarter Ended December 28, 2018 24 Acquisition- Restructuring Related and Other Adjusted U.S. GAAP Charges(1) Charges, Net (1) (Non-GAAP) (2) Operating income: Transportation Solutions 332$ 3$ 21$ 356$ Industrial Solutions 100 3 35 138 Communications Solutions 52 - 19 71 Total 484$ 6$ 75$ 565$ Operating margin 14.5% 16.9% Other expense, net (1)$ -$ -$ (1)$ Income tax expense (78)$ (1)$ (19)$ (98)$ Effective tax rate 16.9% 18.1% Income from continuing operations 383$ 5$ 56$ 444$ Diluted earnings per share from continuing operations 1.11$ 0.01$ 0.16$ 1.29$ (2) See description of non-GAAP financial measures. (1) The tax effect of each non-GAAP adjustment is calculated based on the jurisdictions in which the expense (income) is incurred and the tax laws in effect for each such jurisdiction. ($ in millions, except per share data) Adjustments

TE Connectivity Confidential & Proprietary. Do not reproduce or distribute. Reconciliation of Non - GAAP Financial Measures to GAAP Financial Measures for the Quarter Ended March 29, 2019 25 Acquisition- Restructuring Related and Other Tax Adjusted U.S. GAAP Charges(1) Charges, Net (1) Items (2) (Non-GAAP) (3) Operating income: Transportation Solutions 316$ 4$ 24$ -$ 344$ Industrial Solutions 137 5 17 - 159 Communications Solutions 77 - 1 - 78 Total 530$ 9$ 42$ -$ 581$ Operating margin 15.5% 17.0% Other income, net 1$ -$ -$ -$ 1$ Income tax expense (91)$ (2)$ (10)$ 15$ (88)$ Effective tax rate 17.5% 15.4% Income from continuing operations 429$ 7$ 32$ 15$ 483$ Diluted earnings per share from continuing operations 1.26$ 0.02$ 0.09$ 0.04$ 1.42$ (3) See description of non-GAAP financial measures. Adjustments ($ in millions, except per share data) (1) The tax effect of each non-GAAP adjustment is calculated based on the jurisdictions in which the expense (income) is incurred and the tax laws in effect for each such jurisdiction. (2) Includes income tax expense associated with the tax impacts of certain legal entity restructurings and intercompany transactions.
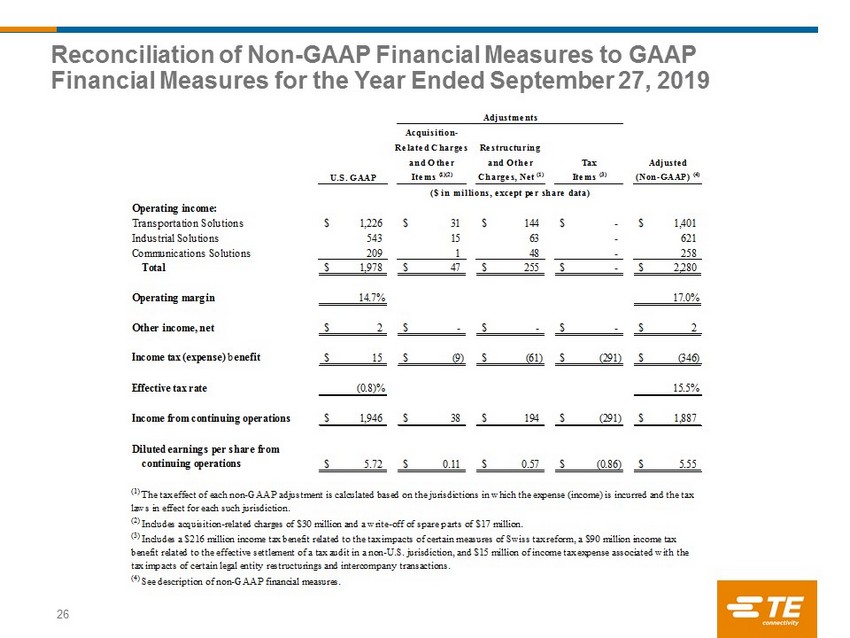
TE Connectivity Confidential & Proprietary. Do not reproduce or distribute. Reconciliation of Non - GAAP Financial Measures to GAAP Financial Measures for the Year Ended September 27, 2019 26 Acquisition- Related Charges Restructuring and Other and Other Tax Adjusted U.S. GAAP Items (1)(2) Charges, Net (1) Items (3) (Non-GAAP) (4) Operating income: Transportation Solutions 1,226$ 31$ 144$ -$ 1,401$ Industrial Solutions 543 15 63 - 621 Communications Solutions 209 1 48 - 258 Total 1,978$ 47$ 255$ -$ 2,280$ Operating margin 14.7% 17.0% Other income, net 2$ -$ -$ -$ 2$ Income tax (expense) benefit 15$ (9)$ (61)$ (291)$ (346)$ Effective tax rate (0.8)% 15.5% Income from continuing operations 1,946$ 38$ 194$ (291)$ 1,887$ Diluted earnings per share from continuing operations 5.72$ 0.11$ 0.57$ (0.86)$ 5.55$ Adjustments (4) See description of non-GAAP financial measures. ($ in millions, except per share data) (1) The tax effect of each non-GAAP adjustment is calculated based on the jurisdictions in which the expense (income) is incurred and the tax laws in effect for each such jurisdiction. (3) Includes a $216 million income tax benefit related to the tax impacts of certain measures of Swiss tax reform, a $90 million income tax benefit related to the effective settlement of a tax audit in a non-U.S. jurisdiction, and $15 million of income tax expense associated with the tax impacts of certain legal entity restructurings and intercompany transactions. (2) Includes acquisition-related charges of $30 million and a write-off of spare parts of $17 million.
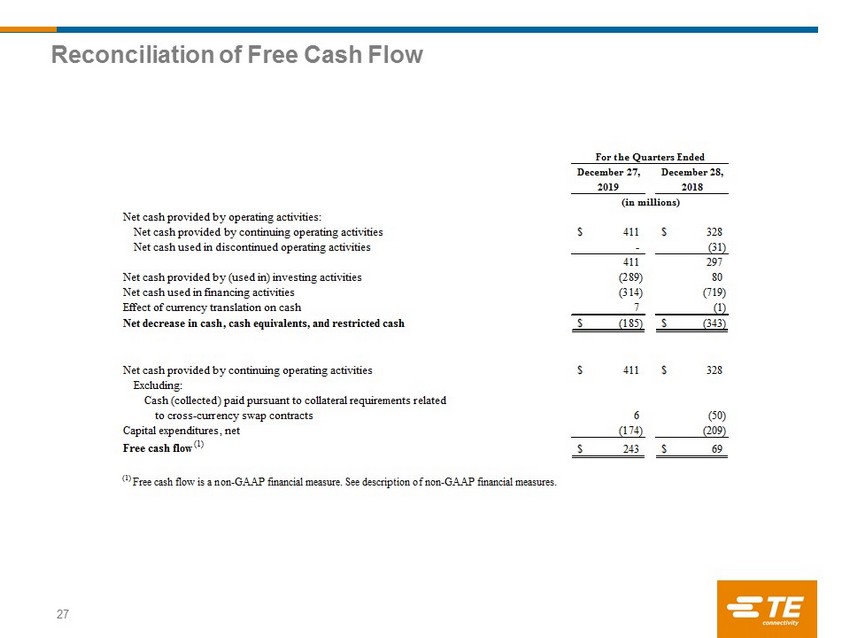
TE Connectivity Confidential & Proprietary. Do not reproduce or distribute. Reconciliation of Free Cash Flow 27 December 27, December 28, 2019 2018 Net cash provided by operating activities: Net cash provided by continuing operating activities 411$ 328$ Net cash used in discontinued operating activities - (31) 411 297 Net cash provided by (used in) investing activities (289) 80 Net cash used in financing activities (314) (719) Effect of currency translation on cash 7 (1) Net decrease in cash, cash equivalents, and restricted cash (185)$ (343)$ Net cash provided by continuing operating activities 411$ 328$ Excluding: Cash (collected) paid pursuant to collateral requirements related to cross-currency swap contracts 6 (50) Capital expenditures, net (174) (209) Free cash flow (1) 243$ 69$ (1) Free cash flow is a non-GAAP financial measure. See description of non-GAAP financial measures. For the Quarters Ended (in millions)
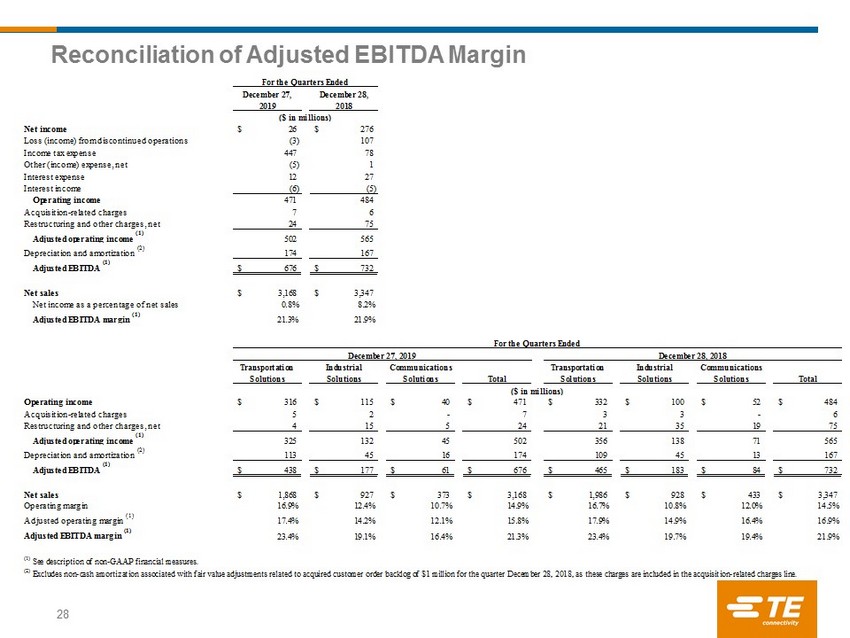
TE Connectivity Confidential & Proprietary. Do not reproduce or distribute. Reconciliation of Adjusted EBITDA Margin 28 December 27, December 28, 2019 2018 Net income 26$ 276$ Loss (income) from discontinued operations (3) 107 Income tax expense 447 78 Other (income) expense, net (5) 1 Interest expense 12 27 Interest income (6) (5) Operating income 471 484 Acquisition-related charges 7 6 Restructuring and other charges, net 24 75 Adjusted operating income (1) 502 565 Depreciation and amortization (2) 174 167 Adjusted EBITDA (1) 676$ 732$ Net sales 3,168$ 3,347$ Net income as a percentage of net sales 0.8% 8.2% Adjusted EBITDA margin (1) 21.3% 21.9% Transportation Industrial Communications Transportation Industrial Communications Solutions Solutions Solutions Total Solutions Solutions Solutions Total Operating income 316$ 115$ 40$ 471$ 332$ 100$ 52$ 484$ Acquisition-related charges 5 2 - 7 3 3 - 6 Restructuring and other charges, net 4 15 5 24 21 35 19 75 Adjusted operating income (1) 325 132 45 502 356 138 71 565 Depreciation and amortization (2) 113 45 16 174 109 45 13 167 Adjusted EBITDA (1) 438$ 177$ 61$ 676$ 465$ 183$ 84$ 732$ Net sales 1,868$ 927$ 373$ 3,168$ 1,986$ 928$ 433$ 3,347$ Operating margin 16.9% 12.4% 10.7% 14.9% 16.7% 10.8% 12.0% 14.5% Adjusted operating margin (1) 17.4% 14.2% 12.1% 15.8% 17.9% 14.9% 16.4% 16.9% Adjusted EBITDA margin (1) 23.4% 19.1% 16.4% 21.3% 23.4% 19.7% 19.4% 21.9% (2) Excludes non-cash amortization associated with fair value adjustments related to acquired customer order backlog of $1 million for the quarter December 28, 2018, as these charges are included in the acquisition-related charges line. For the Quarters Ended (1) See description of non-GAAP financial measures. December 27, 2019 December 28, 2018 For the Quarters Ended ($ in millions) ($ in millions)
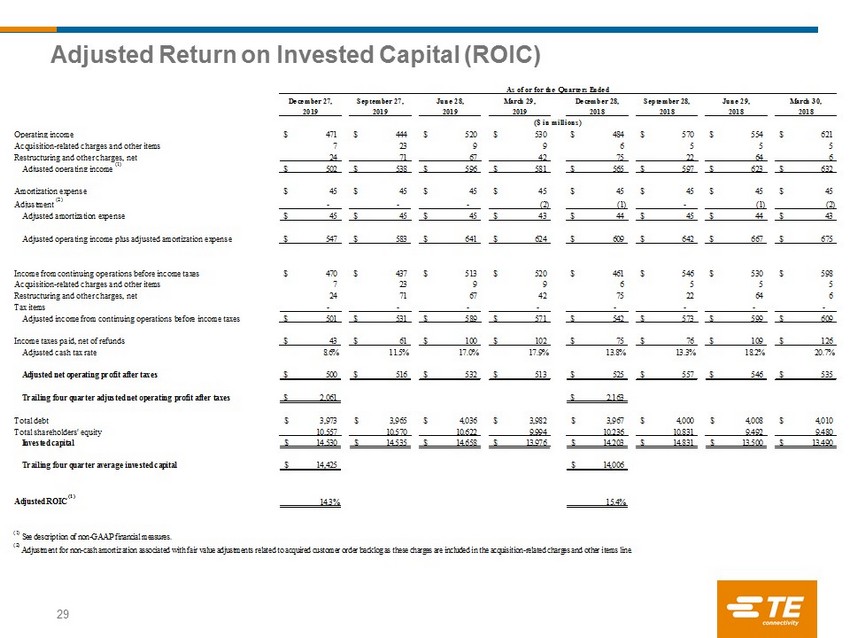
TE Connectivity Confidential & Proprietary. Do not reproduce or distribute. Adjusted Return on Invested Capital (ROIC) 29 December 27, September 27, June 28, March 29, December 28, September 28, June 29, March 30, 2019 2019 2019 2019 2018 2018 2018 2018 Operating income 471$ 444$ 520$ 530$ 484$ 570$ 554$ 621$ Acquisition-related charges and other items 7 23 9 9 6 5 5 5 Restructuring and other charges, net 24 71 67 42 75 22 64 6 Adjusted operating income (1) 502$ 538$ 596$ 581$ 565$ 597$ 623$ 632$ Amortization expense 45$ 45$ 45$ 45$ 45$ 45$ 45$ 45$ Adjustment (2) - - - (2) (1) - (1) (2) Adjusted amortization expense 45$ 45$ 45$ 43$ 44$ 45$ 44$ 43$ Adjusted operating income plus adjusted amortization expense 547$ 583$ 641$ 624$ 609$ 642$ 667$ 675$ Income from continuing operations before income taxes 470$ 437$ 513$ 520$ 461$ 546$ 530$ 598$ Acquisition-related charges and other items 7 23 9 9 6 5 5 5 Restructuring and other charges, net 24 71 67 42 75 22 64 6 Tax items - - - - - - - - Adjusted income from continuing operations before income taxes 501$ 531$ 589$ 571$ 542$ 573$ 599$ 609$ Income taxes paid, net of refunds 43$ 61$ 100$ 102$ 75$ 76$ 109$ 126$ Adjusted cash tax rate 8.6% 11.5% 17.0% 17.9% 13.8% 13.3% 18.2% 20.7% Adjusted net operating profit after taxes 500$ 516$ 532$ 513$ 525$ 557$ 546$ 535$ Trailing four quarter adjusted net operating profit after taxes 2,061$ 2,163$ Total debt 3,973$ 3,965$ 4,036$ 3,982$ 3,967$ 4,000$ 4,008$ 4,010$ Total shareholders' equity 10,557 10,570 10,622 9,994 10,236 10,831 9,492 9,480 Invested capital 14,530$ 14,535$ 14,658$ 13,976$ 14,203$ 14,831$ 13,500$ 13,490$ Trailing four quarter average invested capital 14,425$ 14,006$ Adjusted ROIC (1) 14.3% 15.4% (1) See description of non-GAAP financial measures. (2) Adjustment for non-cash amortization associated with fair value adjustments related to acquired customer order backlog as these charges are included in the acquisition-related charges and other items line. As of or for the Quarters Ended ($ in millions)
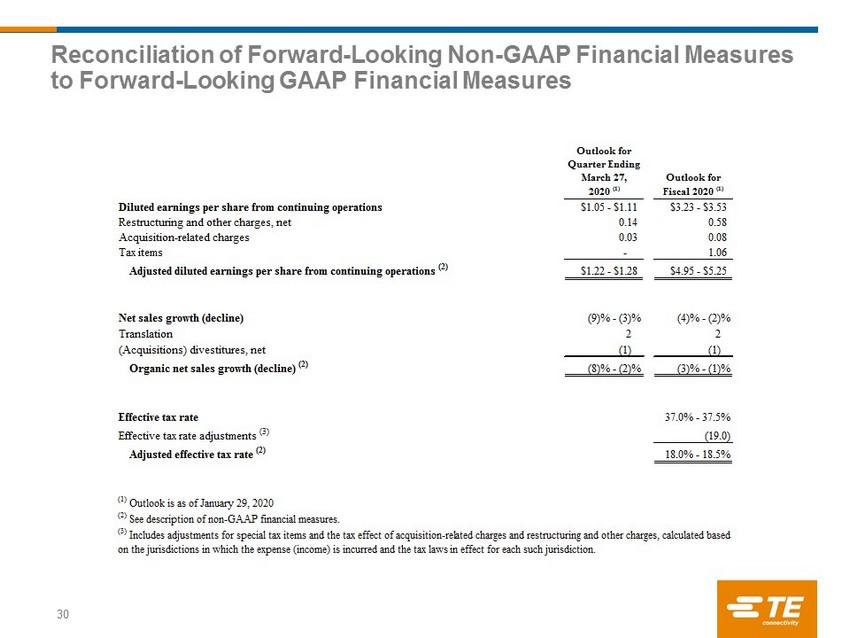
TE Connectivity Confidential & Proprietary. Do not reproduce or distribute. Reconciliation of Forward - Looking Non - GAAP Financial Measures to Forward - Looking GAAP Financial Measures 30 Outlook for Quarter Ending March 27, Outlook for 2020 (1) Fiscal 2020 (1) Diluted earnings per share from continuing operations $1.05 - $1.11 $3.23 - $3.53 Restructuring and other charges, net 0.14 0.58 Acquisition-related charges 0.03 0.08 Tax items - 1.06 Adjusted diluted earnings per share from continuing operations (2) $1.22 - $1.28 $4.95 - $5.25 Net sales growth (decline) (9)% - (3)% (4)% - (2)% Translation 2 2 (Acquisitions) divestitures, net (1) (1) Organic net sales growth (decline) (2) (8)% - (2)% (3)% - (1)% Effective tax rate 37.0% - 37.5% Effective tax rate adjustments (3) (19.0) Adjusted effective tax rate (2) 18.0% - 18.5% (3) Includes adjustments for special tax items and the tax effect of acquisition-related charges and restructuring and other charges, calculated based on the jurisdictions in which the expense (income) is incurred and the tax laws in effect for each such jurisdiction. (1) Outlook is as of January 29, 2020 (2) See description of non-GAAP financial measures.