Attached files
| file | filename |
|---|---|
| EX-99.1 - EXHIBIT 99.1 - AUTOMATIC DATA PROCESSING INC | q2fy20exhibit99.htm |
| 8-K - 8-K - AUTOMATIC DATA PROCESSING INC | q2fy20adpearningsrelea.htm |
ADP Earnings Call & Webcast Q2 Fiscal 2020 January 29, 2020 Copyright © 2020 ADP, LLC
Forward Looking Statements This presentation and other written or oral statements made from time to time by ADP may contain “forward-looking statements” within the meaning of the Private Securities Litigation Reform Act of 1995. Statements that are not historical in nature and which may be identified by the use of words like “expects,” “assumes,” “projects,” “anticipates,” “estimates,” “we believe,” “could” “is designed to” and other words of similar meaning, are forward-looking statements. These statements are based on management’s expectations and assumptions and depend upon or refer to future events or conditions and are subject to risks and uncertainties that may cause actual results to differ materially from those expressed. Factors that could cause actual results to differ materially from those contemplated by the forward- looking statements or that could contribute to such difference include: ADP's success in obtaining, and retaining, clients, and selling additional services to clients; the pricing of products and services; the success of our new solutions; compliance with existing or new legislation or regulations; changes in, or interpretations of, existing legislation or regulations; overall market, political and economic conditions, including interest rate and foreign currency trends; competitive conditions; our ability to maintain our current credit ratings and the impact on our funding costs and profitability; security or cyber breaches, fraudulent acts, and system interruptions and failures; employment and wage levels; changes in technology; availability of skilled technical associates; the impact of new acquisitions and divestitures; and the adequacy, effectiveness and success of our business transformation initiatives. ADP disclaims any obligation to update any forward-looking statements, whether as a result of new information, future events or otherwise, except as required by law. These risks and uncertainties, along with the risk factors discussed under “Item 1A. Risk Factors” of our most recent Annual Report on Form 10-K, and in other written or oral statements made from time to time by ADP, should be considered in evaluating any forward-looking statements contained herein. Non-GAAP Measures Adjusted EBIT, adjusted EBIT margin, adjusted diluted earnings per share, adjusted effective tax rate, and organic constant currency are all non-GAAP financial measures. Please refer to the Q2 fiscal 2020 earnings release available at investors.adp.com for a discussion of why ADP believes these measures are important and for a reconciliation of non-GAAP financial measures to their comparable GAAP financial measures. This presentation is a supplement to our Q2 fiscal 2020 earnings release; it is intended to be read in conjunction with, not as a substitute for, or in isolation from, the earnings release. 2 Copyright © 2020 ADP, LLC

CEO’s Perspective • Strong overall quarter with 5% revenue growth, 70bps adjusted EBIT (a) margin expansion, and 13% adjusted diluted EPS (a) growth • ES New Business Bookings growth of 3% driven by continued solid U.S. performance, offset by international and multinational • Continued progress and positive reception to the roll-out of our Next Gen solutions • Continuing our track record of shareholder friendly actions; recently increased dividend for 45th consecutive year (a) For a reconciliation of these non-GAAP financial metrics to their closest comparable GAAP metrics see our Q2 fiscal 2020 earnings release available at investors.adp.com. 3 Copyright © 2020 ADP, LLC
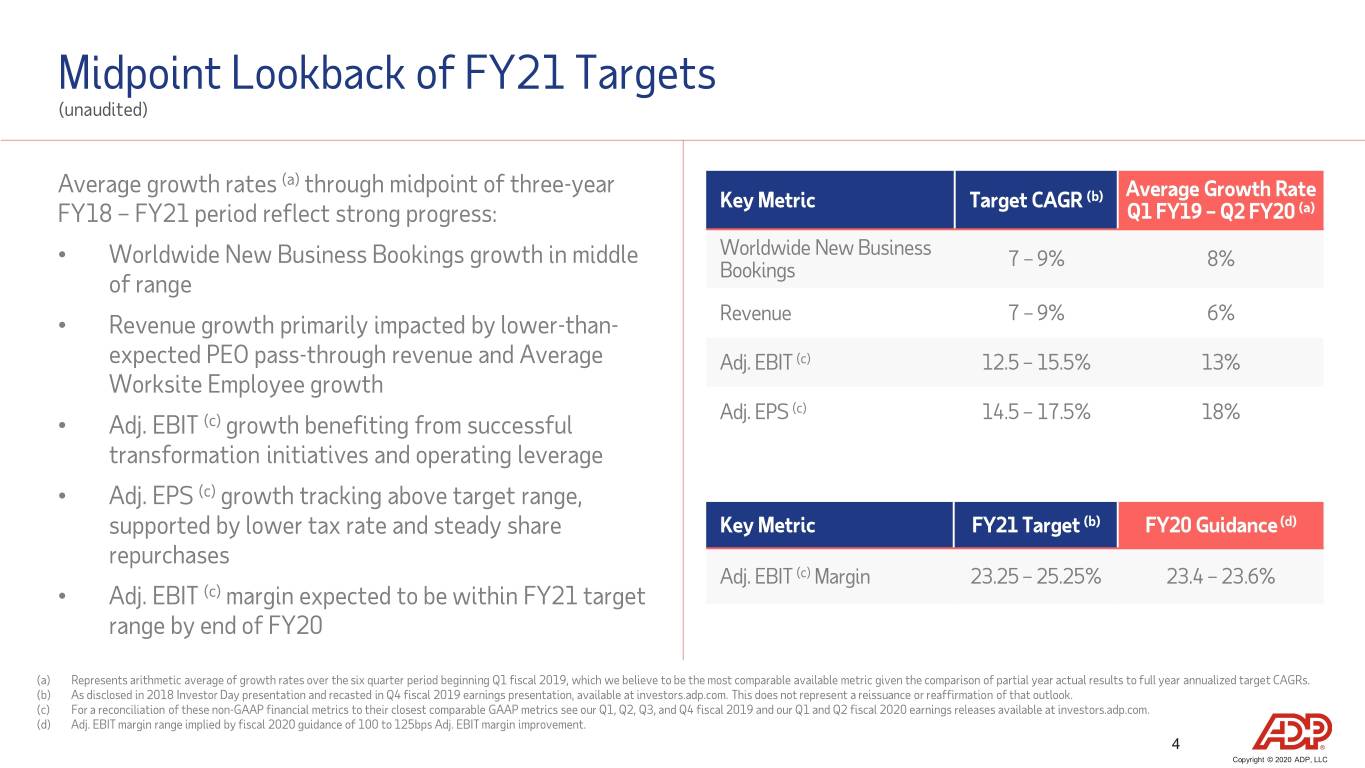
Midpoint Lookback of FY21 Targets (unaudited) Average growth rates (a) through midpoint of three-year Average Growth Rate Key Metric Target CAGR (b) FY18 – FY21 period reflect strong progress: Q1 FY19 – Q2 FY20 (a) Worldwide New Business • Worldwide New Business Bookings growth in middle 7 – 9% 8% Bookings of range Revenue 7 – 9% 6% • Revenue growth primarily impacted by lower-than- expected PEO pass-through revenue and Average Adj. EBIT (c) 12.5 – 15.5% 13% Worksite Employee growth Adj. EPS (c) 14.5 – 17.5% 18% • Adj. EBIT (c) growth benefiting from successful transformation initiatives and operating leverage • Adj. EPS (c) growth tracking above target range, supported by lower tax rate and steady share Key Metric FY21 Target (b) FY20 Guidance (d) repurchases Adj. EBIT (c) Margin 23.25 – 25.25% 23.4 – 23.6% • Adj. EBIT (c) margin expected to be within FY21 target range by end of FY20 (a) Represents arithmetic average of growth rates over the six quarter period beginning Q1 fiscal 2019, which we believe to be the most comparable available metric given the comparison of partial year actual results to full year annualized target CAGRs. (b) As disclosed in 2018 Investor Day presentation and recasted in Q4 fiscal 2019 earnings presentation, available at investors.adp.com. This does not represent a reissuance or reaffirmation of that outlook. (c) For a reconciliation of these non-GAAP financial metrics to their closest comparable GAAP metrics see our Q1, Q2, Q3, and Q4 fiscal 2019 and our Q1 and Q2 fiscal 2020 earnings releases available at investors.adp.com. (d) Adj. EBIT margin range implied by fiscal 2020 guidance of 100 to 125bps Adj. EBIT margin improvement. 4 Copyright © 2020 ADP, LLC

Q2 Fiscal 2020 Financial Highlights (unaudited) Total Revenues Adjusted EBIT (a) Adjusted Diluted EPS (a) h 5% h 9% h 13% h 6% Organic Constant Currency (a) $1.52 $854M $1.34 $3.5B $3.7B $787M Q2 FY19 Q2 FY20 Q2 FY19 Q2 FY20 Q2 FY19 Q2 FY20 (a) For a reconciliation of these non-GAAP financial metrics to their closest comparable GAAP metrics see our Q2 fiscal 2020 earnings release available at investors.adp.com. 5 Copyright © 2020 ADP, LLC
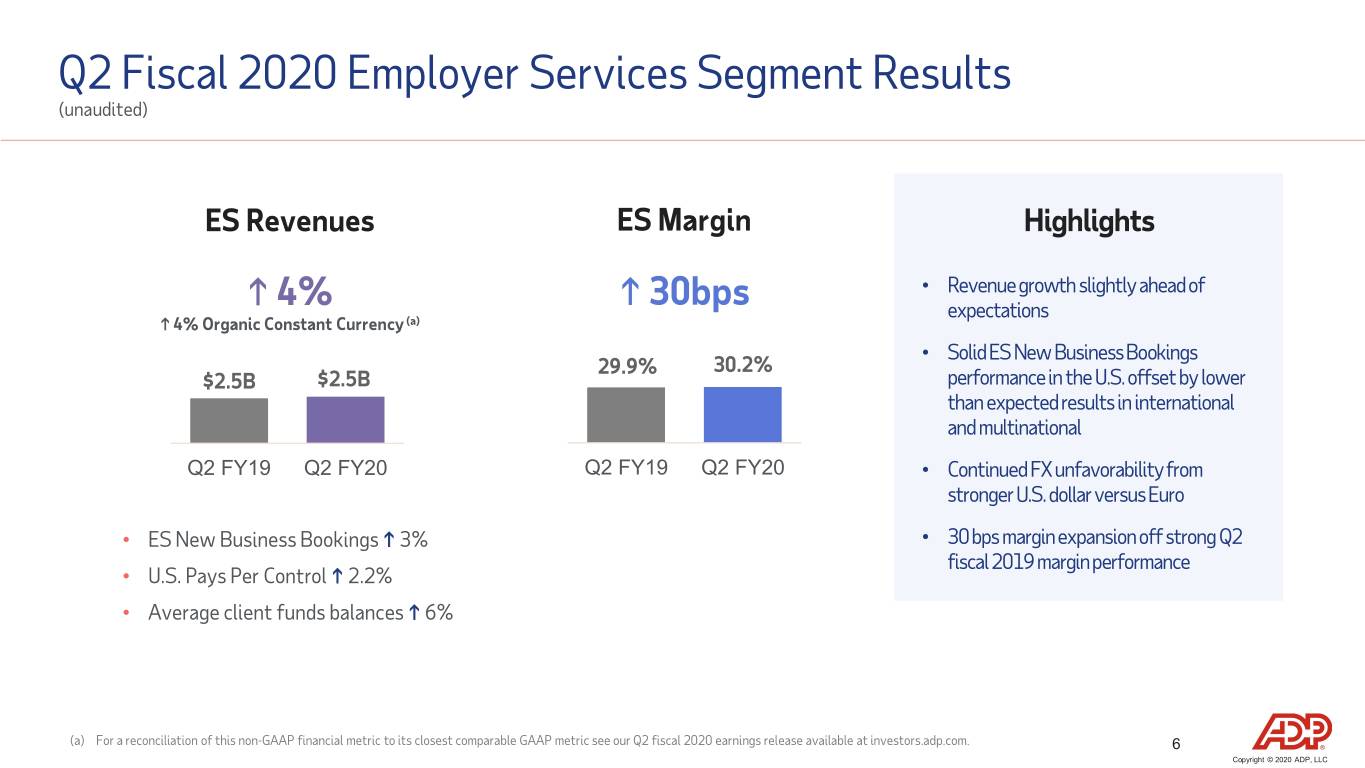
Q2 Fiscal 2020 Employer Services Segment Results (unaudited) ES Revenues ES Margin Highlights • Revenue growth slightly ahead of h 4% h 30bps expectations h 4% Organic Constant Currency (a) • Solid ES New Business Bookings 29.9% 30.2% $2.5B $2.5B performance in the U.S. offset by lower than expected results in international and multinational Q2 FY19 Q2 FY20 Q2 FY19 Q2 FY20 • Continued FX unfavorabilityfrom stronger U.S. dollar versus Euro • ES New Business Bookings h 3% • 30 bps margin expansion off strong Q2 fiscal 2019 margin performance • U.S. Pays Per Control h 2.2% • Average client funds balances h 6% (a) For a reconciliation of this non-GAAP financial metric to its closest comparable GAAP metric see our Q2 fiscal 2020 earnings release available at investors.adp.com. 6 Copyright © 2020 ADP, LLC

Q2 Fiscal 2020 PEO Services Segment Results (unaudited) PEO Revenues PEO Margin Highlights • Strong double-digit bookings growth; h 9% i 30bps continue to expect improvement in Average WSE growth through the remainder of the year $1.0B $1.1B 15.1% 14.7% • Margins impacted by increased selling expense and difficult Q2 FY19 compare Q2 FY19 Q2 FY20 Q2 FY19 Q2 FY20 • Slight benefit from ADP Indemnity in the quarter, in line with expectations; no change to full year expectation for 50 • Revenues excluding zero-margin • Includes 30 basis points of bps of pressure benefits pass-throughs h 7% benefit from ADP Indemnity • Average Worksite Employees paid h 6% to 579,000 7 Copyright © 2020 ADP, LLC
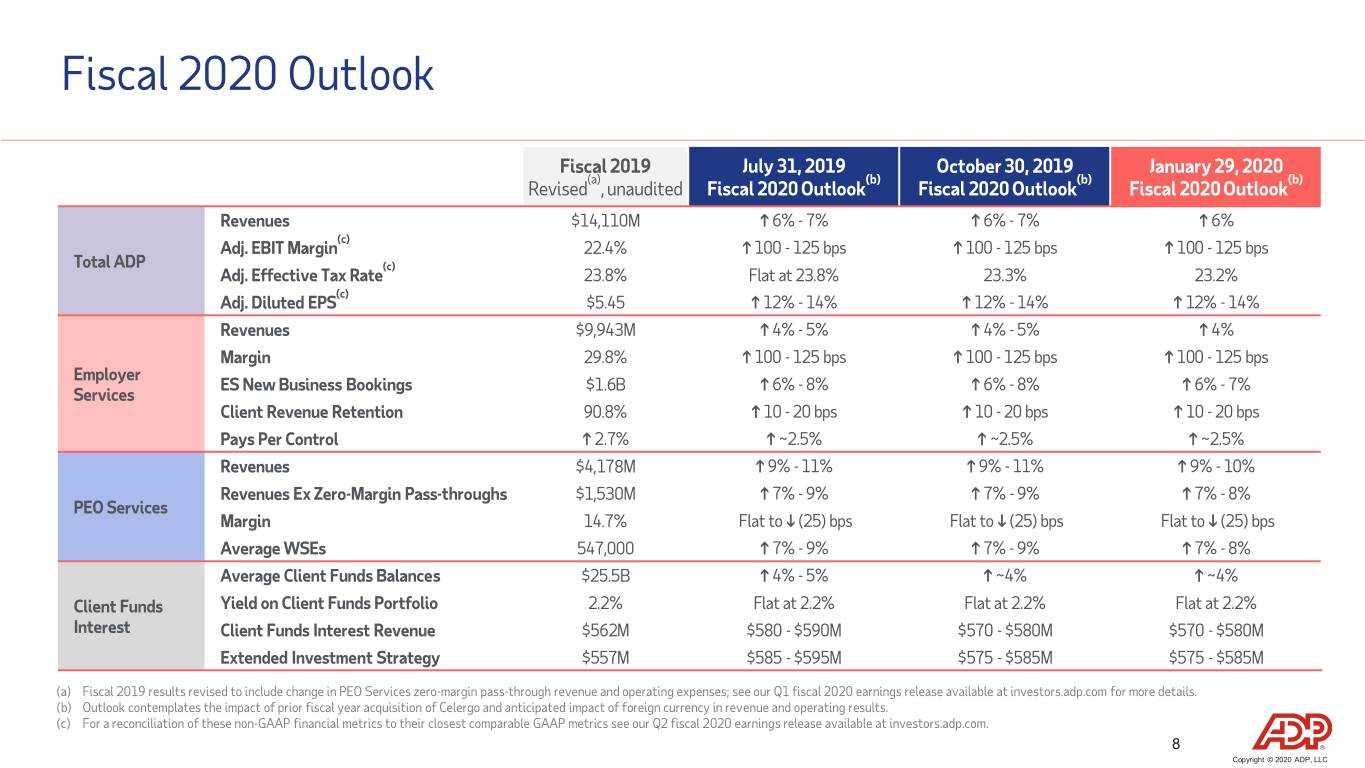
Fiscal 2020 Outlook Fiscal 2019 July 31, 2019 October 30, 2019 January 29, 2020 (a) (b) (b) (b) Revised , unaudited Fiscal 2020 Outlook Fiscal 2020 Outlook Fiscal 2020 Outlook Revenues $14,110M h 6% - 7% h 6% - 7% h 6% (c) Adj. EBIT Margin 22.4% h 100 - 125 bps h 100 - 125 bps h 100 - 125 bps Total ADP (c) Adj. Effective Tax Rate 23.8% Flat at 23.8% 23.3% 23.2% (c) Adj. Diluted EPS $5.45 h 12% - 14% h 12% - 14% h 12% - 14% Revenues $9,943M h 4% - 5% h 4% - 5% h 4% Margin 29.8% h 100 - 125 bps h 100 - 125 bps h 100 - 125 bps Employer ES New Business Bookings $1.6B h 6% - 8% h 6% - 8% h 6% - 7% Services Client Revenue Retention 90.8% h 10 - 20 bps h 10 - 20 bps h 10 - 20 bps Pays Per Control h 2.7% h ~2.5% h ~2.5% h ~2.5% Revenues $4,178M h 9% - 11% h 9% - 11% h 9% - 10% Revenues Ex Zero-Margin Pass-throughs $1,530M h 7% - 9% h 7% - 9% h 7% - 8% PEO Services Margin 14.7% Flat to i (25) bps Flat to i (25) bps Flat to i (25) bps Average WSEs 547,000 h 7% - 9% h 7% - 9% h 7% - 8% Average Client Funds Balances $25.5B h 4% - 5% h ~4% h ~4% Client Funds Yield on Client Funds Portfolio 2.2% Flat at 2.2% Flat at 2.2% Flat at 2.2% Interest Client Funds Interest Revenue $562M $580 - $590M $570 - $580M $570 - $580M Extended Investment Strategy $557M $585 - $595M $575 - $585M $575 - $585M (a) Fiscal 2019 results revised to include change in PEO Services zero-margin pass-through revenue and operating expenses; see our Q1 fiscal 2020 earnings release available at investors.adp.com for more details. (b) Outlook contemplates the impact of prior fiscal year acquisition of Celergo and anticipated impact of foreign currency in revenue and operating results. (c) For a reconciliation of these non-GAAP financial metrics to their closest comparable GAAP metrics see our Q2 fiscal 2020 earnings release available at investors.adp.com. 8 Copyright © 2020 ADP, LLC
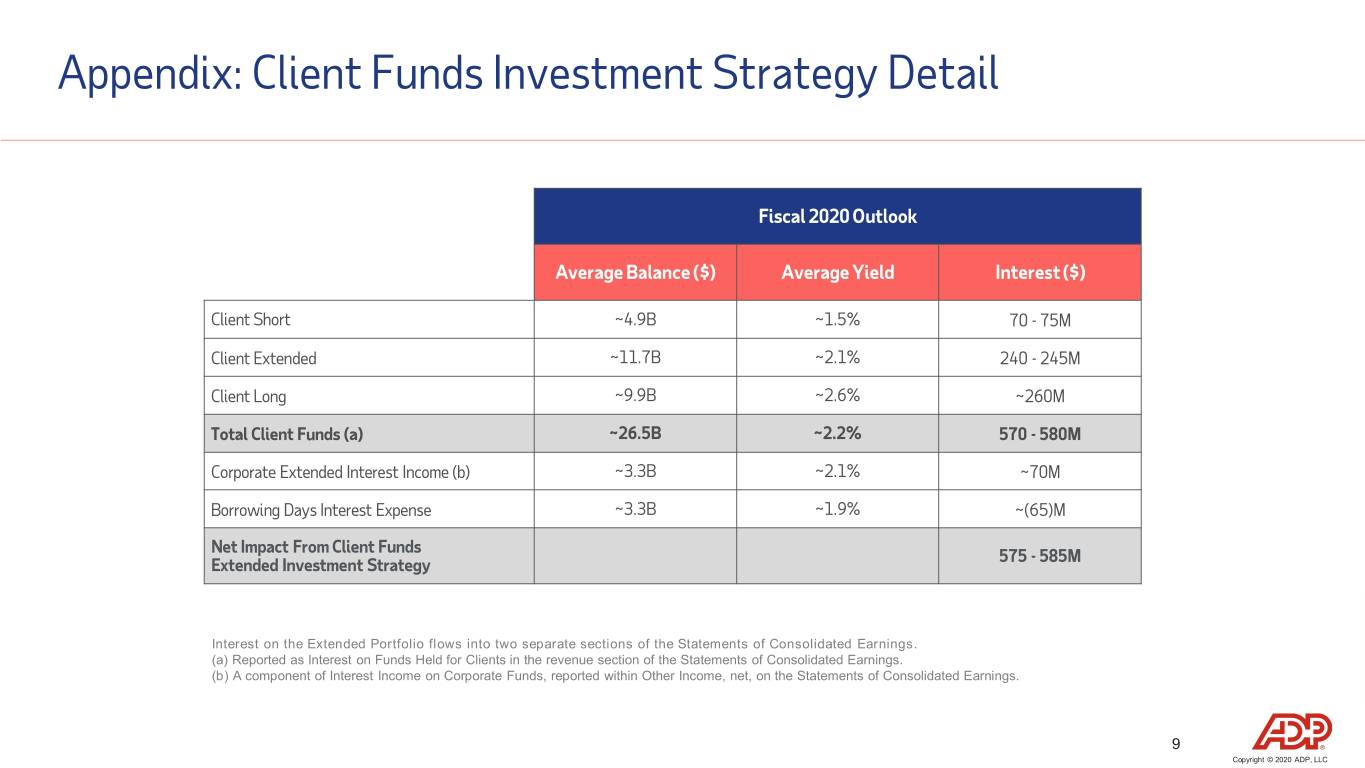
Appendix: Client Funds Investment Strategy Detail Fiscal 2020 Outlook Average Balance ($) Average Yield Interest ($) Client Short ~4.9B ~1.5% 70 - 75M Client Extended ~11.7B ~2.1% 240 - 245M Client Long ~9.9B ~2.6% ~260M Total Client Funds (a) ~26.5B ~2.2% 570 - 580M Corporate Extended Interest Income (b) ~3.3B ~2.1% ~70M Borrowing Days Interest Expense ~3.3B ~1.9% ~(65)M Net Impact From Client Funds 575 - 585M Extended Investment Strategy Interest on the Extended Portfolio flows into two separate sections of the Statements of Consolidated Earnings. (a) Reported as Interest on Funds Held for Clients in the revenue section of the Statements of Consolidated Earnings. (b) A component of Interest Income on Corporate Funds, reported within Other Income, net, on the Statements of Consolidated Earnings. 9 Copyright © 2020 ADP, LLC
