Attached files
| file | filename |
|---|---|
| EX-99..1 - EXHIBIT 99..1 - SMARTFINANCIAL INC. | a123119earningsexhibit991.htm |
| 8-K - 8-K - SMARTFINANCIAL INC. | a2019q4earningsreleasecover.htm |

Fourth Quarter 2019 Earnings Release January 21, 2020

Legal Disclaimer Forward-Looking Statements This news release may contain statements that are based on management’s current estimates or expectations of future events or future results, and that may be deemed to constitute forward-looking statements as defined under the Private Securities Litigation Reform Act. These statements are not historical in nature and can generally be identified by such words as “expect,” “anticipate,” “intend,” “plan,” “believe,” “seek,” “may,” “estimate,” and similar expressions. All forward-looking statements are subject to risks, uncertainties, and other factors that may cause the actual results of SmartFinancial to differ materially from future results expressed or implied by such forward-looking statements. Such risks, uncertainties, and other factors include, among others, (1) the risk of litigation related to the termination of our agreement and plan of merger with Entegra Financial Corp. (the “Entegra Merger Agreement”) or the abandonment of the transactions that were contemplated by the Entegra Merger Agreement; (2) reputational risk resulting from the termination of the Entegra Merger Agreement; (3) potential changes to, or the risk that we may not be able to execute on, our business strategy as a result of the termination of the Entegra Merger Agreement; (4) the risk that cost savings and revenue synergies from recently completed acquisitions may not be realized or may take longer than anticipated to realize; (5) disruption from recently completed acquisitions with customer, supplier, employee, or other business relationships; (6) our ability to successfully integrate the businesses acquired as part of previous acquisitions with the business of SmartBank; (7) risks related to the proposed acquisition of PFG, including the risk that the proposed acquisition does not close when expected or at all because conditions to closing are not satisfied on a timely basis or at all, or the terms of the proposed transaction need to be modified to satisfy such conditions; (8) the risk that the anticipated benefits from the proposed acquisition of PFG may not be realized in the time frame anticipated; (9) changes in management’s plans for the future; (10) prevailing, or changes in, economic or political conditions, particularly in our market areas; (11) credit risk associated with our lending activities; (12) changes in interest rates, loan demand, real estate values, or competition; (13) changes in accounting principles, policies, or guidelines; (14) changes in applicable laws, rules, or regulations; and (15) other general competitive, economic, political, and market factors, including those affecting our business, operations, pricing, products, or services. These and other factors that could cause results to differ materially from those described in the forward-looking statements can be found in SmartFinancial’s most recent annual report on Form 10-K, quarterly reports on Form 10-Q, and current reports on Form 8-K, in each case filed with or furnished to the Securities and Exchange Commission (the “SEC”) and available on the SEC’s website (www.sec.gov). Undue reliance should not be placed on forward-looking statements. SmartFinancial disclaims any obligation to update or revise any forward-looking statements contained in this release, which speak only as of the date hereof, whether as a result of new information, future events, or otherwise. Non-GAAP Financial Measures Statements included in this presentation include Non-GAAP financial measures and should be read along with the accompanying tables, which provide a reconciliation of Non-GAAP financial measures to GAAP financial measures. SmartFinancial management uses several Non-GAAP financial measures, including: (i) net operating earnings, (ii) net operating return on average assets, (iii) net operating return on average shareholder equity, (iv) return on average tangible common equity, (v) net operating return on average tangible common equity, (vi) operating efficiency ratio; (vii) tangible common equity; (viii) average tangible common equity; (ix) tangible book value; and ratios derived therefrom, in its analysis of the company's performance. Net operating earnings excludes the following from net income: securities gains and losses, merger termination fee of $6.4 million in the second quarter of 2019, merger related and restructuring expenses, the effect of the December 2017 tax law change on deferred tax assets, tax benefit from director options previously exercised, and the income tax effect of adjustments. Net operating return on average equity is the annualized net operating earnings divided by average assets. Net operating return on average equity is the annualized net operating earnings divided by average equity. Return on average tangible common equity is the annualized net income divided by average tangible common equity. Net operating return on average tangible common equity is the annualized net operating earnings divided by average tangible common equity (Non-GAAP). The operating efficiency ratio includes an adjustment for taxable equivalent yields and excludes securities gains and losses and merger related and restructuring expenses from the efficiency ratio. Tangible common equity and average tangible common equity excludes goodwill and other intangible assets. Tangible book value excludes intangible assets and goodwill. Management believes that Non-GAAP financial measures provide additional useful information that allows investors to evaluate the ongoing performance of the company and provide meaningful comparisons to its peers. Management believes these non-GAAP financial measures also enhance investors' ability to compare period-to-period financial results and allow investors and company management to view our operating results excluding the impact of items that are not reflective of the underlying operating performance. Non-GAAP financial measures should not be considered as an alternative to any measure of performance or financial condition as promulgated under GAAP, and investors should consider SmartFinancial's performance and financial condition as reported under GAAP and all other relevant information when assessing the performance or financial condition of the company. Non-GAAP financial measures have limitations as analytical tools, and investors should not consider them in isolation or as a substitute for analysis of the results or financial condition as reported under GAAP. 2

Overview of SmartFinancial . SmartFinancial, Inc. (Nasdaq: SMBK) is a $2.4 billion Branch Footprint asset bank holding company headquartered in Knoxville, Tennessee Nashville Knoxville Greensboro . Jonesboro Operates one subsidiary bank, SmartBank, which was founded in 40 January 2007 ARKANSAS . Located primarily in attractive, high-growth markets throughout TENNESSEE NORTH CAROLINA East/Mid Tennessee, Alabama and the Florida PanhandleMemphis Chattanooga . 399 full-time employees 77 . ~$324 million market capitalization(1) Huntsville SOUTH 85 CAROLINA . Balance Sheet (12/31/19) . Assets: $2.4 billion Atlanta Birmingham 20 . Gross Loans: $1.9 billion . Deposits: $2.0 billion Tuscaloosa GEORGIA . Shareholders’ Equity / Tangible Common EquityMISSISSIPPI(Non-GAAP): $313.0 million / $235.6 million ALABAMA Columbus Jackson 16 . Profitability (Q4 ’19) Montgomery Savannah . Net Income / Net Operating Earnings (Non-GAAP): $6.7 million / $6.5 million 65 75 . ROAA / Net Operating ROAA (Non-GAAP): 1.12% / 1.08% 95 . ROATCE / Net Operating ROATCE (Non-GAAP): 11.6% / 11.1% . Efficiency Ratio / Operating Efficiency Ratio (Non-GAAP): 67.0% / Mobile 10 65.0% Baton Rouge Tallahassee SMBK Branch . Asset Quality New Orleans FLORIDA . Superior asset quality and proven credit culture . NPAs / Total Assets of 0.21% . Initiated Regularly Quarterly Dividend . Declared quarterly cash dividend of $0.05 per share Financial data as of or for the three months ended 12/31/19 (1) Pricing data as of 01/17/20 Note: For a reconciliation of Non-GAAP financial measures to their most directly comparable GAAP measures, see the Appendix 3

Culture We are building a culture where Associates thrive and are empowered to be leaders. The core values that we have established as a company help us operate in unison and have become a critical part of our culture. Our Associates are key to SmartBank’s success. Core Values Act with Integrity Delivering Be Enthusiastic Exhibiting Creating Exceptional, Over-The-Top Create Positivity “WOW” Professional & Enthusiasm emonstrate Accountability Experiences Knowledgeable D and Positivity Embrace Change Service Positioning Statement At SmartBank, delivering unparalleled value to our Shareholders, Associates, Clients and the Communities we serve 9 drives every decision and action we take. Exceptional value means being there with smart solutions, fast responses and deep commitment every single time. By doing this, we will create the Southeast’s next, great community banking franchise. 4

Fourth Quarter Financial Highlights

Solid Earnings Track Record $8,000 Capstone Southern Foothills Acquisition Acquisition Acquisition $6,000 GAAP) - $4,000 $2,000 Net Operating Net (Non Operating Earnings ($000) $0 4Q17 1Q18 2Q18 3Q18 4Q18 1Q19 2Q19 3Q19 4Q19 Net Operating Earnings, Less Accretion Accretion, Net of Tax ($ in thousands) 4Q17 1Q18 2Q18 3Q18 4Q18 1Q19 2Q19 3Q19 4Q19 Net Operating Earnings (Non-GAAP) $3,707 $3,810 $4,844 $4,966 $5,907 $5,509 $5,603 $6,016 $6,487 Less: Accretion, Net of Tax ($1,567) ($943) ($1,911) ($894) ($2,039) ($1,392) ($1,017) ($939) ($1,038) Net Operating Earnings, Less Accretion $2,140 $2,867 $2,933 $4,072 $3,869 $4,117 $4,586 $5,077 $5,450 Note: For a reconciliation of Non-GAAP financial measures to their most directly comparable GAAP measures, see the Appendix 6

Performance Trends . Net Operating Earnings (Non-GAAP) of $6.5 ROAA (%) ROATCE (%) million for the quarter, up 10% from a year 1.56 % 16.8 % earlier 1.17 % 13.1 % 1.07 % 1.12 % 1.08 % 12.0 % 0.96 % 1.01 % 1.02 % 10.8 % 11.6 % 11.1 % 0.98 % 10.3 % 10.5 % 10.6 % 0.84 % 9.3 % . ROAA of 1.12% for the quarter and Net Operating ROAA (Non-GAAP) of 1.08% . ROATCE (Non-GAAP) of 11.6% for the quarter and Operating ROATCE (Non-GAAP) Reported Operating (1) of 11.1% . Efficiency Ratio of 67.0% for the quarter and Operating Efficiency Ratio (Non-GAAP) of Net Interest Margin (%) Efficiency Ratio (%) 65.0% 68.7 % 67.7 % 67.0 % 4.29 % 65.6 % 65.0 % 4.09 % 64.3 % 3.94 % 63.0 % 62.4 % 3.83 % 3.91 % 3.84 % 61.7 % . Net Interest Margin (fully taxable equivalent 3.73 % 3.68 % 3.68 % 3.59 % “FTE”) of 3.84%, down 7 basis points from 57.5 % the prior quarter . Nonperforming Assets were 0.21% of Total Assets Reported Operating (1) (1) Operating profitability (Non-GAAP) figures exclude gain on sale of securities, merger termination fees, merger-related and restructuring expenses and non-operating items; net interest margin excludes purchase accounting adjustments Note: For a reconciliation of Non-GAAP financial measures to their most directly comparable GAAP measures, see the Appendix 7

Balance Sheet Trends Total Assets ($mm) Net Loans ($mm) $2,000 $2,500 $2,391 $2,449 $1,893 $2,354 $2,390 $1,832 $1,828 $1,858 $2,274 $1,769 $2,300 $1,800 $2,100 $1,600 $1,900 $1,400 $1,700 $1,200 $1,500 $1,000 4Q18 1Q19 2Q19 3Q19 4Q19 4Q18 1Q19 2Q19 3Q19 4Q19 Total Deposits ($mm) Book Value Per Share $2,200 $22.33 $22.50 $21.47 $21.93 $2,047 $20.82 $1,994 $2,012 $1,998 $20.31 $2,000 $1,922 $20.00 $1,800 $16.82 $17.50 $15.86 $16.37 $14.64 $15.18 $1,600 $15.00 $1,400 $12.50 $1,200 $10.00 4Q18 1Q19 2Q19 3Q19 4Q19 4Q18 1Q19 2Q19 3Q19 4Q19 Book Value Tangible Book Value (Non-GAAP) Note: For a reconciliation of Non-GAAP financial measures to their most directly comparable GAAP measures, see the Appendix 8

Net Interest Income . Net Interest Margin (FTE) decreased quarter-to-quarter primarily due to the three Federal rate decreases during the third and fourth quarters of 2019 . Compared quarter-to-quarter, Earning Asset Yields have decreased 13 basis points; the Average Cost of Interest-bearing Liabilities have decreased 8 basis points . Excluding the effect of purchase accounting adjustments, the Net Interest Margin (FTE) decreased 9 basis points quarter-to-quarter ($ in thousands) 4Q19 3Q19 4Q18 Average Yields and Rates 4Q19 3Q19 4Q18 Net Interest Income (FTE) $21,120 $21,250 $21,541 Loans, less accretion 5.07% 5.22% 5.17% Average Earning Assets $2,190,508 $2,157,193 $1,990,262 Accretion 0.29% 0.26% 0.64% Loans 5.36% 5.48% 5.81% Taxable securities 2.38% 2.49% 2.09% Tax-exempt securities (FTE) 3.10% 3.14% 4.04% Net Interest Margin Federal funds and other investments 1.74% 2.18% 2.99% 5.50% Earning Asset Yields 4.92% 5.05% 5.36% 4.50% Total Interest-Bearing Deposits 1.29% 1.37% 1.21% Securities sold under agreement to repurchase 0.35% 0.31% 0.33% Federal funds purchased and other borrowings 1.00% 0.58% 4.97% 3.50% Subordinated debt 5.90% 5.91% 5.91% Total Interest-Bearing Liabilities 1.39% 1.47% 1.33% 2.50% 4Q18 1Q19 2Q19 3Q19 4Q19 Net Interest Margin (FTE) 3.84% 3.91% 4.28% Net Interest Margin (FTE) Net Interest Margin (FTE - ex Purchase Acct. Adj.) 3.59% 3.68% 3.83% Net Interest Margin (FTE - ex Purchase Accounting Adj.) (Non-GAAP) Cost of Funds 1.15% 1.21% 1.12% Note: For a reconciliation of Non-GAAP financial measures to their most directly comparable GAAP measures, see the Appendix 9
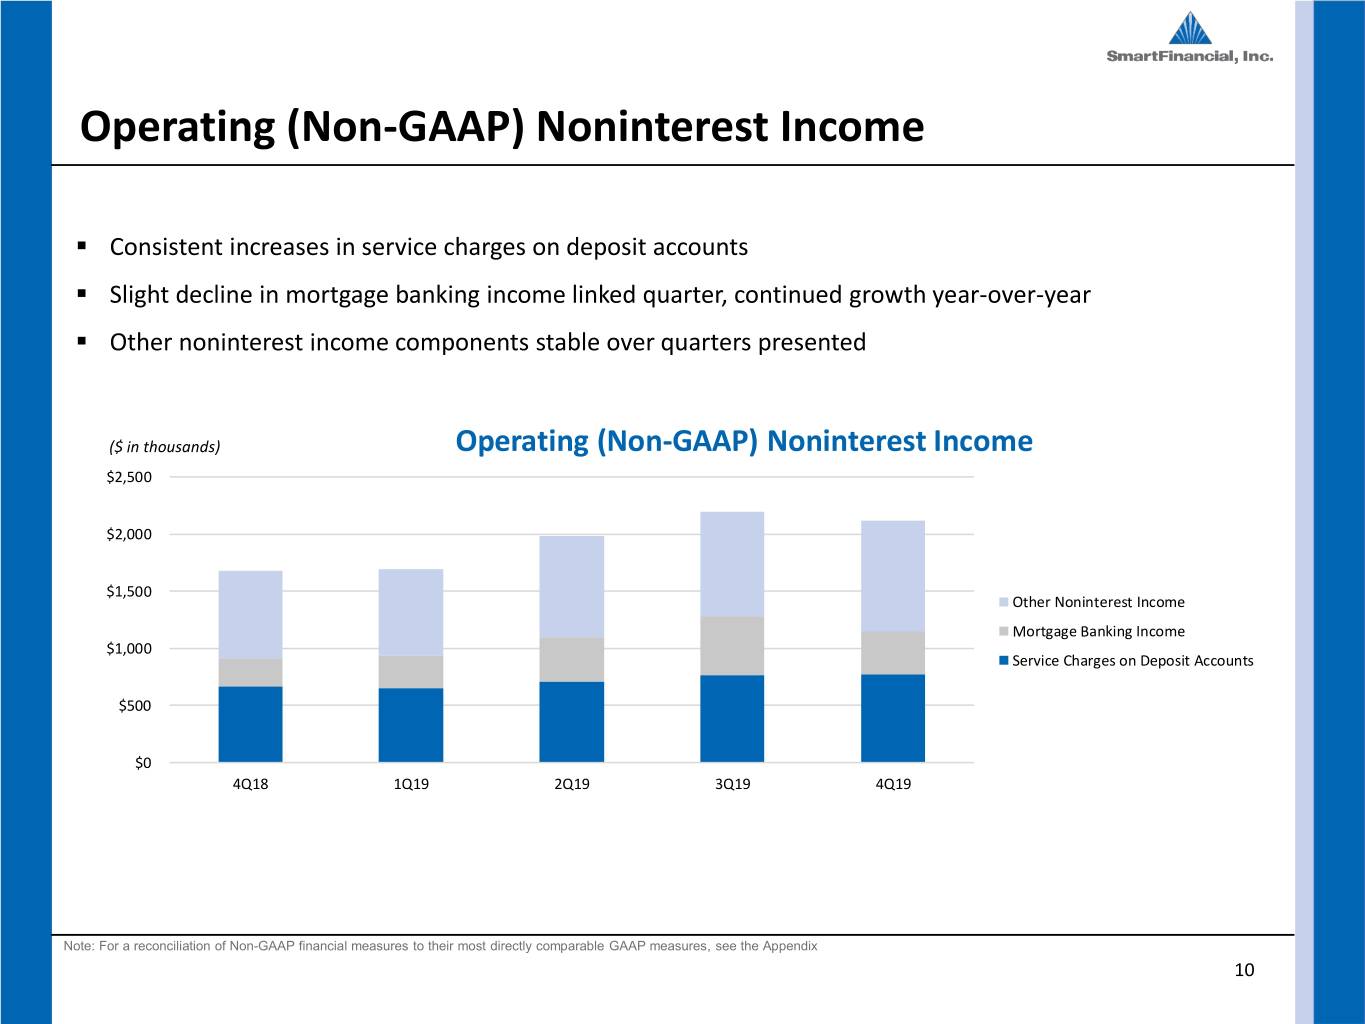
Operating (Non-GAAP) Noninterest Income . Consistent increases in service charges on deposit accounts . Slight decline in mortgage banking income linked quarter, continued growth year-over-year . Other noninterest income components stable over quarters presented ($ in thousands) Operating (Non-GAAP) Noninterest Income $2,500 $2,000 $1,500 Other Noninterest Income Mortgage Banking Income $1,000 Service Charges on Deposit Accounts $500 $0 4Q18 1Q19 2Q19 3Q19 4Q19 Note: For a reconciliation of Non-GAAP financial measures to their most directly comparable GAAP measures, see the Appendix 10

Operating (Non-GAAP) Noninterest Expense . Operating Efficiency Ratio (Non-GAAP) remained under 65% for the fifth consecutive quarter . Salary increases are driven by our continued investment in hiring talented revenue producing associates in order to complement our strategic initiatives . Continued investment in infrastructure ($ in thousands) Operating (Non-GAAP) Noninterest Expense $20,000 $15,000 Other Amortization of Intangibles $10,000 Data Processing Occupancy $5,000 Salaries & Benefits $0 4Q18 1Q19 2Q19 3Q19 4Q19 Note: For a reconciliation of Non-GAAP financial measures to their most directly comparable GAAP measures, see the Appendix 11

Attractive Deposit Mix Deposit Composition (12/31/19) Historical Deposit Composition ($mm) $2,500 Noninterest Demand $2,047 $1,994 $2,012 $1,998 Time 18% $2,000 $1,922 Deposits 33% Interest- $635 $673 $647 $680 bearing $649 $1,500 Demand Money 19% Market and Savings $623 30% $1,000 $698 $648 $635 $642 Historical Cost of Deposits $334 $351 $380 $500 $311 $332 3.00% 2.50% $320 $329 $357 $365 $364 2.50% 2.50% 2.50% 2.00% $0 1.50% 2.00% 4Q18 1Q19 2Q19 3Q19 4Q19 1.75% 1.00% Noninterest Demand Interest-bearing Demand 1.10% 1.18% 1.00% 1.13% 1.06% 0.50% Money Market and Savings Time Deposits 0.00% 4Q18 1Q19 2Q19 4Q19 3Q19 Cost of Deposits Fed Funds Target 12

Overview of Loan Portfolio Loan Composition (12/31/19) Historical Loan Composition ($mm) Other $2,500 <1% Consumer RE 22% CRE, Non $2,000 $1,903 Owner $1,841 $1,837 $1,868 Occupied C&I $1,777 18% 25% $423 $411 $406 $406 $407 $1,500 CRE, C&D Owner $476 Occupied 12% $473 $464 $468 $488 23% $1,000 $416 $416 $422 $429 $372 Historical CRE Ratios $500 $187 $205 $220 $228 400% $188 300% $308 $341 $334 $341 $337 265% $0 200% 4Q18 1Q19 2Q19 3Q19 4Q19 100% 84% C&I C&D 0% CRE, Owner Occupied CRE, Non Owner Occupied 4Q18 1Q19 2Q19 3Q19 4Q19 Consumer RE Other CRE C & D 13

Asset Quality . Superior asset quality, with Nonperforming Assets at 0.21% of Total Assets compared to the Nonperforming Assets ($ in thousands) Southeast Peer Median (1) of 0.59% $9,000 1.00% . Remaining fair value discounts on acquired $6,000 0.59% 0.70% loans are 1.5x the current Allowance For Loan $3,000 0.21%0.40% Losses $0 0.10% 4Q18 1Q19 2Q19 3Q19* 4Q19 . Allowance for loan losses to loans is 0.54% at Foreclosed Assets 4Q19 Nonperforming Loans . Proven credit culture, with Net Charge-Offs to Nonperforming Assets/ Total Assets (SMBK) Average Loans of 0.01% compared to the Nonperforming Assets/ Total Assets (SE Peer Median) (1) Southeast Peer Median (1) of 0.03% Loan Discounts ($ in thousands) Net Charge-Offs/ Average Loans $30 0.90% 0.15% $20 0.60% 0.10% $10 0.30% 0.05% $0 0.00% 0.03% 4Q18 1Q19 2Q19 3Q19 4Q19 0.00% 0.01% Allowance for Loan Losses (GAAP) (0.05%) Net Acquisition Accounting Fair Falue Discounts to Loans 4Q18 1Q19 2Q19 3Q19* 4Q19 Allowance for Loan Losses/ Loans SMBK SE Peer Median (1) Source: S&P Global Market Intelligence (1) Major-exchange (NYSE, NYSEAM, NASDAQ) traded banks between $1.5B and $3B in assets headquartered in the Southeast (AL, AR, FL, GA, LA, MS, NC, SC, TN and WV) as of 09/30/19 14 * Peer median data held constant from 3Q19 due to unavailable 4Q19 data as of SMBK reporting date

Reported and Operating (Non-GAAP) Earnings . Fourth quarter 2019 operating earnings increased 8% from the prior linked quarter, and increased 10% to same prior year quarter . Quarterly operating earnings overall had directionally consistent growth . Full year operating earnings increased 21% from 2018 to 2019 Quarterly Earnings Full Year Earnings ($ in thousands) ($ in thousands) $26,548 $23,615 $9,121 $19,516 $18,102 $6,444 $6,733 $6,487 $5,963 $6,016 $5,907 $5,509 $5,603 $4,731 Reported Operating (1) Reported Operating (1) (1) Operating (Non-GAAP) figures exclude gain on sale of securities, merger termination fees, merger-related and restructuring expenses and non-operating items Note: For a reconciliation of Non-GAAP financial measures to their most directly comparable GAAP measures, see the Appendix 15
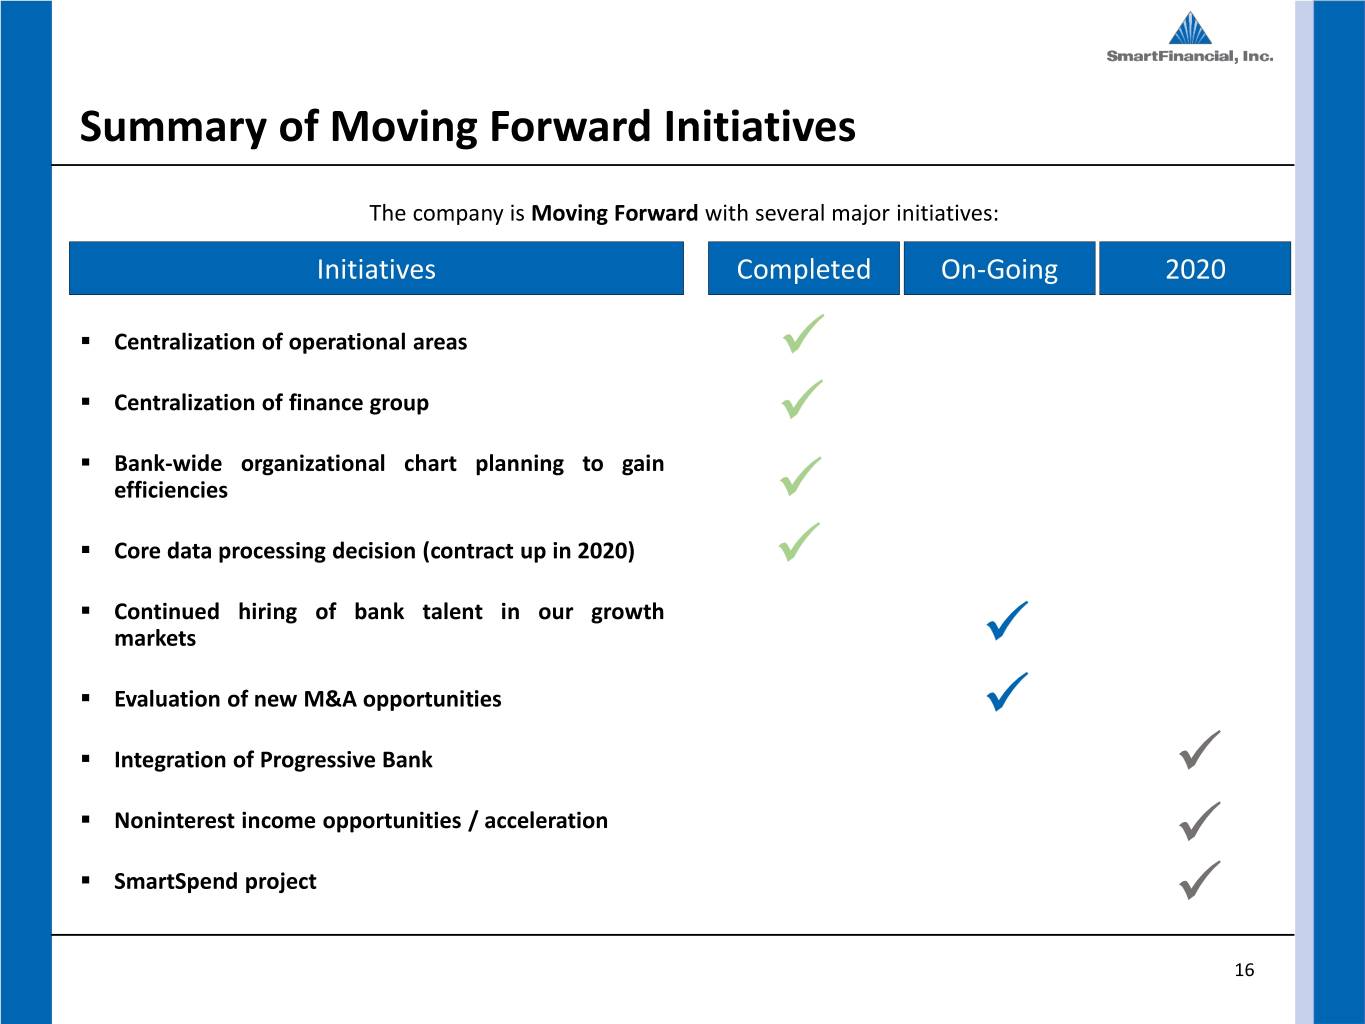
Summary of Moving Forward Initiatives The company is Moving Forward with several major initiatives: Initiatives Completed On-Going 2020 . Centralization of operational areas . Centralization of finance group . Bank-wide organizational chart planning to gain efficiencies . Core data processing decision (contract up in 2020) . Continued hiring of bank talent in our growth markets . Evaluation of new M&A opportunities . Integration of Progressive Bank . Noninterest income opportunities / acceleration . SmartSpend project 16

Noteworthy Accomplishments in 2019 Announced the Acquisition Debuted on Fortune’s 100 Named “A Top Workplace” of Progressive Savings Bank Fastest-Growing Companies 3-Years Running 9 The proposed transaction will bolster The Fortune 100 Fastest-Growing For the third year in a row, SmartBank was SmartFinancial’s presence in Companies are publicly traded presented the Top Workplace award by the Tennessee and, based on market share companies ranked each year by Knoxville News Sentinel and Knox.biz. data as of June 30, 2019, revenue growth rate, EPS growth rate SmartFinancial will become the 7th and three-year annualized total return. largest community bank by deposits in Tennessee (pro forma), with total consolidated assets in excess of $2.7 billion. 17

Acquisition of Progressive Financial Group, Inc.

SMBK M&A Criteria SmartFinancial is committed to balancing organic growth with thoughtful acquisitions and will not make acquisitions simply for the sake of growth Impact SMBK Criteria Acquisition of Progressive TBV Earnback Period < 3 years Meaningful earnings EPS Impact accretion in first full year of operations Builds upon footprint in Market Density current and adjacent markets Deposit Base Steady, low-cost funding 19
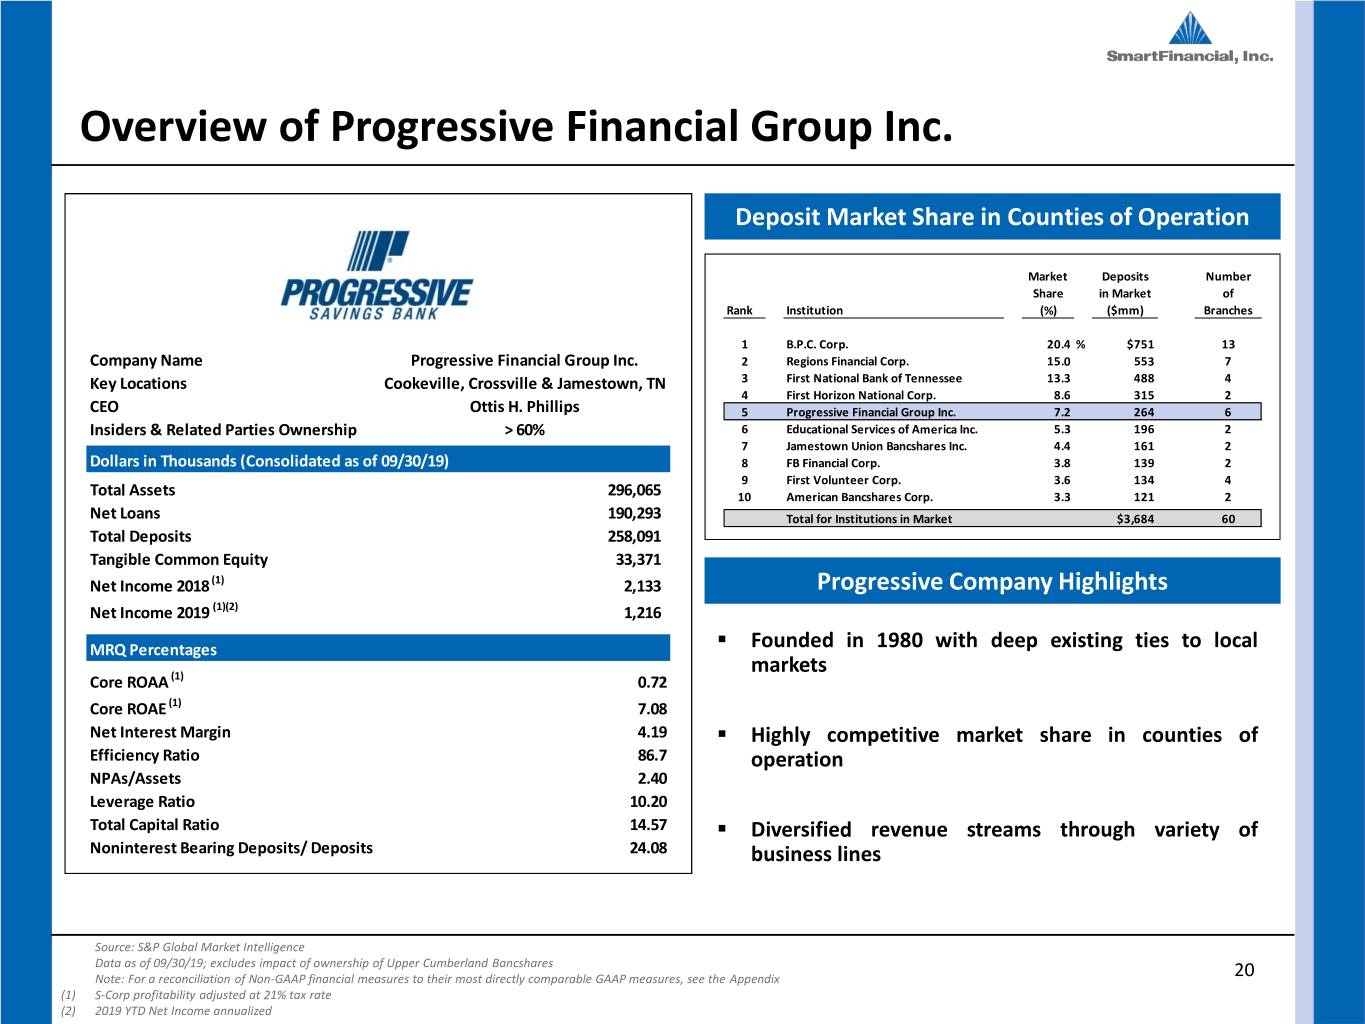
Overview of Progressive Financial Group Inc. Deposit Market Share in Counties of Operation Market Deposits Number Share in Market of Rank Institution (%) ($mm) Branches 1 B.P.C. Corp. 20.4 % $751 13 Company Name Progressive Financial Group Inc. 2 Regions Financial Corp. 15.0 553 7 Key Locations Cookeville, Crossville & Jamestown, TN 3 First National Bank of Tennessee 13.3 488 4 4 First Horizon National Corp. 8.6 315 2 CEO Ottis H. Phillips 5 Progressive Financial Group Inc. 7.2 264 6 Insiders & Related Parties Ownership > 60% 6 Educational Services of America Inc. 5.3 196 2 7 Jamestown Union Bancshares Inc. 4.4 161 2 Dollars in Thousands (Consolidated as of 09/30/19) 8 FB Financial Corp. 3.8 139 2 9 First Volunteer Corp. 3.6 134 4 Total Assets 296,065 10 American Bancshares Corp. 3.3 121 2 Net Loans 190,293 Total for Institutions in Market $3,684 60 Total Deposits 258,091 Tangible Common Equity 33,371 Net Income 2018 (1) 2,133 Progressive Company Highlights Net Income 2019 (1)(2) 1,216 MRQ Percentages . Founded in 1980 with deep existing ties to local markets Core ROAA (1) 0.72 Core ROAE (1) 7.08 Net Interest Margin 4.19 . Highly competitive market share in counties of Efficiency Ratio 86.7 operation NPAs/Assets 2.40 Leverage Ratio 10.20 Total Capital Ratio 14.57 . Diversified revenue streams through variety of Noninterest Bearing Deposits/ Deposits 24.08 business lines Source: S&P Global Market Intelligence Data as of 09/30/19; excludes impact of ownership of Upper Cumberland Bancshares Note: For a reconciliation of Non-GAAP financial measures to their most directly comparable GAAP measures, see the Appendix 20 (1) S-Corp profitability adjusted at 21% tax rate (2) 2019 YTD Net Income annualized

Bolstering Our Core Tennessee Market Tennessee Branch Footprint ClarksvilleClarksville JamestownJamestown JohnsonJohnson CityCity LebanonLebanon CookevilleCookeville JohnsonJohnson CityCity CookevilleCookeville 81 NashvilleNashville 40 KnoxvilleKnoxville 40 MurfreesboroMurfreesboro CrossvilleCrossville JacksonJackson JacksonJackson 65 75 TullahomaTullahoma 24 ClevelandCleveland ClevelandCleveland Progressive (6) MemphisMemphis ChattanoogaChattanooga SMBK (17) Tennessee Deposit Market Share (1) Pro Forma Company Overview (3) Community Market Deposits Number Assets $2.7 Billion Bank Share in Market of (1) Rank Rank Institution (%) ($mm) Branches Loans $2.0 Billion 1 Regions Financial Corp. 11.94 $16,546 218 2 First Horizon National Corp. 11.88 16,467 157 3 Truist Financial Corp. 10.47 14,507 147 Deposits $2.3 Billion 4 Pinnacle Financial Partners Inc. 6.32 8,766 48 5 Bank of America Corp. 5.60 7,756 58 1 6 FB Financial Corp. 3.16 4,382 67 Loans / Deposits 89.3% 7 U.S. Bancorp 2.50 3,471 91 2 8 Wilson Bank Holding Co. 1.68 2,332 28 3 9 Fifth Third Bancorp 1.65 2,282 35 10 Franklin Financial Network Inc. 1.50 2,074 15 . Provides entry into Crossville, TN and Cookeville, TN MSAs and a natural 11 Simmons First National Corp. 1.47 2,040 42 4 12 Reliant Bancorp Inc. 1.27 1,760 22 extension of branch network in Knoxville, TN MSA 13 Wells Fargo & Co. 1.27 1,754 19 5 14 CapStar Financial Holdings Inc. 1.25 1,737 13 6 15 Home Federal Bank of Tennessee 1.23 1,706 23 7 16 Pro Forma 1.21 1,685 23 . (2) 8 16 Educational Services of America Inc. 1.14 1,580 14 Ranked as a top 7 community bank in Tennessee on a pro forma basis 17 Renasant Corp. 1.08 1,502 20 9 18 First Citizens Bancshares Inc. 1.06 1,473 25 19 BancorpSouth Bank 1.03 1,429 27 10 20 SmartFinancial Inc. 1.02 1,421 17 . Advances strategy of building a Southeast regional community bank 62 81 Progressive Financial Group Inc. 0.19 264 6 Source: S&P Global Market Intelligence Deposit data as of 06/30/19 (1) Deposits capped at $1.0 billion per branch 21 (2) Community Bank defined as banks with total assets less than $15.0bn headquartered in Tennessee (3) Excludes purchase accounting adjustments

Appendix

Non-GAAP Reconciliations ($ in thousands) 4Q19 3Q19 2Q19 1Q19 4Q18 Net interest income - ex purchase acct. adj. Net interest income (GAAP) $ 21,104 $ 21,140 $ 20,802 $ 20,997 $ 21,447 Taxable equivalent adjustment 116 110 116 115 94 Net interest income TEY 21,220 21,250 20,918 21,112 21,541 Purchase accounting adjustments 1,375 1,246 1,374 1,717 2,343 Net interest income - ex purchase acct. adj. (Non-GAAP) $ 19,845 $ 20,004 $ 19,544 $ 19,395 $ 19,198 Operating Noninterest Income Noninterest income (GAAP) $ 2,840 $ 2,196 $ 8,416 $ 1,698 $ 1,680 Securities (gain) losses - (1) (33) - (2) ADECA termination proceeds (720) - - - - Merger termination fee - - (6,400) - - Operating noninterest income (Non-GAAP) $ 2,120 $ 2,195 $ 1,983 $ 1,698 $ 1,678 Operating Noninterest Expense Noninterest expense (GAAP) $ 16,052 $ 14,708 $ 16,809 $ 15,579 $ 15,661 Salaries - prior year adjustment (603) - - - - Merger related and restructuring charges (427) (73) (1,796) (923) (1,322) Other - prior year franchise tax true-up 312 - - - - Operating noninterest expense (Non-GAAP) $ 15,334 $ 14,635 $ 15,013 $ 14,656 $ 14,339 Tangible Common Equity Shareholders' equity (GAAP) $ 312,747 $ 306,040 $ 299,611 $ 290,481 $ 283,011 Less goodwill and other intangible assets 77,193 77,534 78,348 78,690 79,034 Tangible Common Equity (Non-GAAP) $ 235,555 $ 228,506 $ 221,263 $ 211,791 $ 203,977 Non-GAAP Return Ratios Net operating return on average assets (Non-GAAP)(1) 1.08% 1.02% 0.96% 0.98% 1.07% Return on average tangible common equity (Non-GAAP)(2) 11.6% 10.5% 16.8% 9.3% 13.1% Net operating return on average shareholder equity (Non-GAAP)(3) 8.3% 7.9% 7.6% 7.8% 8.7% Net operating return on average tangible common equity (Non-GAAP)(4) 11.1% 10.6% 10.3% 10.8% 12.0% (1) Net operating return on average assets (Non-GAAP) is the annualized net operating earnings (Non-GAAP) divided by average assets. (2) Return on average tangible common equity (Non-GAAP) is the annualized net income divided by average tangible common equity (Non-GAAP). (3) Net operating return on average shareholder equity (Non-GAAP) is the annualized net operating earnings (Non-GAAP) divided by average shareholder equity. 23 (4) Net operating return on average tangible common equity (Non-GAAP) is the annualized net operating earnings (Non-GAAP) divided by average tangible common equity (Non-GAAP). Note: “ADECA” represents a program administered by the Alabama Department of Economic and Community Affairs
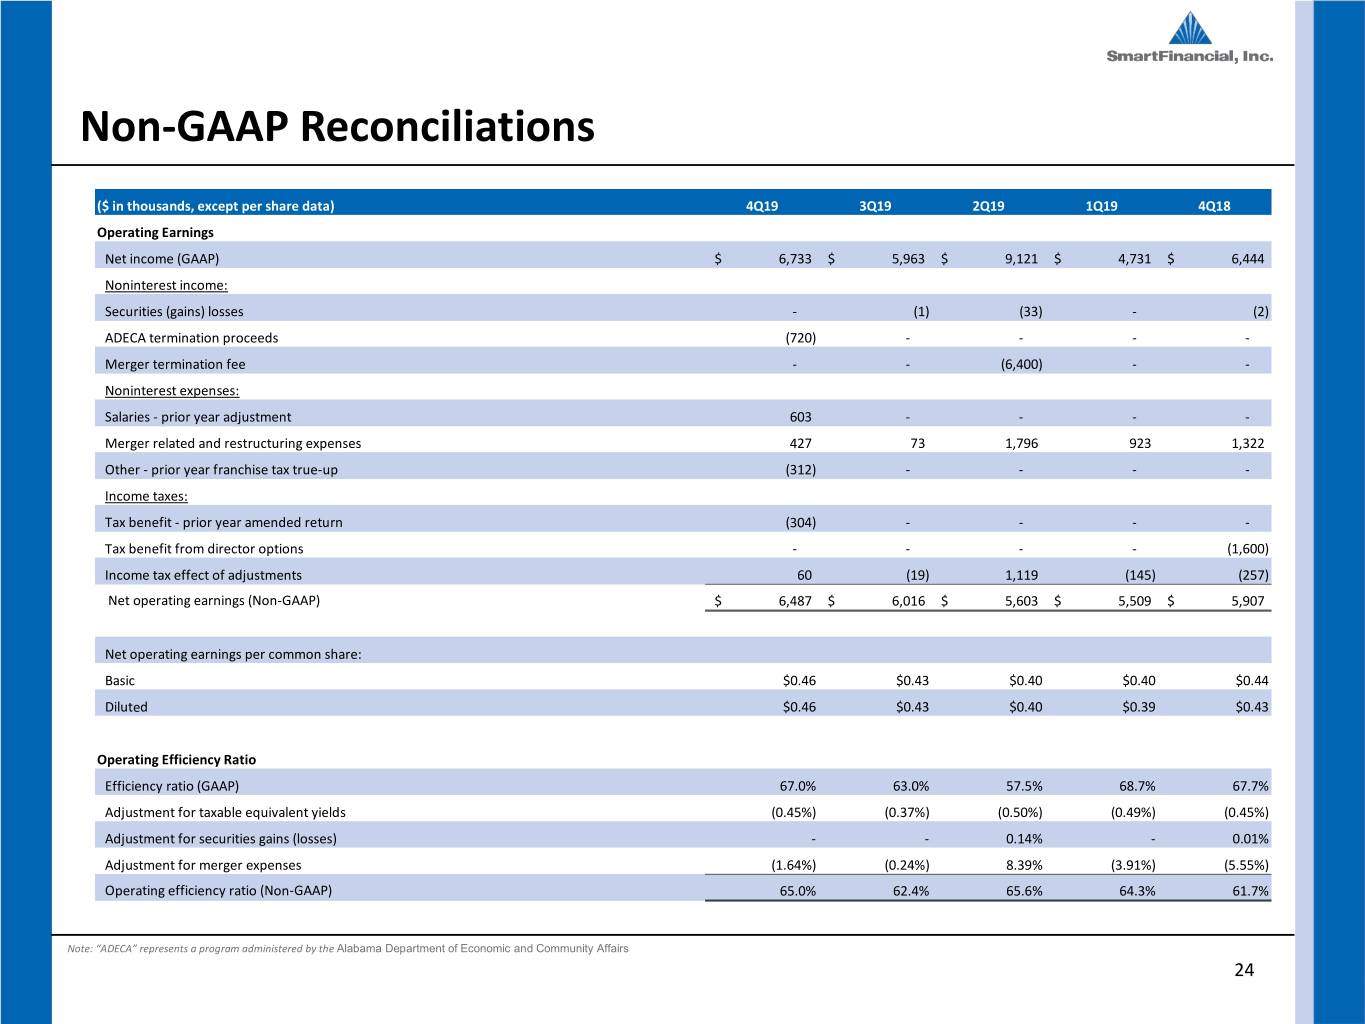
Non-GAAP Reconciliations ($ in thousands, except per share data) 4Q19 3Q19 2Q19 1Q19 4Q18 Operating Earnings Net income (GAAP) $ 6,733 $ 5,963 $ 9,121 $ 4,731 $ 6,444 Noninterest income: Securities (gains) losses - (1) (33) - (2) ADECA termination proceeds (720) - - - - Merger termination fee - - (6,400) - - Noninterest expenses: Salaries - prior year adjustment 603 - - - - Merger related and restructuring expenses 427 73 1,796 923 1,322 Other - prior year franchise tax true-up (312) - - - - Income taxes: Tax benefit - prior year amended return (304) - - - - Tax benefit from director options - - - - (1,600) Income tax effect of adjustments 60 (19) 1,119 (145) (257) Net operating earnings (Non-GAAP) $ 6,487 $ 6,016 $ 5,603 $ 5,509 $ 5,907 Net operating earnings per common share: Basic $0.46 $0.43 $0.40 $0.40 $0.44 Diluted $0.46 $0.43 $0.40 $0.39 $0.43 Operating Efficiency Ratio Efficiency ratio (GAAP) 67.0% 63.0% 57.5% 68.7% 67.7% Adjustment for taxable equivalent yields (0.45%) (0.37%) (0.50%) (0.49%) (0.45%) Adjustment for securities gains (losses) - - 0.14% - 0.01% Adjustment for merger expenses (1.64%) (0.24%) 8.39% (3.91%) (5.55%) Operating efficiency ratio (Non-GAAP) 65.0% 62.4% 65.6% 64.3% 61.7% Note: “ADECA” represents a program administered by the Alabama Department of Economic and Community Affairs 24
Investor Contacts Billy Carroll Miller Welborn President & CEO Chairman (865) 868-0613 (423) 385-3067 Billy.Carroll@SmartBank.com Miller.Welborn@SmartBank.com SmartFinancial, Inc. 5401 Kingston Pike, Suite 600 Knoxville, TN 37919 25

