Attached files
| file | filename |
|---|---|
| EX-10.1 - EX-10.1 - CITRIX SYSTEMS INC | d856712dex101.htm |
| 8-K - 8-K - CITRIX SYSTEMS INC | d856712d8k.htm |
Exhibit 99.1

| 2019 | Q4 and Full Year Financials
To Our Stakeholders
Our fourth quarter and full year 2019 performance reflects an accelerated subscription model transition and strong demand across both our Workspace and Networking solutions.
Our fourth quarter and full year highlights include:
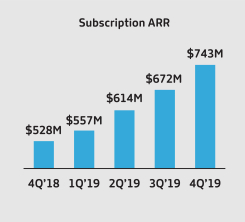
· Fourth quarter subscription ARR1 was $743 million, up 41% year-over-year, and SaaS ARR was $520 million, up 49% year-over-year
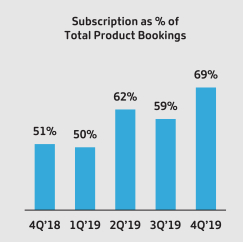
· Subscription bookings as a percentage of total product bookings was 69%, up from 51% in the fourth quarter of 2018. For the full year, subscription bookings as a percentage of total product bookings was 62%, up from 42% in 2018
· Reported revenue was $810 million in the fourth quarter and $3.0 billion for the full year, up 1% year-over-year in the fourth quarter and for the full year. For the fourth quarter, GAAP diluted EPS was $1.56 and non-GAAP diluted EPS2 was $1.71. For the full year, GAAP diluted EPS was $5.03 and non-GAAP diluted EPS2 was $5.69, at the high end of our non-GAAP diluted EPS2 guidance of $5.60 to $5.70
· Future committed revenue increased 15%, or approximately $328 million year-over-year reflecting an increasing mix of subscription product bookings
· On January 21, 2020 our Board of Directors increased our share repurchase authorization by $1 billion, bringing the total remaining authorization to approximately $1.75 billion. We also announced today that we entered into a $1 billion term loan credit facility, which we plan to use to return capital through open market transactions, accelerated share repurchases, or other means |
1Annualized Recurring Revenue, or ARR, is an operating metric that represents the contracted recurring value of all termed subscriptions normalized to a one-year period. It is calculated at the end of a reporting period by taking each contract’s recurring total contract value and dividing by the length of the contract. ARR includes only active contractually committed, fixed subscription fees. All contracts are annualized, including 30 day offerings where we take monthly recurring revenue multiplied by 12 to annualize. ARR should be viewed independently of U.S. GAAP revenue, deferred revenue and unbilled revenue and is not intended to be combined with or to replace those items. ARR is not a forecast of future revenue.
2A reconciliation of GAAP to non-GAAP measures has been provided in the financial statement tables included in this letter. An explanation of these measures is also included below under the heading “Reconciliation of Non-GAAP Financial Measures to Comparable U.S. GAAP Measures.”
|
|
||||||||||||
| 2019 | Q4 and Full Year Financials | 1 | ||||||||||

|
|
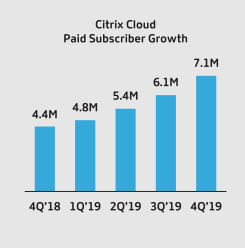
Subscription ARR accelerated year-over-year in the fourth quarter, reflecting strong growth in Workspace SaaS and Networking subscription. The notable inflection of subscription as a percentage of Networking product bookings was driven by a few large customers that elected to transition to pooled-capacity subscription agreements. One of these transactions was the largest Networking deal in Citrix’s history and drove subscription bookings as a percentage of total product bookings to 69% in the fourth quarter. These Networking subscription agreements contributed to the highest level of total subscription bookings mix we have achieved and reflects the confidence of our customers in our vision and in our ability to execute. Workspace drove Citrix Cloud paid subscribers to 7.1M, a 64% year-over-year increase. | |||
|
Citrix Workspace: Now Available With Greater Intelligence
As the Citrix Workspace evolves as a platform, we are adding additional features and functionalities that tie together the myriad of applications that reside within enterprises. In doing so, we are creating the platform for digital transformation and developing a universal platform for work. Citrix Workspace enables a Zero Trust architecture, supporting the increasing importance of Workspace security to defend against an ever growing number of threats. Innovations within Citrix Workspace drive productivity in the workplace beyond our market-leading virtual desktop infrastructure (VDI).
Importantly, in the fourth quarter, intelligence features within Citrix Workspace became generally available. This feature set is arguably the most significant functionality added to the Workspace in Citrix’s history. Now, consumer-like user interfaces can be experienced across every device on which Citrix Workspace runs, with single sign-on to access all enterprise applications and data. Universal search, contextual security and performance further differentiate Citrix Workspace and add unique value to our customers. | |||
|
|
Citrix Workspace with intelligence enables customers to unify and simplify employee experience by organizing, guiding and automating work anywhere, allowing employees more time to spend on value creating activities. Customers can now modernize their applications with minimal effort with our connector appliance that enables tools for on-premise application integrations, allowing customers to leverage existing investments and innovate more rapidly by focusing on what matters most. And, with our low-code builder for microapps, customers can accelerate their IT agility and innovation which enables faster delivery of business outcomes.
With pre-built integrations with networking and SD-WAN, our Networking capabilities enable end-to-end Workspace delivery. By providing visibility of the user across the network and applications, we can provide comprehensive performance analytics and insights to customers. |
|
|
||||||||||||
| 2019 | Q4 and Full Year Financials | 2 | ||||||||||


|
|
||||||||||||
| 2019 | Q4 and Full Year Financials | 3 | ||||||||||
Financial Overview
|
|
Bookings
· Subscription bookings as a percentage of total product bookings were 69% in the fourth quarter up from 51% in the fourth quarter of 2018. For the full year, subscription bookings accounted for 62% of total product bookings vs. 42% in 2018
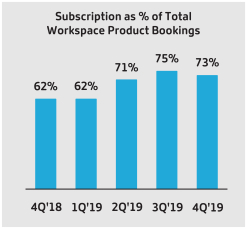
· Workspace subscription bookings as a percentage of Workspace product bookings were 73% in the fourth quarter, up from 62% in the fourth quarter of 2018. For the full year, Workspace subscription bookings accounted for 71% of Workspace product bookings vs. 58% in 2018
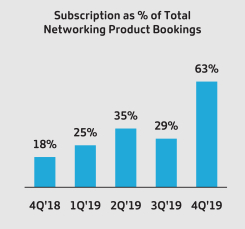
· Networking subscription bookings as a percentage of total Networking product bookings were 63% in the fourth quarter, up from 18% in the fourth quarter of 2018. For the full year, Networking subscription bookings accounted for 44% of Networking product bookings vs. 13% in 2018. The notable inflection of subscription as a percentage of Networking product bookings was driven by a few large customers that elected to transition to pooled-capacity subscription agreements in the fourth quarter. One of these transactions was the largest Networking deal in Citrix’s history
· Future committed revenue grew 15% year-over-year to approximately $2.5 billion in the fourth quarter
· Total average contract duration of deals booked in the fourth quarter was 1.7 years, up year-over-year due to the richer mix of subscription bookings which carry longer duration |
Our transition to a subscription model focuses on growing higher value recurring revenue streams that result in more of the business booked in the current period being recognized in future periods. This subscription model transition creates variability in the individual components of future committed revenue (short-term, long-term and unbilled) due to the mix within subscription. In addition, we expect that average contract duration will increase, as more of our customers transition to the subscription model, which today typically has a 3-year duration and is a reflection of deepening and extending relationships with our customers.
| Subscription Bookings | 4Q18 | FY18 | 1Q19 | 2Q19 | 3Q19 | 4Q19 | FY19 | |||||||||||||||||||||
| Subscription as % of Total Product |
51 | % | 42 | % | 50 | % | 62 | % | 59 | % | 69 | % | 62% | |||||||||||||||
| Subscription as a % of Workspace Product |
62 | % | 58 | % | 62 | % | 71 | % | 75 | % | 73 | % | 71% | |||||||||||||||
| Subscription as a % of Networking Product |
18 | % | 13 | % | 25 | % | 35 | % | 29 | % | 63 | % | 44% | |||||||||||||||
| Future Committed Revenue (in millions) | 4Q18 | 1Q19 | 2Q19 | 3Q19 | 4Q19 | |||||||||||||||
| Deferred Revenue |
$ | 1,835 | $ | 1,757 | $ | 1,745 | $ | 1,616 | $ | 1,796 | ||||||||||
| Unbilled Revenue3 |
338 | 380 | 484 | 559 | 705 | |||||||||||||||
| Total Deferred and Unbilled Revenue |
$ | 2,173 | $ | 2,137 | $ | 2,229 | $ | 2,175 | $ | 2,501 | ||||||||||
| Y/Y Growth |
n/a | 21% | 15% | 13% | 15% | |||||||||||||||
| Total Average Contract Duration (years) |
1.3 | 1.4 | 1.6 | 1.6 | 1.7 | |||||||||||||||
Note: Financial summary tables are unaudited. This document should be read in conjunction with the Company’s SEC Filings.
3Unbilled revenue primarily represents future billings under our subscription agreements that have not been invoiced and, accordingly, are not recorded in accounts receivable or deferred revenue within our condensed consolidated financial statements.
|
|
||||||||||||
| 2019 | Q4 and Full Year Financials | 4 | ||||||||||
|
Annualized Recurring Revenue
· Subscription ARR in the fourth quarter of 2019 was $743 million, up 41% year-over-year
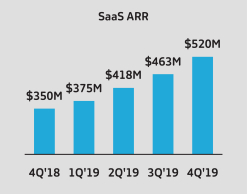
· SaaS ARR in the fourth quarter was $520 million, up 49% year-over-year
We believe ARR is a key performance indicator of the health and trajectory of our business, representing the pace of our transition and serves as a leading indicator of top line trends. | |
Annualized Recurring Revenue (in millions)
| 4Q18 | 1Q19 | 2Q19 | 3Q19 | 4Q19 | ||||||||||||||||||
| Subscription ARR |
$ | 528 | $ | 557 | $ | 614 | $ | 672 | $ | 743 | ||||||||||||
| SaaS ARR |
$ | 350 | $ | 375 | $ | 418 | $ | 463 | $ | 520 | ||||||||||||
|
|
Revenue
· Total revenue of $810 million in the fourth quarter was up 1% year-over-year as strong subscription revenue growth of 49% offset the decline in perpetual product and license revenue and support and services revenue
· Total SSP revenue was $36 million in the fourth quarter, representing an increase of 112% year-over-year
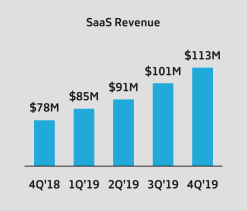
· SaaS revenue grew 45% year-over-year to $113 million and accounted for 59% of subscription revenue and 14% of total revenue in the fourth quarter |
Revenue Summary (in millions)
| 4Q18 | FY18 | 1Q19 | 2Q19 | 3Q19 | 4Q19 | FY19 | ||||||||||||||||||||||
| Subscription |
$ | 130 | $455 | $ | 142 | $ | 156 | $ | 160 | $ | 194 | $651 | ||||||||||||||||
| SaaS |
78 | 273 | 85 | 91 | 101 | 113 | 391 | |||||||||||||||||||||
| Other Subscription |
52 | 182 | 56 | 65 | 59 | 80 | 260 | |||||||||||||||||||||
| Product & License |
211 | 735 | 135 | 141 | 131 | 177 | 584 | |||||||||||||||||||||
| Support & Services |
461 | 1,784 | 443 | 452 | 442 | 439 | 1,776 | |||||||||||||||||||||
| Total Revenue* |
$ | 802 | $ | 2,974 | $ | 719 | $ | 749 | $ | 733 | $ | 810 | $ | 3,011 | ||||||||||||||
Y/Y Growth
| 1Q19 | 2Q19 | 3Q19 | 4Q19 | FY19 | ||||||||||||||||||||||||
| Subscription |
37% | 41% | 43% | 49% | 43% | |||||||||||||||||||||||
| SaaS |
43% | 41% | 43% | 45% | 43% | |||||||||||||||||||||||
| Other Subscription |
30% | 41% | 45% | 56% | 43% | |||||||||||||||||||||||
| Product & License |
-16% | -27% | -23% | -16% | -21% | |||||||||||||||||||||||
| Support & Services |
2% | 3% | -2% | -5% | 0% | |||||||||||||||||||||||
| Total Revenue* |
3% | 1% | 0% | 1% | 1% | |||||||||||||||||||||||
*Amounts may not recalculate due to rounding.
Note: Financial summary tables are unaudited. This document should be read in conjunction with the Company’s SEC Filings.
|
|
||||||||||||
| 2019 | Q4 and Full Year Financials | 5 | ||||||||||
% of Total Revenue
| 4Q18 | FY18 | 1Q19 | 2Q19 | 3Q19 | 4Q19 | FY19 | ||||||||||||||||||||||
| Subscription |
16 | % | 15 | % | 20 | % | 21 | % | 22 | % | 24 | % | 22 | % | ||||||||||||||
| SaaS % of Subscription |
60 | % | 60 | % | 60 | % | 59 | % | 63 | % | 59 | % | 60 | % | ||||||||||||||
| SaaS % of Total |
10 | % | 9 | % | 12 | % | 12 | % | 14 | % | 14 | % | 13 | % | ||||||||||||||
| Product & License |
26 | % | 25 | % | 18 | % | 19 | % | 18 | % | 22 | % | 19 | % | ||||||||||||||
| Support & Services |
58 | % | 60 | % | 62 | % | 60 | % | 60 | % | 54 | % | 59 | % | ||||||||||||||
Revenue by Product Group
Workspace
| · | Workspace revenue of $565 million in the fourth quarter increased 1% year-over-year reflecting the effect of the headwind to reported revenue from subscription bookings, and particularly SaaS bookings. For the full year, Workspace revenue grew 5% year-over-year |
| · | Workspace subscription revenue in the fourth quarter accounted for 27% of total Workspace revenue, up from 20% a year ago |
| · | Workspace revenue accounted for 70% of total revenue in the fourth quarter |
Networking
| · | Networking revenue of $212 million in the fourth quarter increased 3% year-over-year. For the full year, Networking revenue declined 8% year-over-year |
| · | Networking subscription revenue in the fourth quarter increased 100% year-over-year with total Networking software revenue accounting for 33% of total Networking revenue |
| · | Networking revenue accounted for 26% of total revenue in the fourth quarter |
We expect the mix shift within Networking away from hardware towards software-based solutions will create pressure on reported Networking revenue over time.
Revenue by Product Group (in millions)
| 4Q18 | FY18 | 1Q19 | 2Q19 | 3Q19 | 4Q19 | FY19 | ||||||||||||||||||||||||||||||
| Workspace |
$ | 557 | $ | 2,024 | $515 | $535 | $513 | $565 | $2,127 | |||||||||||||||||||||||||||
| Networking |
206 | 817 | 171 | 178 | 188 | 212 | 750 | |||||||||||||||||||||||||||||
| Professional Services |
39 | 132 | 33 | 35 | 32 | 33 | 133 | |||||||||||||||||||||||||||||
| Total Revenue* |
$ | 802 | $ | 2,974 | $719 | $749 | $733 | $810 | $3,011 | |||||||||||||||||||||||||||
|
Y/Y Growth
|
||||||||||||||||||||||||||||||||||||
| 1Q19 | 2Q19 | 3Q19 | 4Q19 | FY19 | ||||||||||||||||||||||||||||||||
| Workspace |
13% | 7% | 1% | 1% | 5% | |||||||||||||||||||||||||||||||
| Networking |
-18% | -14% | -4% | 3% | -8% | |||||||||||||||||||||||||||||||
| Professional Services |
6% | 5% | 12% | -16% | 1% | |||||||||||||||||||||||||||||||
| Total Revenue* |
3% | 1% | 0% | 1% | 1% | |||||||||||||||||||||||||||||||
*Amounts may not recalculate due to rounding.
Note: Financial summary tables are unaudited. This document should be read in conjunction with the Company’s SEC Filings.
|
|
||||||||||||
| 2019 | Q4 and Full Year Financials | 6 | ||||||||||
% of Total Revenue
| 4Q18 | FY18 | 1Q19 | 2Q19 | 3Q19 | 4Q19 | FY19 | ||||||||||||||||||||||
| Workspace |
69 | % | 68 | % | 72 | % | 71 | % | 70 | % | 70 | % | 71 | % | ||||||||||||||
| Networking |
26 | % | 28 | % | 24 | % | 24 | % | 26 | % | 26 | % | 25 | % | ||||||||||||||
| Professional Services |
5 | % | 4 | % | 4 | % | 5 | % | 4 | % | 4 | % | 4 | % | ||||||||||||||
Revenue by Customer Type
| · | Revenue from SSP customers was $36 million, up 112% year-over-year, and represented 4% of total revenue in the fourth quarter. For the full year, revenue from SSP customers declined 22% and represented 4% of total revenue, down from 5% of total revenue in 2018 |
| · | Revenue from all other customers was $774 million in the fourth quarter, down 1% year-over-year due to the impact of the subscription model shift. For the full year, revenue from all other customers increased 2% year-over year |
Revenue by Customer Type (in millions)
| 4Q18 | FY18 | 1Q19 | 2Q19 | 3Q19 | 4Q19 | FY19 | ||||||||||||||||||||||
| SSP |
$17 | $153 | $22 | $24 | $39 | $36 | $120 | |||||||||||||||||||||
|
Non-SSP |
785 | 2,821 | 697 | 725 | 694 | 774 | 2,891 | |||||||||||||||||||||
| Total Revenue* |
$ | 802 | $ | 2,974 | $719 | $749 | $733 | $810 | $3,011 | |||||||||||||||||||
|
Y/Y Growth
|
||||||||||||||||||||||||||||
| 1Q19 | 2Q19 | 3Q19 | 4Q19 | FY19 | ||||||||||||||||||||||||
| SSP |
-65% | -39% | 11% | 112% | -22% | |||||||||||||||||||||||
|
Non-SSP |
10% | 3% | -1% | -1% | 2% | |||||||||||||||||||||||
| Total Revenue* |
3% | 1% | 0% | 1% | 1% | |||||||||||||||||||||||
% of Total Revenue
| 4Q18 | FY18 | 1Q19 | 2Q19 | 3Q19 | 4Q19 | FY19 | ||||||||||||||||||||||
| SSP |
2% | 5% | 3% | 3% | 5% | 4% | 4% | |||||||||||||||||||||
|
Non-SSP |
98% | 95% | 97% | 97% | 95% | 96% | 96% | |||||||||||||||||||||
Revenue by Geography
| · | Revenue in the Americas was $453 million, up 3% year-over-year, and represented 56% of total revenue in the fourth quarter |
| · | Revenue in EMEA decreased 1% year-over-year, and APJ decreased 4% year-over-year, and represented 34% and 10% of revenue, respectively, in the fourth quarter |
Revenue by Geography (in millions)
| 4Q18 | FY18 | 1Q19 | 2Q19 | 3Q19 | 4Q19 | FY19 | ||||||||||||||||||||||
| Americas |
$ | 440 | $ | 1,717 | $ | 401 | $ | 432 | $ | 418 | $ | 453 | $ | 1,705 | ||||||||||||||
| EMEA |
279 | 956 | 237 | 240 | 236 | 278 | 991 | |||||||||||||||||||||
| APJ |
82 | 301 | 81 | 76 | 79 | 79 | 315 | |||||||||||||||||||||
| Total Revenue* |
$ | 802 | $ | 2,974 | $ | 719 | $ | 749 | $ | 733 | $ | 810 | $ | 3,011 | ||||||||||||||
*Amounts may not recalculate due to rounding.
Note: Financial summary tables are unaudited. This document should be read in conjunction with the Company’s SEC Filings.
|
|
||||||||||||
| 2019 | Q4 and Full Year Financials | 7 | ||||||||||
Y/Y Growth
| 1Q19 | 2Q19 | 3Q19 | 4Q19 | FY19 | ||||||||||||||||||||||||
| Americas |
-3 | % | 0 | % | -3 | % | 3 | % | -1 | % | ||||||||||||||||||
| EMEA |
10 | % | 3 | % | 3 | % | -1 | % | 4 | % | ||||||||||||||||||
| APJ |
18 | % | -3 | % | 10 | % | -4 | % | 5 | % | ||||||||||||||||||
| Total Revenue* |
3 | % | 1 | % | 0 | % | 1 | % | 1 | % | ||||||||||||||||||
% of Total Revenue
| 4Q18 | FY18 | 1Q19 | 2Q19 | 3Q19 | 4Q19 | FY19 | ||||||||||||||||||||||
| Americas |
55 | % | 58 | % | 56 | % | 58 | % | 57 | % | 56 | % | 57 | % | ||||||||||||||
| EMEA |
35 | % | 32 | % | 33 | % | 32 | % | 32 | % | 34 | % | 33 | % | ||||||||||||||
| APJ |
10 | % | 10 | % | 11 | % | 10 | % | 11 | % | 10 | % | 10 | % | ||||||||||||||
Operating Margin2
| · | GAAP operating margin in the fourth quarter was 23%, and for the fiscal year was 18% |
| · | Non-GAAP operating margin in the fourth quarter was 34%, and for the fiscal year was 30% |
Earnings2
| · | GAAP net income in the fourth quarter was $207 million, or $1.56 per diluted share, and for the fiscal year was $682 million, or $5.03 per diluted share |
| · | Non-GAAP net income in the fourth quarter was $227 million, or $1.71 per diluted share, and for the fiscal year was $762 million, or $5.69 per diluted share |
Both GAAP and non-GAAP tax rates benefited from the geographical mix of income towards lower tax regions. GAAP net income also included an estimated $54 million tax benefit in the fourth quarter, and $212 million for the full fiscal year related to transitional tax relief in accordance with the enactment of federal tax reform in Switzerland.
Cash Flow from Operations
| · | Cash flow from Operations in the fourth quarter was $206 million, and for the fiscal year was $783 million |
As a result of our subscription model transition, more cash will be collected in future periods as SaaS agreements are typically billed annually, as opposed to our perpetual business, which is typically billed up-front.
Balance Sheet and Capital Allocation
| · | The fourth quarter ended with approximately $605 million in cash and investments |
| · | Paid dividend to shareholders of $0.35 per share totaling $46 million in the fourth quarter, and $183 million for the fiscal year |
| · | Board of Directors declared a quarterly dividend of $0.35 per share to be paid on March 20, 2020 to shareholders of record on March 6, 2020 |
| · | Repurchased approximately 1.0 million shares in the fourth quarter, and 5.4 million shares for the fiscal year |
*Amounts may not recalculate due to rounding.
Note: Financial summary tables are unaudited. This document should be read in conjunction with the Company’s SEC Filings.
2A reconciliation of GAAP to non-GAAP measures has been provided in the financial statement tables included in this letter. An explanation of these measures is also included below under the heading “Reconciliation of Non-GAAP Financial Measures to Comparable U.S. GAAP Measures.”
|
|
||||||||||||
| 2019 | Q4 and Full Year Financials | 8 | ||||||||||
| · | On January 21, 2020, our Board of Directors increased our share repurchase authorization by $1 billion, bringing the total remaining authorization to approximately $1.75 billion. We also announced today that we entered into a $1 billion term loan credit facility, which we plan to use to return capital through open market transactions, accelerated share repurchases, or other means, and is reflected in our guidance |
Guidance
Full Year 2020
Our full year 2020 guidance is now:
| Full Year 2020 Guidance2 | ||
| Revenue |
$3.10 billion to $3.13 billion | |
| GAAP Operating Margin |
17.2% to 18.2% | |
|
Non-GAAP Operating Margin |
28.0% to 29.0% | |
| GAAP Diluted EPS |
$3.29 to $3.50 | |
|
Non-GAAP Diluted EPS |
$5.35 to $5.55 | |
Guidance reflects our expectation that subscription bookings as a percentage of product bookings will increase from 62% in 2019 to approximately 65% to 75% in 2020. The magnitude of the impact to recognized revenue is dependent on the mix of product bookings as well as the mix within subscription bookings. If our actual subscription bookings as a percentage of product bookings or if our SaaS bookings mix within subscription bookings exceeds expectations, the headwind to our 2020 revenue could be higher.
Guidance assumes that non-GAAP operating margin will decline approximately 100 basis points year-over-year driven by a higher mix of cloud subscriptions and investments to continue to scale a growing cloud mix. We expect 2020 to be the trough year for operating margin in our multi-year subscription transition.
First Quarter 2020
We currently anticipate:
| First Quarter 2020 Guidance2 | ||
| Revenue |
$730 million to $740 million | |
| GAAP Diluted EPS |
$0.74 to $0.80 | |
|
Non-GAAP Diluted EPS |
$1.15 to $1.20 | |
Guidance reflects our expectation that subscription bookings as a percentage of product bookings will be in the range of 55% to 60% in the first quarter of 2020.
The above statements are based on current targets as of the date of this letter. These statements are forward-looking, and actual results may differ materially.
2A reconciliation of GAAP to non-GAAP measures has been provided in the financial statement tables included in this letter. An explanation of these measures is also included below under the heading “Reconciliation of Non-GAAP Financial Measures to Comparable U.S. GAAP Measures.”
|
|
||||||||||||
| 2019 | Q4 and Full Year Financials | 9 | ||||||||||
CITRIX SYSTEMS, INC.
CONDENSED CONSOLIDATED STATEMENTS OF INCOME
(In thousands, except per share data – unaudited)
|
Three Months
|
Three Months
|
Year Ended
|
Year
Ended
|
|||||||||||||
| Revenues |
||||||||||||||||
| Subscription |
$193,498 | $129,783 | $650,810 | $455,276 | ||||||||||||
| Product and license |
176,741 | 210,788 | 583,474 | 734,495 | ||||||||||||
| Support and services |
439,584 | 461,299 | 1,776,280 | 1,784,132 | ||||||||||||
| Total net revenues |
809,823 | 801,870 | 3,010,564 | 2,973,903 | ||||||||||||
| Cost of net revenues |
||||||||||||||||
| Cost of subscription, support and services |
83,125 | 70,870 | 310,255 | 266,495 | ||||||||||||
| Cost of product and license revenues |
27,419 | 29,099 | 102,452 | 120,249 | ||||||||||||
| Amortization and impairment of product related intangible assets |
8,633 | 12,882 | 51,340 | 47,059 | ||||||||||||
| Total cost of net revenues |
119,177 | 112,851 | 464,047 | 433,803 | ||||||||||||
| Gross margin |
690,646 | 689,019 | 2,546,517 | 2,540,100 | ||||||||||||
| Operating expenses |
||||||||||||||||
| Research and development |
128,165 | 116,934 | 518,877 | 439,984 | ||||||||||||
| Sales, marketing and services |
284,998 | 273,729 | 1,132,956 | 1,074,234 | ||||||||||||
| General and administrative |
81,678 | 88,192 | 320,429 | 315,343 | ||||||||||||
| Amortization of other intangible assets |
4,219 | 4,106 | 15,890 | 15,854 | ||||||||||||
| Restructuring |
6,225 | 3,587 | 22,247 | 16,725 | ||||||||||||
| Total operating expenses |
505,285 | 486,548 | 2,010,399 | 1,862,140 | ||||||||||||
| Income from operations |
185,361 | 202,471 | 536,118 | 677,960 | ||||||||||||
| Interest income |
2,087 | 11,001 | 18,280 | 40,030 | ||||||||||||
| Interest expense |
(8,830) | (19,322) | (45,974) | (80,162) | ||||||||||||
| Other (expense) income, net |
(2,659) | (6,526) | 1,076 | (8,373) | ||||||||||||
| Income before income taxes |
175,959 | 187,624 | 509,500 | 629,455 | ||||||||||||
| Income tax (benefit) expense |
(31,154) | 21,906 | (172,313) | 53,788 | ||||||||||||
| Net income |
$207,113 | $165,718 | $681,813 | $575,667 | ||||||||||||
| Earnings per share: |
||||||||||||||||
| Basic |
$1.59 | $1.24 | $5.21 | $4.23 | ||||||||||||
| Diluted |
$1.56 | $1.15 | $5.03 | $3.94 | ||||||||||||
| Weighted average shares outstanding: |
||||||||||||||||
| Basic |
130,361 | 133,883 | 130,853 | 136,030 | ||||||||||||
| Diluted |
133,112 | 144,372 | 135,495 | 145,934 | ||||||||||||
Note: This document should be read in conjunction with the Company’s SEC Filings.
|
|
||||||||||||
| 2019 | Q4 and Full Year Financials | 10 | ||||||||||
CITRIX SYSTEMS, INC.
CONDENSED CONSOLIDATED BALANCE SHEETS
(In thousands – unaudited)
|
December 31, 2019
|
December 31, 2018
|
|||||||
| Assets |
||||||||
| Cash and cash equivalents |
$545,761 | $618,766 | ||||||
| Short-term investments, available for sale |
43,055 | 583,615 | ||||||
| Accounts receivable, net |
720,359 | 688,420 | ||||||
| Inventories, net |
15,898 | 21,905 | ||||||
| Prepaid expenses and other current assets |
187,659 | 174,195 | ||||||
| Total current assets |
1,512,732 | 2,086,901 | ||||||
| Long-term investments, available for sale |
16,640 | 574,319 | ||||||
| Property and equipment, net |
231,894 | 243,396 | ||||||
| Operating lease right-of-use assets |
206,154 | - | ||||||
| Goodwill |
1,798,408 | 1,802,670 | ||||||
| Other intangible assets, net |
108,478 | 167,187 | ||||||
| Deferred tax assets, net |
361,814 | 136,998 | ||||||
| Other assets |
152,806 | 124,578 | ||||||
| Total assets |
$4,388,926 | $5,136,049 | ||||||
| Liabilities, Temporary Equity, and Stockholders’ Equity |
||||||||
| Accounts payable |
$84,538 | $75,551 | ||||||
| Accrued expenses and other current liabilities |
331,680 | 290,492 | ||||||
| Income taxes payable |
60,036 | 44,409 | ||||||
| Current portion of convertible notes |
- | 1,155,445 | ||||||
| Current portion of deferred revenues |
1,352,333 | 1,345,243 | ||||||
| Total current liabilities |
1,828,587 | 2,911,140 | ||||||
| Long-term portion of deferred revenues |
443,458 | 489,329 | ||||||
| Long-term debt |
742,926 | 741,825 | ||||||
| Long-term income tax payable |
259,391 | 285,627 | ||||||
| Operating lease liabilities |
209,382 | - | ||||||
| Other liabilities |
67,526 | 148,499 | ||||||
| Temporary equity from convertible notes |
- | 8,110 | ||||||
| Stockholders’ equity: |
||||||||
| Common stock |
319 | 310 | ||||||
| Additional paid-in capital |
6,249,065 | 5,404,500 | ||||||
| Retained earnings |
4,660,145 | 4,169,019 | ||||||
| Accumulated other comprehensive loss |
(5,127) | (8,154) | ||||||
| Less-common stock in treasury, at cost |
(10,066,746) | (9,014,156) | ||||||
| Total stockholders’ equity |
837,656 | 551,519 | ||||||
| Total liabilities, temporary equity and stockholders’ equity |
$4,388,926 | $5,136,049 | ||||||
Note: This document should be read in conjunction with the Company’s SEC Filings.
|
|
||||||||||||
| 2019 | Q4 and Full Year Financials | 11 | ||||||||||
CITRIX SYSTEMS, INC.
CONDENSED CONSOLIDATED STATEMENT OF CASH FLOWS
(In thousands – unaudited)
|
Year Ended
|
||||
| Operating Activities |
||||
| Net income |
$681,813 | |||
| Adjustments to reconcile net income to net cash provided by operating activities: |
||||
| Depreciation, amortization and other |
244,520 | |||
| Stock-based compensation expense |
278,892 | |||
| Deferred income tax benefit |
(244,933) | |||
| Effects of other rate changes on monetary assets and liabilities denominated in foreign currencies |
2,631 | |||
| Other non-cash items |
10,630 | |||
| Total adjustments to reconcile net income to net cash provided by operating activities |
291,740 | |||
| Changes in operating assets and liabilities, net of the effects of acquisitions: |
||||
| Accounts receivable |
(38,994) | |||
| Inventories |
3,046 | |||
| Prepaid expenses and other current assets |
(7,129) | |||
| Other assets |
(74,152) | |||
| Income taxes, net |
(22,147) | |||
| Accounts payable |
8,994 | |||
| Accrued expenses and other current liabilities |
(25,722) | |||
| Deferred revenues |
(38,780) | |||
| Other liabilities |
4,401 | |||
| Total changes in operating assets and liabilities, net of the effects of acquisitions |
(190,483) | |||
| Net cash provided by operating activities |
783,070 | |||
| Investing Activities |
||||
| Purchases of available-for-sale investments |
(20,003) | |||
| Proceeds from sales of available-for-sale investments |
942,985 | |||
| Proceeds from maturities of available-for-sale investments |
178,070 | |||
| Purchases of property and equipment |
(63,454) | |||
| Cash paid for licensing agreements, patents and technology |
(3,500) | |||
| Other |
1,651 | |||
| Net cash provided by investing activities |
1,035,749 | |||
| Financing Activities |
||||
| Proceeds from credit facility |
200,000 | |||
| Repayment on credit facility |
(200,000) | |||
| Repayment on convertible notes |
(1,164,497) | |||
| Stock repurchases, net |
(453,853) | |||
| Cash paid for tax withholding on vested stock awards |
(89,213) | |||
| Cash paid for dividends |
(182,947) | |||
| Net cash used in financing activities |
(1,890,510) | |||
| Effect of exchange rate changes on cash and cash equivalents |
(1,314) | |||
| Change in cash and cash equivalents |
(73,005) | |||
| Cash and cash equivalents at beginning of period |
618,766 | |||
| Cash and cash equivalents at end of period |
$545,761 | |||
Note: This document should be read in conjunction with the Company’s SEC Filings.
|
|
||||||||||||
| 2019 | Q4 and Full Year Financials | 12 | ||||||||||
CITRIX SYSTEMS, INC.
STOCK-BASED COMPENSATION EXPENSE BY INCOME STATEMENT CLASSIFICATION
(In thousands – unaudited)
| 4Q18 | FY18 | 1Q19 | 2Q19 | 3Q19 | 4Q19 | FY19 | ||||||||||||||||||||||
| Cost of subscription, support and services |
$2,152 | $7,979 | $2,202 | $2,956 | $2,898 | $2,865 | $10,921 | |||||||||||||||||||||
| Research and development |
20,637 | 66,154 | 27,837 | 25,419 | 25,505 | 25,792 | 104,553 | |||||||||||||||||||||
| Sales, marketing and services |
20,311 | 72,406 | 19,926 | 24,424 | 23,838 | 27,347 | 95,535 | |||||||||||||||||||||
| General and administrative |
16,213 | 57,080 | 15,269 | 15,521 | 16,728 | 20,365 | 67,883 | |||||||||||||||||||||
| Total stock-based compensation expense |
$59,313 | $203,619 | $65,234 | $68,320 | $68,969 | $76,369 | $278,892 | |||||||||||||||||||||
Note: This document should be read in conjunction with the Company’s SEC Filings.
Safe Harbor
For Citrix Investors
This letter contains forward-looking statements made pursuant to the safe harbor provisions of Section 27A of the Securities Act of 1933 and of Section 21E of the Securities Exchange Act of 1934. The forward-looking statements in this letter do not constitute guarantees of future performance. Investors are cautioned that statements in this letter, which are not strictly historical statements, including, without limitation, statements regarding the pace of our transformation, the evolution of the Workspace market and the potential of Citrix Workspace, statements regarding our opportunity and product position, statements regarding our opportunity to grow our VDI business and grow our customer and user base, statements regarding our near and longer-term growth potential and our multi-year strategy, statements regarding the mix shift within Networking away from hardware towards software-based solutions, statements regarding the future return of capital to our shareholders, statements regarding our ability to increase the average duration of customer contracts, statements contained in the Guidance sections and under the Non-GAAP Financial Measures Reconciliation section, including statements concerning fiscal quarters and years ending in 2020, headwind to 2020 revenue, our subscription model-transition, mix of cloud subscriptions and investments, and the impact of the transition on operating margin, and statements regarding ARR, product introductions and management’s plans, objectives and strategies, constitute forward-looking statements. Such forward-looking statements are subject to a number of risks and uncertainties that could cause actual results to differ materially from those anticipated by the forward-looking statements, including, without limitation, risks associated with our ability to advance our transformation from perpetual to subscription and from on-premise to cloud, including our ability to deepen our subscription customer relationships; our ability to grow the percentage of subscription bookings and paid subscribers; our ability to forecast our future financial performance during our business model transition; our ability to continue to grow the company’s Workspace business, further develop Citrix Workspace and continued demand for Citrix Workspace; risks associated with the expansion of cloud-delivered services; regulation of privacy and data security; the risks associated with maintaining the security of our products, services, and networks, including securing customer data, and the risks associated with our recent cyber security incident and recent networking product vulnerability; the impact of the global economic and political environment on our business, volatility in global stock markets, foreign exchange rate volatility and uncertainty in IT spending and changes in the markets for our products, including the Workspace market; changes in Citrix’s pricing and licensing models, promotional programs and product mix, all of which may impact Citrix’s revenue recognition; our ability to expand our customer base and attract more users within our customer base; the introduction of new products by competitors or the entry of new competitors into the markets for Citrix’s products and services; our ability to protect our innovations and intellectual property, including in higher-risk markets; the concentration of customers in Citrix’s networking business; the company’s ability to innovate and develop new products and services while growing its established virtualization and networking products and services; changes in our revenue mix towards products and services with lower gross margins; seasonal fluctuations in the company’s business; failure to execute Citrix’s sales and marketing plans; failure to successfully partner with key distributors, resellers, system integrators, service providers and strategic partners, such as Microsoft; transitions in key personnel and succession risk; the company’s ability to maintain and expand its business in large enterprise accounts and reliance on large service provider customers; the size, timing and recognition of revenue from
|
|
||||||||||||
| 2019 | Q4 and Full Year Financials | 13 | ||||||||||
significant orders; the success of investments in its product groups, foreign operations and vertical and geographic markets; the ability of Citrix to make suitable acquisitions on favorable terms in the future; risks associated with Citrix’s acquisitions and divestitures, including failure to further develop and successfully market the technology and products of acquired companies, failure to achieve or maintain anticipated revenues and operating performance contributions from acquisitions, which could dilute earnings; the recruitment and retention of qualified employees; risks in effectively controlling operating expenses, and our ability to improve our operating margin; ability to effectively manage our capital structure and the impact of related changes on our operating results and financial condition; the effect of new accounting pronouncements on revenue and expense recognition; failure to comply with federal, state and international regulations; litigation and disputes, including challenges to our intellectual property rights or allegations of infringement of the intellectual property rights of others; the ability to maintain and protect our collection of brands; charges in the event of a write-off or impairment of acquired assets, underperforming businesses, investments or licenses; international market readiness, execution and other risks associated with the markets for Citrix’s products and services; risks related to servicing our debt; risks of political uncertainty and social turmoil; and other risks detailed in Citrix’s filings with the Securities and Exchange Commission. Citrix assumes no obligation to update any forward-looking information contained in this letter or with respect to the announcements described herein.
Reconciliation of Non-GAAP Financial Measures to Comparable U.S. GAAP Measures (Unaudited)
Pursuant to the requirements of Regulation G, the Company has provided a reconciliation of each non-GAAP financial measure used in this letter and related conference call or webcast to the most directly comparable GAAP financial measure. These measures differ from GAAP in that they exclude amortization and impairment primarily related to acquired intangible assets and debt discount, stock-based compensation expenses and charges associated with the Company’s restructuring programs, the related tax effect of those items, and charges and benefits related to tax reform. The Company also reflects the effect of anti-dilutive convertible note hedges in the number of shares used in non-GAAP diluted earnings per share. The income tax effect on non-GAAP items is calculated based upon the tax laws and statutory income tax rates applicable in the tax jurisdiction(s) of the underlying non-GAAP adjustment. The Company’s basis for these adjustments is described below.
Management uses these non-GAAP measures for internal reporting and forecasting purposes, when publicly providing its business outlook, to evaluate the Company’s performance and to evaluate and compensate the Company’s executives. The Company has provided these non-GAAP financial measures in addition to GAAP financial results because it believes that these non-GAAP financial measures provide useful information to certain investors and financial analysts for comparison across accounting periods not influenced by certain non-cash items or cash charges that are the result of discrete activities that are not used by management when evaluating the Company’s historical and prospective financial performance. In addition, the Company has historically provided this or similar information and understands that some investors and financial analysts find this information helpful in analyzing the Company’s operating margins, operating expenses and net income and comparing the Company’s financial performance to that of its peer companies and competitors. Management typically excludes the amounts described above when evaluating the Company’s operating performance and believes that the resulting non-GAAP measures are useful to investors and financial analysts in assessing the Company’s operating performance due to the following factors:
| · | The Company does not acquire businesses on a predictable cycle. The Company, therefore, believes that the presentation of non-GAAP measures that adjust for the impact of amortization and impairment of intangible assets and stock-based compensation expenses and the related tax effects that are primarily related to acquisitions, provide investors and financial analysts with a consistent basis for comparison across accounting periods and, therefore, are useful to investors and financial analysts in helping them to better understand the Company’s operating results and underlying operational trends. |
| · | Amortization and impairment of intangible assets and the related tax effects are fixed at the time of an acquisition, are then amortized over a period of several years after the acquisition and generally cannot be changed or influenced by management after the acquisition. |
|
|
||||||||||||
| 2019 | Q4 and Full Year Financials | 14 | ||||||||||
| · | Although stock-based compensation is an important aspect of the compensation of the Company’s employees and executives, stock-based compensation expense is generally fixed at the time of grant, then amortized over a period of several years after the grant of the stock-based instrument, and generally cannot be changed or influenced by management after the grant. |
| · | Under GAAP, certain convertible debt instruments that may be settled in cash on conversion are required to be accounted for as separate liability (debt) and equity (conversion option) components in a manner that reflects the issuer’s non-convertible debt borrowing rate. The difference between the imputed interest expense and the coupon interest expense, net of the interest amount capitalized, is excluded from management’s assessment of the Company’s operating performance because management believes that the exclusion of these charges will better help investors and financial analysts understand the Company’s operating results and underlying operational trends. |
| · | The Company has engaged in various restructuring activities over the past several years that have resulted in costs associated with reductions in headcount, consolidation of leased facilities and related costs. Each restructuring activity has been a discrete event based on a unique set of business objectives or circumstances, and each has differed from the others in terms of its operational implementation, business impact and scope. While the Company’s operations previously benefited from the employees and facilities covered by the various restructuring charges, these employees and facilities have benefited different parts of the Company’s business in different ways, and the amount of these charges has varied significantly from period to period. The Company, therefore, believes that the exclusion of these charges will better help investors and financial analysts understand the Company’s operating results and underlying operational trends. |
| · | The Company had convertible note hedges in place to offset potential dilution from the embedded conversion feature in its convertible notes. For GAAP diluted earnings per share purposes, the Company cannot reflect the anti-dilutive impact of the convertible note hedges. The Company believes that reflecting the anti-dilutive impact of the convertible note hedges in non-GAAP diluted earnings per share provides investors with useful information in evaluating the financial performance of the Company on a per share basis. |
| · | Tax charges or benefits resulting from the enactment of Swiss tax reform. These charges or benefits are not anticipated to be ongoing; and, thus, are outside of the normal operations of the Company’s business. Therefore, the Company believes that the exclusion of these charges or benefits will better help investors and financial analysts understand the Company’s operating results and underlying operational trends. |
These non-GAAP financial measures are not prepared in accordance with accounting principles generally accepted in the United States (“GAAP”) and may differ from the non-GAAP information used by other companies. There are significant limitations associated with the use of non-GAAP financial measures. The additional non-GAAP financial information presented here should be considered in conjunction with, and not as a substitute for or superior to, the financial information presented in accordance with GAAP (such as net income and earnings per share) and should not be considered measures of the Company’s liquidity.
GAAP to Non-GAAP Reconciliation
(In thousands, except per share data and operating margin data - unaudited)
| Three Months Ended
|
Twelve Months Ended
|
|||||||
| GAAP operating margin |
22.9 | % | 17.8 | % | ||||
| Add: stock-based compensation |
9.4 | 9.3 | ||||||
| Add: amortization and impairment of product related intangible assets |
0.8 | 1.5 | ||||||
| Add: amortization of other intangible assets |
0.5 | 0.5 | ||||||
| Add: restructuring charges |
0.8 | 0.7 | ||||||
|
Non-GAAP operating margin |
34.4 | % | 29.8 | % | ||||
|
|
||||||||||||
| 2019 | Q4 and Full Year Financials | 15 | ||||||||||
| Three Months Ended
|
Twelve Months Ended
|
|||||||
| GAAP net income |
$207,113 | $681,813 | ||||||
| Add: stock-based compensation |
76,369 | 278,892 | ||||||
| Add: amortization and impairment of product related intangible assets |
6,696 | 43,945 | ||||||
| Add: amortization of other intangible assets |
4,219 | 15,890 | ||||||
| Add: amortization of debt discount |
- | 8,191 | ||||||
| Add: restructuring charges |
6,225 | 22,247 | ||||||
| Less: tax effects related to above items |
(19,142) | (76,572) | ||||||
| Less: benefit related to Swiss tax reform |
(54,375) | (212,026) | ||||||
|
Non-GAAP net income |
$227,105 | $762,380 | ||||||
| Twelve Months Ended
|
||||||
| Number of shares used in diluted earnings per share calculations: |
||||||
| GAAP weighted average shares outstanding |
135,495 | |||||
| Less: effect of convertible note hedges |
(1,422) | |||||
|
Non-GAAP weighted average shares outstanding |
134,073 | |||||
| Three Months Ended
|
Twelve Months Ended
|
|||||||
| GAAP earnings per share - diluted |
$1.56 | $5.03 | ||||||
| Add: stock-based compensation |
0.57 | 2.06 | ||||||
| Add: amortization and impairment of product related intangible assets |
0.05 | 0.32 | ||||||
| Add: amortization of other intangible assets |
0.03 | 0.12 | ||||||
| Add: amortization of debt discount |
- | 0.06 | ||||||
| Add: restructuring charges |
0.05 | 0.16 | ||||||
| Less: tax effects related to above items |
(0.14) | (0.56) | ||||||
| Less: benefit related to Swiss tax reform |
(0.41) | (1.56) | ||||||
| Add: effect of convertible note hedges |
- | 0.06 | ||||||
|
Non-GAAP earnings per share - diluted |
$1.71 | $5.69 | ||||||
Forward Looking Guidance - GAAP to Non-GAAP Reconciliation
| Three Months Ended March 31, 2020
|
Twelve Months Ended December 31, 2020
| |||
| GAAP earnings per share - diluted |
$0.74 - $0.80 | $3.29 - $3.50 | ||
| Add: adjustments to exclude the effects of
expenses related to |
0.44 | 2.28 | ||
| Add: adjustments to exclude the effects of
amortization of |
0.05 | 0.21 | ||
| Add: adjustments to exclude the effects of restructuring charges |
0.02 | 0.08 | ||
| Less: tax effects related to above items |
(0.10) - (0.11) | (0.51) - (0.52) | ||
|
Non-GAAP earnings per share - diluted |
$1.15 - $1.20 | $5.35 - $5.55 | ||
GAAP and non-GAAP diluted earnings per share do not include any additional impacts related to Swiss Cantonal tax reform because such impacts are not determinable at this time.
| Twelve Months Ended December 31, 2020
| ||||
| GAAP operating margin |
17.2% - 18.2% | |||
| Add: adjustment to exclude stock-based compensation |
9.6 | |||
| Add: adjustment to exclude amortization of intangible assets |
0.9 | |||
| Add: adjustment to exclude restructuring charges |
0.3 | |||
|
Non-GAAP operating margin |
28.0% - 29.0% | |||
|
|
||||||||||||
| 2019 | Q4 and Full Year Financials | 16 | ||||||||||