Attached files
| file | filename |
|---|---|
| EX-99.1 - EXHIBIT 99.1 - ALLSCRIPTS HEALTHCARE SOLUTIONS, INC. | a52158287ex99_1.htm |
| 8-K - ALLSCRIPTS HEALTHCARE SOLUTIONS, INC. 8-K - ALLSCRIPTS HEALTHCARE SOLUTIONS, INC. | a52158287.htm |
Exhibit 99.2

Allscripts Healthcare Solutions January 2020 J.P. Morgan Healthcare Conference
Disclaimer This presentation contains forward-looking statements within the meaning of the Private
Securities Litigation Reform Act of 1995. These forward-looking statements, including the preliminary financial information included in this presentation, are based on the current beliefs and expectations of Allscripts management, only speak
as of the date that they are made and are subject to significant risks and uncertainties. Such statements can be identified by the use of words such as “future,” “anticipates,” “believes,” “estimates,” “expects,” “intends,” “plans,”
“predicts,” “will,” “would,” “could,” “can,” “may,” and similar terms. Actual results could differ significantly from those set forth in the forward-looking statements and reported results should not be considered an indication of future
performance. Certain factors that could cause Allscripts actual results to differ materially from those described in the forward-looking statements include, but are not limited to: the final outcome of the criminal and civil investigations by
the DOJ involving Practice Fusion, including our ability to negotiate final settlement agreements with the DOJ and the terms of such agreements; potential additional investigations and proceedings from governmental entities or third parties
other than the DOJ related to the same or similar conduct underlying the DOJ’s investigations into Practice Fusion’s business practices; the expected financial results of businesses acquired by us; the successful integration of businesses
acquired by us; the anticipated and unanticipated expenses and liabilities related to businesses acquired by us, including the civil investigation by the U.S. Attorney’s Office involving our EIS business; security breaches resulting in
unauthorized access to our or our clients’ computer systems or data, including denial-of-services, ransomware or other Internet-based attacks; Allscripts ability to establish and maintain strategic relationships, including the recent
strategic partnerships announced by our Veradigm business unit; Allscripts failure to compete successfully; consolidation in Allscripts industry; current and future laws, regulations and industry initiatives; increased government involvement
in Allscripts industry; the failure of markets in which Allscripts operates to develop as quickly as expected; Allscripts or its customers’ failure to see the benefits of government programs; changes in interoperability or other regulatory
standards; the effects of the realignment of Allscripts sales, services and support organizations; market acceptance of Allscripts products and services; the unpredictability of the sales and implementation cycles for Allscripts products and
services; Allscripts ability to manage future growth; Allscripts ability to introduce new products and services; the performance of Allscripts products; Allscripts ability to protect its intellectual property rights; the outcome of legal
proceedings involving Allscripts; Allscripts ability to hire, retain and motivate key personnel; performance by Allscripts content and service providers; liability for use of content; price reductions; Allscripts ability to license and
integrate third party technologies; Allscripts ability to maintain or expand its business with existing customers; risks related to international operations; changes in tax rates or laws; business disruptions; Allscripts ability to maintain
proper and effective internal controls; and asset and long-term investment impairment charges. Additional information about these and other risks, uncertainties, and factors affecting Allscripts business is contained in Allscripts filings
with the Securities and Exchange Commission, including under the caption “Risk Factors” in the most recent Allscripts Annual Report on Form 10-K and subsequent Form 10-Qs. Allscripts does not undertake to update forward-looking statements to
reflect changed assumptions, the impact of circumstances or events that may arise after the date of the forward-looking statements, or other changes in its business, financial condition or operating results over time.
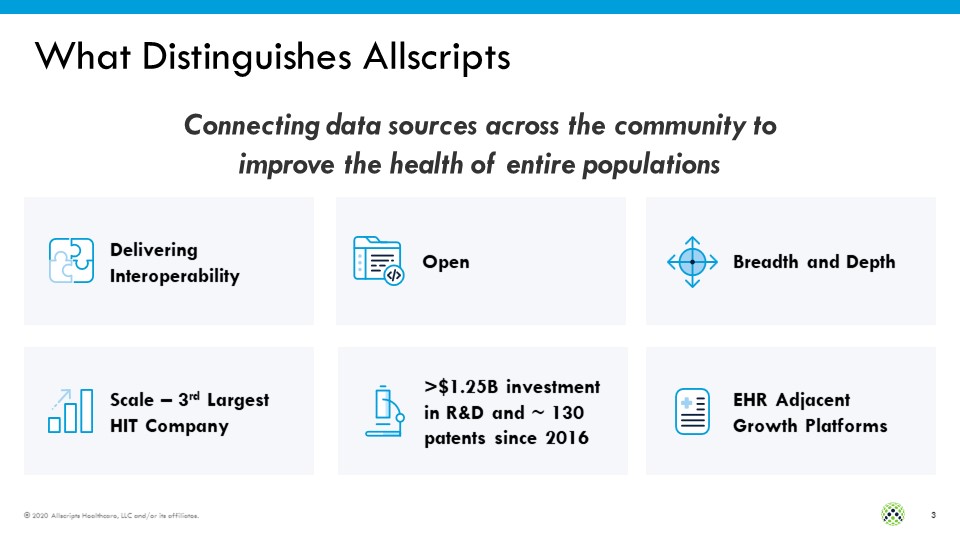
What Distinguishes Allscripts Delivering Interoperability Scale – 3rd Largest HIT Company Open EHR
Adjacent Growth Platforms Breadth and Depth >$1.25B investment in R&D and ~ 130 patents since 2016 Connecting data sources across the community to improve the health of entire populations
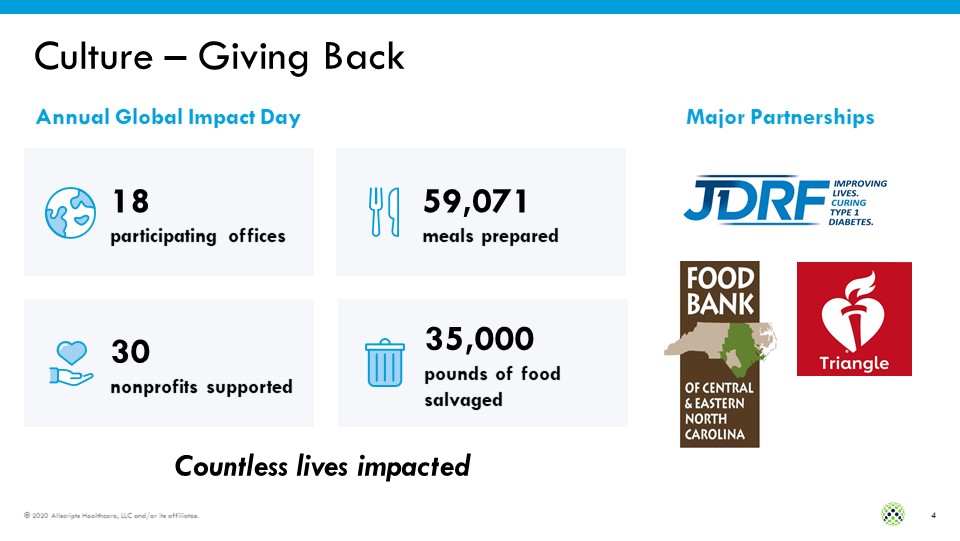
Culture – Giving Back 18participating offices 30nonprofits supported 59,071meals
prepared 35,000pounds of food salvaged Countless lives impacted Annual Global Impact Day Major Partnerships
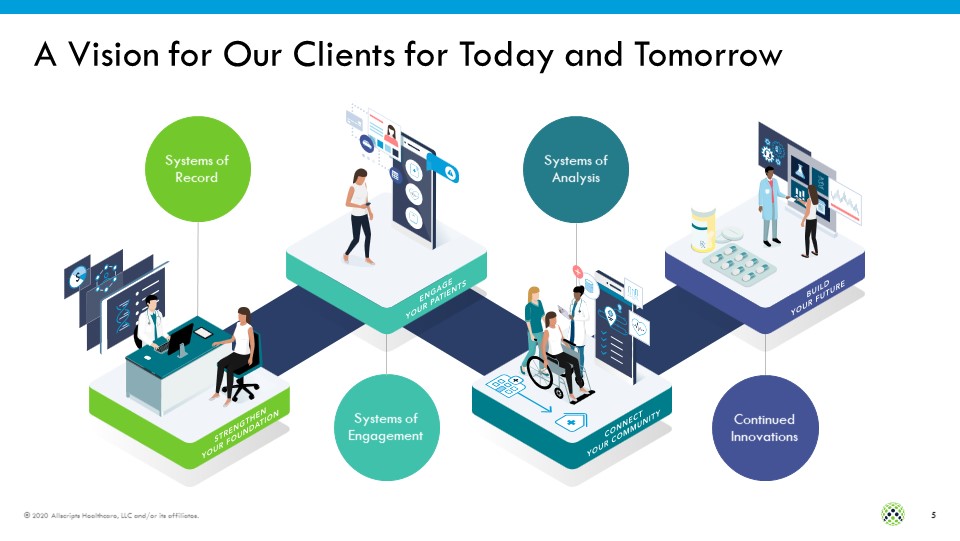
Systems of Record Systems of Engagement Systems of Analysis Continued
Innovations A Vision for Our Clients for Today and Tomorrow
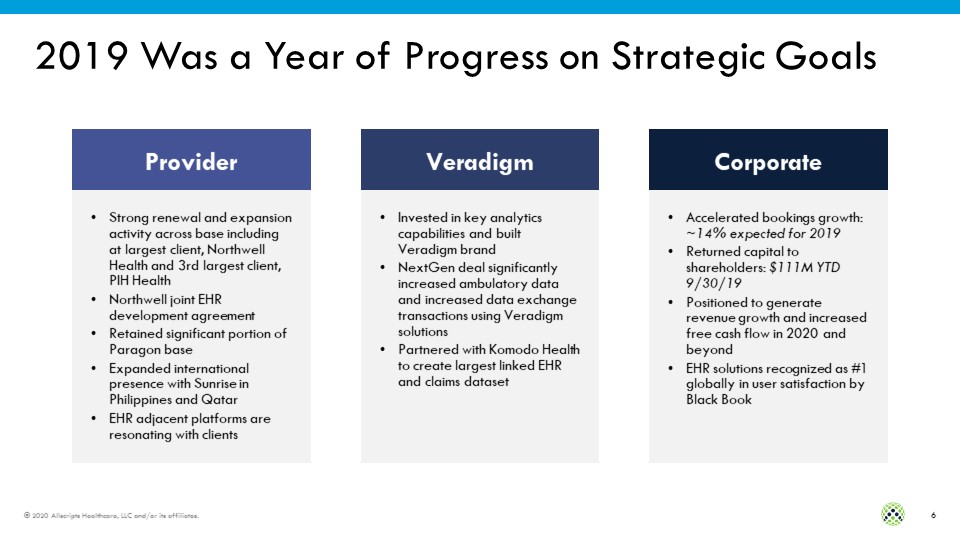
2019 Was a Year of Progress on Strategic Goals Strong renewal and expansion activity across base
including at largest client, Northwell Health and 3rd largest client, PIH HealthNorthwell joint EHR development agreementRetained significant portion of Paragon baseExpanded international presence with Sunrise in Philippines and QatarEHR
adjacent platforms are resonating with clients Invested in key analytics capabilities and built Veradigm brandNextGen deal significantly increased ambulatory data and increased data exchange transactions using Veradigm solutionsPartnered
with Komodo Health to create largest linked EHR and claims dataset Accelerated bookings growth: ~14% expected for 2019Returned capital to shareholders: $111M YTD 9/30/19 Positioned to generate revenue growth and increased free cash flow in
2020 and beyondEHR solutions recognized as #1 globally in user satisfaction by Black Book Provider Veradigm Corporate
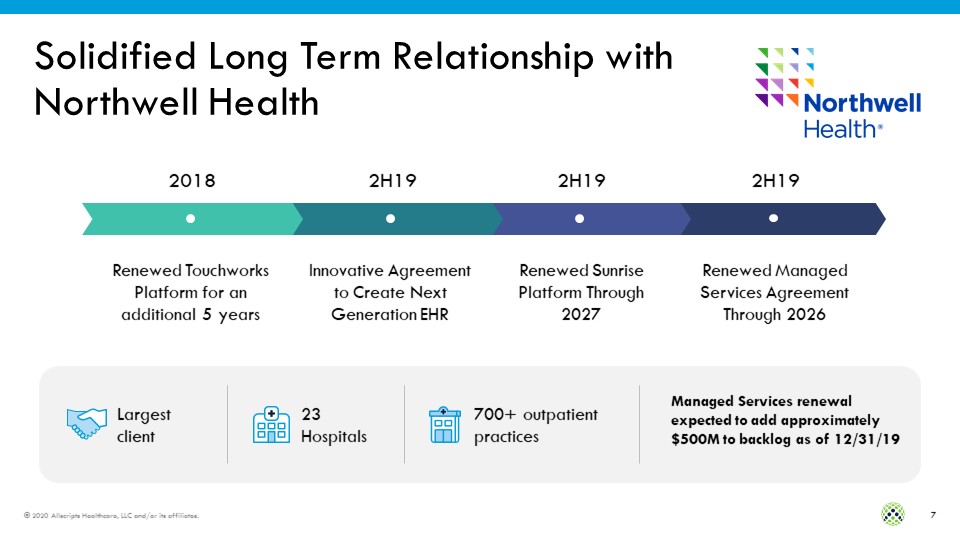
Solidified Long Term Relationship with Northwell Health 2018 2H19 2H19 2H19 Renewed
Touchworks Platform for an additional 5 years Innovative Agreement to Create Next Generation EHR Renewed Sunrise Platform Through 2027 Renewed Managed Services Agreement Through 2026 Largest client 23 Hospitals 700+ outpatient
practices Managed Services renewal expected to add approximately $500M to backlog as of 12/31/19

Unique Growth Platforms
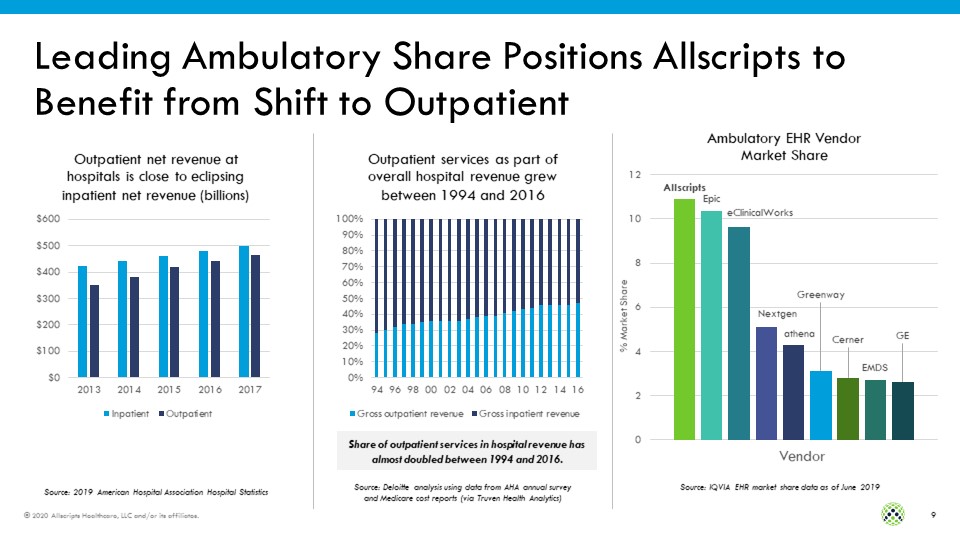
Leading Ambulatory Share Positions Allscripts to Benefit from Shift to Outpatient Source: 2019
American Hospital Association Hospital Statistics Source: Deloitte analysis using data from AHA annual survey and Medicare cost reports (via Truven Health Analytics) Share of outpatient services in hospital revenue has almost doubled
between 1994 and 2016. Source: IQVIA EHR market share data as of June 2019 % Market Share
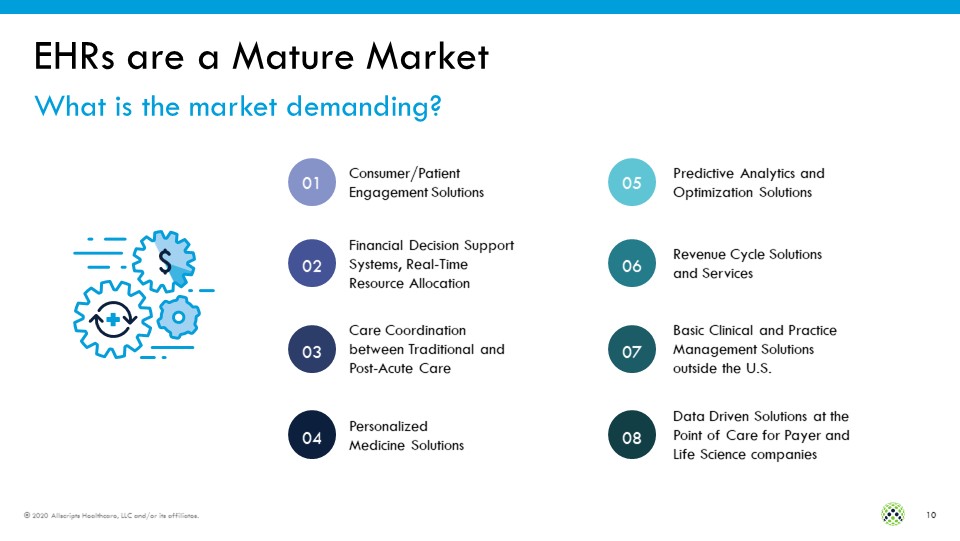
EHRs are a Mature Market What is the market demanding? 01 05 Consumer/Patient Engagement
Solutions Predictive Analytics and Optimization Solutions 03 07 Care Coordination between Traditional and Post-Acute Care Basic Clinical and Practice Management Solutions outside the U.S. 02 06 Financial Decision Support Systems,
Real-Time Resource Allocation Revenue Cycle Solutions and Services 04 Personalized Medicine Solutions 08 Data Driven Solutions at the Point of Care for Payer and Life Science companies
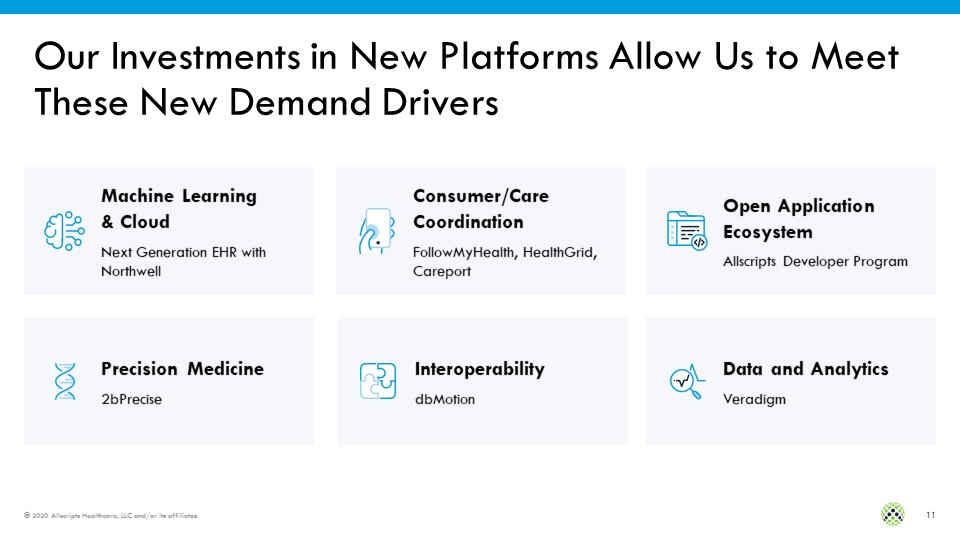
Our Investments in New Platforms Allow Us to Meet These New Demand Drivers Machine Learning &
CloudNext Generation EHR with Northwell Precision Medicine2bPrecise Consumer/Care Coordination FollowMyHealth, HealthGrid, Careport Data and AnalyticsVeradigm Open Application EcosystemAllscripts Developer Program
InteroperabilitydbMotion
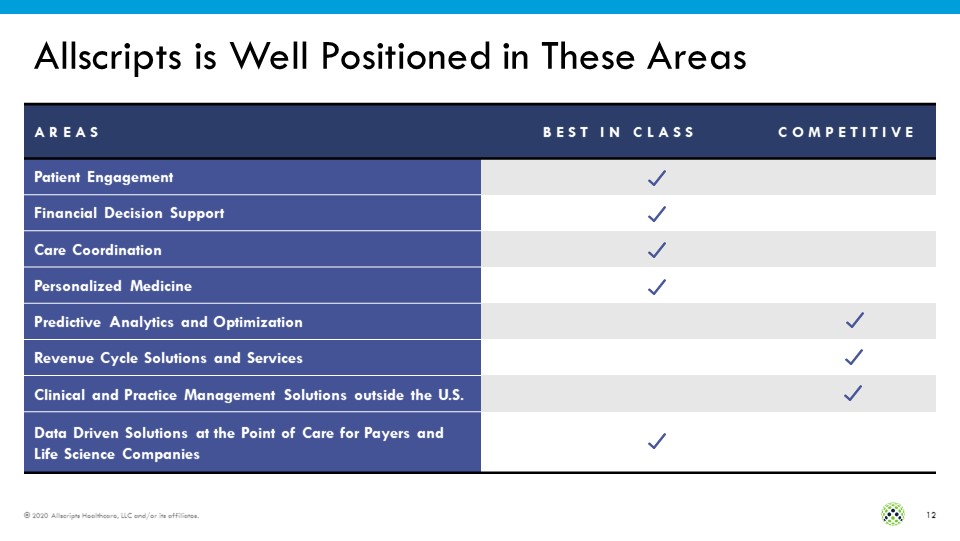
A R E A S B E S T I N C L A S S C O M P E T I T I V E Patient Engagement Financial Decision
Support Care Coordination Personalized Medicine Predictive Analytics and Optimization Revenue Cycle Solutions and Services Clinical and Practice Management Solutions outside the U.S. Data Driven Solutions at
the Point of Care for Payers and Life Science Companies Allscripts is Well Positioned in These Areas
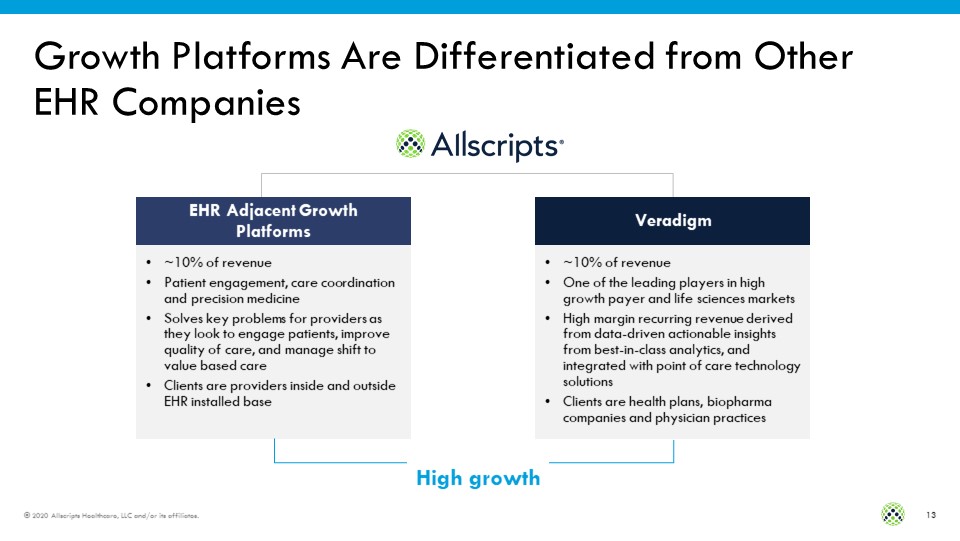
Growth Platforms Are Differentiated from Other EHR Companies ~10% of revenuePatient engagement, care
coordination and precision medicineSolves key problems for providers as they look to engage patients, improve quality of care, and manage shift to value based careClients are providers inside and outside EHR installed base ~10% of revenueOne
of the leading players in high growth payer and life sciences marketsHigh margin recurring revenue derived from data-driven actionable insights from best-in-class analytics, and integrated with point of care technology solutionsClients are
health plans, biopharma companies and physician practices EHR Adjacent Growth Platforms Veradigm High growth
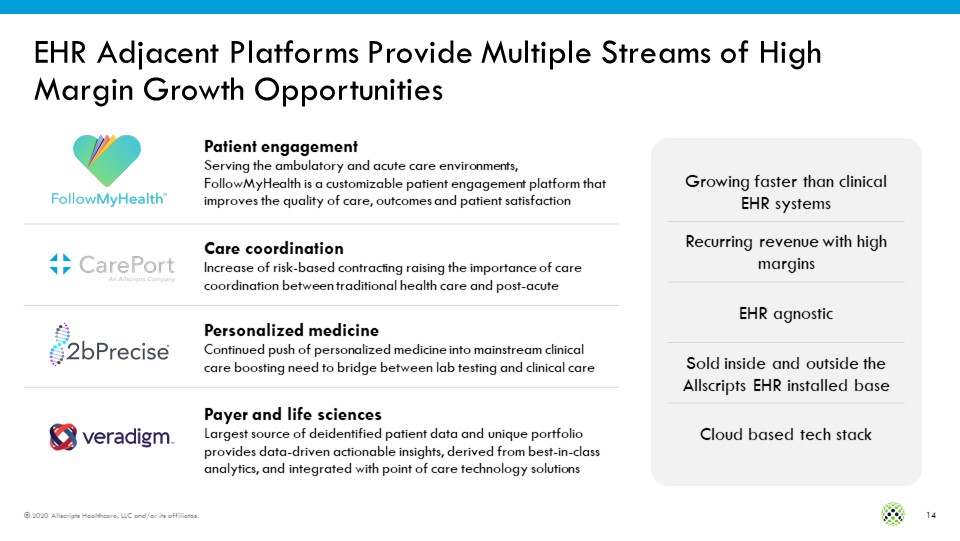
EHR Adjacent Platforms Provide Multiple Streams of High Margin Growth Opportunities Patient
engagementServing the ambulatory and acute care environments, FollowMyHealth is a customizable patient engagement platform that improves the quality of care, outcomes and patient satisfaction Care coordinationIncrease of risk-based
contracting raising the importance of care coordination between traditional health care and post-acute Personalized medicineContinued push of personalized medicine into mainstream clinical care boosting need to bridge between lab testing
and clinical care Payer and life sciencesLargest source of deidentified patient data and unique portfolio provides data-driven actionable insights, derived from best-in-class analytics, and integrated with point of care technology
solutions Growing faster than clinical EHR systems Recurring revenue with high margins EHR agnostic Sold inside and outside the Allscripts EHR installed base Cloud based tech stack
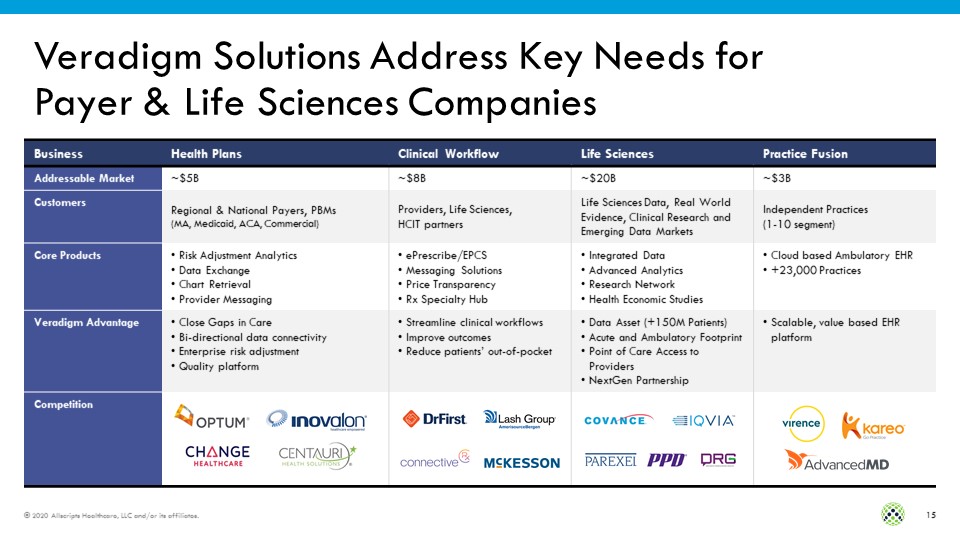
Veradigm Solutions Address Key Needs for Payer & Life Sciences Companies Business Health
Plans Clinical Workflow Life Sciences Practice Fusion Addressable Market ~$5B ~$8B ~$20B ~$3B Customers Regional & National Payers, PBMs(MA, Medicaid, ACA, Commercial) Providers, Life Sciences,HCIT partners Life Sciences Data,
Real World Evidence, Clinical Research and Emerging Data Markets Independent Practices(1-10 segment) Core Products Risk Adjustment AnalyticsData ExchangeChart RetrievalProvider Messaging ePrescribe/EPCSMessaging SolutionsPrice
TransparencyRx Specialty Hub Integrated DataAdvanced AnalyticsResearch NetworkHealth Economic Studies Cloud based Ambulatory EHR+23,000 Practices Veradigm Advantage Close Gaps in CareBi-directional data connectivityEnterprise risk
adjustmentQuality platform Streamline clinical workflowsImprove outcomesReduce patients’ out-of-pocket Data Asset (+150M Patients)Acute and Ambulatory FootprintPoint of Care Access to ProvidersNextGen Partnership Scalable, value based EHR
platform Competition
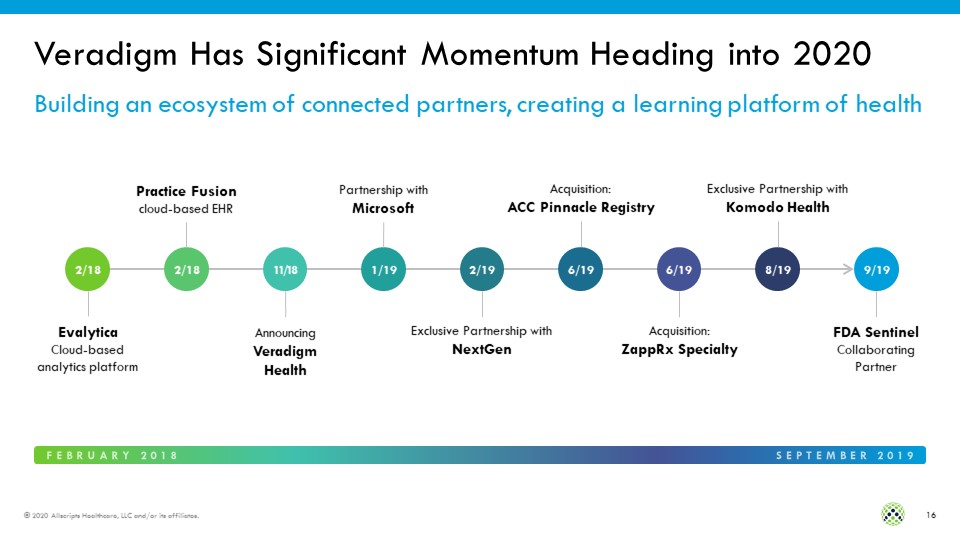
Veradigm Has Significant Momentum Heading into 2020 Building an ecosystem of connected partners,
creating a learning platform of health EvalyticaCloud-based analytics platform Practice Fusioncloud-based EHR Announcing Veradigm Health Partnership with Microsoft Exclusive Partnership withNextGen Acquisition:ACC Pinnacle
Registry Acquisition:ZappRx Specialty Exclusive Partnership withKomodo Health 2/18 2/18 11/18 1/19 2/19 6/19 6/19 8/19 FDA SentinelCollaboratingPartner 9/19 FEBRUARY 2018 SEPTEMBER 2019

Financial Update
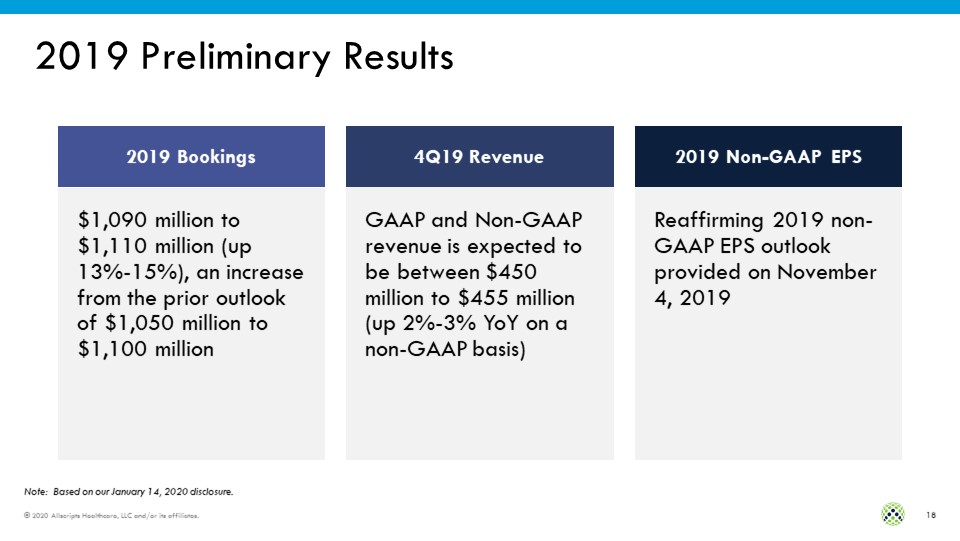
2019 Preliminary Results $1,090 million to $1,110 million (up 13%-15%), an increase from the prior
outlook of $1,050 million to $1,100 million GAAP and Non-GAAP revenue is expected to be between $450 million to $455 million (up 2%-3% YoY on a non-GAAP basis) Reaffirming 2019 non-GAAP EPS outlook provided on November 4, 2019 2019
Bookings 4Q19 Revenue 2019 Non-GAAP EPS Note: Based on our January 14, 2020 disclosure.
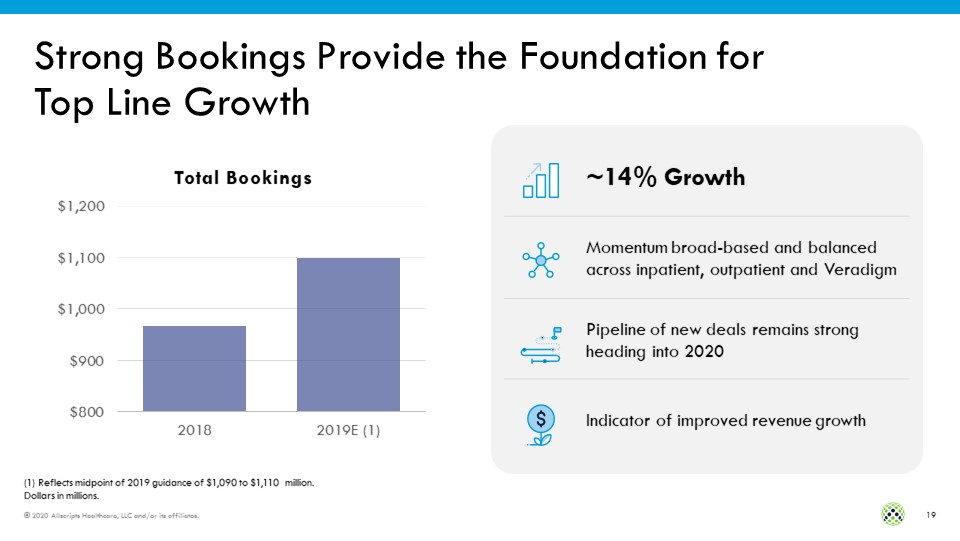
Strong Bookings Provide the Foundation for Top Line Growth (1) Reflects midpoint of 2019 guidance of
$1,090 to $1,110 million.Dollars in millions. ~14% Growth Momentum broad-based and balanced across inpatient, outpatient and Veradigm Pipeline of new deals remains strong heading into 2020 Indicator of improved revenue growth
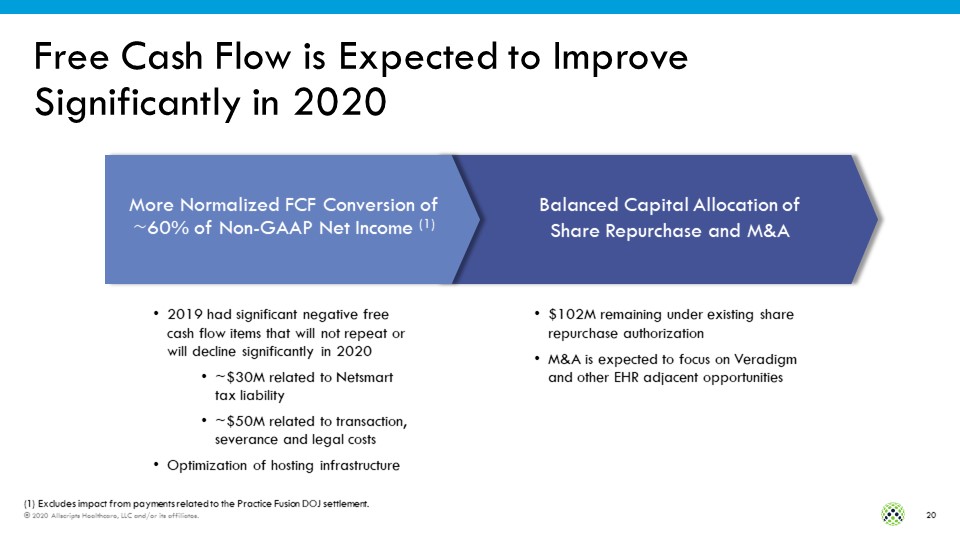
Free Cash Flow is Expected to Improve Significantly in 2020 Balanced Capital Allocation of Share
Repurchase and M&A More Normalized FCF Conversion of ~60% of Non-GAAP Net Income (1) 2019 had significant negative free cash flow items that will not repeat or will decline significantly in 2020~$30M related to Netsmart tax
liability~$50M related to transaction, severance and legal costsOptimization of hosting infrastructure $102M remaining under existing share repurchase authorization M&A is expected to focus on Veradigm and other EHR adjacent
opportunities (1) Excludes impact from payments related to the Practice Fusion DOJ settlement.
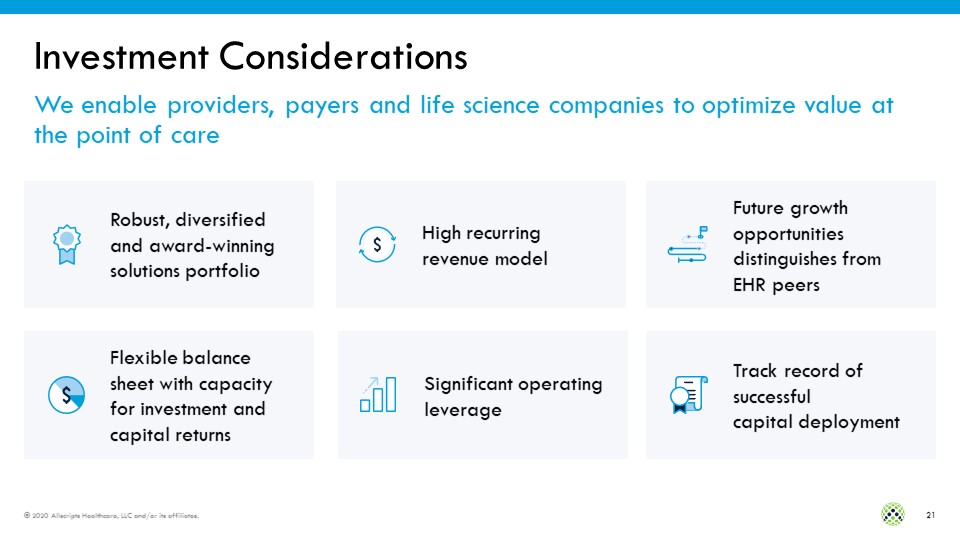
Investment Considerations We enable providers, payers and life science companies to optimize value at
the point of care Robust, diversified and award-winning solutions portfolio Flexible balance sheet with capacity for investment and capital returns High recurring revenue model Track record of successful capital deployment Future growth
opportunities distinguishes from EHR peers Significant operating leverage
Appendix: Non-GAAP Financial Measures
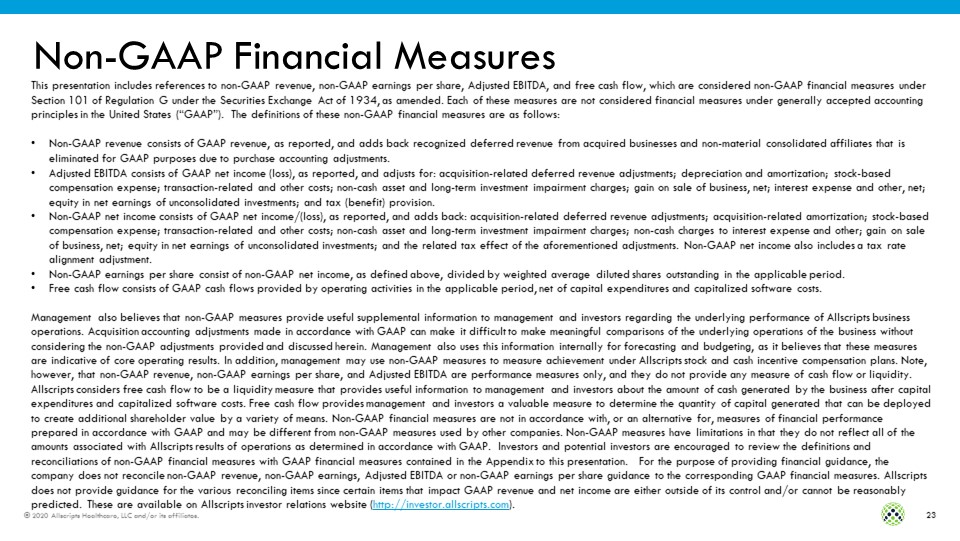
Non-GAAP Financial Measures This presentation includes references to non-GAAP revenue, non-GAAP
earnings per share, Adjusted EBITDA, and free cash flow, which are considered non-GAAP financial measures under Section 101 of Regulation G under the Securities Exchange Act of 1934, as amended. Each of these measures are not considered
financial measures under generally accepted accounting principles in the United States (“GAAP”). The definitions of these non-GAAP financial measures are as follows:Non-GAAP revenue consists of GAAP revenue, as reported, and adds back
recognized deferred revenue from acquired businesses and non-material consolidated affiliates that is eliminated for GAAP purposes due to purchase accounting adjustments.Adjusted EBITDA consists of GAAP net income (loss), as reported, and
adjusts for: acquisition-related deferred revenue adjustments; depreciation and amortization; stock-based compensation expense; transaction-related and other costs; non-cash asset and long-term investment impairment charges; gain on sale of
business, net; interest expense and other, net; equity in net earnings of unconsolidated investments; and tax (benefit) provision.Non-GAAP net income consists of GAAP net income/(loss), as reported, and adds back: acquisition-related deferred
revenue adjustments; acquisition-related amortization; stock-based compensation expense; transaction-related and other costs; non-cash asset and long-term investment impairment charges; non-cash charges to interest expense and other; gain on
sale of business, net; equity in net earnings of unconsolidated investments; and the related tax effect of the aforementioned adjustments. Non-GAAP net income also includes a tax rate alignment adjustment.Non-GAAP earnings per share consist
of non-GAAP net income, as defined above, divided by weighted average diluted shares outstanding in the applicable period.Free cash flow consists of GAAP cash flows provided by operating activities in the applicable period, net of capital
expenditures and capitalized software costs.Management also believes that non-GAAP measures provide useful supplemental information to management and investors regarding the underlying performance of Allscripts business operations.
Acquisition accounting adjustments made in accordance with GAAP can make it difficult to make meaningful comparisons of the underlying operations of the business without considering the non-GAAP adjustments provided and discussed herein.
Management also uses this information internally for forecasting and budgeting, as it believes that these measures are indicative of core operating results. In addition, management may use non-GAAP measures to measure achievement under
Allscripts stock and cash incentive compensation plans. Note, however, that non-GAAP revenue, non-GAAP earnings per share, and Adjusted EBITDA are performance measures only, and they do not provide any measure of cash flow or liquidity.
Allscripts considers free cash flow to be a liquidity measure that provides useful information to management and investors about the amount of cash generated by the business after capital expenditures and capitalized software costs. Free cash
flow provides management and investors a valuable measure to determine the quantity of capital generated that can be deployed to create additional shareholder value by a variety of means. Non-GAAP financial measures are not in accordance
with, or an alternative for, measures of financial performance prepared in accordance with GAAP and may be different from non-GAAP measures used by other companies. Non-GAAP measures have limitations in that they do not reflect all of the
amounts associated with Allscripts results of operations as determined in accordance with GAAP. Investors and potential investors are encouraged to review the definitions and reconciliations of non-GAAP financial measures with GAAP financial
measures contained in the Appendix to this presentation. For the purpose of providing financial guidance, the company does not reconcile non-GAAP revenue, non-GAAP earnings, Adjusted EBITDA or non-GAAP earnings per share guidance to the
corresponding GAAP financial measures. Allscripts does not provide guidance for the various reconciling items since certain items that impact GAAP revenue and net income are either outside of its control and/or cannot be reasonably predicted.
These are available on Allscripts investor relations website (http://investor.allscripts.com).