Attached files
| file | filename |
|---|---|
| 8-K - 8-K - MOLINA HEALTHCARE, INC. | moh8kjpmorganhealthcon.htm |

Molina Healthcare, Inc. JP Morgan Healthcare Conference Joe Zubretsky, President and Chief Executive Officer JANUARY 13, 2020

Cautionary Statement Safe Harbor Statement under the Private Securities Litigation Reform Act of 1995 This presentation and the accompanying oral remarks include forward-looking statements regarding, without limitation, the Company’s capital position, planning, and deployment; our growth plans and prospects; future procurement opportunities; and our financial outlook. The Company intends such forward-looking statements to be covered by the safe harbor provisions for forward-looking statements contained in the Private Securities Litigation Reform Act of 1995. The Company cannot guarantee that it will actually achieve the plans, outlook, or expectations disclosed in its forward-looking statements and, accordingly, you should not place undue reliance on the Company’s forward-looking statements. Those risks and uncertainties are discussed under Item 1A in the section entitled “Risk Factors” in the Company’s Annual Report on Form 10-K and also in the Company’s quarterly reports and other reports and filings with the Securities and Exchange Commission, or SEC. These reports can be accessed under the investor relations tab of the Company’s website or on the SEC’s website at www.sec.gov. Given these risks and uncertainties, the Company can give no assurances that its forward-looking statements will prove to be accurate, or that the results or events projected or contemplated by its forward-looking statements will in fact occur. All forward-looking statements in this presentation represent management’s judgment as of January 13, 2020, and, except as otherwise required by law, the Company disclaims any obligation to update any forward-looking statements to conform the statement to actual results or changes in its expectations. 2
Today’s Agenda Today’s presentation will focus on: 1 Capital Position 2 Capital Deployment 3 Financial Outlook 3

Capital Position 4
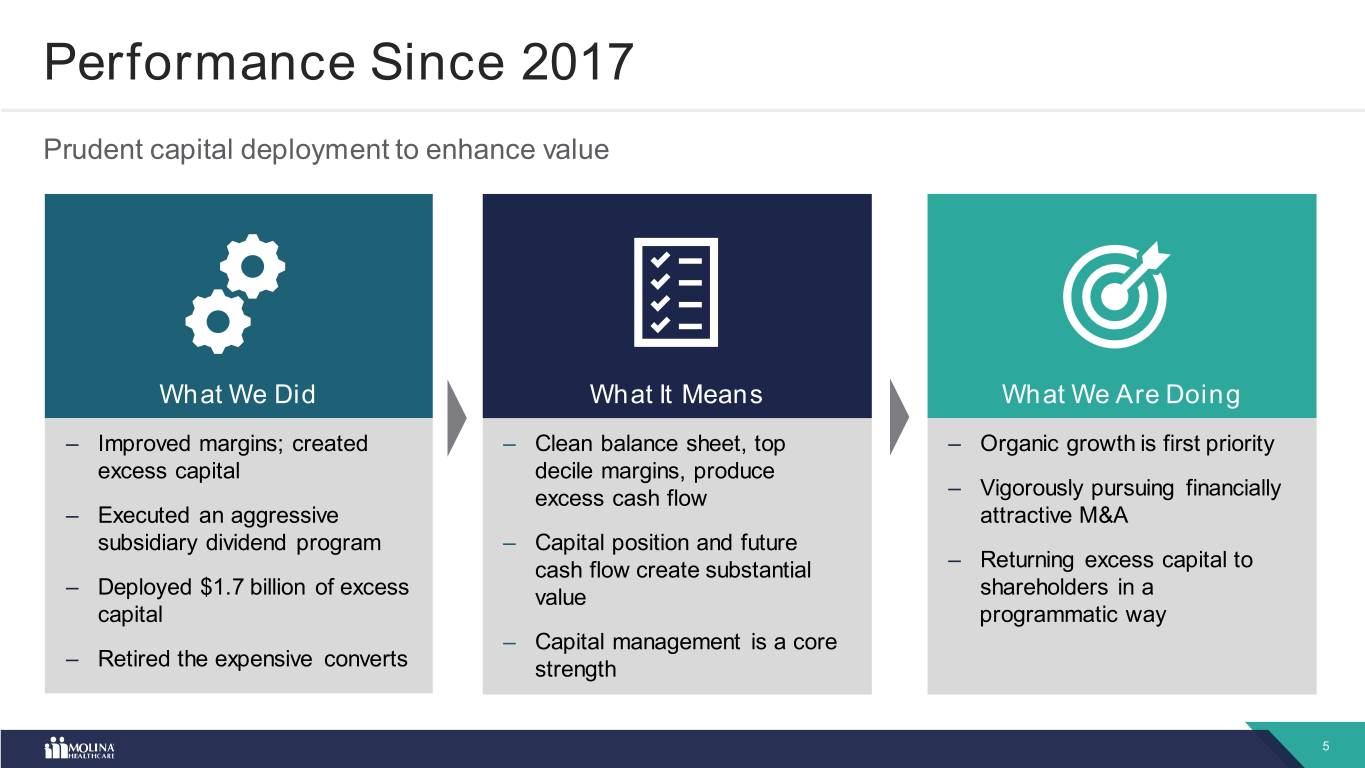
Performance Since 2017 Prudent capital deployment to enhance value What We Did What It Means What We Are Doing – Improved margins; created – Clean balance sheet, top – Organic growth is first priority excess capital decile margins, produce excess cash flow – Vigorously pursuing financially – Executed an aggressive attractive M&A subsidiary dividend program – Capital position and future cash flow create substantial – Returning excess capital to – Deployed $1.7 billion of excess value shareholders in a capital programmatic way – Capital management is a core – Retired the expensive converts strength 5
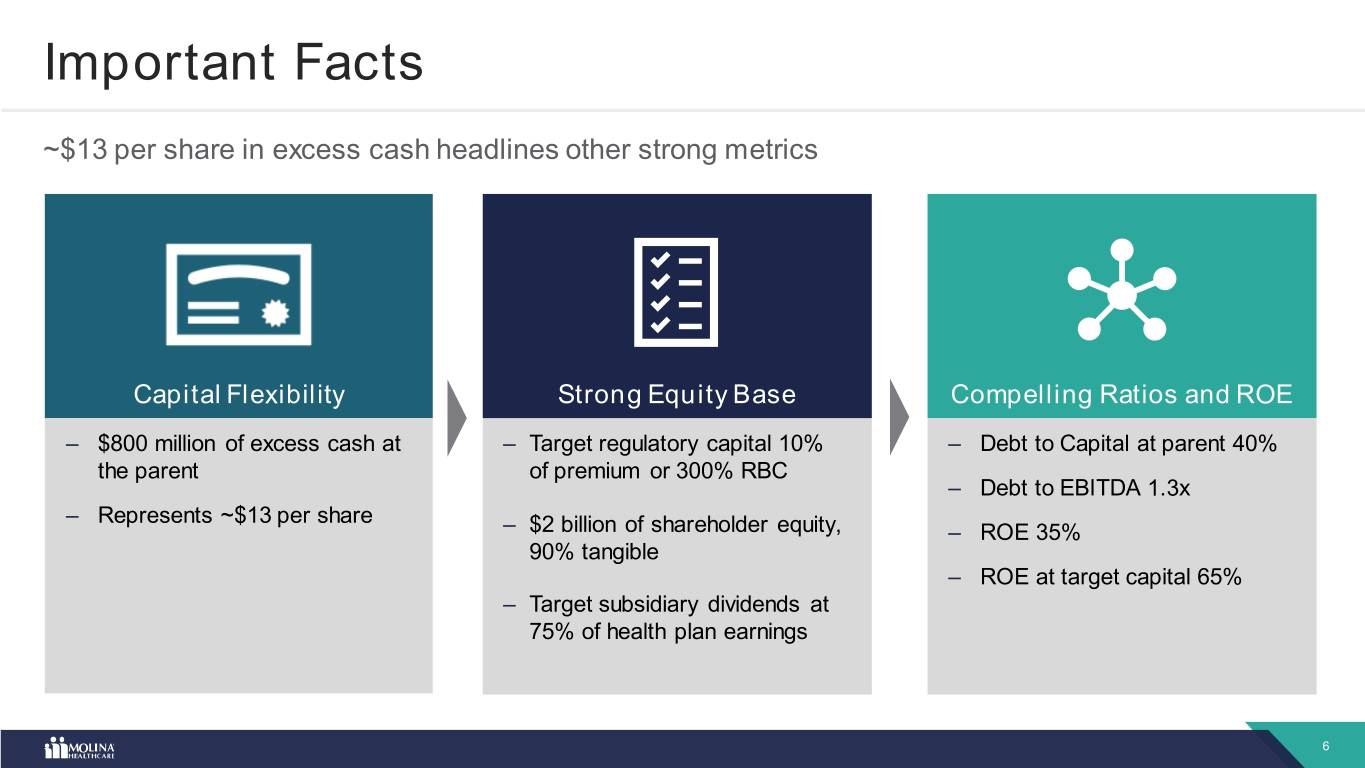
Important Facts ~$13 per share in excess cash headlines other strong metrics Capital Flexibility Strong Equity Base Compelling Ratios and ROE – $800 million of excess cash at – Target regulatory capital 10% – Debt to Capital at parent 40% the parent of premium or 300% RBC – Debt to EBITDA 1.3x – Represents ~$13 per share – $2 billion of shareholder equity, – ROE 35% 90% tangible – ROE at target capital 65% – Target subsidiary dividends at 75% of health plan earnings 6

Capital Deployment 7
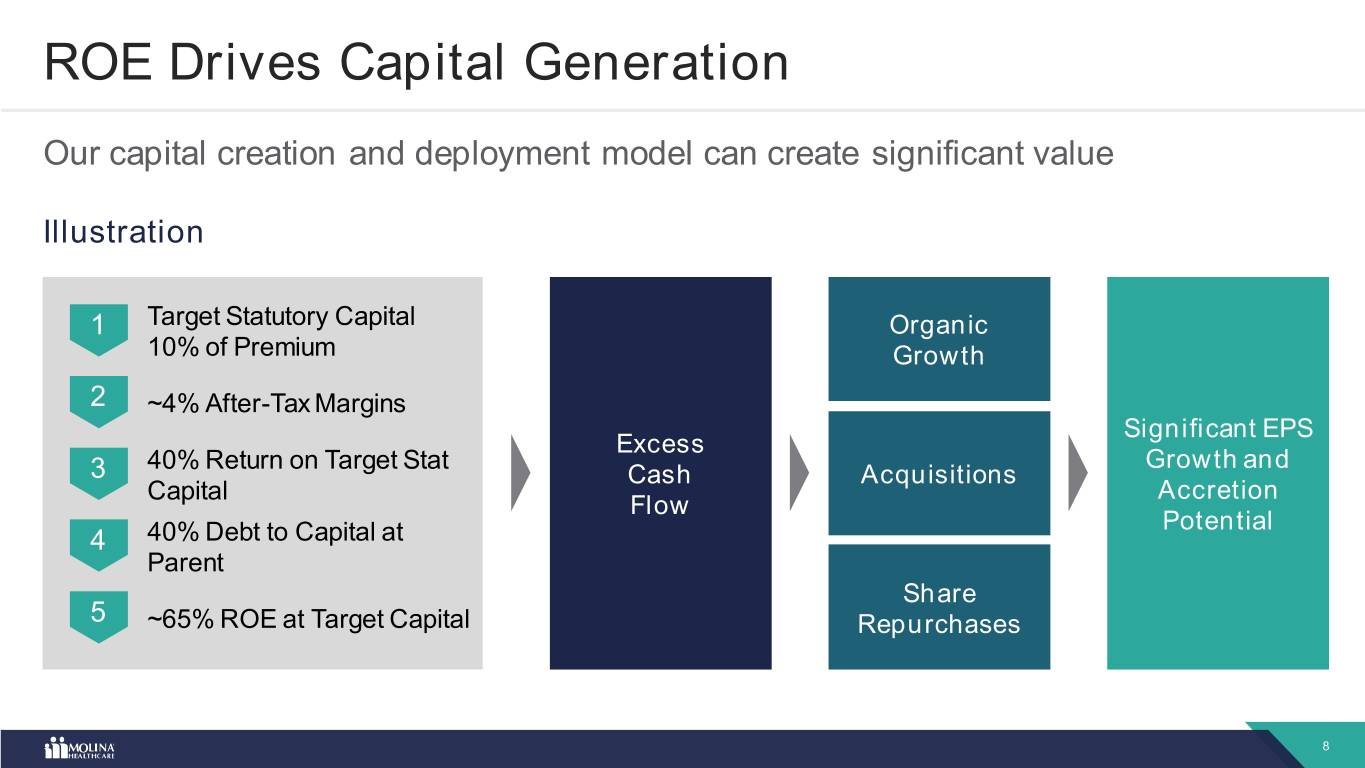
ROE Drives Capital Generation Our capital creation and deployment model can create significant value Illustration 1 Target Statutory Capital Organic 10% of Premium Growth 2 ~4% After-Tax Margins Significant EPS Excess 40% Return on Target Stat Growth and 3 Cash Acquisitions Capital Accretion Flow Potential 4 40% Debt to Capital at Parent Share 5 ~65% ROE at Target Capital Repurchases 8
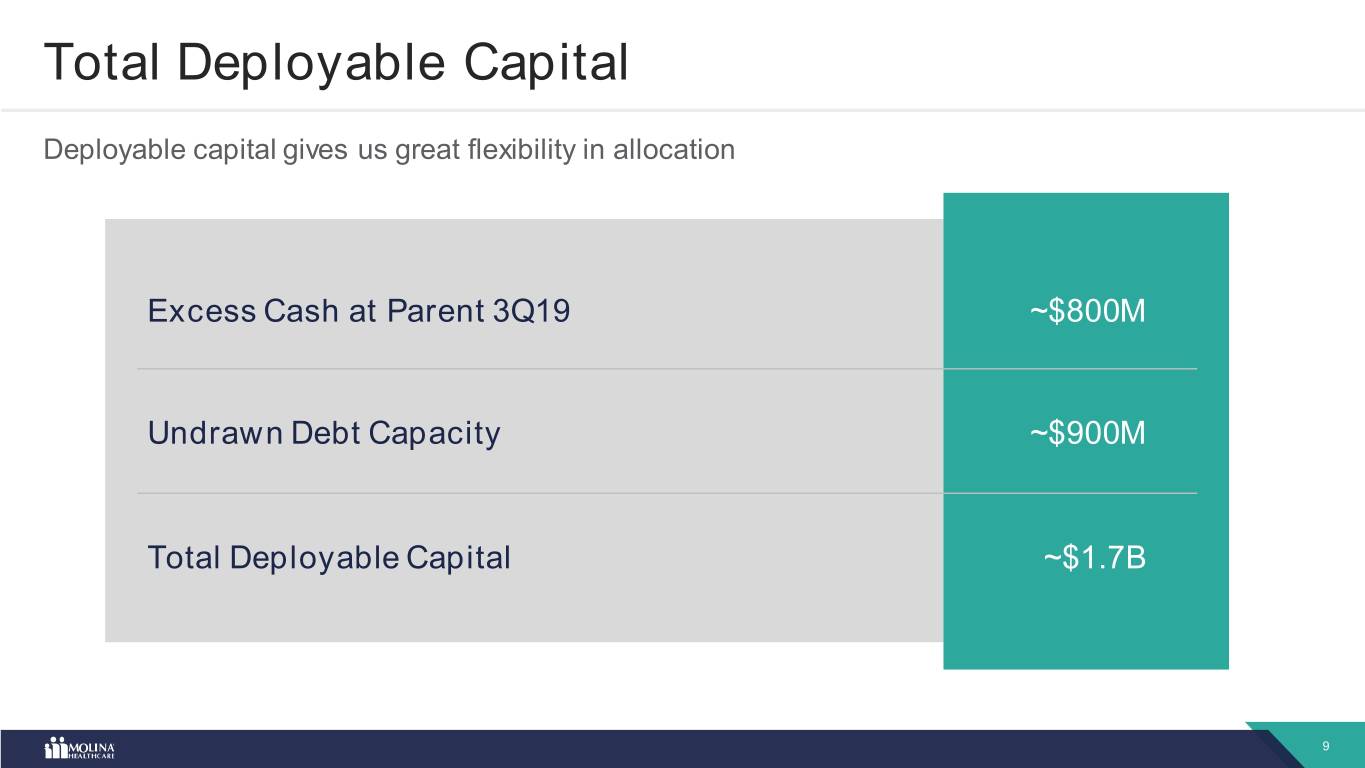
Total Deployable Capital Deployable capital gives us great flexibility in allocation Excess Cash at Parent 3Q19 ~$800M Undrawn Debt Capacity ~$900M Total Deployable Capital ~$1.7B 9
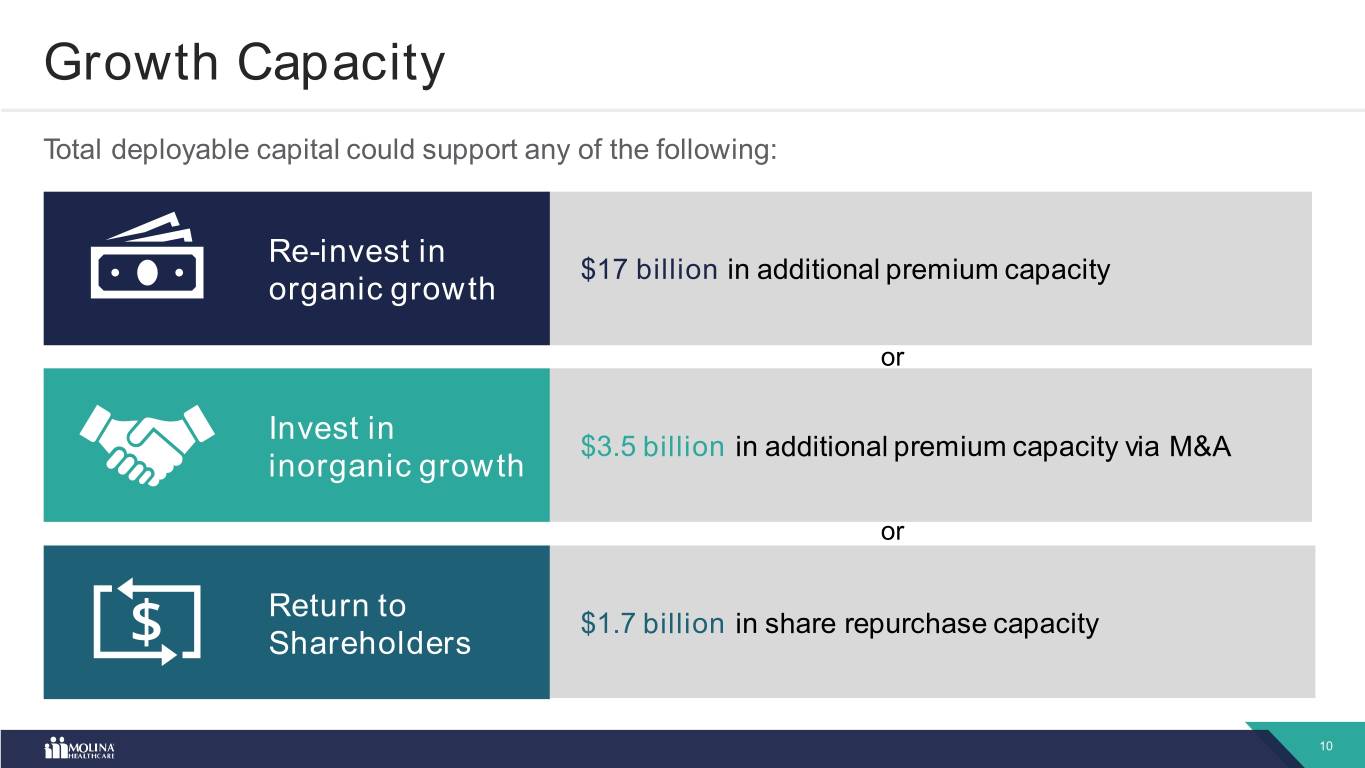
Growth Capacity Total deployable capital could support any of the following: Re-invest in $17 billion in additional premium capacity organic growth or Invest in $3.5 billion in additional premium capacity via M&A inorganic growth or Return to $1.7 billion in share repurchase capacity Shareholders 10
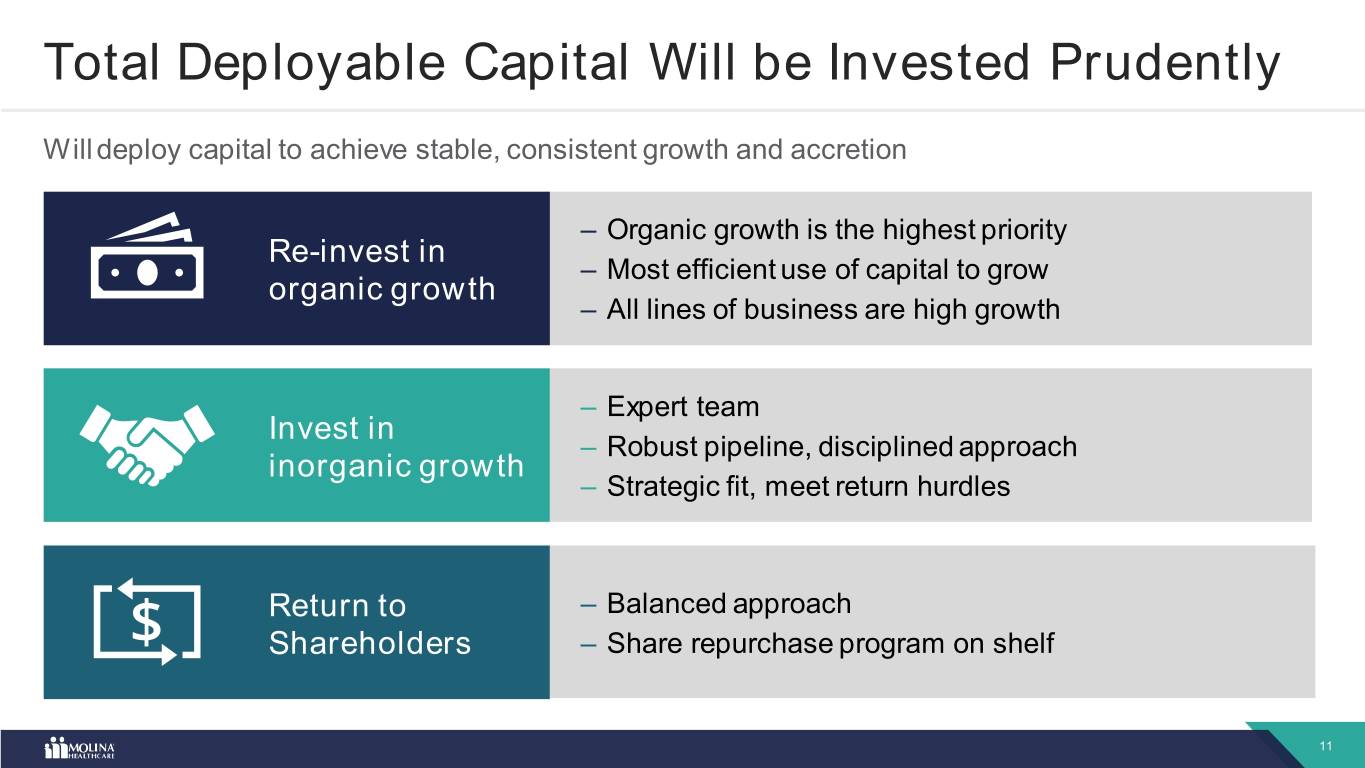
Total Deployable Capital Will be Invested Prudently Will deploy capital to achieve stable, consistent growth and accretion – Organic growth is the highest priority Re-invest in – Most efficient use of capital to grow organic growth – All lines of business are high growth – Expert team Invest in – Robust pipeline, disciplined approach inorganic growth – Strategic fit, meet return hurdles Return to – Balanced approach Shareholders – Share repurchase program on shelf 11
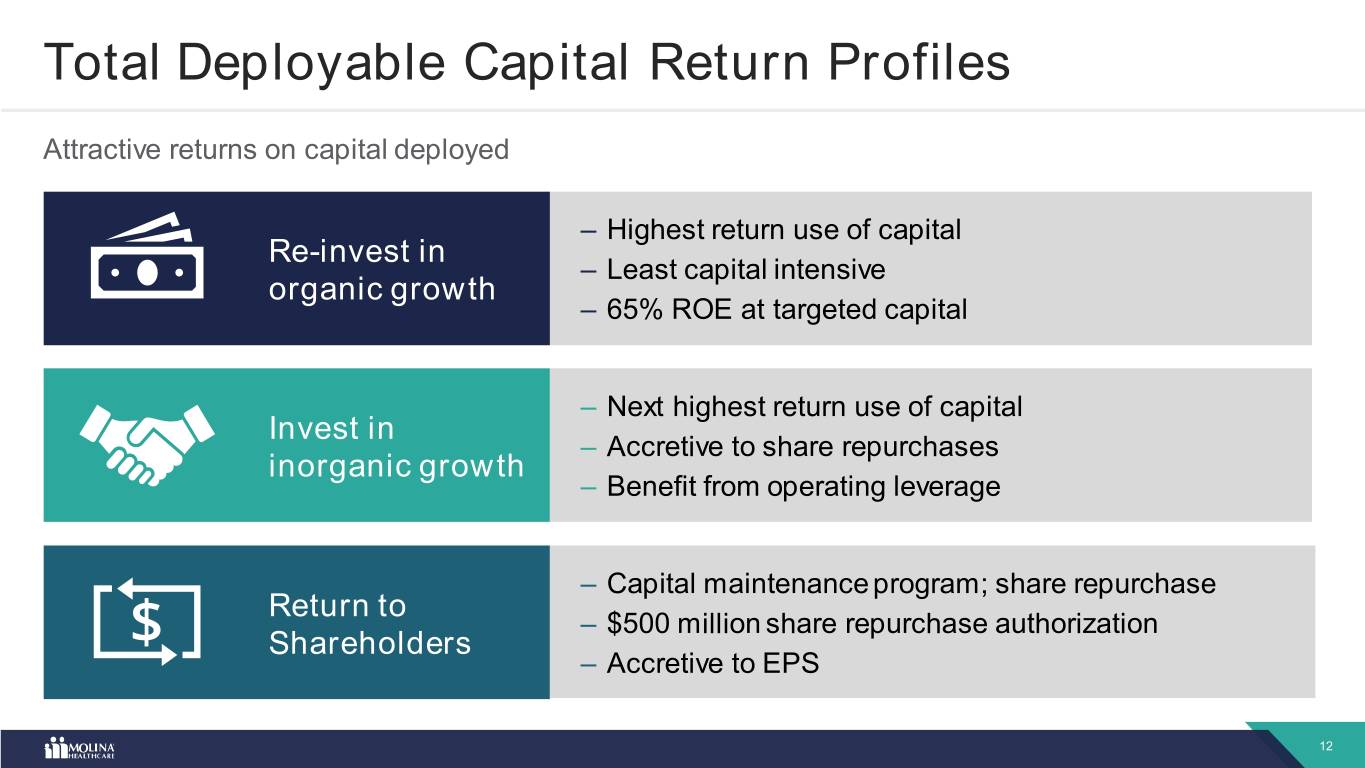
Total Deployable Capital Return Profiles Attractive returns on capital deployed – Highest return use of capital Re-invest in – Least capital intensive organic growth – 65% ROE at targeted capital – Next highest return use of capital Invest in – Accretive to share repurchases inorganic growth – Benefit from operating leverage – Capital maintenance program; share repurchase Return to – $500 million share repurchase authorization Shareholders – Accretive to EPS 12
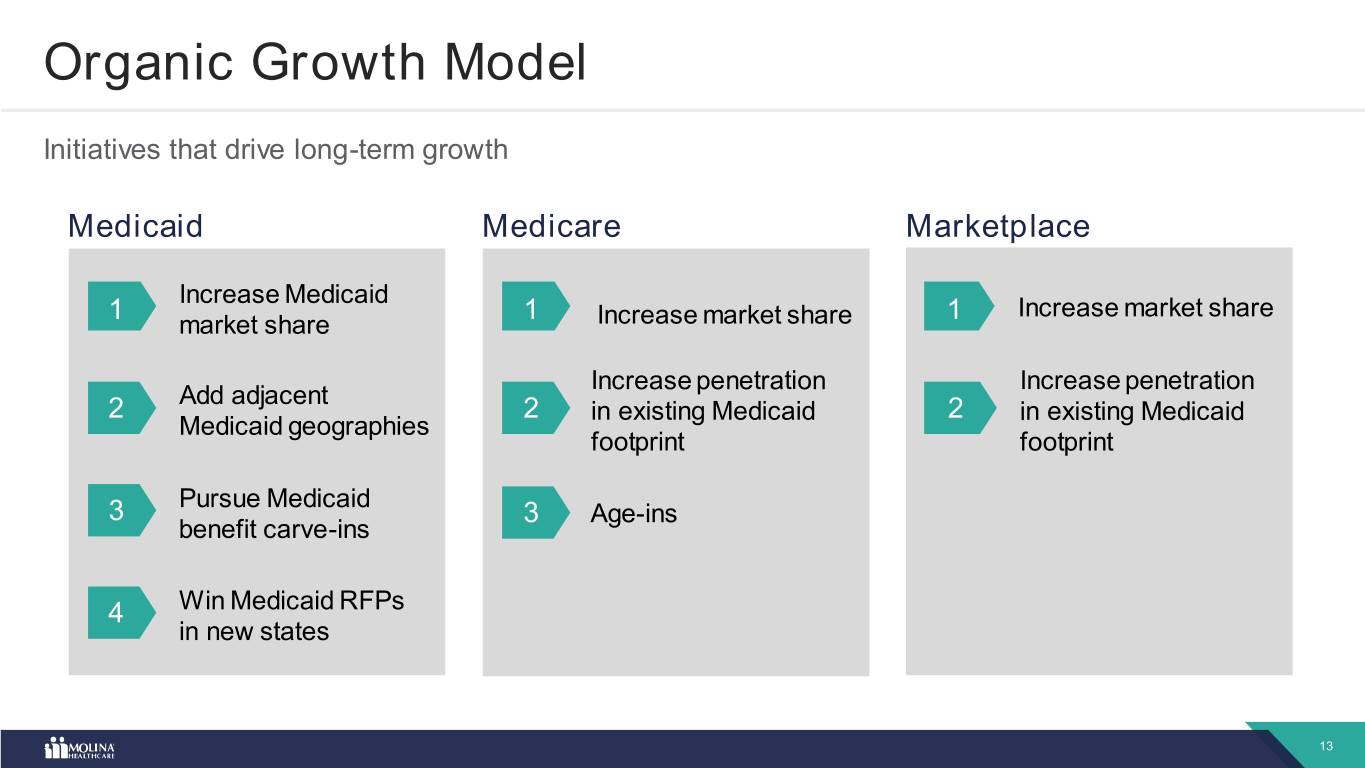
Organic Growth Model Initiatives that drive long-term growth Medicaid Medicare Marketplace Increase Medicaid 1 1 1 Increase market share market share Increase market share Increase penetration Increase penetration Add adjacent 2 2 in existing Medicaid 2 in existing Medicaid Medicaid geographies footprint footprint Pursue Medicaid 3 3 Age-ins benefit carve-ins 4 Win Medicaid RFPs in new states 13
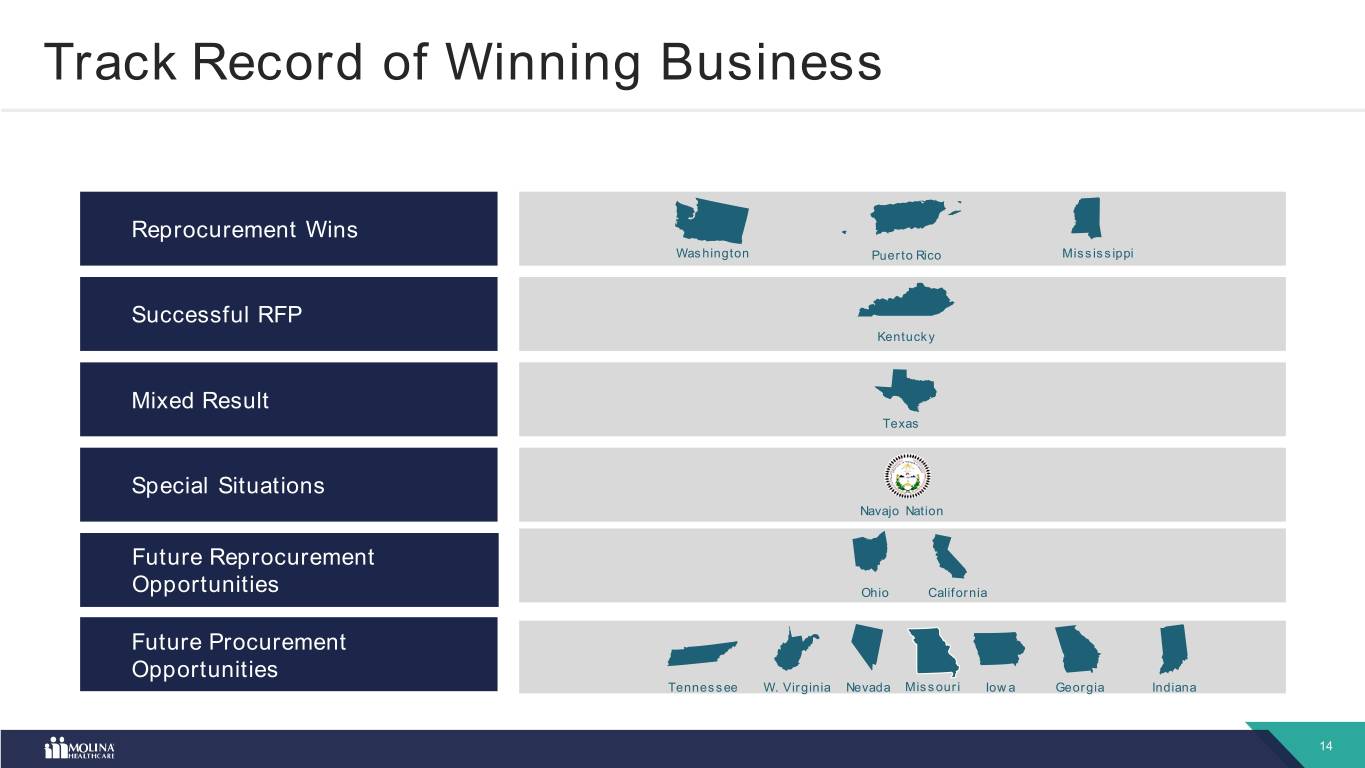
Track Record of Winning Business Reprocurement Wins Washington Puerto Rico Mississippi Successful RFP Kentucky Mixed Result Texas Special Situations Navajo Nation Texas Future Reprocurement Opportunities Ohio California Future Procurement Opportunities Tennessee W. Virginia Nevada Missouri Iowa Georgia Indiana 14
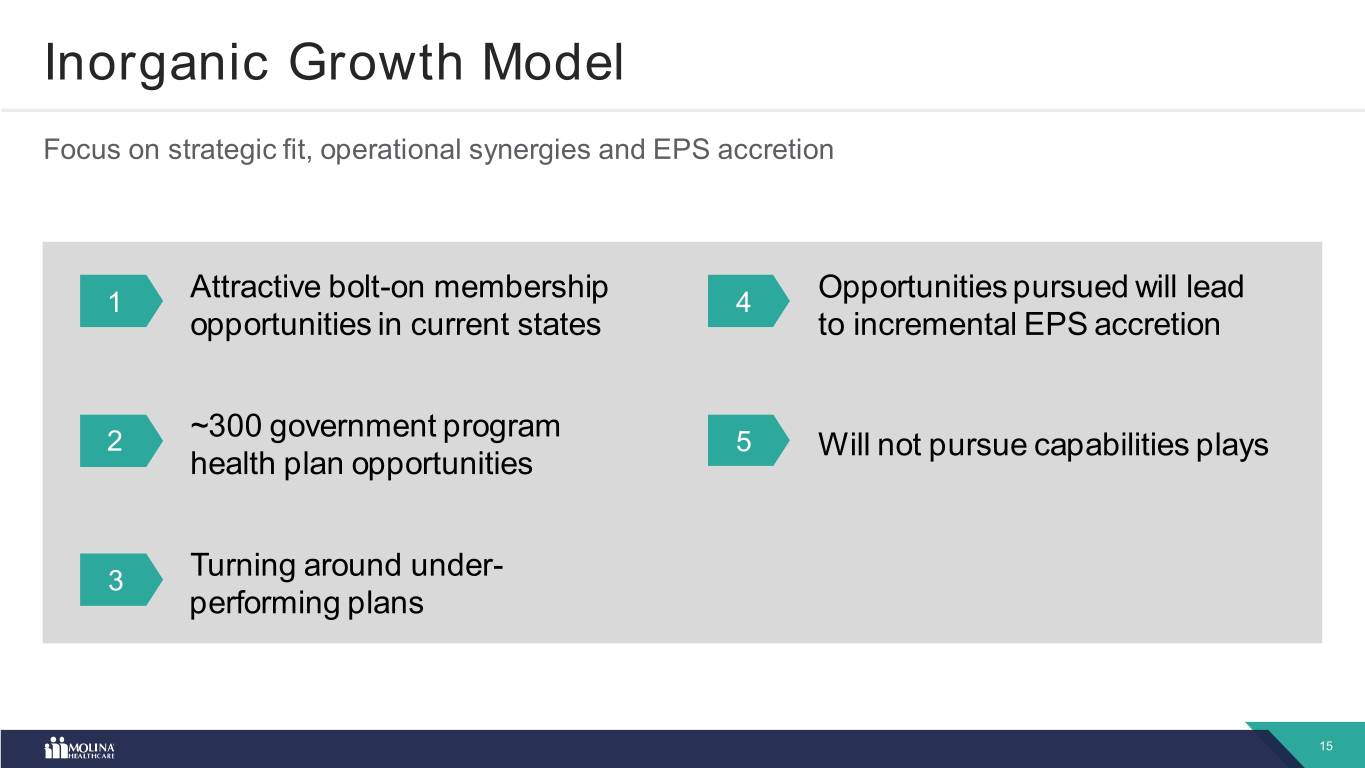
Inorganic Growth Model Focus on strategic fit, operational synergies and EPS accretion 1 Attractive bolt-on membership 4 Opportunities pursued will lead opportunities in current states to incremental EPS accretion ~300 government program 2 5 Will not pursue capabilities plays health plan opportunities 3 Turning around under- performing plans 15
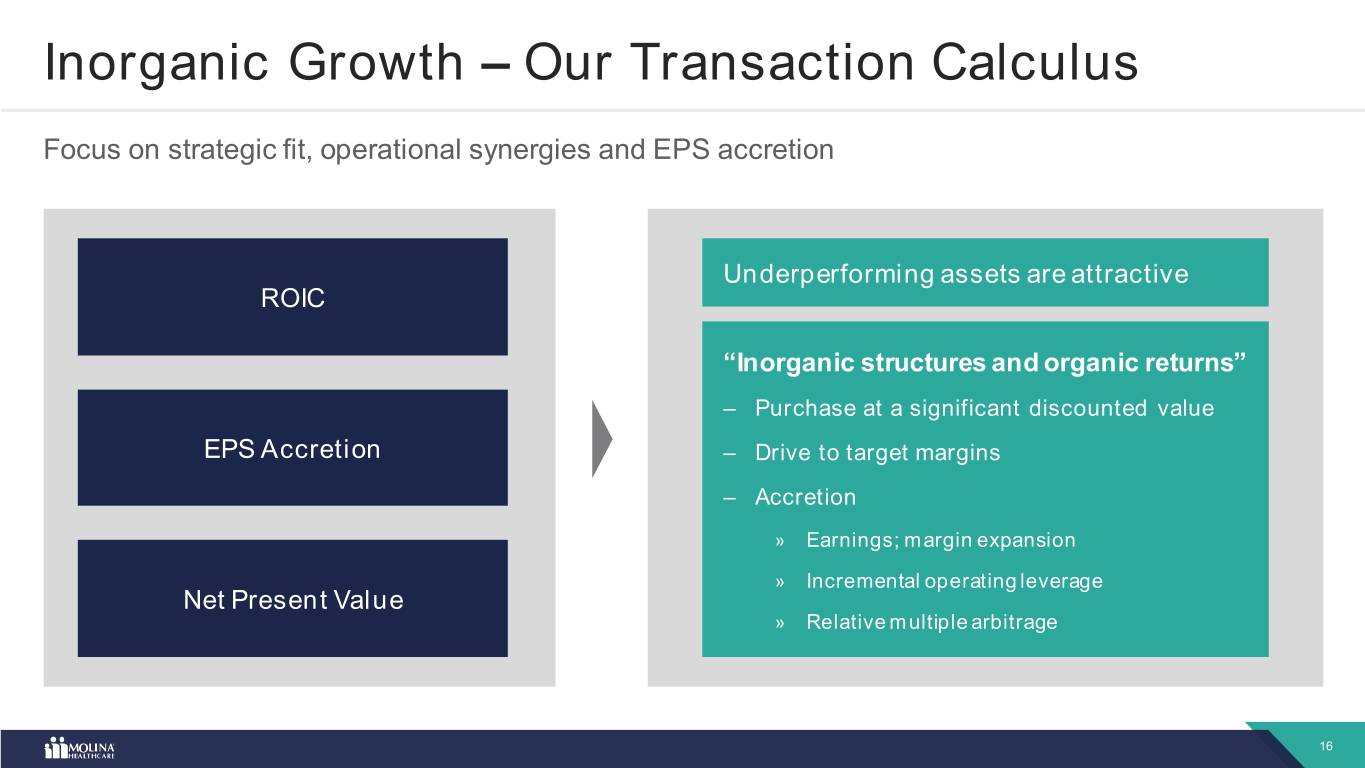
Inorganic Growth – Our Transaction Calculus Focus on strategic fit, operational synergies and EPS accretion Underperforming assets are attractive ROIC “Inorganic structures and organic returns” – Purchase at a significant discounted value EPS Accretion – Drive to target margins – Accretion » Earnings; margin expansion » Incremental operating leverage Net Present Value » Relative multiple arbitrage 16

Financial Outlook 17
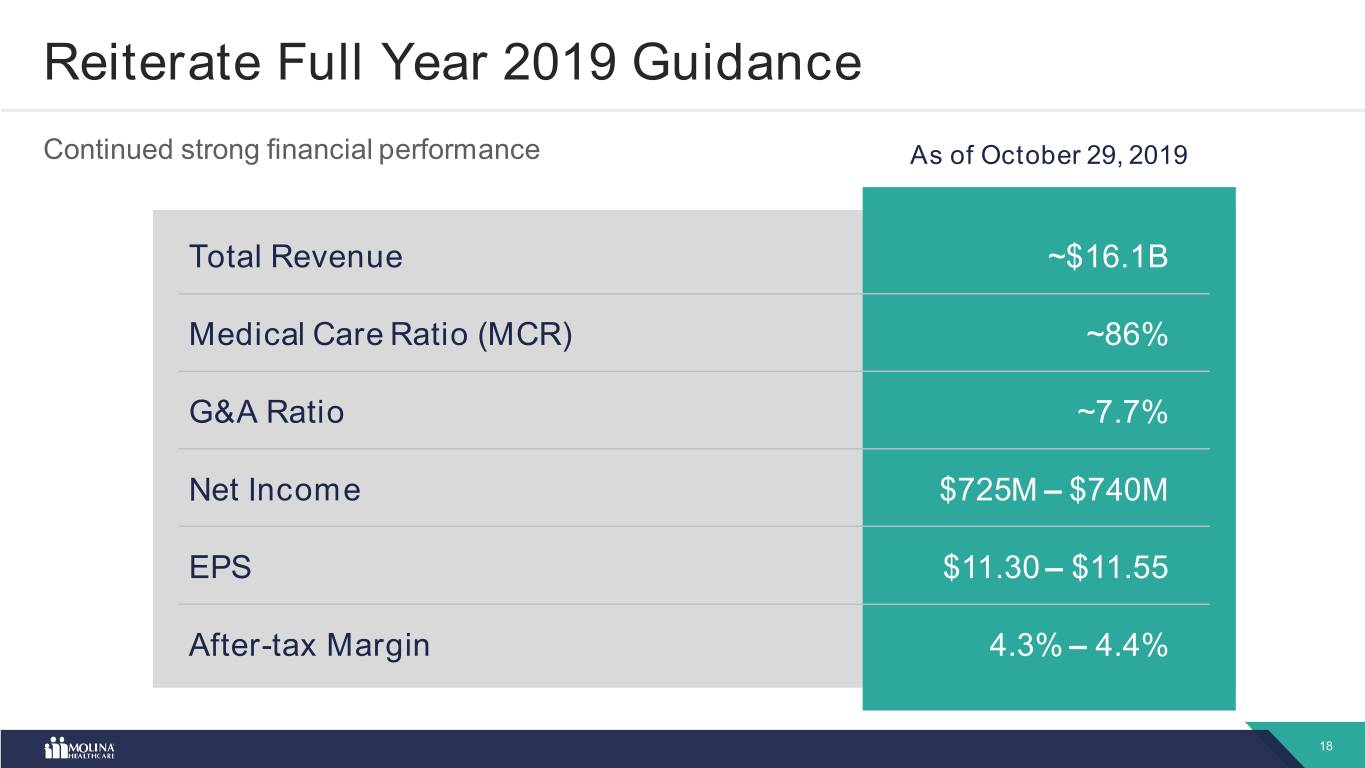
Reiterate Full Year 2019 Guidance Continued strong financial performance As of October 29, 2019 Total Revenue ~$16.1B Medical Care Ratio (MCR) ~86% G&A Ratio ~7.7% Net Income $725M – $740M EPS $11.30 – $11.55 After-tax Margin 4.3% – 4.4% 18
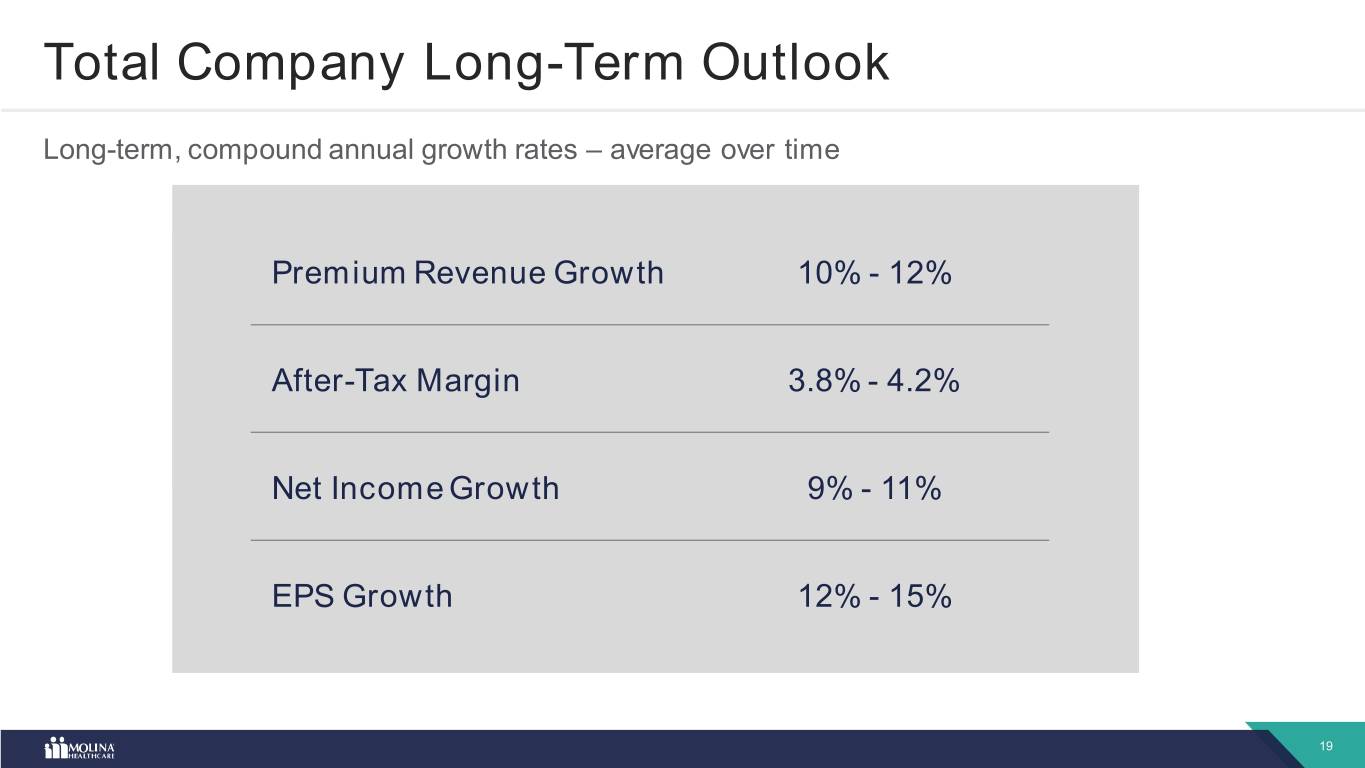
Total Company Long-Term Outlook Long-term, compound annual growth rates – average over time Premium Revenue Growth 10% - 12% After-Tax Margin 3.8% - 4.2% Net Income Growth 9% - 11% EPS Growth 12% - 15% 19
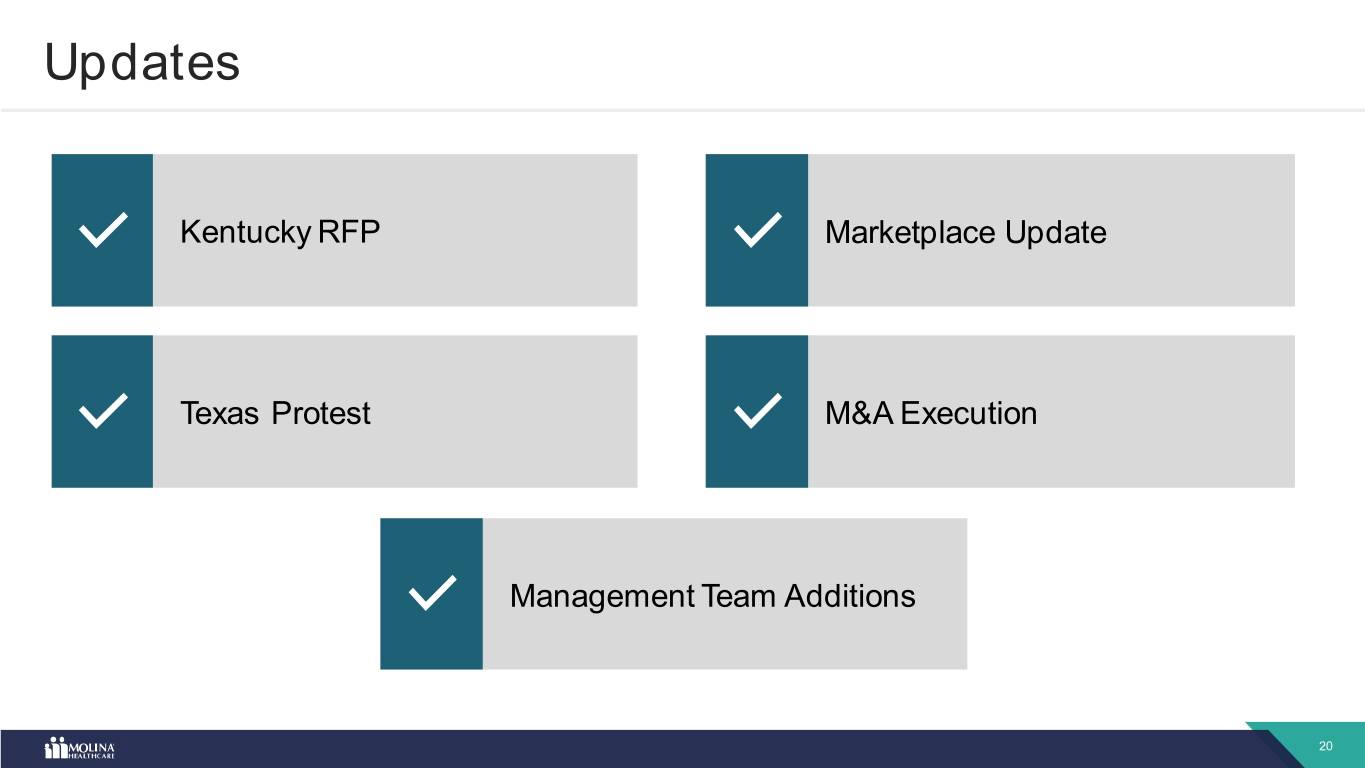
Updates Kentucky RFP Marketplace Update Texas Protest M&A Execution Management Team Additions 20

Thank You for Your Interest in Molina 21

Reconciliation of Non-GAAP Financial Measures 22
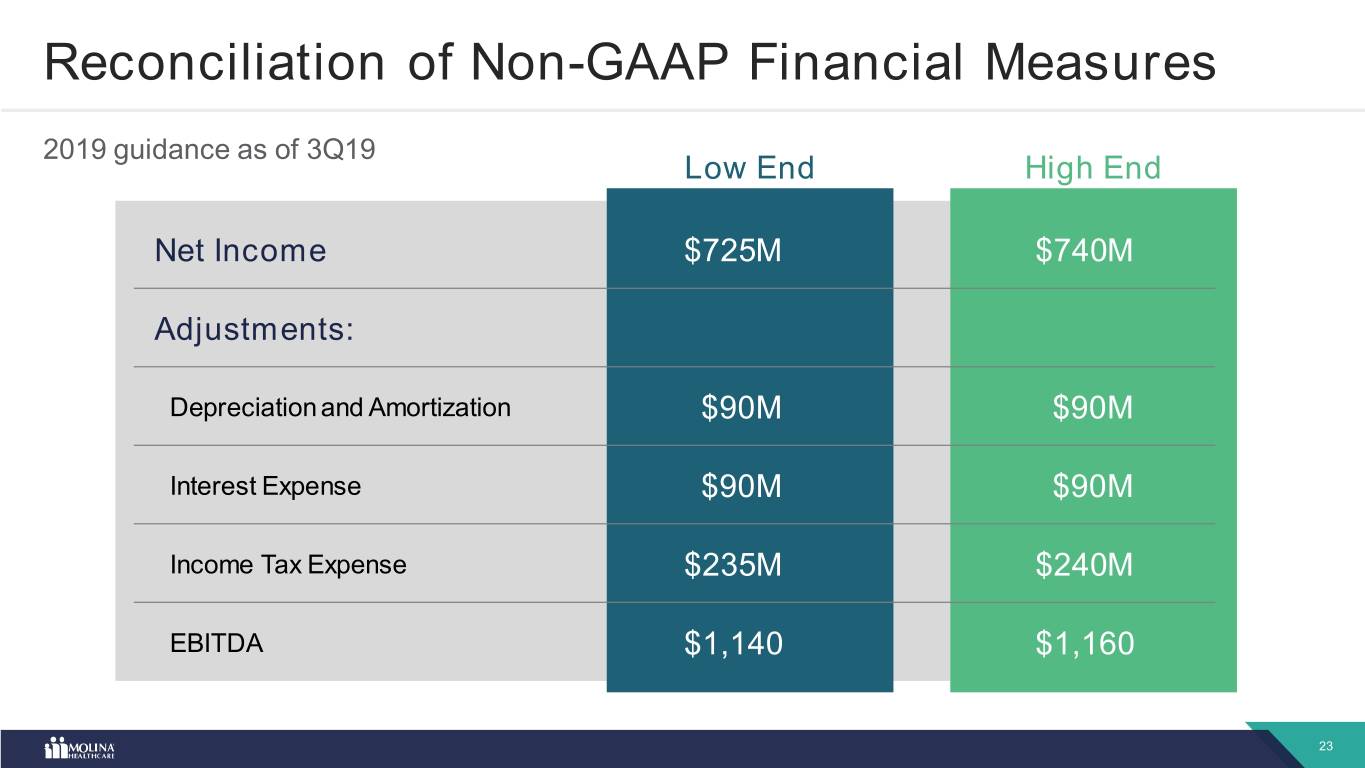
Reconciliation of Non-GAAP Financial Measures 2019 guidance as of 3Q19 Low End High End Net Income $725M $740M Adjustments: Depreciation and Amortization $90M $90M Interest Expense $90M $90M Income Tax Expense $235M $240M EBITDA $1,140 $1,160 23
