Attached files
| file | filename |
|---|---|
| 8-K - FORM 8-K - MEDIFAST INC | tm203250d1_8k.htm |
Exhibit 99.1
January 2020 INVESTOR PRESENTATION

Safe Harbor Statement Certain information included in this presentation may constitute “forward - looking statements” within the meaning of Section 27A of the Securities Act of 1933, as amended, Section 21E of the Securities Exchange Act of 1934, as amended, and the Private Securities Litigation Reform Act of 1995. These forward - looking statements generally can be identified by use of phrases or terminology such as "intend" or other similar words or the negative of such terminology. Similarly, descriptions o f Medifast's objectives, strategies, plans, goals or targets contained herein are also considered forward - looking statements. Medifast believes this presentation should be read in conjunction with all of its filings with the United States Securities a nd Exchange Commission and cautions its readers that these forward - looking statements are subject to certain events, risks, uncertainties, and other factors. Some of these factors include, among others, Medifast's inability to attract and retain independent OPTA VIA Coaches TM and Members, stability in the pricing of print, TV and Direct Mail marketing initiatives affecting the cost to acquire customers, increases in competition, litigation, regulatory changes, and its planned growth int o new domestic and international markets and new channels of distribution. Although Medifast believes that the expectations, statements, and assumptions reflected in these forward - looking statements are reasonable, it cautions readers to always consider all of the risk factors and any other cautionary statements carefully in evaluating each forward - looking statement in this presentation, as well as those set forth in its latest Annual Report on Form 10 - K, and other filings filed with the United States Securities and Exchange Commission, including its current reports on Form 8 - K. All of the forward - looking statements contained herein speak only as of the date of this presentation. 2
3 AGENDA OPTA VIA Transition And Performance Highlights 2 Our Plan For Growth 3 Medifast At A Glance 1

MEDIFAST AT A GLANCE 4

• The company behind one of the fastest - growing health and wellness communities, OPTA VIA • Differentiated direct - to - consumer sales model: – Network of 32,200 Coaches , most of whom initially started as clients – 100% of products are directly shipped to clients for consumption, never for re - sale • Leaders in offering personal Coaching service to individuals who are disillusioned with dieting • Offer subscription - based meal plans which help to create healthier eating habits – 85% of orders are subscription based • Scientifically backed with 40 years of proven history delivering consistent results ( over 16 peer reviewed articles in past 10 years) 5 Medifast At A Glance Who We Are

• We empower passionate and engaged communities of people committed to healthier lifestyles • Our network of talented and committed Coaches provide clients with the encouragement and inspiration they need to drive change • Everything we do is aimed at helping the world achieve Lifelong Transformation One Healthy Habit at a Time 6 Medifast At A Glance (Cont’d) What We Do

7 OPTA VIA DIRECT - TO - CONSUMER MODEL TRADITIONAL DIRECT SELLER Health and wellness community Selling network Clients and certified Coaches Distributors/sales agents and wholesale buyers Client s ervice and community building Recruiting and transactions Long - term sustainable growth Short - term unsustainable growth Holistic health and wellness programs Selling products Lifestyle transformation - focused Diet - focused Coaches do not buy inventory, or handle transactions Agents hold inventory and manage cash A New and Unique Direct - To - Consumer M odel
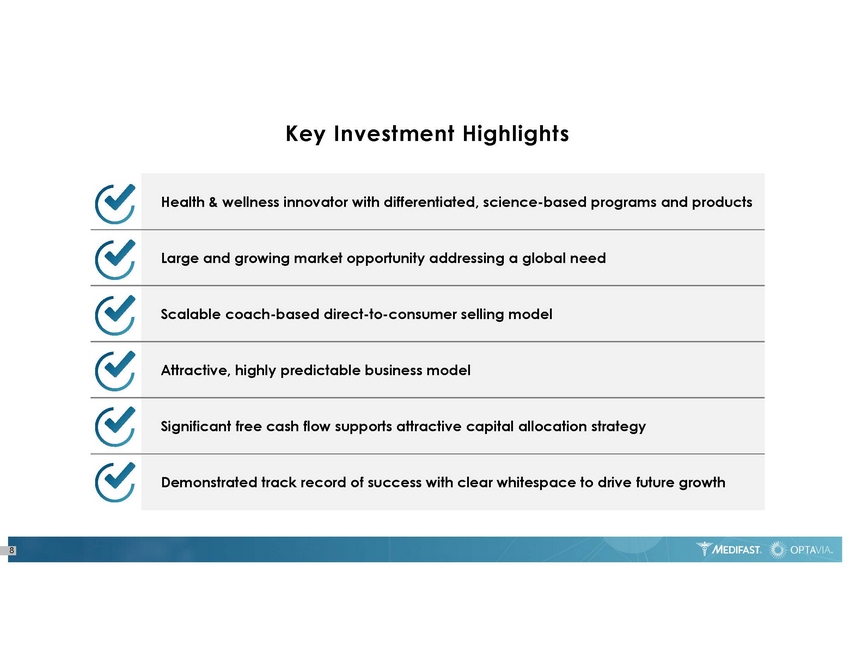
Health & wellness innovator with differentiated, science - based programs and products Large and growing market opportunity addressing a global need Scalable coach - based direct - to - consumer selling model Attractive, highly predictable business model Significant free cash flow supports attractive capital allocation strategy Demonstrated track record of success with clear whitespace to drive future growth Key Investment Highlights 8

9 Key Financial Metrics LTM Q3 2019 Operating Income $ 92 mm LTM Q3 2019 Revenue $ 689 mm 2017 – LTM Q3 2019 Operating Income CAGR 62 % 2017 – LTM Q3 2019 Revenue CAGR 60 %

10 Attractive Variable Cost Model LTM Q3 2019 CapEx as % of Revenue ~2 % SG&A is Variable ~ 70 % LTM Q3 2019 FCF Conversion 2 93 % LTM Q3 2019 Free Cash Flow 1 $ 75 mm 1 Free Cash Flow defined as c ash f low from operations – cash f low from i nvesting 2 Free Cash Flow conversion calculated as (cash flow f rom operations – c ash flow f rom i nvesting) / cash flow from o perations 3 Represents sum of shares repurchased and dividends paid over the last twelve months LTM Q3 2019 Return to Shareholders 3 $ 76 mm
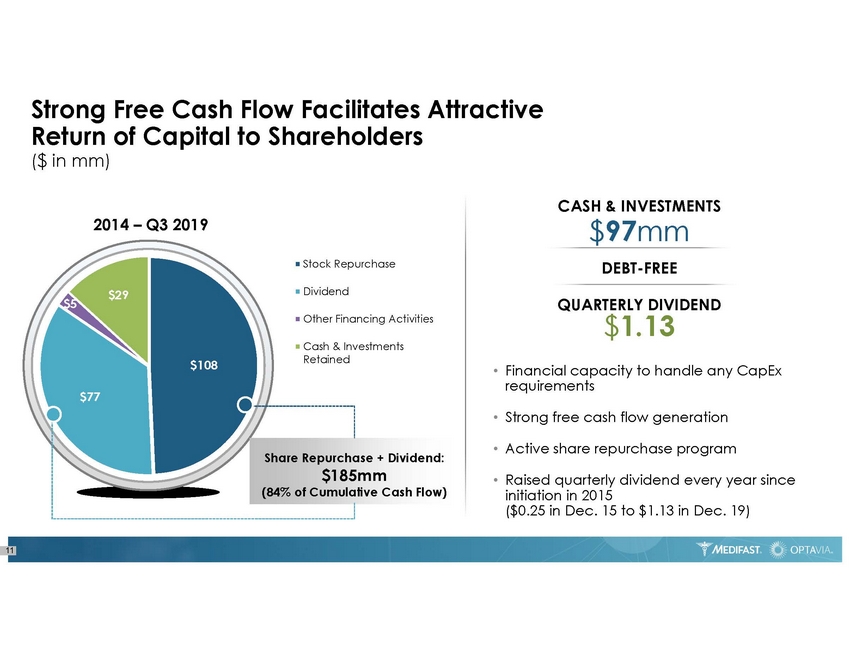
2014 – Q3 2019 $ 108 $ 77 $ 5 $ 29 Stock Repurchase Dividend Other Financing Activities Cash & Investments Retained 11 ($ in mm) Strong Free Cash Flow Facilitates Attractive Return of Capital to Shareholders Share Repurchase + Dividend: $185mm (84% of Cumulative Cash Flow) QUARTERLY DIVIDEND $ 1.13 DEBT - FREE CASH & INVESTMENTS $ 97 mm • Financial capacity to handle any CapEx requirements • Strong free cash flow generation • Active share repurchase program • Raised quarterly dividend every year since initiation in 2015 ($ 0.25 in Dec. 15 to $1.13 in Dec. 19)
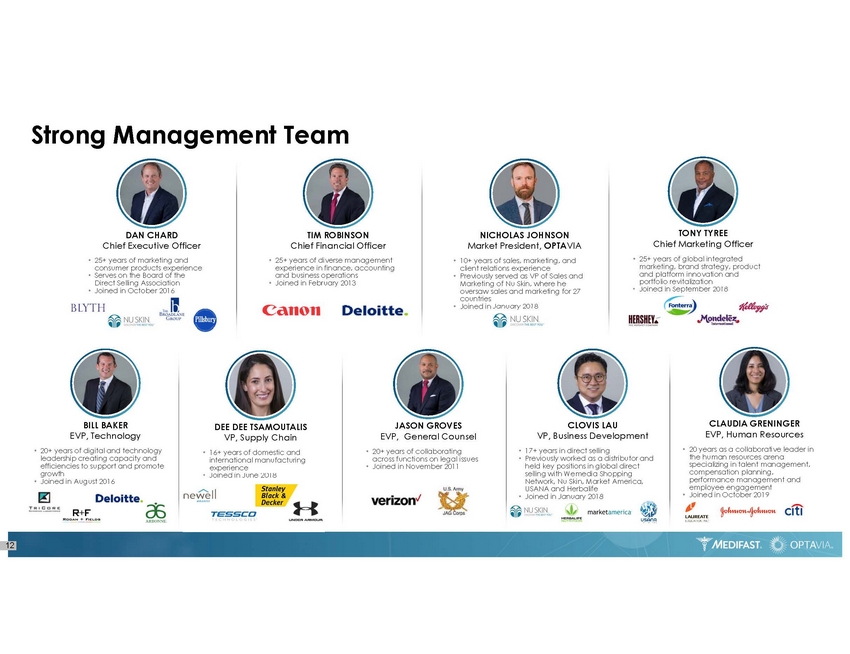
12 Strong Management Team
OPTA VIA TRANSITION AND PERFORMANCE HIGHLIGHTS 13

14 The OPTA VIA Model People are More Successful in their Transformation Journey when they... • Have a Support System (Coach and Community) • Learn and incorporate Healthy Habits into Their Lives (Habits of Health System ) 1 2 PROVEN NUTRITION g ets you where you want to go. OPTA VIA COACHES TM Consumer/ Client BECOMES ACTIVATES ACTIVATES BECOMES Active Earning Coach Minimal marketing costs Enables premium pricing Fits gig economy Creates sticky relationship Consumer/ Client Virtuous Circle for Growth 2x Higher Lifetime Value of Clients when Supported by Coaches Active Earning Coach

15 Our Strategy WHERE TO PLAY GROWTH AREAS Technology Our scalable business model to offer the world optimal health by combining clinically proven plans with scientifically developed products and the encouragement, inspiration and support of Coaches Program Innovation Enhanced Experience Operational Effectiveness Expansion

16 Strong and Sustainable Customer Loyalty Client spend on OPTA VIA products vs CPG benchmarks * ≈ 20 x OPTA VIA repeat rates vs industry benchmark * 2 x Customer retention rates 86 % ^Nielsen panel data analysis benchmarking OPTAvia against leading H&W brands OPTA VIA customers who have bought products more than four times 50 %
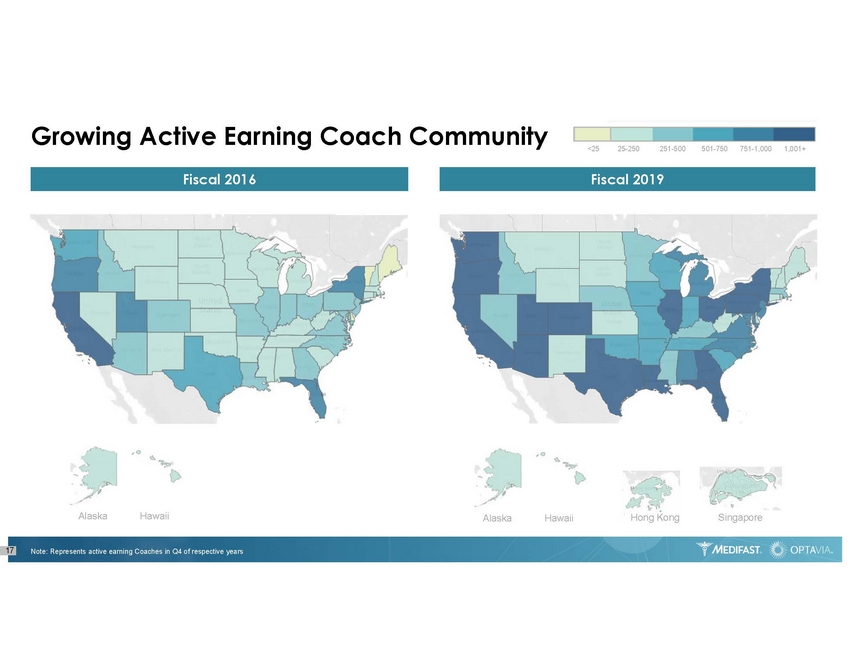
Growing Active Earning Coach Community 17 Fiscal 2016 Fiscal 2019 Note: Represents active earning Coaches in Q4 of respective years Hong Kong Singapore Alaska Hawaii Alaska Hawaii <25 25 - 250 251 - 500 501 - 750 751 - 1,000 1,001+

Revenue Per Coach 12,600 12,800 12,800 12,500 13,000 13,500 14,200 15,000 16,700 19,700 22,600 24,100 27,200 30,600 32,200 ~50,000 $4,490 $4,479 $4,421 $4,158 $4,463 $4,713 $4,693 $4,562 $5,278 $5,474 $5,781 $5,756 $5,817 $5,863 $5,715 Active Earning Coaches Number of Coaches 18 +42% Q3 18 – Q3 19 2017 2016 2018 2019 2021 Target Q1 Q2 Q3 Q4 Launch of New Business Strategy

$30 $29 $27 $40 $69 $285 $273 $275 $302 $501 $700 - $710 $1,000 2014* 2015* 2016 2017 2018 2019 Guidance 2021 Target Launch of New Business Strategy 19 ($ in mm, Except Per Share Data) OPTA VIA Driving Transformational Growth Revenue Operating Income $ 1.65 $ 1.62 $1.49 $2.29 $4.62 $5.80 - $5.90 +10% *From continuing operations 1 In the most recent quarter, the reported EPS was in - line with the guidance range +66% Beat guidance 8 out of 9 quarters since the launch of OPTA VIA 1 +74% +48% ~20% CAGR Diluted EPS ~40%

OUR PLAN FOR GROWTH 20
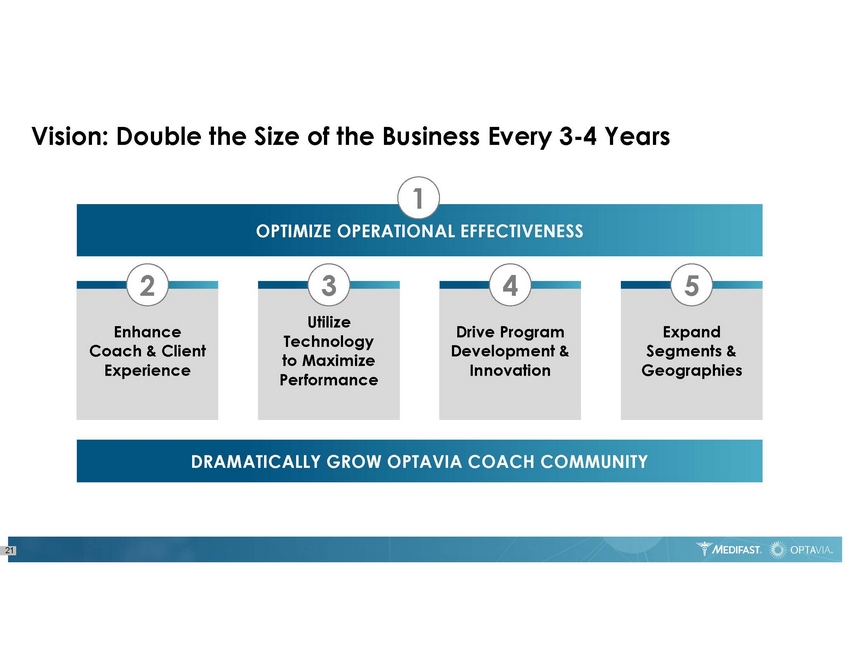
Vision: Double the Size of the Business Every 3 - 4 Years 21 DRAMATICALLY GROW OPTAVIA COACH COMMUNITY Enhance Coach & Client Experience 2 Expand Segments & Geographies 5 Drive Program Development & Innovation 4 Utilize Technology to Maximize Performance 3 OPTIMIZE OPERATIONAL EFFECTIVENESS 1

Optimize Operational Effectiveness 1 • Creating an organization that can power long - term sustained growth • Maximize efficiency and growth, while minimizing impact of any short - term air pockets • Scalable systems and processes • Replicable across multiple geographies, products and services 22

Credit Card Bad Debt Normalized Product Returns as a % of Sales Call Center Metrics Consumer Net Promoter Score Monthly Client Retention Rate 23 All Key Metrics Trending Positively

Enhance Coach & Client Experience 2 • Call center and CRM • Supply chain and support enhancements • Improved user technology experience • Enhanced product sensory experience 24

Utilize Technology to Maximize Performance 3 25 • New Coach Business Suite Improves Coach productivity – Deep visibility into Coach team activities – Work flow enabled – Real time updates • New e - commerce platform Improves Client experience and payment security • New social tools Makes sharing their story easier • Scalable to support expansion plans • Developing new Cloud - based Learning Management System to support Coaches for consistency of training as well as scalability December 2019 Development complete IOS and Android 2 nd Half 2020 Launch in Asia EOM / After Oracle launch

Support Additional Healthy Habits Through Products , Education and Community 26 Drive Program Development & Innovation 4 Movement Sleep Hydration Nutrition Aging

27 Expand Segments & Geographies 5 Market Opportunities Diversity Outreach to important communities Generational Target younger demographics Regional Underrepresented markets Lifestyle Serve clients in different stages of optimal wellbeing International Establish a global footprint

SUMMARY 28

Health & wellness innovator with differentiated, science - based programs and products Large and growing market opportunity addressing a global need Scalable coach - based direct - to - consumer selling model Attractive, highly predictable business model Significant free cash flow supports attractive capital allocation strategy Demonstrated track record of success with clear whitespace to drive future growth Key Investment Highlights 29

Thank You

31 Non - GAAP Reconciliation ($ in mm) Reconciliation of free cash flow and free cash flow conversion to Net cash provided by operating activities, the most directly comparable GAAP financial measure, for the last twelve months ended September 30, 2019. Non - GAAP measures should be evaluated with, and are not a substitute for, GAAP financial measures. Last Twelve Months Ended September 30, 2019 Free cash flow Net cash flow provided by operating activities 80$ Net cash flow used in investing activities (6) Free cash flow 75$ Free cash flow conversion Net cash flow provided by operating activities 80$ Net cash flow used in investing activities (6) Free cash flow 75 Divided By: Net cash flow provided by operating activities 80 Free cash flow conversion 93%