Attached files
| file | filename |
|---|---|
| 8-K - 8-K - Emergent BioSolutions Inc. | jpmpressrelease8-k.htm |
| EX-99.1 - EXHIBIT 99.1 - Emergent BioSolutions Inc. | a2020forecastexhibitjpm.htm |

Corporate Overview 38th Annual J.P. Morgan Healthcare Conference Robert G. Kramer Sr. President and Chief Executive Officer January 14, 2020

Forward-looking statements / Non-GAAP financial measures / trademarks Safe-Harbor Statement This presentation includes forward-looking statements within the meaning of the Private Securities Litigation Reform Act of 1995. Any statements, other than statements of historical fact, including, without limitation, our financial forecast and guidance, statements regarding our continued success, becoming a Fortune 500 company, our sustainable business model and competitive advantages, building on scalable capabilities, statements about consistent, diversified growth, profitability, doubling revenues and achieving target adjusted EBITDA margin, covering a larger portion of the public health threat market, growth through M&A, strengthening our R&D portfolio and other key growth areas and related future market opportunities and any other statements containing the words “will,” “believes,” “expects,” “anticipates,” “intends” “plans,” “targets,” “forecasts,” “estimates” and similar expressions in conjunction with, among other things, discussions of the Company's outlook, financial performance or financial condition, financial and operation goals, strategic goals, growth strategy, product sales, government development or procurement contracts or awards, government appropriations, manufacturing capabilities, and the timing of certain regulatory approvals or expenditures are forward-looking statements. These forward-looking statements are based on our current intentions, beliefs and expectations regarding future events. We cannot guarantee that any forward-looking statement will be accurate. Investors should realize that if underlying assumptions prove inaccurate or unknown risks or uncertainties materialize, actual results could differ materially from our expectations. Investors are, therefore, cautioned not to place undue reliance on any forward-looking statement. Any forward-looking statements speak only as of the date of this presentation, and, except as required by law, we do not undertake to update any forward-looking statement to reflect new information, events or circumstances. There are a number of important factors that could cause the Company’s actual results to differ materially from those indicated by such forward-looking statements, including the availability of funding and the exercise of options under our anthrax vaccine contracts; appropriations for the procurement of our products; our ability to continue deliveries of AV7909, ACAM and VIGIV to the SNS; our ability to secure Emergency Use Authorization designation and eventual licensure of AV7909 from the FDA within the anticipated timeframe, if at all; availability of funding for our U.S. government grants and contracts; our ability to successfully integrate and develop the operations, products or product candidates, programs, and personnel of any entities, businesses or products that we acquire, including our acquisitions of PaxVax and Adapt Pharma; our ability to complete expected deliveries of anthrax vaccines, BAT and raxibacumab; our ability to establish a multi-year follow-on contract for raxibacumab; our ability to identify and acquire or in-license products or product candidates that satisfy our selection criteria; our ability and the ability of our collaborators to defend underlying patents from infringement by generic naloxone entrants; whether anticipated synergies and benefits from an acquisition or in-license will be realized within expected time periods, if at all; our ability to utilize our manufacturing facilities and expand our capabilities; our ability and the ability of our contractors and suppliers to maintain compliance with Current Good Manufacturing Practices and other regulatory obligations; the results of regulatory inspections; the success of our ongoing and planned development programs; the timing and results of clinical trials; the timing of and our ability to obtain and maintain regulatory approvals for our product candidates; and our commercialization, marketing and manufacturing capabilities and strategy. The foregoing sets forth many, but not all, of the factors that could cause actual results to differ from our expectations in any forward- looking statement. Investors should consider this cautionary statement as well as the risk factors identified in our periodic reports filed with the Securities and Exchange Commission when evaluating our forward-looking statements. Non-GAAP Financial Measures This presentation contains five financial measures (Adjusted Net Income, Adjusted Net Income margin, EBITDA (Earnings Before Interest, Taxes, Depreciation and Amortization), Adjusted EBITDA and Adjusted EBITDA margin) that are considered “non-GAAP” financial measures under applicable Securities and Exchange Commission rules and regulations. These non-GAAP financial measures should be considered supplemental to and not a substitute for financial information prepared in accordance with generally accepted accounting principles. The Company’s definition of these non-GAAP measures may differ from similarly titled measures used by others. Adjusted Net Income adjusts for specified items that can be highly variable or difficult to predict or reflect the non-cash impact of charges resulting from purchase accounting. Adjusted Net Income margin is defined as Adjusted Net Income divided by total revenues. EBITDA reflects net income excluding the impact of depreciation, amortization, interest expense and provision for income taxes. Adjusted EBITDA also excludes specified items that can be highly variable and the non-cash impact of certain purchase accounting adjustments (which are tax effected utilizing the statutory tax rate for the US). Adjusted EBITDA margin is defined as Adjusted EBITDA divided by total revenues. The Company views these non- GAAP financial measures as a means to facilitate management’s financial and operational decision-making, including evaluation of the Company’s historical operating results and comparison to competitors’ operating results. These non-GAAP financial measures reflect an additional way of viewing aspects of the Company’s operations that, when viewed with GAAP results and the reconciliations to the corresponding GAAP financial measure, may provide a more complete understanding of factors and trends affecting the Company’s business. The determination of the amounts that are excluded from these non-GAAP financial measures are a matter of management judgment and depend upon, among other factors, the nature of the underlying expense or income amounts. Because non-GAAP financial measures exclude the effect of items that will increase or decrease the Company’s reported results of operations, management strongly encourages investors to review the Company’s consolidated financial statements and publicly filed reports in their entirety. For additional on the non-GAAP financial measures noted here, please refer to the Reconciliation Tables provided in the Appendix to this presentation. Trademarks BioThrax® (Anthrax Vaccine Adsorbed), RSDL® (Reactive Skin Decontamination Lotion Kit), BAT® [Botulism Antitoxin Heptavalent (A,B,C,D,E,F,G)-(Equine)], Anthrasil® (Anthrax Immune Globulin Intravenous [human]), CNJ-016® [Vaccinia Immune Globulin Intravenous (Human)], Trobigard® (atropine sulfate, obidoxime chloride), ACAM2000®, (Smallpox (Vaccinia) Vaccine, Live), Vivotif® (Typhoid Vaccine Live Oral Ty21a), Vaxchora® (Cholera Vaccine, Live, Oral), NARCAN® (naloxone HCI) Nasal Spray and any and all Emergent BioSolutions Inc. brands, products, services and feature names, logos and slogans are trademarks or registered trademarks of Emergent BioSolutions Inc. or its subsidiaries in the United States or other countries. All other brands, products, services and feature names or trademarks are the property of their respective owners. 2

Our vision To become a Fortune 500 global life sciences company recognized for protecting and enhancing life, driving innovation and living our values Our focus • CBRNE • Emerging Health Crises • Emerging Infectious Disease • Acute/Emergency Care • Travel Health • CDMO services 3
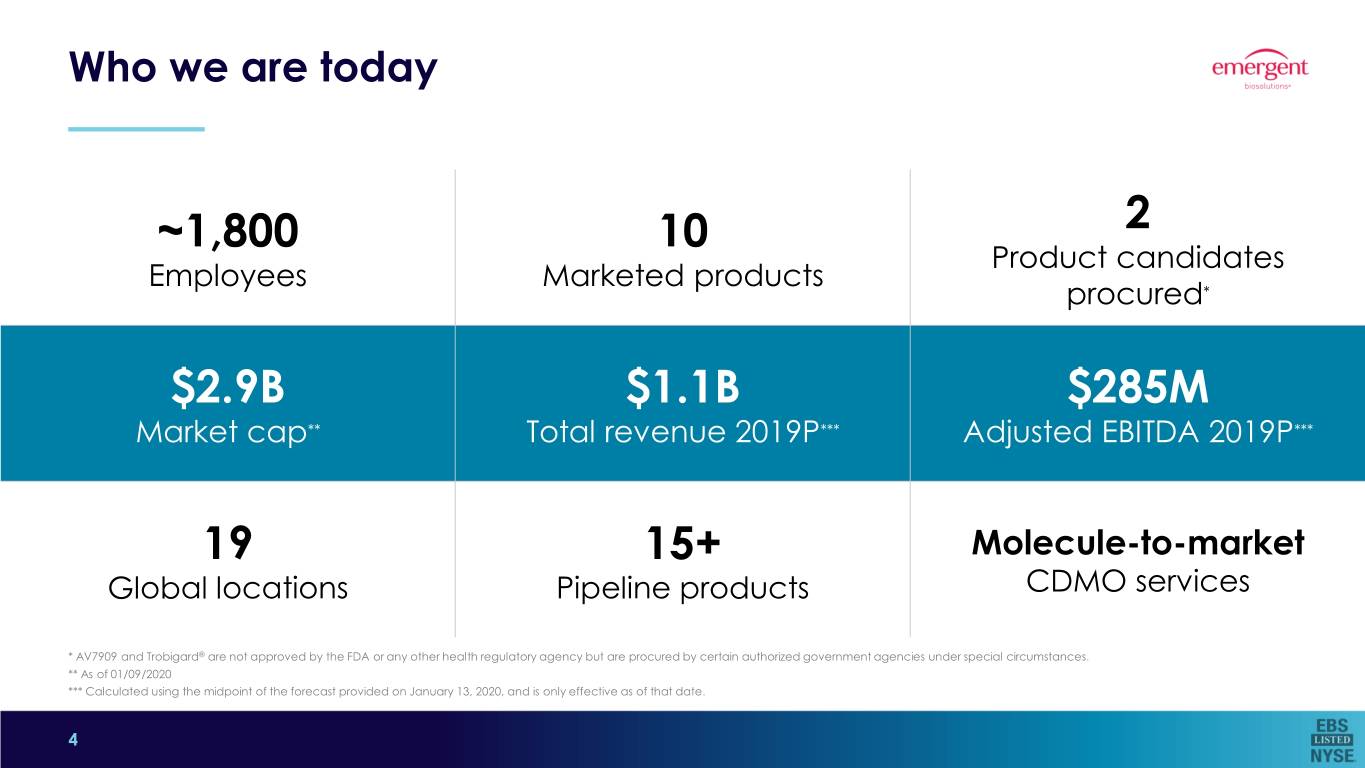
Who we are today ~1,800 10 2 Product candidates Employees Marketed products procured* $2.9B $1.1B $285M Market cap** Total revenue 2019P*** Adjusted EBITDA 2019P*** 19 15+ Molecule-to-market Global locations Pipeline products CDMO services * AV7909 and Trobigard® are not approved by the FDA or any other health regulatory agency but are procured by certain authorized government agencies under special circumstances. ** As of 01/09/2020 *** Calculated using the midpoint of the forecast provided on January 13, 2020, and is only effective as of that date. 4

Our marketed and specially-procured products Product types Anthrax Smallpox Opioids Anthrasil® ACAM2000® NARCAN® [Anthrax Immune (Smallpox (Vaccinia) (naloxone HCl) Globulin Intravenous Vaccine, Live) Nasal Spray (human)] ® Vaccines VIGIV CNJ-016 AV7909* [Vaccinia Immune Public (liquid, oral) [Anthrax Vaccine Globulin Intravenous Chemical Adsorbed (AVA), (Human)] ® Health Adjuvanted] RSDL (Reactive Skin Decontamination Threats ® BioThrax Lotion Kit) (Anthrax Vaccine Travel Health Emerging Therapeutics Adsorbed) ®* EmergingHealth Vaxchora® Trobigard (hyperimmune/mAb) (atropine sulfate, Health (Cholera Vaccine, Crises raxibacumab obidoxime chloride Crises Live, Oral) injection auto-injector) A fully human 5 ® monoclonal antibody Vivotif (Typhoid Vaccine Live Oral Ty21a) Botulism >$30B Market Medical devices (device, drug-device BAT® Opportunity combination product) [Botulism Antitoxin Heptavalent (A, B, C, D, E, F, G) - (Equine)] * AV7909 and Trobigard® are not approved by the FDA or any other health regulatory agency but are procured by certain authorized government agencies under special circumstances. 5

Our services Molecule-to-market Sustainable competitive advantages CDMO offerings • Foundational market approach • Science and technology Technology Development services • Industry-leading track record Platforms • Speed and flexibility to market • Tailored, individualized and integrated offerings Drug substance • 9 Global development & manufacturing sites • Center for Innovation in Advanced Development and Manufacturing (CIADM) $20B Market Opportunity Drug product & packaging 6

Our clinical pipeline Phase 1 Phase 2 Phase 3 Phase 4 ZIKV-IG CHIKV VLP AV7909* Vaxchora® - pediatric (Zika Virus Therapeutic) (Chikungunya Virus VLP [Anthrax Vaccine Adsorbed (Cholera Vaccine, Live, Oral) Vaccine) (AVA), Adjuvanted] FLU-IGIV Vaccines & Vaccines (Seasonal Influenza A Virus Therapeutics Therapeutic) Early Stage Late Stage D4 Trobigard* # (2PAM/Atropine) (Atropine Sulfate, Obidoxime Chloride Auto-injector) PC2A AP003 (Diazepam) (Naloxone Multidose Nasal Spray) Devices SIAN AP004 (Stabilized Isoamyl Nitrite) (Naloxone Prefilled Syringe) AP007 (Sustained-release Nalmefene Injectable) * AV7909 and Trobigard are not approved by FDA or any other health regulatory agency but are procured by certain authorized government agencies under special circumstances. # Application submitted to a regulatory health authority in the European Union. 7

Consistent, diversified revenue growth… Total revenue Revenue mix 10 Products ($ Millions) 12% * 21% CAGR 22% 8% $1,103 1 Product $1,016M 23% 18% 16% $278M $278 77% 25% 2012 Trailing 12-months (09/30/2019) 2012 2013 2014 2015 2016 2017 2018 2019P* Anthrax vaccines ACAM2000® NARCAN® Nasal Spray Other product sales Contract manufacturing C&G * Based upon the midpoint of the range for preliminary 2019 total revenue, initially provided on January 13, 2020. 8

…Driving strong profitability Adjusted net income* Adjusted EBITDA* ($ Millions) $400 $400 CAGR 15%** CAGR 20%** $300 $300 $285 $200 $200 $155 $100 $100 $79 $59 $0 $0 ** 2012 2013 2014 2015 2016 2017 2018 2019P 2012 2013 2014 2015 2016 2017 2018 2019P** * See the Appendix for non-GAAP reconciliation tables. ** All references related to preliminary 2019 financial results, and any calculations taking into effect these preliminary results, are based upon the midpoint of ranges provided on January 13, 2020. 9

Strong track record of M&A 2013 Hattiesburg, MS 2014 Winnipeg, Baltimore, MD Canada (Camden) 2015 Auto-injector platform raxibacumab injection 2017 Canton, Rockville, MA MD A fully human monoclonal antibody Bern, 2018 Switzerland Added $600M in annual revenue through acquisitions since 2017 10

2019 financial goals Full Year Financial Goals Preliminary Financial Results (As of 1/13/2020) Total Revenue $1,060M-$1,140M $1,100M-$1,105M*** Adjusted Net $150M-$160M*** Income* $150M-$180M # Margin** 15% 14% Adjusted $280M-$290M*** EBITDA* $280M-$310M # Margin** 27% 26% * See the Appendix for non-GAAP reconciliation tables. ** Calculated using the midpoint of the range of the relevant metric divided by the midpoint of the range for total revenue. *** Based upon the ranges provided in the press release issued by the Company on January 13, 2020. # See the Appendix for methodology and specific factors used in calculating this metric. 11

2019 operational goals Operational Goals Operational Achievements • ACAM2000 - $2B – 10 year contract ✓ Secure/renew U.S. Government • VIG - $535M – 10 year contract procurement contracts for key programs • BAT – up to $500M – 10 year contract • AV7909 Exercise - $261M – 1 year contract ✓ Continue initiatives to support awareness, • Expanded annual production capacity to >10M units • Supported implementation of Co-Rx in CA, NM, WA, OH availability and affordability of NARCAN® • Price has remained constant with average copay $19 per Nasal Spray 4 mg two-unit carton • AV7909: P3 initiated; initial doses delivered to SNS • Vaxchora: New formulation (refrigerated versus frozen) ✓ Advance 6 R&D programs to next stage • CHIKV VLP: P2 completed; P3 development plans reviewed of development • FLU-IGIV: P2 database locked; safety analysis ongoing • Naloxone PFS: FDA dossier submission completed • Trobigard: Belgium Health Authority submission completed 12

Title Only 13 Footer

2024 strategic goals • Double revenue to >$2B • Grow in disciplined, profitable way; achieve adjusted EBITDA margin of 27%-30%* • Expand and build scalable leadership positions in current and new public health threat (PHT) markets • Invest in capabilities, innovation and operational excellence * Defined as Adjusted EBITDA divided by total revenue. 14

Core strategies driving the next five years Execute Grow Strengthen R&D Build Scalable Evolve Core Business Through M&A Portfolio Capabilities Culture * Defined as Adjusted EBITDA divided by total revenue. 15

Core strategy – Execute Core Business Deliver core business in products and services Execute Core Business * Defined as Adjusted EBITDA divided by total revenue. 16

Addressing a larger portion of the PHT market CBRNE Public EID Health Public Threats Health Threats EmergingEmerging Opioids HealthHealth CrisesCrises Travelers’ CBRNE Diseases >$30B Market Opportunity 1998 2024 17
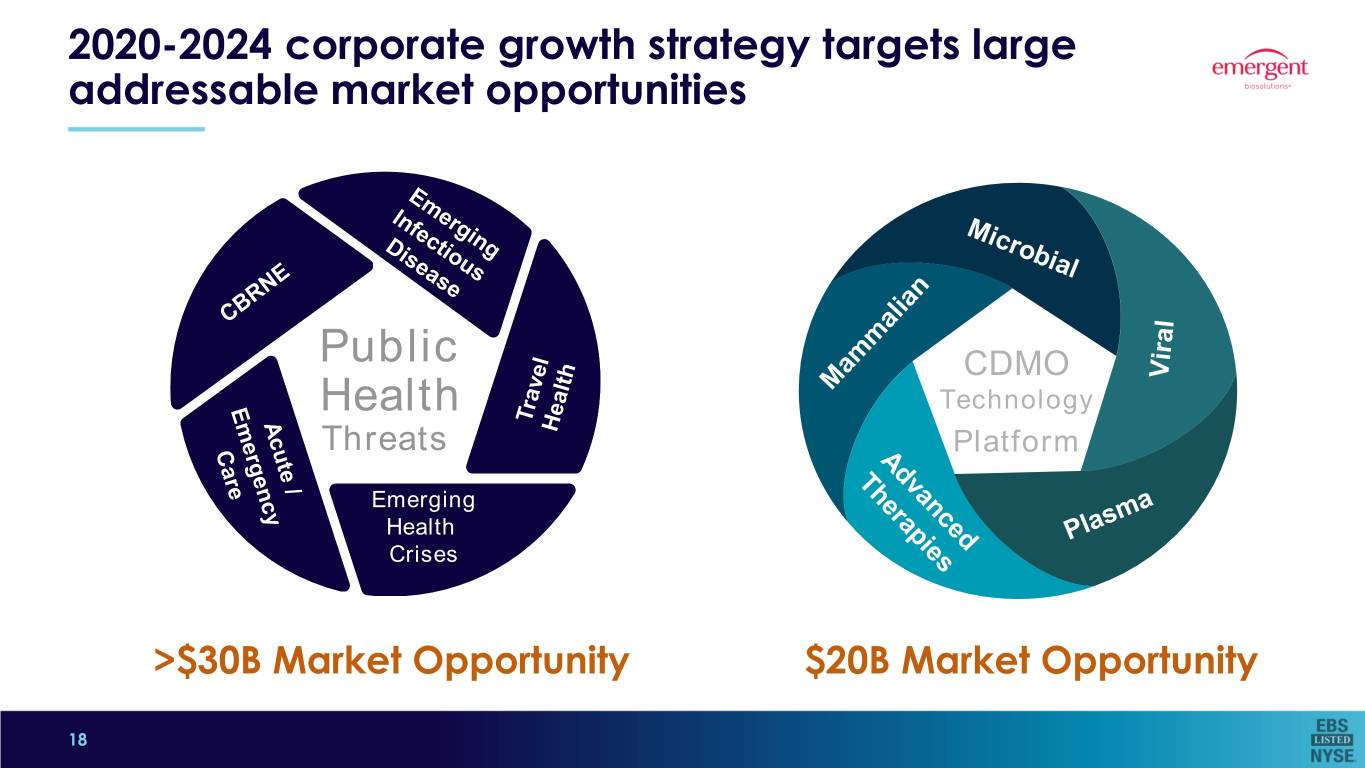
2020-2024 corporate growth strategy targets large addressable market opportunities Public CDMO Health Technology Threats Platform Emerging EmergingHealth HealthCrises Crises 5 >$30B Market Opportunity $20B Market Opportunity 18

Customer and partner mix provides platform for continued success Pharma and NGO Government Clinics/Distributors/Pharmacies Biotech Small Mid Large >50 customers 19

Core strategy – Grow Through M&A Expand impact on patients and customers while profitably delivering incremental topline revenue Grow Through M&A 20
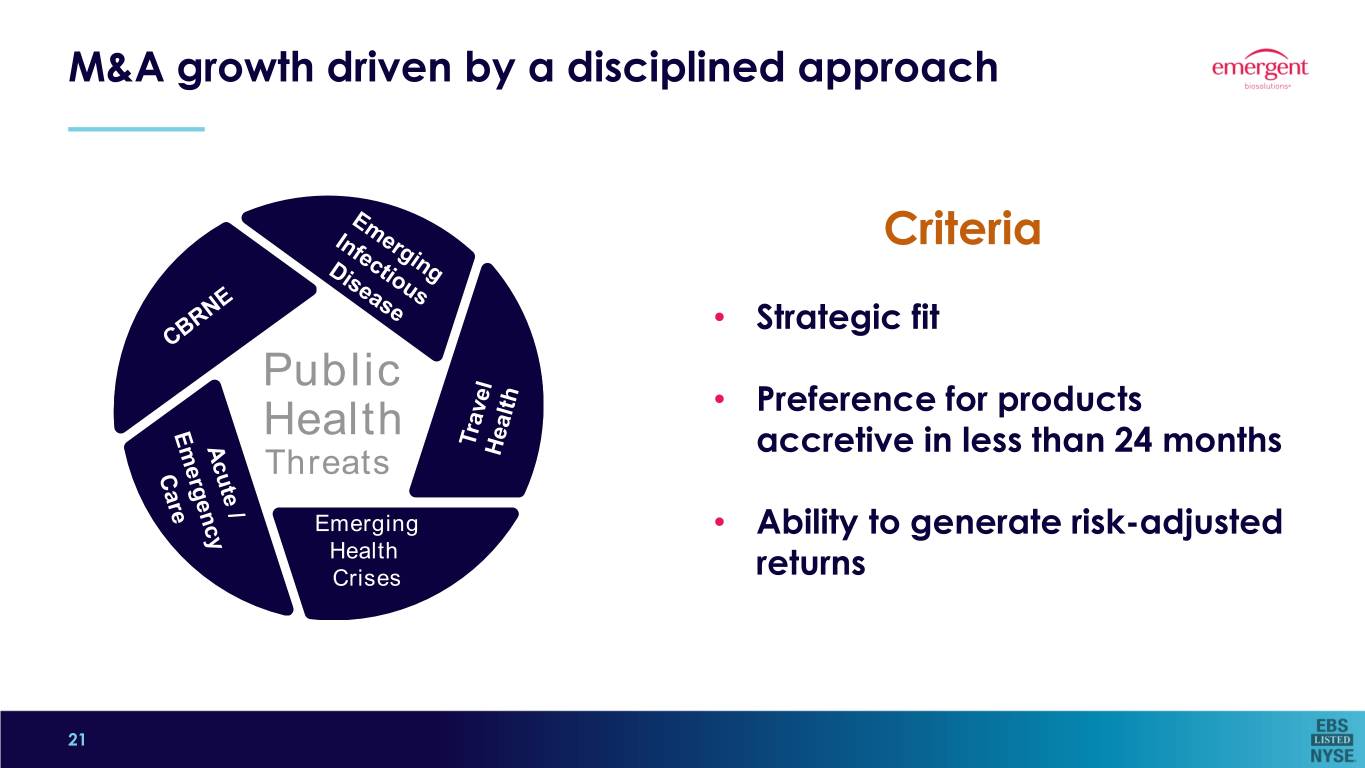
M&A growth driven by a disciplined approach Criteria • Strategic fit Public • Preference for products Health accretive in less than 24 months Threats Emerging • Ability to generate risk-adjusted EmergingHealth HealthCrises returns Crises 5 21

Core strategy – Strengthen R&D Portfolio Build R&D pipeline to become a meaningful contributor to growth after 2024 Strengthen R&D Portfolio 22

Core strategy – Build Scalable Capabilities Invest in operational excellence and innovation to support a growing enterprise that will deliver greater impact Build Scalable Capabilities 23

Core strategy – Evolve Culture Evolve our culture to support increased employee engagement and empowerment Evolve Culture 24
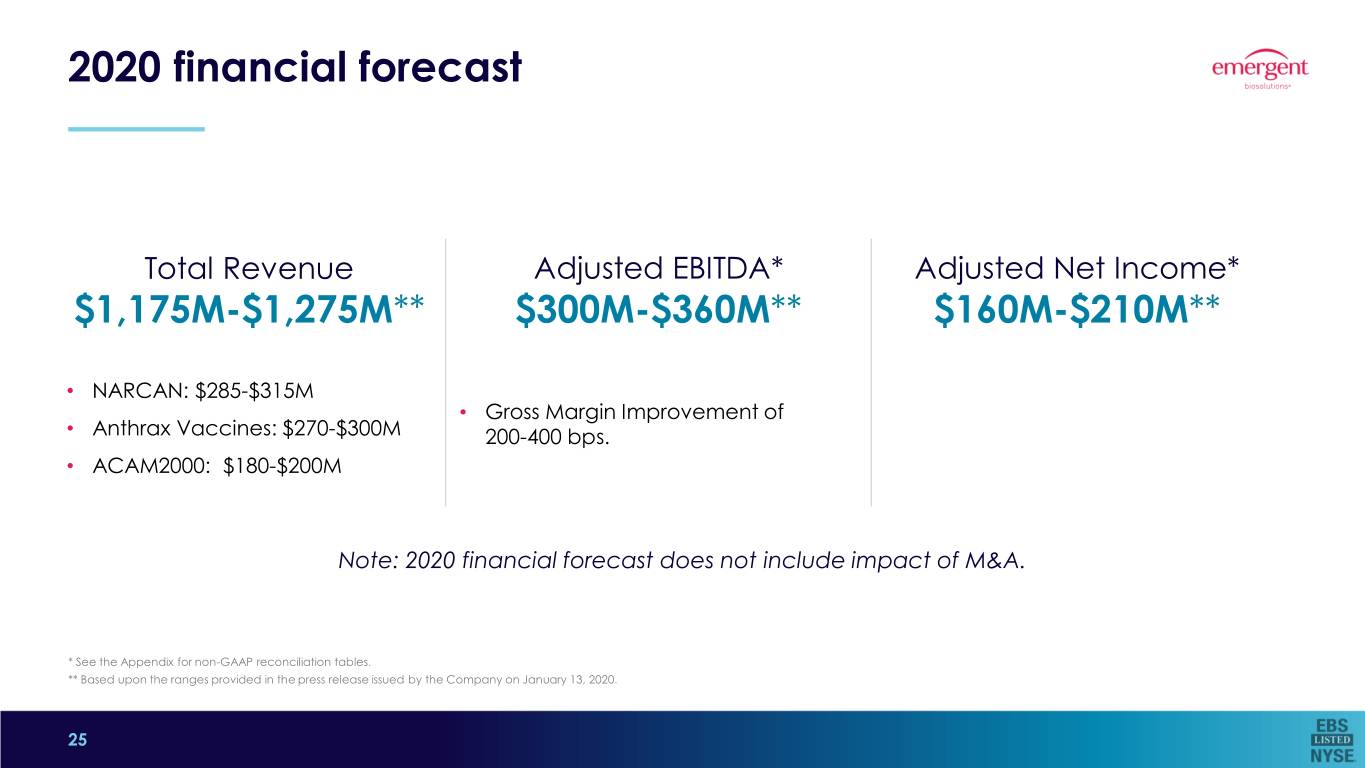
2020 financial forecast Total Revenue Adjusted EBITDA* Adjusted Net Income* $1,175M-$1,275M** $300M-$360M** $160M-$210M** • NARCAN: $285-$315M • Gross Margin Improvement of • Anthrax Vaccines: $270-$300M 200-400 bps. • ACAM2000: $180-$200M Note: 2020 financial forecast does not include impact of M&A. * See the Appendix for non-GAAP reconciliation tables. ** Based upon the ranges provided in the press release issued by the Company on January 13, 2020. 25

Summary takeaways Proven track record – build from history of profitable, diversified revenue growth Scalable and sustainable business model – deliver expanding offering of specialty products and services addressing global preparedness and response Established leader – continue to build and scale leadership positions in select PHT markets where we have competitive advantages Strong financial foundation – employ a disciplined capital deployment approach to support strategic objectives and drive shareholder value 26

Corporate Overview 38th Annual J.P. Morgan Healthcare Conference Robert G. Kramer Sr. President and Chief Executive Officer January 14, 2020

Appendix
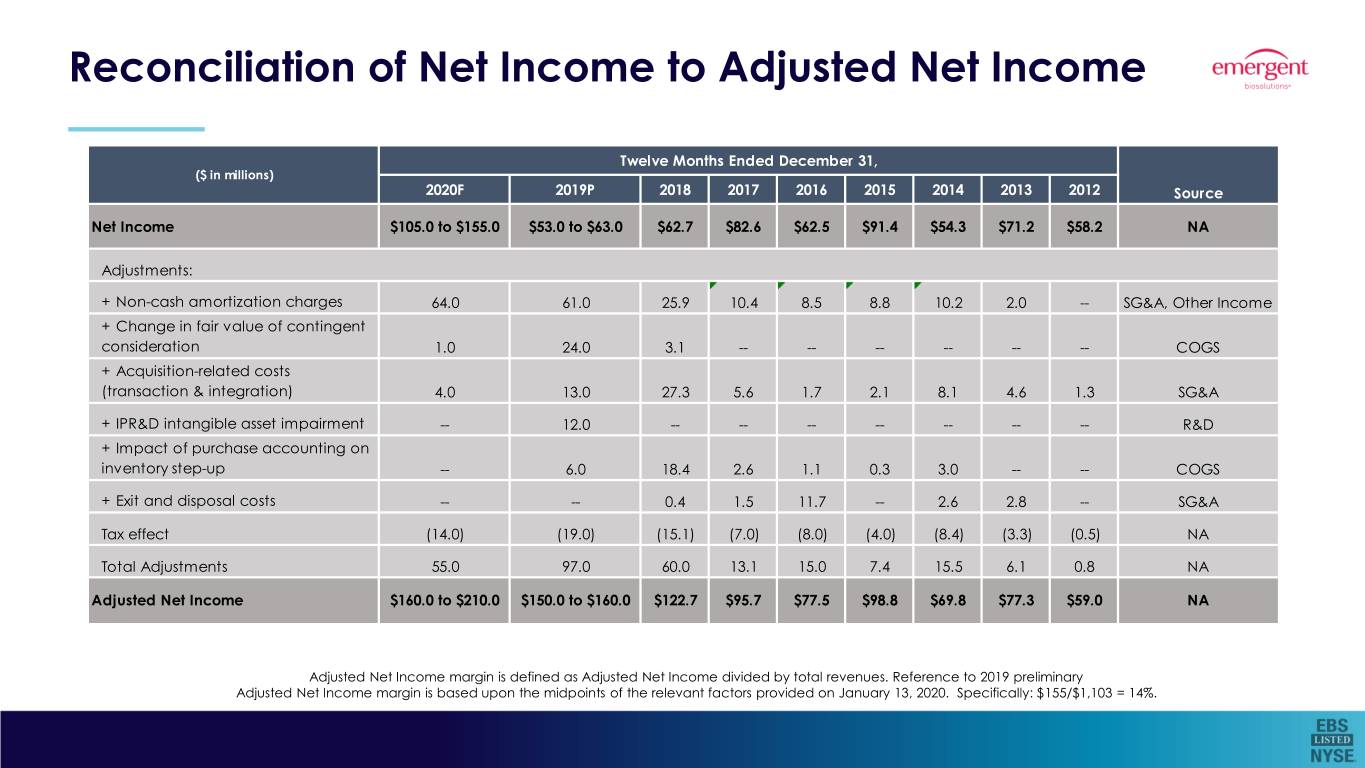
Reconciliation of Net Income to Adjusted Net Income Twelve Months Ended December 31, ($ in millions) 2020F 2019P 2018 2017 2016 2015 2014 2013 2012 Source Net Income $105.0 to $155.0 $53.0 to $63.0 $62.7 $82.6 $62.5 $91.4 $54.3 $71.2 $58.2 NA Adjustments: + Non-cash amortization charges 64.0 61.0 25.9 10.4 8.5 8.8 10.2 2.0 -- SG&A, Other Income + Change in fair value of contingent consideration 1.0 24.0 3.1 -- -- -- -- -- -- COGS + Acquisition-related costs (transaction & integration) 4.0 13.0 27.3 5.6 1.7 2.1 8.1 4.6 1.3 SG&A + IPR&D intangible asset impairment -- 12.0 -- -- -- -- -- -- -- R&D + Impact of purchase accounting on inventory step-up -- 6.0 18.4 2.6 1.1 0.3 3.0 -- -- COGS + Exit and disposal costs -- -- 0.4 1.5 11.7 -- 2.6 2.8 -- SG&A Tax effect (14.0) (19.0) (15.1) (7.0) (8.0) (4.0) (8.4) (3.3) (0.5) NA Total Adjustments 55.0 97.0 60.0 13.1 15.0 7.4 15.5 6.1 0.8 NA Adjusted Net Income $160.0 to $210.0 $150.0 to $160.0 $122.7 $95.7 $77.5 $98.8 $69.8 $77.3 $59.0 NA Adjusted Net Income margin is defined as Adjusted Net Income divided by total revenues. Reference to 2019 preliminary Adjusted Net Income margin is based upon the midpoints of the relevant factors provided on January 13, 2020. Specifically: $155/$1,103 = 14%.

Reconciliation of Net Income to EBITDA and Adjusted EBITDA Twelve Months Ended December 31, ($ in millions) 2020F 2019P 2018 2017 2016 2015 2014 2013 2012 Source Net Income $105.0 to $155.0 $53.0 to $63.0 $62.7 $82.6 $62.5 $91.4 $54.3 $71.2 $58.2 NA Adjustments: + Depreciation & Amortization 111.0 to 121.0 111.0 61.3 40.8 34.9 31.2 29.4 18.3 9.7 COGS, SG&A, R&D + Total Interest Expense 31.0 38.0 9.9 6.6 7.6 6.5 8.2 -- -- Other Expense/(Income) + Provision for Income Taxes 48.0 23.0 18.8 36.0 36.7 44.3 29.9 12.3 9.8 Income Taxes EBITDA $295.0 to $355.0 $225.0 to $235.0 $152.7 $166.0 $141.7 $173.4 $121.8 $101.8 $77.7 NA Additional Adjustments: + Change in fair value of contingent consideration 1.0 24.0 3.1 -- -- -- -- -- -- COGS + Acquisition-related costs (transaction & integration) 4.0 13.0 27.3 5.6 1.7 2.1 8.1 4.6 1.3 SG&A + IPR&D intangible asset impairment -- 12.0 -- -- -- -- -- -- -- R&D + Impact of purchase accounting on inventory step-up -- 6.0 18.4 2.6 1.1 0.3 3.0 -- -- COGS + Exit and disposal costs -- -- 0.4 1.5 11.8 -- 2.6 2.8 -- SG&A Total Additional Adjustments 5.0 55.0 49.2 9.7 14.6 2.4 13.7 7.4 1.3 NA Adjusted EBITDA $300.0 to $360.0 $280.0 to $290.0 $201.9 $175.7 $156.3 $175.8 $135.5 $109.2 $79.0 NA Adjusted EBITDA margin is defined as Adjusted EBITDA divided by total revenues. Reference to 2019 preliminary Adjusted EBITDA margin is based upon the midpoints of the relevant factors provided on January 13, 2020. Specifically: $285/$1,103 = 26%.
