Attached files
| file | filename |
|---|---|
| 8-K - FORM 8-K - Helmerich & Payne, Inc. | tm1923841-6_8k.htm |
Exhibit 99.1
HELMERICH & PAYNE, INC. Data as of 11/14/2019 unless otherwise noted. Goldman Sachs Global Energy Conference January 2020
© HELMERICH & PAYNE, INC. 2020 1 Forward - Looking Statements Forward Looking Statements This presentation contains forward - looking statements within the meaning of the securities laws. Forward - looking statements can be identified by the fact that they do not relate strictly to historical or current facts. They often include words or variation of words such as "expect," "look forward to," "an ticipate" "intend," "plan," "believe," "seek," "estimate," "will," "project" or words of similar meaning or other similar expressions. Forward - looking statements provide management's current expe ctations or predictions of future conditions, events or results. All statements that address operating performance, strategies, events or developments that we expect or anticipate will occur in the future are forward - looking statements. They may include estimates of revenues, market share, income, effective tax rate, earnings per share, cost savings, capital e xpe nditures, returning cash to stockholders through dividends or share repurchases, liquidity, capital structure or other financial items, descriptions of management's plans or objectives fo r f uture operations, products or services, or descriptions of assumptions underlying any of the above. All forward - looking statements speak only as of the date they are made and reflect the company's good faith beliefs, assumptions and expectations, but they are not guarantees of future performance or events. Furthermore, the company disclaims an y obligation to publicly update or revise any forward - looking statement to reflect changes in underlying assumptions, factors, or expectations, new information, data or metho ds, future events or other changes, except as required by law. By their nature, forward - looking statements are subject to risks and uncertainties that could cause actual resu lts to differ materially from those suggested by the forward - looking statements. Factors that might cause such differences include, but are not limited to a variety of economic, com petitive and regulatory factors, many of which are beyond the company's control, that are described in our Annual Report on Form 10 - K for the fiscal year ended September 30, 2019 in the sections entitled "Risk Factors“ and “Management’s Discussion & Analysis of Financial Condition and Results of Operations” and additional factors we may describe fro m time to time in other filings with the Securities and Exchange Commission. You may get such filings for free at our website at https ://www.hpinc.com /. You should understand that it is not possible to predict or identify all such factors and, consequently, you should not consider any such list to be a complete set of all potential risks or uncertainties . Market and Industry Data The data included in this presentation regarding the oil field services industry, including trends in the market and the comp any 's position and the position of its competitors within this industry, are based on the company's estimates, which have been derived from management's knowledge and experience in the ind ust ry, and information obtained from customers, trade and business organizations, internal research, publicly - available information, industry publications and surveys and other contacts in the industry. The company has also cited information compiled by industry publications, governmental agencies and publicly - available sources. Although the company believ es these third - party sources to be reliable, it has not independently verified the data obtained from these sources and it cannot assure you of the accuracy or completeness of t he data. Estimates of market size and relative positions in a market are difficult to develop and inherently uncertain and the company cannot assure you that it is accurate. Accordin gly , you should not place undue weight on the industry and market share data presented in this presentation.
© HELMERICH & PAYNE, INC. 2020 H&P Investment Thesis » Industry Leader in U.S. Land Drilling • FlexRig ® Fleet Poised for Continued Market Share Gains • Most Capable and Uniform Fleet • Consistent Operational Excellence (Safety, Customer Satisfaction, Reliability) • Financial Position and Strength • Technology and Innovation Leader » Financial Discipline • Invest Capital Wisely • Maintain Flexible Balance Sheet • Return Cash to shareholders • ~$1 billion in U.S. term revenue backlog; ~67% of fleet on term contracts » Unique Financial Profile • 48 Years of Increasing Dividends; Strong Yield • Member of S&P 500 (1 of 6 in the oilfield service sector) • Investment grade rating (BBB+; 1 of 6 in the oilfield service sector) * Source: Bloomberg, based on annual performance of H&P stock compared to the annual performance of the OSX index. 2
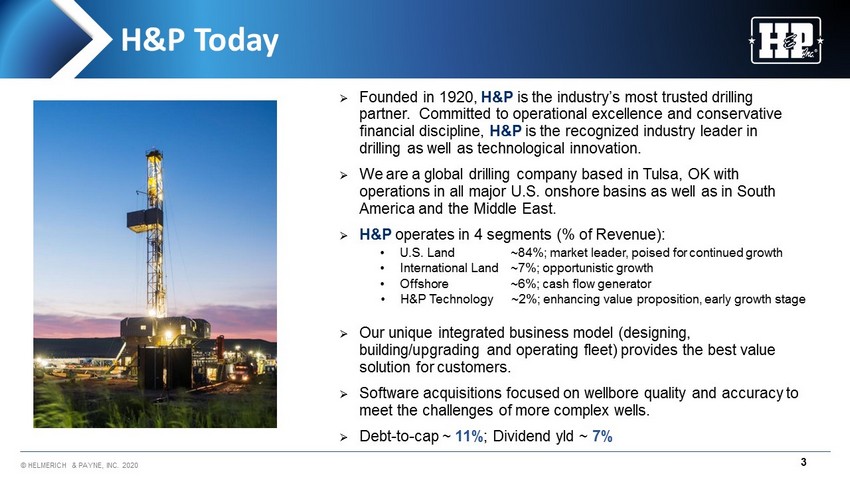
© HELMERICH & PAYNE, INC. 2020 H&P Today » Founded in 1920, H&P is the industry’s most trusted drilling partner. Committed to operational excellence and conservative financial discipline, H&P is the recognized industry leader in drilling as well as technological innovation. » We are a global drilling company based in Tulsa, OK with operations in all major U.S. onshore basins as well as in South America and the Middle East. » H&P operates in 4 segments (% of Revenue): » Our unique integrated business model (designing, building/upgrading and operating fleet) provides the best value solution for customers. » Software acquisitions focused on wellbore quality and accuracy to meet the challenges of more complex wells. » Debt - to - cap ~ 11% ; Dividend y ld ~ 7 % • U.S. Land ~84%; market leader, poised for continued growth • International Land ~7%; opportunistic growth • Offshore ~6%; cash flow generator • H&P Technology ~2%; enhancing value proposition, early growth stage 3
© HELMERICH & PAYNE, INC. 2020 Today’s Focus Points H&P’s Winning Strategy » Execute as the dominant U.S. land driller » Continue to lead industry in technology and innovation bringing value to customers » Grow international business opportunistically » Maintain cash flow generating offshore exposure » Maintain and build upon a solid financial foundation » Adapt to changing market conditions and make wise investments through the cycles 4
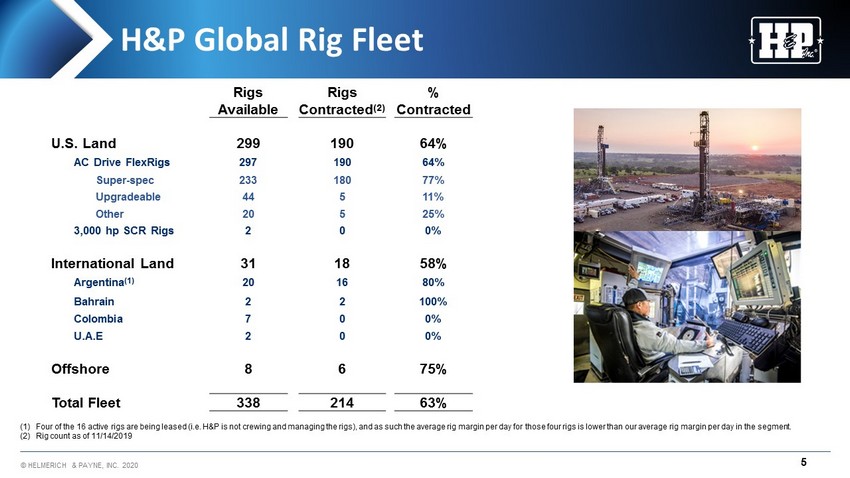
© HELMERICH & PAYNE, INC. 2020 H&P Global Rig Fleet (1) Four of the 16 active rigs are being leased (i.e. H&P is not crewing and managing the rigs), and as such the average rig marg in per day for those four rigs is lower than our average rig margin per day in the segment. (2) Rig count as of 11/14/2019 Rigs Rigs % Available Contracted (2) Contracted U.S. Land 299 190 64% AC Drive FlexRigs 297 190 64% Super - spec 233 180 77% Upgradeable 44 5 11% Other 20 5 25% 3,000 hp SCR Rigs 2 0 0% International Land 31 18 58% Argentina (1) 20 16 80% Bahrain 2 2 100% Colombia 7 0 0% U.A.E 2 0 0% Offshore 8 6 75% Total Fleet 338 214 63% 5
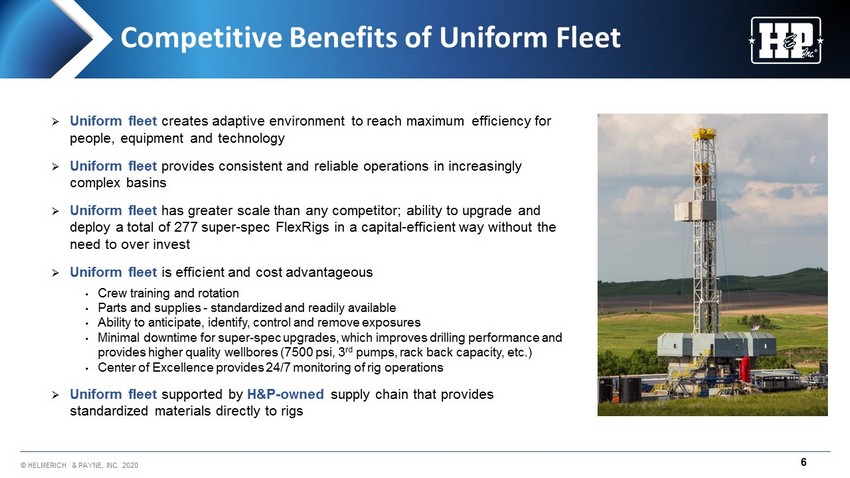
© HELMERICH & PAYNE, INC. 2020 Competitive Benefits of Uniform Fleet » Uniform fleet creates adaptive environment to reach maximum efficiency for people, equipment and technology » Uniform fleet provides consistent and reliable operations in increasingly complex basins » Uniform fleet has greater scale than any competitor; ability to upgrade and deploy a total of 277 super - spec FlexRigs in a capital - efficient way without the need to over invest » Uniform fleet is efficient and cost advantageous • Crew training and rotation • Parts and supplies - standardized and readily available • Ability to anticipate, identify, control and remove exposures • Minimal downtime for super - spec upgrades, which improves drilling performance and provides higher quality wellbores (7500 psi, 3 rd pumps, rack back capacity, etc.) • Center of Excellence provides 24/7 monitoring of rig operations » Uniform fleet supported by H&P - owned supply chain that provides standardized materials directly to rigs 6
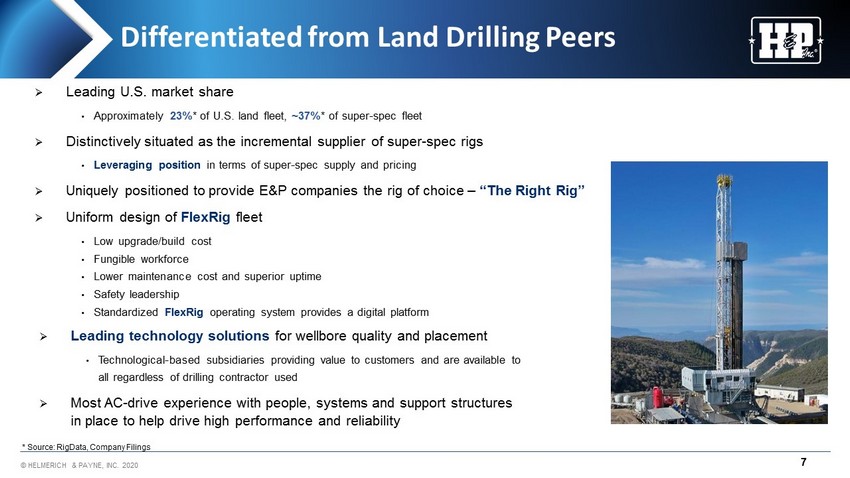
© HELMERICH & PAYNE, INC. 2020 Differentiated from Land Drilling Peers » Leading U.S. market share • Approximately 23% * of U.S. land fleet, ~37% * of super - spec fleet » Distinctively situated as the incremental supplier of super - spec rigs • Leveraging position in terms of super - spec supply and pricing » Uniquely positioned to provide E&P companies the rig of choice – “The Right Rig” » Uniform design of FlexRig fleet • Low upgrade/build cost • Fungible workforce • Lower maintenance cost and superior uptime • Safety leadership • Standardized FlexRig operating system provides a digital platform » Leading technology solutions for wellbore quality and placement • Technological - based subsidiaries providing value to customers and are available to all regardless of drilling contractor used » Most AC - drive experience with people , systems and support structures in place to help drive high performance and reliability * Source: RigData , Company Filings 7
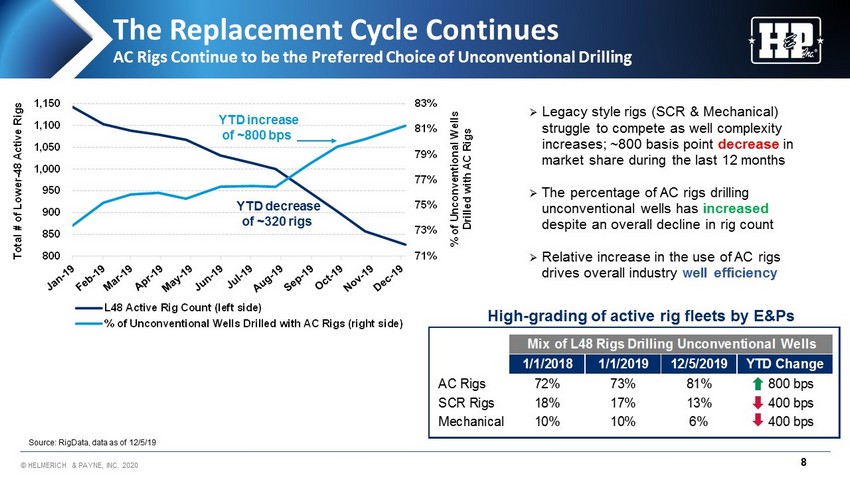
© HELMERICH & PAYNE, INC. 2020 71% 73% 75% 77% 79% 81% 83% 800 850 900 950 1,000 1,050 1,100 1,150 % of Unconventional Wells Drilled with AC Rigs Total # of Lower - 48 Active Rigs L48 Active Rig Count (left side) % of Unconventional Wells Drilled with AC Rigs (right side) 8 The Replacement Cycle Continues AC Rigs Continue to be the Preferred Choice of Unconventional Drilling » Legacy style rigs (SCR & Mechanical) struggle to compete as well complexity increases; ~800 basis point decrease in market share during the last 12 months » The percentage of AC rigs drilling unconventional wells has increased despite an overall decline in rig count » Relative increase in the use of AC rigs drives overall industry well efficiency High - grading of active rig fleets by E&Ps YTD increase of ~800 bps YTD decrease of ~320 rigs 1/1/2018 1/1/2019 12/5/2019 YTD Change AC Rigs 72% 73% 81% 800 bps SCR Rigs 18% 17% 13% 400 bps Mechanical 10% 10% 6% 400 bps Mix of L48 Rigs Drilling Unconventional Wells Source: RigData , data as of 12/5/19
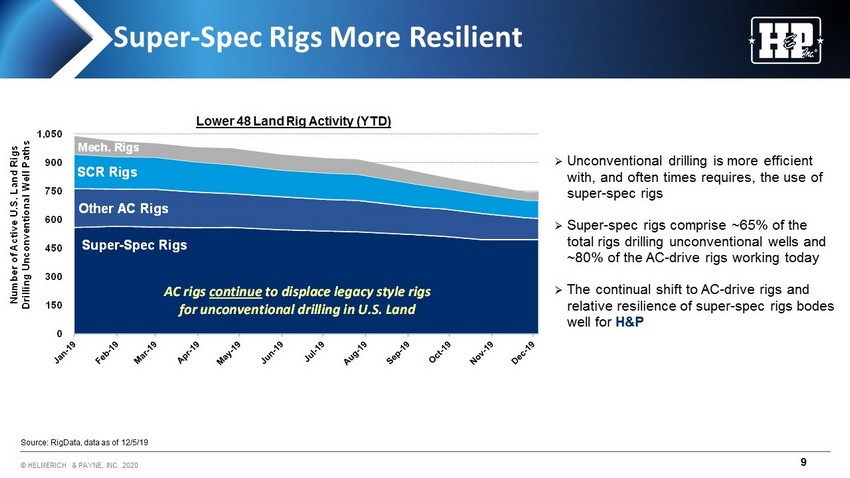
© HELMERICH & PAYNE, INC. 2020 9 Super - Spec Rigs More Resilient » Unconventional drilling is more efficient with, and often times requires, the use of super - spec rigs » Super - spec rigs comprise ~65% of the total rigs drilling unconventional wells and ~80% of the AC - drive rigs working today » The continual shift to AC - drive rigs and relative resilience of super - spec rigs bodes well for H&P 0 150 300 450 600 750 900 1,050 Number of Active U.S. Land Rigs Drilling Unconventional Well Paths Other AC Rigs SCR Rigs Mech. Rigs AC rigs continue to displace legacy style rigs for unconventional drilling in U.S. Land Super - Spec Rigs Lower 48 Land Rig Activity (YTD) Source: RigData , data as of 12/5/19
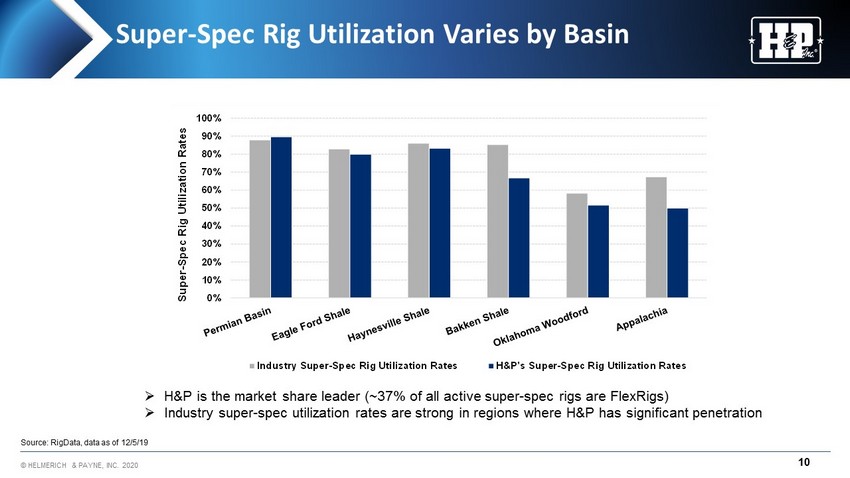
© HELMERICH & PAYNE, INC. 2020 Super - Spec Rig Utilization Varies by Basin 10 » H&P is the market share leader (~37% of all active super - spec rigs are FlexRigs ) » Industry super - spec utilization rates are strong in regions where H&P has significant penetration Source: RigData , data as of 12/5/19 0% 10% 20% 30% 40% 50% 60% 70% 80% 90% 100% Super - Spec Rig Utilization Rates Industry Super-Spec Rig Utilization Rates H&P's Super-Spec Rig Utilization Rates
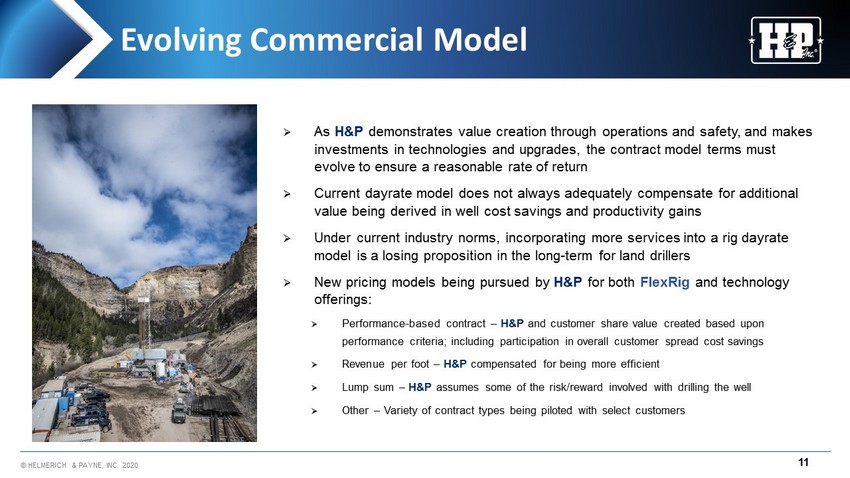
© HELMERICH & PAYNE, INC. 2020 Evolving Commercial Model » As H&P demonstrates value creation through operations and safety, and makes investments in technologies and upgrades, the contract model terms must evolve to ensure a reasonable rate of return » Current dayrate model does not always adequately compensate for additional value being derived in well cost savings and productivity gains » Under current industry norms, incorporating more services into a rig dayrate model is a losing proposition in the long - term for land drillers » New pricing models being pursued by H&P for both FlexRig and technology offerings: » Performance - based contract – H&P and customer share value created based upon performance criteria; including participation in overall customer spread cost savings » Revenue per foot – H&P compensated for being more efficient » Lump sum – H&P assumes some of the risk/reward involved with drilling the well » Other – Variety of contract types being piloted with select customers 11
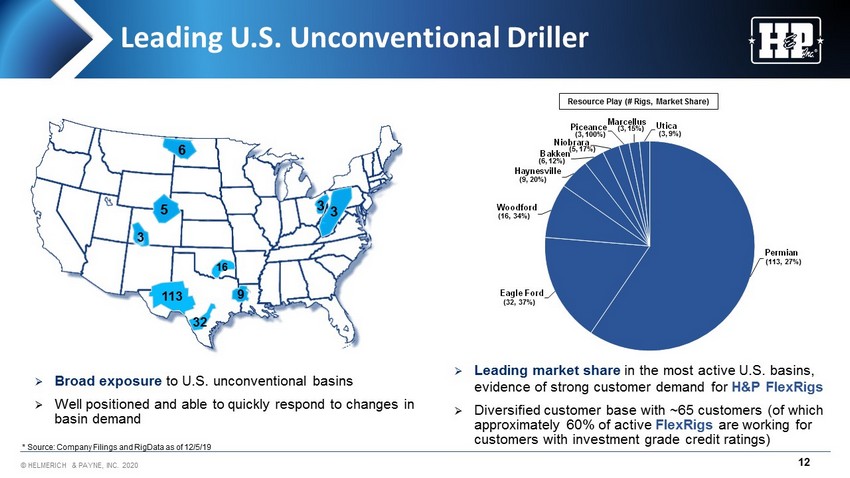
© HELMERICH & PAYNE, INC. 2020 Permian Eagle Ford Woodford Haynesville Bakken Niobrara Piceance Marcellus Utica 6 5 3 113 32 9 16 3 3 Leading U.S. Unconventional Driller » Leading market share in the most active U.S. basins, evidence of strong customer demand for H&P FlexRigs » Diversified customer base with ~65 customers (of which approximately 60% of active FlexRigs are working for customers with investment grade credit ratings) » Broad exposure to U.S. unconventional basins » Well positioned and able to quickly respond to changes in basin demand Resource Play (# Rigs, Market Share) (113, 27%) * Source: Company Filings and RigData as of 12/5/19 12 (32, 37%) (16, 34%) (9, 20%) (6, 12%) (5, 17%) (3, 100%) (3, 15%) (3, 9%)
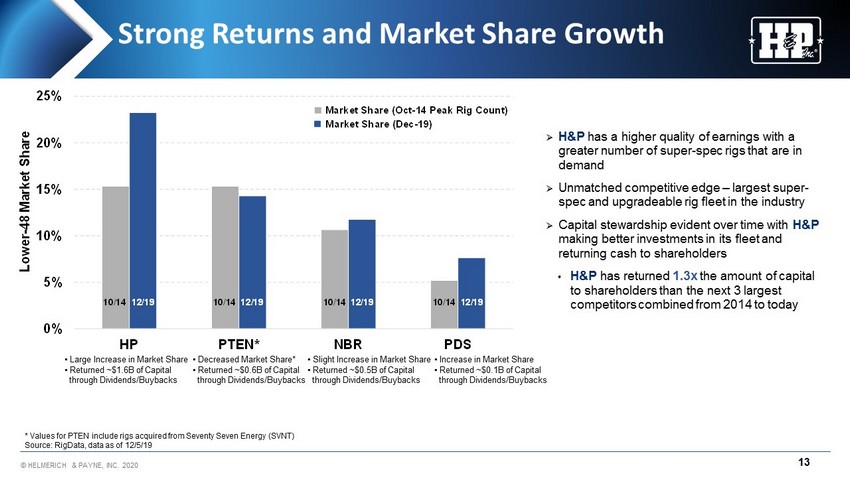
© HELMERICH & PAYNE, INC. 2020 0% 5% 10% 15% 20% 25% HP PTEN* NBR PDS 12/19 12/19 12/19 12/19 Lower - 48 Market Share Market Share ( Oct - 14 Peak Rig Count) Market Share (Dec - 19) 10/14 10/14 10/14 10/14 Strong Returns and Market Share Growth » H&P has a higher quality of earnings with a greater number of super - spec rigs that are in demand » Unmatched competitive edge – largest super - spec and upgradeable rig fleet in the industry » Capital stewardship evident over time with H&P making better investments in its fleet and returning cash to shareholders • H&P has returned 1.3x the amount of capital to shareholders than the next 3 largest competitors combined from 2014 to today * Values for PTEN include rigs acquired from Seventy Seven Energy (SVNT ) Source: RigData , data as of 12/5/19 13 ƒ Large Increase in Market Share ƒ Returned ~$ 1.6B of Capital through Dividends/Buybacks ƒ Decreased Market Share * ƒ Returned ~$ 0.6B of Capital through Dividends/Buybacks ƒ Slight Increase in Market Share ƒ Returned ~$ 0.5B of Capital through Dividends/Buybacks ƒ Increase in Market Share ƒ Returned ~$ 0.1B of Capital through Dividends/Buybacks
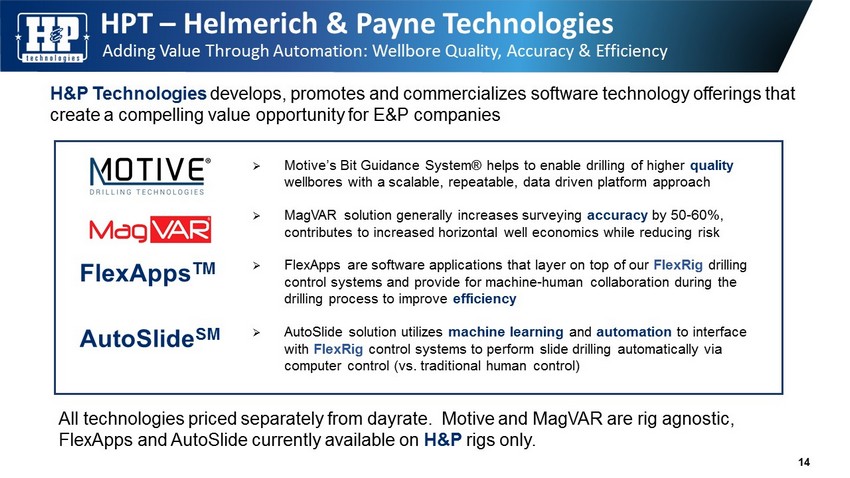
HPT – Helmerich & Payne Technologies Adding Value Through Automation: Wellbore Quality, Accuracy & Efficiency H&P Technologies develops, promotes and commercializes software technology offerings that create a compelling value opportunity for E&P companies 14 » Motive’s Bit Guidance System® helps to enable drilling of higher quality wellbores with a scalable, repeatable, data driven platform approach » MagVAR solution generally increases surveying accuracy by 50 - 60%, contributes to increased horizontal well economics while reducing risk » FlexApps are software applications that layer on top of our FlexRig drilling control systems and provide for machine - human collaboration during the drilling process to improve efficiency » AutoSlide solution utilizes machine learning and automation to interface with FlexRig control systems to perform slide drilling automatically via computer control (vs. traditional human control ) FlexApps TM AutoSlide SM All technologies priced separately from dayrate . Motive and MagVAR are rig agnostic, FlexApps and AutoSlide currently available on H&P rigs only.
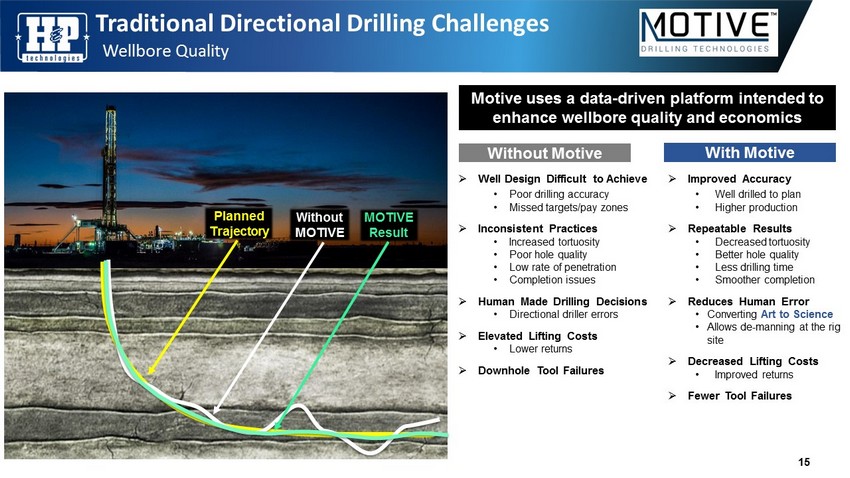
Planned Trajectory Without MOTIVE Traditional Directional Drilling Challenges » Well Design Difficult to Achieve • Poor drilling accuracy • Missed targets/pay zones » Inconsistent Practices • Increased tortuosity • P oor hole quality • Low rate of penetration • Completion issues » Human Made Drilling Decisions • Directional driller errors » Elevated Lifting Costs • Lower returns » Downhole Tool Failures MOTIVE Result » Improved Accuracy • Well drilled to plan • Higher production » Repeatable Results • Decreased tortuosity • Better hole quality • Less drilling time • Smoother completion » Reduces Human Error • Converting Art to Science • Allows de - manning at the rig site » Decreased Lifting Costs • Improved returns » Fewer Tool Failures Without Motive With Motive 15 Wellbore Quality Motive uses a data - driven platform intended to enhance wellbore quality and economics
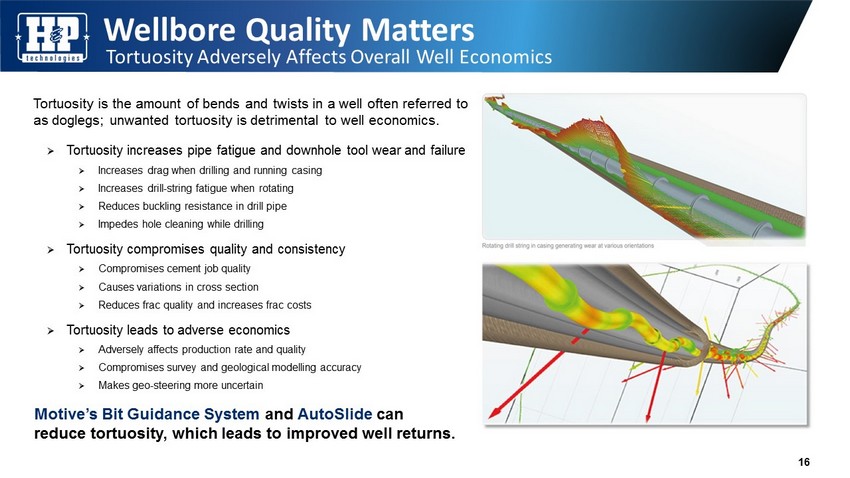
Wellbore Quality Matters Tortuosity Adversely Affects Overall Well Economics » Tortuosity increases pipe fatigue and downhole tool wear and failure » Increases drag when drilling and running casing » Increases drill - string fatigue when rotating » Reduces buckling resistance in drill pipe » Impedes hole cleaning while drilling » Tortuosity compromises quality and consistency » Compromises cement job quality » Causes variations in cross section » Reduces frac quality and increases frac costs » Tortuosity leads to adverse economics » Adversely affects production rate and quality » Compromises survey and geological modelling accuracy » Makes geo - steering more uncertain 16 Tortuosity is the amount of bends and twists in a well often referred to as doglegs; unwanted tortuosity is detrimental to well economics. Motive’s Bit Guidance System and AutoSlide can reduce tortuosity, which leads to improved well returns.
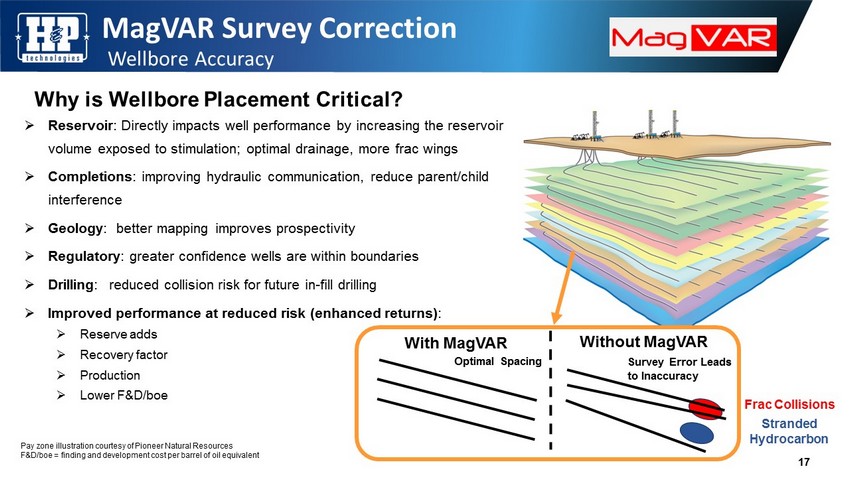
MagVAR Survey Correction » Reservoir : Directly impacts well performance by increasing the reservoir volume exposed to stimulation; optimal drainage, more frac wings » Completions : improving hydraulic communication, reduce parent/child interference » Geology : better mapping improves prospectivity » Regulatory : greater confidence wells are within boundaries » Drilling : reduced collision risk for future in - fill drilling » Improved performance at reduced risk (enhanced returns) : » Reserve adds » Recovery factor » Production » Lower F&D/ boe Pay zone illustration courtesy of Pioneer Natural Resources F&D/ boe = finding and development cost per barrel of oil equivalent With MagVAR Optimal Spacing Without MagVAR Survey Error Leads to Inaccuracy Frac Collisions Stranded Hydrocarbon Wellbore Accuracy 17 Why is Wellbore Placement Critical?
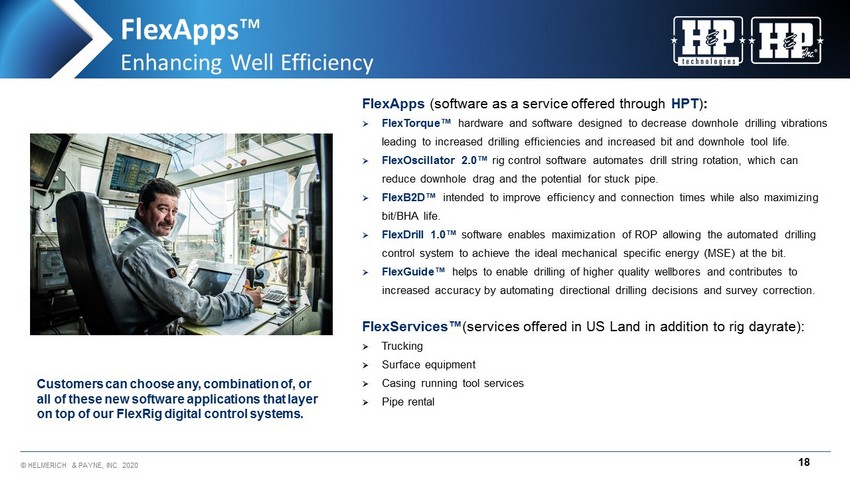
© HELMERICH & PAYNE, INC. 2020 FlexApps ™ FlexApps (software as a service offered through HPT ) : » FlexTorque ™ hardware and software designed to decrease downhole drilling vibrations leading to increased drilling efficiencies and increased bit and downhole tool life. » FlexOscillator 2.0™ rig control software automates drill string rotation, which can reduce downhole drag and the potential for stuck pipe . » FlexB2D™ intended to improve efficiency and connection times while also maximizing bit/BHA life . » FlexDrill 1.0™ software enables maximization of ROP allowing the automated drilling control system to achieve the ideal mechanical specific energy (MSE) at the bit. » FlexGuide ™ helps to enable drilling of higher quality wellbores and contributes to increased accuracy by automating directional drilling decisions and survey correction. FlexServices ™ (services offered in US Land in addition to rig dayrate ): » Trucking » Surface equipment » Casing running tool services » Pipe rental Enhancing Well Efficiency Customers can choose any, combination of, or all of these new software applications that layer on top of our FlexRig digital control systems. 18
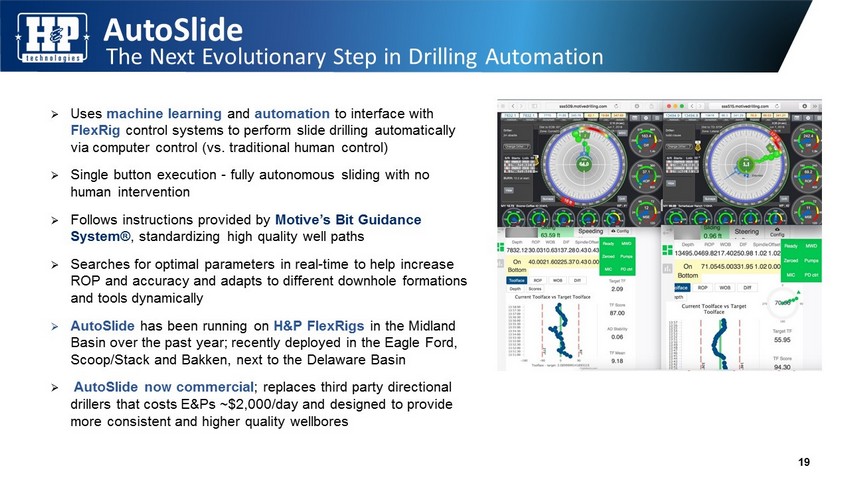
AutoSlide The Next Evolutionary Step in Drilling Automation » Uses machine learning and automation to interface with FlexRig control systems to perform slide drilling automatically via computer control (vs. traditional human control ) » Single button execution - fully autonomous sliding with no human intervention » Follows instructions provided by Motive’s Bit Guidance System ® , standardizing high quality well paths » Searches for optimal parameters in real - time to help increase ROP and accuracy and adapts to different downhole formations and tools dynamically » AutoSlide has been running on H&P FlexRigs in the Midland Basin over the past year; recently deployed in the Eagle Ford, Scoop/Stack and Bakken, next to the Delaware Basin » AutoSlide now commercial ; replaces third party directional drillers that costs E&Ps ~$2,000/day and designed to provide more consistent and higher quality wellbores 19
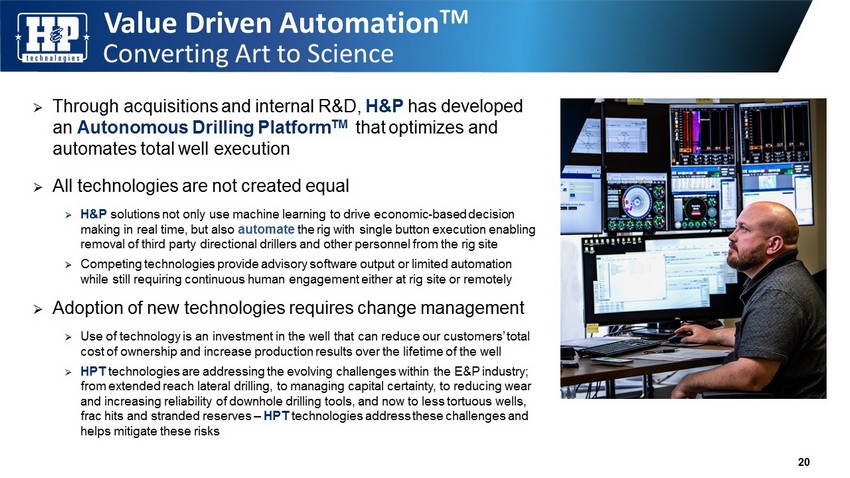
Value Driven Automation TM Converting Art to Science » Through acquisitions and internal R&D, H&P has developed an Autonomous Drilling Platform TM that optimizes and automates total well execution » All technologies are not created equal » H&P solutions not only use machine learning to drive economic - based decision making in real time, but also automate the rig with single button execution enabling removal of third party directional drillers and other personnel from the rig site » Competing technologies provide advisory software output or limited automation while still requiring continuous human engagement either at rig site or remotely » Adoption of new technologies requires change management » Use of technology is an investment in the well that can reduce our customers’ total cost of ownership and increase production results over the lifetime of the well » HPT t echnologies are addressing the evolving challenges within the E&P industry; from extended reach lateral drilling, to managing capital certainty, to reducing wear and increasing reliability of downhole drilling tools, and now to less tortuous wells, frac hits and stranded reserves – HPT technologies address these challenges and helps mitigate these risks 20
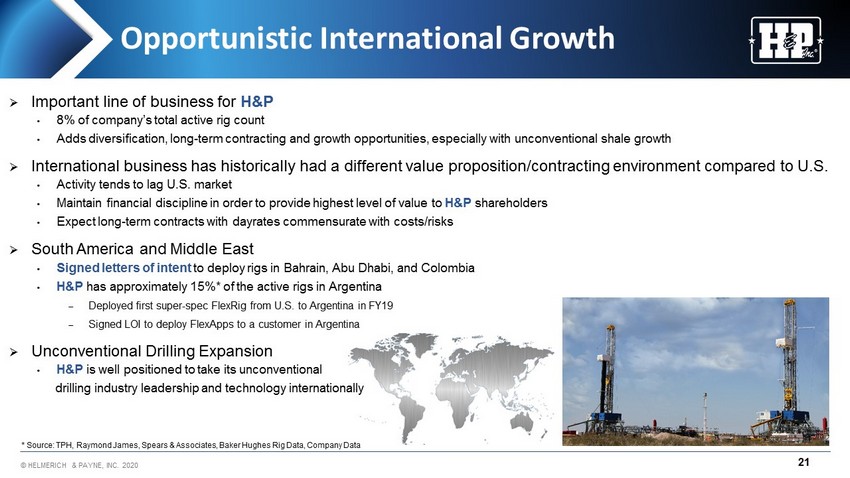
© HELMERICH & PAYNE, INC. 2020 » Important line of business for H&P • 8% of company’s total active rig count • Adds diversification, long - term contracting and growth opportunities, especially with unconventional shale growth » International business has historically had a different value proposition/contracting environment compared to U.S. • Activity tends to lag U.S. market • Maintain financial discipline in order to provide highest level of value to H&P shareholders • Expect long - term contracts with dayrates commensurate with costs/risks » South America and Middle East • Signed letters of intent to deploy rigs in Bahrain, Abu Dhabi, and Colombia • H&P has approximately 15%* of the active rigs in Argentina – Deployed first super - spec FlexRig from U.S. to Argentina in FY19 – Signed LOI to deploy FlexApps to a customer in Argentina » Unconventional Drilling Expansion • H&P is well positioned to take its unconventional drilling industry leadership and technology internationally Opportunistic International Growth * Source: TPH, Raymond James, Spears & Associates, Baker Hughes Rig Data, Company Data 21
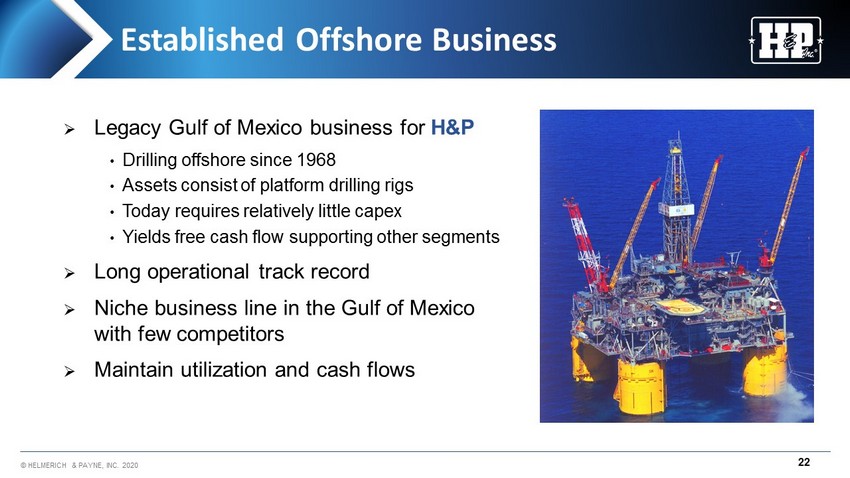
© HELMERICH & PAYNE, INC. 2020 Established Offshore Business » Legacy Gulf of Mexico business for H&P • Drilling offshore since 1968 • Assets consist of platform drilling rigs • Today requires relatively little capex • Yields free cash flow supporting other segments » Long operational track record » Niche business line in the Gulf of Mexico with few competitors » Maintain utilization and cash flows 22
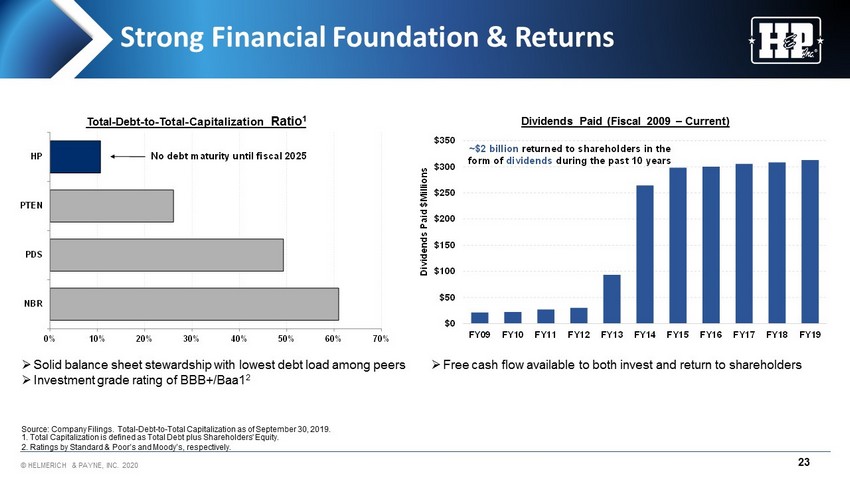
© HELMERICH & PAYNE, INC. 2020 Strong Financial Foundation & Returns Total - Debt - to - Total - Capitalization Ratio 1 Dividends Paid (Fiscal 2009 – Current) » Solid balance sheet stewardship with lowest debt load among peers » Investment grade rating of BBB+/Baa1 2 » Free cash flow available to both invest and return to shareholders 1. Total Capitalization is defined as Total Debt plus Shareholders' Equity. Source: Company Filings . Total - Debt - to - Total Capitalization as of September 30, 2019. 2. Ratings by Standard & Poor’s and Moody’s, respectively. 23 $0 $50 $100 $150 $200 $250 $300 $350 FY09 FY10 FY11 FY12 FY13 FY14 FY15 FY16 FY17 FY18 FY19 Dividends Paid $Millions ~$2 billion returned to shareholders in the form of dividends during the past 10 years 0% 10% 20% 30% 40% 50% 60% 70% NBR PDS PTEN HP No debt maturity until fiscal 2025
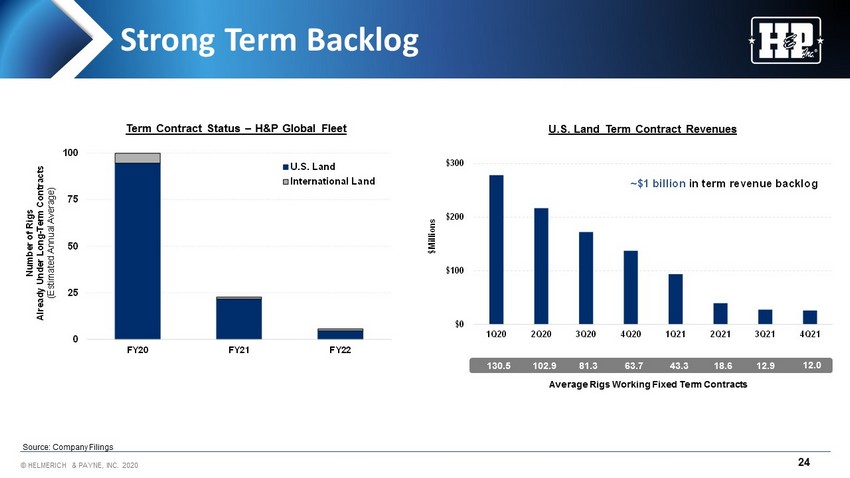
© HELMERICH & PAYNE, INC. 2020 130.5 Strong Term Backlog Term Contract Status – H&P Global Fleet U.S. Land Term Contract Revenues Source: Company Filings 24 Average Rigs Working Fixed Term Contracts 102.9 81.3 63.7 43.3 18.6 12.9 12.0 0 25 50 75 100 FY20 FY21 FY22 Number of Rigs Already Under Long - Term Contracts (Estimated Annual Average) U.S. Land International Land $0 $100 $200 $300 1Q20 2Q20 3Q20 4Q20 1Q21 2Q21 3Q21 4Q21 $Millions ~$1 billion in term revenue backlog
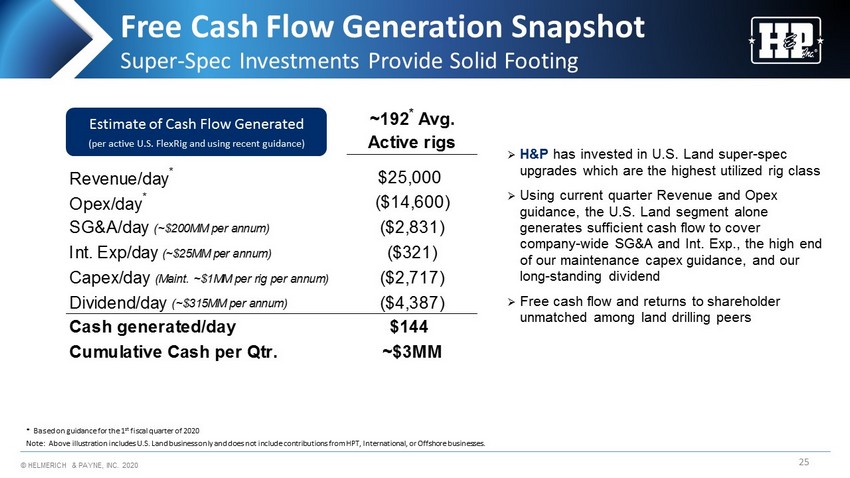
© HELMERICH & PAYNE, INC. 2020 Super - Spec Investments Provide Solid Footing Free Cash Flow Generation Snapshot 25 » H&P has invested in U.S. Land super - spec upgrades which are the highest utilized rig class » Using current quarter Revenue and Opex guidance, the U.S. Land segment alone generates sufficient cash flow to cover company - wide SG&A and Int. Exp., the high end of our maintenance capex guidance, and our long - standing dividend » Free cash flow and returns to shareholder unmatched among land drilling peers * Based on guidance for the 1 st fiscal quarter of 2020 Estimate of Cash Flow Generated (per active U.S. FlexRig and using recent guidance) Note: Above illustration includes U.S. Land business only and does not include contributions from HPT, International, or Off sho re businesses. ~192 * Avg. Active rigs Revenue/day * $25,500 Opex/day * ($14,600) SG&A/day (~$200MM per annum) ($2,831) Int. Exp/day (~$25MM per annum) ($354) Capex/day (Maint. ~$1MM per rig per annum) ($2,717) Dividend/day (~$315MM per annum) ($4,458) Cash generated/day $540 Cumulative Cash per Qtr. ~$10MM
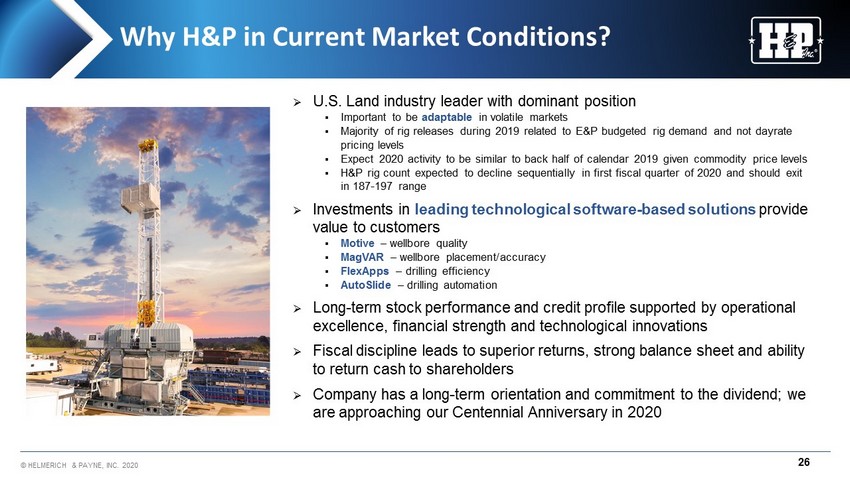
© HELMERICH & PAYNE, INC. 2020 Why H&P in Current Market Conditions? » U.S. Land industry leader with dominant position ▪ Important to be adaptable in volatile markets ▪ Majority of rig releases during 2019 related to E&P budgeted rig demand and not dayrate pricing levels ▪ Expect 2020 activity to be similar to back half of calendar 2019 given commodity price levels ▪ H&P rig count expected to decline sequentially in first fiscal quarter of 2020 and should exit in 187 - 197 range » Investments in leading technological software - based solutions provide value to customers ▪ Motive – wellbore quality ▪ MagVAR – wellbore placement/accuracy ▪ FlexApps – drilling efficiency ▪ AutoSlide – drilling automation » Long - term stock performance and credit profile supported by operational excellence, financial strength and technological innovations » Fiscal discipline leads to superior returns, strong balance sheet and ability to return cash to shareholders » Company has a long - term orientation and commitment to the dividend; we are approaching our Centennial Anniversary in 2020 26
Thank you for your interest in H&P. Our stock is traded on the NYSE, ticker symbol - HP For more information please visit our website at www.hpinc.com or contact: Dave Wilson, CFA, CPA Director of Investor Relations 918 - 588 - 5190, investor.relations@hpinc.com Helmerich & Payne, Inc.