Attached files
| file | filename |
|---|---|
| EX-32.2 - EX-32.2 - Twist Bioscience Corp | d65251dex322.htm |
| EX-32.1 - EX-32.1 - Twist Bioscience Corp | d65251dex321.htm |
| EX-31.2 - EX-31.2 - Twist Bioscience Corp | d65251dex312.htm |
| EX-31.1 - EX-31.1 - Twist Bioscience Corp | d65251dex311.htm |
| EX-23.1 - EX-23.1 - Twist Bioscience Corp | d65251dex231.htm |
| EX-21.1 - EX-21.1 - Twist Bioscience Corp | d65251dex211.htm |
Table of Contents
UNITED STATES
SECURITIES AND EXCHANGE COMMISSION
Washington, D.C. 20549
FORM 10-K
(Mark One)
| ☒ | ANNUAL REPORT PURSUANT TO SECTION 13 OR 15(d) OF THE SECURITIES EXCHANGE ACT OF 1934 |
For the fiscal year ended September 30, 2019
OR
| ☐ | TRANSITION REPORT PURSUANT TO SECTION 13 OR 15(d) OF THE SECURITIES EXCHANGE ACT OF 1934 |
For the transition period from to
Commission File Number: 001-38720

Twist Bioscience Corporation
(Exact Name of Registrant as Specified in its Charter)
| Delaware | 46-205888 | |
| (State or other jurisdiction of incorporation or organization) |
(I.R.S. Employer Identification No.) |
681 Gateway Blvd, South San Francisco, CA 94080
(Address of principal executive offices and zip code)
(800) 719-0671
(Registrant’s telephone number, including area code)
| Title of each class |
Trading Symbol(s) |
Name of each exchange on which registered | ||
| Common Stock | TWST | The Nasdaq Global Select Market |
Indicate by check mark if the Registrant is a well-known seasoned issuer, as defined in Rule 405 of the Securities Act. YES ☐ NO ☒
Indicate by check mark if the Registrant is not required to file reports pursuant to Section 13 or 15(d) of the Act. YES ☐ NO ☒
Indicate by check mark whether the Registrant: (1) has filed all reports required to be filed by Section 13 or 15(d) of the Securities Exchange Act of 1934 during the preceding 12 months (or for such shorter period that the Registrant was required to file such reports), and (2) has been subject to such filing requirements for the past 90 days. YES ☒ NO ☐
Indicate by check mark whether the Registrant has submitted electronically every Interactive Data File required to be submitted pursuant to Rule 405 of Regulation S-T (§232.405 of this chapter) during the preceding 12 months (or for such shorter period that the Registrant was required to submit and post such files). YES ☒ NO ☐
Indicate by check mark if disclosure of delinquent filers pursuant to Item 405 of Regulation S-K (§229.405) is not contained herein, and will not be contained, to the best of Registrant’s knowledge, in definitive proxy or information statements incorporated by reference in Part III of this Form 10-K or any amendment to this Form 10-K. ☒
Indicate by check mark whether the Registrant is a large accelerated filer, an accelerated filer, a non-accelerated filer, a smaller reporting company, or an emerging growth company. See the definitions of “large accelerated filer,” “accelerated filer,” “smaller reporting company” and “emerging growth company” in Rule 12b-2 of the Exchange Act. (Check one):
| Large accelerated filer | ☐ | Accelerated filer | ☐ | |||
| Non-accelerated filer | ☐ | Small reporting company | ☒ | |||
| Emerging growth company | ☒ | |||||
If an emerging growth company, indicate by check mark if the registrant has elected not to use the extended transition period for complying with any new or revised financial accounting standards provided pursuant to Section 13(a) of the Exchange Act. ☒
Indicate by check mark whether the Registrant is a shell company (as defined in Rule 12b-2 of the Exchange Act). YES ☐ NO ☒
As of March 29, 2019, the last business day of the registrant’s most recently completed second fiscal quarter, the aggregate market value of shares of common stock held by non-affiliates of the registrant was approximately $402 million.
The number of shares of the Registrant’s common stock outstanding as of December 9, 2019, was 33,118,096.
DOCUMENTS INCORPORATED BY REFERENCE
None.
Table of Contents
TWIST CORPORATION
ANNUAL REPORT ON FORM 10-K
FOR THE FISCAL YEAR ENDED SEPTEMBER 30, 2019
| Page | ||||||
| Item 1. |
2 | |||||
| Item 1A. |
19 | |||||
| Item 1B. |
53 | |||||
| Item 2. |
53 | |||||
| Item 3. |
53 | |||||
| Item 4. |
55 | |||||
| Item 5. |
56 | |||||
| Item 6. |
58 | |||||
| Item 7. |
Management’s discussion and analysis of financial condition and results of operations |
59 | ||||
| Item 7A. |
76 | |||||
| Item 8. |
77 | |||||
| Item 9. |
Changes in and disagreements with accountants on accounting and financial disclosure |
106 | ||||
| Item 9A. |
106 | |||||
| Item 9B. |
106 | |||||
| Item 10. |
107 | |||||
| Item 11. |
114 | |||||
| Item 12. |
Security ownership of certain beneficial owners and management and related stockholder matters |
122 | ||||
| Item 13. |
Certain relationships and related transactions, and director independence |
124 | ||||
| Item 14. |
126 | |||||
| Item 15. |
128 | |||||
| Item 16. |
130 | |||||
| 131 | ||||||
Table of Contents
Forward-looking statements
This Annual Report on Form 10-K for the fiscal year ended September 30, 2019, or Form 10-K, contains forward-looking statements within the meaning of Section 27A of the Securities Act of 1933, as amended, or the Securities Act, and Section 21E of the Securities Exchange Act of 1934, as amended, or the Exchange Act. The words “believe,” “will,” “may,” “estimate,” “continue,” “anticipate,” “intend,” “should,” “plan,” “expect,” “predict,” “could,” “potentially” and variations of such words and similar expressions are intended to identify such forward-looking statements, which may include, but are not limited to, statements concerning the following:
| • | our ability to increase our revenue and our revenue growth rate; |
| • | estimates of our expenses, future revenues, capital requirements and our needs for additional financing; our estimates of the size of our market opportunities; |
| • | our expectations regarding our ability to increase DNA production, reduce turnaround times and drive cost reductions for our customers; |
| • | our ability to effectively manage our growth; |
| • | our ability to successfully enter new markets and manage our international expansion; |
| • | our ability to protect our intellectual property, including our proprietary DNA synthesis platform; |
| • | costs associated with defending intellectual property infringement and other claims; |
| • | the effects of increased competition in our business; |
| • | our ability to keep pace with changes in technology and our competitors; |
| • | our ability to successfully identify, evaluate and manage any future acquisitions of businesses, solutions or technologies; |
| • | the success of our marketing efforts; |
| • | the potential purchases of common stock by certain of our existing stockholders and their affiliated entities, including stockholders who are associated with certain of our directors; |
| • | significant disruption in, or breach in security of our information technology systems and resultant interruptions in service and any related impact on our reputation; |
| • | the attraction and retention of qualified employees and key personnel; |
| • | the effects of natural or man-made catastrophic events; |
| • | the effectiveness of our internal controls; |
| • | changes in government regulation affecting our business; |
| • | the impact of adverse economic conditions; and |
| • | other risk factors included under the section titled “Risk Factors.” |
You should not rely upon forward-looking statements as predictions of future events. Such statements are based on management’s expectations as of the date of this filing and involve many risks and uncertainties that could cause our actual results, events or circumstances to differ materially from those expressed or implied in our forward-looking statements. Such risks and uncertainties include those described throughout this report and particularly in the sections entitled “Risk factors” and “Management’s discussion and analysis of financial condition and results of operations.” Given these risks and uncertainties, readers are cautioned not to place undue reliance on such forward-looking statements. Readers are urged to carefully review and consider all of the information in this Form 10-K and in other documents we file from time to time with the Securities and Exchange Commission, or SEC. We undertake no obligation to update any forward-looking statements made in
1
Table of Contents
this Form 10-K to reflect events or circumstances after the date of this filing or to reflect new information or the occurrence of unanticipated events, except as required by law. We may not actually achieve the plans, intentions or expectations disclosed in our forward-looking statements. Our forward-looking statements do not reflect the potential impact of any future acquisitions, mergers, dispositions, joint ventures or investments we may make.
When we use the terms “Twist,” “Twist Bioscience,” the “Company,” “we,” “us” or “our” in this report, we are referring to Twist Bioscience Corporation and its consolidated subsidiaries unless the context requires otherwise. Sequencespace and the Twist logo are trademarks of Twist Bioscience Corporation. All other company and product names may be trademarks of the respective companies with which they are associated.
| Item 1. | Business |
At Twist Bioscience Corporation, we work in service of customers who are changing the world for the better. In fields such as health care, agriculture, industrial chemicals, academic research and data storage, by using our synthetic DNA tools, our customers are developing ways to better lives and improve the sustainability of the planet. We believe that the faster our customers succeed, the better for all of us, and we believe Twist Bioscience is uniquely positioned to help accelerate their efforts.
We have developed a disruptive DNA synthesis platform to industrialize the engineering of biology that provides DNA for a wide range of uses and markets. The core of our platform is a proprietary technology that pioneers a new method of manufacturing synthetic DNA by “writing” DNA on a silicon chip. We have miniaturized traditional chemical DNA synthesis reactions to write over one million short pieces of DNA on each silicon chip, approximately the size of a large mobile phone. We have combined our silicon-based DNA writing technology with proprietary software, scalable commercial infrastructure and an e-commerce platform to create an integrated technology platform that enables us to achieve high levels of quality, precision, automation, and manufacturing throughput at a significantly lower cost than our competitors.
We have applied our unique technology to manufacture a broad range of synthetic DNA-based products, including synthetic genes, tools for next generation sample preparation, and antibody libraries for drug discovery and development, all designed to enable our customers to conduct research more efficiently and effectively. Additionally, we are expanding our footprint by harnessing our proprietary platform to disrupt and innovate within larger market opportunities, such as discovery partnerships for biologic drugs, and new applications for synthetic DNA, such as digital data storage, to expand the overall reach and impact of DNA-based products. We sell our synthetic DNA and synthetic DNA-based products to a global customer base of 1,305 customers across a broad range of industries.
DNA is the fundamental building block of biology. The ability to design DNA and engineer biology, a field known as synthetic biology, is growing rapidly, and we believe this field represents one of the most exciting areas of growth and technological innovation in the 21st century. The ability to modify DNA to improve health and the sustainability of the planet is leading to a broad range of applications for synthetic DNA and synthetic DNA-based products across multiple industries, including:
| • | healthcare for the identification, prevention, diagnosis and treatment of disease (antibody discovery and optimization technology); |
| • | industrial chemicals for cost-effective and sustainable production of new and existing specialty chemicals and materials, such as spider silk, nylon, rubber, fragrances, food flavors and food additives; |
| • | agriculture for more effective and sustainable crop production; |
| • | academic research for a broad range of applications; and |
| • | technology for potential use as an alternative long-term data storage medium. |
2
Table of Contents
Background
The synthetic biology market is growing rapidly and is being fueled by increased access to affordable and innovative tools that enable new applications. We believe this is analogous to the trends seen in the next generation sequencing, or NGS, market, where declining costs of sequencing drove adoption, new applications and market expansion. Similarly, tools that combine advanced production technology with modern digital technology and software capabilities, such as our DNA synthesis platform, are driving growth and market creation for synthetic DNA and synthetic DNA-based products. According to BCC Research, in calendar year 2017, the market for synthetic biology products was approximately $4.4 billion and is expected to grow to $13.9 billion by calendar year 2022. We believe this period of accelerated growth in the synthetic biology industry is in its early stages.
The applications of our DNA synthesis platform are broad. We currently generate revenue through two primary product lines: synthetic biology tools and next generation sequencing tools. In addition, we are leveraging the versatility of our platform to expand our portfolio to include other synthetic DNA-based products and address additional market opportunities, including vertical market opportunities in biological drug discovery and development and digital data storage.
In April 2016, we launched the first applications of our platform, synthetic genes and high diversity collections of oligonucleotides, or oligo pools, to disrupt the gene synthesis market and make legacy DNA synthesis methods obsolete. We believe that the traditional DNA synthesis methods used by our competitors are inherently limited in scalability and are not optimized to satisfy the rapidly growing demand for high-quality, low-cost synthetic DNA. Our silicon-based chip technology can increase DNA production by a factor of 9,600 on a footprint like that of traditional DNA synthesis methods. Also, it significantly lowers the volume of required reagents, specifically the most expensive reagent by a factor of 1,000,000, and improves the precision of the synthesis process relative to legacy methods. This enables us to produce high-quality synthetic DNA on a much larger scale and at lower cost than competitors. Importantly, it is this platform that can be applied to multiple market opportunities to harness the power of DNA—from next generation sequencing to drug discovery to data storage—to enable life-changing products and therapeutic medicines.
In February 2018, we launched an innovative and comprehensive sample preparation kit for next generation sequencing. Our kit leverages our platform to precisely synthesize short pieces of DNA called probes, and thus uniformly amplify the desired target DNA segments, considerably improving the accuracy of the downstream sequencing analysis, saving both time and sequencing costs. We have expanded our NGS offering to include both general and customized tools in addition to adding the mouse exome. In addition, we have formatted our NGS tools to work within an automated and advanced workflow.
Our currently marketed products target the synthetic DNA market, a sub-segment of the synthetic biology market, and NGS sample preparation, a large adjacent market opportunity. We estimate that the combined market opportunity was $1.8 billion in calendar year 2016. Based on market research, we believe that current estimates understate our market potential because they reflect the costly, time-consuming, and cumbersome nature of legacy DNA synthesis technologies. We believe our solution has the potential to materially expand our initial market by providing end users access to high-quality and lower cost tools, encouraging adoption and facilitating new applications for our products.
As part of our synthetic biology offering, we have commercialized a custom DNA library solution which we believe can be leveraged to facilitate other proprietary tools to provide an end-to-end solution in biologics drug discovery and early development, from target to investigational new drug, or IND, application, adding value as a partner to biotechnology and pharmaceutical companies.
In fiscal year 2019 we served 1,305 customers and reported $54.4 million in revenue including $21.9 million to the industrial chemicals sector, $17.4 million to the healthcare sector, $13.8 million to the academic research
3
Table of Contents
sector and $1.2 million to the agricultural sector. The industrial chemicals segment includes sales of $9.2 million to Ginkgo Bioworks (which we believe is the largest purchaser of synthetic DNA).
We generated revenues of $54.4 million in fiscal 2019, $25.4 million in fiscal 2018 and $10.8 million in fiscal 2017, while incurring net losses of $107.7 million, $71.2 million and $59.3 million in fiscal years 2019, 2018 and 2017, respectively. Since our inception, we have incurred significant operating losses. Our ability to generate product revenue sufficient to achieve profitability will depend heavily on the success of our existing products and development and commercialization of additional products in the synthetic biology industry.
Our headquarters and manufacturing facilities are located in South San Francisco, California. As of September 30, 2019, we had 414 full-time employees worldwide, including three locations in the San Francisco Bay Area and an international location in Tel Aviv, Israel. We also utilize a team of 32 dedicated commercial consultants across the European Union and the United Kingdom and 18 dedicated commercial consultants across Asia. In May 2018, we received private funding to establish production facilities and commercial operations in China for the manufacture of the back end of our NGS product line. We expect to establish back-end production facilities to expand our commercial market for our Next Generation Sequencing (NGS) product line in China. We expect this site will be open by the end of December 2019. This site will be used to ensure Asian customers receive products in a timeframe similar to other parts of the world. Our advanced front-end manufacturing facilities to create our synthetic DNA products will remain in the United States and subject to comprehensive patent protection in key jurisdictions. Twist will continue to use our best practice biosecurity screening program in servicing the China market, a part of the world that is dominated by foreign actors that we do not believe have rigorous biosecurity screening measures.
Through September 30, 2019, we have raised a total of $444.4 million in net proceeds from public and private funding. Specifically, we have raised $290.5 million in net proceeds from the sale of redeemable convertible preferred stock from January 2016 through July 2018, and a total of $153.9 million in net proceeds from the sale of stock, including $84.3 million in net proceeds from our public offering in May 2019 and $69.6 million in net proceeds from our initial public offering in October 2018.
Our Markets
The synthetic biology industry
Our initial suite of products serve the field of synthetic biology, which is undergoing an era of rapid innovation and transformation. Synthetic biology is the engineering of biology to build new biological systems or re-design existing biological systems. The ability to design DNA and engineer biology is creating advances and benefits for a broad and growing range of applications for synthetic DNA and synthetic DNA-based products across multiple industries, including:
| • | healthcare for the discovery and production of new therapeutics and molecular diagnostics; |
| • | industrial chemicals for cost-effective and sustainable production of new and existing specialty chemicals and materials, such as spider silk, nylon, rubber, fragrances food flavors and food additives; |
| • | agriculture for more effective and sustainable crop production; |
| • | academic research for a broad range of applications; and |
| • | technology for potential use as an alternative long-term data storage medium. |
According to BCC Research, the overall market for synthetic biology products was approximately $4.4 billion in calendar year 2017 and is expected to grow to over $13.9 billion by calendar year 2022. This industry momentum creates a significant opportunity for us to grow within our existing markets as well as expand our product offering.
Synthetic DNA is the fundamental building block of synthetic biology. Users of synthetic biology can design synthetic DNA to regulate the production of these proteins and molecules to achieve a specific functional
4
Table of Contents
purpose. While synthetic DNA has been produced for more than 40 years, the complexities of biology and the production constraints inherent in legacy processes have historically limited the applications and market opportunities for DNA synthesis.
Limitations of existing solutions
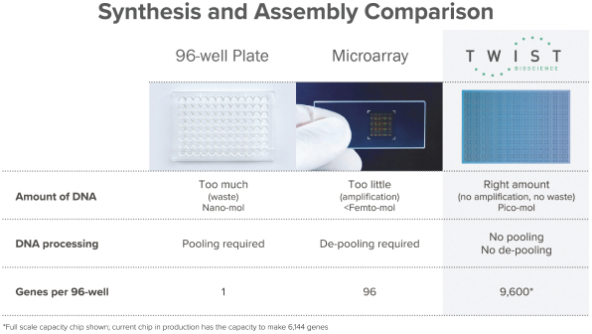
Traditional methods of DNA synthesis consist of a two-step process that initially involves the synthesis of oligonucleotides, also referred to as oligos, which are short strands of DNA. These oligos are then combined to create longer strands of DNA. Currently, there are two primary methodologies used by others to create synthetic DNA, the 96-well plate method and the microarray method, each having production limitations that we believe make these technologies sub-optimal to satisfy the rapidly growing demand for synthetic DNA. In addition, because the synthesis of oligos can introduce errors in the sequence order, all DNA synthesis methods require a process called cloning to produce many identical copies of a strand of DNA, such as a clonal gene. Today, all of our competitors use one of these two primary methods of DNA synthesis and require cloning for clonal genes.
96-well plate method of DNA synthesis
Introduced as early as the 1950s, a 96-well plate is a flat plastic plate, roughly the size of two smartphones, with eight rows of 12 wells that are used as small test tubes. Instead of creating one sequence of DNA at a time in a single test tube, the 96-well plate allows researchers to create 96 oligos in parallel, one in each well. While this process successfully achieves DNA synthesis, it requires high volumes of phosphoramidites, an expensive raw material, as well as other ancillary reagents. It also produces excessive amounts of the final product, significantly more than is required for most subsequent processes, resulting in material that is discarded and an unnecessary expense. Additionally, this process is not scalable to produce high volumes, as approximately 100 oligos are needed to assemble one gene and therefore only one gene can be made from each 96-well plate.
Microarray method of DNA synthesis
Unlike a 96-well plate, a microarray is a flat surface made of plastic or glass on which DNA is synthesized directly in an array of discrete locations. Microarrays allow large numbers of oligos to be synthesized in parallel, increasing DNA production by up to four orders of magnitude when compared to the 96-well plate. However, while this method can make 100 genes in parallel, it remains difficult to scale, requires many steps, and results in significant waste of materials.
Cloning
Cloning is a tedious process to filter out errors and produce many identical copies of a strand of DNA, such as a gene. While the cloning process results in a precise sequence, it is incredibly slow and labor intensive and generally takes around 10 business days to complete. As a result, it is time consuming, expensive, and, in many cases, not an efficient use of researchers’ time. In general, more accurate DNA synthesis technology results in fewer errors in the sequence order and reduces the time and costs required or allocated to the cloning process.
Our platform
We developed the Twist Bioscience DNA synthesis platform to address the limitations of throughput, scalability, and cost inherent in legacy DNA synthesis methods. Our platform stems from extensive analyses of, and improvements to, the existing gene synthesis and assembly workflows. Our core technologies combine expertise in silicon, software, fluidics, chemistry, and motion and vision control to miniaturize thousands of parallel chemical reactions on silicon and write thousands of strands of DNA in parallel. With a footprint that is similar to the size of a 96-well plate that produces one gene, we are able to produce 9,600 genes in parallel. Based on current production needs, we have intentionally designed our latest chip to make 6,144 genes in parallel, but we have the current capability to increase this to 9,600 genes, as needed. We have combined our DNA synthesis
5
Table of Contents
technology with propriety software and a scalable commercial infrastructure to create our vertically integrated DNA synthesis platform capable of delivering very large volumes of high-quality synthetic DNA at low cost.
Next Generation Sequencing Market
Our next generation sequencing (NGS) product line improves the work of our customers within large and growing markets. NGS has transformed many markets in recent years by changing the landscape of diagnosing disease and disorders to offer a path to prevention or treatment of disease. Some of the markets impacted by NGS include: oncology, reproductive health, agriculture, consumer genomics, infectious disease research and drug discovery. As NGS technology improved and the cost of sequencing declines, new emerging markets that were once considered impractical, such as population-scale sequencing and single cell sequencing, have become major areas of interest and investment.
Historically, a significant constraint in many NGS applications has been the high cost and long turnaround time of oligonucleotide production. Highly accurate and reproducible oligonucleotide production is required to produce high quality target enrichment data. Traditionally, the lack of options for oligonucleotide production forced researchers to choose between using less precise methods or to reduce the number of samples in their study.
The ability of the Twist DNA synthesis platform to precisely manufacture target enrichment probes at large scale has dramatically increased the types of projects that can now be addressed using NGS technologies. Our platform has unlocked new applications, improved data quality, and dramatically expanded the types of scientific questions that can be answered using NGS. In addition, the speed of our DNA synthesis platform enables customers to quickly deploy NGS technologies to applications where the time to answer is critical.
Our products
We have developed multiple products derived from synthetic DNA and our versatile DNA synthesis technology. Our current offering consists of two primary product lines that address different needs of our customers across a variety of applications: synthetic genes, oligo pools, next generation sequencing tools and DNA libraries.
6
Table of Contents
Synthetic Biology Products
Synthetic genes
Synthetic genes are manufactured strands of DNA. Customers order our synthetic genes to conduct a wide range of research, including product development for the healthcare, agricultural, and industrial chemical industries as well as a multitude of applications within academic research. Virtually all research and development requires trial and error, and our customers require many variations of genes to find the DNA sequence that achieves their objectives.
We offer two primary categories of synthetic genes: genes of perfect quality, clonal genes, in a vehicle to carry the DNA, also called a vector, and genes of near-perfect quality, non-clonal genes or fragments, that customers can place in their own vector. Within these two categories, customers can order different lengths of DNA depending on their required final gene construct. Customers can order longer genes or shorter genes and can stitch genes together to create longer or shorter constructs if desired.
Clonal genes in a Twist Bioscience or customer vector
Our premier gene synthesis offering delivers clonally perfect genes. For our clonally perfect genes, we perform the cloning on behalf of our customers and deliver DNA in either a customer-supplied vector or a Twist Bioscience vector. Customer-supplied vectors greatly simplify downstream work for our customers, allowing them to take our genes and pass them directly into their workflows. We have also developed a catalog of our own specific vectors. Currently, we manufacture genes of up to 5,000 base pairs in length, yielding a clonally perfect piece of DNA that our customers can immediately use for their research. We offer turnaround times of approximately 11 – 17 business days for clonal genes. Our standard pricing for clonal DNA is $0.09 per base pair for genes between 300 and 1,800 bps in length.
Non-clonal genes
Non-clonal genes serve customers who prefer to conduct their own cloning protocols or that do not need, or want, to pay for perfect quality genes. We offer non-clonal genes of up to 1,800 base pairs in length, which we believe addresses the vast majority of demand for non-clonal genes. We offer turnaround times of six to nine business days for non-clonal genes, with what we believe is the lowest industry error rate of 1:3000 base pairs. Our standard pricing for non-clonal genes is $0.07 per base pair.
Oligonucleotide (Oligo) pools
Oligo pools, or high diversity collections of oligonucleotides, are utilized in many applications, including targeted next generation sequencing, or NGS, CRISPR gene editing, mutagenesis experiments, DNA origami (the nanoscale folding of DNA to create two- and three-dimensional shapes at the nanoscale), DNA computing and data storage in DNA, among others. Our oligo pools are also used for high-throughput reporter assays that are used to study cell signaling pathways, gene regulation, and the structure of cell regulatory elements. For these applications, we provide customers with accurate and uniform synthetic oligos to precisely match their required designs.
We sell a diverse, customizable set of oligo pools, ranging from a few hundred oligos to over one million and offer oligonucleotides of up to 300 nucleotides in length with an error rate of 1:2000 nucleotides and turnaround times beginning at five days. In the future, we expect to offer cloned pools, and a sub-pooling capability which will allow our customers to purchase lower complexity pools and arrayed pools.
Oligo pools for CRISPR gene editing
CRISPR is a recently discovered gene editing tool that has become an area of significant research focus, especially in drug development, and is a rapidly growing application that is contributing to growing demand for
7
Table of Contents
our oligo pools. In the CRISPR editing process, a short sequence of RNA called guide-RNA (gRNA) binds to its target DNA sequence in a host cell, indicating to an enzyme where to cut and edit the DNA. In order to conduct gene editing research, many single guide-RNA must be created. Researchers can use oligo pools for CRISPR gene editing to silence, through editing, DNA locations. This process creates an error at a particular location in the DNA of the cell, rendering that location unusable, in other words silenced. By studying the relationship between silenced regions and change in phenotype (did the disease get worse or better), researchers can find the genomic regions important to the disease and identify targets for therapeutics. Similar to our standard oligo pools, we offer oligo pools for CRISPR screening with a diverse and customizable set of specifications, including pool sizes ranging from a few hundred oligos to over one million. From oligo produced on a single silicon chip, researchers can edit up to 1,000,000 DNA locations. We currently offer oligo pools for CRISPR screening of up to 300 nucleotides in length, which in each oligo, allows for two guide-RNAs. As such, where previously researchers could study one region at a time, with the ability to create double guide-RNA pools, there is now the ability to study two regions simultaneously, which has the potential to expand the knowledge of a particular target or disease as well as the underlying biology.
Gene pools
The growth of the synthetic biology industry continues to see incredible innovation and new applications facilitated by unlimited access to the building blocks of research, including synthetic DNA at unprecedented scale. Where previously researchers worked in individual workflows with one gene in one tube, the explosion of biological information provides new opportunities to work in massively parallel workflows to exponentially accelerate the rate and scope of research. Gene pools are similar to oligo pools, but provide multiple genes within one test tube. Designed with the flexibility to have up to 180,000 genes in a single tube at an affordable price, we introduced gene pools in October 2019 as part of our new Twist Innovation Lab that continues to drive toward products that enable customers to innovate at the pace of today’s research and truly change the world for the better.
Next generation sequencing (NGS) tools
We recently expanded the application of our DNA synthesis technology to develop products targeted at the large next generation sequencing market, or NGS. In particular, we are focused on addressing the demand for better sample preparation products that improve sequencing workflow, increase sequencing accuracy, and lower sequencing costs. Using our silicon-based DNA synthesis platform, we are able to synthesize the exact sequences of interest. In the target enrichment process, our synthetic DNA probes “enrich” bind the sequence of interest within the sample in order to isolate and physically extract the targeted segment of DNA.
The ability of the probes to bind to the target segment of interest impacts the ability to capture the correct DNA from the sample, which is subsequently sequenced. Though many factors can influence the efficiency of such capture, a primary consideration is how well the DNA sequence of the probe matches the target (sequence complementarity), as this affects both the efficiency and selectivity of capture. Our target enrichment capture probes are unique in the enrichment market as they consist of double stranded DNA. During the melt step the probes unwind, becoming two independent probes of complementary sequence. When the genome fragments unwind, both strands are captured independently. Each genome fragment can be sequenced twice. Also, with some genomic fragments, one of the two strands may be difficult to capture due to unfavorable sequence composition, as in some cancer mutations. By using double stranded probes, capture efficiency can be maximized as there are multiple opportunities to capture a single fragment. Data shows that uniform synthesis of probes is important for downstream productivity. Because we synthesize each probe individually, our solution allows genome fragments to be captured uniformly.
The targeted segment of DNA can then be copied uniformly prior to NGS analysis by our customers, yielding a larger volume of targeted segments in the sample used for sequencing. Because we are able to precisely target, extract, and uniformly amplify the target DNA segments, our solution considerably improves the accuracy of the
8
Table of Contents
downstream sequencing analysis. This enables our customers to perform fewer sequencing runs per sample, without sacrificing accuracy, saving them time and money.
Our NGS products are primarily used for diagnostic testing, research for population genetics and biomarker discovery, translational research, microbiology and applied markets. Our customers are primarily diagnostic companies and hospitals, research institutions, agricultural biotechnology companies, and consumer genetics companies conducting diagnostic tests for a wide range of applications.
In addition to our DNA probes, we have created a comprehensive sample preparation kit that combines these probes for NGS target enrichment with all the reagents and consumables necessary to process a sample into sequencing-ready material. This improves the NGS library preparation workflow and is a cost-effective solution that reduces sequencing costs, improves time to results, enhances sequencing coverage, and provides quality control on every DNA probe. Each of our NGS tool products include our individually synthesized DNA probes.
ISO Certification
In January 2019, our quality management systems for manufacturing our NGS Target Enrichment Panels in our Mission Bay San Francisco offices received ISO 9001:2015 and 13485:2016 certifications, the latter for medical device applications. In addition to continuing to provide NGS tools to our current customer base, we now have the ability to support customers in more regulated markets that require ISO certification from their key reagent suppliers. We anticipate obtaining these certifications for our new facility in South San Francisco in the first quarter of the calendar year 2020.
Human Core Exome Kit
A human genome is incredibly complex. Genes (the parts of the genome that encode proteins) are fragmented, scattered across the genome and surrounded by other DNA. That other DNA is required for maintaining the genome’s integrity, for controlling each gene’s expression, and in some instances, its function still remains a mystery. A researcher’s aim in an exome sequencing experiment is to isolate the DNA sequences from a genomic sample containing only the protein coding regions called the exome. Only 1% of a human genome contains gene encoding regions, yet around 85% of genetic mutations known to cause disease occur in the exome. By isolating just these regions, the amount of genomic DNA that needs to be sequenced to get meaningful data about a disease can be lowered. Exome sequencing provides an important “first pass” screen for mutations.
The Twist Human Core Exome Kit includes the library preparation and enrichment components of the NGS sample preparation process for the entire known coding region of the genome for known inherited disease. Compared to traditional capture methods, our kit allows researchers to increase sample throughput, and achieve a higher depth of coverage across target regions with uncompromising quality.
Library Prep Kits
In addition to the complete human exome, we offer kits to accommodate a wide range of DNA. Sometimes DNA samples are degraded and need special materials to enhance the extraction of the DNA, particularly when the input sample is low quality.
Fixed Panels
We offer a suite of products that have specific probes to address specific needs. We sell the Human RefSeq Panel to complement the Human Core Exome Kit. We sell the Pan-Viral Panel that contains over 1,000 viral human pathogens for rapid identification in various settings and the Mouse Exome Panel with the most current content in the industry.
9
Table of Contents
FastHyb
A key step in the sample preparation process is hybridization. This is the process whereby the probes are mixed with the genomic sample and then the target DNA is extracted. This step often takes many hours and can even take days, and is an important rate-limiting step in the sample preparation process. With our FastHyb solution, customers can complete the hybridization step in as little as 15 minutes, enabling the sample to be moved through the workflow and onto the sequencing step in a single day.
In our FastHyb and Wash Kit, the probes are mixed with the genomic sample and then heated to above 95°C to melt the base pair interactions in the double-stranded genomic DNA, forming a pool of single stranded DNA. Bringing the temperature down allows the genomic DNA to start to form back into complementary double stranded molecules. As the probes are designed to be complementary with the exome, they will also form base pair interactions with the genomic DNA.
Drug and Target Discovery Solutions
DNA libraries
DNA libraries are collections of DNA fragments that are primarily used by pharmaceutical companies during antibody discovery and development. During the drug discovery phase, a pharmaceutical company typically has a biological target or function of interest. In order to find antibodies that best bind to that target in a specific region of a gene and deliver a therapeutic effect, it may be necessary to test many variants of an antibody. Synthetic DNA libraries become useful in this process, as they produce customized, controllable groups of antibodies from specific DNA sequences to run through assays that assess function, toxicity and binding affinity.
Traditionally, pharmaceutical companies have generated antibody libraries through a process called “random mutagenesis.” This uses a technique called polymerase chain reaction (PCR) mutagenesis, where PCR is used to introduce many sequence errors, or variations, within the copies of the antibody. While this generates many different antibody variants, the changes are entirely random and are unknown until the antibody DNA is sequenced. In addition, because of the random approach, there is no guarantee that the resulting antibodies will target the desired region of interest.
Our platform allows customers to customize every antibody variation and construct a precise library systematically to target the entire region of interest. We can create single site libraries in which we change one single amino acid (which is encoded by a group of three DNA nucleobases) within the sequence or single site saturation libraries in which we change every amino acid within the sequence for a more comprehensive approach. We can also generate combinatorial libraries in which we introduce changes to multiple sites within the same gene in specific ratios and combinations. These libraries can be used for antibody engineering, affinity maturation, and humanization, which simplifies downstream screening and identifies more lead molecules. Our libraries are explicitly developed for a specific area of the genome or tailored to a specific disease, with antibody compounds evenly represented across all areas of the genome desired.
To support our efforts to add further value for our customers and potential partners, we have developed a comprehensive antibody optimization solution to enable simultaneous optimization of multiple characteristics of a given antibody. We have developed custom software for the optimization of antibody hits, antibody compounds that meet pre-specified criteria for therapeutic development. We have added our high throughput and hyper-variant antibody library capabilities to create a comprehensive antibody optimization solution for potential partners. We are now using this solution to design, build and test hyper-variant, tightly controlled antibody libraries that follow the rules of the human repertoire and mitigate the pitfalls associated with traditional optimization methods. By following the rules of the human repertoire, which means including only DNA sequences known to occur in humans, these libraries will be natural in composition and are expected to generate better drug development candidates. The libraries also have a large degree of synthetic variation, enabling simultaneous optimization of several antibody characteristics and the discovery of antibodies with high affinity and specificity to drug targets.
10
Table of Contents
Additionally, we are leveraging our ability to rapidly generate custom libraries to discover novel therapeutic antibodies against biological targets that have traditionally been difficult for biological drug development. We have developed a proprietary antibody library targeting a major class of proteins known as GPCRs. GPCRs are important receptors that control and drive the biology of nearly all disease classes, including inflammation, cancer, metabolism, respiratory, and pain. According to a recent publication in Molecular Pharmacology, approximately 700 approved therapeutics target GPCRs, representing approximately 35% of all approved drugs. However, they remain a difficult class of targets for antibody development due to the lack of exposed protein surfaces to bind. We have created a series of single domain antibody libraries. Single domain antibody libraries are antibody fragments that are much smaller than a whole antibody. Where a whole antibody is composed of two heavy chains and two light chains, single domain antibodies are engineered from the heavy chain antibodies and are also called VHH fragments. These fragments are small and modular antibodies that are both stable and robust for potentially faster discovery and development.
Using our proprietary libraries, we have identified three different functional antibodies to the GLP1R receptor, an important target in type 2 diabetes and also Parkinson’s and Alzheimer’s diseases. We may partner with other technology providers to advance development of our antibody discovery efforts. We expect to continue to develop additional libraries for screening and selection of other biological therapeutic targets such as ion channels and membrane-based transporters.
We believe we have several avenues available to monetize our antibody discovery program. For example, we anticipate that successful discovery of a novel therapeutic antibody against any single GPCR target would attract significant partnership interest from academic institutions as well as biotechnology and pharmaceutical companies given the difficult nature of this class of antibody targets. These partnerships may include upfront, milestone and royalty payments to us for access to our GPCR library.
Collaboration with LakePharma
In April 2019, we announced a strategic collaboration with LakePharma to offer antibody discovery and development solutions to pharmaceutical and biotechnology customers. Under the terms of the agreement, LakePharma will have the ability to offer Twist’s proprietary antibody discovery and optimization platforms to their existing and future biopharmaceutical customers as part of their service offerings. One such Twist platform that may be offered is for discovery of novel therapeutic antibodies against a major class of protein drug targets known as GPCRs, which traditionally have been difficult for biologics drug development. GPCRs have been heavily investigated due to their involvement in multiple disease classes, including inflammation, cancer, metabolism, respiratory, and pain. In return, we may offer our customers access to LakePharma’s integrated discovery and development services. Each of we and LakePharma will share with each other a percentage of certain revenues generated from customers who purchase services as a result of the collaboration.
Antibody Optimization Service for Pandion
In April 2019, we announced a new collaboration with Pandion Therapeutics, to apply our antibody optimization platform to the targeting arm of a bispecific antibody. The initial project required Twist to improve the affinity of an oncology bispecific antibody across multiple species for optimal preclinical testing, which was completed successfully. Based on that success, we are now working to optimize two additional antibodies for Pandion.
Our target markets
Our currently marketed product offering addresses a market opportunity that was approximately $1.8 billion in calendar year 2016. We believe our solution has the potential to materially expand our initial market by providing end-users with access to high-quality and lower cost tools, encouraging adoption and facilitating new applications for our products, such as pharmaceutical biologics drug discovery and digital data storage in DNA.
11
Table of Contents
Synthetic DNA market
We believe that our current market opportunity for synthetic DNA was approximately $1.3 billion in calendar year 2016. The market consists of those who buy DNA, or DNA Buyers, and those who make their own DNA, or DNA Makers. Driven by access to more affordable and high-quality synthetic DNA, we believe that there is a strong trend of DNA Makers converting to DNA Buyers. According to BCC Research, the size of the DNA Buyer market in 2016 was approximately $300 million and is growing at a rate of approximately 20% annually as existing DNA Buyers develop new uses for synthetic DNA and existing DNA Makers convert to DNA Buyers. We estimate our market opportunity in the DNA Maker market to be approximately $950 million. Our market estimate is based on the market sizes for products used in manual DNA synthesis, including the cloning and restriction digestion enzyme market in 2016, according to a report on Molecular Biology by Markets and Markets.
NGS sample preparation market
Our NGS sample preparation kits address the demand for better sample preparation products that improve the sequencing workflow, increase sequencing accuracy and lower sequencing costs. We offer kits consisting of double-stranded DNA probes and a comprehensive target enrichment kit that are used for exome sequencing and custom targeted sequencing. Kalorama Information, a division of marketresearch.com, estimates the market for sample preparation for next generation sequencing was approximately $500 million in calendar year 2016 and growing at approximately 20% annually.
In addition, we believe we have an opportunity to convert customers using single nucleotide polymorphism arrays, or SNP arrays, to a workflow that uses Twist products for library preparation and target capture with sequencing on the NovaSeq platform. We believe this workflow can be less expensive than running DNA microarrays for SNP analysis and we intend to continue to enable this conversion.
SNP arrays are used extensively in the consumer DNA testing space as well as the agricultural biotech market. In the agricultural market, SNP arrays are used to genotype chicken, beef, salmon and other food products. We believe that together, these SNP array market segments represent a total market opportunity of $500 million. We do expect it to take time to penetrate this area of the market as the shift in workflow is substantial, though it could result in richer genotyping data at an attractive price per point compared to SNP arrays.
Pharmaceutical biologics drug discovery
We believe we are uniquely positioned to capture a larger portion of the drug discovery value chain given that our synthetic DNA products are already used by our pharmaceutical partners throughout the drug development process. As part of our effort in this market, we recently launched our custom DNA library solution which facilitates biologic drug discovery and development. We are already in agreement with a top three pharmaceutical company by revenue to supply our custom DNA libraries instead of them producing their own. In addition to our custom DNA libraries, we are also developing other proprietary tools, such as a wholly-owned GPCR library and an antibody optimization solution, that we believe will enable us to provide an end-to-end solution in biologics drug discovery and early development, from target to investigational new drug, or IND, application, and adding value as a partner to biotechnology and pharmaceutical companies. These partnerships may include upfront, milestone and royalty payments.
Digital data storage in DNA
Due to the explosion of data across many industries, finding efficient means of storage has become more important. Through the Semiconductor Research Corporation, many leading semiconductor companies, including Microsoft Corporation, IBM Corporation, Micron Technology, Inc., Autodesk Inc., Mentor Graphics Corporation and GlobalFoundries Inc., are exploring DNA as a data storage medium. We have strategic relationships with
12
Table of Contents
Microsoft Corporation and the University of Washington through which we have demonstrated the feasibility of storing data on DNA and the unique benefits of longevity, density, and universality of this format. We believe that in three to five years, new DNA technologies and cost efficiencies could surpass mature information technology hardware solutions to allow data storage in DNA to become cost competitive with traditional storage media and enable us to target several large markets within data storage. The market for digital data storage is more than $35 billion and we believe DNA can address several segments within this market.
Our growth strategy
Our objective is to be the leading provider of synthetic DNA and DNA-based products worldwide and to leverage the versatility of our platform to build a leadership position in other synthetic DNA-based product markets in which we have a competitive advantage. We intend to accomplish this objective by executing on the following:
| • | Maintain and expand our position as the provider of choice for high-quality, affordable synthetic genes and DNA to customers across multiple industries; |
| • | Become a leading supplier of NGS sample preparation products; |
| • | Conduct antibody therapeutic discovery and optimization for our current customers and future partners; |
| • | Continue to explore development of DNA as a digital data storage medium via internal research and government and industry partnerships; and |
| • | Expand our global presence. |
Beyond these opportunities, we are working with industry partners to create new markets for our products by leveraging the versatility of our platform.
Sales and marketing
We have built a versatile and scalable commercial platform that enables us to reach a diverse customer base that we estimate consists of over 100,000 synthetic DNA users, and many additional potential customers of our NGS library preparation products today. In order to address this diverse customer base, we have employed a multi-channel strategy comprised of a direct sales force targeting synthetic DNA customers, a direct sales force focusing on the NGS market and an e-commerce platform that serves both commercial channels. Our sales force is focused on customer acquisition, support, and management across industries, and is highly trained on both the technical aspects of our platform and how synthetic DNA can be used in a wide range of industries. Our easy-to-use e-commerce platform allows customers to design, validate, and place on-demand orders of customized DNA online, and enable them to receive real-time customized quotes for their products and track their order status through the manufacturing and delivery process. This is a critical part of our strategy to address our large market and diverse customer base, as well as drive commercial productivity, enhance the customer experience, and promote loyalty. We target customers of our NGS products through a direct sales team focused on the NGS tools market and which is separate from our synthetic DNA sales force. Our direct NGS sales representatives are focused on supporting our early adopters and providing a high level of service in order to familiarize customers with our product offering.
We sell our products through a worldwide selling organization that includes direct sales personnel, commercial consultants in Europe, Asia and China, an ecommerce platform and distributors. As of September 30, 2019, we employed 121 people in sales, marketing and customer support. We have three distributors in the Americas and 13 distributors in the rest of the world. Sales to distributors accounted for less than 5% of revenues in fiscal 2019.
In fiscal 2019, 66% of sales were derived from the United States, 27% from Europe and the Middle East, 3% from China, 2% from the rest of the Asia Pacific region, and 2% from Canada and Mexico. For financial information about geographic areas for each of our last three fiscal years, see Note 15, “Geographic and product
13
Table of Contents
information”, to the Notes to Consolidated Financial Statements in Item 8 of this Annual Report on Form 10-K, which information is incorporated by reference into this Item 1. For a discussion of the risks attendant to our foreign operations, see Item 1A, “Risk Factors-Our international operations expose us to material risks,” which information is incorporated by reference into this Item”.
Research and development
Our research and development expenses were $35.7 million in fiscal 2019, $20.3 million in fiscal 2018, and $19.2 million in fiscal 2017. As of September 30, 2019, we employed 100 people in engineering and research and development activities.
We are engaged in ongoing research and development efforts focused on enhancements to existing products and the development of new products. Currently, we are pursuing research and development projects with respect to the following:
| • | Process development for higher quality oligos; |
| • | Optimization, automation and miniaturization of gene and NGS pipelines; |
| • | Silicon process and chemistry development for our data storage initiative; |
| • | Building a massively parallel screening facility for our pharma initiatives that allows us to screen over a dozen antibody phage display campaigns per week; and |
| • | Expansion of our product offering for oligo, gene and NGS products |
Research and development activities are conducted in collaboration with manufacturing activities to help expedite new products from the development phase to manufacturing and to more quickly implement new process technologies. From time to time, our research and development efforts have included participation in technology collaborations with universities and research institutions.
Patents and other intellectual property rights
As of September 30, 2019, we own 14 issued U.S. patents and 3 issued international patents in China and 1 in Taiwan. There are 149 pending patent applications, including 48 in the United States, 91 international applications and 10 applications filed under the Patent Cooperation Treaty. We rely on a combination of patent rights, copyrights and trade secrets to protect the proprietary elements of our products. Our policy is to file patent applications to protect technology, inventions and improvements that are important to our business.
Manufacturing and facilities
The production of our products is a highly complex and precise process. Twist has approximately 9,000 square feet of manufacturing space, approximately 10,000 square feet of research and development space and approximately 41,000 square feet of office space located at our headquarters in South San Francisco, California. We currently manufacture all of our products and multiple sub-assemblies at these facilities. As of September 30, 2019, we had 102 full-time employees dedicated to manufacturing our synthetic genes, oligo pools and NGS tools and creating our DNA libraries.
All of our products originate from synthetic DNA obtained from nanostructured clusters fabricated on our proprietary silicon technology platform. Due to its on-demand nature, the gene synthesis business requires manufacturing operations to be in operation 24 hours a day, seven days a week, 365 days per year. For synthetic
14
Table of Contents
genes, we have built a highly scalable gene production process with what we believe is industry-leading capacity of approximately 45,000 genes per month to address the growing demand of scalable, high-quality, affordable synthetic genes.
In addition to synthetic genes, we are combining nanostructured clusters into oligo pools. If our production was dedicated entirely to the oligos, we currently have the capacity to produce more than 20 million high-quality oligos per month that can be combined into high-precision oligo pools of various sizes. The pooling process has been fully automated through a mixture of custom proprietary and over-the-counter liquid handling equipment. We are currently only utilizing approximately two thirds of this production capacity for synthetic genes and oligos. We intend to increase our shipments to leverage our production capacity through our e-commerce platform, which we believe will expand both our market opportunity and our customer base.
The manufacturing process for our NGS tools is highly flexible and scalable and requires minimal fixed costs and direct labor given the efficiency of our production capability. We have automated the entire workflow using proprietary and over-the-counter laboratory equipment. We have built dedicated production capabilities for our NGS products.
We take substantial measures to safeguard our intellectual property and keep our advanced and proprietary technology within the United States. We have kept and will maintain all front-end advanced technology in the United States. To support the rapidly growing Asian genomics and NGS markets, we are in the process of establishing a production site in China for the back-end manufacturing of the Next Generation Sequencing product line incorporating the same rigorous biosecurity screening system as our other sites. Our advanced front-end manufacturing facilities to create our synthetic DNA products will remain in the United States as well as the accompanying IP. We believe that structuring our manufacturing in this manner will allow us to offer comparable delivery times for customers in the Asian market. This also brings our industry-leading biosecurity screening program into the Asian market, allows us to protect ourselves from potential export tariffs in both countries, while simultaneously allowing us to protect our intellectual property and to satisfy the needs of our customers.
Over time, to further improve our production process, we intend to outsource various sub-assemblies to third-party manufacturers.
We initially certified our Quality Management System (QMS) to the ISO 9001:2000 standard and in 2019 updated our certification to ISO 9001:2008. ISO is an internationally recognized standard for quality management systems. Subsequent audits by the registrar have been and will continue to be carried out at regular intervals to ensure we are maintaining our system in compliance with ISO standards. Recertification is required every three years and we have been successfully recertified since obtaining our original ISO certification. Also, we have our QMS certified to the ISO 13485:2012 Quality Management Standard and the Canadian Medical Devices Regulation (CMDR). These standards include a special set of requirements specifically related to the supply of medical devices and related services. Additionally, we manufacture to current FDA “Good Manufacturing Practice” requirements and our QMS is implemented in accordance with FDA Quality System Regulations (21 CFR 820).
Supply chain
We have historically purchased many of the components and raw materials used in our products from numerous suppliers worldwide. For reasons of quality assurance, sole source availability or cost effectiveness, certain components and raw materials used in the manufacture of our products are available only from one supplier. We have worked closely with our suppliers to develop contingency plans to assure continuity of supply while maintaining high quality and reliability, and in some cases, we have established long-term supply contracts with our suppliers. In the event that we are unable to obtain sufficient quantities of raw materials or components on commercially reasonable terms or in a timely manner, our ability to manufacture our products on a timely and
15
Table of Contents
cost-competitive basis may be compromised, which may have a material adverse effect on our business, financial condition and results of operations.
Competition
The synthetic biology industry is intensely competitive and is characterized by price competition, technological change, international competition, product turnaround time and manufacturing yield problems. The competitive factors in the market for our products include:
| • | price; |
| • | product quality, reliability and accuracy; |
| • | product offering & complexity; |
| • | turnaround time; |
| • | breadth of product line; |
| • | design and introduction of new products; |
| • | market acceptance of our products and those of our customers; |
| • | throughput and scale; |
| • | technical support and service. |
Regarding these factors, we face competition from a broad range of providers of core synthetic biology products such as GenScript Biotech Corporation, GENEWIZ (owned by Brooks Automation), Integrated DNA Technologies, Inc. (owned by Danaher), DNA 2.0 Inc. d/b/a/ ATUM, GeneArt (owned by Thermo Fisher Scientific Inc.), Eurofins Genomics LLC, Sigma-Aldrich Corporation (an indirect wholly owned subsidiary of Merck & Company), Promega Corporation, OriGene Technologies, Inc., Blue Heron Biotech, LLC and others. Additionally, we compete with both large and emerging providers in the life sciences tools and diagnostics industries focused on sample preparation for next generation sequencing such as Thermo Fisher Scientific Inc., Illumina, Inc., Integrated DNA Technologies, Inc., Agilent Technologies, Inc., and Roche NimbleGen, Inc. In the antibody discovery market, we compete with clinical research organizations, such as LakePharma (mouse hybridoma, llama immune libraries, XOMA phage display library) and Aldevron, LLC (genetic mouse immunization coupled with hybridoma), and antibody discovery biotechnology companies, such as Iontas (human phage display libraries, human phage display library focused on ion channels), Adimab (human synthetic yeast display libraries), and Distributed Bio (human synthetic phage display library, lead optimization libraries). In the field of DNA digital data storage, we compete with Catalog Technologies, Inc., ETH Zurich, Helixworks, Iridia, Inc., North Shore Bio and Roswell.
Employees
At September 30, 2019, we employed 414 employees, of whom 100 were primarily engaged in engineering and research and development activities, 121 in marketing, sales and customer support, 146 in operations and manufacturing and 47 in general and administration. Of these employees, 320 hold engineering or science degrees, including 69 Ph.D.’s.
Seasonality
Over the years, we have experienced a pattern, although not consistently, of our third-quarter revenue growth being lower than revenue growth in other quarters due to a decrease in demand from Ginkgo Bioworks during such quarter and recent revenue fluctuations in our NGS tools. As we continue to grow our NGS tools, our revenue may fluctuate from quarter to quarter. As our European business becomes a larger percentage of our revenues, we anticipate reduced revenue in our fourth quarter due to the seasonal slowdown at our customers’ European facilities caused by summer vacations and European holiday schedules.
16
Table of Contents
Government regulation
The synthetic biology industry and our current product portfolio is largely unregulated by governmental bodies such as the FDA. Our products are also not intended to be components or incorporated into our customers’ products. Rather, our synthetic DNA products enable our customers to develop a wide spectrum of commercial products, some of which may require governmental approval. If a customer’s product requires governmental approval, as would be the case with the development of medical diagnostics and therapeutic drugs, it is the customer who seeks and obtains the required governmental approval to commercialize those products. However, in the future we may be subject to a variety of specialized regulatory requirements, including potential regulation by the FDA, any of which could have a material effect on the business.
“Research Use Only,” or ROU, is a term limited to our target enrichment products for the next-generation sequencing market and is specifically applied only to kits sold to this market segment, and is intended to restrict use of the kits to non-in vitro diagnostic purposes. The RUO label is not affixed to any other products. Our NGS target enrichment and library preparation products are used in a more comprehensive workflow for next generation sequencing. It is this larger workflow that can become an in vitro diagnostic, after undergoing the appropriate regulatory processes. As noted above, our NGS products target a market opportunity for NGS sample preparation that was approximately $500 million in calendar year 2016 and growing at approximately 20% annually, according to market research provided by Kalorama Information, a division of marketresearch.com. This market estimate represents the NGS target enrichment products which are limited solely to the RUO component of target enrichment and library preparation and does not include the full in vitro diagnostic workflow.
While most of the current laws and regulations concerning synthetic biology relate to the end products produced using synthetic biology, this may change. For example, in December 2010, the Presidential Commission for the Study of Bioethical Issues recommended that the federal government oversee, but not regulate, synthetic biology research. The Presidential Commission also recommended that the federal government lead an ongoing review of developments in the synthetic biology field and that the federal government conduct a reasonable risk assessment before the field release of synthetic organisms.
While we and our subsidiaries maintain regulatory compliance practices, we rely on our customers’ compliance with laws and regulations applicable to the products they produce. We do not independently monitor whether our customers comply with applicable laws and regulations.
FDA
Pursuant to its authority under the Federal Food, Drug, and Cosmetic Act, or the FDC Act, the FDA has jurisdiction over medical devices. The FDA regulates, among other things, the research, testing, manufacturing, safety, labeling, storage, recordkeeping, premarket clearance or approval, marketing and promotion and sales and distribution of medical devices in the United States to ensure that medical products distributed domestically are safe and effective for their intended uses. In addition, the FDA regulates the import and export of medical devices.
The FDC Act classifies medical devices into one of three categories based on the risks associated with the device and the level of control necessary to provide reasonable assurance of safety and effectiveness. Devices deemed by the FDA to pose the greatest risk, such as life-sustaining, life-supporting or implantable devices, or devices deemed not substantially equivalent to a previously 510(k) cleared devices are categorized as Class III. These devices typically require submission and approval of a Premarket Approval Application, or PMA. Devices deemed to pose lower risk are categorized as either Class I or II. Class II classification usually requires the manufacturer to submit to the FDA a premarket notification submission requesting clearance of the device for commercial distribution in the United States pursuant to Section 510(k) of the FDC Act, referred to as 510(k) clearance. Most Class I devices are exempt from this requirement, as are some lower risk Class II devices. When
17
Table of Contents
a 510(k) is required, the manufacturer must submit to the FDA a premarket notification submission demonstrating that the device is “substantially equivalent” to: (i) a device that was legally marketed prior to May 28, 1976, for which PMA approval is not required, (ii) a legally marketed device that has been reclassified from Class III to Class II or Class I, or (iii) another legally marketed, similar device that has been cleared through the 510(k) process.
In vitro diagnostics, or IVDs, are a category of medical devices that include reagents, instruments, and systems intended for use in diagnosis of disease or other conditions, including a determination of the state of health, in order to cure, mitigate, treat, or prevent disease or its sequelae. IVDs are intended for use in the collection, preparation, and examination of specimens taken from the human body. A research use only, or RUO, IVD product is an IVD product that is in the laboratory research phase of development. As such, an RUO IVD is not intended for use in clinical investigations or in clinical practice. Such RUO products do not require premarket clearance or approval from the FDA, provided that they be labeled “For Research Use Only. Not for use in diagnostic procedures” pursuant to FDA regulations.
As presently contemplated, none of our IVD products are intended for clinical or diagnostic use, and we market them to academic institutions, life sciences and clinical research laboratories that conduct research, and biopharmaceutical and biotechnology companies for non-diagnostic and non-clinical purposes. Our current IVD products are marketed and labeled as RUO, and are provided to our customers solely for their internal research use. Accordingly, we believe that our current IVD products are subject only to limited regulation with respect to labeling by the FDA, and we have not sought clearance or approval from the FDA to market our products.
In November 2013, the FDA issued final guidance indicating that merely including the RUO labeling statement will not necessarily render the device exempt from FDA premarket clearance, approval, or other regulatory requirements if the totality of circumstances surrounding the distribution of the product indicate that the manufacturer intended its IVDs for diagnostic use. Such circumstances may include, but are not limited to, the product’s advertising, labeling, or promotion, or the manufacturer’s assistance of a clinical laboratory in validating or verifying a test that incorporates products labeled RUO. We do not believe any of these circumstances apply to our current product portfolio.
While we believe that none of our current IVD products require FDA approval or clearance, we may in the future develop and commercialize a subset of our products or related applications that could become subject to additional regulation by the FDA. If we market our products for use in performing clinical diagnostics, thus subjecting them to additional regulation by the FDA, including premarket and post market control as medical devices, we would be required to obtain either prior 510(k) clearance or prior pre-market approval from the FDA before commercializing the product, unless an exemption applies.
International sales of medical devices are subject to foreign government regulations, which vary substantially from country to country. Outside of the European Union, or EU, regulatory approval needs to be sought on a country-by-country basis in order to market medical devices.
FSAP
The federal Centers for Disease Control and Prevention and the Animal and Plant Health Inspection Service administer requirements of the Federal Select Agent Program, or FSAP. FSAP requirements govern possession, use, and transfer of biological select agents and toxins that have the potential to pose a severe threat to public, animal or plant health or to animal or plant products. It is our policy generally not to produce or otherwise work with material that is subject to FSAP requirements.
Export controls
Some sequences we produce may be subject to licensing requirements for export outside of the United States under the U.S. Export Administration Regulations (EAR).
18
Table of Contents
Given the evolving nature of our industry, legislative bodies or regulatory authorities may adopt additional regulation or expand existing regulation to include our service. Changes to the current regulatory framework, including the imposition of additional or new regulations, could arise at any time, and we may be unable to obtain or maintain comparable regulatory approval or clearance of our service, if required. These regulations and restrictions may materially and adversely affect our business, financial condition, and results of operations.
Available information
Our corporate website address is www.twistbioscience.com. We use the investor relations page of our website for purposes of compliance with Regulation FD and as a routine channel for distribution of important information, including news releases, analyst presentations, financial information and corporate governance practices. Our filings with the SEC are posted on our website and available free of charge as soon as reasonably practical after they are electronically filed with, or furnished to, the SEC. The SEC’s website, www.sec.gov, contains reports, proxy statements and other information regarding issuers that file electronically with the SEC. The content on any website referred to in this Form 10-K is not incorporated by reference in this Form 10-K unless expressly noted. Further, the Company’s references to website URLs are intended to be inactive textual references only.
| Item 1A. | Risk factors |
The following discussion of risk factors contains forward-looking statements. These risk factors may be important to understanding other statements in this Annual Report on Form 10-K. The following information should be read in conjunction with Part II, Item 7, “Management’s discussion and analysis of financial condition and results of operations” and the consolidated financial statements and related notes in Part II, Item 8, “Consolidated financial statements and supplementary data” of this Form 10-K.
The business, financial condition and operating results of the Company can be affected by a number of factors, whether currently known or unknown, including but not limited to those described below, any one or more of which could, directly or indirectly, cause the Company’s actual financial condition and operating results to vary materially from past, or from anticipated future, financial condition and operating results. Any of these factors, in whole or in part, could materially and adversely affect the Company’s business, financial condition, operating results and stock price.
Because of the following factors, as well as other factors affecting the Company’s financial condition and operating results, past financial performance should not be considered to be a reliable indicator of future performance, and investors should not use historical trends to anticipate results or trends in future periods.
Risks related to our business
We are an early stage company with a limited operating history, which may make it difficult to evaluate our current business and predict our future performance.
We were incorporated in February 2013 and began commercial operations in April 2016. Prior to engaging in commercial operations, we focused on research and development of DNA synthesis. Our revenues for the fiscal years ended September 30, 2019, 2018 and 2017, were $54.4 million, $25.4 million and $10.8 million, respectively. We may never achieve commercial success, and we have limited historical financial data upon which we may base our projected revenue. We also have limited historical financial data upon which we may base our planned operating expense or upon which you may evaluate our business and our prospects. Based on our limited experience in developing and marketing new products, we may not be able to effectively:
| • | drive adoption of our products; |
| • | attract and retain customers for our products; |
19
Table of Contents
| • | anticipate and adapt to changes in the existing and emerging markets in which we operate; |
| • | focus our research and development efforts in areas that generate returns on these efforts; |
| • | maintain and develop strategic relationships with suppliers to acquire necessary materials and equipment for the production of our products on appropriate timelines, or at all; |
| • | implement an effective marketing strategy to promote awareness of our products with potential customers; |
| • | scale our manufacturing activities to meet potential demand at a reasonable cost; |
| • | avoid infringement of third-party intellectual property; |
| • | obtain licenses on commercially reasonable terms to third-party intellectual property, as needed; |
| • | obtain valid and enforceable patents that give us a competitive advantage; |
| • | protect our proprietary technology; |
| • | provide appropriate levels of customer training and support for our products; and |
| • | attract, retain and motivate qualified personnel. |
In addition, a high percentage of our expenses have been and will continue to be fixed. Accordingly, if we do not generate revenue as and when anticipated, our losses may be greater than expected and our operating results will suffer. You should consider the risks and difficulties frequently encountered by companies like ours in new and rapidly evolving markets when making a decision to invest in our common stock.
We have incurred net losses in every period to date, and we expect to continue to incur significant losses as we develop our business and may never achieve profitability.
We have incurred net losses each year since inception and have generated limited revenue from product sales to date. We expect to incur increasing costs as we grow our business. We cannot be certain if or when we will produce sufficient revenue from our operations to support our costs. Even if profitability is achieved, we may not be able to sustain profitability. We incurred net losses of $107.7 million, $71.2 million and $59.3 million for the years ended September 30, 2019, 2018 and 2017, respectively. As of September 30, 2019, we had an accumulated deficit of $318.5 million. We expect to incur substantial losses and negative cash flow for the foreseeable future. We may incur significant losses in the future for a number of reasons, many of which are beyond our control, including the other risks described in this Form 10-K, the market acceptance of our products, future product development, and our market penetration and margins.
We will require additional financing to achieve our goals, and a failure to obtain this necessary capital when needed on acceptable terms, or at all, could force us to delay, limit, reduce or terminate our product manufacturing and development and other operations.
Since our inception, substantially all of our resources have been dedicated to the development of our DNA synthesis platform and our sample preparation kit for next generation sequencing, or NGS. We believe that we will continue to expend substantial resources for the foreseeable future as we expand into additional markets we may choose to pursue, including pharmaceutical biologics drug discovery and digital data storage in DNA. These expenditures are expected to include costs associated with research and development, manufacturing and supply as well as marketing and selling existing and new products. In addition, other unanticipated costs may arise.
We expect that our existing cash and cash equivalents will be sufficient to fund our planned operating expenses, capital expenditure requirements and debt service payments through at least the next 12 months. However, our operating plan may change as a result of factors currently unknown to us, and we may need to seek additional funds sooner than planned, through public or private equity or debt financings or other sources, such as strategic
20
Table of Contents
collaborations. Such financing may result in dilution to stockholders, imposition of debt covenants and repayment obligations, or other restrictions that may adversely affect our business. In addition, we may seek additional capital due to favorable market conditions or strategic considerations even if we believe we have sufficient funds for our current or future operating plans.
Our future capital requirements depend on many factors, including:
| • | the number and characteristics of any additional products or manufacturing processes we develop or acquire to serve new or existing markets; |
| • | the scope, progress, results and costs of researching and developing future products or improvements to existing products or manufacturing processes; |
| • | the cost of manufacturing our DNA synthesis equipment and tools, our NGS sample preparation kits, and any future products we successfully commercialize; |
| • | our ability to establish and maintain strategic collaborations, licensing or other arrangements and the financial terms of such agreements; |
| • | the costs of expanding our sales and marketing capabilities in the United States and in other geographies, including China; |
| • | any lawsuits related to our products or commenced against us, including the costs associated with our current litigation with Agilent Technologies, Inc. (Agilent); |
| • | the expenses needed to attract and retain skilled personnel; |
| • | the costs associated with being a public company; |
| • | the costs involved in preparing, filing, prosecuting, maintaining, defending and enforcing patent claims, including litigation costs and the outcome of such litigation; and |
| • | the timing, receipt and amount of sales of, or royalties on, any future approved products, if any. |
Additional funds may not be available when we need them, on terms that are acceptable to us, or at all. If adequate funds are not available to us on a timely basis, we may be required to:
| • | delay, limit, reduce or terminate our manufacturing, research and development activities; or |
| • | delay, limit, reduce or terminate our establishment of sales and marketing capabilities or other activities that may be necessary to generate revenue and achieve profitability. |
If we are unable to maintain adequate revenue growth or do not successfully manage such growth, our business and growth prospects will be harmed.
We have experienced significant revenue growth in a short period of time. We may not achieve similar growth rates in future periods. Investors should not rely on our operating results for any prior periods as an indication of our future operating performance. To effectively manage our anticipated future growth, we must continue to maintain and enhance our manufacturing, sales, financial and customer support administration systems, processes and controls. Failure to effectively manage our anticipated growth could lead us to over-invest or under-invest in development, operational, and administrative infrastructure; result in weaknesses in our infrastructure, systems, or controls; give rise to operational mistakes, losses, loss of customers, productivity or business opportunities; and result in loss of employees and reduced productivity of remaining employees.
Our continued growth could require significant capital expenditures and might divert financial resources from other projects such as the development of new products and services. As additional products are commercialized, we may need to incorporate new equipment, implement new technology systems, or hire new personnel with different qualifications. Failure to manage this growth or transition could result in turnaround time delays, higher
21
Table of Contents
manufacturing costs, declining product quality, deteriorating customer service, and slower responses to competitive challenges. A failure in any one of these areas could make it difficult for us to meet market expectations for our products, and could damage our reputation and the prospects for our business.
If our management is unable to effectively manage our anticipated growth, our expenses may increase more than expected, our revenue could decline or grow more slowly than expected and we may be unable to implement our business strategy. The quality of our products may suffer, which could negatively affect our reputation and harm our ability to retain and attract customers.
The estimates of market opportunity and forecasts of market growth included in this Form 10-K may prove to be inaccurate, and even if the market in which we compete achieves the forecasted growth, our business could fail to grow at similar rates, if at all.
Market opportunity estimates and growth forecasts are subject to significant uncertainty and are based on assumptions and estimates that may not prove to be accurate. For example, several of the reports rely on discussions with industry thought leaders, employ projections of future applications of synthetic biology and next generation sequencing technology in major end-user market segments and by technology type, and incorporate data from secondary sources such as company websites as well as industry, trade and government publications. The estimates and forecasts in this Form 10-K relating to the size and expected growth of our market may prove to be inaccurate. Even if the market in which we compete meets the size estimates and growth forecasted in this Form 10-K, our business could fail to grow at the rate we anticipate, if at all.
Our quarterly and annual operating results and cash flows have fluctuated in the past and might continue to fluctuate, causing the value of our common stock to decline substantially.
Numerous factors, many of which are outside our control, may cause or contribute to significant fluctuations in our quarterly and annual operating results. These fluctuations may make financial planning and forecasting difficult. In addition, these fluctuations may result in unanticipated decreases in our available cash, which could negatively affect our business and prospects. In addition, one or more of such factors may cause our revenue or operating expenses in one period to be disproportionately higher or lower relative to the others. As a result, comparing our operating results on a period-to-period basis might not be meaningful. You should not rely on our past results as indicative of our future performance. Moreover, our stock price might be based on expectations of future performance that are unrealistic or that we might not meet and, if our revenue or operating results fall below the expectations of investors or securities analysts, the price of our common stock could decline substantially.
Our operating results have varied in the past. As a result, our operating results could be unpredictable, particularly on a quarterly basis. In addition to other risk factors listed in this section, some of the important factors that may cause fluctuations in our quarterly and annual operating results are further described in “Risk factors—Risks relating to owning our stock.”
In addition, a significant portion of our operating expense is relatively fixed in nature, and planned expenditures are based in part on expectations regarding future revenue. Accordingly, unexpected revenue shortfalls might decrease our gross margins and could cause significant changes in our operating results from quarter to quarter. If this occurs, the trading price of our common stock could fall substantially.
If we are unable to attract new customers and retain and grow sales from our existing customers, our business will be materially and adversely affected.
In order to grow our business, we must continue to attract new customers and retain and grow sales from our existing customers on a cost-effective basis. To do this, we aim to attract new and existing buyers of synthetic DNA and NGS tool kits, convert makers of synthetic DNA into buyers of synthetic DNA, and achieve
22
Table of Contents
widespread market acceptance by delivering both our current product offerings and new products and technologies at low-cost, with high-quality, reliable turn-around times and throughput, superior e-commerce services and effective technical support. We cannot guarantee that our efforts to provide these key requirements will be consistently acceptable to, and meet the performance expectations of, our customers and potential customers. If we are unable to successfully attract and retain customers, our business, financial position and results of operations would be negatively impacted.
Internet security poses a risk to our e-commerce sales.
We currently generate a growing portion of our revenue through sales on our e-commerce platform, increasing to 82% of total revenue in the 2019 fiscal year. However, as part of our growth strategy, we intend to increase the level of customer traffic and volume of customer purchases through our e-commerce platform which we formally launched to the general public in January 2018. We manage our website and e-commerce platform internally and as a result any compromise of our security or misappropriation of proprietary information could have a material adverse effect on our business, financial condition and results of operations. We rely on encryption and authentication technology licensed from third parties to provide the security and authentication necessary to effect secure Internet transmission of confidential information, such as credit and other proprietary information. Advances in computer capabilities, new discoveries in the field of cryptography or other events or developments may result in a compromise or breach of the technology used by us to protect customer transaction data. Anyone who is able to circumvent our security measures could misappropriate proprietary information or cause material interruptions in our operations. We may be required to expend significant capital and other resources to protect against security breaches or to minimize problems caused by security breaches. To the extent that our activities or the activities of others involve the storage and transmission of proprietary information, security breaches could damage our reputation and expose us to a risk of loss and/or litigation. Our security measures may not prevent security breaches. Our failure to prevent these security breaches may result in consumer distrust and may adversely affect our business, results of operations and financial condition.
Our actual operating results may differ significantly from our guidance.
From time to time, we may release guidance in our quarterly earnings conference calls, quarterly earnings releases, or otherwise, regarding our future performance that represents our management’s estimates as of the date of release. This guidance, which includes forward-looking statements, is based on projections prepared by our management. This guidance is not prepared with a view toward compliance with published guidelines of the American Institute of Certified Public Accountants (AICPA) regarding projections or the SEC regarding forward-looking statements, and neither our independent registered public accounting firm nor any other independent expert or outside party compiles or examines the projections. Accordingly, no such person will express any opinion or any other form of assurance with respect to the projections.
Projections are based upon a number of assumptions and estimates that, while presented with numerical specificity, are inherently subject to significant business, economic and competitive uncertainties and contingencies, many of which are beyond our control and are based upon specific assumptions with respect to future business decisions, some of which will change. Our aim is to state possible outcomes as high and low ranges to provide a sensitivity analysis as variables are changed but are not intended to imply that actual results could not fall outside of the suggested ranges. The principal reason that we release guidance is to provide a basis for our management to discuss our business outlook with analysts and investors. We do not accept any responsibility for any projections or reports published by any such third parties.
Guidance is necessarily speculative in nature, and it can be expected that some or all of the assumptions underlying the guidance furnished by us will not materialize or will vary significantly from actual results. Accordingly, our guidance is only an estimate of what management believes is realizable as of the date of release. Actual results may vary from our guidance and the variations may be material. In light of the foregoing, investors are urged not to rely upon our guidance in making an investment decision regarding our common stock.
23
Table of Contents
Any failure to successfully implement our operating strategy or the occurrence of any of the events or circumstances set forth in this “Risk factors” section in this Form 10-K could result in the actual operating results being different from our guidance, and the differences may be adverse and material.
Rapidly changing technology and extensive competition in synthetic biology could make the products we are developing and producing obsolete or non-competitive unless we continue to develop and manufacture new and improved products and pursue new market opportunities.
The synthetic biology industry is characterized by rapid and significant technological changes, frequent new product introductions and enhancements and evolving industry demands and standards. Our future success will depend on our ability to continually improve the products we are developing and producing, to develop and introduce new products that address the evolving needs of our customers on a timely and cost-effective basis and to pursue new market opportunities that develop as a result of technological and scientific advances. These new market opportunities may be outside the scope of our proven expertise or in areas which have unproven market demand, and the utility and value of new products and services developed by us may not be accepted in the markets served by the new products. Our inability to gain market acceptance of existing products in new markets or market acceptance of new products could harm our future operating results. Our future success also depends on our ability to manufacture these new and improved products to meet customer demand in a timely and cost-effective manner, including our ability to resolve manufacturing issues that may arise as we commence production of any new products we develop. Unanticipated difficulties or delays in replacing existing products with new products we introduce or in manufacturing improved or new products in sufficient quantities to meet customer demand could diminish future demand for our products and harm our future operating results.
In addition, there is extensive competition in the synthetic biology industry, and our future success will depend on our ability to maintain a competitive position with respect to technological advances. Technological development by others may result in our technologies, as well as products developed using our technologies, becoming obsolete. Our ability to compete successfully will depend on our ability to develop proprietary technologies and products that are technologically superior to and/or are less expensive than our competitors’ technologies and products. Our competitors may be able to develop competing and/or superior technologies and processes and compete more aggressively and sustain that competition over a longer period of time.
The continued success of our business relies heavily on our disruptive technologies and products and our position in the market as a leading provider or synthetic DNA using a silicon chip.
Our future profitability will depend on our ability to successfully execute and maintain a sustainable business model and generate continuous streams of revenue. Our business model is premised on the fact that we are the only DNA synthesis provider to synthesize DNA on a silicon chip and the competitive advantages this creates. Our DNA synthesis methods, among other things, reduce the amount of raw materials required, speed up the synthesis process and deliver large volumes of high-quality synthetic DNA at low unit cost. However, if other competitors develop and commercialize a manufacturing process using a silicon chip or other similar technologies providing for the development of competitive synthetic DNA products at scale, this could be disruptive to our business model and could adversely affect our business prospects, financial condition and results of operations. If we are unable to convert sufficient number of current manufacturers of synthetic DNA to buyers of our synthetic DNA, surpass our competitors regarding certain industry-related data points, and effectively implement our e-commerce platform which facilitates efficient order entry and fulfillment for our customers, our business, prospects, financial condition and results of operation will be adversely affected.
If we are unable to expand into adjacent addressable markets, our business may be materially and adversely affected.
Our future revenue growth and market potential may depend on our ability to leverage our DNA synthesis platform together with our custom libraries and other proprietary tools, such as our anti-GPCR library and
24
Table of Contents
antibody optimization solution, in adjacent businesses such as pharmaceutical biologics drug discovery and digital data storage in DNA. There can be no assurance that we can continue to utilize our antibody libraries to accelerate the lead identification and lead optimization steps of antibody discovery or to discover more effective antibody drugs. In addition, our technology may not develop in a way that allows data storage in DNA to become cost competitive with traditional data storage media or in a way that otherwise enables us to address the markets opportunities that we believe exist. If we are unable to expand into adjacent addressable markets, our business, financial position and results of operations could be negatively impacted.
A significant portion of our sales depends on customers’ budgets that may be subject to significant and unexpected variation, including seasonality.
Our customers’ spending on research and development impacts our sales and profitability. Our customers and potential customers include healthcare, agriculture, industrial chemicals and academic research sectors, and their budgets can have a significant effect on the demand for our products. Their research and development budgets are based on a wide variety of factors, including factors beyond our control, such as:
| • | the allocation of available resources to make purchases; |
| • | funding from government sources; |
| • | changes in government programs that provide funding to research institutions and companies; |
| • | the spending priorities among various types of research equipment; |
| • | policies regarding capital expenditures during recessionary periods; |
| • | macroeconomic conditions and the political climate; |
| • | changes in the regulatory environment; |
| • | differences in budgetary cycles; and |
| • | market acceptance of relatively new technologies, such as ours. |
Any decrease in spending or change in spending priorities of our customers and potential customers could significantly reduce the demand for our products. As we expand into new geographic markets, our revenue may be impacted by seasonal trends in the different regions, the seasonality of customer budgets in those regions and the mix of domestic versus international sales. Moreover, we have no control over the timing and amount of purchases by these customers and potential customers, and as a result, revenue from these sources may vary significantly due to factors that can be difficult to forecast. Any delay or reduction in purchases by customers and potential customers or our inability to forecast fluctuations in demand could harm our future operating results.
We generally do not have long-term contracts with our customers requiring them to purchase any specified quantities from us.
We generally do not have long-term contracts with our customers requiring them to purchase any specified quantities from us and without such contracts our customers are not obligated to order or reorder our products. As a result, we cannot accurately predict our customers’ decisions to reduce or cease purchasing our products. Additionally, even where we enter into contracts with our customers, there is no guarantee that such agreements will be negotiated on terms that are commercially favorable to us in the long-term. Therefore, if many of our customers were to substantially reduce their transaction volume or cease ordering products from us, this could materially and adversely affect our financial performance.
We have limited experience in sales and marketing of our products and, as a result, may be unable to successfully increase our market share and expand our customer base.
We have limited experience in sales and the marketing of our products. Our ability to achieve profitability depends on our being able to increase our market share and expand our customer base. Although members of our
25
Table of Contents
sales and marketing teams have considerable industry experience and have engaged in marketing activities for our products, in the future we must expand our sales, marketing, distribution and customer support capabilities with the appropriate technical expertise to effectively market our products. Furthermore, it takes six to nine months to recruit, onboard and ramp sales personnel to full capability. To perform sales, marketing, distribution and customer support successfully, we will face a number of risks, including that:
| • | we may not be able to attract, retain and manage the sales, marketing and service force necessary to publicize and gain broader market acceptance of our technology; |
| • | the time and cost of establishing a specialized sales, marketing and service force for a particular product or service, which may be difficult to justify in light of the revenue generated; and |
| • | our sales, marketing and service force may be unable to initiate and execute successful commercialization activities with respect to new products or markets we may seek to enter. |
If our sales and marketing efforts, or those of any third-party sales and distribution partners, are not successful, our new technologies and products may not gain market acceptance, which could materially impact our business operations.
If we are unable to expand our DNA synthesis manufacturing capacity, we could lose revenue and our business could be harmed.
In order to expand our manufacturing capacity of new and existing products, we need to either build additional internal manufacturing capacity, contract with one or more partners, or both. Our technology and the production process for our DNA synthesis equipment and tools are complex, involving specialized parts, and we may encounter unexpected difficulties in the manufacture, improvement or increasing the capacity of our DNA synthesis equipment and tools. There is no assurance that we will be able to continue to increase manufacturing capacity internally or that we will find one or more suitable partners to help us towards this objective, in order to meet the volume and quality requirements necessary for success in our existing and potential markets. Manufacturing and product quality issues may arise as we continue to increase the scale of our production. If our DNA synthesis equipment and tools do not consistently produce DNA products that meet our customers’ performance expectations, our reputation may be harmed, and we may be unable to generate sufficient revenue to become profitable. Any delay or inability in expanding our manufacturing capacity could diminish our ability to develop or sell our products, which could result in lost revenue and materially harm our business, financial condition and results of operations.
We are substantially dependent on the success of our synthetic DNA products.
To date, we have invested a substantial portion of our efforts and financial resources towards the research and development and commercialization of our synthetic DNA products. The DNA synthesis business is very capital intensive, particularly for early stage companies that do not have significant off-setting revenues and which are making significant investments in the commercialization and marketing of their products.
Our financial results are dependent on strengthening our core business while diversifying into other developing sectors such as pharmaceutical biologics drug discovery, creating useful DNA libraries and data storage. Substantially all of our revenue generated to date is from our synthetic DNA products.
Our near-term prospects, including our ability to finance our Company and enter into strategic collaborations, will depend heavily on the successful development and commercialization of our synthetic DNA products. These initiatives will be substantially dependent on our ability to generate revenue from our synthetic DNA products and obtain other funding necessary to support these initiatives. Our inability to continue these initiatives and initiate new research and development efforts could result in a failure to develop new products, improve upon existing products such that sectors like pharmaceutical biologics drug discovery, DNA library creation and data storage may never be fully developed, and expand our addressable market which could have a material and adverse impact on our sales, business, financial position and results of operations.
26
Table of Contents
We and our chief executive officer are currently involved in litigation with Agilent in which Agilent has alleged a claim of trade secret misappropriation against Twist Bioscience and trade secret misappropriation and other related claims against our chief executive officer, and an adverse result could harm our business and results of operations.
We and our chief executive officer are currently involved in litigation with Agilent in which Agilent has alleged a claim of trade secret misappropriation against our Company and trade secret misappropriation and other related claims against our chief executive officer and also against two other individuals: a current Company employee and a former Company employee. This litigation with Agilent could result in significant expense. Agilent has considerable resources available to it; we, on the other hand, are an early-stage commercial company with comparatively few resources available to us to engage in costly and protracted litigation. Intellectual property infringement claims asserted against us could be costly to defend and could limit our ability to use some technologies in the future. They will be time consuming, will divert our chief executive officer’s, management’s and scientific personnel’s attention, may be used by Agilent in an effort to generate negative publicity with our customers and investors, and may result in liability for substantial damages. For example, we have incurred and anticipate that we will continue to incur significant expense and substantial time in defending against our current intellectual property infringement dispute with Agilent. In another example, we have incurred and anticipate that we will continue to incur significant expense and substantial time in preparing and prosecuting counterclaims alleged against Agilent. We anticipate that Agilent may use litigation, including filing amended or new complaints, other court filings, public statements and press releases, regardless of merit in an attempt to disrupt our business and create uncertainty about our future prospects, which could create volatility in the trading price of our common stock or damage to our reputation in the marketplace.
An adverse judgment in the Agilent proceeding could require us to pay damages, attorneys’ fees, costs and expenses, or result in injunctive relief, or generate negative publicity, any of which could materially adversely affect our business, financial condition, results of operations and prospects. For more information on our current legal and regulatory proceedings, see the section of this Form 10-K captioned “Legal proceedings.” And for other risks related to our intellectual property, see the section of this Form 10-K captioned “Risks related to our intellectual property.” We may also in the future be involved with other litigation. We expect that the number of such claims may increase as our scale and the level of competition in our industry segments grows.
We depend on one single-source supplier for a critical component for our DNA synthesis process. The loss of this supplier or its failure to supply us with the necessary component on a timely basis, could cause delays in the future capacity of our DNA synthesis process and adversely affect our business.
We depend on one single-source supplier for a critical component for our DNA synthesis process. We do not currently have the infrastructure or capability internally to manufacture this component. Although we have a substantial reserve of supplies and although alternative suppliers exist for this critical component of our synthesis process, our existing DNA synthesis manufacturing process has been designed based on the functions, limitations, features and specifications of the components that we currently utilize. We have a supply agreement in place with this component supplier. However, there can be no assurance that our supply of this component will not be limited, interrupted, or of satisfactory quality or continue to be available at acceptable prices. Additionally, we do not have any control over the process or timing of the acquisition or manufacture of materials by our manufacturer and cannot ensure that it will deliver to us the component we order on time, or at all.
The loss of this component provided by this supplier could require us to change the design of our manufacturing process based on the functions, limitations, features and specifications of the replacement components.
In addition, the lead time needed to establish a relationship with a new supplier can be lengthy, and we may experience delays in meeting demand in the event we must switch to a new supplier. The time and effort to qualify a new supplier could result in additional costs, diversion of resources or reduced manufacturing yields, any of which would negatively impact our operating results. Further, we may be unable to enter into agreements
27
Table of Contents
with a new supplier on commercially reasonable terms, which could have a material adverse impact on our business. Our dependence on this single-source supplier exposes us to certain risks, including the following:
| • | our supplier may cease or reduce production or deliveries, raise prices or renegotiate terms; |
| • | we may be unable to locate a suitable replacement on acceptable terms or on a timely basis, if at all; |
| • | if there is a disruption to our single-source supplier’s operations, and if we are unable to enter into arrangements with alternative suppliers, we will have no other means of completing our synthesis process until they restore the affected facilities or we or they procure alternative manufacturing facilities or sources of supply; |
| • | delays caused by supply issues may harm our reputation, frustrate our customers and cause them to turn to our competitors for future projects; and |
| • | our ability to progress our DNA synthesis products could be materially and adversely impacted if the single-source supplier upon which we rely were to experience a significant business challenge, disruption or failure due to issues such as financial difficulties or bankruptcy, issues relating to other customers such as regulatory or quality compliance issues, or other financial, legal, regulatory or reputational issues. |
Moreover, to meet anticipated market demand, our single-source supplier may need to increase manufacturing capacity, which could involve significant challenges. This may require us and our supplier to invest substantial additional funds and hire and retain the technical personnel who have the necessary experience. Neither we nor our supplier may successfully complete any required increase to existing manufacturing capacity in a timely manner, or at all.
We must continue to secure and maintain sufficient and stable supplies of raw materials.
Although historically we have not experienced price increases due to unexpected raw material shortages and other unanticipated events, there is no assurance that our supply of raw materials will not be significantly adversely affected in the future, adversely affecting our business, prospects, financial condition and results of operation.
In addition, as we grow, our existing suppliers may not be able to meet our increasing demand, and we may need to find additional suppliers. There is no assurance that we will always be able to secure suppliers who provide raw materials at the specification, quantity and quality levels that we demand (or at all) or be able to negotiate acceptable fees and terms of services with any such suppliers. Identifying a suitable supplier is an involved process that requires us to become satisfied with their quality control, responsiveness and service, financial stability and labor and other ethical practices. Even if we are able to expand existing sources, we may encounter delays in production and added costs as a result of the time it takes to train suppliers in our methods, products and quality control standards.
We typically do not enter into agreements with our suppliers but secure our raw materials on a purchase order basis. Our suppliers may reduce or cease their supply of raw materials and outsourced services and products to us at any time in the future. If the supply of raw materials and the outsourced services and products is interrupted, our production processes may be delayed. If any such event occurs, our operation and financial position may be adversely affected.
A deterioration of our relationship with any of our suppliers, or problems experienced by these suppliers, could lead to shortages in our production capacity for some or all of our products. In such case, we may not be able to fulfill the demand of existing customers or supply new customers. A raw material shortage or an increase in the cost of the raw materials we use could result in decreased revenue or could impair our ability to maintain or expand our business.
28
Table of Contents
In the event of significant price increases for raw materials, we may have to pass the increased raw materials costs to our customers. However, we cannot assure you that we will be able to raise the prices of our products sufficiently to cover increased costs resulting from increases in the cost of our raw materials or overcome the interruption of a sufficient supply of qualified raw materials for our products. As a result, a price increase for our raw materials may negatively impact our business, financial position and results of operations.
We may encounter difficulties in managing our growth, and these difficulties could impair our profitability.
Currently, we are working simultaneously on multiple projects, expanding our capacity, consolidating our manufacturing operations into one facility in South San Francisco and reobtaining certain ISO certifications as well as targeting several market sectors, including activities in the healthcare, agriculture, industrial chemicals and academic sectors. These diversified operations and activities place significant demands on our limited resources and require us to substantially expand the capabilities of our technical, administrative and operational resources.
If we are unable to manage this growth and consolidation and recertification of our manufacturing facilities effectively, our shipments to our customers could be impacted and our business and operating results could suffer. Our ability to manage our operations and costs, including research and development, costs of components, manufacturing, sales and marketing, requires us to continue to enhance our operational, financial and management controls, reporting systems and procedures and to attract and retain sufficient numbers of talented employees. Failure to attract and retain sufficient numbers of talented employees will further strain our human resources and could impede our growth.
Our revenue, results of operations, cash flows and reputation in the marketplace may suffer upon the loss of a significant customer.
We have derived, and believe we may continue to derive, a significant portion of our revenues from one large customer or a limited number of large customers. Our largest customer Ginkgo Bioworks accounted for 17%, 34% and 40% of our revenues for the fiscal years ended September 30, 2019, 2018 and 2017, respectively. Our customers may buy less of our products depending on their own technological developments, end-user demand for our products and internal budget cycles. In addition, existing customers may choose to produce some or all of their synthetic DNA requirements internally by using or developing manufacturing capabilities organically or by using capabilities from acquisitions of assets or entities from third parties with such capabilities. The loss of Ginkgo Bioworks as a customer, or the loss of any other significant customer or a significant reduction in the amount of product ordered by Ginkgo Bioworks or any other significant customer would adversely affect our revenue, results of operations, cash flows and reputation in the marketplace.
Our credit facility contains restrictions that limit our flexibility in operating our business.
In September 2017, we entered into an amended and restated loan and security agreement with Silicon Valley Bank (SVB). Our credit facility contains various covenants that limit our ability to engage in specified types of transactions. These covenants limit our ability to, among other things:
| • | sell, transfer, lease or otherwise dispose of our assets; |
| • | create, incur or assume additional indebtedness; |
| • | engage in certain changes in business, management, control, or business location |
| • | encumber or permit liens on certain of our assets; |
| • | make restricted payments, including paying dividends on, repurchasing or making distributions with respect to our common stock; |
| • | make specified investments (including loans and advances); |
29
Table of Contents
| • | consolidate, merge, sell or otherwise dispose of all or substantially all of our assets or acquire other entities; |
| • | make or permit any payment on any subordinated debt; and |
| • | enter into certain transactions with our affiliates. |
Our incurrence of this debt, and any future increases in our aggregate level of debt, may adversely affect our operating results and financial condition by, among other things:
| • | increasing our vulnerability to downturns in our business, to competitive pressures and to adverse economic and industry conditions; |
| • | requiring the dedication of an increased portion of our expected cash flows from operations to service our indebtedness, thereby reducing the amount of expected cash flows available for other purposes, including capital expenditures, acquisitions and dividends; and |
| • | limiting our flexibility in planning for, or reacting to, changes in our business and our industry. |
A breach of any of these covenants could result in a default under our credit facility. Upon the occurrence of an event of default under our credit facility, SVB could elect to declare all amounts outstanding under our credit facility to be immediately due and payable and terminate all commitments to extend further credit. If we were unable to repay those amounts, the lenders under our credit facility could proceed against the collateral granted to them to secure such indebtedness. We have pledged substantially all of our assets, other than our intellectual property, as collateral under our credit facility.
We depend on the continuing efforts of our senior management team and other key personnel. If we lose members of our senior management team or other key personnel or are unable to successfully retain, recruit and train qualified researchers, engineering and other personnel, our ability to develop our products could be harmed, and we may be unable to achieve our goals.
Our future success depends upon the continuing services of members of our senior management team and scientific and engineering personnel. We are highly dependent on Dr. Emily Leproust, our President and Chief Executive Officer, who is employed “at will,” meaning we or she may terminate the employment relationship at any time. In particular, our researchers and engineers are critical to our future technological and product innovations, and we will need to hire additional qualified personnel. We may not be able to attract and retain qualified personnel on acceptable terms, or at all. In addition, to the extent we hire personnel from competitors, we may be subject to allegations that they have been improperly solicited or that they have divulged proprietary or other confidential information, or that their former employers own their research output. Our industry, particularly in the San Francisco Bay Area, is characterized by high demand and intense competition for talent, and the turnover rate can be high. We compete for qualified management and scientific personnel with other life science companies, academic institutions and research institutions, particularly those focusing on genomics. Many of these employees could leave our company with little or no prior notice and would be free to work for a competitor. If one or more of our senior executives or other key personnel were unable or unwilling to continue in their present positions, we might not be able to replace them easily or at all, and other senior management may be required to divert attention from other aspects of the business. In addition, we do not have “key person” life insurance policies covering members of our management team or other key personnel except Dr. Leproust. The loss of any of these individuals or our inability to attract or retain qualified personnel, including researchers, engineers and others, could prevent us from pursuing collaborations and adversely affect our product development and introductions, business growth prospects, results of operations and financial condition.
We may engage in strategic transactions, including acquisitions that could disrupt our business, cause dilution to our stockholders, reduce our financial resources, or prove not to be successful.
In the future, we may enter into transactions to acquire other businesses, products or technologies and our ability to do so successfully cannot be ensured. In April 2016, we acquired Genome Compiler Corporation, which
30
Table of Contents
became a wholly owned subsidiary. This acquisition allowed us to add software design capabilities for our e-commerce ordering system. However, to date, we have not successfully concluded other acquisitions, and we are pursuing opportunities in the life sciences industry that complement and expand our synthetic DNA product, products and markets both locally and internationally. If we identify suitable opportunities, we may not be able to make such acquisitions on favorable terms or at all. Any acquisitions we make may not strengthen our competitive position, and these transactions may be viewed negatively by customers or investors. We may decide to incur debt in connection with an acquisition or issue our common stock or other equity securities to the stockholders of the acquired company, which would reduce the percentage ownership of our existing stockholders. We could incur losses resulting from undiscovered liabilities of the acquired business that are not covered by any indemnification we may obtain from the seller. In addition, we may not be able to successfully integrate the acquired personnel, technologies and operations into our existing business in an effective, timely and non-disruptive manner. Acquisitions may also divert management attention from day-to-day responsibilities, increase our expenses and reduce our cash available for operations and other uses. In addition, we cannot guarantee that we will be able to fully recover the costs of such acquisitions or that we will be successful in leveraging any such strategic transactions into increased business, revenue or profitability. We also cannot predict the number, timing or size of any future acquisitions or the effect that any such transactions might have on our operating results.
From time to time, we may consider other strategic transactions, including collaborations. The competition for collaborators is intense, and the negotiation process is time-consuming and complex. Any new collaboration may be on terms that are not optimal for us, and we may not be able to maintain any new collaboration. Any such collaboration may require us to incur non-recurring or other charges, increase our near- and long-term expenditures and pose significant integration or implementation challenges or disrupt our management or business. These transactions would entail numerous operational and financial risks, including exposure to unknown liabilities, disruption of our business and diversion of our management’s time and attention to manage a collaboration, incurrence of substantial debt or dilutive issuances of equity securities to pay transaction consideration or costs, higher than expected collaboration, acquisition or integration costs, write-downs of assets or goodwill or impairment charges, increased amortization expenses, difficulty and cost in facilitating the collaboration or combining the operations and personnel of any acquired business, impairment of relationships with key suppliers, manufacturers or customers of any acquired business due to changes in management and ownership and the inability to retain key employees of any acquired business. Accordingly, although there can be no assurance that we will undertake or successfully complete any collaborations, any transactions that we do complete may be subject to the foregoing or other risks and have a material and adverse effect on our business, financial condition, results of operations and prospects. Conversely, any failure to enter any collaboration or other strategic transaction that would be beneficial to us could delay the development and potential commercialization of our products and technologies.
As we expand our development and commercialization activities outside of the United States, we will be subject to an increased risk of inadvertently conducting activities in a manner that violates the U.S. Foreign Corrupt Practices Act and similar laws. If that occurs, we may be subject to civil or criminal penalties which could have a material adverse effect on our business, financial condition, results of operations and growth prospects.
We are subject to the U.S. Foreign Corrupt Practices Act, or the FCPA, which prohibits corporations and individuals from paying, offering to pay, or authorizing the payment of anything of value to any foreign government official, government staff member, political party, or political candidate in an attempt to obtain or retain business or to otherwise influence a person working in an official capacity. We are also subject to the UK Anti-Bribery Act, which prohibits both domestic and international bribery, as well as bribery across both public and private sectors.
In the course of establishing and expanding our commercial operations and complying with non-U.S. regulatory requirements, we will need to establish and expand business relationships with various third parties and we will
31
Table of Contents
interact more frequently with foreign officials, including regulatory authorities. Expanded programs to maintain compliance with such laws will be costly and may not be effective. Any interactions with any such parties or individuals where compensation is provided that are found to be in violation of such laws could result in substantial fines and penalties and could materially harm our business. Furthermore, any finding of a violation under one country’s laws may increase the likelihood that we will be prosecuted and be found to have violated another country’s laws. If our business practices outside the United States are found to be in violation of the FCPA, UK Anti-Bribery Act or other similar laws, we may be subject to significant civil and criminal penalties which could have a material adverse effect on our financial condition and results of operations.
We could engage in exporting or related activity that contravenes international trade restraints, or regulatory authorities could promulgate more far reaching international trade restraints, which could give rise to one or more of substantial legal liability, impediments to our business and reputational damage.
Our international business activities must comport with U.S. export controls and other international trade restraints, including the U.S. Department of Commerce’s Export Administration Regulations and economic sanctions regulations administered by the U.S. Treasury Department’s Office of Foreign Assets Controls.
We have established an international trade compliance program that encompasses best practices for preventing, detecting and addressing noncompliance with international trade restraints. Furthermore, to date our exports have not been licensable under export controls; however, we could fail to observe the compliance program requirements in a manner that leaves us in noncompliance with export controls or other international trade restraints. In addition, authorities could promulgate international trade restraints that impinge on our ability to prosecute our business as planned. One or more of resulting legal penalties, restraints on our business or reputational damage could have material adverse effects on our business and financial condition.
Adverse conditions in the global economy and disruption of financial markets may significantly harm our revenue, profitability and results of operations.
The global economy has a significant impact on our business and volatility and disruption of financial markets could limit our customers’ ability to obtain adequate financing or credit to purchase and pay for our products in a timely manner or to maintain operations, which could result in a decrease in sales volume that could harm our results of operations. General concerns about the fundamental soundness of domestic and international economies may also cause our customers to reduce their purchases. Changes in banking, monetary and fiscal policies to address liquidity and increase credit availability may not be effective. Significant government investment and allocation of resources to assist the economic recovery of sectors which do not include our customers may reduce the resources available for government grants and related funding for life sciences research and development. Continuation or further deterioration of these financial and macroeconomic conditions could significantly harm our sales, profitability and results of operations.
We operate in a highly competitive industry and if we are not able to compete effectively, our business and operating results will likely be harmed.
We face competition from a broad range of providers of core synthetic biology products such as GenScript Biotech Corporation, GENEWIZ (owned by Brooks Automation), Integrated DNA Technologies, Inc., DNA 2.0 Inc. d/b/a/ ATUM, GeneArt (owned by Thermo Fisher Scientific Inc.), Eurofins Genomics LLC, Sigma-Aldrich Corporation (an indirect wholly owned subsidiary of Merck & Company), Promega Corporation, OriGene Technologies, Inc., Blue Heron Biotech, LLC and others. Additionally, we compete with both large and emerging providers in the life sciences tools and diagnostics industries focused on sample preparation for next generation sequencing such as Thermo Fisher Scientific Inc., Illumina, Inc., Integrated DNA Technologies, Inc., Agilent, and Roche NimbleGen, Inc. In the antibody discovery market, we compete with clinical research organizations, such as LakePharma (mouse hybridoma, llama immune libraries, XOMA phage display library) and Aldevron, LLC (genetic mouse immunization coupled with hybridoma), and antibody discovery
32
Table of Contents
biotechnology companies, such as Iontas (human phage display libraries, human phage display library focused on ion channels), Adimab (human synthetic yeast display libraries), and Distributed Bio (human synthetic phage display library, lead optimization libraries). In the field of DNA digital data storage, we compete with Catalog Technologies, Inc., ETH Zurich, Helixworks, Iridia, Inc., North Shore Bio and Roswell. We may not be successful in maintaining our competitive position for a number of reasons. Some of our current competitors, as well as many of our potential competitors, have significant name recognition, substantial intellectual property portfolios, longer operating histories, greater resources to invest in new technologies, substantial experience in new product development and manufacturing capabilities and more established distribution channels to deliver products to customers than we do. These competitors may be able to respond more quickly and effectively than we can to new or changing opportunities, technologies, standards or customer requirements. Our competitors may develop disruptive technologies or products that are comparable or superior to our technologies and products. In light of these advantages, even though we believe our technology is superior to the products offerings of our competitors, current or potential customers might accept competitive products in lieu of purchasing our products. Increased competition is likely to result in continued pricing pressures, which could harm our sales, profitability or market share. Our failure to continue competing effectively or wining additional business with our existing customers could materially and adversely affect our business, financial condition or results of operations.
We may be subject to significant pricing pressures.
Over time, increasing customer demand for lower prices could force us to discount our products and result in lower margins. The impact may be further exacerbated if we are unable to successfully control production costs. Alternatively, if due to rising market prices, our suppliers increase prices or reduce discounts on their supplies, we may be unable to pass on any cost increase to our customers, thereby resulting in reduced margins and profits. Furthermore, changes in our product mix may negatively affect our gross margins. Overall, these pricing pressures may adversely affect our business, financial position and results of operations.
Ethical, legal and social concerns surrounding the use of genetic information could reduce demand for our technology.
Our products may be used to create DNA sequences of humans, agricultural crops and other living organisms. Our products could be used in a variety of applications, which may have underlying ethical, legal and social concerns. Governmental authorities could, for safety, social or other purposes, impose limits on or implement regulation of the use of gene synthesis. Such concerns or governmental restrictions could limit the use of our DNA synthesis products, which could have a material adverse effect on our business, financial condition and results of operations. In addition, public perception about the safety and environmental hazards of, and ethical concerns over, genetically engineered products and processes could influence public acceptance of our technologies, products and processes. These concerns could result in increased expenses, regulatory scrutiny, delays or other impediments to our programs.
We use biological and hazardous materials that require considerable expertise and expense for handling, storage and disposal and may result in claims against us.
We work with materials, including chemicals, biological agents, and compounds and DNA samples that could be hazardous to human health and safety or the environment. Our operations also produce hazardous and biological waste products. Federal, state and local laws and regulations govern the use, generation, manufacture, storage, handling and disposal of these materials and wastes. Compliance with applicable environmental laws and regulations is expensive, and current or future environmental laws and regulations may restrict our operations. If we do not comply with applicable regulations, we may be subject to fines and penalties.
In addition, we cannot eliminate the risk of accidental injury or contamination from these materials or wastes, which could cause an interruption of our commercialization efforts, research and development programs and
33
Table of Contents
business operations, as well as environmental damage resulting in costly clean-up and liabilities under applicable laws and regulations. Furthermore, environmental laws and regulations are complex, change frequently and have tended to become more stringent. We cannot predict the impact of such changes and cannot be certain of our future compliance. While our property insurance policy provides limited coverage in the event of contamination from hazardous and biological products and the resulting cleanup costs, we do not currently have any additional insurance coverage for legal liability for claims arising from the handling, storage or disposal of hazardous materials. Accordingly, in the event of contamination or injury, we could be liable for damages or penalized with fines in an amount exceeding our resources and our operations could be suspended or otherwise adversely affected.
We could develop DNA sequences or engage in other activity that contravenes biosecurity requirements, or regulatory authorities could promulgate more far reaching biosecurity requirements that our standard business practices cannot accommodate, which could give rise to substantial legal liability, impede our business and damage our reputation.
The Federal Select Agent Program, or the FSAP, involves rules administered by the Centers for Disease Control and Prevention and Toxins and the Animal and Plant Health Inspection Service that regulate possession, use and transfer of biological select agents and toxins that have the potential to pose a severe threat to public, animal or plant health or to animal or plant products.
We have established a biosecurity program under which we follow biosafety and biosecurity best practices and avoid DNA synthesis activities that implicate FSAP rules; however, we could err in our observance of compliance program requirements in a manner that leaves us in noncompliance with FSAP or other biosecurity rules. In addition, authorities could promulgate new biosecurity requirements that restrictions our operations. One or more resulting legal penalties, restraints on our business or reputational damage could have material adverse effects on our business and financial condition.
Third parties may use our products in ways that could damage our reputation.
After our customers have received our products, we do not have any control over their use and our customers may use them in ways that are harmful to our reputation as a supplier of synthetic DNA products. In addition, while we have established a biosecurity program designed to comply with biosafety and biosecurity requirements and perform export control screening in an effort to ensure that third parties do not obtain our products for malevolent purposes, we cannot guarantee that these preventative measures will eliminate or reduce the risk of the domestic and global opportunities for the misuse of our products. Accordingly, in the event of such misuse, our reputation, future revenue and operating results may suffer.
Any damage to our reputation or brand may materially and adversely affect our business, financial condition and results of operations.
We believe that developing and maintaining our brand is important to our success and that our financial success is influenced by the perception of our brand by our customers. Furthermore, the importance of our brand recognition may become even greater to the extent that competitors offer more products similar to ours. Many factors, some of which are beyond our control, are important to maintaining our reputation and brand. These factors include our ability to comply with ethical, social, product, labor and environmental standards. Any actual or perceived failure in compliance with such standards could damage our reputation and brand.
Because we are subject to existing and potential additional governmental regulation, the markets for our products may be narrowed.
We are subject, both directly and indirectly, to the adverse impact of existing and potential future government regulation of our operations and markets. For example, the export of our products is subject to strict regulatory
34
Table of Contents
control in a number of jurisdictions. The failure to satisfy export control criteria or obtain necessary clearances could delay or prevent the shipment of products, which could adversely affect our revenues and profitability. Moreover, the life sciences industry, which is currently the primary market for our technology, has historically been heavily regulated. There are, for example, laws in several jurisdictions restricting research in genetic engineering, which can operate to narrow our markets. Given the evolving nature of this industry, legislative bodies or regulatory authorities may adopt additional regulation that adversely affects our market opportunities. Our business is also directly affected by a wide variety of government regulations applicable to business enterprises generally and to companies operating in the life science industry in particular. Failure to comply with these regulations or obtain or maintain necessary permits and licenses could result in a variety of fines or other censures or an interruption in our business operations which may have a negative impact on our ability to generate revenues and could increase the cost of operating our business.
Our products could in the future be subject to additional regulation by the U.S. Food and Drug Administration or other domestic and international regulatory agencies, which could increase our costs and delay our commercialization efforts, thereby materially and adversely affecting our business and results of operations.
The U.S. Food and Drug Administration, or FDA, regulates medical devices, including in vitro diagnostics, or IVDs. IVDs include reagents, instruments, and systems intended for use in diagnosis of disease or other conditions, including a determination of the state of health, in order to cure, mitigate, treat, or prevent disease or its sequelae. IVDs are intended for use in the collection, preparation, and examination of specimens taken from the human body. A research use only, or RUO, IVD product is an IVD product that is in the laboratory research phase of development and is being shipped or delivered for an investigation that is not subject to FDA’s investigational device exemption requirements. As such, an RUO IVD is not intended for use in clinical investigations or in clinical practice. Such RUO products do not require premarket clearance or approval from the FDA, provided that they are labeled “For Research Use Only. Not for use in diagnostic procedures” pursuant to FDA regulations. Our IVD products are not intended for clinical or diagnostic use, and we market and label them as RUO. Accordingly, we have not sought clearance or approval from the FDA to market our products. However, the FDA may disagree with our assessment that our products are properly marketed as RUO, and may determine that our products are subject to pre-market clearance, approval, or other regulatory requirements. If the FDA determines that our products are subject to such requirements, we could be subject to enforcement action, including administrative and judicial sanctions, and additional regulatory controls and submissions for our tests, all of which could be burdensome.
Further, in the future, certain of our products or related applications could be subject to additional FDA regulation. Even where a product is not subject to FDA clearance or approval requirements, the FDA may impose restrictions as to the types of customers to which we can market and sell our products. Such regulation and restrictions may materially and adversely affect our business, financial condition and results of operations. Other regulatory regimes that do not currently present material challenges but that could in the future present material challenges include export controls and biosecurity.
Similarly, even though our products and services are not currently covered and reimbursed by third-party payors, including government healthcare programs such as Medicare and Medicaid, to the extent our products or related applications become eligible for coverage and reimbursement by such payors, we could be subject to healthcare fraud and abuse laws of both the federal government and the states in which we conduct our business. Because of the breadth of these laws and the narrowness of available statutory and regulatory exceptions, it is possible that some of our business activities could be subject to challenge under one or more of such laws. If we or our operations are found to be in violation of any of the laws described above or any other governmental regulations that apply to us, we may be subject to penalties, including civil and criminal penalties, damages, fines, imprisonment, and the curtailment or restructuring of our operations, any of which could materially adversely affect our ability to operate our business and our financial results.
35
Table of Contents
Many countries have laws and regulations that could affect our products. The number and scope of these requirements are increasing. Unlike many of our competitors, this is an area where we do not have expertise. We may not be able to obtain regulatory approvals in such countries or may incur significant costs in obtaining or maintaining foreign regulatory approvals.
Certain of our potential customers may require that we become certified under the Clinical Laboratory Improvement Amendments of 1988.
Although we are not currently subject to the Clinical Laboratory Improvement Amendment of 1988, or CLIA, we may in the future be required by certain customers to obtain a CLIA certification. CLIA, which extends federal oversight over clinical laboratories by requiring that they be certified by the federal government or by a federally approved accreditation agency, is designed to ensure the quality and reliability of clinical laboratories by mandating specific standards in the areas of personnel qualifications, administration and participation in proficiency testing, patient test management, quality control, quality assurance and inspections. If our customers require a CLIA certification, we will have to continually expend time, money and effort to ensure that we meet the applicable quality and safety requirements, which may divert the attention of management and disrupt our core business operations.
If we experience a significant disruption in, or breach in security of, our information technology systems, or if we fail to implement new systems and software successfully, our business could be adversely affected.
We rely on several centralized information technology systems throughout our company to provide products, keep financial records, process orders, manage inventory, process shipments to customers and operate other critical functions. Our information technology systems may be susceptible to damage, disruptions or shutdowns due to power outages, hardware failures, computer viruses, attacks by computer hackers, telecommunication failures, user errors, catastrophes or other unforeseen events. Our information technology systems also may experience interruptions, delays or cessations of service or produce errors in connection with system integration, software upgrades or system migration work that takes place from time to time. If we were to experience a prolonged system disruption in the information technology systems that involve our interactions with customers or suppliers, including negatively impacting our order fulfillment and order entry on our e-commerce platform, it could result in the loss of sales and customers and significant incremental costs, which could adversely affect our business. In addition, security breaches of our information technology systems could result in the misappropriation or unauthorized disclosure of confidential information belonging to us or to our employees, partners, customers or suppliers, which could result in our suffering significant financial or reputational damage. Further, such a breach may require notification to governmental agencies, the media or individuals pursuant to various federal and state privacy and security laws. We would also be exposed to a risk of litigation and potential liability, which could materially adversely affect our business, results of operations and financial condition.
Our manufacturing operations in the United States depend primarily on one facility. If this facility is destroyed or we experience any manufacturing difficulties, disruptions, or delays, this could limit supply of our product or adversely affect our ability to sell products or conduct our clinical trials, and our business would be adversely impacted.
A substantial portion of our manufacturing takes place at our headquarters. If regulatory, manufacturing, or other problems require us to discontinue production at this facility, we will not be able to manufacture our synthetic genes, oligo pools or NGS tool or create our DNA libraries, which would adversely impact our business. If this facility or the equipment in it is significantly damaged or destroyed by fire, flood, power loss, or similar events, we may not be able to quickly or inexpensively replace our manufacturing capacity or replace the facility at all. In the event of a temporary or protracted loss of this facility or equipment, we might not be able to transfer manufacturing to another third party. Even if we could transfer manufacturing from one facility to another, the shift would likely be expensive and time-consuming, particularly if we were to maintain the current ISO, CMDR and FDA standards applicable to the QMS and manufacturing procedures at such alternative facility.
36
Table of Contents
Our facilities in California are located near known earthquake faults, and the occurrence of an earthquake or other catastrophic disaster could cause damage to our facilities and equipment, which could require us to cease or curtail operations.
Our facilities in the San Francisco Bay Area are located near known earthquake fault zones and are vulnerable to damage from earthquakes. We are also vulnerable to damage from other types of disasters, including fire, floods, power loss, communications failures and similar events. If any disaster were to occur, our ability to operate our business at our facilities would be seriously, or potentially completely, impaired. In addition, the nature of our activities could cause significant delays in our research programs and commercial activities and make it difficult for us to recover from a disaster. The insurance we maintain may not be adequate to cover our losses resulting from disasters or other business interruptions. Accordingly, an earthquake or other disaster could materially and adversely harm our ability to conduct business.
Delivery of our products could be delayed or disrupted by factors beyond our control, and we could lose customers as a result.
We rely on third-party carriers for the timely delivery of our products. As a result, we are subject to carrier disruptions and increased costs that are beyond our control, including employee strikes, inclement weather and increased fuel costs. Any failure to deliver products to our customers in a timely and accurate manner may damage our reputation and brand and could cause us to lose customers. If our relationship with any of these third-party carriers is terminated or impaired or if any of these third parties are unable to deliver our products, the delivery and acceptance of our products by our customers may be delayed which could harm our business and financial results. The failure to deliver our products in a timely manner may harm our relationship with our customers, increase our costs and otherwise disrupt our operations.
Doing business internationally creates operational and financial risks for our business.
During our fiscal years ended September 30, 2019, 2018 and 2017, 34%, 31% and 23%, respectively, of our revenue was generated from customers located outside of the United States. In connection with our growth strategy, we intend to further expand in international markets. Conducting and launching operations on an international scale requires close coordination of activities across multiple jurisdictions and time zones and consumes significant management resources. If we fail to coordinate and manage these activities effectively, our business, financial condition or results of operations could be adversely affected. International sales entail a variety of risks, including longer payment cycles and difficulties in collecting accounts receivable outside of the United States, currency exchange fluctuations, challenges in staffing and managing foreign operations, tariffs and other trade barriers, unexpected changes in legislative or regulatory requirements of foreign countries into which we sell our products, difficulties in obtaining export licenses or in overcoming other trade barriers, laws and business practices favoring local companies, political and economic instability, difficulties protecting or procuring intellectual property rights, and restrictions resulting in delivery delays and significant taxes or other burdens of complying with a variety of foreign laws.
Changes in the value of the relevant currencies may affect the cost of certain items required in our operations. Changes in currency exchange rates may also affect the relative prices at which we are able to sell products in the same market. Our revenue from international customers may be negatively impacted as increases in the U.S. dollar relative to our international customers’ local currency could make our products more expensive, impacting our ability to compete. Our costs of materials from international suppliers may increase if in order to continue doing business with us they raise their prices as the value of the U.S. dollar decreases relative to their local currency. Foreign policies and actions regarding currency valuation could result in actions by the United States and other countries to offset the effects of such fluctuations. The recent global financial downturn has led to a high level of volatility in foreign currency exchange rates and that level of volatility may continue, which could adversely affect our business, financial condition or results of operations.
37
Table of Contents
Our ability to use our net operating loss carryforwards to offset future taxable income may be subject to certain limitations.
In general, under Section 382 of the Internal Revenue Code of 1986, as amended, or the Code, a corporation that undergoes an “ownership change” is subject to limitations on its ability to use its pre-change net operating loss carryforwards, or NOLs, to offset future taxable income. If the Internal Revenue Service challenges our analysis that our existing NOLs will not expire before utilization due to previous ownership changes, our ability to use our NOLs could be limited by Section 382 of the Code. Future changes in our stock ownership, some of which are outside of our control, could result in an ownership change under Section 382 of the Code. Furthermore, our ability to use NOLs of companies that we may acquire in the future may be subject to limitations. For these reasons, we may not be able to use a material portion of the NOLs reflected on our balance sheet, even if we attain profitability.
The enactment of legislation implementing changes in taxation of international business activities, the adoption of other corporate tax reform policies, or changes in tax legislation or policies could impact our future financial position and results of operations.
Corporate tax reform, base-erosion efforts and tax transparency continue to be high priorities in many tax jurisdictions where we intend to have business operations. As a result, policies regarding corporate income and other taxes in numerous jurisdictions are under heightened scrutiny and tax reform legislation is being proposed or enacted in a number of jurisdictions. For example, the Tax Cuts and Jobs Act of 2017, or the Tax Act, signed into law on December 22, 2017, adopting broad U.S. corporate income tax reform will, among other things, reduce the U.S. corporate income tax rate, but will impose base-erosion prevention measures on non-U.S. earnings of U.S. entities as well as a one-time mandatory deemed repatriation tax on accumulated non-U.S. earnings of U.S. entities.
In addition, many countries are beginning to implement legislation and other guidance to align their international tax rules with the Organization for Economic Co-operation’s Base Erosion and Profit Shifting recommendations and action plan that aim to standardize and modernize global corporate tax policy, including changes to cross-border tax, transfer-pricing documentation rules, and nexus-based tax incentive practices.
Such legislative initiatives may materially and adversely affect our plans to expand internationally and may negatively impact our financial condition and results of operations generally.
Our inability to collect on our accounts receivable by a significant number of customers may have an adverse effect on our business, financial condition and results of operations.
Sales to our customers are generally made on open credit terms. Management maintains an allowance for potential credit losses. The average days sales outstanding of our trade receivables was 63 days, based on year-end balances and sales for the last 30 days of the year. If our customers’ cash flow, working capital, financial conditions or results of operations deteriorate, they may be unable or even unwilling to pay trade receivables owed to us promptly or at all. As a result, we could be exposed to a certain level of credit risk. If a major customer experiences, or a significant number of customers experience, financial difficulties, the effect on us could be material and have an adverse effect on our business, financial condition and results of operations.
Risks related to being a public company
If we fail to maintain proper and effective internal controls, our ability to produce accurate financial statements on a timely basis could be impaired, which would adversely affect our business.
Ensuring that we have adequate internal financial and accounting controls and procedures in place to produce accurate financial statements on a timely basis is a costly and time-consuming effort that needs to be re-evaluated
38
Table of Contents
frequently. To ensure the level of segregation of duties customary for a U.S. public company and the requirement to produce timely financial information has created a need for additional resources within the accounting and finance functions. Consequently, we have hired additional resources in the accounting and finance function and continue to reassess the sufficiency of finance personnel in response to these increasing demands and expectations.
Our management is responsible for establishing and maintaining adequate internal control over financial reporting to provide reasonable assurance regarding the reliability of our financial reporting and the preparation of financial statements for external purposes in accordance with generally accepted accounting principles. Our management does not expect that our internal control over financial reporting will prevent or detect all errors and all fraud. A control system, no matter how well designed and operated, can provide only reasonable, not absolute, assurance that the control system’s objectives will be met. Because of the inherent limitations in all control systems, no evaluation of controls can provide absolute assurance that misstatements due to error or fraud will not occur or that all control issues and instances of fraud, if any, within our company will have been detected.
Commencing with our fiscal year ending September 30, 2019, we must perform system and process evaluation and testing of our internal control over financial reporting to allow management to report on the effectiveness of our internal control over financial reporting in our Form 10-K filing for that year, as required by Section 404 of the Sarbanes Oxley Act. If we become an accelerated filer or a large accelerated filer under the rules of the SEC, our auditors will also be required by Section 404 to evaluate and test, and issue an audit report on the effectiveness of our internal control over financial reporting. We expect to expend significant resources in developing the necessary documentation and testing procedures required by Section 404. We cannot be certain that the actions we will be taking to improve our internal controls over financial reporting will be sufficient, or that we will be able to implement our planned processes and procedures in a timely manner. In addition, if we are unable to produce accurate financial statements on a timely basis, investors could lose confidence in the reliability of our financial statements, which could cause the market price of our common stock to decline and make it more difficult for us to finance our operations and growth.
We are an emerging growth company and smaller reporting company, and we cannot be certain if the reduced disclosure requirements applicable to emerging growth companies and smaller reporting companies will make our common stock less attractive to investors.
We are an “emerging growth company” as defined in the JOBS Act. Under the JOBS Act, emerging growth companies can delay adopting new or revised accounting standards until such time as those standards apply to private companies. We have irrevocably elected not to avail ourselves of this exemption from new or revised accounting standards and, therefore, we will be subject to the same new or revised accounting standards as other public companies that are not “emerging growth companies.”
For as long as we continue to be an emerging growth company, we intend to take advantage of certain other exemptions from various reporting requirements that are applicable to other public companies including, but not limited to, reduced disclosure obligations regarding executive compensation in our periodic reports and proxy statements, and exemptions from the requirements of holding a nonbinding advisory vote on executive compensation and stockholder approval of any golden parachute payments not previously approved. We cannot predict if investors will find our common stock less attractive because we will rely on these exemptions. If some investors find our common stock less attractive as a result, there may be a less active trading market for our common stock and our stock price may be more volatile.
We will remain an emerging growth company until the earliest of (i) the last day of the fiscal year in which we have total annual gross revenue of $1.07 billion or more; (ii) the last day of our fiscal year following the fifth anniversary of the date of the closing of our initial public offering; (iii) the date on which we have issued more than $1.0 billion in nonconvertible debt during the previous three years; or (iv) the date on which we are deemed to be a large accelerated filer under the rules of the SEC.
39
Table of Contents
We are also a “smaller reporting company,” meaning that the market value of our stock held by non-affiliates plus the proposed aggregate amount of gross proceeds to us as a result of this offering is less than $700 million and our annual revenue is less than $100 million during the most recently completed fiscal year. We may continue to be a smaller reporting company if either (i) the market value of our stock held by non-affiliates is less than $250 million or (ii) our annual revenue is less than $100 million during the most recently completed fiscal year and the market value of our stock held by non-affiliates is less than $700 million. If we are a smaller reporting company at the time we cease to be an emerging growth company, we may continue to rely on exemptions from certain disclosure requirements that are available to smaller reporting companies. Specifically, as a smaller reporting company we may choose to present only the two most recent fiscal years of audited financial statements in our Annual Report on Form 10-K and, similar to emerging growth companies, smaller reporting companies have reduced disclosure obligations regarding executive compensation.
The requirements of being a public company may strain our resources, divert management’s attention and affect our ability to attract and retain qualified board members.
As a public company, we will be subject to the reporting requirements of the Exchange Act, the Sarbanes-Oxley Act, the Dodd-Frank Wall Street Reform and Consumer Protection Act, or the Dodd-Frank Act, the listing requirements of the stock exchange on which our common stock is traded and other applicable securities rules and regulations. The SEC and other regulators have continued to adopt new rules and regulations and make additional changes to existing regulations that require our compliance. Stockholder activism, the current political environment, and the current high level of government intervention and regulatory reform may lead to substantial new regulations and disclosure obligations, which may lead to additional compliance costs and impact, in ways we cannot currently anticipate, the manner in which we operate our business. Compliance with these rules and regulations may cause us to incur additional accounting, legal and other expenses that we did not incur as a private company. We also anticipate that we will incur costs associated with corporate governance requirements, including requirements under securities laws, as well as rules and regulations implemented by the SEC and the Nasdaq Global Select Market, particularly after we are no longer an “emerging growth company.” We expect these rules and regulations to increase our legal and financial compliance costs and to make some activities more time-consuming and costly. Furthermore, these rules and regulations could make it more difficult or costlier for us to obtain certain types of insurance, including director and officer liability insurance, and we may be forced to accept reduced policy limits and coverage or incur substantially higher costs to obtain the same or similar coverage. The impact of these requirements could also make it more difficult for us to attract and retain qualified persons to serve on our board of directors, our board committees or as executive officers. We are currently evaluating and monitoring developments with respect to these rules and regulations, and we cannot predict or estimate the amount of additional costs we may incur or the timing of such costs.
Risks related to our intellectual property
Our ability to protect our intellectual property and proprietary technology through patents and other means is uncertain.
Our commercial success depends in part on our ability to protect our intellectual property and proprietary technologies. We rely on patent protection, where appropriate and available, as well as a combination of copyright, trade secret and trademark laws, and nondisclosure, confidentiality and other contractual restrictions to protect our proprietary technology. However, these legal means afford only limited protection and may not adequately protect our rights or permit us to gain or keep any competitive advantage.
As of September 30, 2019, we own 14 issued U.S. patents and 3 issued international patents in China and 1 in Taiwan. There are 149 pending patent applications, including 48 in the United States, 91 international applications and 10 applications filed under the Patent Cooperation Treaty. We rely on a combination of patent rights, copyrights and trade secrets to protect the proprietary elements of our products. Our policy is to file patent applications to protect technology, inventions and improvements that are important to our business.
40
Table of Contents
Several patent applications covering our technologies have been filed recently. We cannot offer any assurances about which, if any, patents will issue, the breadth of any such patent, or whether any issued patents will be found invalid and unenforceable or will be threatened by third parties. Any successful opposition to these patents or any other patents owned by or, if applicable in the future, licensed to us could deprive us of rights necessary for the practice of our technologies or the successful commercialization of products that we may develop. Since patent applications in the U.S. and most other countries are confidential for a period of time after filing, we cannot be certain that we were the first to file any patent application related to our technologies or products. Furthermore, an interference proceeding can be provoked by a third party or instituted by the U.S. Patent and Trademark Office, or the USPTO, to determine who was the first to invent any of the subject matter covered by the patent claims of our applications.
Patent law can be highly uncertain and involve complex legal and factual questions for which important principles remain unresolved. In the United States and in many international jurisdictions, policy regarding the breadth of claims allowed in patents can be inconsistent. The U.S. Supreme Court and the Court of Appeals for the Federal Circuit have made, and will likely continue to make, changes in how the patent laws of the United States are interpreted. Similarly, international courts have made, and will likely continue to make, changes in how the patent laws in their respective jurisdictions are interpreted. We cannot predict future changes in the interpretation of patent laws or changes to patent laws that might be enacted into law by U.S. and international legislative bodies.
Moreover, the United States Leahy-Smith American Invents Act, enacted in September 2011, brought significant changes to the U.S. patent system, including a change from a “first to invent” system to a “first to file” system. Under a “first to file” system, assuming the other requirements for patentability are met, the first inventor to file a patent application generally will be entitled to the patent on an invention regardless of whether another inventor had made the invention earlier. Other changes affect the way the patent applications are prosecuted, redefine prior art, and may affect patent litigation. The USPTO developed new regulations and procedures to govern the administration of the Leahy-Smith Act, and many of the substantive changes to patent law associated with the Leahy-Smith Act became effective on March 16, 2013. The Leahy-Smith Act and its implementation could increase the uncertainties and costs surrounding the prosecution of our patent applications and the enforcement or defense of our issued patents, which could have a material adverse effect on our business and financial condition.
If we are unable to obtain, maintain and enforce intellectual property protection, others may be able to make, use, or sell products and technologies substantially the same as ours, which could adversely affect our ability to compete in the market.
We may not pursue or maintain patent protection for our products in every country or territory in which we sell our products and technologies. In addition, our pending U.S. and foreign patent applications may not issue as patents or may not issue in a form that will be sufficient to protect our proprietary technology and gain or keep our competitive advantage. Any patents we have obtained or do obtain may be subject to re-examination, reissue, opposition or other administrative proceedings, or may be challenged in litigation, and such challenges could result in a determination that the patent is invalid or unenforceable.
Patents have a limited lifespan. Patent terms may be shortened or lengthened by, for example, terminal disclaimers, patent term adjustments, supplemental protection certificates, and patent term extensions. Although extensions may be available, the life of a patent, and the protection it affords, is limited. Patent term extensions and supplemental protection certificates, and the like, may be impacted by the regulatory process and may not significantly lengthen patent term. Non-payment or delay in payment of patent fees or annuities, delay in patent filings or delay in extension filing, whether intentional or unintentional, may also result in the loss of patent rights important to our business. In such an event, competitors might be able to enter the market earlier than would otherwise have been the case. In addition, certain countries have compulsory licensing laws under which a patent owner may be compelled to grant licenses to other parties. Furthermore, many countries limit the enforceability of patents against other parties, including government agencies or government contractors. In these countries, the patent owner may have limited remedies, which could materially diminish the value of any patents.
41
Table of Contents
We cannot be certain that the steps we have taken will prevent unauthorized use or unauthorized reverse engineering of our technology. In addition, competitors may be able to design alternative methods or devices that avoid infringement of our patents. To the extent our intellectual property, including licensed intellectual property, offers inadequate protection, or is found to be invalid or unenforceable, we are exposed to a greater risk of direct competition. If our intellectual property does not provide adequate protection against our competitors’ products, our competitive position could be adversely affected, as could our business. Both the patent application process and the process of managing patent disputes can be time consuming and expensive.
Monitoring unauthorized use of our intellectual property is difficult and costly. From time to time, we review our competitors’ products, and may in the future seek to enforce our patents or other rights against potential infringement. However, the steps we have taken to protect our proprietary rights may not be adequate to prevent misappropriation of our intellectual property. We may not be able to detect unauthorized use of, or take appropriate steps to enforce, our intellectual property rights. We cannot guarantee that any of our patent searches or analyses, including but not limited to the identification of relevant patents, the scope of patent claims or the expiration of relevant patents, are complete or thorough, nor can we be certain that we have identified each and every third-party patent and pending application in the United States and abroad that is relevant to or necessary for the commercialization of our products in any jurisdiction. For example, U.S. applications filed before November 29, 2000 and certain U.S. applications filed after that date that will not be filed outside the United States remain confidential until patents issue. Patent applications in the United States and elsewhere are published approximately 18 months after the earliest filing for which priority is claimed. Therefore, patent applications covering our product candidates or technologies could have been filed by others without our knowledge. Additionally, pending patent applications that have been published can, subject to certain limitations, be later amended in a manner that could cover our platform technologies, our products or the use of our products or technologies. The scope of a patent claim is determined by the interpretation of the law, the written disclosure in a patent and the patent’s prosecution history. Our interpretation of the relevance or the scope of a patent or a pending application may be incorrect, which may negatively impact our ability to market our products. We may incorrectly determine that our products are not covered by a third-party patent or may incorrectly predict whether a third party’s pending application will issue with claims of relevant scope. Our determination of the expiration date of any patent in the United States or abroad that we consider relevant may be incorrect, which may negatively impact our ability to develop and market our product candidates.
Any inability to meaningfully protect our intellectual property could result in competitors offering products or technologies that incorporate our products or technologies, which could reduce demand for our products or technologies. A court or other judicial body may decide that the patent we seek to enforce is invalid or unenforceable or may refuse to stop the other party from using the technology at issue on the grounds that the patent in question does not cover the technology in question. An adverse result in any litigation could put one or more of our patents at risk of being invalidated or interpreted narrowly. Some of our competitors may be able to devote significantly more resources to intellectual property litigation and may have significantly broader patent portfolios to assert against us if we assert our rights against them.
We cannot predict the breadth of claims that may be allowed or enforced in our patents or in third-party patents. For example:
| • | we might not have been the first to make the inventions covered by each of our pending patent applications; |
| • | we might not have been the first to file patent applications for these inventions; |
| • | others may independently develop similar or alternative products and technologies or duplicate any of our products and technologies; |
| • | it is possible that none of our pending patent applications will result in issued patents, and even if they issue as patents, they may not provide a basis for commercially viable products, or may not provide us with any competitive advantages, or may be challenged and invalidated by third parties; |
42
Table of Contents
| • | we may not develop additional proprietary products and technologies that are patentable; |
| • | the patents of others may have an adverse effect on our business; and |
| • | we apply for patents covering our products and technologies and uses thereof, as we deem appropriate. However, we may fail to apply for patents on important products and technologies in a timely fashion or at all. |
We may not be able to protect our intellectual property rights throughout the world.
Filing, prosecuting and defending patents on our technologies and products in all countries throughout the world would be prohibitively expensive. In addition, the laws of some non-U.S. countries do not protect intellectual property rights to the same extent as the laws of the United States, and many companies have encountered significant problems in protecting and defending such rights in foreign jurisdictions. Consequently, we may not be able to prevent third parties from practicing our inventions in all countries outside the United States, or from selling or importing products made using our inventions in and into the United States or other jurisdictions. Competitors may use our technologies in jurisdictions where we have not obtained patent protection to develop their own technologies and products and further, may export otherwise infringing products to territories where we have patent protection, but enforcement is not as strong as that in the United States. These products may compete with our products, and our patents or other intellectual property rights may not be effective or sufficient enough to prevent them from competing.
The legal systems of certain countries, particularly certain developing countries, do not favor the enforcement of patents and other intellectual property protection, particularly those relating to biotechnology, which could make it difficult for us to stop the infringement of our patents. Proceedings to enforce our patent rights in foreign jurisdictions could result in substantial cost and divert our efforts and attention from other aspects of our business, could put our own patents at risk of being invalidated or interpreted narrowly and our patent applications at risk of not issuing, and could provoke third parties to assert claims against us. We may not prevail in any lawsuits that we initiate, and the damages or other remedies awarded, if any, may not be commercially meaningful. Accordingly, our efforts to enforce our intellectual property rights around the world may be inadequate to obtain a significant commercial advantage from the intellectual property that we develop.
If we are unable to protect the confidentiality of our proprietary information and know-how, the value of our technology and products could be adversely affected.
In addition to pursuing patents on our technology, we take steps to protect our intellectual property and proprietary technology by entering into confidentiality agreements and intellectual property assignment agreements with our employees, consultants, corporate partners and, when needed, our advisors. Such agreements may not be enforceable or may not provide meaningful protection for our trade secrets or other proprietary information in the event of unauthorized use or disclosure or other breaches of the agreements, and we may not be able to prevent such unauthorized disclosure. Monitoring unauthorized disclosure is difficult, and we do not know whether the steps we have taken to prevent such disclosure are, or will be, adequate. If we were to enforce a claim that a third party had illegally obtained and was using our trade secrets, it would be expensive and time consuming, and the outcome would be unpredictable. In addition, courts outside the United States may be less willing to protect trade secrets.
Trade secrets and know-how can be difficult to protect as trade secrets, and know-how will over time be disseminated within the industry through independent development, the publication of journal articles, and the movement of personnel skilled in the art from company to company. In addition, because we may rely on third parties in the development of our products, we may, at times, share trade secrets with them. We seek to protect our proprietary technology in part by entering into confidentiality agreements and, if applicable, material transfer agreements, consulting agreements or other similar agreements with third parties prior to beginning research or disclosing proprietary information. These agreements typically limit the rights of the third parties to use or
43
Table of Contents
disclose our confidential information, including our trade secrets. Despite the contractual provisions employed when working with third parties, the need to share trade secrets and other confidential information increases the risk that such trade secrets become known by our competitors, are inadvertently incorporated into the technology of others, or are disclosed or used in violation of these agreements. If we are unable to prevent material disclosure of the intellectual property related to our technologies to third parties, we will not be able to establish or maintain a competitive advantage in our market, which could materially adversely affect our business, results of operations and financial condition.
Despite our efforts to protect our trade secrets, our competitors may discover our trade secrets, either lawfully or through breach of our agreements with third parties, independent development or publication of information by any of our third-party collaborators. Competitors could willfully infringe our intellectual property rights, design around our protected technology or develop their own competitive technologies that fall outside of our intellectual property rights. In addition, if any of our trade secrets were to be lawfully obtained or independently developed by a competitor, we would have no right to prevent such competitor from using that technology or information to compete with us, which could harm our competitive position. Given that our proprietary position is based, in part, on our know-how and trade secrets, a competitor’s discovery of our trade secrets or other unauthorized use or disclosure would impair our competitive position and may have an adverse effect on our business and results of operations.
We may also be subject to claims that former employees, collaborators or other third parties have an ownership interest in our patents or other intellectual property. Other than the currently pending litigation filed by Agilent, described under the captions “Business—Legal proceedings” and “Risk factors—We and our chief executive officer are currently involved in litigation with Agilent in which Agilent has alleged a claim of trade secret misappropriation against Twist Bioscience and trade secret misappropriation and other related claims against our chief executive officer, and an adverse result could harm our business and results of operations”, no legal claims against us are currently pending. Some of our employees were previously employed at universities or biotechnology or biopharmaceutical companies, including our competitors or potential competitors. We may be subject to claims that these employees or we have inadvertently or otherwise used or disclosed trade secrets or other proprietary information of their former employers. Litigation may be necessary to defend against these and other claims challenging inventorship or ownership. If we fail in defending any such claims, in addition to paying monetary damages, we may lose valuable intellectual property rights. A loss of key research personnel or their work product could hamper our ability to commercialize, or prevent us from commercializing, our products and technologies. Such an outcome could have a material adverse effect on our business. Even if we are successful in defending against such claims, litigation could result in substantial costs and distraction to management and other employees.
We may be involved in lawsuits to protect or enforce our patents and proprietary rights, to determine the scope, coverage and validity of others’ proprietary rights, or to defend against third party claims of intellectual property infringement that could require us to spend significant time and money and could prevent us from selling our products or impact our stock price.
Litigation may be necessary for us to enforce our patent and proprietary rights and/or to determine the scope, coverage and validity of others’ proprietary rights. Litigation on these matters has been prevalent in our industry and we expect that this will continue. As the biotechnology and synthetic biology industries expand and more patents are issued, the risk increases that there may be patents issued to third parties that relate to our technologies and products of which we are not aware or that we may need to challenge to continue our operations as currently contemplated. In addition, our competitors and others may have patents or may in the future obtain patents and claim that the use of our products or processes infringes these patents. As we move into new markets and applications for our products and processes, incumbent participants in such markets may assert their patents and other proprietary rights against us as a means of slowing our entry into such markets or as a means to extract substantial license and royalty payments from us.
44
Table of Contents
To determine the priority of inventions, we may have to initiate and participate in interference proceedings declared by the USPTO that could result in substantial legal fees and could substantially affect the scope of our patent protection. Also, our intellectual property may be subject to significant administrative and litigation proceedings such as invalidity, unenforceability, re-examination and opposition proceedings against our patents. Whether merited or not, we may additionally face allegations that we have infringed the trademarks, copyrights, patents and other intellectual property rights of third parties, including patents held by our competitors or by non-practicing entities. If we fail to identify and correctly interpret relevant patents, we may be subject to infringement claims. We may also face allegations that our employees have misappropriated the intellectual property rights of their former employers or other third parties. The outcome of any litigation or other proceeding is inherently uncertain and the results might not be favorable to us. For more information on our current legal and regulatory proceedings, see the section of this Form 10-K captioned “Legal proceedings.”
In patent litigation in the United States, defendant counterclaims alleging invalidity or unenforceability are commonplace. Grounds for a validity challenge could be an alleged failure to meet any of several statutory requirements, for example, lack of novelty, obviousness or non-enablement. Grounds for an unenforceability assertion could be an allegation that someone connected with prosecution of the patent withheld relevant information from the USPTO or made a misleading statement during prosecution. The outcome following legal assertions of invalidity and unenforceability during patent litigation is unpredictable. If a defendant were to prevail on a legal assertion of invalidity or unenforceability, we would lose at least part, and perhaps all, of the patent protection on certain aspects of our platform technology. Such a loss of patent protection could have a material and adverse effect on our business, financial condition, results of operations and prospects.
Patent infringement suits can be expensive, lengthy and disruptive to business operations. We could incur substantial costs and divert the attention of our management and technical personnel in prosecuting or defending against any claims and may harm our reputation. Some of our competitors may be able to sustain the costs of complex patent litigation more effectively than we can because they have substantially greater resources. There can be no assurance that we will prevail in any suit initiated against us by third parties, successfully settle or otherwise resolve patent infringement claims. If we are unable to successfully settle claims on terms acceptable to us, we may be required to engage in or continue costly, unpredictable and time-consuming litigation and may be prevented from or experience substantial delays in marketing our technologies and products. Furthermore, parties making claims against us may be able to obtain injunctive or other relief, which could block our ability to develop, commercialize and sell products, and could result in the award of substantial damages against us, including treble damages and attorneys’ fees and costs in the event that we are found to be a willful infringer of third party patents.
In the event of a successful claim of infringement against us, we may be required to obtain one or more licenses from third parties, which we may not be able to obtain at a reasonable cost, if at all. We could therefore incur substantial costs related to royalty payments for licenses obtained from third parties, which could negatively affect our gross margins. In addition, we could encounter delays in product introductions while we attempt to develop alternative methods or products to avoid infringing third-party patents or proprietary rights. Defense of any lawsuit or failure to obtain any required licenses on favorable terms could prevent us from commercializing our products, and the risk of a prohibition on the sale of any of our products could adversely affect our ability to grow and gain market acceptance for our products.
Furthermore, because of the substantial amount of discovery required in connection with intellectual property litigation, there is a risk that some of our confidential information could be compromised by disclosure during this type of litigation. In addition, during the course of this kind of litigation, there could be public announcements of the results of hearings, motions or other interim proceedings or developments. If securities analysts or investors perceive these results to be negative, it could have a substantial adverse effect on the price of our common stock. Such litigation or proceedings could substantially increase our operating losses and reduce the resources available for development activities or any future sales, marketing or distribution activities. Finally, any uncertainties resulting from the initiation and continuation of any litigation could have a material adverse effect on our ability to raise the funds necessary to continue our operations.
45
Table of Contents
In addition, our agreements with some of our suppliers, distributors, customers and other entities with whom we do business may require us to defend or indemnify these parties to the extent they become involved in infringement claims against us, including the claims described above. We could also voluntarily agree to defend or indemnify third parties in instances where we are not obligated to do so if we determine it would be important to our business relationships. If we are required or agree to defend or indemnify any of these third parties in connection with any infringement claims, we could incur significant costs and expenses that could adversely affect our business, operating results, or financial condition.
We may not be successful in obtaining or maintaining necessary rights to our products and technologies through acquisitions and in-licenses, and our intellectual property agreements with third parties may involve unfavorable terms or be subject to disagreements over contract interpretation.
We may find that our programs require the use of proprietary rights held by third parties, and the growth of our business may depend in part on our ability to acquire, in-license or use these proprietary rights. We may be unable to acquire or in-license compositions, methods of use, processes or other third-party intellectual property rights from third parties that we identify as necessary for our products and technologies. The licensing and acquisition of third-party intellectual property rights is a competitive area, and other companies may also be pursuing strategies to license or acquire third-party intellectual property rights that we may consider attractive. These companies may have a competitive advantage over us due to their size, financial resources and greater commercialization capabilities. In addition, companies that perceive us to be a competitor may be unwilling to assign or license rights to us. Moreover, collaboration arrangements are complex and time-consuming to negotiate, document, implement and maintain. We may not be successful in our efforts to establish and implement collaborations or other alternative arrangements should we so choose to enter into such arrangements. We also may be unable to license or acquire third-party intellectual property rights on terms that would be favorable to us or would allow us to make an appropriate return on our investment.
We engage in discussions regarding other possible commercial and cross-licensing agreements with third parties from time to time. There can be no assurance that these discussions will lead to the execution of commercial license or cross-license agreements or that such agreements will be on terms that are favorable to us. Even if we are able to obtain a license to intellectual property of interest, we may not be able to secure exclusive rights, in which case others could use the same rights and compete with us. In addition, if we enter into cross-licensing agreements, there is no assurance that we will be able to effectively compete against others who are licensed under our patents.
In addition, provisions in our licensing and other intellectual property agreements may be susceptible to multiple interpretations. The resolution of any contract interpretation disagreement that may arise could affect the scope of our rights to the relevant intellectual property or technology or affect financial or other obligations under the relevant agreement, either of which could have a material adverse effect on our business, financial condition, results of operations and prospects.
We have not yet registered some of our trademarks in all of our potential markets, and failure to secure those registrations could adversely affect our business.
Some of our trademark applications may not be allowed for registration, and our registered trademarks may not be maintained or enforced. In addition, in the U.S. Patent and Trademark Office and in comparable agencies in many foreign jurisdictions, third parties are given an opportunity to oppose pending trademark applications and to seek to cancel registered trademarks. Opposition or cancellation proceedings may be filed against our trademarks, and our trademarks may not survive such proceedings.
In addition, third parties may file first for our trademarks in certain countries. If they succeed in registering such trademarks, and if we are not successful in challenging such third-party rights, we may not be able to use these trademarks for marketing our products and technologies in those countries. Over the long-term, if we are unable
46
Table of Contents
to establish name recognition based on our trademarks, then our marketing abilities may be materially adversely impacted.
We depend on certain technologies that are licensed to us. We do not control these technologies and any loss of our rights to them could prevent us from selling our products.
We rely on, or may in the future rely on, licenses in order to be able to use various proprietary technologies that are material to our business. We do not or will not own the patents that underlie these licenses. Our rights to use the technology we license are subject to the negotiation of, continuation of and compliance with the terms of those licenses. In some cases, we do not or will not control the prosecution, maintenance, or filing of the patents to which we hold licenses, or the enforcement of these patents against third parties. Some of our patents and patent applications were either acquired from another company who acquired those patents and patent applications from yet another company or are licensed from a third party. For example, Twist Bioscience acquired Genome Compiler Corporation in 2016, and Genome Compiler had a non-exclusive license to U.S. Patent No. 7,805,252 owned by DNA 2.0. Thus, these patents and patent applications are not written by us or our attorneys, and we did not have control over the drafting and prosecution. The former patent owners and our licensors might not have given the same attention to the drafting and prosecution of these patents and applications as we would have if we had been the owners of the patents and applications and had control over the drafting and prosecution. We cannot be certain that drafting and/or prosecution of the licensed patents and patent applications by the licensors have been or will be conducted in compliance with applicable laws and regulations or will result in valid and enforceable patents and other intellectual property rights.
Our rights to use the technology we license is subject to the validity of the owner’s intellectual property rights. Enforcement of our licensed patents or defense or any claims asserting the invalidity of these patents is often subject to the control or cooperation of our licensors. Legal action could be initiated against the owners of the intellectual property that we license. Even if we are not a party to these legal actions, an adverse outcome could harm our business because it might prevent these other companies or institutions from continuing to license intellectual property that we may need to operate our business.
Our licenses contain or will contain provisions that allow the licensor to terminate the license upon specific conditions. Our rights under the licenses are subject to or will be subject to our continued compliance with the terms of the license, including the payment of royalties due under the license. Termination of these licenses could prevent us from marketing some or all of our products. Because of the complexity of our products and the patents we have licensed, determining the scope of the license and related royalty obligation can be difficult and can lead to disputes between us and the licensor. An unfavorable resolution of such a dispute could lead to an increase in the royalties payable pursuant to the license. If a licensor believed we were not paying the royalties due under the license or were otherwise not in compliance with the terms of the license, the licensor might attempt to revoke the license. If such an attempt were successful, we might be barred from producing and selling some or all of our products.
Risks related to doing business in China
The People’s Republic of China, or the PRC, government has the ability to exercise significant influence and control over our proposed wholly owned foreign entity in China.
The PRC plays a significant role in regulating industrial development by imposing business regulations. It also exercises significant control over the country’s economic growth through the allocation of resources, controlling the payment of foreign currency-denominated obligations, setting monetary policy and providing preferential treatment to particular industries or companies.
Additional factors that we may experience in connection with setting up operations in China that may adversely affect our business and results of operations include:
| • | our inability to enforce or obtain a remedy under our agreements; |
47
Table of Contents
| • | PRC restrictions on foreign investment that could impair our ability to conduct our business or acquire or contract with other entities in the future; |
| • | restrictions on currency exchange that may limit our ability to use cash flow most effectively or to repatriate our investments; |
| • | fluctuations in currency values; |
| • | increased challenges of defending our intellectual property; |
| • | cultural, language and managerial differences that may reduce our overall performance; and |
| • | political instability in China. |
We may not be able to enforce our rights in China.
China’s legal and judicial system may negatively impact foreign investors. The legal system in China is evolving rapidly, and the enforcement of laws is inconsistent. It may be impossible to obtain swift and equitable enforcement of laws or enforcement of the judgment of one court by a court of another jurisdiction. China’s legal system is based on civil law or written statutes and a decision by one judge does not set a legal precedent that must be followed by judges in other cases. In addition, the interpretation of Chinese laws may vary to reflect domestic political changes.
There are substantial uncertainties regarding the interpretation and application to our business of PRC laws and regulations, since many of the rules and regulations that companies face in China are not made public. The effectiveness of newly enacted laws, regulations or amendments may be delayed, resulting in detrimental reliance by foreign investors. We cannot predict what effect the interpretation of existing or new PRC laws or regulations may have on the proposed business of our wholly foreign owned entity.
China is a developing nation governed by a one-party communist government and susceptible to political, economic, and social upheaval that could disrupt the economy.
China is a developing country governed by a one-party government. China is also a country with an extremely large population, wide income gaps between rich and poor and between urban and rural residents, minority ethnic and religious populations, and growing access to information about the different social, economic, and political systems found in other countries. China has also experienced extremely rapid economic growth over the last decade, and its legal and regulatory systems have had to change rapidly to accommodate this growth. If China experiences political or economic upheaval, labor disruptions or other organized protests, nationalization of private businesses, civil strife, strikes, acts of war and insurrections, this may disrupt China’s economy and could materially and adversely affect the financial performance of our proposed wholly foreign owned entity.
If relations between China and the U.S. deteriorate, our business in the United States and China may be materially and adversely affected.
The relationship between China and the U.S. is subject to periodic tension. Relations may also be compromised if the U.S. becomes a more active advocate of Taiwan or pressures the PRC government regarding its monetary, economic or social policies. Changes in political conditions in China and changes in the state of China-U.S. relations are difficult to predict and could adversely affect the operations or financial condition of our proposed wholly owned foreign owned entity. In addition, because of our involvement in the Chinese market, any deterioration in political or trade relations might cause a public perception in the U.S. or elsewhere that might cause our products to become less attractive. A proposed enhancement of U.S. export controls is expected to apply to U.S. technology exports to China and Chinese companies, in addition to a more stringent review of foreign investment in U.S. technology companies by the Committee on Foreign Investment in the United States. We cannot predict what effect any changes in China-U.S. relations may have on our ability to access capital or effectively do business in China, including through the proposed business of our proposed wholly foreign owned entity.
48
Table of Contents
Governmental control of currency conversion may limit our ability to utilize our revenues effectively and affect the value of your investment.
The PRC government imposes controls on the convertibility of the Chinese currency, Renminbi, into foreign currencies and, in certain cases, the remittance of currency out of China. Under existing PRC foreign exchange regulations, payments of current account items, including profit distributions, interest payments and trade and service-related foreign exchange transactions, can be made in foreign currencies without prior approval of State Administration of Foreign Exchange, or SAFE, by complying with certain procedural requirements. However, in practice sometimes payment of current account items may be subject to delay and other restrictions. Furthermore, approval from or registration with appropriate government authorities is required where Renminbi is to be converted into foreign currency and remitted out of China to pay capital expenses such as the repayment of loans denominated in foreign currencies.
In light of the flood of capital outflows of China in 2016 due to the weakening Renminbi, the PRC government has imposed more restrictive foreign exchange policies and stepped up scrutiny of major outbound capital movement including overseas direct investment.
More restrictions and substantial vetting process are put in place by SAFE to regulate cross-border transactions falling under the capital account. The PRC government may at its discretion further restrict access in the future to foreign currencies for current account transactions. Therefore, if we receive revenues in Renminbi by our proposed wholly foreign owned entity or otherwise, due to China’s foreign exchange control, such revenues may not be converted to foreign currency and remitted out of China in a timely manner.
Risks relating to owning our common stock
The market price of our common stock is likely to be volatile and could fluctuate or decline, resulting in a substantial loss of your investment.
The market price of our common stock could be subject to wide fluctuations in response to, among other things, the factors described in this “Risk factors” section or otherwise, and other factors beyond our control, such as fluctuations in the valuations of companies perceived by investors to be comparable to us.
Furthermore, the stock markets have experienced price and volume fluctuations that have affected and continue to affect the market prices of equity securities of many companies. These fluctuations often have been unrelated or disproportionate to the operating performance of those companies. These broad market fluctuations, as well as general economic, systemic, political and market conditions, such as recessions, interest rate changes or international currency fluctuations, may negatively affect the market price of our common stock.
Factors that could cause the market price of our common stock to fluctuate significantly include:
| • | actual or anticipated fluctuations in our financial condition and operating results, including fluctuations in our quarterly and annual results; |
| • | announcements of technological innovations by us or our competitors; |
| • | overall conditions in our industry and the markets in which we operate; |
| • | addition or loss of significant customers, or other developments with respect to significant customers; |
| • | changes in laws or regulations applicable to our products; |
| • | actual or anticipated changes in our growth rate relative to our competitors; |
| • | announcements by us or our competitors of significant acquisitions, strategic partnerships, joint ventures or capital commitments; |
49
Table of Contents
| • | additions or departures of key personnel; |
| • | competition from existing products or new products that may emerge; |
| • | issuance of new or updated research or reports by securities analysts; |
| • | fluctuations in the valuation of companies perceived by investors to be comparable to us; |
| • | disputes or other developments related to proprietary rights, including patents, litigation matters including the Agilent litigation, and our ability to obtain intellectual property protection for our technologies; |
| • | announcement or expectation of additional financing efforts; |
| • | sales of our common stock by us or our stockholders; |
| • | share price and volume fluctuations attributable to inconsistent trading volume levels of our shares; |
| • | the expiration of contractual lock-up agreements with our executive officers, directors and stockholders; and |
| • | general economic and market conditions. |
In the past, many companies that have experienced volatility in the market price of their stock have become subject to securities class action litigation. We may be the target of this type of litigation in the future. Securities litigation against us could result in substantial costs and divert our management’s attention from other business concerns, which could harm our business.
If securities or industry analysts do not publish research or reports about our business or publish negative reports about our business, our share price and trading volume could decline.
The trading market for our common stock will depend on the research and reports that securities or industry analysts publish about us or our business and we will not have any control over such analysts. If one or more of the analysts who cover us downgrade our shares or change their opinion of our shares, our share price would likely decline. If one or more of these analysts cease coverage of our company or fail to regularly publish reports on us, we could lose visibility in the financial markets, which could cause our share price or trading volume to decline.
Future sales and issuances of our common stock or rights to purchase common stock, including pursuant to our equity incentive plans, could result in additional dilution of the percentage ownership of our stockholders and could cause the stock price of our common stock to decline.
In the future, we may sell common stock, convertible securities or other equity securities in one or more transactions at prices and in a manner, we determine from time to time. We also expect to issue common stock to employees and directors pursuant to our equity incentive plans. If we sell common stock, convertible securities or other equity securities in subsequent transactions, or common stock is issued pursuant to equity incentive plans, investors may be materially diluted. New investors in such subsequent transactions could gain rights, preferences and privileges senior to those of holders of our common stock.
We have never paid dividends on our capital stock and we do not intend to pay dividends for the foreseeable future. Consequently, any gains from an investment in our common stock will likely depend on whether the price of our common stock increases.
We have never declared or paid any dividends on our common stock and do not intend to pay any dividends in the foreseeable future. We anticipate that we will retain all of our future earnings for use in the operation of our business and for general corporate purposes. Any determination to pay dividends in the future will be at the
50
Table of Contents
discretion of our board of directors. Accordingly, investors must rely on sales of their common stock after price appreciation, which may never occur, as the only way to realize any future gains on their investments. Furthermore, we are party to a credit agreement with Silicon Valley Bank which contains negative covenants that limit our ability to pay dividends. For more information, see the section of this Form 10-K captioned “Management’s discussion and analysis of financial condition and results of operation—Liquidity and capital resources.” For more information regarding the negative covenants in our loan and security agreement with Silicon Valley Bank, see “Risk factors—Our credit facility contains restrictions that limit our flexibility in operating our business.”
Our charter documents and Delaware law could prevent a takeover that stockholders consider favorable and could also reduce the market price of our stock.
Our amended and restated certificate of incorporation and our amended and restated bylaws will contain provisions that could delay or prevent a change in control of our company. These provisions could also make it more difficult for stockholders to elect directors and take other corporate actions. These provisions include:
| • | providing for a classified board of directors with staggered, three-year terms; |
| • | authorizing our board of directors to issue preferred stock with voting or other rights or preferences that could discourage a takeover attempt or delay changes in control; |
| • | prohibiting cumulative voting in the election of directors; |
| • | providing that vacancies on our board of directors may be filled only by a majority of directors then in office, even though less than a quorum; |
| • | prohibiting the adoption, amendment or repeal of our amended and restated bylaws or the repeal of the provisions of our amended and restated certificate of incorporation regarding the election and removal of directors without the required approval of at least 66.67% of the shares entitled to vote at an election of directors; |
| • | prohibiting stockholder action by written consent; |
| • | limiting the persons who may call special meetings of stockholders; and |
| • | requiring advance notification of stockholder nominations and proposals. |
These provisions may frustrate or prevent any attempts by our stockholders to replace or remove our current management by making it more difficult for stockholders to replace members of our board of directors, which is responsible for appointing the members of our management. In addition, the provisions of Section 203 of the Delaware General Corporate Law, or the DGCL, govern us. These provisions may prohibit large stockholders, in particular those owning 15% or more of our outstanding voting stock, from merging or combining with us for a certain period of time without the consent of our board of directors.
These and other provisions in our amended and restated certificate of incorporation and our amended and restated bylaws and under Delaware law could discourage potential takeover attempts, reduce the price investors might be willing to pay in the future for shares of our common stock and result in the market price of our common stock being lower than it would be without these provisions.
Insiders have substantial control over us and will be able to influence corporate matters.
As of September 30, 2019, our directors and executive officers and their affiliates beneficially own, in the aggregate, approximately 27.2% of our outstanding capital stock. As a result, these stockholders will be able to exercise significant influence over all matters requiring stockholder approval, including the election of directors and approval of significant corporate transactions, such as a merger or other sale of our company or its assets. This concentration of ownership could limit stockholders’ ability to influence corporate matters and may have the effect of delaying or preventing a third party from acquiring control over us.
51
Table of Contents
Claims for indemnification by our directors and officers may reduce our available funds to satisfy successful third-party claims against us and may reduce the amount of money available to us.
Our amended and restated certificate of incorporation and amended and restated bylaws provide that we will indemnify our directors and officers, in each case to the fullest extent permitted by Delaware law.
In addition, as permitted by Section 145 of the DGCL, our amended and restated bylaws and our indemnification agreements that we have entered into with our directors and officers provide that:
| • | We will indemnify our directors and officers for serving us in those capacities or for serving other business enterprises at our request, to the fullest extent permitted by Delaware law. Delaware law provides that a corporation may indemnify such person if such person acted in good faith and in a manner such person reasonably believed to be in or not opposed to the best interests of the registrant and, with respect to any criminal proceeding, had no reasonable cause to believe such person’s conduct was unlawful; |
| • | We may, in our discretion, indemnify employees and agents in those circumstances where indemnification is permitted by applicable law; |
| • | We are required to advance expenses, as incurred, to our directors and officers in connection with defending a proceeding, except that such directors or officers shall undertake to repay such advances if it is ultimately determined that such person is not entitled to indemnification; |
| • | We will not be obligated pursuant to our amended and restated bylaws to indemnify a person with respect to proceedings initiated by that person against us or our other indemnitees, except with respect to proceedings authorized by our board of directors or brought to enforce a right to indemnification; |
| • | The rights conferred in our amended and restated bylaws are not exclusive, and we are authorized to enter into indemnification agreements with our directors, officers, employees and agents and to obtain insurance to indemnify such persons; and |
| • | We may not retroactively amend our amended and restated bylaw provisions to reduce our indemnification obligations to directors, officers, employees and agents. |
Our amended and restated certificate of incorporation provides that the Court of Chancery of the State of Delaware and the federal district courts of the United States will be the exclusive forum for substantially all disputes between us and our stockholders, which could limit our stockholders’ ability to obtain a favorable judicial forum for disputes with us or our directors, officers or other employees.
Our amended and restated certificate of incorporation provides that the Court of Chancery of the State of Delaware is the sole and exclusive forum for any derivative action or proceeding brought on our behalf, any action asserting a breach of fiduciary duty owed by any of our directors, officers or other employees to us or our stockholders, any action asserting a claim against us arising pursuant to any provisions of the DGCL, our amended and restated certificate of incorporation or our amended and restated bylaws, any action or proceeding asserting a claim as to which the Delaware General Corporation Law confers jurisdiction upon the Court of Chancery of the State of Delaware or any action asserting a claim against us that is governed by the internal affairs doctrine, subject in each case to the Court of Chancery having personal jurisdiction over the parties named as defendants therein. The exclusive forum provision will not apply to suits brought to enforce any liability or duty created by the Exchange Act or any other claim for which the federal courts have exclusive jurisdiction. The choice of forum provision may limit a stockholder’s ability to bring a claim in a judicial forum that it finds favorable for disputes with us or our directors, officers or other employees, which may discourage such lawsuits against us and our directors, officers and other employees. If a court were to find the choice of forum provision contained in our amended and restated certificate of incorporation to be inapplicable or unenforceable in an action, we might incur additional costs associated with resolving such action in other jurisdictions.
In addition, our amended and restated certificate of incorporation provides that the U.S. federal district courts are the exclusive forum for the resolution of any complaint asserting a cause of action arising under the Securities
52
Table of Contents
Act. Our exclusive forum provision will not relieve us of our duties to comply with the federal securities laws and the rules and regulations thereunder, and our stockholders will not be deemed to have waived our compliance with these laws, rules and regulations.
The enforceability of similar federal court choice of forum provisions in other companies’ certificates of incorporation has been challenged in legal proceedings, and it is possible that a court could find our federal court choice of forum provision to be inapplicable or unenforceable. If a court were to find either of the choice of forum provisions contained in our amended and restated certificate of incorporation to be inapplicable or unenforceable in an action, we may incur additional costs associated with resolving such action in other jurisdictions.
For example, on December 19, 2018, the Court of Chancery of the State of Delaware issued an opinion in Sciabacucchi v. Salzberg, C.A. No. 2017-0931-JTL, invalidating provisions in the certificates of incorporation of Delaware companies that purport to designate federal district courts as the exclusive forum in which a stockholder could bring a claim under the Securities Act. The Court of Chancery held that a Delaware corporation can only use its constitutive documents to bind a plaintiff to a particular forum where the claim involves rights or relationships established by or under Delaware’s corporate law. In light of the Sciabacucchi decision, we do not currently intend to enforce our federal forum selection provision unless the Sciabacucchi decision is appealed and the Supreme Court for the State of Delaware reverses the decision. If the Supreme Court for the State of Delaware affirms the Delaware Chancery Court’s decision, we intend to seek approval by our stockholders to amend the amended and restated certificate of incorporation at our next regularly scheduled annual meeting of stockholders to remove the invalid provision.
| Item 1B. | Unresolved staff comments |
None.
| Item 2. | Properties |
Our principal facilities are described below:
| Principal Facilities |
Approximate Square Footage |
Lease Expiration |
Use |
Owned or | ||||||||
| San Francisco, CA |
4,940 | 2019 | R&D and Manufacturing |
Leased | ||||||||
| San Francisco, CA |
10,750 | 2020 | General & Administration |
Leased | ||||||||
| South San Francisco, CA |
60,963 | 2026 | General & Administration, R&D and Manufacturing |
Leased | ||||||||
| Carlsbad, CA |
2,496 | 2020 | Sales & Marketing |
Leased | ||||||||
| Tel Aviv, IL |
9,332 | 2022 | R&D |
Leased | ||||||||
| Guangzhou, China |
11,583 | 2024 | R&D and Manufacturing |
Leased | ||||||||
The Company believes its existing facilities are in good operating condition and are suitable for the conduct of its business.
| Item 3. | Legal proceedings |
On February 3, 2016, Agilent filed a lawsuit against us and our Chief Executive Officer, Dr. Emily Leproust, in the Superior Court of California, Santa Clara County, or the Court. The complaint also names Does 1 through 20, which are fictitious placeholder defendants. As discussed below in more detail, Agilent has filed a motion for leave to amend its complaint, including to add two individuals as defendants, and Agilent may seek to amend its complaint to name additional defendants in the future. Agilent’s complaint alleges three claims: (1) alleged breach of contract, related to the use of confidential information and alleged breach of non-solicitation
53
Table of Contents
obligations against Dr. Leproust; (2) alleged breach of a duty of loyalty against Dr. Leproust; and (3) alleged misappropriation of trade secrets under the California Uniform Trade Secrets Act, or CUTSA, against all defendants.
On August 22, 2018, Agilent filed a motion for leave to amend its complaint, including to add two individuals as defendants. On September 12, 2018, Agilent filed a supplemental declaration in support of its motion to amend, which attached a new, proposed Second Amended Complaint that revised certain allegations in paragraph 2 of the document. On September 28, 2018, Agilent filed a motion for a protective order seeking to impose limits on the defendants’ discovery in the case. The Company and Dr. Leproust opposed both motions.
On December 7, 2018, the Court granted Agilent’s motion to amend its complaint, permitting Agilent to file its Second Amended Complaint. This new complaint, filed on December 13, 2018, adds amended allegations against the Company and Dr. Leproust, and also sets forth new claims for breach of contract and trade secret misappropriation against two individuals: a current employee and a former employee. However, the Court denied Agilent’s motion for a protective order and did not set any limits on discovery.
In addition, on December 7, 2018, the Court held a case management conference and set the trial to start on February 24, 2020. On January 22, 2019, the Court issued an Order appointing the Honorable W. James Ware (Ret.) as Discovery Referee.
Agilent’s specific allegations against the Company and Dr. Leproust are set forth in its second amended complaint, which maintains the same set of claims against the Company and Dr. Leproust as the superseded first amended complaint. With regard to the misappropriation claim, Agilent alleges, among other things, that the Company and Dr. Leproust misappropriated trade secrets relating to Agilent’s oligonucleotide synthesis technology and used those secrets to develop Twist’s technology and identify personnel to hire from Agilent. With regard to the breach of loyalty claim, Agilent alleges, among other things, that Dr. Leproust improperly withheld strategic business and technological plans from Agilent and diverted those plans to Twist instead. With regard to the breach of contract claim, Agilent alleges, among other things, that Dr. Leproust violated her contractual obligations under her employment agreement with Agilent, including by failing to disclose the aforementioned plans and by soliciting one or more Agilent employees to terminate their employment within two years of her resignation.
Agilent’s requested relief, in its second amended complaint, includes: compensatory damages; injunctive relief; punitive and/or statutory exemplary damages; a constructive trust upon allegedly misappropriated assets and gains derived from alleged breaches of agreements; and its attorneys’ fees and costs.
On January 29, 2019, the Company and Dr. Leproust filed a demurrer and motion to strike Agilent’s second amended complaint, challenging each of Agilent’s claims. First, the Company and Dr. Leproust asserted that Agilent’s breach of contract claim is antithetical to California law and public policy favoring employee mobility. Second, the Company and Dr. Leproust asserted that California precedent requires that Agilent’s duty of loyalty claim be dismissed. Third, the Company and Dr. Leproust asserted that Agilent’s trade secret misappropriation claims must be dismissed for failure to identify any harm.
That same day, the Company and Dr. Leproust filed a cross-complaint, asserting six counterclaims against Agilent and Does 1-10 for (1) declaration of no trade secret misappropriation; (2) declaration of no breach of contract; (3) declaration of no breach of duty of loyalty; (4) defamation, defamation per se, libel, libel per se, slander, and slander per se; (5) intentional interference with prospective economic advantage; and (6) unlawful and unfair competition. The Company and Dr. Leproust also filed their answer and affirmative defenses to Agilent’s second amended complaint. The answer to Agilent’s second amended complaint responded to Agilent’s allegations and asserted numerous affirmative defenses and furthermore denies Agilent’s claims have merit or entitle it to any relief.
54
Table of Contents
On March 4, 2019, Agilent filed a demurrer and motion to strike challenging all six claims alleged in the Company’s cross-complaint filed on January 29, 2019. The Company and Dr. Leproust opposed Agilent’s motions.
On May 10, 2019, the Court issued its ruling denying Agilent’s demurrer and motion to strike the Company’s cross-complaint. In addition, the Court issued its ruling denying the Company’s demurrer and motion to strike certain allegations associated with Agilent’s breach of contract claim, but granted the Company’s motion to strike breach of contract allegations relating to the non-solicitation provision in Agilent’s employment contract.
On May 16, 2019, Agilent filed its notice of appeal of the Court’s May 10, 2019 ruling denying Agilent’s motion to strike. On May 22, 2019, Agilent sought ex parte relief from the Court to stay all proceedings related to both the Company’s cross-claims and Agilent’s affirmative claims. The Court stayed proceedings relating to the Company’s cross-claims, which was not opposed by the Company, but denied Agilent’s request for a discovery stay related to Agilent’s affirmative claims. Agilent then filed a noticed motion seeking to stay proceedings related to its affirmative claims on June 14, 2019, and following a hearing on June 28, 2019, the Court denied Agilent’s motion. Agilent has not appealed this ruling.
The parties, including the Company and Dr. Leproust, have since been conducting fact and expert discovery, with the latter set to close on December 16, 2019.
Trial remains set for February 24, 2020.
We and Dr. Leproust currently believe that we have substantial and meritorious defenses to Agilent’s claims and intend to vigorously defend our position, including through the trial and appellate stages if necessary. The outcome of any litigation, however, is inherently uncertain and there can be no assurance that the outcome of the case or the costs of litigation, regardless of outcome, will not have a material adverse effect on our business.
From time to time, the Company posts case updates detailing relevant developments in its ongoing litigation with Agilent at the following website: https://investors.twistbioscience.com/agilent-v-twist-litigation.
We may also be subject to various other legal proceedings and claims arising in the ordinary course of business. Although occasional adverse decisions or settlements may occur, management believes that the final disposition of such matters will not have a material adverse effect on our business, financial position, results of operations or cash flows.
| Item 4. | Mine safety disclosures |
Not applicable.
55
Table of Contents
| Item 5. | Market for registrant’s common equity, related stockholder matters and issuer purchases of equity securities |
Market information for common stock
Our common stock began trading on The Nasdaq Global Market under the symbol “TWST” on October 31, 2018 in connection with the initial public offering of our common stock. Prior to that date, there was no public market for our common stock.
Holders of Record
As of December 9, 2019, there were approximately 107 holders of record of our common stock. Because many of our shares of common stock are held by brokers and other institutions on behalf of stockholders, we are unable to estimate the total number of stockholders represented by these record holders.
Dividend Policy
We have never declared or paid, and do not anticipate declaring or paying in the foreseeable future, any cash dividends on our capital stock. Any future determination to declare cash dividends will be made at the discretion of our board of directors, subject to applicable laws, and will depend on our financial condition, results of operations, capital requirements, general business conditions and other factors that our board of directors may deem relevant.
Securities authorized for issuance under equity compensation plans
Equity compensation plan information
The following table presents information as of September 30, 2019 with respect to compensation plans under which shares of our common stock may be issued.
| Plan |
Shares issuable upon exercise of outstanding plan options, warrants and rights (a) |
Weighted- average exercise price of outstanding options, warrants and rights (b) |
Shares remaining available for future issuance under plan (excluding those reflected in column (a))(c) |
|||||||||
| Equity compensation plan approved by security holders(1)(2) |
3,550,445 | $ | 15.99 | 1,576,956 | (2) | |||||||
| Equity compensation plans not approved by security holders |
— | — | — | |||||||||
| Total |
3,550,445 | $ | 15.99 | 1,576,956 | ||||||||
|
|
|
|
|
|
|
|||||||
| (1) | Includes our 2013 Stock Plan, 2018 Equity Incentive Plan and our 2018 Employee Stock Purchase Plan. |
| (2) | Includes 56,081 shares that remain available for purchase under the 2018 Employee Stock Purchase Plan and 1,520,875 shares of common stock that remain available for grant under the 2018 Equity Incentive Plan. There are no shares of common stock available for issuance under our 2013 Plan, but the plan continues to govern the terms of stock options granted thereunder. Any shares of common stock that are subject to outstanding awards under the 2013 Plan that are issuable upon the exercise of stock options that expire or become unexercisable for any reason without having been exercised in full will generally be available for future grant and issuance under our 2018 Equity Incentive Plan. In addition, the 2018 Plan provides for an automatic increase in the number of shares reserved for issuance thereunder on the first day of each fiscal |
56
Table of Contents
| year for the remaining term of the plan equal to the least of (a) 4.0% of the number of issued and outstanding shares of common stock outstanding at that time, (b) 999,900 shares, or (c) a lesser amount as approved by the board each year. Also, the 2018 Employee Stock Purchase Plan provides for an automatic annual increase in the number of shares reserved for issuance thereunder on the first day of each fiscal year for the remaining term of the plan equal to the least of (a) 1.0% of the number of issued and outstanding shares of common stock outstanding, (b) 249,470 shares, or (c) a lesser amount as approved by the Board each year. |
Sales of unregistered securities
None.
Use of proceeds from public offering of common stock.
On October 30, 2018, our registration statement on Form S-1 (Registration No. 333-227672) was declared effective by the SEC for our initial public offering pursuant to which we registered an aggregate of 5,000,000 shares of our common stock at an initial public offering price of $14.00 per share for an aggregate price of $70.0 million. Sale of an additional 750,000 shares was registered upon exercise of the underwriters’ option to purchase additional shares at an offering price of $14.00 per share for an aggregate price of approximately $10.5 million. The underwriters of the offering were J.P. Morgan Securities LLC, Cowen and Company, LLC, Allen & Company LLC, and Robert W. Baird & Co Incorporated. We paid the underwriters of our initial public offering underwriting discounts and commissions totaling $5.6 million, also, we incurred $5.3 million in offering costs. Thus, the net offering proceeds, after deducting underwriting discounts and offering expenses, were $69.6 million.
On May 9, 2019, we completed an underwritten public offering of common stock. A total of 4,312,500 shares were offered and sold at a price of $21.00 per share, and the Company received net proceeds of $84.3 million. The underwriters of the offering were J.P. Morgan Securities LLC, Cowen and Company, LLC, Evercore Group LLC, and Robert W. Baird & Co Incorporated. We paid the underwriters an underwriting discount and commission totaling $5.4 million, and we incurred offering expenses of $0.9 million.
We have begun using and intend to use the net proceeds from these offerings primarily to (i) improve and update our platform and core technologies, (ii) expand our sales and marketing capabilities in the U.S. and other geographies, including China, (iii) continue to expand in the pharmaceutical biologics drug discovery and DNA data storage markets, (iv) establish our operations in China, and (v) for working capital and general corporate purposes. While we have no current agreements, commitments or understandings for any specific strategic acquisitions or in-licenses at this time, we may use a portion of the net proceeds for these purposes.
Issuer Purchases of Equity Securities
None.
57
Table of Contents
| Item 6. | Selected consolidated financial data |
The selected consolidated statements of operations and comprehensive loss data for the years ended September 30, 2019, 2018, and 2017 and the consolidated balance sheet data as of September 30, 2019 and 2018 are derived from our audited consolidated financial statements included elsewhere in this report and should be read together with “Management’s Discussion and Analysis of Financial Condition and Results of Operations”, and Item 8, “Consolidated financial statements and Supplementary Data”. We derived the selected consolidated balance sheet data as of September 30, 2017 from our audited financial statements not included in this report. Our historical results are not necessarily indicative of our results in any future period.
| Year ended September 30, | ||||||||||||
| (in thousands, except share and per share data) |
2019 | 2018 | 2017 | |||||||||
| Consolidated statements of operations and comprehensive loss data: |
||||||||||||
| Revenues |
$ | 54,385 | $ | 25,427 | $ | 10,767 | ||||||
| Operating expenses: |
||||||||||||
| Cost of revenues |
47,426 | 32,189 | 24,020 | |||||||||
| Research and development |
35,683 | 20,347 | 19,169 | |||||||||
| Selling, general and administrative |
80,126 | 43,450 | 26,060 | |||||||||
|
|
|
|
|
|
|
|||||||
| Total operating expenses |
163,235 | 95,986 | 69,249 | |||||||||
|
|
|
|
|
|
|
|||||||
| Loss from operations |
(108,850 | ) | (70,559 | ) | (58,482 | ) | ||||||
| Interest income |
3,032 | 999 | 412 | |||||||||
| Interest expense |
(1,294 | ) | (1,313 | ) | (905 | ) | ||||||
| Other income (expense), net |
(265 | ) | (121 | ) | (55 | ) | ||||||
|
|
|
|
|
|
|
|||||||
| Loss before income taxes |
(107,377 | ) | (70,994 | ) | (59,030 | ) | ||||||
| Provision for income taxes |
(292 | ) | (242 | ) | (280 | ) | ||||||
|
|
|
|
|
|
|
|||||||
| Net loss attributable to common stockholders |
$ | (107,669 | ) | $ | (71,236 | ) | $ | (59,310 | ) | |||
|
|
|
|
|
|
|
|||||||
| Other comprehensive loss |
||||||||||||
| Change in unrealized gain (loss) on investments |
49 | — | (9 | ) | ||||||||
| Foreign currency translation adjustment |
45 | 54 | 33 | |||||||||
|
|
|
|
|
|
|
|||||||
| Comprehensive loss |
$ | (107,575 | ) | $ | (71,182 | ) | $ | (59,286 | ) | |||
|
|
|
|
|
|
|
|||||||
| Net loss per share attributable to common stockholders—basic and diluted |
$ | (3.92 | ) | $ | (25.51 | ) | $ | (24.49 | ) | |||
|
|
|
|
|
|
|
|||||||
| September 30, | ||||||||||||
| (in thousands) |
2019 | 2018 | 2017 | |||||||||
| Consolidated balance sheet data: |
||||||||||||
| Cash, cash equivalents, and short-term investments |
$ | 138,107 | $ | 80,757 | $ | 62,204 | ||||||
| Working capital |
129,781 | 77,134 | 58,392 | |||||||||
| Total assets |
186,994 | 115,791 | 85,657 | |||||||||
| Total liabilities |
34,912 | 26,730 | 19,382 | |||||||||
| Redeemable convertible preferred stock |
— | 290,483 | 199,633 | |||||||||
| Additional paid-in capital |
470,425 | 9,346 | 6,228 | |||||||||
| Accumulated deficit |
(318,524 | ) | (210,855 | ) | (139,619 | ) | ||||||
| Total stockholders’ equity (deficit) |
152,082 | (201,422 | ) | (133,358 | ) | |||||||
58
Table of Contents
| Item 7. | Management’s discussion and analysis of financial condition and results of operations |
The following discussion and analysis of our financial condition and results of operations should be read in conjunction with our consolidated financial statements and the related notes to those statements included elsewhere in this Form 10-K. In addition to historical financial information, the following discussion and analysis contains forward-looking statements that involve risks, uncertainties and assumptions. Our actual results and timing of selected events may differ materially from those anticipated in these forward-looking statements as a result of many factors, including those discussed under “Risk factors” and elsewhere in this Form 10-K. The last day of our fiscal year is September 30, and we refer to our fiscal year ended September 30, 2017 as fiscal 2017 or 2017, September 30, 2018 as fiscal 2018 or 2018 and our fiscal year ended September 30, 2019 as fiscal 2019 or 2019.
Overview
We are a leading and rapidly growing synthetic biology company that has developed a disruptive DNA synthesis platform to industrialize the engineering of biology. The core of our platform is a proprietary technology that pioneers a new method of manufacturing synthetic DNA by “writing” DNA on a silicon chip. We have combined this technology with proprietary software, scalable commercial infrastructure and an e-commerce platform to create an integrated technology platform that enables us to achieve high levels of quality, precision, automation, and manufacturing throughput at a significantly lower cost than our competitors. We are leveraging our unique technology to manufacture a broad range of synthetic DNA-based products, including synthetic genes, tools for next generation sample preparation, and antibody libraries for drug discovery and development.
Additionally, we believe our platform will enable new value-add opportunities, such as discovery partnerships for biologic drugs, and will enable new applications for synthetic DNA, such as digital data storage. We sell our synthetic DNA and synthetic DNA-based products to a customer base of 1,305 customers across a broad range of industries.
We launched the first application of our platform, synthetic genes and oligo pools, in April 2016 to disrupt the gene synthesis market and make legacy DNA synthesis methods obsolete.
In fiscal 2017, we served 286 customers including $0.3 million in sales to seven of the top 20 pharmaceutical companies by revenue, $4.3 million in sales to Ginkgo Bioworks, Inc., or Ginkgo Bioworks (which we believe is the largest global purchaser of synthetic DNA), $0.3 million in sales to three of the largest agricultural biotechnology companies, $2.7 million in sales to over 100 academic research institutions worldwide, and $7.3 million in sales to innovative customers using synthetic DNA for new and emerging applications, such as Microsoft Corporation and the University of Washington for use of DNA as a digital data storage medium. We are also an original equipment manufacturer, or OEM, of synthetic DNA to four synthetic DNA manufacturers that also compete with us, which we believe is a strong demonstration of the superiority of our platform.
In fiscal 2018, we served 717 customers, and sales to the industrial chemicals sector, the academic research sector, the agricultural sector and the healthcare sector accounted for 59%, 23%, 2% and 16% of the total $25.4 million revenues for the year ended September 30, 2018. Sales to Ginkgo Bioworks amounted to $8.7 million, or 34% and sales to customers other than Ginkgo Bioworks was $16.7 million, or 66%, for the year ended September 30, 2018; an increase in revenue of 101% and 160%, respectively, as compared to the year ended September 30, 2017.
In fiscal 2019, we served 1,305 customers, and sales to the industrial chemicals sector, healthcare sector, the academic research sector, and the agricultural sector accounted for 40%, 32%, 26% and 2% of the total $54.4 million revenues for the year ended September 30, 2019. Sales to Ginkgo Bioworks amounted to $9.2 million, or 17% of our total revenue in fiscal 2019.
59
Table of Contents
We have leveraged the versatility of our platform to expand our product portfolio into other markets in which we believe we have a competitive advantage. In February 2018, we launched an innovative and comprehensive preparation kit for next generation sequencing at the Advances in Genome Biology and Technology conference. In February 2019, we announced an expansion of next generation sequencing product offerings including Twist Fast Hybridization and wash kits. Our kit leverages our platform to precisely synthesize oligo pools and uniformly amplify the desired target DNA segments, accelerating the hybridization process and considerably improving the accuracy of the downstream sequencing analysis. We have also commercialized a custom DNA library solution which enables more effective biologic drug discovery and development for our customers. We believe we can further leverage our platform to develop other proprietary tools, such as our GPCR library and antibody optimization solution, to provide services in biologics drug discovery and early development, from target to Investigational New Drug (IND) application, adding value as a partner to biotech and pharmaceutical companies. We also aim to explore the development of DNA as a digital data storage medium via internal research and industry partnerships. In July 2019 we announced the launch of our 300 nucleotide length Oligo pools. These longer Oligos are suited for many applications including drug discovery and development, data storage, CRISPR gene editing and protein engineering.
We have built a scalable commercial platform that enables us to reach a diverse customer base that we believe includes over 100,000 synthetic DNA users today. To address this diverse customer base, we have employed a multi-channel strategy comprised of a direct sales force targeting synthetic DNA customers, international distributors, and an e-commerce platform. We launched our proprietary, innovative, and easy-to-use e-commerce platform in October 2017 to existing customers and expanded access to the general public in January 2018. Our platform allows customers to design, validate and place on-demand orders of customized DNA online. This is a key component of our strategy to address and support our diverse and growing customer base, as well as support commercial productivity, enhance the customer experience, and promote loyalty.
On October 30, 2018, our registration statement on Form S-1 was declared effective by the SEC, and our shares began trading on the NASDAQ Global Stock Market on October 31, 2018. A total of 5,750,000 shares were offered and sold at a price of $14.00 per share. As a result of the initial public offering, or IPO, the Company received $69.6 million in net proceeds, after deducting underwriting discounts and commissions of $5.6 million and offering expenses of approximately $5.3 million payable by the Company.
In May 2019, we completed an underwritten public offering of common stock. A total of 4,312,500 shares were offered and sold at a price of $21.00 per share, and the Company received net proceeds of $84.3 million, after deducting underwriting discounts and commissions of $5.4 million and offering expenses of $0.9 million.
We generated revenues of $54.4 million in the year ended September 30, 2019, $25.4 million in the year ended September 30, 2018 and $10.8 million in the year ended September 30, 2017, while incurring net losses of $107.7 million, $71.2 million and $59.3 million in the years ended September 30, 2019, 2018 and 2017, respectively. Since our inception, we have incurred significant operating losses. Our ability to generate product revenue sufficient to achieve profitability will depend heavily on the success of our existing products and development and commercialization of additional products in the synthetic biology industry.
As of September 30, 2019, we had $138.1 million cash, cash equivalents and short-term investments. We believe that our existing cash and cash equivalents will be sufficient to fund our planned operating expenses, capital expenditure requirements and debt service payments for at least one year from the issuance of these consolidated financial statements. However, the Company may need to obtain additional financing to fund operations beyond this period, and there can be no assurance that the Company will be successful in raising additional financing on terms which are acceptable to the Company. We have based these estimates on assumptions that may prove to be wrong, and we could exhaust our available capital resources sooner than we expect. See “Liquidity and capital resources.”
See Item 1. Business above for additional information regarding our business, products, competitive market and regulatory matters.
60
Table of Contents
Key business metrics
We regularly review the following key business metrics to evaluate our business, measure our performance, identify trends affecting our business, formulate financial projections and make strategic decisions. We believe that the following metrics are representative of our current business; however, we anticipate these will change or may be substituted for additional or different metrics as our business grows.
Value of orders received
We believe that the value of orders we receive is a leading indicator of our ability to generate revenue in subsequent quarters although there can be no assurance orders will translate into revenue. We define an order as a contract with a customer or purchase order from a customer, which outlines the promised goods at an agreed upon price. We regularly assess trends relating to the value of orders we receive, including with respect to our customer concentration.
Since commercially launching our product in April 2016, orders from customers have rapidly increased. Commencing with our Beta Access program, we believe we have successfully achieved industry-leading volumes of synthetic DNA orders. In 2018, we launched our e-commerce platform to enable customers to conveniently order our products online. These steps have contributed to triple digit order growth over the last three years, which is illustrated in the table below.
| Year ended September 30, | ||||||||||||
| (in thousands, except percentages) |
2019 | 2018 | 2017 | |||||||||
| Customers other than Ginkgo Bioworks |
$ | 62,159 | $ | 30,347 | $ | 10,228 | ||||||
| Percentage change from prior year |
105 | % | 197 | % | (NM | ) | ||||||
(NM)—Not meaningful
Orders may never convert into actual revenue and the timing of delivery of our orders and recognition of revenue, if any, may vary based on the nature of the order, and there can be no assurance that orders will result in recognized revenue. The following table lists the value of orders received, including Ginkgo and non-Ginkgo orders, during the periods indicated:
| Year ended September 30, | ||||||||||||
| (in thousands) |
2019 | 2018 | 2017 | |||||||||
| Order value |
$ | 69,947 | $ | 39,372 | $ | 17,557 | ||||||
Number of customers
We believe that the number of customers who have purchased from us since inception is representative of our ability to drive adoption of our products and convert DNA Makers to DNA Buyers. We define customers as separate legal entities or persons who have purchased and directly paid for our products. This means that if a parent company is a customer of ours, it is counted as one customer, and if its subsidiary also purchases our products from us, and the subsidiary makes a payment directly to us, we count the subsidiary as a separate customer. We apply this methodology of counting customers because it is not possible for our e-commerce platform and other data tracking software to distinguish accurately between affiliated purchasers.
Percentage of revenue from new vs. repeat customers
We believe that the percentage of revenue that we generate from both new and repeat customers is an indicator of our ability to drive adoption of our products amongst existing customers while also generating a robust pipeline
61
Table of Contents
of new customers. We define a new customer as a customer who, as a separate legal entity or person, has not had multiple purchases in the current fiscal year. We define a repeat customer as any customer who, as a separate legal entity or person, has purchased products or services from us more than once in the current fiscal year.
The table below represents sales to individual customers. We shipped products to 286 customers in fiscal 2017, 717 customers in fiscal 2018 and 1,305 customers in fiscal 2019.
| Year ended September 30, | ||||||||||||
| 2019 | 2018 | 2017 | ||||||||||
| Percentage of revenue from repeat customers |
97 | % | 97 | % | 63 | % | ||||||
| Percentage of revenue from new customers |
3 | % | 3 | % | 37 | % | ||||||
Financial overview
The following table summarizes certain selected historical financial results:
| Year ended September 30, | ||||||||||||
| (in thousands) |
2019 | 2018 | 2017 | |||||||||
| Revenues |
$ | 54,385 | $ | 25,427 | $ | 10,767 | ||||||
| Loss from operations |
(108,850 | ) | (70,559 | ) | (58,482 | ) | ||||||
| Net loss attributable to common stockholders |
(107,669 | ) | (71,236 | ) | (59,310 | ) | ||||||
Revenues
We generate revenue from sales of synthetic genes, oligo pools, next generation sequencing tools and DNA libraries. We recognize revenue upon delivery (Shipment) to our customers and bill them directly for the shipments. Our ability to increase our revenues will depend on our ability to further penetrate the domestic and international markets, generate sales through our direct sales force and over time from our e-commerce platform and launch new products.
Revenues by geography
We have one reportable segment from the sale of synthetic DNA products. The following table shows our revenues by geography, based on our customers’ shipping addresses. North America consists of Canada and Mexico; EMEA consists of Europe, Middle East, and Africa; and APAC consists of Japan, China, South Korea, Singapore, Malaysia and Australia.
| Year ended September 30, | ||||||||||||||||||||||||
| (in thousands, except percentages) |
2019 | % | 2018 | % | 2017 | % | ||||||||||||||||||
| United States |
$ | 35,936 | 66 | % | $ | 17,662 | 69 | % | $ | 8,243 | 77 | % | ||||||||||||
| EMEA |
14,692 | 27 | % | 6,557 | 26 | % | 2,023 | 19 | % | |||||||||||||||
| APAC |
2,761 | 5 | % | 1,001 | 4 | % | 274 | 2 | % | |||||||||||||||
| North America |
996 | 2 | % | 207 | 1 | % | 227 | 2 | % | |||||||||||||||
|
|
|
|
|
|
|
|
|
|
|
|
|
|||||||||||||
| Total revenues |
$ | 54,385 | 100 | % | $ | 25,427 | 100 | % | $ | 10,767 | 100 | % | ||||||||||||
|
|
|
|
|
|
|
|
|
|
|
|
|
|||||||||||||
62
Table of Contents
Revenues by products
The table below sets forth revenues by products:
| Year ended September 30, | ||||||||||||||||||||||||
| (in thousands, except percentages) | 2019 | % | 2018 | % | 2017 | % | ||||||||||||||||||
| Synthetic genes |
$ | 26,712 | 49 | % | $ | 17,986 | 71 | % | $ | 8,122 | 75 | % | ||||||||||||
| Oligo pools |
4,594 | 8 | % | 3,002 | 12 | % | 2,056 | 19 | % | |||||||||||||||
| DNA libraries |
2,036 | 4 | % | 1,771 | 7 | % | 517 | 5 | % | |||||||||||||||
| NGS tools |
21,043 | 39 | % | 2,668 | 10 | % | 72 | 1 | % | |||||||||||||||
|
|
|
|
|
|
|
|
|
|
|
|
|
|||||||||||||
| Total revenues |
$ | 54,385 | 100 | % | $ | 25,427 | 100 | % | $ | 10,767 | 100 | % | ||||||||||||
|
|
|
|
|
|
|
|
|
|
|
|
|
|||||||||||||
Revenues by industry
Revenues by industry were as follows:
| Year ended September 30, | ||||||||||||||||||||||||
| (in thousands, except percentages) | 2019 | % | 2018 | % | 2017 | % | ||||||||||||||||||
| Industrial chemicals |
$ | 21,927 | 40 | % | $ | 14,912 | 59 | % | $ | 6,702 | 62 | % | ||||||||||||
| Academic research |
13,835 | 26 | % | 5,813 | 23 | % | 2,709 | 25 | % | |||||||||||||||
| Healthcare |
17,424 | 32 | % | 4,212 | 16 | % | 1,226 | 12 | % | |||||||||||||||
| Agriculture |
1,199 | 2 | % | 490 | 2 | % | 130 | 1 | % | |||||||||||||||
|
|
|
|
|
|
|
|
|
|
|
|
|
|||||||||||||
| Total revenues |
$ | 54,385 | 100 | % | $ | 25,427 | 100 | % | $ | 10,767 | 100 | % | ||||||||||||
|
|
|
|
|
|
|
|
|
|
|
|
|
|||||||||||||
Revenues and accounts receivable concentration
Customer revenues equal to or greater than 10% of total revenues was as follows:
| Year ended September 30, | ||||||||||||
| 2019 | 2018 | 2017 | ||||||||||
| Customer A |
17 | % | 34 | % | 40 | % | ||||||
One customer accounted for greater than 10% of net accounts receivable as follows:
| September 30, | ||||||||
| 2019 | 2018 | |||||||
| Customer A |
13 | % | 27 | % | ||||
Product shipments including synthetic genes
Shipments of all products and number of genes shipped in years ended September 30, 2019, 2018 and 2017 were as follows:
| Year ended September 30, | ||||||||||||
| (in thousands, except shipments) |
2019 | 2018 | 2017 | |||||||||
| Number of genes shipped |
288,424 | 247,102 | 125,462 | |||||||||
| Number of shipments |
17,734 | 6,138 | 1,749 | |||||||||
Cost of revenues
Cost of revenues reflect the aggregate cost incurred in the production and delivery of our products and consists of production materials, personnel costs (salaries, benefits, bonuses and stock-based compensation), cost of
63
Table of Contents
expensed equipment and consumables, laboratory supplies, depreciation of capitalized equipment, production overhead costs and allocations of IT and facility costs. We expect that our cost of revenues will increase as we increase our revenues with new product developments.
Other operating expenses
Our operating expenses are classified in the following categories: Research and development, and selling, general and administrative. For each category, the largest component is personnel costs, which includes salaries, employee benefit costs, bonuses, and stock-based compensation expenses.
Research and development
Research and development expenses consist primarily of costs incurred for the development of our products, which include personnel costs, laboratory supplies, consulting costs and allocated overhead, including IT and facility costs. We expense our research and development expenses in the period in which they are incurred. We expect to increase our research and development expenses as we continue to invest in new product development.
Selling, general and administrative
Selling expenses consist of personnel cost, customer service expenses, direct marketing expenses, educational and promotional expense, market research and analysis. General and administrative expenses include executive, finance and accounting, legal and human resources. These expenses consist of personnel costs, audit and legal expenses, consulting costs and allocated IT and facility costs. We expense all selling, general and administrative expenses as incurred. We expect our selling and marketing cost will continue to increase in absolute dollars, primarily driven by our efforts to expand our commercial capability, with an increased presence both within and outside the United States, and to expand our brand awareness and customer base through targeted marketing initiatives. We expect general and administrative expenses will increase as well as we scale our operations.
Interest expense
Interest expense is attributable to borrowing under our senior secured term loan and our equipment financing facility.
Interest income
Interest income consists primarily of interest earned on our cash, cash equivalents, and short-term investments.
Other income (expense), net
Other income (expense), net consists of realized foreign exchange gains and losses and loss on disposal of property and equipment.
64
Table of Contents
Results of operations
The following table sets forth selected consolidated statements of operations data for the fiscal years indicated and the percentage change in such data from year to year. These historical operating results may not be indicative of the results for any future period.
| Year ended September 30, | ||||||||||||
| (in thousands) | 2019 | 2018 | 2017 | |||||||||
| Revenues |
$ | 54,385 | $ | 25,427 | $ | 10,767 | ||||||
| Operating expenses: |
||||||||||||
| Cost of revenues |
47,426 | 32,189 | 24,020 | |||||||||
| Research and development |
35,683 | 20,347 | 19,169 | |||||||||
| Selling, general and administrative |
80,126 | 43,450 | 26,060 | |||||||||
|
|
|
|
|
|
|
|||||||
| Total operating expenses |
163,235 | 95,986 | 69,249 | |||||||||
|
|
|
|
|
|
|
|||||||
| Loss from operations |
(108,850 | ) | (70,559 | ) | (58,482 | ) | ||||||
| Interest income |
3,032 | 999 | 412 | |||||||||
| Interest expense |
(1,294 | ) | (1,313 | ) | (905 | ) | ||||||
| Other income (expense), net |
(265 | ) | (121 | ) | (55 | ) | ||||||
| Provision for income taxes |
(292 | ) | (242 | ) | (280 | ) | ||||||
|
|
|
|
|
|
|
|||||||
| Net loss attributable to common stockholders |
$ | (107,669 | ) | $ | (71,236 | ) | $ | (59,310 | ) | |||
|
|
|
|
|
|
|
|||||||
Comparison of the years ended September 30, 2019, 2018 and 2017
Revenues
| Year ended September 30, | Change | |||||||||||||||||||||||||||
| (in thousands, except percentages) |
2019 | 2018 | 2017 | 2019-2018 | 2018-2017 | |||||||||||||||||||||||
| Revenues |
$ | 54,385 | $ | 25,427 | $ | 10,767 | $ | 28,958 | 114 | % | $ | 14,660 | 136 | % | ||||||||||||||
Revenues increased from $25.4 million to $54.4 million in the year ended September 30, 2019, which was an increase of $29.0 million, or 114%. The increase in revenue was primarily due to increase in NGS tools which grew from $2.7 million in 2018 to $21.0 million in 2019 and $8.7 million increase revenue in Synthetic genes to $26.7 million in year ended September 2019. The NGS tools revenue growth period-over-period was attributed to the full commercial product launch in February 2018, customer adoption in 2019 and higher volumes as an increasing number of customers adopted our NGS tools and scaled production. The increase in synthetic genes revenue was attributed to a 17% volume growth as we shipped 288,424 genes in in the year ended September 2019 as compared to 247,102 genes in the prior year. In addition, we also benefited from higher revenue in our 5.0KB clonal genes which was released to our customers in January 2019. Gene pricing to our customers was relatively constant period-over-period.
Revenues increased from $10.7 million to $25.4 million in the year ended September 30, 2018, which was an increase of $14.7 million, or 136%. This revenue increase was driven by revenues from synthetic genes of $18.0 million and NGS tools of $2.7 million. The primary increase in synthetic genes revenue was attributed to volume increases of genes shipped to customers period-over-period, driven by increased investment in our sales force infrastructure and the launching of the e-commerce platform in fiscal 2018. In the year ended September 30, 2018, we shipped 247,102 genes compared to 125,462 genes in the year ended September 30, 2017, an increase of 96%. Gene pricing to our customers was relatively constant period-over-period. The primary reasons for NGS tools revenue growth period-over-period was attributed to the full commercial launching of the product in February 2018, increased investment in our sales force infrastructure and the volume of units shipped in fiscal 2018. We do not believe the pricing had a meaningful impact on the revenue changes for NGS tools period-over-period. Revenues from customers other than Ginkgo Bioworks increased $10.2 million or 160%
65
Table of Contents
from $6.5 million to $16.7 million and revenue from Ginkgo Bioworks increased $4.4 million, an increase of 102% from $4.3 million to $8.7 million compared to the prior year ended September 30, 2017. Revenue from repeat customers increased $17.9 million or 263% from $6.8 million to $24.6 million in the year ended September 30, 2017 and 2018, respectively.
Revenue increased to $10.8 million in the year ended September 30, 2017, as we continued to ramp up production capacity and sales of our synthetic DNA products, primarily oligonucleotides, clonal and non-clonal synthetic genes, DNA libraries and oligo pools. In fiscal 2017, revenues from customers in the United States accounted for 77% and 23% from customers outside the United States.
Cost of revenues
| Year ended September 30, | Change | |||||||||||||||||||||||||||
| (in thousands, except percentages) |
2019 | 2018 | 2017 | 2019-2018 | 2018-2017 | |||||||||||||||||||||||
| Cost of revenues |
$ | 47,426 | $ | 32,189 | $ | 24,020 | $ | 15,237 | 47 | % | $ | 8,169 | 34 | % | ||||||||||||||
In the year ended September 30, 2019, total cost of revenue increased by $15.2 million to $47.4 million from $32.2 million in the prior year. The increase was primarily due to higher consumption of reagents and production materials of $6.9 million associated with the increased product shipments and higher revenue. Payroll and stock compensation related expense increase of $7.7 million, facilities and information technology costs increased by $2.0 million including facilities move expenses of $0.4 million.
In the year ended September 30, 2018, total cost of revenue increased by $8.2 million from $24.0 million to $32.2 million from the prior year. The increase was primarily due to payroll and stock compensation related expense increase of $3.6 million, increase of consumption of reagents and production materials of $2.8 million, consulting and outside services increase of $0.9 million and facilities cost increase of $0.9 million over prior year.
In the year ended September 30, 2017, total cost of revenues increased to $24.0 million from $9.4 million in the year ended September 30, 2016, primarily due to payroll and stock compensation related expenses of $4.8 million due to an increase in headcount, increased consumption of reagents and production materials of $4.0 million, increased information technology and facilities costs of $2.4 million, increased consulting and outside services of $0.6 million, $1.7 million increase in depreciation expense related to additional equipment for increased production capacity, and increased maintenance costs of $0.4 million.
Research and development expenses
| Year ended September 30, | Change | |||||||||||||||||||||||||||
| (in thousands, except percentages) |
2019 | 2018 | 2017 | 2019-2018 | 2018-2017 | |||||||||||||||||||||||
| Research and development |
$ | 35,683 | $ | 20,347 | $ | 19,169 | $ | 15,336 | 75 | % | $ | 1,178 | 6 | % | ||||||||||||||
Research and development costs increased by $15.3 million to $35.7 million for the year ended September 30, 2019, as compared to the same period 2018. The increase was due to increase in personnel related costs of $8.6 million including $6.2 million for salaries and benefits, increased bonus of $0.8 million and $1.7 million stock-based compensation. Equipment depreciation, amortization and maintenance costs increased by $1.3 million, lab supplies rose $2.0 million and outside services increased by $1.8 million. Information technology and facilities costs increased by $0.9 million including facilities move expenses of approximately $0.4 million. In addition, there were $0.5 million in payments from Defense Advanced Research Projects Agency (DARPA) received during the 2019 fiscal year.
66
Table of Contents
For the year ended September 30, 2018, research and development expenses increased from $19.1 million to $20.3 million, an increase of 6%. The increase was driven primarily from an increase in personnel related costs of $1.3 million, subcontracting services increase of $0.5 million and other increases for $0.1 million offset by decrease of prototype supplies of ($0.8) million. The R&D group hired full time staffing and used less materials in research. In addition, there were $0.3 million in payments from DARPA received during the 2018 fiscal year.
Research and development expenses increased by $0.9 million or 5% from $18.2 million in the year ended September 30, 2016 to $19.2 million in the year ended September 30, 2017. This was primarily due to increased development activities for new product offerings, materials costs, and information technology and facilities costs. In fiscal 2017, information technology and facilities costs increased by $0.9 million compared to fiscal 2016, primarily due to the signing of lease agreements for additional facilities located in San Francisco and South San Francisco. Additional research and development expenses of $3.4 million were also incurred in fiscal 2017 in connection with the acquisition of Genome Compiler Corporation in the prior fiscal year. In fiscal 2016, we received $2.4 million DARPA payments, whereas in fiscal 2017 there were no DARPA payments to offset expenses. In fiscal 2017, laboratory materials used in research and development increased $0.5 million from $2.7 million to $3.2 million and allocations from facilities and information technology increased $0.9 million.
Selling, general and administrative expenses
| Year ended September 30, | Change | |||||||||||||||||||||||||||
| (in thousands, except percentages) |
2019 | 2018 | 2017 | 2019-2018 | 2018-2017 | |||||||||||||||||||||||
| Selling, general and administrative |
$ | 80,126 | $ | 43,450 | $ | 26,060 | $ | 36,676 | 84 | % | $ | 17,390 | 67 | % | ||||||||||||||
Selling, general and administrative expenses increased by $36.7 million to $80.0 million for the year end September 30, 2019, compared to the same period for 2018. The increase was primarily due to increases in personnel expenses of $18.4 million related to $10.3 million increase in salaries and benefits mainly associated with expanding our commercial organization, higher bonuses and sales commissions of $2.5 million, and increased stock-based compensation of $5.6 million. Marketing costs increased by $1.2 million as we continue to invest in our brand. External legal expenses increased by $11.8 million and higher insurance costs of $1.6 million associated with being public. Travel costs increased by $1.7 million mainly due to the increased staffing in our commercial organization.
Selling, general and administrative expenses increased by $17.4 million, or 67%, from $26.1 million in the year ended September 30, 2017 to $43.5 million in the year ended September 30, 2018, primarily due to increases in payroll expenses related to increased headcount, advertising and marketing expenses, professional and legal expenses, stock compensation expenses and information technology related charges. Salaries and related costs increased by $8.2 million in fiscal 2018, as a result of increased headcount in our sales department. In addition, professional services expenses increased by $4.7 million due to commercial expansion of our products and setting up our infrastructure to become a public company. Our marketing related activities increased $1.7 million and remaining increases all relate to commercialization of sales group or corporate development towards preparation of going public.
67
Table of Contents
Selling, general and administrative expenses increased by $7.8 million, or 43%, from $18.3 million in the year ended September 30, 2016 to $26.1 million in the year ended September 30, 2017, primarily due to increases in payroll related to increased headcount, professional and legal expenses, information technology and facilities expenses. Salaries and related costs increased by $1.9 million in fiscal 2017, as a result of increased headcount in our sales department. In addition, professional and legal expenses increased by $5.2 million due to commercial expansion of our products
Interest, and other income (expense), net
| Year ended September 30, | Change | |||||||||||||||||||||||||||
| (in thousands, except percentages) |
2019 | 2018 | 2017 | 2019-2018 | 2018-2017 | |||||||||||||||||||||||
| Interest income |
$ | 3,032 | $ | 999 | $ | 412 | $ | 2,033 | 204 | % | $ | 587 | 142 | % | ||||||||||||||
| Interest expense |
(1,294 | ) | (1,313 | ) | (905 | ) | 19 | (1 | )% | (408 | ) | 45 | % | |||||||||||||||
| Other income (expense) |
(265 | ) | (121 | ) | (55 | ) | (144 | ) | 119 | % | (66 | ) | 120 | % | ||||||||||||||
|
|
|
|
|
|
|
|
|
|
|
|
|
|
|
|||||||||||||||
| Total interest, and other income (expense), net |
$ | 1,473 | $ | (435 | ) | $ | (548 | ) | $ | 1,908 | (439 | )% | $ | 113 | (21 | )% | ||||||||||||
|
|
|
|
|
|
|
|
|
|
|
|
|
|
|
|||||||||||||||
Interest income was $3.0 million in the year ended September 30, 2019, $1.0 million in the year ended September 30, 2018 and $0.4 million in the year ended September 30, 2017, resulting from our short-term investments. Interest expense was $1.3 million in fiscal 2019, $1.3 million in fiscal 2018 and $0.9 million in fiscal 2017 related to our outstanding debt.
Provision for income taxes
| Year ended September 30, | Change | |||||||||||||||||||||||||||
| (in thousands, except percentages) | 2019 | 2018 | 2017 | 2019-2018 | 2018-2017 | |||||||||||||||||||||||
| Provision for income taxes |
$ | (292 | ) | $ | (242 | ) | $ | (280 | ) | $ | (50 | ) | 21 | % | $ | 38 | (14 | )% | ||||||||||
We recorded provision for income taxes of $0.3 million in 2019, $0.2 million in 2018 and $0.3 million in 2017.
68
Table of Contents
Quarterly Results of Operations
The following table shows unaudited quarterly consolidated statement of operations data for each of the last eight quarters. In the opinion of management, the information for each of these quarters has been prepared on the same basis as our audited financial statements and include all adjustments, consisting of normal recurring adjustments and accruals, necessary for the fair statement of financial information in accordance with generally accepted accounting principles. This information should be read in conjunction with the audited consolidated financial statements and related notes included in this Form 10-K. Historical results are not necessarily indicative of results that may be achieved in future periods, and operating results for quarterly periods are not necessarily indicative of operating results for a full year. You should read this unaudited consolidated statement of operations data in conjunction with our consolidated financial statements and the related notes included elsewhere in this Form 10-K.
| Three months ended | ||||||||||||||||||||||||||||||||
| (in thousands) |
September 30, 2019 |
June 30, 2019 |
March 31, 2019 |
December 31, 2018 |
September 30, 2018 |
June 30, 2018 |
March 31, 2018 |
December 31, 2017 |
||||||||||||||||||||||||
| Revenues |
$ | 15,736 | $ | 13,600 | $ | 13,557 | $ | 11,492 | $ | 8,407 | $ | 6,541 | $ | 6,166 | $ | 4,313 | ||||||||||||||||
| Operating expenses: |
||||||||||||||||||||||||||||||||
| Cost of revenues |
$ | 12,386 | $ | 11,394 | $ | 11,789 | $ | 11,857 | $ | 9,093 | $ | 7,503 | $ | 8,095 | $ | 7,498 | ||||||||||||||||
| Research and development |
10,496 | 9,007 | 8,907 | 7,273 | 6,065 | 5,268 | 4,711 | 4,303 | ||||||||||||||||||||||||
| Selling, general and administrative |
24,423 | 21,320 | 19,124 | 15,259 | 12,953 | 11,256 | 9,978 | 9,263 | ||||||||||||||||||||||||
|
|
|
|
|
|
|
|
|
|
|
|
|
|
|
|
|
|||||||||||||||||
| Total operating expenses |
$ | 47,305 | $ | 41,721 | $ | 39,820 | $ | 34,389 | $ | 28,111 | $ | 24,027 | $ | 22,784 | $ | 21,064 | ||||||||||||||||
|
|
|
|
|
|
|
|
|
|
|
|
|
|
|
|
|
|||||||||||||||||
| Loss from operations |
$ | (31,569 | ) | $ | (28,121 | ) | $ | (26,263 | ) | $ | (22,897 | ) | $ | (19,704 | ) | $ | (17,486 | ) | $ | (16,618 | ) | $ | (16,751 | ) | ||||||||
| Interest income |
789 | 804 | 775 | 664 | 409 | 284 | 148 | 158 | ||||||||||||||||||||||||
| Interest expense |
(288 | ) | (318 | ) | (340 | ) | (348 | ) | (386 | ) | (337 | ) | (317 | ) | (273 | ) | ||||||||||||||||
| Other income (expense), net |
(2 | ) | (227 | ) | (21 | ) | (15 | ) | (45 | ) | (14 | ) | (43 | ) | (19 | ) | ||||||||||||||||
|
|
|
|
|
|
|
|
|
|
|
|
|
|
|
|
|
|||||||||||||||||
| Loss before income taxes |
$ | (31,070 | ) | $ | (27,862 | ) | $ | (25,849 | ) | $ | (22,596 | ) | $ | (19,726 | ) | $ | (17,553 | ) | $ | (16,830 | ) | $ | (16,885 | ) | ||||||||
| Provision for income taxes |
(111 | ) | (54 | ) | (84 | ) | (43 | ) | (76 | ) | (71 | ) | (43 | ) | (52 | ) | ||||||||||||||||
|
|
|
|
|
|
|
|
|
|
|
|
|
|
|
|
|
|||||||||||||||||
| Net loss attributable to common stockholders |
$ | (31,181 | ) | $ | (27,916 | ) | $ | (25,933 | ) | $ | (22,639 | ) | $ | (19,802 | ) | $ | (17,624 | ) | $ | (16,873 | ) | $ | (16,937 | ) | ||||||||
| Net loss per share—basic and diluted |
$ | (0.96 | ) | $ | (0.92 | ) | $ | (0.93 | ) | $ | (1.18 | ) | $ | (6.59 | ) | $ | (6.18 | ) | $ | (6.32 | ) | $ | (6.42 | ) | ||||||||
Liquidity and capital resources
Sources of liquidity
To date, we have financed our operations principally through private placements of our convertible preferred stock, borrowings from credit facilities, public equity raises and revenue from our commercial operations.
Since our inception on February 4, 2013 and through September 30, 2019, we have received an aggregate of $444.4 million in net proceeds from the issuance of equity securities and an aggregate of $13.8 million from debt. As of September 30, 2019, we had a balance of $46.7 million of cash and cash equivalents and $91.4 million in short-term investments.
69
Table of Contents
Preferred stock financings
As of September 30, 2019, we had raised $290.5 million in net proceeds from the sale of our equity securities, including the sale of 10,326,454 shares of our Series D redeemable convertible preferred stock from January 2016 through September 2018 at a purchase price of $21.24 per share for gross proceeds of $219.4 million. On March 19, 2018 and May 29, 2018, we issued 2,353,544 and 941,417 shares of Series D redeemable convertible preferred stock for an aggregate purchase price of approximately $50.0 million and $20.0 million, respectively. On July 2, 2018 and July 3, 2018, we issued 517,778 and 47,070 shares of Series D redeemable convertible preferred stock for an aggregate purchase price of $11.0 million and $1.0 million, respectively.
Debt financings
In September 2017, we entered into a Fourth Amended and Restated Loan and Security Agreement, or the Fourth Loan, with SVB, which allowed for borrowings aggregating up to $20.0 million in a series of three advances. The first advance—which was effectuated in September 2017—provided a principal amount of $10.0 million, the second optional advance allowed for a principal amount of $5.0 million and the third optional advance allowed for a principal amount of $5.0 million during their respective drawdown periods; however, the draw periods for the second and third tranches under this agreement have expired as of January 31, 2018 and June 30, 2018, respectively.
In connection with the first advance, we issued warrants to purchase 64,127 shares of common stock at an exercise price of $6.24 per share. The Fourth Loan contains a subjective acceleration clause under which the Fourth Loan could become due and payable to SVB in the event of a material adverse change in our business. The term of the loan was 51 months with an interest rate of prime plus 3.00% and a final payment fee of $0.7 million.
In addition, we obtained a revolving facility from SVB in September 2017 as part of the Fourth Loan and the facility which allows us to borrow up to $10.0 million. The principal amount outstanding under the revolving line accrues interest at a floating per annum rate equal to one percentage point (1.00%) above the prime rate, which interest shall be payable monthly. The amounts available under the revolving line are limited by an advance rate which is a percentage of our account receivables balance. As of September 30, 2019, we have not borrowed against the $10 million revolving facility.
Our credit facilities contain customary representations and warranties and customary affirmative and negative covenants applicable to us and our subsidiaries, including, among other things, restrictions on changes in business, management, ownership or business locations, indebtedness, encumbrances, investments, mergers or acquisitions, dispositions, maintenance of collateral accounts, prepayment of other indebtedness, distributions and transactions with affiliates. The credit facilities contain customary events of default subject in certain cases to grace periods and notice requirements, including (a) failure to pay principal, interest and other obligations when due, (b) material misrepresentations, (c) breach of covenants, conditions or agreements in the credit facilities, (d) default under material indebtedness, (e) certain bankruptcy events, (f) a material adverse change; (g) attachment, levy or restraint on business, (h) default with respect to subordinated debt, (i) cross default under our credit facilities, and (j) government approvals being revoked. As part of the Fourth Loan, all rights, title and interest to our personal property with the exception of our intellectual property, have been pledged as collateral, including cash and cash equivalents, short-term investments, accounts receivable, contractual rights to payment, license agreements, general intangibles, inventory and equipment. We were in compliance with all covenants under the loan and security agreement as of September 30, 2019.
70
Table of Contents
Future maturities of the loan as of September 30, 2019 are as follows:
| (in thousands) |
Principal | Interest | Total | |||||||||
| Years ending September 30, |
||||||||||||
| 2020 |
3,333 | 486 | 3,819 | |||||||||
| 2021 |
3,333 | 214 | 3,547 | |||||||||
| 2022 |
834 | 11 | 845 | |||||||||
|
|
|
|
|
|
|
|||||||
| 7,500 | 711 | 8,211 | ||||||||||
| Less: Interest |
(711 | ) | ||||||||||
|
|
|
|||||||||||
| Total amount of loan principal |
7,500 | |||||||||||
| Less unamortized debt discount |
(269 | ) | ||||||||||
| Add accretion of final payment fee |
502 | |||||||||||
|
|
|
|||||||||||
| $ | 7,733 | |||||||||||
|
|
|
|||||||||||
Capital resources
As of September 30, 2019, we had cash, cash equivalents and short-term investments of $138.1 million. On October 30, 2018, our registration statement on Form S-1 was declared effective by the SEC and our shares began trading on the NASDAQ Global Stock Market on October 31, 2018. A total of 5,750,000 shares were offered and sold at a price of $14.00 per share. As a result of the IPO, the Company received $69.6 million in net proceeds, after deducting underwriting discounts and commissions of $5.6 million and offering expenses of $5.3 million payable by the Company.
In May 2019, we completed an underwritten public offering of common stock. A total of 4,312,500 shares were offered and sold at a price of $21.00 per share, and the Company received net proceeds of $84.3 million, after deducting an underwriting discount and commission totaling $5.4 million, and we incurred offering expenses of $0.9 million.
We believe that our existing cash and cash equivalents are sufficient to fund our operating expenses, capital expenditure requirements and debt service payments for at least one year from the issuance of these consolidated financial statements. In the future, we may still need to obtain additional financing to fund operations beyond this period, and there can be no assurance that we will be successful in raising additional financing on terms which are acceptable to us. In addition, our operating plan may change as a result of factors currently unknown to us, and we may need to seek additional funds sooner than planned. Such financing may result in dilution to stockholders, imposition of debt covenants and repayment obligations, or other restrictions that may adversely affect our business. In addition, we may seek additional capital due to favorable market conditions or strategic considerations even if we believe we have sufficient funds for our current or future operating plans. Our future capital requirements will depend on many factors. See “Risk factors—We will require additional financing to achieve our goals, and a failure to obtain this necessary capital when needed on acceptable terms, or at all, could force us to delay, limit, reduce or terminate our product manufacturing and development and other operations.”
Operating capital requirements
Our primary uses of capital are, and we expect will continue to be for the near future, compensation and related expenses, manufacturing costs, laboratory and related supplies, legal and other regulatory expenses and general overhead costs. We had $2.5 million in commitments for capital expenditures as of September 30, 2019 and 2018, respectively.
71
Table of Contents
Cash flows
The following table summarizes our sources and uses of cash and cash equivalents:
| Year ended September 30, |
||||||||||||
| (in thousands) |
2019 | 2018 | 2017 | |||||||||
| Net cash used in operating activities |
$ | (87,937 | ) | $ | (66,164 | ) | $ | (51,301 | ) | |||
| Net cash provided by (used in) investing activities |
(104,810 | ) | 27,306 | (9,990 | ) | |||||||
| Net cash provided by financing activities |
158,578 | 88,822 | 63,802 | |||||||||
Operating activities
Net cash used in operating activities was $87.9 million in fiscal 2019 and consisted primarily of a net loss of $107.7 million adjusted for non-cash items including depreciation and amortization expenses of $6.1 million, stock-based compensation expense of $11.2 million, a change in operating assets and liabilities of $3.0 million, and a net total of other non-cash items of $0.5 million.
Net cash used in operating activities was $66.2 million in fiscal 2018 and consisted primarily of a net loss of $71.2 million adjusted for non-cash items including depreciation and amortization expenses of $5.7 million, stock-based compensation expense of $3.0 million, a change in operating assets and liabilities of $4.2 million, and a net total of other non-cash items of $0.5 million.
Net cash used in operating activities was $51.3 million in fiscal 2017 and consisted primarily of a net loss of $59.3 million adjusted for non-cash items including depreciation and amortization expenses of $5.0 million, stock-based compensation expense of $1.9 million, a change in operating assets and liabilities of $0.1 million, and a net total of other non-cash items of $1.2 million.
Investing activities
In fiscal 2019, our investing activities used net cash of $104.8 million. The use of net cash resulted primarily from the net impact of purchases and maturity of investments and purchases of laboratory property, equipment and computers.
In fiscal 2018, our investing activities provided net cash of $27.3 million. Investing activities included the purchases and maturity of investments and purchases of laboratory property, equipment and computers.
In fiscal 2017, our investing activities used net cash of $10.0 million. The use of net cash resulted primarily from the net impact of purchases and maturity of investments, and purchases of laboratory property, equipment and computers.
Financing activities
Net cash provided by financing activities was $158.6 million in fiscal 2019, which consisted of $156.2 million from the issuance of common stock in public offerings, $2.2 million from the issuance of common stock and exercise of stock options, $2.7 million from issuance of common stock under the employee stock purchase plan, and principal payments on long term debt of $2.5 million.
Net cash provided by financing activities was $88.8 million in fiscal 2018, which consisted of $90.9 million from the issuance of convertible preferred stock, $2.4 million in payment of deferred offering costs, and $0.3 million from the issuance of common stock and exercise of stock options.
72
Table of Contents
Net cash provided by financing activities was $63.8 million in fiscal 2017, which consisted of $65.6 million from the issuance of redeemable convertible preferred stock, $0.2 million from the issuance of common stock, $2.2 million from additional debt, off-set by the repayment of $4.2 million of debt.
Off-balance sheet arrangements
We do not have any off-balance sheet arrangements other than our indemnification agreements as described in Note 7 of the consolidated financial statements included elsewhere in this Form 10-K.
Contractual obligations and other commitments
Set forth below is information concerning our contractual commitments and obligations as of September 30, 2019:
| (in thousands) |
Total | Less than 1 Year |
Years 2-3 |
Years 4-5 |
After 5 Years |
|||||||||||||||
| Contractual obligations |
||||||||||||||||||||
| Future minimum operating lease payments |
$ | 40,719 | $ | 6,671 | $ | 11,888 | $ | 12,093 | $ | 10,067 | ||||||||||
| Long-term debt obligations |
8,937 | 3,820 | 5,117 | — | — | |||||||||||||||
| Purchase commitments |
13,686 | 12,871 | 714 | 67 | 34 | |||||||||||||||
|
|
|
|
|
|
|
|
|
|
|
|||||||||||
| Total |
$ | 63,342 | $ | 23,362 | $ | 17,719 | $ | 12,160 | $ | 10,101 | ||||||||||
|
|
|
|
|
|
|
|
|
|
|
|||||||||||
In September 2016, we entered into a collaboration agreement with Distributed Bio to offer therapeutic antibody design and optimization services, as well as an exclusive library targeting G-protein coupled receptors to our customers. Upon successful commercialization, we agreed on a profit-sharing and license arrangement for an Antibody Optimization Software and GPCR-Targeting Antibody Library, which includes royalty payments for discovered pharmaceutical products in a tiered structure, which ranges from 25% to 35% of net revenue generated.
In March 2018, we entered into a stock purchase agreement related to the sale of additional shares of our Series D redeemable convertible preferred stock for the amount of $70.0 million. Pursuant to a side letter to the stock purchase agreement, we have committed, subject to certain conditions, to using commercially reasonable efforts to invest up to $5.0 million in the first year, $10.0 million in the second year and $10.0 million in the third year for an aggregate of $25.0 million over a three-year period in connection with the incorporation, business and/or operations of a wholly owned foreign enterprise in the PRC.
Critical accounting policies and significant management estimates
The discussion and analysis of our financial condition and results of operations are based upon our audited consolidated financial statements, which have been prepared in accordance with accounting principles generally accepted in the United States of America. The preparation of these financial statements requires management to make estimates and judgments that affect the reported amounts of assets, liabilities, revenues and expenses, and related disclosures of contingent assets and liabilities. On an ongoing basis, management evaluates the reasonableness of its estimates. Management bases its estimates on historical experience and on various assumptions that are believed to be reasonable under the circumstances, the results of which form the basis for making judgments about the carrying values of assets and liabilities that are not readily available from other sources. Actual results may differ materially from these estimates under different assumptions or conditions.
We believe the following critical accounting policies require that we make significant judgments and estimates in preparing our consolidated financial statements.
73
Table of Contents
Revenue recognition
Effective October 1, 2017, we elected to early adopt the requirements of ASC 606 – Revenue from Contracts with Customers using the full retrospective method. We evaluated the impact on revenues, loss from operations, net loss attributable to common stockholders and basic and diluted earnings per share for all periods presented and concluded that there was no material impact on our consolidated financial statements for all periods presented.
Our revenue is generated through the sale of synthetic biology tools, such as synthetic genes, or clonal genes and fragments, oligonucleotide pools, or oligo pools, next generation sequencing, or NGS tools and DNA libraries. We account for a contract when it has approval and commitment from both parties, the rights of the parties are identified, payment terms are identified, the contract has commercial substance and collectability of consideration is probable.
Contracts with customers are generally in the written form of a purchase order or a quotation, which outline the promised goods and the agreed upon price. Such orders are often accompanied by a Master Supply or Distribution Agreement that establishes the terms and conditions, rights of the parties, delivery terms, and pricing. We assess collectability based on a number of factors, including past transaction history and creditworthiness of the customer.
For all of our contracts to date, the customer orders a specified quantity of a synthetic DNA sequence; therefore, the delivery of the ordered quantity per the purchase order is accounted for as one performance obligation. Some contracts may contain prospective discounts when certain order quantities are exceeded; however, these future discounts are either not significant, not deemed to be incremental to the pricing offered to other customers, or not enforceable options to acquire additional goods. As a result, these discounts do not constitute a material right and do not meet the definition of a separate performance obligation. We do not offer retrospective discounts or rebates.
The transaction price is determined based on the agreed upon rates in the purchase order or master supply agreements applied to the quantity of synthetic DNA that was manufactured and shipped to the customer. Our contracts include only one performance obligation—the delivery of the product to the customer. Accordingly, all of the transaction price, net of any discounts, is allocated to the one performance obligation. Therefore, upon delivery of the product, there are no remaining performance obligations. Our shipping and handling activities are performed before the customer obtains control of the goods and therefore are considered a fulfillment cost. We have elected to exclude all sales and value added taxes from the measurement of the transaction price. We have not adjusted the transaction price for significant financing since the time period between the transfer of goods and payment is less than one year.
We recognize revenue at a point in time when control of the products is transferred to the customer. Management applies judgment in evaluating when a customer obtains control of the promised good which is generally when the product is delivered to the customer. Our customer contracts generally include a standard assurance warranty to guarantee that our products comply with agreed specifications. We reduce revenue by the amount of expected returns which have been insignificant.
We have elected the practical expedient of not disclosing the consideration allocated to remaining performance obligations and an explanation of when those amounts are expected to be recognized as revenue since the duration of our contracts is less than one year.
We do not have any contract assets or contract liabilities as of September 30, 2019 and September 30, 2018. For all periods presented, we did not recognize revenue from amounts that were included in the contract liability balance at the beginning of each period. In addition, for all periods presented, there was no revenue recognized in a reporting period from performance obligations satisfied in previous periods.
Based on the nature of our contracts with customers which are recognized over a term of less than 12 months, we have elected to use the practical expedient whereby costs to obtain a contract are expensed as they are incurred.
74
Table of Contents
We state our revenues net of any taxes collected from customers that are required to be remitted to various government agencies. The amount of taxes collected from customers and payable to governmental entities is included on the balance sheet as part of “Accrued expenses and other current liabilities.”
Income tax
In preparing our consolidated financial statements, we are required to estimate our income taxes in each of the jurisdictions in which we operate. This process involves estimating our actual current tax exposure together with assessing temporary differences resulting from differing treatment of items for tax and accounting purposes. These differences result in deferred tax assets and liabilities, which are included within our audited consolidated balance sheets. We then assess the likelihood that our deferred tax assets will be recovered from future taxable income and, to the extent we believe that recovery is not likely, we establish a valuation allowance. A valuation allowance reduces our deferred tax assets to the amount that management estimates is more likely than not to be realized. In determining the amount of the valuation allowance, we consider income over recent years, estimated future taxable income, feasible tax planning strategies and other factors in each taxing jurisdiction in which we operate. If we determine that it is more likely than not that we will not realize all or a portion of our remaining deferred tax assets, then we will increase our valuation allowance with a charge to income tax expense. Conversely, if we determine that it is likely that we will ultimately be able to utilize all or a portion of the deferred tax assets for which a valuation allowance has been provided, then the related portion of the valuation allowance will reduce income tax expense. Significant management judgment is required in determining our provision for income taxes and potential tax exposures, our deferred tax assets and liabilities and any valuation allowance recorded against our net deferred tax assets. In the event that actual results differ from these estimates or we adjust these estimates in future periods, we may need to establish a valuation allowance, which could materially impact our financial position and results of operations. Our ability to utilize our deferred tax assets and the need for a related valuation allowance are monitored on an ongoing basis.
Furthermore, computation of our tax liabilities involves examining uncertainties in the application of complex tax regulations. We recognize liabilities for uncertain tax positions based on the two-step process as prescribed by the authoritative guidance provided by FASB. The first step is to evaluate the tax position to determine whether there is sufficient available evidence to indicate if it is more likely than not that the position will be sustained on audit, including resolution of any related appeals or litigation processes. The second step requires us to measure and determine the approximate amount of the tax benefit at the largest amount that is more than 50% likely of being realized upon ultimate settlement with the tax authorities. It is inherently difficult and requires significant judgment to estimate such amounts, as this requires us to determine the probability of various possible outcomes. We reexamine these uncertain tax positions on a quarterly basis. This reassessment is based on various factors during the period including, but not limited to, changes in worldwide tax laws and treaties, changes in facts or circumstances, effectively settled issues under audit and any new audit activity. A change in recognition or measurement would result in the recognition of a tax benefit or an additional charge to the tax provision in the period.
Stock-based compensation
We have granted stock-based awards, consisting of stock options and restricted stock, to our employees, certain non-employee consultants and certain members of our board of directors. We measure stock-based compensation expense for restricted stock and stock options granted to our employees and directors on the date of grant and recognize the corresponding compensation expense of those awards over the requisite service period, which is generally the vesting period of the respective award. We account for stock-based compensation arrangements with non-employee consultants using a fair value approach. The estimated fair value of unvested options granted to non-employee consultants is remeasured at each reporting date through the date of final vesting. As a result, the noncash charge to operations for nonemployee options with vesting conditions is affected in each reporting period by changes in the estimated fair value of our common stock. We adjust for actual forfeitures as they occur.
75
Table of Contents
We estimate the fair value of stock options granted to our employees and directors on the grant date, and rights to acquire stock granted under our Employee Stock Purchase Plan, and the resulting stock-based compensation expense, using the Black-Scholes option-pricing model. The Black-Scholes option-pricing model requires the use of highly subjective assumptions which determine the fair value of stock-based awards. These assumptions include:
| • | Expected Term. Our expected term represents the period that our stock-based awards are expected to be outstanding and is determined using the simplified method (based on the mid-point between the vesting date and the end of the contractual term), as we do not have sufficient historical data to use any other method to estimate expected term. |
| • | Expected Volatility. As we have very limited trading history of our common stock, the expected volatility is estimated based on the average volatility for comparable publicly traded biopharmaceutical companies over a period equal to the expected term of the stock option grants. The comparable companies are chosen based on their similar size, stage in the life cycle or area of specialty. |
| • | Risk-Free Interest Rate. The risk-free interest rate is based on the U.S. Treasury zero coupon issues in effect at the time of grant for periods corresponding with the expected term of the stock option grants. |
| • | Expected Dividend. We have never paid dividends on our common stock and have no plans to pay dividends on our common stock. Therefore, we use an expected dividend yield of zero. |
For options granted to non-employee consultants, the fair value of these options is also remeasured using the Black-Scholes option-pricing model reflecting the same assumptions as applied to employee options in each of the reported periods, other than the expected life, which is assumed to be the remaining contractual life of the option.
Recently issued accounting pronouncements
For a description of accounting changes and recent accounting pronouncements, including the expected dates of adoption and estimated effects, if any, on our consolidated financial statements, see Note 2, “Summary of Significant Accounting Policies” in the Notes to Consolidated Financial Statements in Item 8 of this Annual Report on Form 10-K for a further discussion of the impairment analysis of acquisition-related intangible assets.
| Item 7A. | Quantitative and qualitative disclosures about market risk |
Interest rates risk
We had cash and cash equivalents totaling $46.7 million and $80.8 million as of September 30, 2019 and 2018, respectively. We had short-term investments totaling $91.4 million as of September 30, 2019 and none as of September 30, 2018. Our cash and cash equivalents consist of cash in bank accounts and money market funds, and short-term investments consist of U.S. government agency bonds, corporate bonds, and commercial paper. The primary objectives of our investment activities are to preserve principal and provide liquidity without significantly increasing risk. We do not enter into investments for trading or speculative purposes. Due to the relatively short-term nature of our investment portfolio, a hypothetical 100 basis point change in interest rates would not have a material effect on the fair value of our portfolio for the year ended September 30, 2019.
Foreign currency exchange rate risk
Substantially all of our revenues and operating expenses are denominated in U.S. dollars. Therefore, we do not believe that our exposure to foreign currency exchange risk is material to our business, financial condition or results of operations. If a significant portion of our revenue or operating expenses were to become denominated in currencies other than U.S. dollars, we may not be able to effectively manage this risk, and our business, financial condition and results of operations could be adversely affected by translation to U.S. dollars and by transactional foreign currency conversions.
76
Table of Contents
| Item 8. | Consolidated financial statements and supplementary data |
INDEX TO CONSOLIDATED FINANCIAL STATEMENTS
| 78 | ||||
| 79 | ||||
| Consolidated Statements of Operations and Comprehensive Loss |
80 | |||
| Consolidated Statements of Redeemable Convertible Preferred Stock and Stockholders’ Equity (Deficit) |
81 | |||
| 82 | ||||
| 83 |
77
Table of Contents
Report of Independent Registered Public Accounting Firm
To the Board of Directors and Stockholders of Twist Bioscience Corporation
Opinion on the Financial Statements
We have audited the accompanying consolidated balance sheets of Twist Bioscience Corporation and its subsidiaries (the “Company”) as of September 30, 2019 and 2018, and the related consolidated statements of operations and comprehensive loss, of redeemable convertible preferred stock and stockholders’ equity (deficit) and of cash flows for each of the three years in the period ended September 30, 2019, including the related notes (collectively referred to as the “consolidated financial statements”). In our opinion, the consolidated financial statements present fairly, in all material respects, the financial position of the Company as of September 30, 2019 and 2018, and the results of its operations and its cash flows for each of the three years in the period ended September 30, 2019 in conformity with accounting principles generally accepted in the United States of America.
Basis for Opinion
These consolidated financial statements are the responsibility of the Company’s management. Our responsibility is to express an opinion on the Company’s consolidated financial statements based on our audits. We are a public accounting firm registered with the Public Company Accounting Oversight Board (United States) (PCAOB) and are required to be independent with respect to the Company in accordance with the U.S. federal securities laws and the applicable rules and regulations of the Securities and Exchange Commission and the PCAOB.
We conducted our audits of these consolidated financial statements in accordance with the standards of the PCAOB. Those standards require that we plan and perform the audit to obtain reasonable assurance about whether the consolidated financial statements are free of material misstatement, whether due to error or fraud. The Company is not required to have, nor were we engaged to perform, an audit of its internal control over financial reporting. As part of our audits we are required to obtain an understanding of internal control over financial reporting but not for the purpose of expressing an opinion on the effectiveness of the Company’s internal control over financial reporting. Accordingly, we express no such opinion.
Our audits included performing procedures to assess the risks of material misstatement of the consolidated financial statements, whether due to error or fraud, and performing procedures that respond to those risks. Such procedures included examining, on a test basis, evidence regarding the amounts and disclosures in the consolidated financial statements. Our audits also included evaluating the accounting principles used and significant estimates made by management, as well as evaluating the overall presentation of the consolidated financial statements. We believe that our audits provide a reasonable basis for our opinion.
/s/ PricewaterhouseCoopers LLP
San Jose, California
December 12, 2019
We have served as the Company’s auditor since 2015.
78
Table of Contents
Twist Bioscience Corporation
| (In thousands, except share and per share data) |
September 30, 2019 |
September 30, 2018 |
||||||
| Assets |
||||||||
| Current assets: |
||||||||
| Cash and cash equivalents |
$ | 46,735 | $ | 80,757 | ||||
| Short-term investments |
91,372 | — | ||||||
| Accounts receivable, net |
12,104 | 5,419 | ||||||
| Inventories |
7,330 | 6,028 | ||||||
| Prepaid expenses and other current assets |
2,594 | 3,467 | ||||||
|
|
|
|
|
|||||
| Total current assets |
$ | 160,135 | $ | 95,671 | ||||
| Property and equipment, net |
20,835 | 12,331 | ||||||
| Goodwill |
1,138 | 1,138 | ||||||
| Intangible assets, net |
508 | 712 | ||||||
| Restricted cash, non-current |
579 | 579 | ||||||
| Other non-current assets |
3,799 | 5,360 | ||||||
|
|
|
|
|
|||||
| Total assets |
$ | 186,994 | $ | 115,791 | ||||
|
|
|
|
|
|||||
| Liabilities, redeemable convertible preferred stock and stockholders’ equity (deficit) |
||||||||
| Current liabilities: |
||||||||
| Accounts payable |
$ | 9,760 | $ | 7,531 | ||||
| Accrued expenses |
5,965 | 2,166 | ||||||
| Accrued compensation |
10,479 | 5,401 | ||||||
| Current portion of long-term debt |
3,333 | 2,500 | ||||||
| Other current liabilities |
817 | 939 | ||||||
|
|
|
|
|
|||||
| Total current liabilities |
$ | 30,354 | $ | 18,537 | ||||
| Redeemable convertible preferred stock warrant liability |
— | 631 | ||||||
| Long-term debt, net of current portion |
4,400 | 7,218 | ||||||
| Other non-current liabilities |
158 | 344 | ||||||
|
|
|
|
|
|||||
| Total liabilities |
$ | 34,912 | $ | 26,730 | ||||
|
|
|
|
|
|||||
| Commitments and contingencies (Note 7) |
||||||||
| Redeemable convertible preferred stock |
||||||||
| Series A redeemable convertible preferred stock, $0.00001 par value—no shares and 2,854,576 shares authorized as of September 30, 2019 and 2018; no shares and 2,817,723 shares issued and outstanding as of September 30, 2019 and 2018. |
$ | — | $ | 9,141 | ||||
| Series B redeemable convertible preferred stock, $0.00001 par value—no shares and 3,331,878 shares authorized as of September 30, 2019 and 2018; no shares and 3,315,645 shares issued and outstanding as of September 30, 2019 and 2018. |
— | 25,900 | ||||||
| Series C redeemable convertible preferred stock, $0.00001 par value—no shares and 2,510,354 shares authorized as of September 30, 2019 and 2018; no shares and 2,491,483 shares issued and outstanding as of September 30, 2019 and 2018. |
— | 36,726 | ||||||
| Series D redeemable convertible preferred stock, $0.00001 par value—no shares and 10,475,252 shares authorized as of September 30, 2019 and 2018, respectively; no shares and 10,326,454 shares issued and outstanding as of September 30, 2019 and 2018, respectively. |
— | 218,716 | ||||||
|
|
|
|
|
|||||
| Total redeemable convertible preferred stock |
$ | — | $ | 290,483 | ||||
|
|
|
|
|
|||||
| Stockholders’ equity (deficit) |
||||||||
| Preferred stock, $0.00001 par value—10,000,000 shares and no shares authorized as of September 30, 2019 and 2018, respectively; no shares issued or outstanding as of September 30, 2019 and 2018, respectively. |
$ | — | $ | — | ||||
| Common stock, $0.00001 par value—100,000,000 and 21,210,000 shares authorized at September 30, 2019 and 2018, respectively; 32,872,675 and 3,206,048 shares issued and outstanding at September 30, 2019 and 2018, respectively. |
— | — | ||||||
| Additional paid-in capital |
470,425 | 9,346 | ||||||
| Accumulated other comprehensive income |
181 | 87 | ||||||
| Accumulated deficit |
(318,524 | ) | (210,855 | ) | ||||
|
|
|
|
|
|||||
| Total stockholders’ equity (deficit) |
$ | 152,082 | $ | (201,422 | ) | |||
|
|
|
|
|
|||||
| Total liabilities, redeemable convertible preferred stock and stockholders’ equity (deficit) |
$ | 186,994 | $ | 115,791 | ||||
|
|
|
|
|
|||||
The accompanying notes are an integral part of these consolidated financial statements.
79
Table of Contents
Twist Bioscience Corporation
Consolidated Statements of Operations and Comprehensive Loss
| Year ended September 30, | ||||||||||||
| (In thousands, except share and per share data) |
2019 | 2018 | 2017 | |||||||||
| Revenues |
$ | 54,385 | $ | 25,427 | $ | 10,767 | ||||||
| Operating expenses: |
||||||||||||
| Cost of revenues |
$ | 47,426 | $ | 32,189 | $ | 24,020 | ||||||
| Research and development |
35,683 | 20,347 | 19,169 | |||||||||
| Selling, general and administrative |
80,126 | 43,450 | 26,060 | |||||||||
|
|
|
|
|
|
|
|||||||
| Total operating expenses |
$ | 163,235 | $ | 95,986 | $ | 69,249 | ||||||
|
|
|
|
|
|
|
|||||||
| Loss from operations |
$ | (108,850 | ) | $ | (70,559 | ) | $ | (58,482 | ) | |||
| Interest income |
3,032 | 999 | 412 | |||||||||
| Interest expense |
(1,294 | ) | (1,313 | ) | (905 | ) | ||||||
| Other income (expense), net |
(265 | ) | (121 | ) | (55 | ) | ||||||
|
|
|
|
|
|
|
|||||||
| Loss before income taxes |
$ | (107,377 | ) | $ | (70,994 | ) | $ | (59,030 | ) | |||
| Provision for income taxes |
(292 | ) | (242 | ) | (280 | ) | ||||||
|
|
|
|
|
|
|
|||||||
| Net loss attributable to common stockholders |
$ | (107,669 | ) | $ | (71,236 | ) | $ | (59,310 | ) | |||
|
|
|
|
|
|
|
|||||||
| Other comprehensive loss: |
||||||||||||
| Change in unrealized gain (loss) on investments |
$ | 49 | $ | — | $ | (9 | ) | |||||
| Foreign currency translation adjustment |
45 | 54 | 33 | |||||||||
|
|
|
|
|
|
|
|||||||
| Comprehensive loss |
$ | (107,575 | ) | $ | (71,182 | ) | $ | (59,286 | ) | |||
|
|
|
|
|
|
|
|||||||
| Net loss per share attributable to common stockholders—basic and diluted |
$ | (3.92 | ) | $ | (25.51 | ) | $ | (24.49 | ) | |||
|
|
|
|
|
|
|
|||||||
| Weighted average shares used in computing net loss per share attributable to common stockholders—basic and diluted |
27,461,844 | 2,792,743 | 2,422,243 | |||||||||
|
|
|
|
|
|
|
|||||||
The accompanying notes are an integral part of these consolidated financial statements.
80
Table of Contents
Consolidated Statements of Redeemable Convertible Preferred Stock and Stockholders’ Equity (Deficit)
| Series A convertible preferred stock |
Series B convertible preferred stock |
Series C convertible preferred stock |
Series D convertible preferred stock |
Common stock | Additional paid-in capital |
Accumulated other comprehensive income |
Accumulated deficit |
Total stockholders’ equity (deficit) |
||||||||||||||||||||||||||||||||||||||||||||||||
| (In thousands, except share data) |
Shares | Amount | Shares | Amount | Shares | Amount | Shares | Amount | Shares | Amount | ||||||||||||||||||||||||||||||||||||||||||||||
| Balances as of September 30, 2016 |
2,817,723 | $ | 9,141 | 3,315,645 | $ | 25,900 | 2,491,483 | $ | 36,726 | 2,938,714 | $ | 62,270 | 3,146,233 | $ | — | $ | 3,689 | $ | 9 | $ | (80,309 | ) | $ | (76,611 | ) | |||||||||||||||||||||||||||||||
|
|
|
|
|
|
|
|
|
|
|
|
|
|
|
|
|
|
|
|
|
|
|
|
|
|
|
|
|
|||||||||||||||||||||||||||||
| Issuance of Series D redeemable convertible preferred stock, net of financing costs of $165 |
— | — | — | — | — | — | 3,095,375 | 65,596 | — | — | — | — | — | — | ||||||||||||||||||||||||||||||||||||||||||
| Vesting of restricted common stock issued to member of the Board of Directors |
— | — | — | — | — | — | — | — | — | — | 4 | — | — | 4 | ||||||||||||||||||||||||||||||||||||||||||
| Exercise of stock options |
— | — | — | — | — | — | — | — | 32,586 | — | 162 | — | — | 162 | ||||||||||||||||||||||||||||||||||||||||||
| Issuance of common stock warrants |
— | — | — | — | — | — | — | — | — | — | 486 | — | — | 486 | ||||||||||||||||||||||||||||||||||||||||||
| Stock-based compensation |
— | — | — | — | — | — | — | — | — | — | 1,887 | — | — | 1,887 | ||||||||||||||||||||||||||||||||||||||||||
| Other comprehensive income |
— | — | — | — | — | — | — | — | — | — | — | 24 | — | 24 | ||||||||||||||||||||||||||||||||||||||||||
| Net loss |
— | — | — | — | — | — | — | — | — | — | — | — | (59,310 | ) | (59,310 | ) | ||||||||||||||||||||||||||||||||||||||||
|
|
|
|
|
|
|
|
|
|
|
|
|
|
|
|
|
|
|
|
|
|
|
|
|
|
|
|
|
|||||||||||||||||||||||||||||
| Balances as of September 30, 2017 |
2,817,723 | $ | 9,141 | 3,315,645 | $ | 25,900 | 2,491,483 | $ | 36,726 | 6,034,089 | $ | 127,866 | 3,178,819 | $ | — | $ | 6,228 | $ | 33 | $ | (139,619 | ) | $ | (133,358 | ) | |||||||||||||||||||||||||||||||
|
|
|
|
|
|
|
|
|
|
|
|
|
|
|
|
|
|
|
|
|
|
|
|
|
|
|
|
|
|||||||||||||||||||||||||||||
| Issuance of Series D redeemable convertible preferred stock, net of financing costs of $339 |
— | — | — | — | — | — | 4,292,365 | 90,850 | — | — | — | — | — | — | ||||||||||||||||||||||||||||||||||||||||||
| Exercise of stock options |
— | — | — | — | — | — | — | — | 62,862 | — | 215 | — | — | 215 | ||||||||||||||||||||||||||||||||||||||||||
| Repurchase of early exercised stock options |
— | — | — | — | — | — | — | — | (9,639 | ) | — | — | — | — | — | |||||||||||||||||||||||||||||||||||||||||
| Forfeiture of restricted common stock |
— | — | — | — | — | — | — | — | (21,146 | ) | — | — | — | — | — | |||||||||||||||||||||||||||||||||||||||||
| Stock-based compensation |
— | — | — | — | — | — | — | — | — | — | 2,961 | — | — | 2,961 | ||||||||||||||||||||||||||||||||||||||||||
| Treasury stock purchase |
(4,848 | ) | — | (58 | ) | — | — | (58 | ) | |||||||||||||||||||||||||||||||||||||||||||||||
| Other comprehensive income |
— | — | — | — | — | — | — | — | — | — | — | 54 | — | 54 | ||||||||||||||||||||||||||||||||||||||||||
| Net loss |
— | — | — | — | — | — | — | — | — | — | — | — | (71,236 | ) | (71,236 | ) | ||||||||||||||||||||||||||||||||||||||||
|
|
|
|
|
|
|
|
|
|
|
|
|
|
|
|
|
|
|
|
|
|
|
|
|
|
|
|
|
|||||||||||||||||||||||||||||
| Balances as of September 30, 2018 |
2,817,723 | $ | 9,141 | 3,315,645 | $ | 25,900 | 2,491,483 | $ | 36,726 | 10,326,454 | $ | 218,716 | 3,206,048 | $ | — | $ | 9,346 | $ | 87 | $ | (210,855 | ) | $ | (201,422 | ) | |||||||||||||||||||||||||||||||
|
|
|
|
|
|
|
|
|
|
|
|
|
|
|
|
|
|
|
|
|
|
|
|
|
|
|
|
|
|||||||||||||||||||||||||||||
| Issuance of common stock in public offerings, net of underwriting discounts, commissions and offering expenses of $17,210 |
— | — | — | — | — | — | — | — | 10,062,500 | — | 153,852 | — | — | 153,852 | ||||||||||||||||||||||||||||||||||||||||||
| Vesting of restricted stock units |
— | — | — | — | — | — | — | — | 8,352 | — | — | — | — | — | ||||||||||||||||||||||||||||||||||||||||||
| Issuance of shares under the employee stock purchase plan |
— | — | — | — | — | — | — | — | 219,144 | — | 2,700 | — | — | 2,700 | ||||||||||||||||||||||||||||||||||||||||||
| Exercise of stock options |
— | — | — | — | — | — | — | — | 331,205 | — | 2,264 | — | — | 2,264 | ||||||||||||||||||||||||||||||||||||||||||
| Conversion of redeemable convertible preferred stock warrant liability to equity |
— | — | — | — | — | — | — | — | — | — | 631 | — | — | 631 | ||||||||||||||||||||||||||||||||||||||||||
| Conversion of redeemable convertible preferred stock to common stock |
(2,817,723 | ) | (9,141 | ) | (3,315,645 | ) | (25,900 | ) | (2,491,483 | ) | (36,726 | ) | (10,326,454 | ) | (218,716 | ) | 18,951,305 | — | 290,462 | — | — | 290,462 | ||||||||||||||||||||||||||||||||||
| Repurchase of early exercised stock options |
— | — | — | — | — | — | — | — | (442 | ) | — | — | — | — | — | |||||||||||||||||||||||||||||||||||||||||
| Stock-based compensation |
— | — | — | — | — | — | — | — | — | — | 11,170 | — | — | 11,170 | ||||||||||||||||||||||||||||||||||||||||||
| Net exercise of stock warrants |
— | — | — | — | — | — | — | — | 94,563 | — | — | — | — | — | ||||||||||||||||||||||||||||||||||||||||||
| Other comprehensive income |
— | — | — | — | — | — | — | — | — | — | — | 94 | — | 94 | ||||||||||||||||||||||||||||||||||||||||||
| Net loss |
— | — | — | — | — | — | — | — | — | — | — | — | (107,669 | ) | (107,669 | ) | ||||||||||||||||||||||||||||||||||||||||
|
|
|
|
|
|
|
|
|
|
|
|
|
|
|
|
|
|
|
|
|
|
|
|
|
|
|
|
|
|||||||||||||||||||||||||||||
| Balances as of September 30, 2019 |
— | $ | — | — | $ | — | — | $ | — | — | $ | — | 32,872,675 | $ | — | $ | 470,425 | $ | 181 | $ | (318,524 | ) | $ | 152,082 | ||||||||||||||||||||||||||||||||
|
|
|
|
|
|
|
|
|
|
|
|
|
|
|
|
|
|
|
|
|
|
|
|
|
|
|
|
|
|||||||||||||||||||||||||||||
The accompanying notes are an integral part of these consolidated financial statements.
81
Table of Contents
Twist Bioscience Corporation
Consolidated Statements of Cash Flows
| Year ended September 30, | ||||||||||||
| (in thousands) |
2019 | 2018(1) | 2017(1) | |||||||||
| Cash flows from operating activities |
||||||||||||
| Net loss |
$ | (107,669 | ) | $ | (71,236 | ) | $ | (59,310 | ) | |||
| Adjustments to reconcile net loss to net cash used in operating activities |
||||||||||||
| Depreciation and amortization |
6,111 | 5,727 | 5,021 | |||||||||
| Loss on disposal of property and equipment |
189 | 55 | 507 | |||||||||
| Stock-based compensation |
11,170 | 2,961 | 1,891 | |||||||||
| Discount accretion on investment securities |
(1,249 | ) | — | — | ||||||||
| Non-cash interest expense |
233 | 254 | 363 | |||||||||
| Change in fair value of redeemable convertible preferred stock warrant liability |
— | (13 | ) | 261 | ||||||||
| Amortization of debt discount |
282 | 308 | 95 | |||||||||
| Changes in assets and liabilities: |
||||||||||||
| Accounts receivable, net |
(6,685 | ) | (3,073 | ) | (1,623 | ) | ||||||
| Inventories |
(1,302 | ) | (4,202 | ) | (599 | ) | ||||||
| Prepaid expenses and other current assets |
746 | (1,760 | ) | (324 | ) | |||||||
| Other non-current assets |
(2,064 | ) | (812 | ) | (481 | ) | ||||||
| Accounts payable |
3,278 | 3,759 | 560 | |||||||||
| Accrued expenses |
4,210 | (114 | ) | 621 | ||||||||
| Accrued compensation |
5,060 | 1,932 | 1,067 | |||||||||
| Other liabilities |
(247 | ) | 50 | 650 | ||||||||
|
|
|
|
|
|
|
|||||||
| Net cash used in operating activities |
(87,937 | ) | (66,164 | ) | (51,301 | ) | ||||||
|
|
|
|
|
|
|
|||||||
| Cash flows from investing activities |
||||||||||||
| Purchases of property and equipment |
(14,757 | ) | (3,688 | ) | (6,594 | ) | ||||||
| Proceeds from sale of property and equipment |
21 | 17 | 266 | |||||||||
| Purchases of investments |
(177,574 | ) | (3,523 | ) | (40,587 | ) | ||||||
| Maturity of investments |
87,500 | 34,500 | 36,925 | |||||||||
|
|
|
|
|
|
|
|||||||
| Net cash provided by (used in) investing activities |
(104,810 | ) | 27,306 | (9,990 | ) | |||||||
|
|
|
|
|
|
|
|||||||
| Cash flows from financing activities |
||||||||||||
| Proceeds from exercise of stock options |
2,170 | 331 | 205 | |||||||||
| Proceeds from public offerings, net of underwriting discounts, commissions and offering expenses |
156,208 | — | — | |||||||||
| Proceeds from issuance of Series D redeemable convertible preferred stock, net of issuance costs |
— | 90,850 | 65,596 | |||||||||
| Proceeds from issuance under employee stock purchase plan |
2,700 | — | — | |||||||||
| Payments of deferred offering costs |
— | (2,359 | ) | — | ||||||||
| Borrowings of long-term debt |
— | — | 2,174 | |||||||||
| Repayments of long-term debt |
(2,500 | ) | — | (4,173 | ) | |||||||
|
|
|
|
|
|
|
|||||||
| Net cash provided by financing activities |
158,578 | 88,822 | 63,802 | |||||||||
|
|
|
|
|
|
|
|||||||
| Effect of exchange rates on cash, cash equivalents and restricted cash |
30 | — | — | |||||||||
| Net increase (decrease) in cash, cash equivalents and restricted cash |
(34,139 | ) | 49,964 | 2,511 | ||||||||
| Cash, cash equivalents, and restricted cash at beginning of year |
81,537 | 31,573 | 29,062 | |||||||||
|
|
|
|
|
|
|
|||||||
| Cash, cash equivalents, and restricted cash at end of year |
$ | 47,398 | $ | 81,537 | $ | 31,573 | ||||||
|
|
|
|
|
|
|
|||||||
| Supplemental disclosure of cash flow information |
||||||||||||
| Interest paid |
$ | 779 | $ | 751 | $ | 702 | ||||||
| Income taxes paid, net of refunds |
291 | 179 | 6 | |||||||||
| Non-cash investing and financing activities |
||||||||||||
| Property and equipment additions included in accrued expenses and accounts payable |
$ | 170 | $ | 344 | $ | 285 | ||||||
| Fair value of warrants issued in connection with debt |
— | — | 486 | |||||||||
| Deferred offering costs included in accounts payable and accrued expenses |
— | 1,308 | — | |||||||||
| Conversion of redeemable convertible preferred stock warrant liability to equity |
631 | — | — | |||||||||
| Conversion of redeemable convertible preferred stock to common stock |
290,462 | — | — | |||||||||
| (1) | Adjusted to reflect the retrospective adoption of Accounting Standards Update (ASU) 2016-18, Statement of Cash Flows (Topic 230): Restricted Cash. |
The accompanying notes are an integral part of these consolidated financial statements.
82
Table of Contents
Twist Bioscience Corporation
Notes to Consolidated Financial Statements
1. The company
Twist Bioscience Corporation (the Company) was incorporated in the state of Delaware on February 4, 2013. The Company is a synthetic biology company that has developed a disruptive DNA synthesis platform. DNA is used in many applications across different industries: industrial chemicals, academic, healthcare and agriculture.
The core of our platform is a proprietary technology that pioneers a new method of manufacturing synthetic DNA by “writing” DNA on a silicon chip. We have combined this technology with proprietary software, scalable commercial infrastructure and an e-commerce platform to create an integrated technology platform that enables us to achieve high levels of quality, precision, automation, and manufacturing throughput at a significantly lower cost than our competitors. We are leveraging our unique technology to manufacture a broad range of synthetic DNA-based products, including synthetic genes, tools for next generation sample preparation, and antibody libraries for drug discovery and development.
The Company has a limited operating history and its prospects are subject to risks, expenses and uncertainties frequently encountered by companies in this industry. These risks include, but are not limited to, the uncertainty of availability of additional financing, market acceptance of its products, the ability to retain and attract new customers, and the uncertainty of achieving future profitability.
The Company has generated net losses in all periods since inception. As of September 30, 2019, the Company had an accumulated deficit of $318.5 million and has not generated positive cash flows from operations since inception. Losses are expected to continue as the Company continues to invest in product development, manufacturing, and sales and marketing.
The Company has raised multiple rounds of debt and equity financing since its inception. In October 2018, the Company completed an initial public offering (IPO) of its common stock which raised proceeds of $69.6 million, after deducting underwriting discounts, commissions and offering expenses. In May 2019, the Company completed an underwritten public offering of its common stock with proceeds of $84.3 million, after deducting underwriting discounts and commissions and offering expenses. Management believes that these proceeds combined with existing cash balances on hand will be sufficient to fund operations for at least one year from the issuance of these consolidated financial statements. However, the Company may need to obtain additional financing to fund operations beyond this period, and there can be no assurance that the Company will be successful in raising additional financing on terms which are acceptable to the Company.
If the Company requires but is unable to obtain additional funding, the Company could be forced to delay, reduce or eliminate some or all of its research and development programs, product portfolio expansion or commercialization efforts, which could adversely affect its business prospects, or the Company may be unable to continue operations.
2. Summary of significant accounting policies
Basis of presentation and use of estimates
The presentation of consolidated financial statements in conformity with accounting principles generally accepted in the United States requires management to make estimates and assumptions that affect the reported amounts of assets and liabilities and disclosure of contingent assets and liabilities as of the date of the consolidated financial statements and the reported amounts of revenue and expenses during the reporting period. Such estimates include the valuation of deferred tax assets, stock-based compensation expense, determination of the net realizable value of inventory, and the fair value of the Company’s common stock and redeemable convertible preferred stock warrant liabilities. Actual results could differ from those estimates. The Company’s consolidated financial statements include its wholly-owned subsidiaries. All intercompany balances and accounts are eliminated in consolidation.
83
Table of Contents
Risks and uncertainties
The Company relies on third parties for the supply and manufacture of its products, including a single-source supplier for a critical component, as well as third-party logistics providers. In instances where these parties fail to perform their obligations, the Company may be unable to find alternative suppliers to satisfactorily deliver its products to its customers on time, if at all.
The Company operates in a dynamic and highly competitive industry and believes that changes in any of the following areas could have a material adverse effect on the Company’s future financial position, results of operations, or cash flows: ability to obtain future financing; advances and trends in new technologies and industry standards; market acceptance of the Company’s products; development of sales channels; certain strategic relationships; litigation or claims against the Company regarding intellectual property, patent, product, regulatory, or other factors; and the ability to attract and retain employees necessary to support its growth. Refer to Note 7 for discussion of our current litigation with Agilent which is set to go to trial in February 2020 and could have a material adverse effect on the Company.
The Company has expended and expects to continue to expend substantial funds to complete the research and development of its production process. The Company may require additional funds to commercialize its products and may be unable to entirely fund these efforts with its current financial resources. Additional funds may not be available on acceptable terms, if at all. If adequate funds are unavailable on a timely basis from operations or additional sources of financing, the Company may have to delay the sale of the Company’s products and services which would materially and adversely affect its business, financial condition and operations.
Concentration of credit risk
Financial instruments that potentially subject the Company to a concentration of credit risk consist of cash and cash equivalents, short-term investments and accounts receivable. Substantially all of the Company’s cash is held by one financial institution that management believes is of high credit quality. Such deposits may, at times, exceed federally insured limits. The Company’s investment policy addresses the level of credit exposure by establishing a minimum allowable credit rating and by limiting the concentration in any one investment.
The Company’s accounts receivable is derived from customers located principally in the United States and Europe. The Company maintains credit insurance for certain of its customer balances, performs ongoing credit evaluations of its customers, and maintains allowances for potential credit losses on customers’ accounts when deemed necessary. The Company does not typically require collateral from its customers. Credit losses historically have not been material. The Company continuously monitors customer payments and maintains an allowance for doubtful accounts based on its assessment of various factors including historical experience, age of the receivable balances, and other current economic conditions or other factors that may affect customers’ ability to pay.
Customer concentration
One customer accounted for more than 10% of total revenues as follows:
| Year ended September 30, | ||||||||||||
| 2019 | 2018 | 2017 | ||||||||||
| Customer A |
17 | % | 34 | % | 40 | % | ||||||
One customer accounted for greater than 10% of net accounts receivable as follows:
| September 30, | ||||||||
| 2019 | 2018 | |||||||
| Customer A |
13 | % | 27 | % | ||||
84
Table of Contents
Cash and cash equivalents
Cash equivalents that are readily convertible to cash are stated at cost, which approximates fair value. The Company considers all highly liquid investments with an original or remaining maturity of three months or less at the time of purchase to be cash equivalents. Cash equivalents consist of investments in money market funds as of September 30, 2019 and 2018.
Short-term investments
The Company invests in various types of securities, including United States government, commercial paper, and corporate debt securities. It classifies its investments as available-for-sale and records them at fair value based upon market prices at period end. Unrealized gains and losses that are deemed temporary in nature are recorded in accumulated other comprehensive income as a separate component of stockholders’ equity (deficit). Dividend and interest income are recognized when earned. Realized gains and losses are included in earnings and are derived using the specific identification method for determining the cost of investments sold. The Company may sell these securities at any time for use in current operations.
Accounts receivable
Trade receivables include amounts billed and currently due from customers, recorded at the net invoice value and are not interest bearing. The amounts due are stated at their net estimated realizable value. The Company maintains an allowance for doubtful accounts to provide for the estimated amounts of receivables that will not be collected. The allowance is based upon an assessment of customer creditworthiness, historical payment experience, the age of outstanding receivables and collateral to the extent applicable. The Company re-evaluates such allowance on a regular basis and adjusts its allowance as needed. Once a receivable is deemed to be uncollectible, such balance is charged against the allowance.
The Company has a short order-to-invoice lifecycle, as most products can be manufactured within one month. Upon delivery of the products to the customer, the Company invoices the customer. The typical timing of payment is net 30 days.
Fair value of financial instruments
The carrying amounts of the Company’s financial instruments including cash equivalents, short term investments, and accounts receivable approximate fair value due to their relatively short maturities. The carrying amounts of the redeemable convertible preferred stock warrant liability represent their fair values. Based on the borrowings rates currently available to the Company for loans with similar terms, the carrying value of the Company’s long-term debt approximates its fair value (level 2 within the fair value hierarchy).
Inventories
Inventory is stated at the lower of cost or net realizable value. Cost is determined using the first-in, first-out method. Determining net realizable value of inventory involves judgments and assumptions, including projecting selling prices and costs to sell. Provisions are made to reduce excess and obsolete inventories to their estimated net realizable value based on forecasted demand, past experience, the age and nature of inventories.
Property and equipment
Property and equipment are stated at cost less accumulated depreciation and amortization. Depreciation and amortization are computed using the straight-line method over the estimated useful lives of the assets or the remaining lease term of the respective leasehold improvements assets, if any. The Company recorded
85
Table of Contents
depreciation and amortization expense of $6.1 million, $5.5 million and $4.8 million for the years September 30, 2019, 2018 and 2017, respectively. Estimated lives of property and equipment are as follows:
| Laboratory equipment |
5 Years | |
| Furniture, fixtures and other equipment |
5 Years | |
| Computer equipment |
3 Years | |
| Computer software |
3 Years | |
| Leasehold improvements |
Lesser of useful life or facilities’ lease term. |
Maintenance and repairs are charged to expense as incurred. Betterments are capitalized and depreciated through the life of the lease. When assets are retired or otherwise disposed of, the cost and accumulated depreciation are removed from the balance sheet and any resulting gain or loss is reflected in operations in the period realized.
Capitalized software development costs
Costs associated with internal-use software systems, including those to improve e-commerce capabilities, during the application development stage are capitalized. Capitalization of costs begins when the preliminary project stage is completed, management has committed to funding the project, and it is probable that the project will be completed and the software will be used to perform the function intended. Capitalization ceases at the point when the project is substantially complete and is ready for its intended purpose. The capitalized amounts are included in property and equipment, net on the consolidated balance sheets.
Capitalized software development costs were $2.3 million and $1.9 million as of September 30, 2019 and 2018, respectively. Capitalized costs are amortized from the project completion date, using the straight-line method over an estimated useful life of the assets, which is three years.
Long-lived assets
The Company reviews property and equipment and intangibles for impairment whenever events or changes in circumstances indicate that the carrying amount of an asset may not be recoverable. Recoverability is measured by comparison of the carrying amount to the future undiscounted cash flows which the assets are expected to generate. If such assets are considered to be impaired, the impairment to be recognized is measured by the amount by which the carrying amount of the assets exceeds their fair value. There have been no such impairments of long-lived assets during the years ended September 30, 2019, 2018 and 2017.
Leases
The Company has entered into lease agreements for its manufacturing, research and development and office facilities. These leases qualify as and are accounted for as operating leases. Rent expense is recognized on a straight-line basis over the term of the lease and, accordingly, the Company records the difference between cash rent payments and the recognition of rent expense as a prepaid rent asset or a deferred rent liability, as appropriate for each lease.
Goodwill and purchased intangible assets
Goodwill is evaluated for impairment annually or more frequently if events or changes in circumstances indicate that the carrying value of the asset may not be recoverable. If, based on a qualitative assessment, the Company determines it is more likely than not that goodwill is impaired, a quantitative assessment is performed to determine if the fair value of the Company’s sole reporting unit is less than its carrying value.
Purchased intangible assets with finite lives are generally amortized over their estimated useful lives using the straight-line method. The Company reviews intangible assets for impairment whenever events or changes in
86
Table of Contents
business circumstances indicate that the carrying amounts of the assets may not be fully recoverable. Impairment assessments inherently involve judgment as to assumptions about expected future cash flows and the impact of market conditions on those assumptions.
Segment information
The Company has one business activity, which is manufacturing of synthetic DNA using its semiconductor-based silicon platform and operates as one reportable and operating segment. The Company’s chief operating decision-maker, its Chief Executive Officer (CEO), reviews the Company’s operating results on an aggregate basis for purposes of allocating resources and evaluating financial performance.
Revenue recognition
Effective October 1, 2017, the Company elected to early adopt the requirements of Accounting Standards Codification (ASC) 606, Revenue from Contracts with Customers using the full retrospective method. The Company evaluated the impact on revenues, loss from operations, net loss attributable to common stockholders and basic and diluted earnings per share for all periods presented and concluded that there was no material impact on the Company’s consolidated financial statements for all periods presented.
The Company’s revenue is generated through the sale of synthetic biology tools, such as synthetic genes, or clonal genes and fragments, oligonucleotides pools, or oligo pools, next generation sequencing, or NGS tools and DNA libraries. The Company accounts for a contract when it has approval and commitment from both parties, the rights of the parties are identified, payment terms are identified, the contract has commercial substance and collectability of consideration is probable.
Contracts with customers are generally in the written form of a purchase order or a quotation, which outline the promised goods and the agreed upon price. Such orders are often accompanied by a Master Supply or Distribution Agreement that establishes the terms and conditions, rights of the parties, delivery terms, and pricing. The Company assesses collectability based on a number of factors, including past transaction history and creditworthiness of the customer.
For all of the Company’s contracts to date, the customer orders a specified quantity of synthetic DNA; therefore, the delivery of the ordered quantity per the purchase order is accounted for as one performance obligation. Some contracts may contain prospective discounts when certain order quantities are exceeded; however, these future discounts are either not significant, not deemed to be incremental to the pricing offered to other customers, or not enforceable options to acquire additional goods. As a result, these discounts do not constitute a material right and do not meet the definition of a separate performance obligation. The Company does not offer retrospective discounts or rebates.
The transaction price is determined based on the agreed upon rates in the purchase order or master supply agreements applied to the quantity of synthetic DNA that was manufactured and shipped to the customer. The Company’s contracts include only one performance obligation – the delivery of the product to the customer. Accordingly, all of the transaction price, net of any discounts, is allocated to the one performance obligation. Therefore, upon delivery of the product, there are no remaining performance obligations. The Company’s shipping and handling activities are considered a fulfillment cost. The Company has elected to exclude all sales and value added taxes from the measurement of the transaction price. The Company has not adjusted the transaction price for significant financing since the time period between the transfer of goods and payment is less than one year.
The Company recognizes revenue at a point in time when control of the products is transferred to the customer. Management applies judgment in evaluating when a customer obtains control of the promised good which is generally when the product is shipped or delivered to the customer. The Company’s customer contracts generally include a standard assurance warranty to guarantee that its products comply with agreed specifications. The Company reduces revenue by the amount of expected returns which have been insignificant.
87
Table of Contents
The Company has elected the practical expedient to not disclose the consideration allocated to remaining performance obligations and an explanation of when those amounts are expected to be recognized as revenue since the duration of the contracts is less than one year.
Refer to Note 15 for the disaggregation of revenues by geography, by product and by industry.
The Company does not have any contract assets or contract liabilities as of September 30, 2019 and 2018. For all periods presented, the Company did not recognize revenue from amounts that were included in the contract liability balance at the beginning of each period. In addition, for all periods presented, there was no revenue recognized in a reporting period from performance obligations satisfied in previous periods.
Based on the nature of the Company’s contracts with customers which are recognized over a term of less than 12 months, the Company has elected to use the practical expedient whereby costs to obtain a contract are expensed as they are incurred.
Research and development
Research and development expenses consist of compensation costs, employee benefits, subcontractors, research supplies, allocated facility related expenses and allocated depreciation and amortization. All research and development costs are expensed as incurred.
Advertising costs
Costs related to advertising and promotions are expensed to sales and marketing as incurred. Advertising and promotion expenses for the years ended September 30, 2019, 2018 and 2017, were $1.3 million, $0.9 million and $0.1 million, respectively.
Government contract payments
The Company recognizes payments received from its funded research and development agreement with the Defense Advanced Research Projects Agency (DARPA), when milestones are achieved and records them as a reduction of research and development expenses. In fiscal 2019 and 2018, the Company received $0.5 million and $0.3 million, respectively, in DARPA payments. There were no DARPA payments received during the year ended September 30, 2017.
Redeemable convertible preferred stock warrant liability
Outstanding warrants that were related to the Company’s redeemable convertible preferred stock are classified as liabilities on the balance sheet. As the warrants to purchase redeemable convertible preferred stock were exercisable into shares of convertible preferred stock, the Company had recognized a liability for the fair value of its warrants on the consolidated balance sheets upon issuance and subsequently remeasured the liability to fair value at the end of each reporting period. In connection with the closing of our IPO, all of the outstanding warrants to purchase redeemable convertible preferred stock automatically converted to warrants to purchase common stock, which qualify for equity classification and no further measurement has been required thereafter.
Common stock warrants
Warrants to purchase the Company’s common stock issued in conjunction with debt are recorded as additional paid-in-capital and classified as equity on the consolidated balance sheets. During the year ended September 30, 2017, the Company recorded $0.5 million in additional paid-in-capital for the fair value of warrants to purchase common stock issued in connection with long-term debt. There were no common stock warrants issued during the years ended September 30, 2018 and 2019.
88
Table of Contents
Stock-based compensation
The Company maintains performance incentive plans under which incentive and nonqualified stock options and restricted stock units are granted primarily to employees and may be granted to members of the board of directors and certain non-employee consultants, and employees may participate in an employee stock purchase plan.
The Company recognizes stock compensation in accordance with ASC 718, Compensation—Stock Compensation. ASC 718 requires the recognition of compensation expense, using a fair value-based method, for costs related to all stock-based payments including stock options, restricted stock units and employee stock purchase plan.
The Company recognizes fair value of stock options granted to non-employees as a stock-based compensation expense over the period in which the related services are received. The Company recognizes forfeitures as they occur. The Company believes that the estimated fair value of stock options is more readily measurable than the fair value of the services rendered.
Net loss per share attributable to common stockholders
The Company calculates its basic and diluted net loss per share attributable to common stockholders in conformity with the two-class method required for companies with participating securities. In computing diluted net loss attributable to common stockholders, undistributed earnings are re-allocated to reflect the potential impact of dilutive securities. The Company’s basic net loss per share attributable to common stockholders is calculated by dividing the net loss attributable to common stockholders by the weighted-average number of shares of common stock outstanding for the period. For purposes of the calculation of diluted net loss per share attributable to common stockholders, redeemable convertible preferred stock, unvested shares of common stock issued upon the early exercise of stock options, shares issuable for employee stock purchase plan contributions received, warrants to purchase redeemable convertible preferred stock, warrants to purchase common stock, unvested restricted common stock, unvested restricted stock units and stock options to purchase common stock are considered potentially dilutive securities but have been excluded from the calculation of diluted net loss per share attributable to common stockholders as their effect is antidilutive.
Basic and diluted net loss per share of common stock attributable to common stockholders is calculated by dividing the net loss attributable to common stockholders by the weighted-average number of shares of common stock outstanding during the period, less shares subject to repurchase, and excludes any dilutive effects of employee stock-based awards and warrants. Because the Company has reported a net loss for the years ended September 30, 2019, 2018 and 2017, diluted net loss per common share is the same as the basic net loss per share for those years.
The Company considered all series of its convertible preferred stock to be participating securities as they were entitled to receive noncumulative dividends prior and in preference to any dividends on shares of common stock. Due to the Company’s net losses, there was no impact on the loss per share calculation in applying the two-class method since the participating securities had no legal obligation to share in any losses.
Reverse stock split
In October 2018, the Company’s stockholders approved a one-for-0.101 reverse stock split of its common and redeemable convertible preferred stock which was effected on October 16, 2018. The par value of the common stock and redeemable convertible preferred stock were not adjusted as a result of the reverse stock split. Accordingly, all share and per share amounts for all periods presented in the consolidated financial statements and notes thereto have been adjusted retrospectively to reflect this reverse stock split.
Income taxes
The Company accounts for income taxes using the asset and liability method whereby deferred tax asset and liability accounts are determined based on differences between financial reporting and tax bases of assets and
89
Table of Contents
liabilities and are measured using the enacted tax rates and laws that are currently in effect. Valuation allowances are established where necessary to reduce deferred tax assets to the amounts expected to be realized.
Deferred offering costs
Deferred offering costs, which consist of direct incremental legal, consulting, banking and accounting fees relating to the Company’s IPO, were initially capitalized and subsequently offset against proceeds from the IPO within stockholders’ equity. As of September 30, 2019, there were no capitalized deferred offering costs on the consolidated balance sheets. As of September 30, 2018, there was $3.7 million of deferred offering costs within other non-current assets on the consolidated balance sheets.
Recent accounting pronouncements
In May 2014, the Financial Accounting Standards Board (FASB) issued Accounting Standards Update (ASU) 2014-09, Revenue from Contracts with Customers (Topic 606), which provides accounting guidance for all revenue arising from contracts with customers and supersedes most current revenue recognition guidance. The core principle of the new standard is that a company should recognize revenue to depict the transfer of promised goods or services to customers in an amount that reflects the consideration to which the company expects to be entitled in exchange for those goods or services. The two permitted transition methods under the new standard are the full retrospective method, in which case the standard would be applied to each prior reporting period presented and the cumulative effect of applying the standard would be recognized at the earliest period shown, or the modified retrospective method, in which case the cumulative effect of applying the standard would be recognized at the date of initial application. The Company adopted the new revenue standard, on October 1, 2017, using the full retrospective method.
In February 2016, the FASB issued new lease accounting guidance in ASU 2016-02, Leases. Under the new guidance, lessees will be required to recognize for all leases (with the exception of short-term leases) at the commencement date: (1) a lease liability, which is a lessee’s obligation to make lease payments arising from a lease, measured on a discounted basis; and (2) a right-of-use asset, which is an asset that represents the lessee’s right to use, or control the use of, a specified asset for the lease term. A modified retrospective approach is required, applying the new standard to leases existing as of the date of initial application. An entity may choose to apply the standard as of either its effective date or the beginning of the earliest comparative period presented in the financial statements. The Company will adopt the new standard on October 1, 2019, the first day of fiscal 2020, using the effective date as the date of initial application. Consequently, financial information will not be updated, and the disclosures required under the new standard will not be provided for dates and periods prior to the first quarter of fiscal 2020. The Company will elect certain practical expedients permitted under the transition guidance within the new standard, which among other things, allow the Company to carry forward its prior conclusions about lease identification and classification.
The Company estimates the key change upon adoption of the standard will result in balance sheet recognition of additional lease assets and lease liabilities as of October 1, 2019, which will be based on the present value of committed lease payments which the Company expects to be consistent with the future minimum lease payments disclosed in Note 7. The Company does not expect the adoption of the new standard to have a material impact on the recognition, measurement or presentation of lease expenses within its consolidated income statements, consolidated statements of comprehensive income or consolidated statements of cash flows.
In June 2016, the FASB issued ASU 2016-13, Financial Instruments—Credit Losses (Topic 326): Measurement of Credit Losses on Financial Instruments. The new standard requires entities to use the new “expected credit loss” impairment model for most financial assets measured at amortized cost, including trade and other receivables and held-to-maturity debt securities, and modifies the impairment model for available-for-sale debt securities. The standard is effective for fiscal years beginning after December 15, 2020, including interim periods within those fiscal years. Early application is permitted. The Company is currently evaluating the impact that the adoption of this standard will have on its consolidated financial statements.
90
Table of Contents
In August 2016, the FASB issued ASU 2016-15, Statement of Cash Flows (Topic 230): Classification of Certain Cash Receipts and Cash Payments, which was intended to reduce diversity in practice in how certain cash receipts and payments are presented and classified in the statement of cash flows. The standard provides guidance in a number of situations including, among others, settlement of zero-coupon bonds, contingent consideration payments made after a business combination, proceeds from the settlement of insurance claims, and distributions received from equity method investees. The ASU also provides guidance for classifying cash receipts and payments that have aspects of more than one class of cash flows. The Company adopted this standard effective October 1, 2018. The adoption of ASU 2016-15 did not have an impact on the Company’s consolidated financial statements for either period presented.
In November 2016, the FASB issued ASU 2016-18, Statement of Cash Flows (Topic 230): Restricted Cash. This ASU applies to all entities that have restricted cash or restricted cash equivalents and are required to present a statement of cash flows. The ASU requires that a statement of cash flows explain the change during the period in the total of cash, cash equivalents, and amounts generally described as restricted cash or restricted cash equivalents. As a result, amounts generally described as restricted cash and restricted cash equivalents should be included with cash and cash equivalents when reconciling the beginning-of-period and end-of-period total amounts shown on the statement of cash flows. Further, a reconciliation between the balance sheet and statement of cash flows is required when the balance sheet includes more than one line item for cash, cash equivalents, and restricted cash. Therefore, transfers between these balances should no longer be presented as a cash flow activity. The Company adopted this standard effective October 1, 2018, utilizing the retrospective transition method to each period presented. The following table provides a reconciliation of the Company’s cash and cash equivalents, current portion of restricted cash and non-current portion of restricted cash reported within the consolidated balance sheets that sum to the total cash, cash equivalents and restricted cash shown in the Company’s consolidated statements of cash flows for the periods presented:
| September 30, | ||||||||||||
| 2019 | 2018 | 2017 | ||||||||||
| Cash and cash equivalents |
46,735 | 80,757 | 31,227 | |||||||||
| Restricted cash, non-current |
579 | 579 | 202 | |||||||||
| Restricted cash, current (within prepaid expenses and other current assets) |
84 | 201 | 144 | |||||||||
|
|
|
|
|
|
|
|||||||
| Total cash, cash equivalents and restricted cash |
47,398 | 81,537 | 31,573 | |||||||||
|
|
|
|
|
|
|
|||||||
Amounts included in restricted cash primarily related to security deposits and a letter of credit with a financial institution, both in connection with office space lease agreements.
In January 2017, the FASB issued ASU 2017-01, Business Combinations (Topic 805): Clarifying the Definition of a Business, clarifying the definition of a business. The ASU affects all companies and other reporting organizations that must determine whether they have acquired or sold a business. The definition of a business affects many areas of accounting including acquisitions, disposals, goodwill, and consolidation. The Company adopted this standard effective October 1, 2018. The Company will apply the provisions of this ASU in evaluating the definition of a business for any prospective transaction from October 1, 2018.
In January 2017, the FASB issued ASU 2017-04, Intangibles—Goodwill and Other (Topic 350): Simplifying the Test for Goodwill Impairment. This ASU simplifies the subsequent measurement of goodwill. The ASU eliminates step 2 from the goodwill impairment test, including for reporting units with a zero or negative carrying amount that fail a qualitative test. An entity still has the option to perform the qualitative assessment for a reporting unit to determine if the quantitative impairment test is necessary. This ASU should be applied on a prospective basis. This ASU is effective for annual or any interim goodwill impairment tests in fiscal years beginning after December 15, 2019. Early adoption is permitted for interim or annual goodwill impairment tests performed on testing dates after January 1, 2017. The Company has not yet determined whether it will early adopt this ASU.
91
Table of Contents
In May 2017, the FASB issued ASU 2017-09, Compensation—Stock Compensation (Topic 718): Scope of Modification Accounting, which clarifies when to account for a change to the terms or conditions of a stock-based payment award as a modification. Under ASU 2017-09, modification accounting is required only if the fair value, the vesting conditions, or the classification of the award (as equity or liability) changes as a result of the change in terms or conditions. This standard is effective for all entities for annual reporting periods beginning after December 15, 2017, including interim periods within that reporting period. The Company adopted this standard effective October 1, 2018. The adoption of ASU 2017-09 did not have an impact on the Company’s consolidated financial statements for either period presented.
In August 2018, the FASB issued ASU 2018-13, Fair Value Measurement (Subtopic 820): Disclosure Framework—Changes to the Disclosure Requirements for Fair Value Measurement, which modifies the disclosure requirements on fair value measurements. The amendments on changes in unrealized gains and losses, the range and weighted average of significant unobservable inputs used to develop Level 3 fair value measurements, and the narrative description of measurement uncertainty should be applied prospectively for only the most recent interim or annual period presented in the initial year of adoption. All other amendments should be applied retrospectively to all periods presented upon their effective date. ASU 2018-13 will be effective for the Company for the quarter ending December 31, 2020, with early adoption permitted. The Company is currently assessing the impact of adoption on its disclosures.
3. Fair value measurement
The Company assesses the fair value of financial instruments based on the provisions of ASC 820, Fair Value Measurements. ASC 820 defines fair value as the exchange price that would be received for an asset or paid to transfer a liability (an exit price) in the principal or most advantageous market for the asset or liability in an orderly transaction between market participants on the measurement date. ASC 820 also establishes a fair value hierarchy which requires an entity to maximize the use of observable inputs and minimize the use of unobservable inputs when measuring fair value. The standard describes three levels of inputs that may be used to measure fair value:
Level 1—Quoted prices in active markets for identical assets or liabilities.
Level 2—Observable inputs other than Level 1 prices such as quoted prices for similar assets or liabilities, quoted prices in markets that are not active, or other inputs that are observable or can be corroborated by observable market data for substantially the full term of the assets or liabilities.
Level 3—Unobservable inputs that are supported by little or no market activity and that are significant to the fair value of the assets or liabilities.
In determining fair value, the Company utilizes valuation techniques that maximize the use of observable inputs and minimize the use of unobservable inputs to the extent possible as well as considers counterparty credit risk in its assessment of fair value.
The following table sets forth the cash and cash equivalents, and short-term investments as of September 30, 2019:
| (in thousands) |
Amortized cost |
Gross unrealized gains |
Gross unrealized losses |
Fair value | ||||||||||||
| Cash and cash equivalents |
$ | 46,735 | $ | — | $ | — | $ | 46,735 | ||||||||
| Short-term investments |
91,323 | 49 | — | 91,372 | ||||||||||||
|
|
|
|
|
|
|
|
|
|||||||||
| Total |
$ | 138,058 | $ | 49 | $ | — | $ | 138,107 | ||||||||
|
|
|
|
|
|
|
|
|
|||||||||
92
Table of Contents
The following table sets forth the cash and cash equivalents as of September 30, 2018:
| (in thousands) |
Amortized cost |
Gross unrealized gains |
Gross unrealized losses |
Fair value | ||||||||||||
| Cash and cash equivalents |
$ | 80,757 | $ | — | $ | — | $ | 80,757 | ||||||||
|
|
|
|
|
|
|
|
|
|||||||||
| Total |
$ | 80,757 | $ | — | $ | — | $ | 80,757 | ||||||||
|
|
|
|
|
|
|
|
|
|||||||||
As of September 30, 2019, financial assets and liabilities measured and recognized at fair value are as follows:
| (in thousands) | Level 1 | Level 2 | Level 3 | Fair value | ||||||||||||
| Assets |
||||||||||||||||
| Cash and cash equivalents |
$ | 19,344 | $ | — | $ | — | $ | 19,344 | ||||||||
| Money market funds |
27,390 | — | — | 27,390 | ||||||||||||
| Corporate bonds |
— | 8,530 | — | 8,530 | ||||||||||||
| Commercial paper |
— | 28,361 | — | 28,361 | ||||||||||||
| U.S. government treasury bills |
54,482 | — | — | 54,482 | ||||||||||||
|
|
|
|
|
|
|
|
|
|||||||||
| Total |
$ | 101,216 | $ | 36,891 | $ | — | $ | 138,107 | ||||||||
|
|
|
|
|
|
|
|
|
|||||||||
As of September 30, 2018, financial assets and liabilities measured and recognized at fair value are as follows:
| (in thousands) | Level 1 | Level 2 | Level 3 | Fair value | ||||||||||||
| Assets |
||||||||||||||||
| Cash and cash equivalents |
$ | 46,823 | $ | — | $ | — | $ | 46,823 | ||||||||
| Money market funds |
33,934 | — | — | 33,934 | ||||||||||||
|
|
|
|
|
|
|
|
|
|||||||||
| Total |
$ | 80,757 | $ | — | $ | — | $ | 80,757 | ||||||||
|
|
|
|
|
|
|
|
|
|||||||||
| Liabilities |
||||||||||||||||
| Redeemable convertible preferred stock warrant liability |
$ | — | $ | — | $ | 631 | $ | 631 | ||||||||
|
|
|
|
|
|
|
|
|
|||||||||
The Company did not have short–term investments at September 30, 2018.
Redeemable convertible preferred stock warrants
The following table provides a reconciliation of beginning and ending balances of the Level 3 instruments during the years ended September 30, 2017, 2018 and 2019:
| (in thousands) |
Series A | Series B | Series C | Series D | Total | |||||||||||||||
| Redeemable convertible preferred stock warrant liability: |
||||||||||||||||||||
| Fair value as of September 30, 2016 |
$ | 184 | $ | 57 | $ | 108 | $ | 34 | $ | 383 | ||||||||||
| Change in fair value recorded in other income (expense), net |
147 | 53 | 44 | 17 | 261 | |||||||||||||||
|
|
|
|
|
|
|
|
|
|
|
|||||||||||
| Fair value as of September 30, 2017 |
$ | 331 | $ | 110 | $ | 152 | $ | 51 | $ | 644 | ||||||||||
| Change in fair value recorded in other income (expense), net |
34 | (16 | ) | (22 | ) | (9 | ) | (13 | ) | |||||||||||
|
|
|
|
|
|
|
|
|
|
|
|||||||||||
| Fair value as of September 30, 2018 |
$ | 365 | $ | 94 | $ | 130 | $ | 42 | $ | 631 | ||||||||||
| Conversion of redeemable convertible preferred stock warrants to common stock warrants |
(365 | ) | (94 | ) | (130 | ) | (42 | ) | (631 | ) | ||||||||||
|
|
|
|
|
|
|
|
|
|
|
|||||||||||
| Fair value as of September 30, 2019 |
$ | — | $ | — | $ | — | $ | — | $ | — | ||||||||||
|
|
|
|
|
|
|
|
|
|
|
|||||||||||
93
Table of Contents
4. Balance sheet components
The Company’s accounts receivable, net balance consists of the following:
| September 30, | ||||||||
| (in thousands) |
2019 | 2018 | ||||||
| Trade Receivables |
$ | 11,085 | $ | 5,439 | ||||
| Other Receivables |
1,313 | 75 | ||||||
| Allowance for Doubtful Accounts |
(294 | ) | (95 | ) | ||||
|
|
|
|
|
|||||
| Accounts Receivable, net |
$ | 12,104 | $ | 5,419 | ||||
|
|
|
|
|
|||||
Inventories consist of the following:
| September 30, | ||||||||
| (in thousands) |
2019 | 2018 | ||||||
| Raw Materials |
$ | 4,900 | $ | 2,988 | ||||
|
Work-in-process |
1,157 | 2,273 | ||||||
| Finished Goods |
1,273 | 767 | ||||||
|
|
|
|
|
|||||
| $ | 7,330 | $ | 6,028 | |||||
|
|
|
|
|
|||||
Property and Equipment, net consists of the following:
| September 30, | ||||||||
| (in thousands) |
2019 | 2018 | ||||||
| Laboratory equipment |
$ | 26,021 | $ | 18,865 | ||||
| Furniture, fixtures and other equipment |
1,760 | 613 | ||||||
| Computer equipment |
2,777 | 2,137 | ||||||
| Computer software |
3,507 | 3,094 | ||||||
| Leasehold improvements |
3,772 | 3,340 | ||||||
| Construction in progress |
5,991 | 1,534 | ||||||
|
|
|
|
|
|||||
| 43,828 | 29,583 | |||||||
| Less: Accumulated depreciation and amortization |
(22,993 | ) | (17,252 | ) | ||||
|
|
|
|
|
|||||
| $ | 20,835 | $ | 12,331 | |||||
|
|
|
|
|
|||||
5. Goodwill and intangible assets
There were no changes to the carrying value of goodwill during the years ended September 30, 2019 and 2018. Total amortization expense related to intangible assets was $0.2 million for the year ended September 30, 2019, $0.2 million for the year ended September 30, 2018 and $0.2 million for the year ended September 30, 2017.
The intangible assets balances are presented below:
| September 30, 2019 | ||||||||||||||||
| (in thousands, except for years) |
Useful lives in years |
Gross carrying amount |
Accumulated amortization |
Net book value |
||||||||||||
| Developed Technology |
6 | $ | 1,220 | $ | (712 | ) | $ | 508 | ||||||||
| Tradenames & Trademarks |
2 | 20 | (20 | ) | — | |||||||||||
|
|
|
|
|
|
|
|||||||||||
| Total indefinite-lived intangible assets |
$ | 1,240 | $ | (732 | ) | $ | 508 | |||||||||
|
|
|
|
|
|
|
|||||||||||
94
Table of Contents
| September 30, 2018 | ||||||||||||||||
| (in thousands, except for years) |
Useful lives in years |
Gross carrying amount |
Accumulated amortization |
Net book value |
||||||||||||
| Developed Technology |
6 | $ | 1,220 | $ | (508 | ) | $ | 712 | ||||||||
| Tradenames & Trademarks |
2 | 20 | (20 | ) | — | |||||||||||
|
|
|
|
|
|
|
|||||||||||
| Total indefinite-lived intangible assets |
$ | 1,240 | $ | (528 | ) | $ | 712 | |||||||||
|
|
|
|
|
|
|
|||||||||||
Future annual amortization expense is as follows (in thousands):
| Years ending September 30, |
||||
| 2020 |
203 | |||
| 2021 |
203 | |||
| 2022 |
102 | |||
|
|
|
|||
| $508 | ||||
|
|
|
6. Long-term debt
In September 2017, the Company entered into a Fourth Amended and Restated Loan and Security Agreement (the Fourth Loan) with SVB for loan amounts aggregating up to $20.0 million in a series of three advances. The first advance provides a principal amount of $10.0 million, the second advance provides a principal amount of $5.0 million and the third advance provides a principal amount of $5.0 million during their respective draw down periods. The draw down periods for the second and third advances under this agreement have expired as of January 31, 2018 and June 30, 2018, respectively and were not utilized. In connection with the first advance the Company issued a warrant to purchase 64,127 shares of common stock at an exercise price of $6.24 per share. The Fourth Loan contains a subjective acceleration clause under which the Fourth Loan could become due and payable to SVB in the event of a material adverse change in the Company’s business. The term of the loan was 51 months with an interest rate of prime plus 3.00% and a final payment fee of $0.7 million.
The first advance, totaling $10.0 million, was drawn in September 2017 and comprised $7.8 million to refinance a prior loan and a new advance of $2.2 million. The debt provides for interest only payments through December 31, 2018 at which time monthly principal payments become due.
In addition, the Company obtained a revolving loan facility for a principal amount of up to $10.0 million for which the principal amount outstanding under the revolving line would accrue interest at a floating per annum rate equal to one percentage point (1.00%) above the prime rate, which interest shall be payable monthly. The Company accounted for this transaction as a debt modification and did not incur any gain or loss relating to the modification.
The Company’s credit facilities contain customary representations and warranties and customary affirmative and negative covenants applicable to the Company and its subsidiaries, including, among other things, restrictions on changes in business, management, ownership or business locations, indebtedness, encumbrances, investments, mergers or acquisitions, dispositions, maintenance of collateral accounts, prepayment of other indebtedness, distributions and transactions with affiliates. The credit facilities contain customary events of default subject in certain cases to grace periods and notice requirements, including (a) failure to pay principal, interest and other obligations when due, (b) material misrepresentations, (c) breach of covenants, conditions or agreements in the credit facilities, (d) default under material indebtedness, (e) certain bankruptcy events, (f) a material adverse change; (g) attachment, levy or restraint on business, (h) default with respect to subordinated debt, (i) cross default under the Company’s credit facilities, and (j) government approvals being revoked. As of September 30, 2017, all rights, title and interest to the Company’s personal property with the exception of the Company’s intellectual property, have been pledged as collateral, including cash and cash equivalents, short-term investments, accounts receivable, contractual rights to payment, license agreements, general intangibles, inventory and equipment. The Company was in compliance with all covenants under the loan and security agreement with SVB as of September 30, 2019 and 2018.
95
Table of Contents
Future maturities of the Fourth Loan as of September 30, 2019 are as follows:
| (in thousands) |
Principal | Interest | Total | |||||||||
| Years ending September 30, |
||||||||||||
| 2020 |
$ | 3,333 | 486 | $ | 3,819 | |||||||
| 2021 |
3,333 | 214 | 3,547 | |||||||||
| 2022 |
834 | 11 | 845 | |||||||||
|
|
|
|
|
|
|
|||||||
| 7,500 | 711 | 8,211 | ||||||||||
| Less: Interest |
(711 | ) | ||||||||||
|
|
|
|||||||||||
| Total amount of loan principal |
7,500 | |||||||||||
| Less unamortized debt discount |
(269 | ) | ||||||||||
| Add: accretion of final payment fee |
502 | |||||||||||
|
|
|
|||||||||||
| $ | 7,733 | |||||||||||
|
|
|
|||||||||||
7. Commitments and contingencies
Litigation
In February 2016, a complaint was filed in the Superior Court of the State of California (County of Santa Clara), dated February 3, 2016 on behalf of Agilent Technologies, Inc. (Agilent), against the Company and its CEO, Dr. Emily Leproust (the Complaint) alleging (i) breach of contract against the CEO, and two current or former employees (ii) breach of duty of loyalty against the CEO, and (iii) misappropriation of trade secrets by the Company, the CEO, and two current or former employees. On December 7, 2018, the Court granted Agilent’s motion to amend its complaint, permitting Agilent to file its Second Amended Complaint. This new complaint adds amended allegations against the Company and the CEO, and also new claims for breach of contract and trade secret misappropriation against two individuals: a current Company employee and a former Company employee. The Court also set trial to begin on February 24, 2020.
The Company believes that the complaint is without merit, and intends to continue vigorously defending itself. The Company is currently unable to predict the ultimate outcome of this matter or estimate a reasonably possible loss or range of loss, and no amounts have been accrued in the consolidated financial statements.
Indemnifications
In the ordinary course of business, the Company enters into agreements that may include indemnification provisions. Pursuant to such agreements, the Company may indemnify, hold harmless and defend the indemnified parties for losses suffered or incurred by the indemnified party. Some of the provisions will limit losses to those arising from third-party actions. In some cases, the indemnification will continue after the termination of the agreement. The maximum potential amount of future payments the Company could be required to make under these provisions is not determinable. To date, the Company has not incurred material costs to defend lawsuits or settle claims related to these indemnification provisions. The Company has also entered into indemnification agreements with its directors and officers that may require it to indemnify its directors and officers against liabilities that may arise by reason of their status or service as directors or officers to the fullest extent permitted by corporate law. The Company also has directors’ and officers’ insurance.
Leases
The Company leases certain of its facilities under non-cancellable operating leases expiring at various dates through 2026. The Company is also responsible for utilities, maintenance, insurance, and property taxes under these leases.
96
Table of Contents
Future minimum lease payments under all non-cancelable operating leases as of September 30, 2019 are as follows:
| (in thousands) |
Operating leases |
|||
| Years ending September 30: |
||||
| 2020 |
$ | 6,671 | ||
| 2021 |
5,909 | |||
| 2022 |
5,979 | |||
| 2023 |
6,064 | |||
| 2024 |
6,029 | |||
| Thereafter |
10,067 | |||
|
|
|
|||
| Total minimum lease payments |
$ | 40,719 | ||
|
|
|
|||
Rent expense was $4.9 million, $2.5 million and $2.2 million for the years ended September 30, 2019, 2018 and 2017, respectively. Rent expense is measured based upon amortizing minimum lease payments, including rent escalations under the lease term, using the straight-line method over the term of the lease.
Prepaid rent was $1.6 million as of September 30, 2019. There was no prepaid rent as of September 30, 2018. There was no deferred rent liability as of September 30, 2019. The deferred rent liability was $0.1 million as of September 30 2018.
8. Related party transactions
During the year ended September 30, 2019, the Company purchased raw materials from a related party investor in the amount of $3.2 million. Payable balances and cash receipts and receivable balances with the related party were immaterial as of September 30, 2019.
During the year ended September 30, 2018, the Company purchased raw materials from a related party investor in the amount of $2.3 million. Payable balances and cash receipts and receivable balances with the related party were immaterial as of September 30, 2018.
During the year ended September 30, 2017, the Company sold 170,085 shares of Series D redeemable convertible preferred stock to a related party. The Company also purchased raw materials from a related party investor in the amount of $2.0 million. Payable balances and cash receipts and receivable balances with the related party were immaterial as of September 30, 2017.
9. Income taxes
The Company recorded provision for income taxes of $0.3 million for the year ended September 30, 2019, $0.2 million for the year ended September 30, 2018 and $0.3 million for the year ended September 30, 2017.
97
Table of Contents
The significant components of the Company’s deferred tax assets and liabilities are as follows:
| September 30, | ||||||||
| (in thousands) |
2019 | 2018 | ||||||
| Net operating loss carryforwards |
$ | 73,341 | $ | 49,801 | ||||
| Research and development credit carryforwards |
6,831 | 4,621 | ||||||
| Other |
4,553 | 1,919 | ||||||
|
|
|
|
|
|||||
| Gross deferred tax assets |
84,725 | 56,341 | ||||||
| Less: Valuation allowance |
(84,598 | ) | (56,158 | ) | ||||
|
|
|
|
|
|||||
| Net deferred tax assets |
127 | 183 | ||||||
|
|
|
|
|
|||||
| Fixed assets |
(1 | ) | (1 | ) | ||||
| Intangible assets |
(126 | ) | (182 | ) | ||||
|
|
|
|
|
|||||
| Gross deferred tax liabilities |
(127 | ) | (183 | ) | ||||
|
|
|
|
|
|||||
| Total net deferred tax asset |
$ | — | $ | — | ||||
|
|
|
|
|
|||||
The following is a reconciliation of the statutory federal income tax rate to the Company’s effective tax rate:
| Year ended September 30, |
||||||||||||
| 2019 | 2018 | 2017 | ||||||||||
| Tax expense computed at the federal statutory rate |
21 | % | 24 | % | 35 | % | ||||||
| Change in valuation allowance |
(22 | )% | 4 | % | (35 | )% | ||||||
| Research and development credit benefit |
1 | % | 1 | % | 1 | % | ||||||
| Change in federal tax rate |
— | (28 | )% | — | ||||||||
| Other expenses |
— | (1 | )% | (1 | )% | |||||||
|
|
|
|
|
|
|
|||||||
| Total income tax expense |
— | % | — | % | — | % | ||||||
|
|
|
|
|
|
|
|||||||
Based on the available objective evidence, management believes it is more likely than not that the deferred tax assets will not be fully realizable. Accordingly, the Company has provided a full valuation allowance against its deferred tax assets at September 30, 2019 and 2018.
As of September 30, 2019, the Company had net operating loss carryforwards of approximately $293.6 million and $183.4 million available to reduce future taxable income, if any, for federal and state income tax purposes, respectively. The net operating losses will begin to expire in fiscal 2032.
The Company also had federal and state research and development credit carryforwards of approximately $5.7 million and $5.1 million, respectively, at September 30, 2019. The federal credits will expire starting in 2033 if not utilized. The California research and development credits have no expiration date. Utilization of the net operating losses and tax credits is subject to annual limitation due to the ownership change limitations provided by the Internal Revenue Code and similar state provisions. Such annual limitations may result in the expiration of the net operating losses and tax credits before utilization.
The provisions of ASC 740-10, Accounting for Uncertainty in Income Taxes, prescribe a comprehensive model for the recognition, measurement, and presentation and disclosure in financial statements of any uncertain tax positions that have been taken or expected to be taken on a tax return. The Company has identified uncertain tax positions related to federal and state research and development credits.
98
Table of Contents
The aggregate changes in the balance of gross unrecognized tax benefits are as follows:
| (in thousands) |
Federal and state |
|||
| Balance as of September 30, 2016 |
822 | |||
| Increases related to tax positions taken during 2017 |
562 | |||
| Increases related to tax positions in prior years |
241 | |||
|
|
|
|||
| Balance as of September 30, 2017 |
1,625 | |||
| Increases related to tax positions taken during 2018 |
624 | |||
|
|
|
|||
| Balance as of September 30, 2018 |
$ | 2,249 | ||
| Increases related to tax positions taken during 2019 |
1,042 | |||
|
|
|
|||
| Balance as of September 30, 2019 |
$ | 3,291 | ||
|
|
|
|||
The Company does not expect a material change in unrecognized tax benefits in the next twelve months. As of September 30, 2019, no unrecognized tax benefit would, if recognized, impact the Company’s effective income tax rate.
It is the Company’s policy to include penalties and interest expense related to income taxes as a component of other expense and interest expense, respectively, as necessary. The Company’s management determined that no accrual for interest and penalties was required as of September 30, 2019 and 2018.
The Company’s tax years from 2014 through 2018 will remain open for examination by the federal and state authorities for three and four years, respectively, from the date of utilization of any net operating loss or tax credits. The Company currently has no federal or state tax examinations in progress.
On December 22, 2017, the Tax Cuts and Jobs Act of 2017, or the Tax Act, was enacted into law making significant changes to the Internal Revenue Code. Changes include, but are not limited to, a federal corporate tax rate decrease from 35% to 21% for tax years beginning after December 31, 2017, the transition of U.S. international taxation from a worldwide tax system to a territorial system, and a one-time transition tax on the mandatory deemed repatriation of foreign earnings. For net operating losses generated in the years beginning after December 31, 2017, utilization is limited to 80% of taxable income with an unlimited carryforward period. The Company recognized the effect of the tax law changes in the period of enactment, which required a remeasurement of its U.S. deferred tax assets and liabilities. The Tax Act did not have a material impact on the Company’s financial statements due to its historical loss position and the full valuation allowance on its deferred tax assets. The Company has completed its analysis and accounting with respect to the Tax Act.
99
Table of Contents
10. Warrants
In connection with its long-term debt agreements, the Company issued warrants for its redeemable convertible preferred stock and common stock as follows:
| (in thousands, except share and per share data) | Number of shares underlying warrants |
|||||||||||||||
| September 30, 2019 |
Issuance date | Expiration date | Exercise price per share |
|||||||||||||
| Warrant class/series: |
||||||||||||||||
| Common stock warrants |
18,854 | December 22, 2015 | December 22, 2025 | $ | 14.85 | |||||||||||
| Common stock warrants |
7,531 | March 28, 2016 | March 28, 2026 | $ | 21.24 | |||||||||||
|
|
|
|||||||||||||||
| Total common stock warrants |
26,385 | |||||||||||||||
|
|
|
|||||||||||||||
| (in thousands, except share and per share data) | Number of shares underlying warrants |
Fair value |
||||||||||||||||||
| September 30, 2018 | Issuance date | Expiration date | Exercise price per share |
|||||||||||||||||
| Warrant class/series: |
||||||||||||||||||||
| Series A |
36,838 | $ | 365 | October 8, 2013 | October 8, 2023 | $ | 3.26 | |||||||||||||
| Series B |
16,221 | 94 | September 2, 2014 | September 2, 2024 | $ | 7.84 | ||||||||||||||
| Series C |
18,854 | 130 | December 22, 2015 | December 22, 2025 | $ | 14.85 | ||||||||||||||
| Series D |
7,531 | 42 | March 28, 2016 | March 28, 2026 | $ | 21.24 | ||||||||||||||
|
|
|
|
|
|||||||||||||||||
| Total preferred stock warrants |
79,444 | $ | 631 | |||||||||||||||||
|
|
|
|
|
|||||||||||||||||
| Common stock warrants |
64,127 | $ | 486 | September 6, 2017 | September 6, 2027 | $ | 6.24 | |||||||||||||
|
|
|
|
|
|||||||||||||||||
In October 2018, each warrant to purchase redeemable convertible preferred stock was converted to a warrant to purchase common stock immediately prior to the completion of the IPO. In November 2018, a total of 68,901 warrants were net exercised; 36,838 warrants with an exercise price of $3.26 per common share and 32,063 warrants with an exercise price of $6.24 per common share. The transactions were a cashless exercise for a net 57,122 common shares issued by the Company. In July 2019, a total of 32,064 warrants with an exercise price of $6.24 per common share were net exercised for a net 25,422 common shares issued by the Company. In September 2019, a total of 16,221 warrants with an exercise price of $7.84 per common share were net exercised for a net 12,019 common shares issued by the Company.
11. Redeemable convertible preferred stock
In October 2018, each share of Series A, Series B, Series C, and Series D redeemable convertible preferred stock was converted into common stock immediately prior to the completion of the IPO.
12. Common stock
The fair value of the shares of common stock underlying the Company’s stock options has historically been determined by management and approved by the board of directors. Prior to the Company’s IPO, management and the board of directors determined the fair value of the common stock at the time of grant of any options by considering a number of objective and subjective factors, including valuations performed by an independent third-party specialists, valuations of comparable companies, operating and financial performance, the lack of liquidity of the common stock, recent private stock sale transactions and general and industry-specific economic
100
Table of Contents
outlooks. Valuations performed by third-party valuation specialists were completed and used the methodologies, approaches, and assumptions consistent with the AICPA, Accounting and Valuation Guide: Valuation of Privately-Held-Company Equity Securities Issued as Compensation and Company specific factors.
As of September 30, 2019, the Company reserved sufficient shares of common stock for issuance upon conversion of preferred stock and exercise of stock options and warrants. Each share of common stock is entitled to one vote. The holders of shares of common stock are also entitled to receive dividends whenever funds are legally available and when declared by the board of directors, subject to prior rights of the holders of preferred stock.
13. Stock option plan
2018 Equity Incentive Plan
On September 26, 2018, the board of directors adopted the 2018 Equity Incentive Plan (the 2018 Plan) as a successor to the 2013 Stock Plan. The maximum aggregate number of shares that may be issued under the 2018 Plan is 5,856,505 shares of the Company’s common stock. The number of shares reserved for issuance under the 2018 Plan will be increased automatically on the first day of each fiscal year, following the fiscal year in which the 2018 Plan became effective, by a number equal to the least of 999,900 shares, 4% of the shares of common stock outstanding at that time, or such number of shares determined by the Company’s board of directors. The common shares issuable under the 2018 Plan were registered pursuant to a registration statement on Form S-8 on November 1, 2018.
Any shares subject to outstanding awards under the 2013 Stock Plan that are canceled or repurchased subsequent to the 2018 Plan’s effective date are returned to the pool of shares reserved for issuance under the 2018 Plan. Awards granted under the 2018 Plan may be nonstatutory stock options, stock appreciation rights, restricted stock, restricted stock units, performance shares, and performance units.
2018 Employee Stock Purchase Plan
On September 26, 2018, the board of directors adopted the 2018 Employee Stock Purchase Plan (the 2018 ESPP). A total of 275,225 shares of the Company’s common stock have been reserved for issuance under the 2018 ESPP. The number of shares reserved for issuance under the 2018 ESPP will be increased automatically on the first day of each fiscal year, following the fiscal year in which the 2018 ESPP becomes effective, by a number equal to the least of 249,470 shares, 1% of the shares of common stock outstanding at that time, or such number of shares determined by the Company’s board of directors. Subject to any plan limitations, the 2018 ESPP allows eligible service providers (through qualified and non-qualified offerings) to contribute, normally through payroll deductions, up to 15% of their earnings for the purchase of the Company’s common stock at a discounted price per share. The offering periods are beginning in February and August of each year, except the initial offering period which commenced with the initial public offering in October 2018 and ended on August 20, 2019. The common shares issuable under the 2018 ESPP were registered pursuant to a registration statement on Form S-8 on November 26, 2018.
Unless otherwise determined by the board of directors, the Company’s common stock will be purchased for the accounts of employees participating in the 2018 ESPP at a price per share that is the lesser of 85% of the fair market value of the Company’s common stock on the first trading day of the offering period, which for the initial offering period is the price at which shares of the Company’s common stock were first sold to the public, or 85% of the fair market value of the Company’s common stock on the last trading day of the offering period. During the year ended September 30, 2019, activity under the 2018 ESPP was immaterial.
101
Table of Contents
Activity under the equity incentive plans during the years ended September 30, 2019, 2018 and 2017 is summarized below:
| Shares available |
Options outstanding |
Weighted average exercise price per share |
Weighted average remaining contractual term (years) |
Aggregate intrinsic value |
||||||||||||||||
| Outstanding at September 30, 2016 |
470,623 | 1,033,612 | $ | 4.93 | 8.81 | $ | 1,343,301 | |||||||||||||
| Additional shares authorized |
1,035,414 | — | — | |||||||||||||||||
| Stock options granted |
(857,082 | ) | 857,082 | 8.61 | ||||||||||||||||
| Stock options exercised |
— | (32,586 | ) | 5.54 | ||||||||||||||||
| Stock options forfeited |
38,384 | (38,384 | ) | 5.54 | ||||||||||||||||
|
|
|
|
|
|
|
|||||||||||||||
| Outstanding at September 30, 2017 |
687,339 | 1,819,724 | $ | 6.63 | 9.14 | $ | 7,147,115 | |||||||||||||
| Additional shares authorized |
905,786 | — | — | |||||||||||||||||
| Stock options granted |
(951,310 | ) | 951,310 | 10.96 | ||||||||||||||||
| Stock options exercised |
— | (62,862 | ) | 5.37 | ||||||||||||||||
| Stock options forfeited |
187,687 | (187,687 | ) | 7.73 | ||||||||||||||||
| Early exercised options repurchased |
9,639 | — | ||||||||||||||||||
| Forfeiture of restricted common stock |
21,146 | — | — | |||||||||||||||||
|
|
|
|
|
|
|
|||||||||||||||
| Outstanding at September 30, 2018 |
860,287 | 2,520,485 | $ | 8.22 | 8.38 | $ | 11,482,909 | |||||||||||||
| Additional shares authorized |
2,494,700 | — | — | |||||||||||||||||
| Stock options granted |
(1,685,625 | ) | 1,685,625 | 25.53 | ||||||||||||||||
| Stock options exercised |
— | (331,205 | ) | 6.67 | ||||||||||||||||
| Stock options forfeited |
324,460 | (324,460 | ) | 14.75 | ||||||||||||||||
| Restricted stock units granted |
(500,132 | ) | — | — | ||||||||||||||||
| Early exercised options repurchased |
442 | — | — | |||||||||||||||||
| Forfeiture of restricted stock units |
26,743 | — | — | |||||||||||||||||
|
|
|
|
|
|
|
|||||||||||||||
| Outstanding at September 30, 2019 |
1,520,875 | 3,550,445 | $ | 15.99 | 8.25 | $ | 31,997,934 | |||||||||||||
|
|
|
|
|
|
|
|
|
|
|
|||||||||||
| Vested or expected to vest at September 30, 2019 |
3,550,445 | $ | 15.99 | 8.25 | $ | 31,997,934 | ||||||||||||||
| Vested and exercisable at September 30, 2019 |
1,243,634 | $ | 7.77 | 7.01 | $ | 20,125,913 | ||||||||||||||
|
|
|
|
|
|
|
|
|
|||||||||||||
As of September 30, 2019, there was $24.8 million of total unrecognized compensation cost related to non-vested stock options under the equity incentive plans that are expected to be recognized over a weighted average period of 3.4 years.
Restricted Stock Units
Restricted stock primarily consists of restricted stock unit awards (RSUs) which have been granted to employees. The value of an RSU award is based on the Company’s stock price on the date of grant. The shares underlying the RSU awards are not issued until the RSUs vest. Upon vesting, each RSU converts into one share of the Company’s common stock.
102
Table of Contents
Activity with respect to the Company’s restricted stock units during the year ended September 30, 2019 was as follows:
| (in thousands, except share and per share data) | Number of Shares |
Weighted average grant date fair value per share |
Weighted average remaining contractual term (years) |
Aggregate Intrinsic Value |
||||||||||||
| Outstanding at September 30, 2018 |
— | $ | — | — | $ | — | ||||||||||
| Restricted stock units granted |
500,132 | 26.12 | 3.87 | 13,059,488 | ||||||||||||
| Restricted stock units vested |
(11,019 | ) | 24.69 | — | — | |||||||||||
| Restricted stock units forfeited |
(26,743 | ) | 25.92 | — | — | |||||||||||
| Outstanding at September 30, 2019 |
462,370 | 26.16 | 3.91 | 8,959,223 | ||||||||||||
|
|
|
|
|
|
|
|
|
|||||||||
| Expected to vest at September 30, 2019 |
462,370 | $ | 26.16 | 3.91 | $ | 8,959,223 | ||||||||||
|
|
|
|
|
|
|
|
|
|||||||||
As of September 30, 2019, there was $10.2 million of total unrecognized compensation cost related to these issuances that is expected to be recognized over a weighted average period of 3.99 years.
Stock-based compensation
Total stock-based compensation expense recognized was as follows:
| Year ended September 30, |
||||||||||||
| (in thousands) |
2019 | 2018 | 2017 | |||||||||
| Cost of revenues |
$ | 1,345 | $ | 376 | $ | 202 | ||||||
| Research and development |
2,378 | 705 | 575 | |||||||||
| Selling, general and administrative |
7,447 | 1,880 | 1,114 | |||||||||
|
|
|
|
|
|
|
|||||||
| Total stock-based compensation |
$ | 11,170 | $ | 2,961 | $ | 1,891 | ||||||
|
|
|
|
|
|
|
|||||||
The Company uses the Black-Scholes option pricing model to calculate the grant date fair value of a stock option. The Black-Scholes model requires various assumptions, including the fair value of the Company’s common stock, expected term, expected dividend yield and expected volatility.
The expected volatility of the Company’s stock options is estimated from the historical volatility of selected public companies with comparable characteristics to it, including similarity in size and lines of business. The expected term of stock options represents the period that the Company’s stock-options are expected to be outstanding before being exercised. The risk-free interest rate is based on the implied yield currently available on U.S. treasury notes with terms approximately equal to the expected life of the option. The expected dividend rate is zero as the Company currently has no history or expectation of declaring cash dividends on the Company’s common stock.
The fair value of options granted during the years ended September 30, 2019, 2018 and 2017, respectively, were calculated using the weighted average assumptions set forth below:
| Year ended September 30, |
||||||||||||
| 2019 | 2018 | 2017 | ||||||||||
| Expected term (years) |
6.41 | 6.25 | 6.25 | |||||||||
| Expected volatility |
60.2 | % | 66.3 | % | 65.5 | % | ||||||
| Risk-free interest rate |
2.72 | % | 2.65 | % | 2.02 | % | ||||||
| Dividend yield |
0 | % | 0 | % | 0 | % | ||||||
103
Table of Contents
Weighted average grant date fair value of options granted during the years ended September 30, 2019, 2018 and 2017 was $15.06, $7.08 and $6.63, respectively.
Shares subject to repurchase
The Company has a right of repurchase with respect to unvested shares issued upon early exercise of options at an amount equal to the original exercise price of each unvested share being repurchased. The Company’s right to repurchase these shares lapses pursuant to the vesting schedule of the original grant, which is generally 25% on the first anniversary of the original grant and ratably on a monthly basis over the remaining 36 months. As of September 30, 2019, 38,157 shares remain subject to the Company’s right of repurchase.
14. Net loss per share attributable to common stockholders
The following table sets forth the computation of the Company’s basic and diluted net loss per share attributable to common stockholders:
| Year ended September 30, | ||||||||||||
| (in thousands, except share and per share data) |
2019 | 2018 | 2017 | |||||||||
| Numerator: |
||||||||||||
| Net loss attributable to common stockholders |
$ | (107,669 | ) | $ | (71,236 | ) | $ | (59,310 | ) | |||
|
|
|
|
|
|
|
|||||||
| Denominator: |
||||||||||||
| Weighted-average shares used in computing net loss per share, basic and diluted |
27,461,844 | 2,792,743 | 2,422,243 | |||||||||
|
|
|
|
|
|
|
|||||||
| Net loss per share attributable to common stockholders, basic and diluted |
$ | (3.92 | ) | $ | (25.51 | ) | $ | (24.49 | ) | |||
|
|
|
|
|
|
|
|||||||
The potentially dilutive common shares that were excluded from the calculation of diluted net loss per share because their effect would have been antidilutive for the periods presented are as follows:
| Year ended September 30, | ||||||||||||
| 2019 | 2018 | 2017 | ||||||||||
| Shares subject to options to purchase common stock |
3,550,445 | 2,520,485 | 1,819,724 | |||||||||
| Unvested restricted shares of common stock |
23,861 | 96,750 | 513,766 | |||||||||
| Unvested restricted stock units |
462,370 | — | — | |||||||||
| Unvested shares of common stock issued upon early exercise of stock options |
38,157 | 74,142 | 44,698 | |||||||||
| Shares subject to employee stock purchase plan |
76,335 | — | — | |||||||||
| Shares subject to warrants to purchase common stock |
26,385 | 64,127 | 64,127 | |||||||||
| Shares subject to warrants to purchase redeemable convertible preferred stock |
— | 79,444 | 79,444 | |||||||||
| Shares of redeemable convertible preferred stock |
— | 18,951,305 | 14,658,940 | |||||||||
|
|
|
|
|
|
|
|||||||
| Total |
4,177,553 | 21,786,253 | 17,180,699 | |||||||||
|
|
|
|
|
|
|
|||||||
104
Table of Contents
15. Geographic, product and industry information
The table below sets forth revenues by geographic region, based on ship-to destinations. North America consists of Canada and Mexico; EMEA consists of Europe, Middle East, and Africa; and APAC consists of Japan, China, South Korea, Singapore, Malaysia and Australia.
| Year ended September 30, |
||||||||||||
| (in thousands) |
2019 | 2018 | 2017 | |||||||||
| United States |
$ | 35,936 | $ | 17,662 | $ | 8,243 | ||||||
| EMEA |
14,692 | 6,557 | 2,023 | |||||||||
| APAC |
2,761 | 1,001 | 274 | |||||||||
| North America |
996 | 207 | 227 | |||||||||
|
|
|
|
|
|
|
|||||||
| Total |
$ | 54,385 | $ | 25,427 | $ | 10,767 | ||||||
|
|
|
|
|
|
|
|||||||
The table below sets forth revenues by products.
| Year ended September 30, |
||||||||||||
| (in thousands) |
2019 | 2018 | 2017 | |||||||||
| Synthetic genes |
$ | 26,712 | $ | 17,986 | $ | 8,122 | ||||||
| Oligo pools |
4,594 | 3,002 | 2,056 | |||||||||
| DNA libraries |
2,036 | 1,771 | 517 | |||||||||
| NGS tools |
21,043 | 2,668 | 72 | |||||||||
|
|
|
|
|
|
|
|||||||
| Total |
$ | 54,385 | $ | 25,427 | $ | 10,767 | ||||||
|
|
|
|
|
|
|
|||||||
Revenues by industry were as follows:
| Year ended September 30, | ||||||||||||
| (in thousands) |
2019 | 2018 | 2017 | |||||||||
| Industrial chemicals |
$ | 21,927 | $ | 14,912 | $ | 6,702 | ||||||
| Academic research |
13,835 | 5,813 | 2,709 | |||||||||
| Healthcare |
17,424 | 4,212 | 1,226 | |||||||||
| Agricultural |
1,199 | 490 | 130 | |||||||||
|
|
|
|
|
|
|
|||||||
| Total revenues |
$ | 54,385 | $ | 25,427 | $ | 10,767 | ||||||
|
|
|
|
|
|
|
|||||||
Long-lived assets located in the United States are $19.8 million and $11.9 million as of September 30, 2019 and 2018. Long-lived assets located outside of the United States were $1.0 million and $0.4 million as of September 30, 2019 and 2018.
* * * * *
105
Table of Contents
| Item 9. | Changes in and disagreements with accountants on accounting and financial disclosure |
None.
| Item 9A. | Controls and procedures |
| (a) | Evaluation of disclosure controls and procedures |
Our management is responsible for establishing and maintaining adequate internal control over financial reporting. Management, with the participation of our chief executive officer and our chief financial officer, evaluated the effectiveness of our disclosure controls and procedures as of September 30, 2019. The term “disclosure controls and procedures,” as defined in Rules 13a-15(e) and 15d-15(e) under the Exchange Act, means controls and other procedures of a company that are designed to ensure that information required to be disclosed by a company in the reports that it files or submits under the Exchange Act is recorded, processed, summarized and reported, within the time periods specified in the SEC’s rules and forms. Disclosure controls and procedures include, without limitation, controls and procedures designed to ensure that information required to be disclosed by a company in the reports that it files or submits under the Exchange Act is accumulated and communicated to the company’s management, including its principal executive and principal financial officers, as appropriate to allow timely decisions regarding required disclosure. Management recognizes that any controls and procedures, no matter how well designed and operated, can provide only reasonable assurance of achieving their objectives, and management necessarily applies its judgment in evaluating the cost-benefit relationship of possible controls and procedures. Based on the evaluation of our disclosure controls and procedures as of September 30, 2019, our chief executive officer and chief financial officer concluded that, as of such date, our disclosure controls and procedures were effective at the reasonable assurance level.
| (b) | Management’s annual report on internal control over financial reporting |
Our management is responsible for establishing and maintaining adequate internal control over financial reporting, as such term is defined in Exchange Act Rules 13a-15(f). Because of its inherent limitations, internal control over financial reporting may not prevent or detect all misstatements. Therefore, even those systems determined to be effective can provide only reasonable assurance with respect to financial statement preparation and presentation.
We conducted an evaluation of the effectiveness of our internal control over financial reporting based on the framework in Internal Control—Integrated Framework issued by the Committee of Sponsoring Organizations of the Treadway Commission (2013 framework). Based on our evaluation under the framework in Internal Control—Integrated Framework, our management concluded that our internal control over financial reporting was effective as of September 30, 2019.
| (c) | Changes in internal control over financial reporting |
There were no changes in our internal control over financial reporting identified in connection with the evaluation required by Rule 13a-15(d) and 15d-15(d) of the Exchange Act that occurred during the quarter ended September 30, 2019 that have materially affected, or are reasonably likely to materially affect, our internal control over financial reporting.
| Item 9B. | Other information |
None.
106
Table of Contents
| Item 10. | Directors, executive officers and corporate governance |
The following is biographical information, as of December 12, 2019, of the ten (10) members of our board of directors:
William Banyai, Ph.D., age 65, has served as our Chief Operating Officer and as a member of our board of directors since April 2013. Prior to co-founding Twist Bioscience, from April 2006 to March 2013, Dr. Banyai was the Vice President of Hardware Engineering at Complete Genomics Inc., a life sciences company that developed and commercialized a platform for sequencing and analyzing human genomes. Dr. Banyai was also previously a director at Glimmerglass Networks, a supplier of SDN enabled Intelligent Optical Switching and Optical Network Management solutions. Dr. Banyai holds a B.S. in Physics and an M.S. in Electrical Science from the University of Michigan, an Engineer of Electrical Engineering degree from the University of Southern California and a Ph.D. in Optical Science from the University of Arizona. Our board of directors believes that Dr. Banyai’s experience as our Chief Operating Officer and extensive executive and professional experience in the biotechnology industry, as well as his previous director experience and expertise in corporate governance, qualify him to serve as a director.
Nicolas M. Barthelemy, age 54, has served as a member of our board of directors since October 2019. Mr. Barthelemy brings over 25 years of industry experience to Twist. From September 2014 to February 2017, Mr. Barthelemy served as the President and Chief Executive Officer of Biotheranostics, Inc., a molecular diagnostics company. Previously, he served as President, Global Commercial Operations at Life Technologies Corporation, a global life sciences company, which was acquired by Thermo Fisher Scientific Inc. in February 2014. Before Life Technologies, Mr. Barthelemy was with Biogen Inc., a biotechnology company, most recently as Vice President, Manufacturing and General Manager. He began his career with Merck & Co., Inc., a pharmaceutical company, as Project Engineer, Vaccine Technology. Mr. Barthelemy currently serves as a member of the boards of directors of Fluidigm Corporation, Repligen Corporation, 908 Devices Inc. and of Biocare Medical, LLC. Mr. Barthelemy received an M.S. in chemical engineering from the University of California, Berkeley, and an engineering degree from the Ecole Superieure de Physique et Chimie Industrielles, Paris. Our board of directors believes that Mr. Barthelemy’s extensive experience in manufacturing, distributing and commercializing life science instruments, reagents and services, his knowledge of the research and clinical markets as well as his relevant director experience qualify him to serve as one of our directors.
Nelson C. Chan, age 58, has served on our board of directors since May 2019. From 2006 until 2008, Mr. Chan served as Chief Executive Officer of Magellan Navigation, Inc., a leader in the consumer, survey, GIS and OEM GPS navigation and positioning markets. From 1992 through 2006, Mr. Chan held various senior management positions at SanDisk Corporation, a leader in flash memory cards, including most recently as Executive Vice President and General Manager, Consumer Business. From 1983 to 1992, Mr. Chan held marketing and engineering positions at Chip and Technologies, Signetics, and Delco Electronics. Mr. Chan is Chairman of the board of Synaptics Incorporated, a developer of custom-designed human interface solutions, and is Chairman of the Board of Directors of Adesto Technologies Corporation, a leading provider of innovative application-specific semiconductors and embedded systems for the IoT. Mr. Chan is also a director and a member of the Audit Committee of Deckers Outdoor Corporation. Mr. Chan previously served as a director of Affymetrix, a genetic analysis company from 2010 until it was acquired in 2016 by Thermo Fisher. He also served as a director of Outerwall from 2011 (and serving as Chairman of the board from 2013) until it was acquired in September 2016 by Apollo Global Management, a private equity firm. He also served as a director of Socket Mobile from 2016 until 2019, and as a director of Silicon Laboratories, Inc. from 2007 until 2010. Mr. Chan also currently serves as a member of the board of several privately-held companies. Mr. Chan holds a B.S. degree in electrical and computer engineering from the University of California at Santa Barbara and a M.B.A. from Santa Clara University. Our board believes that Mr. Chan’s experience as the Chief Executive Officer of Magellan, his senior management positions with other leading companies, and his service as a director of multiple public and private
107
Table of Contents
companies provide the requisite qualifications, skills, perspectives, and experiences that qualify him to serve on our board.
Robert Chess, age 62, has served on our board of directors since July 2014, and he was appointed as lead independent director effective as of October 30, 2018. Mr. Chess is Chairman of the board of directors of Nektar Therapeutics, a publicly traded therapeutics company. He has served on the board of Nektar Therapeutics as either CEO and/or Chairman since 1992 and has held the Chairman position since 1999. Mr. Chess has also served on the board of directors of Pharsight Corp., a publicly traded company that provides software and scientific consulting services to pharmaceutical and biotechnology companies, and CoTherix, Inc., a publicly traded biopharmaceutical company. Mr. Chess currently serves as a lecturer at the Stanford Graduate School of Business, a position he has held since 2004. Mr. Chess holds a B.S. in Engineering with Honors from the California Institute of Technology and an M.B.A. from Harvard University. Our board of directors believes that Mr. Chess brings extensive board and executive experience managing the operations of biotechnology companies, and his service on a number of public company boards provides important industry and corporate governance experience, which qualifies him to serve as one of our directors.
Keith Crandell, age 59, has served on our board of directors since October 2013. Mr. Crandell is the Managing Director of Arch Venture Corporation, a venture capital firm focused on early-stage technology companies, since 1987. Mr. Crandell is a director of several private companies and he also serves on the board of directors of Adesto Technologies Corp., a provider of low power, smart non-volatile memory products which is a publicly traded company and Quanterix, a publicly traded life science instrument company. Mr. Crandell holds a B.S. in Chemistry and Mathematics from St. Lawrence University, an M.S. in Chemistry from the University of Texas, Arlington, and an M.B.A. from the University of Chicago. Our board of directors believes that Mr. Crandell brings extensive experience in the technology industry and that his service on a number of boards provides an important perspective on operations, finance and corporate governance matters, which qualifies him to serve as one of our directors.
Frederick Craves, Ph.D., age 74, has served on our board of directors since May 2014. Dr. Craves is the Founder of Bay City Capital, one of the world’s premier life science investment firms, and has been Managing Director since its founding in September 1996. Over the course of his career, Dr. Craves has worked in executive management of a multinational pharmaceutical company and founded and managed several biotech companies. He previously served on the boards of several private and public companies, including Reliant Pharmaceuticals, Medarex Pharmaceuticals and Incyte Pharmaceuticals. His current board memberships include a lead director position on two publicly traded companies, Madrigal Pharmaceuticals, Inc., a clinical stage biopharmaceutical company, and Dermira, Inc. a dermatological biotechnology company. Dr. Craves holds a B.S. in Biology from Georgetown University, an M.S. in Biochemical Pharmacology from Wayne State University, and a Ph.D. in Pharmacology and Toxicology from the University of California, San Francisco. Our board of directors believes that in addition to his educational background, Dr. Craves brings extensive experience in the biotechnology industry and his service on a number of boards of public and private companies provides an important perspective on operations and corporate governance matters, which qualifies him to serve as one of our directors.
Jan Johannessen, age 63, has served on our board of directors since October 2018. Mr. Johannessen currently serves as an advisor to iGlobe Partners, a venture capital company. Mr. Johannessen served as Chief Operating Officer and Secretary at Conexant Systems, LLC, a semiconductor company, from May 2013 to August 2017 and also served as its Chief Financial Officer from May 2013 to May 2016 and as its Chief Executive Officer from May 2016 to August 2017. Mr. Johannessen served as Chief Financial Officer and Secretary at REC Silicon ASA, a company listed on the Oslo stock exchange from August 2008 to May 2013. He served as Interim Chief Executive Officer and President at Lattice Semiconductor Corporation, a publicly traded company, from May 2008 to August 2008 and as Chief Financial Officer and Secretary at Lattice Semiconductor Corporation from December 2003 to May 2008. Mr. Johannessen holds a B.S. in Business from the University of Houston, and a MBA in International Business from Arizona State University. Our board of directors believes that Mr. Johannessen brings extensive executive experience in the technology industry and financial and accounting expertise, which qualifies him to serve as one of our directors.
108
Table of Contents
Emily M. Leproust, Ph.D., age 46, has served as our President and Chief Executive Officer and as a member of our board of directors since April 2013. She was also appointed as Chair of our board of directors effective as of October 2018. Prior to co-founding Twist, Dr. Leproust served in various positions at Agilent most recently as its Director, Applications and Chemistry R&D from February 2009 to April 2013. Dr. Leproust holds a M.Sc. in Industrial Chemistry from the Lyon School of Industrial Chemistry and a Ph.D. in Organic Chemistry from the University of Houston. Our board of directors believes that Dr. Leproust is qualified to serve as a director because of her operational and historical expertise gained from serving as our President and Chief Executive Officer, and her extensive professional and educational experience in the biotechnology industry.
Xiaoying Mai, age 32, has served on our board of directors since July 2018. Ms. Mai is an Investment Director of GF Xinde Investment Management Co. Ltd, a venture capital investment firm based in China that specializes in investing in biotechnology companies, a position she has held since June 2015. Ms. Mai previously served as a financial manager for Guangfa Securities Co., Ltd, a publicly listed company in Hong Kong from December 2012 to June 2015, where she specialized in preparing financial information for public disclosure and tax management. Ms. Mai has also served as a member of the IPSAS program-international public sector accounting standard and worked with the United Nations in 2011. Ms. Mai holds a B.A. in Business Management from the Guangdong University of Foreign Studies and a M.A. in accountancy from George Washington University. Our board of directors believes that Ms. Mai brings extensive experience in the biotechnology industry and her experience with the Asian markets will help us to expand into such markets, which qualifies her to serve as one of our directors.
Robert Ragusa, age 60, has served on our board of directors since November 2016. Mr. Ragusa is currently the Senior Vice President, Global Quality and Operations, at Illumina, Inc., a strategic commercial partner of Twist and a publicly traded corporation, where he has worked since December 2013. Prior to joining Illumina, Inc., from April 2010 to November 2013, Mr. Ragusa was Executive Vice President, Global Operations and Service at Accuray Incorporated, a radiation oncology company that develops, manufactures, sells and supports cancer treatment solutions. Mr. Ragusa holds a B.S. in Biomedical and Electrical Engineering and an M.B.A. from the University of Connecticut, and an M.S. in Biomedical and Electrical Engineering from Carnegie-Mellon University. Our board of directors believes that Mr. Ragusa brings extensive experience in important ecosystem partners and managing operations of large public companies, and this, in addition to his education in biotechnology, finance and management, qualifies him to serve as one of our directors.
Executive Officers
Our executive officers, as of December 12, 2019, their positions and their respective ages are as set forth below:
| Name |
Age | Position | ||||
| Emily M. Leproust, Ph.D. |
46 | President, Chief Executive Officer and Director | ||||
| William Banyai, Ph.D. |
65 | Chief Operating Officer and Director | ||||
| James M. Thorburn |
64 | Chief Financial Officer | ||||
| Mark Daniels |
57 | Senior Vice President, Chief Legal Officer, Chief Ethics and Compliance Officer and Secretary | ||||
| Paula Green |
52 | Vice President of Human Resources | ||||
| Patrick Finn, Ph.D. |
48 | Senior Vice President of Commercial Operations | ||||
| Bill Peck, Ph.D. |
59 | Chief Technology Officer | ||||
| Martin Kunz |
49 | Senior Vice President of Operations | ||||
Mark Daniels has served as our General Counsel since August 2016, as our Chief Ethics and Compliance Officer since May 1, 2017, as our Secretary since September 2018 and as our Senior Vice President and Chief Legal Officer since November 2018. Prior to joining us, from January 2013 to May 2016, Mr. Daniels was at Broadcom Corporation, a semiconductor manufacturer and producer of wireless and broadband products, where his most recent position was Vice President, Law and Deputy Chief Corporate Compliance Officer. Before that,
109
Table of Contents
he spent 20 years in positions of increasing responsibility in the legal department at Amgen, Inc., a producer of biopharmaceuticals, where his last role was Vice President and Associate General Counsel. Mr. Daniels received his B.S. with honors in Industrial and Labor Relations from Cornell University and a J.D., cum laude, from Harvard Law School.
Patrick Finn, Ph.D. has served as our Vice President of Sales and Marketing since February 2015 and as our Senior Vice President of Commercial Operations since December 2018. Prior to joining us, Dr. Finn was Vice President of Sales at Enzymatics Inc., a developer, manufacturer, and marketer of enzymes for molecular biology applications, sold predominantly to manufacturers in research and diagnostic markets from January 2012 to March 2015. Dr. Finn holds a B.Sc. in Chemistry from Heriot-Watt University and a Ph.D. in Chemistry from the University of Southampton.
Paula Green has served as our Vice President of Human Resources since March 2016. Prior to joining us, Ms. Green was Vice President of Human Resources at Qiagen, N.V., a provider of sample and assay technologies for molecular diagnostics, applied testing, academic and pharmaceutical research from March 2001 to September 2015. Ms. Green holds a B.S. Organizational Behavior from the University of San Francisco.
Martin Kunz has served as our Senior Vice President of Operations since February 2019. Previously, he served as President of Eurofins Genomics US from June 2010 to January 2019. Prior to serving as President, he served as Chief Technology Officer from September 2008 to June 2010 where his focus was building IT off-shore capacity and designing a new IT systems landscape for genomics services. Preceding his time at Eurofins, he served as Chief Information Officer of Operon Biotechnologies, Inc. from September 2005 to September 2008 where he built a global information technology team and developed and deployed a CRM, an e-commerce and a business intelligence system. Prior to joining the biotech industry, he held a variety of positions at various companies throughout Switzerland, including sales, QA and business analyst. Mr. Kunz received his B.S. in Engineering from the H.F. Technology and Management School (TGZ) in Zurich, Switzerland.
Bill Peck, Ph.D. has been our Chief Technology Officer since February 2013. Prior to co-founding Twist Bioscience, Dr. Peck was the Director of Fluidic Systems at Complete Genomics Inc. from April 2008 to February 2013. Dr. Peck holds a B.Sc., M.Sc., and Ph.D. in Mechanical Engineering from the University of Alberta.
James M. Thorburn has served as our Chief Financial Officer since April 2018. Prior to joining us, Mr. Thorburn served as a member of the board of directors of IXYS Corporation, a publicly traded semiconductor company from March 2007 to January 2018. Mr. Thorburn was also Chief Sales Officer and Co-Head of International at Televerde, a demand generation and sales acceleration enterprise, from August 2014 to February 2018. Prior to Televerde, he served as interim CFO of several public and private companies including Enercore, Next Autoworks, Fisker Automotive and Numonyx. Mr. Thorburn served as Chief Executive Officer of Zilog from March 2001 until August 2006. Prior to serving as Chief Executive Officer of Zilog, Mr. Thorburn held various executive positions including Chief Operating Officer of ON Semiconductor, operating consultant with Texas Pacific Group, Chief Financial Officer at Zilog and various management positions at National Semiconductor Corporation. Mr. Thorburn holds a B.Sc. (Hons.) degree from University of Glasgow and passed the Chartered Institute of Management Accountant exams in the United Kingdom.
There are no immediate family relationships between or among any of our executive officers or directors.
Section 16(a) Beneficial Ownership Reporting Compliance
Section 16(a) of the Exchange Act requires our directors, executive officers and persons who beneficially own more than 10 percent of our common stock to file with the SEC reports of ownership regarding the common stock and other Twist equity securities. These persons are required by the SEC regulations to furnish us with copies of all Section 16(a) reports they file. Based solely on our review of the copies of such forms furnished to
110
Table of Contents
us and written representations from the directors and executive officers, we believe that all Section 16(a) filing requirements were timely met in fiscal year 2019, other than one Form 4 covering three transactions and one Form 4 covering one transaction, both filed late for Nelson Chan, and Forms 4 filed for Robert Chess, Jan Johannessen, Keith Crandell, Frederick Craves Ph.D., and Robert Ragusa, all related to yearly option grants pursuant to our director compensation policy, which were filed late.
Code of Conduct
We have adopted the Twist Bioscience Corporation Code of Business Conduct and Ethics, or Code of Ethics, with which every person, including executive officers, who works for Twist and every member of our board of directors is expected to comply. The full text of our Code of Ethics is posted on the investor relations section of our website at www.twistbioscience.com. If any substantive amendments are made to the Code of Ethics or any waiver is granted, we intend to satisfy the disclosure requirement under Item 5.05 of Form 8-K regarding such amendment to, or waiver from, a provision of this Code of Ethics by posting such information on our website, at the address and location specified above, or as otherwise required by the Nasdaq Select Global Market.
Board Composition
Our board of directors is currently comprised of ten members. Our amended and restated bylaws permit our board of directors to establish by resolution the authorized number of directors, and ten directors are currently authorized, eight of whom qualify as “independent” under the listing standards of the Nasdaq Stock Market. Our board of directors has designated Dr. Leproust to serve as Chair of our board of directors and Mr. Chess to serve as our lead independent director.
Our board of directors is divided into three classes, with staggered three-year terms. Only one class of directors will be elected at each annual meeting of our stockholders, with the other classes of directors continuing for the remainder of their respective three-year terms. Upon the expiration of the term of a class of directors, a director in that class will be eligible to be elected for a new three-year term at the annual meeting of stockholders in the year in which their term expires.
Our directors are divided among the three classes as follows:
| • | the Class II directors are Messrs. Barthelemy, Crandell and Johannessen and Dr. Craves, and their terms will expire at the annual meeting of stockholders to be held in 2020; |
| • | the Class III directors are Drs. Leproust and Banyai and Mr. Chess, and their terms will expire at the annual meeting of stockholders to be held in 2021; and |
| • | the Class I directors are Messrs. Chan and Ragusa and Ms. Mai, and their terms will expire at the annual meeting of stockholders to be held in 2022. |
Board and Committee Meetings
Our board held eight (8) meetings during the fiscal year ended September 30, 2019. All directors except Mr. Crandell attended at least 75% of the meetings of the board and the committees on which he or she served.
Committees of the Board
Our board has an audit committee, a compensation committee and a nominating and corporate governance committee, each of which has the composition and responsibilities described below.
Audit Committee
Our audit committee is comprised of Messrs. Barthelemy, Ragusa and Johannessen, Dr. Craves and Ms. Mai, each of whom is a non-employee member of our board of directors, with Mr. Johannessen serving as audit
111
Table of Contents
committee chairperson. Our board of directors has determined that each of the members of our audit committee satisfies the requirements for independence and financial literacy under the current listing standards of the Nasdaq Stock Market and SEC rules and regulations, including Rule 10A-3. Our board of directors has also determined that Mr. Johannessen is an audit committee financial expert within the meaning of Item 407(d) of Regulation S-K of the Securities Act. This designation is a disclosure requirement of the SEC and does not impose upon Mr. Johannessen any duties, obligations, or liabilities greater than that which would otherwise be imposed by virtue of his membership on the board or the audit committee. In addition, this designation does not affect the duties, obligations, or liabilities of any other director or audit committee member.
Our audit committee is responsible for, among other things:
| • | selecting a qualified firm to serve as independent registered public accounting firm to audit our financial statements; |
| • | helping to ensure the independence and performance of the independent registered public accounting firm; |
| • | discussing the scope and results of the audit with the independent registered public accounting firm, and reviewing, with management and the independent accountants, our interim and year-end operating results; |
| • | developing procedures for employees to submit concerns anonymously about questionable accounting or audit matters; |
| • | reviewing related party transactions; |
| • | reviewing our policies on risk assessment and risk management; |
| • | approving all audit and all permissible non-audit services, to be performed by the independent registered public accounting firm; and |
| • | reviewing the audit committee report required by SEC rules to be included in our annual proxy statement. |
Our audit committee operates under a written charter, which satisfies the applicable rules of the SEC and the listing standards of the Nasdaq Stock Market, and which is available on the investor relations section of our website at www.twistbioscience.com. All audit services to be provided to us and all permissible non-audit services, other than de minimis non-audit services, to be provided to us by our independent registered public accounting firm will be approved in advance by our audit committee. Our audit committee held four (4) meetings in the fiscal year ended September 30, 2019.
Compensation Committee
Our compensation committee is comprised of Messrs. Barthelemy, Chess, Crandell and Ragusa and Dr. Craves, each of whom is a non-employee member of our board of directors, with Mr. Crandell serving as compensation committee chairperson. Our board of directors has determined that each member of the compensation committee is a non-employee director, as defined pursuant to Rule 16b-3 promulgated under the Exchange Act, and each member meets the requirements for independence under the listing standards of the Nasdaq Stock Market and SEC rules and regulations. Our compensation committee is responsible for, among other things:
| • | reviewing and approving the compensation of our chief executive officer and other executive officers; |
| • | reviewing the compensation paid to our directors and making recommendations to our board of directors; |
| • | reviewing, adopting, amending, and administering our equity incentive plans and granting awards to eligible persons and determining the terms of such awards; |
112
Table of Contents
| • | reviewing, approving, amending, and terminating any change in control, severance or termination agreement, plan or arrangement for our executive officers; |
| • | reviewing in conjunction with the nominating and corporate governance committee, succession planning for our chief executive officer and other executive officers and evaluating potential successors; and |
| • | assessing whether our compensation policies and practices create risks that are reasonably likely to have a material adverse effect on us. |
Our compensation committee operates under a written charter, which satisfies the applicable rules of the SEC and the listing standards of the Nasdaq Stock Market, and which is available on the investor relations section of our website at www.twistbioscience.com. Our compensation committee held six (6) meetings in the fiscal year ended September 30, 2019.
Nominating and Corporate Governance Committee
Our nominating and corporate governance committee consists of Messrs. Chan, Chess, Crandell and Johannessen, each of whom is a non-employee member of our board of directors, with Mr. Chess serving as the nominating and corporate governance committee chairperson. Our board of directors has determined that each member of our nominating and corporate governance committee meets the requirements for independence under the listing standards of the Nasdaq Stock Market and SEC rules and regulations.
Our nominating and corporate governance committee is responsible for, among other things:
| • | identifying, evaluating and making recommendations to our board of directors regarding, nominees for election to our board of directors, and individuals to fill any vacancies on our board of directors, between meetings of our stockholders at which directors are to be elected; |
| • | identifying, evaluating and making recommendations to our board of directors regarding the chairmanship and membership of each of its committees; |
| • | considering and making recommendations to our board of directors regarding the composition of our board of directors and its committees; |
| • | assessing the effectiveness of any diversity policy our board of directors may determine to implement; |
| • | reviewing in conjunction with the compensation committee, succession planning for our chief executive officer and other executive officers and evaluating potential successors; and |
| • | reviewing and assessing the adequacy of our corporate governance guidelines and recommending any proposed changes to our board of directors. |
Our nominating and corporate governance committee operates under a written charter, which satisfies the applicable listing requirements and rules of the Nasdaq Stock Market, and which is available on the investor relations section of our website at www.twistbioscience.com. Our nominating and corporate governance committee held four (4) meetings in the fiscal year ended September 30, 2019.
Our nominating and corporate governance committee is responsible for reviewing with the board of directors, on an annual basis, the appropriate characteristics, skills and experience required for the board of directors as a whole and its individual members. In evaluating the suitability of individual candidates (both new candidates and current members), the nominating and corporate governance committee, in recommending candidates for election, and the board of directors, in approving (and, in the case of vacancies, appointing) such candidates, may take into account many factors, including, but not limited to, diversity of personal and professional background, perspective and experience; personal and professional integrity, ethics and values; experience in corporate management, operations or finance; experience relevant to our industry and with relevant social policy concerns;
113
Table of Contents
experience as a board member or executive officer of another publicly held company; relevant academic expertise or other proficiency in an area of our operations; practical and mature business judgment; and any other relevant qualifications, attributes or skills.
Currently, our board of directors evaluates, each individual in the context of the board of directors as a whole, with the objective of assembling a group that can best maximize the success of the business and represent stockholder interests through the exercise of sound judgment using its diversity of experience in these various areas.
Our board of directors may from time to time establish other committees.
| Item 11. | Executive compensation |
Our named executive officers for fiscal 2019, which consist of our principal executive officer and the next two most highly compensated executive officers, are:
| • | Emily M. Leproust, our President and Chief Executive Officer; |
| • | James M. Thorburn, our Chief Financial Officer; and |
| • | Patrick Finn, Senior Vice President of Commercial Operations. |
Processes and Procedures for Compensation Decisions
Our compensation committee is responsible for the executive compensation programs for our executive officers and reports to the board of directors on its discussions, decisions and other actions. Historically, our Chief Executive Officer makes recommendations to our compensation committee, often attends compensation committee meetings and is involved in the determination of compensation for the respective executive officers that report to her, except that our Chief Executive Officer does not make recommendations as to her own compensation, nor does she attend the portions of compensation committee meetings at which her own compensation is discussed and determined. Our Chief Executive Officer makes recommendations to our compensation committee regarding short- and long-term compensation for all executive officers (other than herself) based on our results, an individual executive officer’s contribution toward these results and performance toward individual goal achievement. Our compensation committee then reviews these recommendations and other data and makes decisions as to each item of total compensation, and the total compensation, for the Chief Executive Officer and each other executive officer, as well as each individual compensation component. Our compensation committee is authorized to select, engage, compensate and terminate compensation consultants, legal counsel and such other advisors, as it sees fit, to assist in carrying out their responsibilities and functions, including the oversight of our overall compensation philosophy, compensation plans and benefits programs and our executive compensation programs and related policies. In the fiscal year ended September 30, 2019, our compensation committee retained the services of Compensia, Inc., an independent compensation consulting firm, to provide advice and recommendations on competitive market practices and specific compensation decisions for our executive officers and non-employee directors. Compensia provided no other services to the Company in the fiscal year ended September 30, 2019.
114
Table of Contents
Summary Compensation Table
The following table sets forth certain information regarding the compensation of our named executive officers for the fiscal years ended September 30, 2018 and 2019:
| Name and principal position |
Year | Salary ($)(1) |
RSU Awards ($)(2) |
Option awards ($)(3) |
Non-equity incentive plan compensation ($)(4) |
Total ($) |
||||||||||||||||||
| Emily M. Leproust, Ph.D. |
2019 | 477,042 | 3,045,398 | 4,144,965 | 458,752 | 8,126,157 | ||||||||||||||||||
| President and Chief Executive Officer |
2018 | 362,250 | — | — | 162,424 | 524,674 | ||||||||||||||||||
| James M. Thorburn, |
2019 | 384,167 | 1,039,793 | 1,415,209 | 213,035 | 3,052,204 | ||||||||||||||||||
| Chief Financial Officer |
2018 | 134,015 | — | 1,286,756 | 70,341 | 1,491,112 | ||||||||||||||||||
| Patrick Finn, |
2019 | 352,917 | 1,039,793 | 1,415,209 | 205,764 | 3,013,683 | ||||||||||||||||||
| Senior Vice President of Commercial Operations(5) |
||||||||||||||||||||||||
| (1) | The amounts reported in this column represent salary earned by each of our named executive officers in the fiscal years ended September 30, 2018 and 2019. |
| (2) | The amounts reported in this column reflect the aggregate grant date fair value for financial statement reporting purposes of restricted stock units granted in the fiscal years ended September 30, 2018 and 2019 as determined in accordance with FASB ASC Topic 718. These amounts reflect our accounting expense for these restricted stock units and do not represent the actual economic value that may be realized by each named executive officer. There can be no assurance that these amounts will ever be realized. For information on the assumptions used in valuing these awards, refer to Note 13 to the consolidated financial statements included elsewhere in this Form 10-K. |
| (3) | The amounts reported in this column reflect the aggregate grant date fair value for financial statement reporting purposes of stock options granted in the fiscal years ended September 30, 2018 and 2019 as determined in accordance with FASB ASC Topic 718. These amounts reflect our accounting expense for these stock options and do not represent the actual economic value that may be realized by each named executive officer. There can be no assurance that these amounts will ever be realized. For information on the assumptions used in valuing these awards, refer to Note 13 to the consolidated financial statements included elsewhere in this Form 10-K. |
| (4) | Represents annual bonuses earned by each named executive officer under our annual cash incentive plan for executive officers for the fiscal years ended September 30, 2018 and 2019. |
| (5) | Fiscal year 2019 is Dr. Finn’s first year as a named executive officer. |
115
Table of Contents
Outstanding equity awards as of September 30, 2019
The following table provides information regarding the outstanding equity awards held by each of our named executive officers as of September 30, 2019:
| Option awards(1) | Stock awards(1) | |||||||||||||||||||||||||||
| Name |
Grant date | Number of securities underlying unexercised options (#) exercisable(2) |
Number of securities underlying unexercised options (#) unexercisable(3) |
Option exercise price or per share purchase price ($)(4) |
Option expiration date |
Number of shares or units of stock that have not vested (#)(5) |
Market value of shares or units of stock that have not vested ($)(6) |
|||||||||||||||||||||
| Emily M. Leproust, Ph.D. |
9/29/2015 | (7) | 100,999 | — | 5.95 | 9/28/2025 | — | — | ||||||||||||||||||||
| 9/29/2017 | (8) | 115,396 | 115,398 | 8.82 | 9/28/2027 | — | — | |||||||||||||||||||||
| 11/19/2018 | (9) | — | 266,539 | 26.66 | 11/18/2028 | — | — | |||||||||||||||||||||
| 11/19/2018 | (10) | — | — | — | — | 114,231 | 2,727,836 | |||||||||||||||||||||
| James M. Thorburn |
6/7/2018 | (11) | 48,911 | 117,838 | 11.59 | 6/6/2028 | — | — | ||||||||||||||||||||
| 11/19/2018 | (12) | — | 91,004 | 26.66 | 11/18/2028 | — | — | |||||||||||||||||||||
| 11/19/2018 | (13) | — | — | — | — | 39,002 | 931,368 | |||||||||||||||||||||
| Patrick Finn |
2/4/2015 | (14) | 60,398 | — | 1.19 | 2/3/2025 | — | — | ||||||||||||||||||||
| 9/29/2015 | (15) | 44,628 | — | 5.95 | 9/28/2025 | — | — | |||||||||||||||||||||
| 9/29/2017 | (16) | 30,214 | 30,214 | 8.82 | 9/28/2027 | — | — | |||||||||||||||||||||
| 11/19/2018 | (17) | — | 91,004 | 26.66 | 11/18/2028 | — | — | |||||||||||||||||||||
| 11/19/2018 | (18) | — | — | — | — | 39,002 | 931,368 | |||||||||||||||||||||
| (1) | Prior to our IPO, all awards were granted under our 2013 Plan. Following our IPO, all awards were granted under our 2018 Plan. |
| (2) | The stock options granted to our named executive officers under the 2013 Plan are early exercisable but those granted under the 2018 Plan are not early exercisable. Because all stock options granted to our named executive officers under the 2013 Plan are early exercisable, and early exercised shares are subject to a repurchase right in favor of the Company which lapses as the option vests, this column reflects the number of options (under either the 2013 Plan or the 2018 Plan) held by our named executive officers that were exercisable and vested as of September 30, 2019. |
| (3) | The stock options granted to our named executive officers under the 2013 Plan are early exercisable but those granted under the 2018 Plan are not early exercisable. Because all stock options granted to our named executive officers under the 2013 Plan are early exercisable, and early exercised shares are subject to a repurchase right in favor of the Company which lapses as the option vests, this column reflects the number of options (under either the 2013 Plan or the 2018 Plan) held by our named executive officers that were exercisable and unvested as of September 30, 2019. |
| (4) | This column represents the fair market value of a share of our common stock on the date of grant, as determined by our board of directors. |
| (5) | The units in this column represent restricted stock units granted pursuant to a restricted stock unit award agreement that remained unvested as of September 30, 2019. |
| (6) | Each restricted stock unit represents the right to receive a share of our common stock. The market value of our common stock is based on the per share price of $23.88, which was the closing stock price of the Company’s common stock on September 30, 2019. |
| (7) | The option grant is subject to a 4-year vesting schedule, with 25% of the shares vesting on September 1, 2016 and 1/48th of the shares vesting monthly thereafter, subject to continuous service through each applicable vesting date. The option grant is also subject to a 50% single trigger acceleration provision and a 100% double trigger acceleration provision (in each case, as described below). |
| (8) | The option grant is subject to a 4-year vesting schedule, with 10% of the shares vesting on September 29, 2017, 15% of the shares vesting on September 28, 2018 and 1/48th of the shares vesting monthly thereafter, subject to continuous service through each applicable vesting date. |
116
Table of Contents
| (9) | The option grant is subject a 5-year vesting schedule, with 20% of the shares vesting on October 31, 2019 and 1/60th of the shares vesting monthly thereafter, subject to continuous service through each applicable vesting date. |
| (10) | The restricted stock unit grant is subject a 5-year vesting schedule, with 20% of the units vesting on November 20, 2019 and 1/20th of the units vesting quarterly thereafter, subject to continuous service through each applicable vesting date. |
| (11) | The option grant is subject to a 4-year vesting schedule, with 25% of the shares vesting on April 23, 2016 and 1/48th of the shares vesting monthly thereafter, subject to continuous service through each applicable vesting date. |
| (12) | The option grant is subject a 5-year vesting schedule, with 20% of the shares vesting on October 31, 2019 and 1/60th of the shares vesting monthly thereafter, subject to continuous service through each applicable vesting date. |
| (13) | The restricted stock unit grant is subject a 5-year vesting schedule, with 20% of the units vesting on November 20, 2019 and 1/20th of the units vesting quarterly thereafter, subject to continuous service through each applicable vesting date. |
| (14) | The option grant is subject to a 4-year vesting schedule, with 25% of the shares vesting on February 2, 2016 and 1/48th of the shares vesting monthly thereafter, subject to continuous service through each applicable vesting date. |
| (15) | The option grant is subject to a 4-year vesting schedule, with 25% of the shares vesting on March 21, 2017 and 1/48th of the shares vesting monthly thereafter, subject to continuous service through each applicable vesting date. |
| (16) | The option grant is subject to a 4-year vesting schedule, with 10% of the shares vesting on September 29, 2017, 15% of the shares vesting on September 28, 2018 and 1/48th of the shares vesting monthly thereafter, subject to continuous service through each applicable vesting date. |
| (17) | The option grant is subject a 5-year vesting schedule, with 20% of the shares vesting on October 31, 2019 and 1/60th of the shares vesting monthly thereafter, subject to continuous service through each applicable vesting date. |
| (18) | The restricted stock unit grant is subject a 5-year vesting schedule, with 20% of the units vesting on November 20, 2019 and 1/20th of the units vesting quarterly thereafter, subject to continuous service through each applicable vesting date. |
Annual Bonus
We have an annual objective-setting and review process for our named executive officers that is the basis for the determination of potential annual bonuses. Our board of directors reviews and approves both the annual objectives and the payment of annual bonuses for our executives. Each of our named executive officers is eligible for annual performance-based bonuses of up to a specific percentage of their salary, subject to approval by our board of directors or the compensation committee. The performance-based bonus is tied to a set of specified goals and strategic objectives for our named executive officers and we conduct an annual performance review to determine the attainment of such goals and objectives. Our management may propose bonus awards to our board of directors primarily based on such review process. Our board of directors or the compensation committee makes the final determination of the achievement of both the specified corporate and strategic objectives and the eligibility requirements for and the amount of such bonus awards. For the fiscal years ended September 30, 2018 and 2019, bonuses were paid out based on the satisfaction of certain revenue goals and strategic objectives.
Equity-Based Incentive Awards
Our equity-based incentive awards are designed to align our interests and the interests of our stockholders with those of our employees and consultants, including our named executive officers. Our board of directors or the compensation committee is responsible for approving equity grants to employees and consultants.
117
Table of Contents
Prior to our IPO, we granted all equity incentive awards pursuant to our 2013 Plan. Following our IPO, we have and will continue to grant equity incentive awards under the terms of our 2018 Plan. The terms of our equity plans are described below under “Equity incentive plans.”
All stock options are granted with an exercise price per share that is no less than the fair market value of our common stock on the date of grant of each award. Our stock option awards generally vest over a four-year period and may be subject to acceleration of vesting and exercisability under certain termination and corporate transaction events.
In fiscal year 2019, the compensation committee granted stock options and restricted stock units to our named executive officers under the 2018 Plan to further incentivize and retain the executives. The details of those equity grants are described above under “Outstanding equity awards as of September 30, 2019.”
Employment Agreements
In connection with our IPO, we entered into an amended and restated employment agreement with each of the named executive officers, effective as of the effective time of the registration statement. These agreements provide for at-will employment and establish the named executive officer’s base salary, eligibility to participate in an incentive bonus plan and standard employee benefits.
These amended and restated employment agreements also, for the three (3) years following the effective date of the amended and restated employment agreements, provide for certain severance payments and benefits in connection with each named executive officer’s termination of employment under various circumstances, including in connection with a change in control of the Company. The material terms and conditions of these provisions are summarized below in “—Potential payments upon termination or change in control.” Following the date that is three (3) years from the effective date of the amended and restated employment agreements, our board of directors or compensation committee, each in its sole discretion, shall determine whether to offer the named executive officers severance pay and benefits according to terms and conditions to be determined at such time, which shall be the same generally available to similarly situated employees of the Company.
Potential Payments upon Termination or Change in Control
Involuntary Termination of Employment not in Connection with Change in Control
In the event that we terminate a named executive officer’s employment for any reason other than “cause,” death, or “disability,” or if the named executive officer resigns for “good reason,” in each case, other than in connection with or during the 12-month period following, a “change in control,” such named executive officer will be eligible to receive the following severance benefits, subject to, among other things, executing a general release of claims in favor of the Company and complying with the terms of his or her confidentiality agreement:
| • | a cash payment equal to 12 months of her then-current base salary in the case of Dr. Leproust and 6 months of their then-current base salary in the case of Mr. Thorburn and Dr. Finn, payable in installments over such period according to our regular payroll schedule; and |
| • | a pro-rata incentive bonus for the year of termination (days worked relative to 365 days) based on actual performance and paid when bonuses are normally paid. |
| • | COBRA premiums for a period of 12 months in the case of Dr. Leproust and 6 months in the case of Mr. Thorburn and Dr. Finn. |
Involuntary termination of employment in connection with change in control
In the event that we terminate a named executive officer’s employment for any reason other than “cause,” death, or “disability,” or if the named executive officer resigns for “good reason,” in each case, in connection with or
118
Table of Contents
during the 12-month period following a “change in control,” such named executive officer will be eligible to receive the following severance benefits, subject to, among other things, executing a general release of claims in favor of the Company and complying with the terms of his or her confidentiality agreement:
| • | a cash payment equal to 24 months of her then-current base salary in the case of Dr. Leproust and 12 months of their then-current base salary in the case of Mr. Thorburn and Dr. Finn, payable in installments over such period according to our regular payroll schedule; |
| • | a cash payment equal to two times her average bonus for the two years prior to the termination in the case of Dr. Leproust and one times in the case of Mr. Thorburn and Dr. Finn, which will be paid pro-rata in equal installments with the cash severance; |
| • | COBRA premiums for a period of 24 months in the case of Dr. Leproust and 12 months in the case of Mr. Thorburn and Dr. Finn; and |
| • | 100% immediate vesting acceleration of all of the shares of our common stock underlying any then-outstanding unvested stock options and other unvested equity awards. |
Each named executive officer’s employment agreement contains a “better after-tax” provision, which provides that if any of the payments to an executive constitutes a parachute payment under Section 280G of the Code, the payments will either be (i) reduced or (ii) provided in full to the executive, whichever results in the named executive officer receiving the greater amount after taking into consideration the excise tax under Section 4999 of the Code and any interest or penalties associated with such excise tax.
As defined in each named executive officer’s employment agreement, “change in control” shall mean: (i) the consummation of a merger or consolidation of the Company or any other corporate reorganization or business combination transaction of the Company with or into another corporation, entity or person; (ii) the sale, transfer or other disposition of all or substantially all of the Company’s assets; or (iii) any transaction as a result of which any person is the “beneficial owner” (as defined in Rule 13d-3 under the Securities Exchange Act of 1934 (the “Exchange Act”)), directly or indirectly, of securities of the Company representing at least fifty percent (50%) of the total voting power represented by the Company’s then outstanding voting securities. For purposes of this definition, the term “person” shall have the same meaning as when used in sections 13(d) and 14(d) of the Exchange Act but shall exclude (i) a trustee or other fiduciary holding securities under an employee benefit plan of the Company or of a parent or subsidiary and (ii) a corporation owned directly or indirectly by the stockholders of the Company in substantially the same proportions as their ownership of the common stock of the Company. A transaction shall not constitute a Change in Control if its sole purpose is to change the state of the Company’s incorporation or to create a holding company that shall be owned in substantially the same proportions by the persons who held the Company’s securities immediately before such transaction.
As defined in each named executive officer’s employment agreement, “cause” means the named executive officer’s (i) material breach of the employment agreement, confidentiality agreement, or any other written agreement with the Company, which breach to the extent deemed curable by the board of directors is not cured within 10 business days after written notice thereof from the Company; (ii) material failure to comply with the Company’s written policies or rules, which breach to the extent deemed curable by the board of directors is not cured within ten (10) business days after written notice thereof from the Company; (iii) repeated failure to follow reasonable and lawful instructions from the board of directors, which failure is not cured within 10 business days after written notice thereof from the Company; (iv) commission, conviction of, or a plea of “guilty” or “no contest” to, a felony under the laws of the United States or any state if such felony is work-related, impairs his or her ability to perform services for the Company in accordance with the employment agreement, or results in a loss to the Company or damage to the reputation of the Company; (v) misappropriation of funds or property of the Company; (vi) gross neglect of his or her duties; (vii) act or omission that results directly or indirectly in material financial accounting improprieties for the Company; (viii) failure to cooperate with a government investigation; or (ix) gross or willful misconduct resulting in a loss to the Company or damage to the reputation of the Company.
119
Table of Contents
As defined in each named executive officer’s employment agreement, “good reason” means a resignation by the named executive officer within 90 days after one of the following conditions has come into existence without his or her written consent: (i) a material diminution in executive’s authority, duties or responsibilities; (ii) a material reduction of executive’s annual base salary; provided, however, that prior to a change in control, it shall not be “good reason” if there is a corresponding reduction in the base salaries of all other executive officers of the Company; or (iii) a material change in the geographic location at which the executive must perform services (a change in location of executive’s office will be considered material only if it increases the executive’s current one-way commute by more than fifty miles). A condition shall not be considered “good reason” unless executive gives the Company written notice of the condition within 30 days after the condition comes into existence and the Company fails to remedy the condition within 30 days after receiving executive’s written notice.
As defined in each named executive officer’s employment agreement, “disability” means that the named executive officer is unable to perform the essential functions of his or her position, with or without reasonable accommodation, for a period of at least 120 consecutive days because of a physical or mental impairment.
Director Compensation
The following table sets forth certain information regarding the compensation of our non-employee directors for the fiscal year ended September 30, 2019:
| Name |
Option awards ($)(1)(2) |
Total ($) |
||||||
| Nelson C. Chan |
217,767 | (3) | 217,767 | |||||
| Robert Chess |
89,747 | (4) | 89,747 | |||||
| Paul A. Conley |
— | — | ||||||
| Keith Crandell |
89,747 | (4) | 89,747 | |||||
| Frederick Craves |
89,747 | (4) | 89,747 | |||||
| Jan Johannessen |
429,744 | (5) | 429,744 | |||||
| Xiaoying Mai |
— | — | ||||||
| Robert Ragusa |
89,747 | (4) | 89,747 | |||||
| (1) | The amount reported in this column represents the aggregate grant date fair value for financial statement reporting purposes of stock options granted in fiscal 2019 under our 2013 Plan, if granted prior to our initial public offering, or our 2018 Plan if granted after our initial public offering, as determined in accordance with FASB ASC Topic 718. This amount reflects our accounting expense for these stock options and does not represent the actual economic value that may be realized by each non-employee director. There can be no assurance that this amount will ever be realized. For information on the assumptions used in valuing this award, refer to Note 14 to the consolidated financial statements included elsewhere in this Form 10-K. |
| (2) | The number of shares underlying outstanding stock options held by each non-employee director as of September 30, 2019, was as follows: Mr. Chan (16,537); Mr. Chess (5,590); Dr. Conley (0); Mr. Crandell (5,590); Dr. Craves (5,590); Ms. Mai (0) and Mr. Ragusa (5,590). |
| (3) | This represents the grant date aggregate fair value of (i) an option to purchase 13,444 shares of common stock granted on May 20, 2019 with an exercise price of $25.29 per share, which is subject to a 3-year vesting schedule with 1/3 of the shares vesting on May 20, 2020 and on each annual anniversary thereafter, and (ii) an option to purchase 3,093 shares of common stock granted on June 21, 2019 with an exercise price of $30.08 per share, which was fully vested upon grant. Both options have a term of ten years. |
| (4) | This represents the grant date fair value of an option to purchase 5,590 shares of common stock granted on July 23, 2019 with an exercise price of $30.41 per share. The option grant will vest in full on the earlier of (i) the one-year anniversary of the date of grant and (ii) the date of our first annual meeting of stockholders following the date of grant. The option has a term of ten years. |
| (5) | This represents the grant date aggregate fair value of (i) an option to purchase 42,304 shares of common stock granted on October 30, 2018 with an exercise price of $14.00 per share, which is subject to a 3-year |
120
Table of Contents
| vesting schedule with 1/3 of the shares vesting on October 30, 2019 and on each annual anniversary thereafter, and (ii) an option to purchase 5,590 shares of common stock granted on July 23, 2019 with an exercise price of $30.41 per share, which will vest in full on the earlier of (i) the one-year anniversary of the date of grant and (ii) the date of our first annual meeting of stockholders following the date of grant. Both options have a term of ten years. |
Our non-employee director compensation policy is designed to provide the appropriate amount and form of compensation to our non-employee directors. Under this policy, we will pay our non-employee directors a cash retainer for service on the board of directors and an additional cash retainer for service on each committee on which the director is a member, which will be paid quarterly in arrears. The chairman of each committee will receive higher retainers for such service. The fees paid to non-employee directors for service on the board of directors and for service on each committee of the board of directors on which the director is a member are as follows:
| Member Annual Retainer |
Chairman or Lead Director Annual Retainer |
|||||||
| Board of Directors |
$ | 40,000 | $ | 60,000 | ||||
| Audit Committee |
7,000 | 16,000 | ||||||
| Compensation Committee |
5,000 | 13,000 | ||||||
| Nominating and Corporate Governance Committee |
5,000 | 10,000 | ||||||
In addition, each non-employee director elected to our board of directors will, upon the date of his or her initial election or appointment to be a non-employee director, be granted an option to purchase a number of shares of common stock having a grant date fair value of $340,000. One-third of the shares subject to such initial option grant will vest on each anniversary of the date of grant, subject to the director providing service through each vesting date. Further, at the close of business on the date of each annual stockholder meeting following the initial public offering, each person who is currently and has been a non-employee director for at least three (3) months will be granted an option to purchase a number of shares of common stock having a grant date fair value of $170,000. 100% of the shares subject to such annual option grant will vest in full on the earlier of the one-year anniversary of the grant date and the next annual stockholder meeting, subject to the director providing service through the vesting date. All stock option awards to non-employee directors are made pursuant to the 2018 Plan. Notwithstanding the foregoing vesting schedules, if such director remains a service provider until immediately prior to the closing of a “change in control” (as defined in the applicable equity plan), the shares subject to his or her then-outstanding stock option that was granted pursuant to the non-employee director compensation policy will become fully vested immediately prior to the closing of the change in control.
We will also continue to reimburse our non-employee directors for reasonable travel and out-of-pocket expenses incurred in connection with attending our board of director and committee meetings.
The non-employee director compensation program is intended to provide a total compensation package that enables us to attract and retain qualified and experienced individuals to serve as directors and to align our directors’ interests with those of our stockholders.
Compensation Committee Interlocks and Insider Participation
During fiscal 2019, our compensation committee consisted of Messrs. Chess and Crandell and Dr. Craves. None of the members of our compensation committee has at any time been one of our officers or employees. None of our executive officers currently serves, or during fiscal 2019 has served, as a member of our board of directors or the compensation committee (or other board committee performing equivalent functions) of any entity that has
121
Table of Contents
one or more of its executive officers who served on our board of directors or our compensation committee during fiscal 2019. Certain members of our compensation committee are affiliated with entities that purchased our preferred stock. Please see “Security Ownership of Certain Beneficial Owners and Management” for more information.
| Item 12. | Security ownership of certain beneficial owners and management and related stockholder matters |
The following table sets forth information regarding beneficial ownership of our common stock as of December 9, 2019 by:
| (1) | each person or group of affiliated persons known by us to be the beneficial owner of more than 5% of our common stock; |
| (2) | each of our named executive officers; |
| (3) | each of our directors; and |
| (4) | all executive officers and directors as a group. |
We have determined beneficial ownership in accordance with the rules of the SEC and the information is not necessarily indicative of beneficial ownership for any other purpose. Unless otherwise indicated below, to our knowledge, the persons and entities named in the table have sole voting and sole investment power with respect to all shares that they beneficially own, subject to community property laws where applicable. To our knowledge, no person or entity except as set forth below, is the beneficial owner of more than 5% of the voting power of our common stock as of the close of business on December 9, 2019.
122
Table of Contents
Under SEC rules, the calculation of the number of shares of our common stock beneficially owned by a person and the percentage ownership of that person includes both outstanding shares of our common stock then owned as well as any shares of our common stock subject to options held by that person that are currently exercisable or exercisable within 60 days of December 9, 2019 and shares issuable upon the settlement of RSUs held by that person that will vest within 60 days of December 9, 2019. Shares subject to those options and RSUs for a particular person are not included as outstanding, however, for the purpose of computing the percentage ownership of any other person. We have based percentage ownership of our common stock on 33,118,096 shares of our common stock outstanding as of December 9, 2019. Unless otherwise indicated, the address of each beneficial owner listed in the table below is c/o Twist Bioscience Corporation, 681 Gateway Boulevard, South San Francisco, California 94080.
| Shares beneficially owned | ||||||||||||||||||||
| Name of beneficial owner |
Common stock |
Options exercisable within 60 days |
RSUs vesting within 60 days |
Aggregate number of shares beneficially owned |
% | |||||||||||||||
| 5% or more stockholders: |
||||||||||||||||||||
| Entities affiliated with ARCH Venture Partners(1) |
3,361,568 | — | — | 3,361,568 | 10.2 | % | ||||||||||||||
| Ever Alpha Fund L.P.(2) |
3,294,961 | — | — | 3,294,961 | 9.9 | % | ||||||||||||||
| Illumina, Inc.(3) |
1,773,530 | — | — | 1,773,530 | 5.4 | % | ||||||||||||||
| Entities affiliated with Tao Capital Partners(4) |
1,665,838 | — | — | 1,665,838 | 5.0 | % | ||||||||||||||
| Named executive officers and directors: |
||||||||||||||||||||
| Emily M. Leproust(5) |
726,275 | 398,427 | — | 1,124,702 | 3.4 | % | ||||||||||||||
| James M. Thorburn(6) |
6,495 | 199,500 | — | 205,995 | * | |||||||||||||||
| Patrick Finn(7) |
7,462 | 188,205 | — | 195,667 | * | |||||||||||||||
| William Banyai(8) |
625,561 | 276,259 | — | 901,820 | 2.7 | % | ||||||||||||||
| Nicolas Barthelemy |
— | — | — | — | * | |||||||||||||||
| Nelson C. Chan |
1,497 | 3,093 | — | 4,590 | * | |||||||||||||||
| Robert Chess(9), (10) |
69,822 | 35,521 | — | 105,343 | * | |||||||||||||||
| Keith Crandell(1), (10) |
3,361,568 | — | — | 3,361,568 | 10.2 | % | ||||||||||||||
| Frederick B. Craves(10) |
66,771 | — | — | 66,771 | * | |||||||||||||||
| Jan Johannessen(10) |
— | 14,101 | — | 14,101 | * | |||||||||||||||
| Xiaoying Mai(11) |
— | — | — | — | * | |||||||||||||||
| Robert Ragusa(3), (10) |
1,773,530 | — | — | 1,773,530 | 5.4 | % | ||||||||||||||
| All directors and executive officers as a group |
7,299,965 | 1,374,328 | — | 8,674,293 | 25.1 | % | ||||||||||||||
| * | Represents beneficial ownership of less than one percent of the outstanding shares of our common stock. |
| (1) | Based on a Schedule 13G filed by ARCH Venture Fund VII, L.P., or ARCH VII, on February 14, 2019. Consists of (i) 2,407,422 shares held of record by ARCH VII and (ii) 954,146 shares held of record by ARCH Venture Fund VIII Overage, L.P., or ARCH VIII Overage. ARCH Venture Partners VII, L.P., or the GPLP, is the sole general partner of ARCH VII and ARCH Venture Partners VII, LLC, or the GPLLC, is the sole general partner of the GPLP. ARCH Venture Partners VIII, LLC, or ARCH VIII Partners, is the sole general partner of ARCH VIII Overage. Keith Crandell, Clinton Bybee and Robert Nelsen are the managing directors of the GPLLC and ARCH VIII Partners, and therefore, may be deemed to share voting and dispositive power over the shares held of record by ARCH VII and ARCH VIII Overage. The address for each of the entities identified in this footnote is 8755 West Higgins Road, Suite 1025, Chicago, IL 60631. |
| (2) | Based on a Schedule 13G filed by Ever Alpha Fund L.P. on February 14, 2019. Consists of 3,294,961 shares held of record by Ever Alpha Fund L.P. Ever Glory Limited is the general partner of Ever Alpha Fund L.P. Ever Glory Limited is a wholly owned subsidiary of GF Xinde Capital Management Limited. GF Xinde Capital Management Limited is a wholly owned subsidiary of GF Investments (Hong Kong) Company Limited. GF Investments (Hong Kong) Company Limited is a wholly owned subsidiary of GF Holdings |
123
Table of Contents
| (Hong Kong) Corporation Limited. GF Holdings (Hong Kong) Corporation Limited is the wholly owned subsidiary of GF Securities Co., Ltd, a publicly listed company in Hong Kong. Sun Shuming, Lin Zhihai, Qin Li, Sun Xiaoyan, Yang Xiong, Tang Xin. Chan Kalok, Shang Shuzhi, Li Xiulin, Li Yanxi and Liu Xuetao serve on the Board of Directors of Guangfa Securities Co., Ltd and may be deemed to share voting and dispositive power over the shares held by Ever Alpha Fund L.P. The address of Ever Alpha Fund L.P. is 16th Floor, Metro Plaza, No. 183, Tianhe North Road, Guangzhou, People’s Republic of China. |
| (3) | Based in part on a Schedule 13G filed by Illumina, Inc. on April 3, 2019. Consists of 1,773,530 shares held of record by Illumina, Inc. Robert Ragusa is Senior Vice President, Global Quality and Operations of Illumina, Inc., and has sole voting and dispositive power over the shares held of record by Illumina, Inc. The address of Illumina, Inc. is 5200 Illumina Way, San Diego, CA 92122. |
| (4) | Based on a Schedule 13G filed by Tao Invest LLC on February 12, 2019. Consists of (i) 1,218,815 shares held of record by Tao Invest LLC, (ii) 89,880 shares held of record by Tao Invest II LLC, and (iii) 357,143 shares held of record by Tao Invest III LLC. Tao Capital Management LP is the managing member of each of Tao Invest LLC, Tao Invest II LLC and Tao Invest III LLC. Tao Capital Management Inc is the general partner of Tao Capital Management LP. Nicholas J. Pritzker is the chairman and Joseph I. Perkovich is the president of Tao Capital Management Inc. Each of Tao Capital Management LP, Tao Capital Management Inc, and Messers Pritzker and Perkovich may be deemed to share voting and dispositive power of the shares held of record by Tao Invest LLC, Tao Invest II LLC and Tao Invest III LLC. The address for each of the entities identified in this footnote is 1 Letterman Drive, Building C, Suite 420, San Francisco, CA 94129. |
| (5) | Consists of (i) 726,275 shares of common stock and (ii) 398,427 shares issuable upon the exercise of early-exercisable stock options, 66,634 of which would be vested within 60 days after December 9, 2019. |
| (6) | Consists of (i) 6,495 shares of common stock and (ii) 199,500 shares issuable upon the exercise of early-exercisable stock options, 22,751 of which would be vested within 60 days after December 9, 2019. |
| (7) | Consists of (i) 7,462 shares of common stock and (ii) 188,205 shares issuable upon the exercise of early-exercisable stock options, 22,751 of which would be vested within 60 days after December 9, 2019. |
| (8) | Consists of (i) 625,561 shares of common stock and (ii) 276,259 shares issuable upon the exercise of early-exercisable stock options, 22,751 of which would be vested within 60 days after December 9, 2019. |
| (9) | Consists of 66,771 shares held of record by The Craves Family Foundation. Fred Craves may be deemed to hold sole voting and dispositive power with respect to the shares held by The Craves Family Foundation. Mr. Craves’ address is 750 Battery Street, Suite 400, San Francisco, CA 94111. |
| (10) | Does not include options to purchase 5,590 shares at an exercise price of $30.41 per share granted on July 23, 2019, which will vest and become exercisable on the earlier of (i) the one-year anniversary of the date of grant and (ii) the date of our first annual meeting of stockholders following the date of grant, subject to the director’s continuous service through such vesting date. |
| (11) | Xiaoying Mai does not have voting and dispositive power over the shares held of record by Ever Alpha Fund L.P. |
| Item 13. | Certain relationships and related transactions, and director independence |
Policies and Procedures for Related Party Transactions
Our audit committee charter states that our audit committee is responsible for reviewing and approving in advance any related party transaction. Our board of directors adopted a written related person transaction policy setting forth the policies and procedures for the review and approval or ratification of related person transactions by the audit committee. Pursuant to the policy, all of our directors, officers and employees are required to report to the audit committee prior to entering into any transaction, arrangement or relationship, or any series of similar transactions, arrangements or relationships in which we are to be a participant, the amount involved exceeds $120,000 and a related person had or will have a direct or indirect material interest, including purchases of goods or services by or from the related person or entities in which the related person has a material interest, indebtedness, guarantees of indebtedness and employment by us of a related person.
124
Table of Contents
We believe that we have executed all of the transactions set forth under the section entitled “Certain relationships and related party transactions” on terms no less favorable to us than we could have obtained from unaffiliated third parties. It is our intention to ensure that all future transactions between us and our officers, directors and principal stockholders and their affiliates, are approved by the audit committee of our board of directors, and are on terms no less favorable to us than those that we could obtain from unaffiliated third parties.
In addition to the compensation arrangements, including employment, termination of employment and change in control arrangements, and indemnification arrangements, discussed, when required, in the sections titled “Management” and “Executive compensation” and the registration rights described in the section titled “Registration rights,” the following is a description of each transaction since October 1, 2018 and each currently proposed transaction in which:
| • | we have been or are to be a participant; |
| • | the amount involved exceeded or will exceed the lesser of $120,000 or one percent of our total assets at the end of the last two completed fiscal years; and |
| • | any of our directors, executive officers, or holders of more than 5% of any class of our voting securities, or any immediate family member of, or person sharing the household with, any of these persons, had or will have a direct or indirect material interest. |
Senior Business Advisor Agreement with Nelson C. Chan
On November 1, 2017, we entered into a Senior Business Advisor Agreement, or the Advisor Agreement, with Nelson C. Chan, who was later appointed to our board of directors as Class I director in May 2019. Pursuant to the Advisor Agreement, Mr. Chan agreed to provide data storage advisory services to us at a rate of $2,500 per month. In addition, the Advisor Agreement provided that, subject to the approval of our board of directors, Mr. Chan was entitled to receive an option to purchase 7,070 shares of our common stock (after giving effect to the reverse stock split effected in October 2018) that was not subsequently granted. Pursuant to the Advisor Agreement, we paid Mr. Chan $30,000 for his services in calendar year 2018 and $30,000 for his services in calendar year 2019. The Advisor Agreement contains confidentiality and invention-assignment provisions.
Upon Mr. Chan’s appointment to our board of directors, and to account for the grant to which he was entitled under the Advisor Agreement, Mr. Chan received a grant of an option to purchase 3,093 shares of common stock and an RSU grant of 1,497 shares on June 21, 2019, with a total value of $83,095 on the date of grant. The Advisor Agreement was amended to provide for the remainder of the grant to which Mr. Chan was originally promised, in the form of a grant in August 2020 of a RSU award for 1,925 shares of our common stock, and an option to purchase 3,978 shares of our common stock. Additionally, at the time of grant, subject to the approval of the Compensation Committee, the Advisor Agreement provides that Mr. Chan will be granted an award of restricted stock units for a number of shares of common stock determined by multiplying (x) 3,977 by (y) the excess, if any, of the closing price on the date of grant over $30.08, and then dividing the resulting total by the closing price on the date the additional award is granted. The Advisor Agreement was designed to ensure that the value of compensation to Mr. Chan would not exceed $120,000 in any rolling 12-month period. The Advisor Agreement has no specific term and either party may terminate the agreement upon providing written notice.
Side letter with Ever Alpha Fund. L.P.
In March 2018, in connection with Ever Alpha Fund L.P. and certain other investors’ purchase of Series D convertible preferred stock, we entered into a side letter with Ever Alpha Fund L.P. and certain other parties pursuant to which, among other things, we have committed to using commercially reasonable efforts to invest up to $5.0 million, $10.0 million and $10.0 million over a three year period in connection with the incorporation, business and/or operations of a wholly owned foreign enterprise in the PRC, subject to and contingent upon the approval of our board of directors and any applicable regulatory agencies in the PRC and U.S., and compliance
125
Table of Contents
with any applicable laws and regulations. The foreign enterprise will be exclusively owned and controlled by us through a subsidiary that we will wholly own, and Ever Alpha Fund L.P. will not have any direct economic, voting or other interests in this enterprise or any of our subsidiaries. Ever Alpha Fund L.P.’s interests in this enterprise are limited to its equity interest as a stockholder in the Company and its belief that expanding our manufacturing capacity and growing our sales organization in China will have a positive impact on our business and long-term value.
Director Independence
Our board of directors has undertaken a review of its composition, the composition of its committees, and the independence of each director and considered whether any director has a material relationship with us that could compromise his or her ability to exercise independent judgment in carrying out his or her responsibilities. Based on information provided by each director concerning his or her background, employment, and affiliations, including family relationships, our board of directors has determined that each of Messrs. Barthelemy, Chan, Chess, Crandell, Ragusa and Johannessen and Dr. Craves and Ms. Mai do not have a relationship that would interfere with the exercise of independent judgment in carrying out the responsibilities of a director and that each of these directors is “independent” as that term is defined under the applicable rules and regulations of the SEC, and the listing standards of the Nasdaq Stock Market. In making these determinations, our board of directors considered the current and prior relationships that each non-employee director has with our company and all other facts and circumstances our board of directors deemed relevant in determining their independence, including the beneficial ownership of our capital stock by each non-employee director, and the transactions involving them described above in this section.
| Item 14. | Principal accounting fees and services |
The following table sets forth the fees for professional services rendered by PricewaterhouseCoopers LLP, the Company’s independent registered public accounting firm, in connection with the audits of our annual financial statements for the fiscal years ended September 30, 2019 and 2018 and for other services rendered by PricewaterhouseCoopers LLP during those periods. All fees described below were approved by the audit committee.
| Fiscal 2019 | Fiscal 2018 | |||||||
| Audit Fees(1) |
$ | 2,118,500 | $ | 2,133,250 | ||||
| Audit-Related Fees |
— | — | ||||||
| Tax Fees(2) |
15,000 | — | ||||||
| All Other Fees(3) |
2,700 | 29,500 | ||||||
|
|
|
|
|
|||||
| Total Fees |
$ | 2,136,200 | $ | 2,162,750 | ||||
| (1) | Audit Fees consist of fees for professional services rendered in connection with the audit of our annual consolidated financial statements, the review of our quarterly condensed consolidated financial statements, and audit services that are normally provided by independent registered public accounting firms in connection with regulatory filings. This category also includes fees for professional services provided in connection with the public offerings of our common stock, including comfort letters, consents and review of documents filed with the SEC. |
| (2) | Tax Fees consist of fees for an Internal Revenue Code Section 382 study. |
| (3) | All Other Fees consist of aggregate fees billed for products and services provided by our independent registered public accounting firm other than those disclosed above. These services specifically relate to an initial public offering readiness assessment and subscription fees paid for access to online accounting research software. |
126
Table of Contents
Pre-Approval Policy
Under our audit committee’s policy governing our use of the services of our independent registered public accountants, the audit committee is required to pre-approve all audit and permitted non-audit services performed by our independent registered public accountants in order to ensure that the provision of such services does not impair the public accountants’ independence. In the fiscal years ended September 30, 2019 and 2018, all fees identified above under the captions “Audit Fees” and “Audit-Related Fees” that were billed by PricewaterhouseCoopers LLP were approved by the audit committee in accordance with SEC requirements.
127
Table of Contents
| Item 15. | Exhibits, financial statement schedules |
Documents filed as part of this report are as follows:
(a) Consolidated Financial Statements
Our Consolidated Financial Statements are listed in the “Index to Consolidated Financial Statements” beginning on page F-1.
(b) Consolidated Financial Statement Schedules
All financial statement schedules are omitted because the information called for is not required or is shown either in the consolidated financial statements or in the notes thereto.
(c) Exhibits
Set forth below is a list of exhibits that are being filed or incorporated by reference into this Annual Report on Form 10-K:
128
Table of Contents
129
Table of Contents
| + | Indicates a management contract or compensatory plan. |
| † | Portions of this exhibit (indicated by asterisks) have been omitted pursuant to a request for confidential treatment that was separately filed with the SEC. |
| Item 16. | Form of 10-K summary |
Not applicable
130
Table of Contents
Pursuant to the requirements of Section 13 or 15(d) of the Securities Exchange Act of 1934, as amended, the Registrant has duly caused this Report to be signed on its behalf by the undersigned, thereunto duly authorized.
| December 12, 2019 | Twist Bioscience Corporation | |||
| By: | /s/ Emily M. Leproust | |||
| Emily M. Leproust | ||||
| President and Chief Executive Officer | ||||
Pursuant to the requirements of the Securities Exchange Act of 1934, as amended, this report has been signed below by the following persons on behalf of the Registrant and in the capacities and on the dates indicated:
| Signature |
Title |
Date | ||
| /s/ Emily M. Leproust Emily M. Leproust |
President, Chief Executive Officer and Chair of the Board of Directors (principal executive officer) |
December 12, 2019 | ||
| /s/ James M. Thorburn James M. Thorburn |
Chief Financial Officer (principal financial and accounting officer) |
December 12, 2019 | ||
| /s/ William Banyai William Banyai |
Director |
December 12, 2019 | ||
| /s/ Nicolas Barthelemy Nicolas Barthelemy |
Director |
December 12, 2019 | ||
| /s/ Nelson C. Chan Nelson C. Chan |
Director |
December 12, 2019 | ||
| /s/ Robert Chess Robert Chess |
Director |
December 12, 2019 | ||
| /s/ Keith Crandell Keith Crandell |
Director |
December 12, 2019 | ||
| /s/ Frederick Craves Frederick Craves |
Director |
December 12, 2019 | ||
| /s/ Jan Johannessen Jan Johannessen |
Director |
December 12, 2019 | ||
| /s/ Xiaoying Mai Xiaoying Mai |
Director |
December 12, 2019 | ||
| /s/ Robert Ragusa Robert Ragusa |
Director |
December 12, 2019 | ||
131