Attached files
| file | filename |
|---|---|
| EX-99.1 - EX-99.1 - STIFEL FINANCIAL CORP | sf-ex991_7.htm |
| 8-K - SF_8K_20190130 - STIFEL FINANCIAL CORP | sf-8k_20190201.htm |
4th Quarter & Full Year 2018 Financial Results Presentation February 1, 2019 Exhibit 99.2
Disclaimer Forward-Looking Statements This presentation may contain “forward-looking statements” within the meaning of the Private Securities Litigation Reform Act of 1995 that involve significant risks, assumptions, and uncertainties, including statements relating to the market opportunity and future business prospects of Stifel Financial Corp., as well as Stifel, Nicolaus & Company, Incorporated and its subsidiaries (collectively, “SF” or the “Company”). These statements can be identified by the use of the words “may,” “will,” “should,” “could,” “would,” “plan,” “potential,” “estimate,” “project,” “believe,” “intend,” “anticipate,” “expect,” and similar expressions. In particular, these statements may refer to our goals, intentions, and expectations, our business plans and growth strategies, our ability to integrate and manage our acquired businesses, estimates of our risks and future costs and benefits, and forecasted demographic and economic trends relating to our industry. You should not place undue reliance on any forward-looking statements, which speak only as of the date they were made. We will not update these forward-looking statements, even though our situation may change in the future, unless we are obligated to do so under federal securities laws. Actual results may differ materially and reported results should not be considered as an indication of future performance. Factors that could cause actual results to differ are included in the Company’s annual and quarterly reports and from time to time in other reports filed by the Company with the Securities and Exchange Commission and include, among other things, changes in general economic and business conditions, actions of competitors, regulatory and legal actions, changes in legislation, and technology changes. Use of Non-GAAP Financial Measures The Company utilized certain non-GAAP calculations as additional measures to aid in understanding and analyzing the Company’s financial results for the three and twelve months ended December 31, 2018. Specifically, the Company believes that the non-GAAP measures provide useful information by excluding certain items that may not be indicative of the Company’s core operating results and business outlook. The Company believes that these non-GAAP measures will allow for a better evaluation of the operating performance of the business and facilitate a meaningful comparison of the Company’s results in the current period to those in prior and future periods. Reference to these non-GAAP measures should not be considered as a substitute for results that are presented in a manner consistent with GAAP. These non-GAAP measures are provided to enhance investors' overall understanding of the Company’s current financial performance. The non-GAAP financial information should be considered in addition to, not as a substitute for or as being superior to, operating income, cash flows, or other measures of financial performance prepared in accordance with GAAP. These non-GAAP measures primarily exclude expenses which management believes are, in some instances, non-recurring and not representative of ongoing business. Management has not included costs which they believe are duplicative in the analysis below. A limitation of utilizing these non-GAAP measures is that the GAAP accounting effects of these charges do, in fact, reflect the underlying financial results of the Company’s business and these effects should not be ignored in evaluating and analyzing its financial results. Therefore, the Company believes that GAAP measures and the same respective non-GAAP measures of the Company’s financial performance should be considered together.
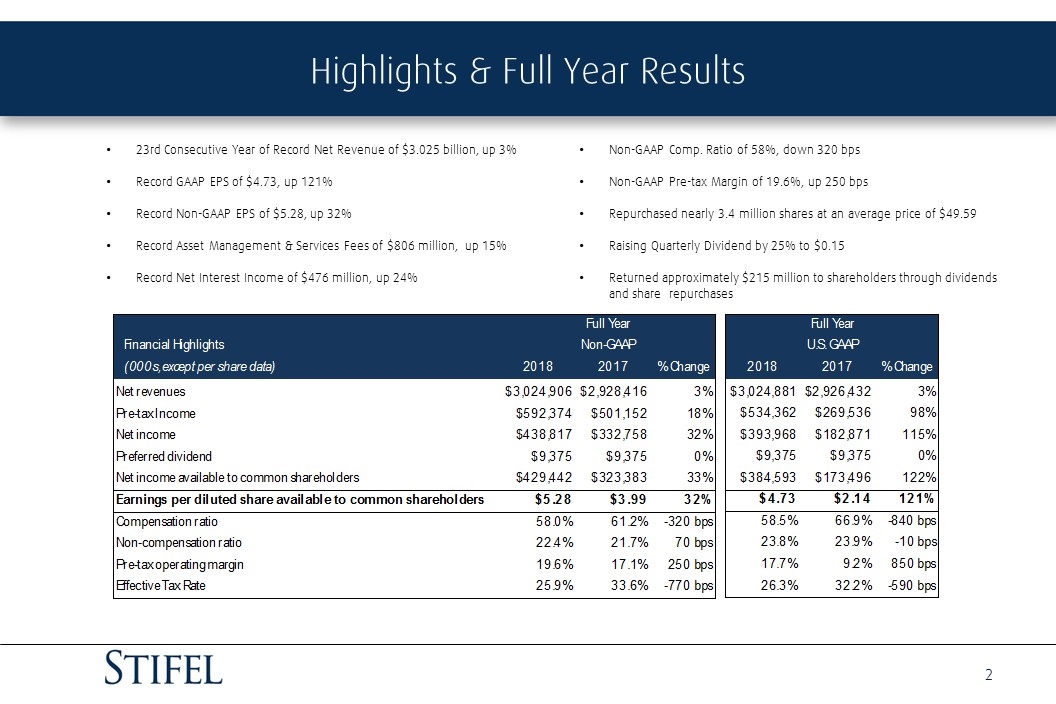
Highlights & Full Year Results 23rd Consecutive Year of Record Net Revenue of $3.025 billion, up 3% Record GAAP EPS of $4.73, up 121% Record Non-GAAP EPS of $5.28, up 32% Record Asset Management & Services Fees of $806 million, up 15% Record Net Interest Income of $476 million, up 24% Non-GAAP Comp. Ratio of 58%, down 320 bps Non-GAAP Pre-tax Margin of 19.6%, up 250 bps Repurchased nearly 3.4 million shares at an average price of $49.59 Raising Quarterly Dividend by 25% to $0.15 Returned approximately $215 million to shareholders through dividends and share repurchases
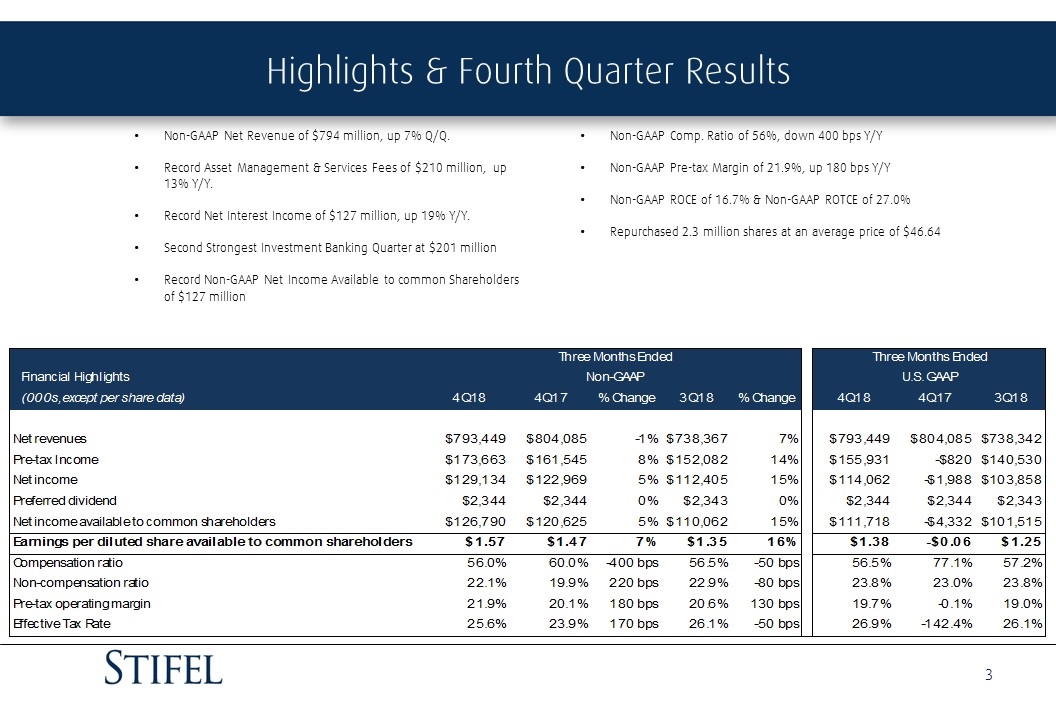
Highlights & Fourth Quarter Results Non-GAAP Net Revenue of $794 million, up 7% Q/Q. Record Asset Management & Services Fees of $210 million, up 13% Y/Y. Record Net Interest Income of $127 million, up 19% Y/Y. Second Strongest Investment Banking Quarter at $201 million Record Non-GAAP Net Income Available to common Shareholders of $127 million Non-GAAP Comp. Ratio of 56%, down 400 bps Y/Y Non-GAAP Pre-tax Margin of 21.9%, up 180 bps Y/Y Non-GAAP ROCE of 16.7% & Non-GAAP ROTCE of 27.0% Repurchased 2.3 million shares at an average price of $46.64

Segment Results
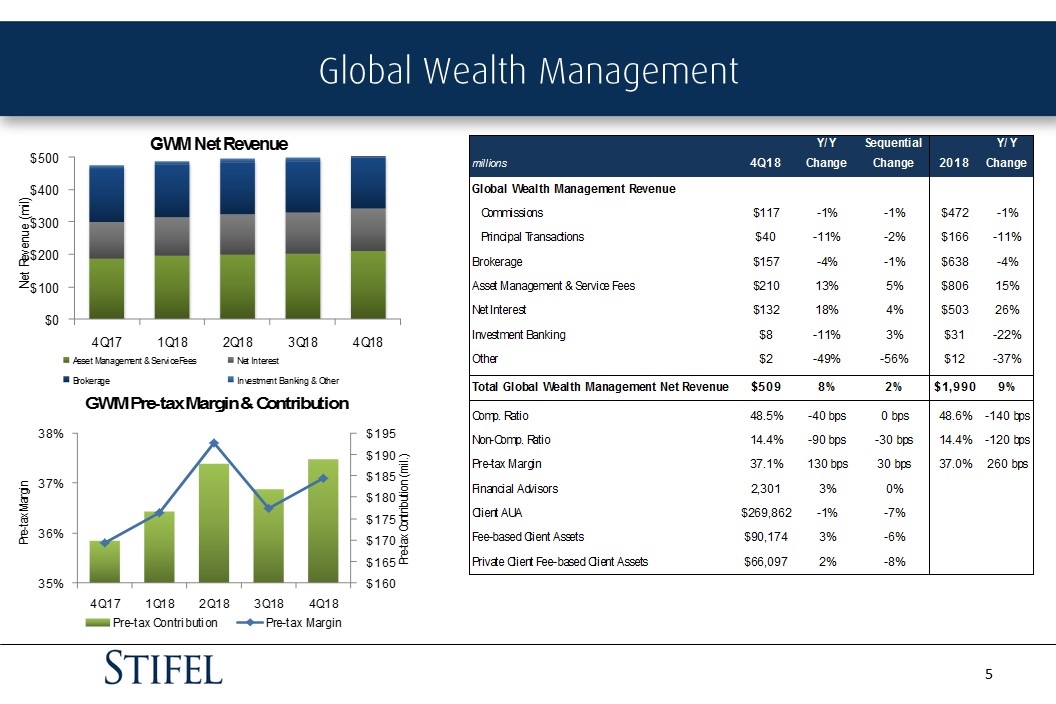
Global Wealth Management
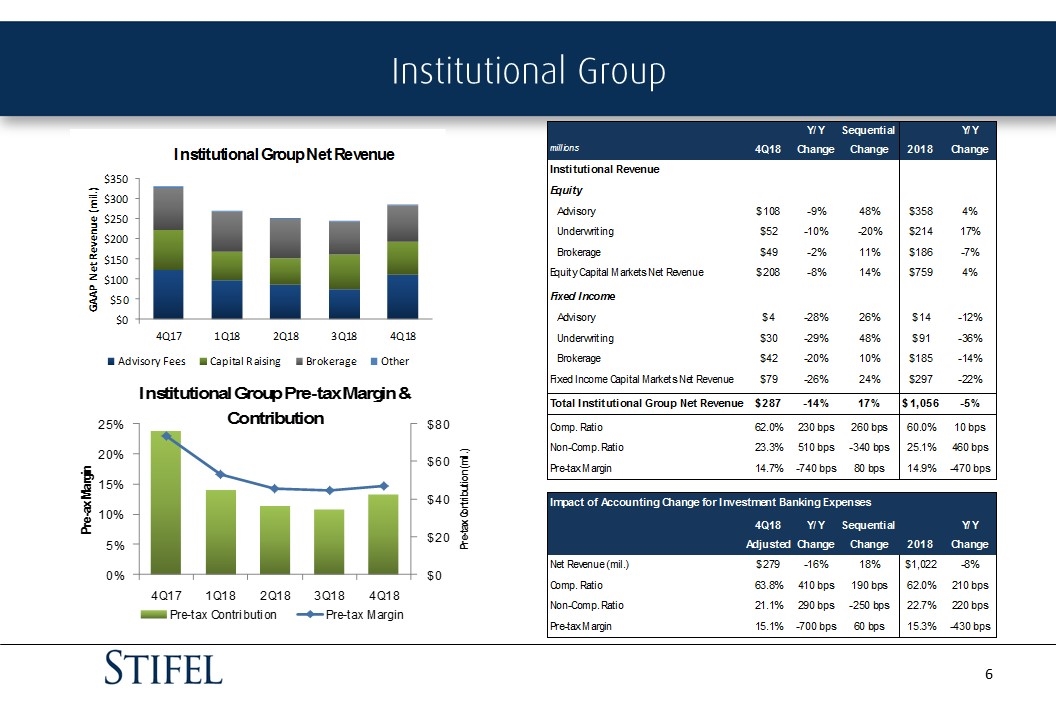
Institutional Group
Revenue & Expenses
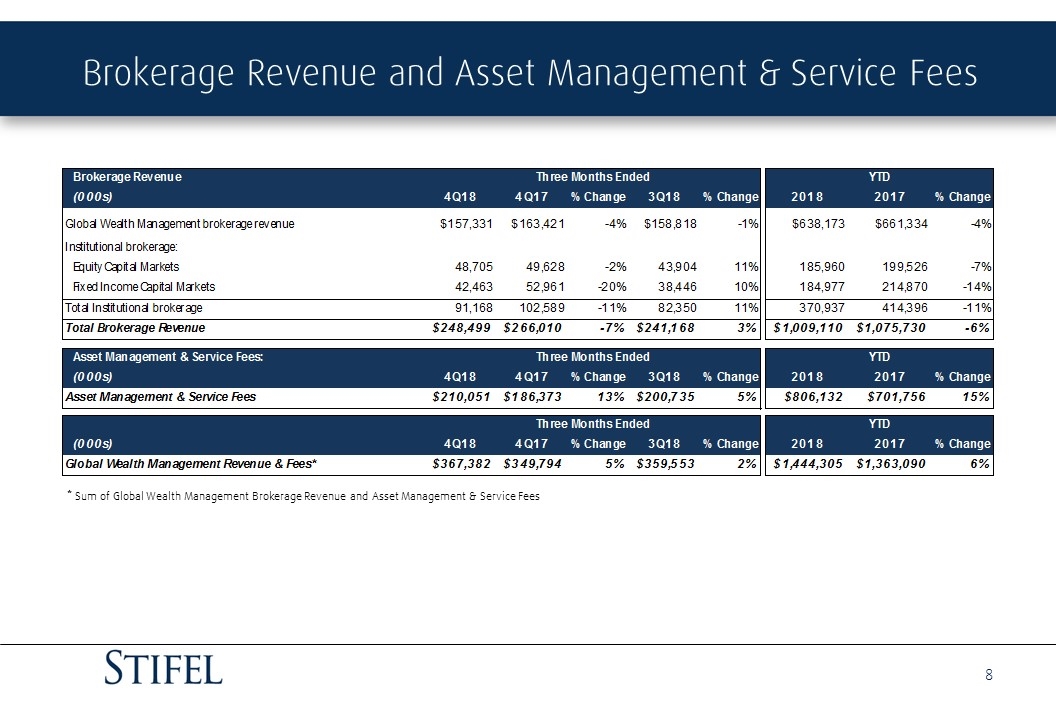
Brokerage Revenue and Asset Management & Service Fees * Sum of Global Wealth Management Brokerage Revenue and Asset Management & Service Fees
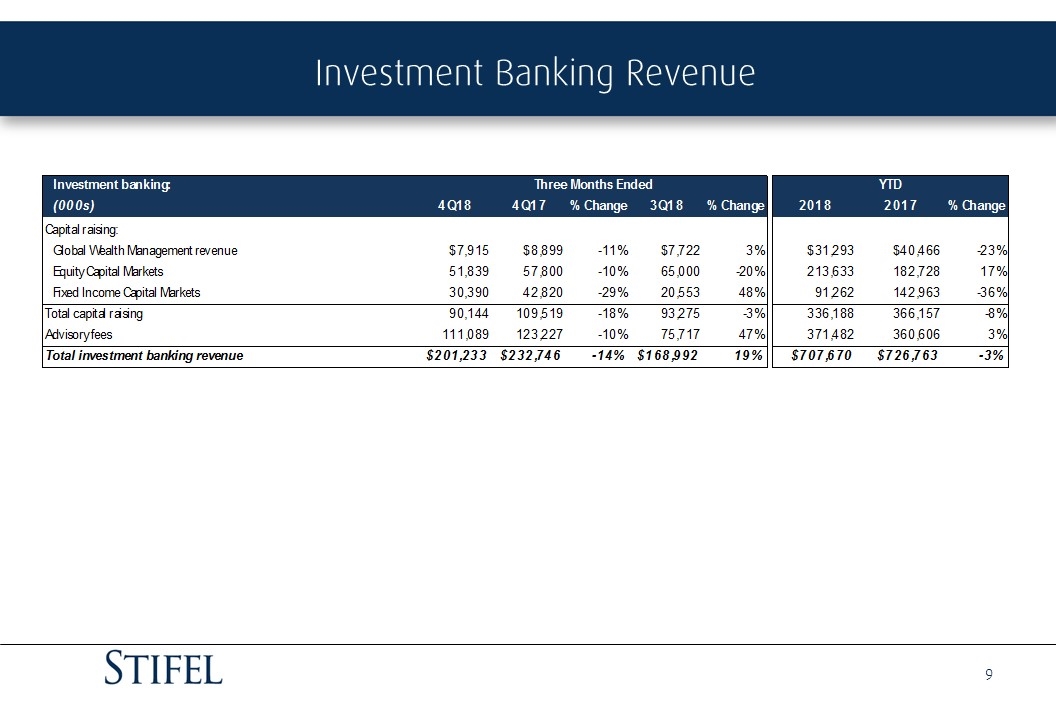
Investment Banking Revenue
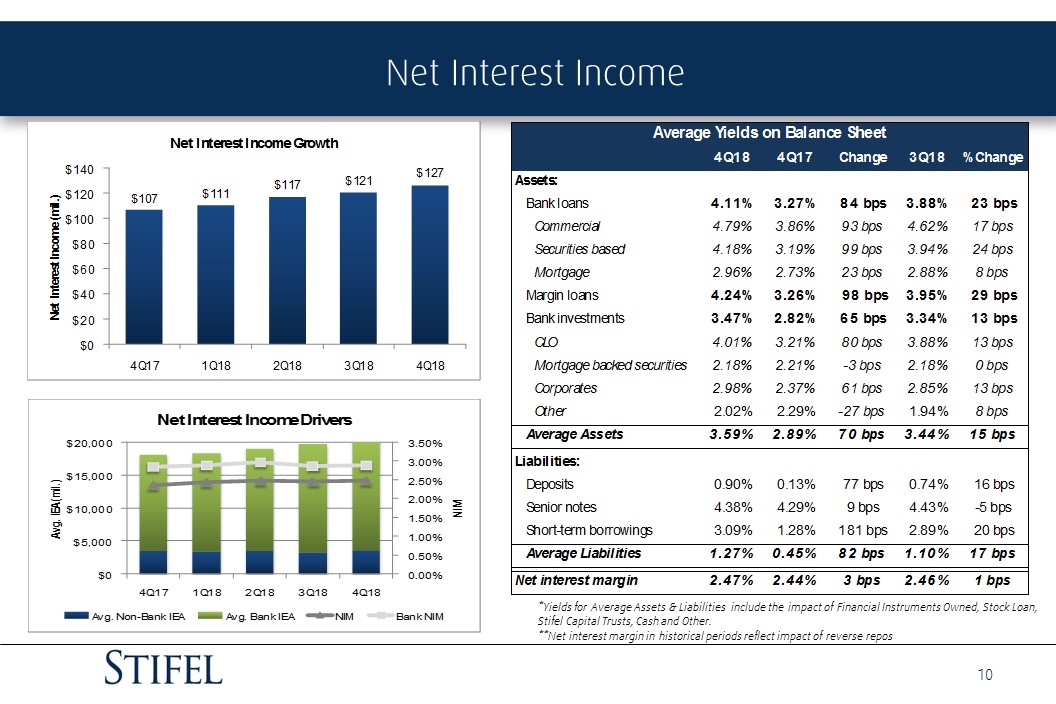
Net Interest Income *Yields for Average Assets & Liabilities include the impact of Financial Instruments Owned, Stock Loan, Stifel Capital Trusts, Cash and Other. **Net interest margin in historical periods reflect impact of reverse repos
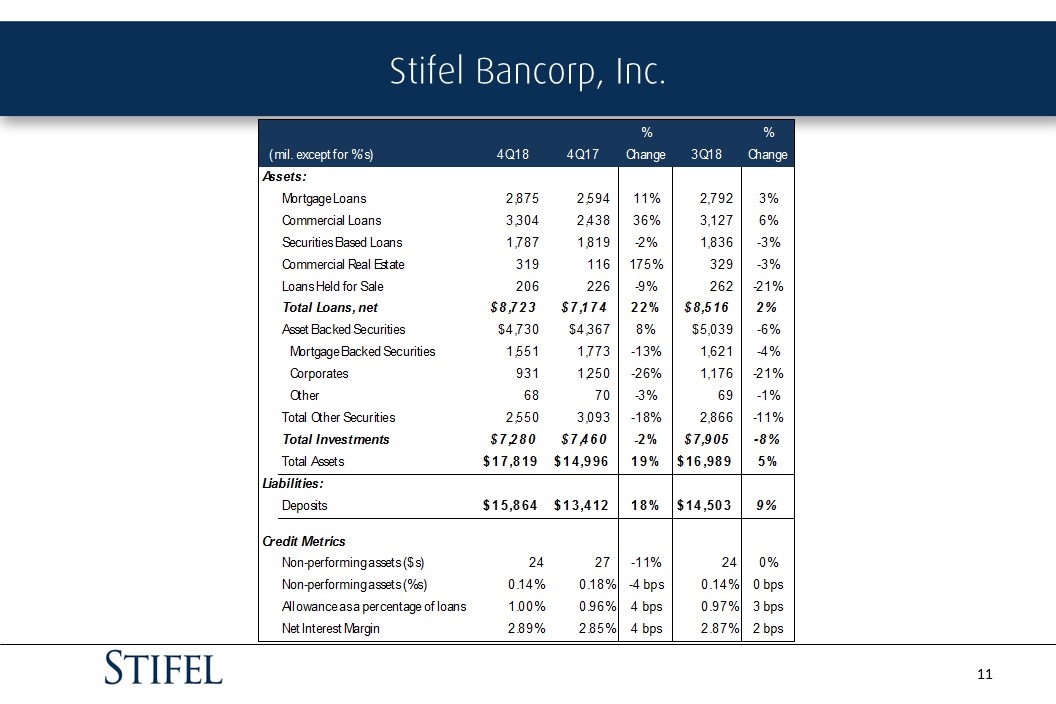
Stifel Bancorp, Inc.
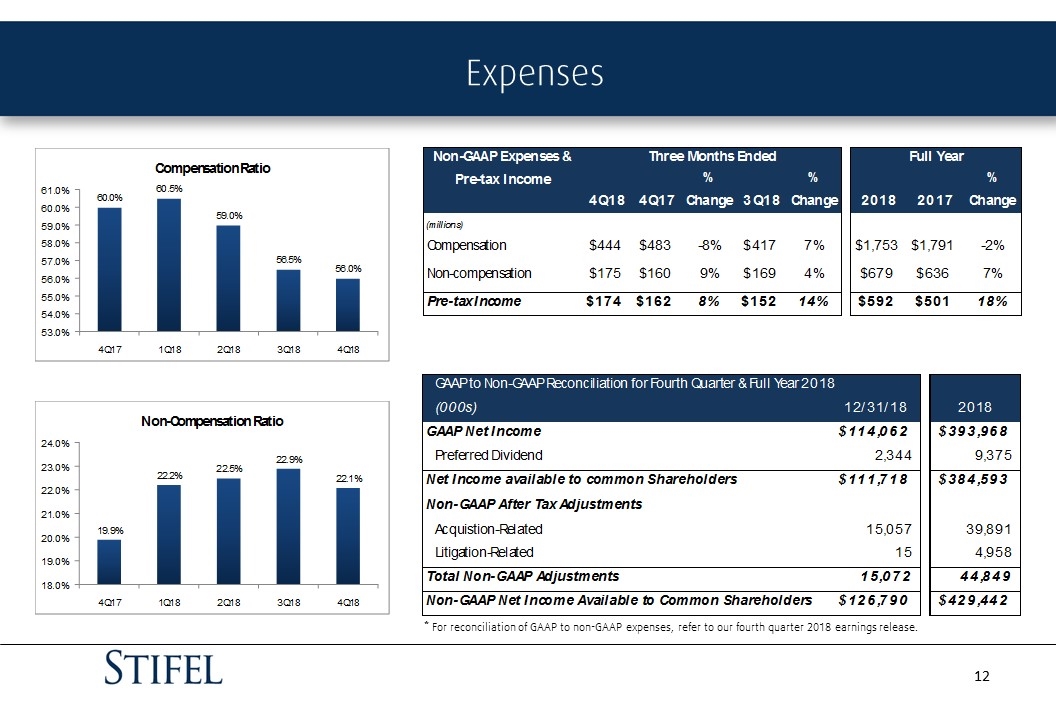
Expenses * For reconciliation of GAAP to non-GAAP expenses, refer to our fourth quarter 2018 earnings release.

Balance Sheet
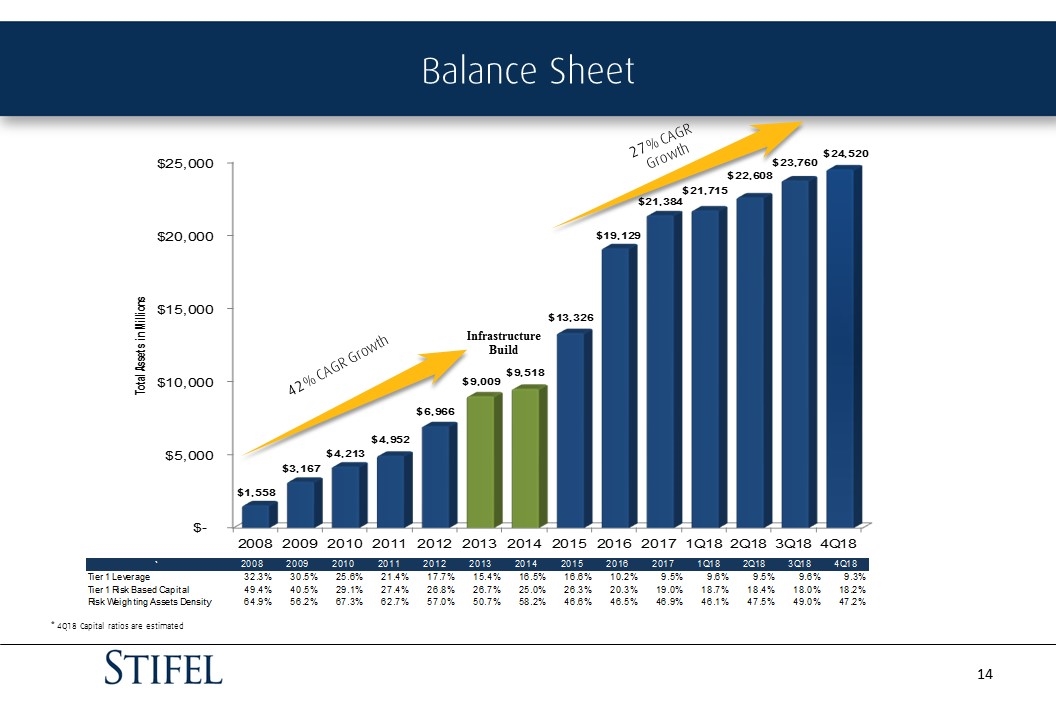
Balance Sheet 27% CAGR Growth Infrastructure Build 42% CAGR Growth * 4Q18 Capital ratios are estimated
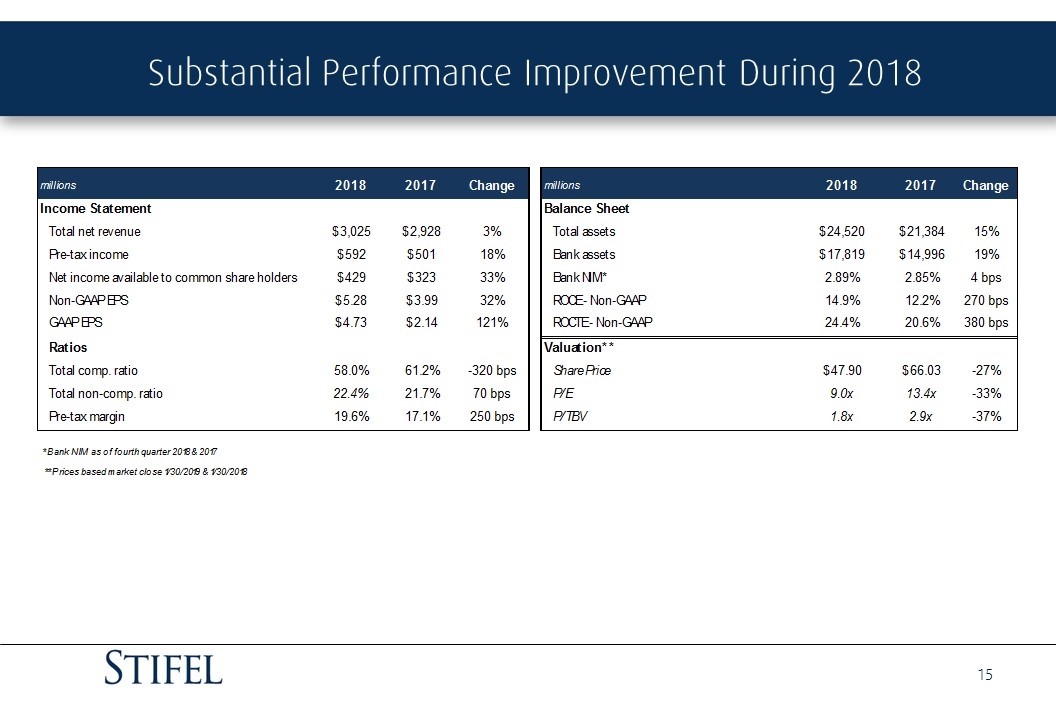
Substantial Performance Improvement During 2018
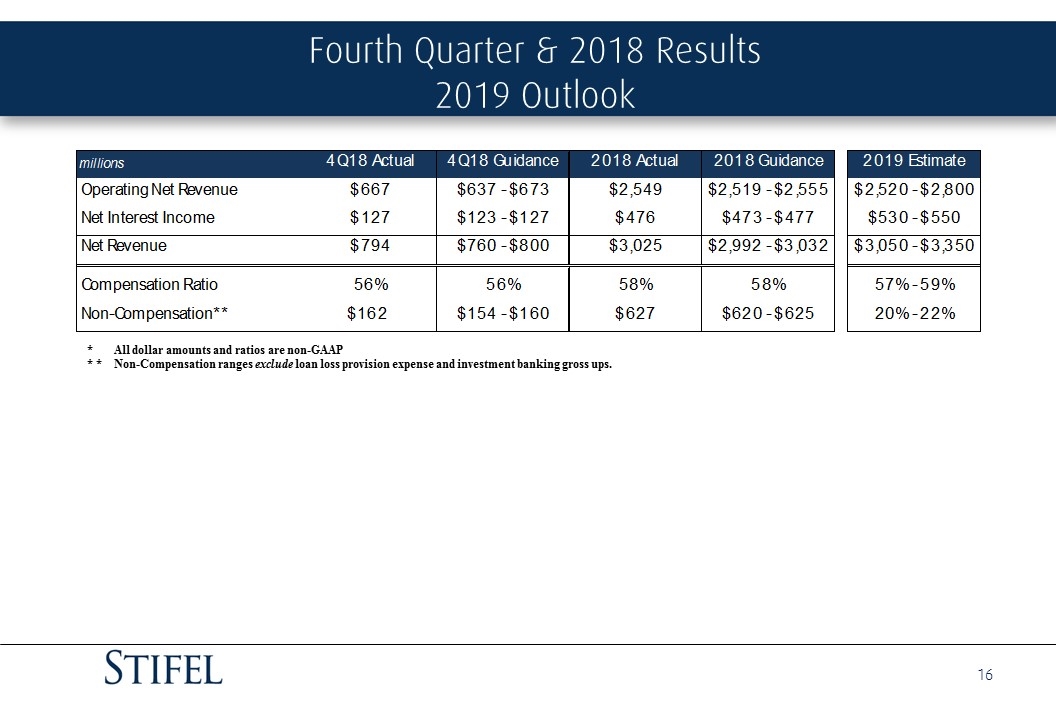
Fourth Quarter & 2018 Results 2019 Outlook * All dollar amounts and ratios are non-GAAP * * Non-Compensation ranges exclude loan loss provision expense and investment banking gross ups.

Q&A
