Attached files
| file | filename |
|---|---|
| 8-K - FORM 8-K - WestRock Co | f8k_013119.htm |
| EX-99.1 - PRESS RELEASE - WestRock Co | exh_991.htm |
EXHIBIT 99.2
Q1 FY19 Results January 31, 2019 Steve Voorhees Chief Executive Officer Ward Dickson Chief Financial Officer Jeff Chalovich President, Corrugated Packaging Bob Feeser President, Consumer Packaging

2 Forward Looking Statements : This presentation contains forward - looking statements within the meaning of the Private Securities Litigation Reform Act of 1995, inc luding but not limited to the statements on the slides entitled “Q1 FY19 Key Highlights”, “Q1 FY19 Corrugated Packaging Results”, “Differentiated Paper - based Packaging Strategy Driving Results”, “Guidance – Q2 FY19 Sequential & Full Year”, “ FY19 Additional Guidance Assumptions”, “Key Commodity Annual Consumption Volumes and FX by Currency”, and “WestRock Has a Pro ven Business Model with a Clear Path to Value Creation” that give guidance or estimates for future periods as well as statements regarding, among other things, that we are on track to achieve our $200 million synergy run rate goal for the KapStone acquisition by the end of fiscal 2021; that we have significant opportunity to expand our business with our 15,000+ customers; that Q2 FY19 earnings drivers and estimates will be as presented on slide 8 ; tha t FY19 additional guidance assumptions and mill maintenance schedule will be as presented on slide 12; and that key commodity annual consumption volumes will be as presented on slide 13. Forward - looking statements are based on our current expectations, beliefs, plans or forecasts and are typically identified by wo rds or phrases such as "may," "will," "could," "should," "would," "anticipate," "estimate," "expect," "project," "intend," "plan," "believe," "target," "prospects," "potent ial " and "forecast," and other words, terms and phrases of similar meaning. Forward - looking statements involve estimates, expectations, projections, goals, forecasts, assumptions, risks a nd uncertainties. WestRock cautions readers that a forward - looking statement is not a guarantee of future performance and that actual results could differ materially from those co ntained in the forward - looking statement. WestRock’s businesses are subject to a number of general risks that would affect any such forward - looking statements, including, among othe rs, decreases in demand for their products; increases in energy, raw materials, shipping and capital equipment costs; reduced supply of raw materials; fluctuations in se lli ng prices and volumes; intense competition; the potential loss of certain customers; the scope, costs, timing and impact of any restructuring of our operations and corporate an d tax structure; the occurrence of a natural disaster, such as hurricanes or other unanticipated problems, such as labor difficulties, equipment failure or unscheduled maintenance and repair, which could result in operational disruptions of varied duration; our desire or ability to continue to repurchase company stock; risks associated with integrat ing KapStone’s operations into our operations and our ability to realize anticipated synergies and productivity improvements; and adverse changes in general market and industry co ndi tions. Such risks and other factors that may impact management's assumptions are more particularly described in our filings with the Securities and Exchange Commission, includin g i n Item 1A under the caption "Risk Factors" in our Annual Report on Form 10 - K for the year ended September 30, 2018 . The information contained herein speaks as of the date hereof and WestRock does not have or undertake any obligation to update or revise its forward - looking statements, whether as a result of new information, future events or otherwis e. Non - GAAP Financial Measures : We may from time to time be in possession of certain information regarding WestRock that applicable law would not require us to disclose to the public in the ordinary course of business, but would require us to disclose if we were engaged in the purchase or sale of our securities. This presentation sh all not be considered to be part of any solicitation of an offer to buy or sell WestRock securities. This presentation also may not include all of the information regarding WestRock th at you may need to make an investment decision regarding WestRock securities. Any investment decision should be made on the basis of the total mix of information regarding Wes tRock that is publicly available as of the date of the investment decision. We report our financial results in accordance with accounting principles generally accepted in the United States ("GAAP"). Ho wev er, management believes certain non - GAAP financial measures provide users with additional meaningful financial information that should be considered when assessing ou r o ngoing performance. Management also uses these non - GAAP financial measures in making financial, operating and planning decisions and in evaluating our performance. Non - G AAP financial measures should be viewed in addition to, and not as an alternative for, our GAAP results. The non - GAAP financial measures we present may differ from similar ly captioned measures presented by other companies. Forward Looking Statements; Non - GAAP Financial Measures

3 Q1 FY19 Key Highlights x Continued strong demand in North American Corrugated container business » 3.1% year - over - year increase in per day North American corrugated box shipments, excluding KapStone x Consumer segment sales up 1.1% year - over - year x Strong backlogs and operating rates across Consumer grades x Restarted Panama City, FL mill following damage from Hurricane Michael x Strong start to KapStone integration efforts; synergy capture on track x More than 130 customers buying significant volumes from both segments, accounting for approximately one third of total sales x $322 million of capital investment x Implementing strategic investments at Florence, SC containerboard mill, Mahrt, AL CNK ® mill, Covington, VA SBS mill, Tres Barras, Brazil containerboard mill and Porto Feliz , Brazil box plant x Announced 5.8% dividend increase in October 2018 to annualized rate of $1.82 per share; paid $116 million in cash dividends x Repurchased $44 million of stock x Leverage ratio of 2.97x at end of quarter (3) ; net leverage ratio of 2.89x (3) x Net Sales (1) increased $549 million, or 14.5%, year - over - year to $4,327 million x Earned $0.83 of Adjusted Earnings Per Diluted Share (2) x Adjusted Segment EBITDA growth of 10% for a margin of 16.9% (3) x Corrugated Packaging Adjusted Segment EBITDA margin of 20.3% (3) » North American Corrugated Adjusted Segment EBITDA margin of 21.0% (3) » Brazil Adjusted Segment EBITDA margin of 27.7% (3) x Consumer Packaging segment favorable price/mix of $34 million year - over - year x Closed the KapStone acquisition on November 2 nd ; acquisition was $0.04 accretive to Adjusted Earnings Per Diluted Share (2) Financial Performance Markets & Operations Capital Allocation 1) Excluding Recycling sales in Q1 FY18. See Reconciliations in the Appendix. 2) Non - GAAP Financial Measure. On a GAAP basis, earnings per diluted share were $0.54 in Q1 FY19 and $4.38 in Q1 FY18. See Non - GAAP Financial Measures and Reconciliations in the Appendix. 3) Non - GAAP Financial Measure. See Non - GAAP Financial Measures and Reconciliations in the Appendix.

4 Q1 FY19 WestRock Consolidated Results Highlights: • Adjusted Segment EBITDA up 10 % year - over - year (2) • Adjusted Segment EBITDA increased due to improved price / mix, productivity and KapStone acquisition (2) • Hurricanes Michael and Florence negatively impacted Adjusted Segment EBITDA by $31 million (2) • Net leverage ratio of 2.89 x at end of quarter (2) Financial Performance ($ in millions, except percentages and per share items) Q1 FY19 Q1 FY18 Net Sales (1) $4,327 $3,778 Adjusted Segment Income (2) $384 $368 Adjusted Segment EBITDA (2) $733 $668 % Margin (2) 16.9% 17.7% Adjusted Earnings Per Diluted Share (3) $0.83 $0.87 Adjusted Operating Cash Flow (2) $348 $374 Adjusted Segment EBITDA (2) ($ in millions) +10% 1) Excluding Recycling sales in Q1 FY18. See Reconciliations in the Appendix. 2) Non - GAAP Financial Measure. See Non - GAAP Financial Measures and Reconciliations in the Appendix. 3) Non - GAAP Financial Measure. On a GAAP basis, earnings per diluted share were $0.54 in Q1 FY19 and $4.38 in Q1 FY18. See Non - GAAP Financial Measures and Reconciliations in the Appendix. $668 134 35 81 $733 (28) (56) (42) (31) (13) (15) Q1 FY18 Volume Price / Mix Energy / Materials / Freight (E/M/F) Wage and Other Inflation Productivity KapStone Hurricanes FX and Pension Other Q1 FY19

5 Q1 FY19 Corrugated Packaging Results 1) Excluding Recycling sales in Q1 FY18 2) Non - GAAP Financial Measure. See Non - GAAP Financial Measures and Reconciliations in the Appendix. Segment Highlights: • Adjusted Segment EBITDA up 19 % year - over - year (2) North America: • Improvement in Adjusted Segment EBITDA margins (2) • Total North American box shipments up 13.5 % year - over - year, including KapStone • Box shipments (excluding KapStone) up 3.1 % per day year - over - year due to gains across various end markets • Jan. 2019 MTD organic container shipments up over 4% Brazil: • Strong operating performance; Adjusted Segment EBITDA margin of 27.7 % (2) Key Bridge Variances: • Volume : Excluding the hurricane, Segment volume down 48k tons driven by lower export and domestic sales • Price / Mix : Flow through of previously published PPW price increases • E/M/F : Higher costs in freight, virgin fiber and energy, partially offset by favorable OCC pricing • Productivity : Driven by capital investments, supply chain optimization, procurement savings and acquisition integration • Hurricanes : Hurricane - related lost production and business interruption related impacts • Other : Negative foreign exchange and other items KapStone Integration Update: • Integration and synergy capture on track to achieve $200 million synergy run - rate goal by the end of fiscal 2021 Financial Performance ($ in millions, except percentages) Q1 FY19 Q1 FY18 Segment Sales (1) $ 2,734 $2,199 Adjusted Segment Income (2) $ 325 $284 Adjusted Segment EBITDA (2) $ 533 $448 % Margin (2) 20.3 % 21.2% North American Adjusted Segment EBITDA Margin (2) 21.0 % 20.9% Brazil Adjusted Segment EBITDA Margin (2) 27.7% 25.0% Adjusted Segment EBITDA (2) ($ in millions) +19% $448 $533 102 16 81 (18) (31) (22) (31) (12) Q1 FY18 Volume Price / Mix Energy / Materials / Freight Wage and Other Inflation Produc- tivity KapStone Hurricanes Other Q1 FY19

6 Q1 FY19 Consumer Packaging Results Segment Highlights: • Pricing momentum from previously published PPW price increases • Growth in foodservice, liquid packaging, beverage, commercial print and retail food offset by lower sales in tobacco and media • WestRock paper machine operating rates above 96% for all substrates • Strong Consumer backlogs with all grades between 4 and 7 weeks Key Bridge Variances: • Volume : Lower volumes in tobacco and media • Price / Mix : Realizing flow through of previously published PPW price increases • E/M/F : Higher costs in freight, virgin fiber and energy, partially offset by favorable recycled fiber • Productivity : Benefits from capital investments, procurement savings and ongoing productivity programs partially offset by challenges sourcing wood Financial Performance ($ in millions, except percentages) Q1 FY19 Q1 FY18 Segment Sales $ 1,619 $1,601 Adjusted Segment Income (1) $ 78 $99 Adjusted Segment EBITDA (1) $ 216 $235 % Margin (1) 13.3 % 14.7% Adjusted Segment EBITDA (1) ($ in millions) 1) Non - GAAP Financial Measure. See Non - GAAP Financial Measures and Reconciliations in the Appendix. $235 34 12 $216 (9) (26) (19) (11) Q1 FY18 Volume Price / Mix Energy / Materials / Freight Wage and Other Inflation Produc- tivity Other Q1 FY19
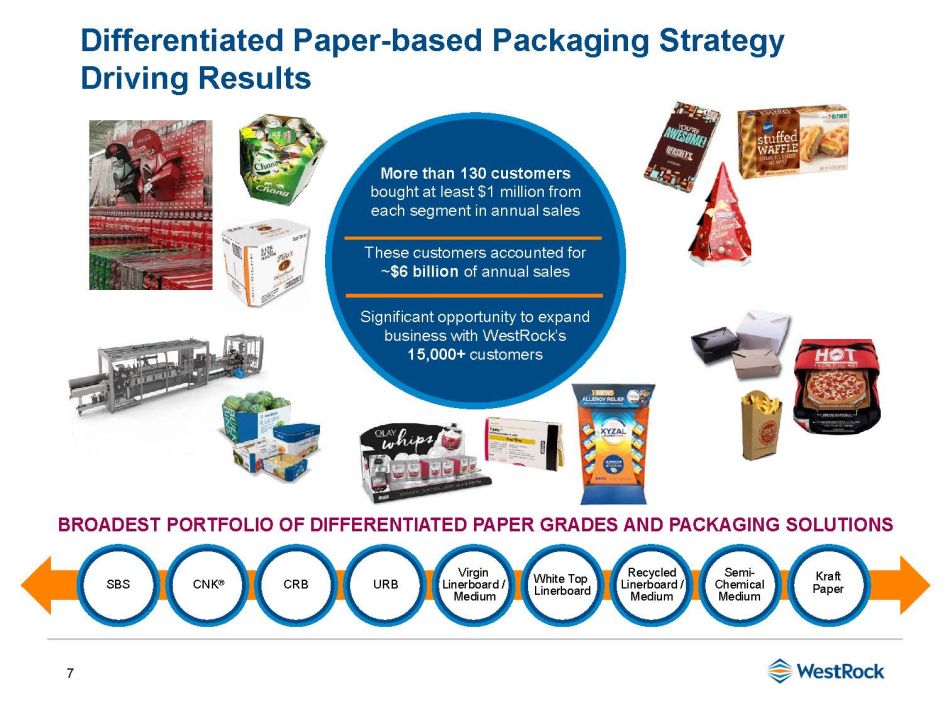
7 Differentiated Paper - based Packaging Strategy Driving Results BROADEST PORTFOLIO OF DIFFERENTIATED PAPER GRADES AND PACKAGING SOLUTIONS More than 130 customers bought at least $1 million from each segment in annual sales These customers accounted for ~ $6 billion of annual sales Significant opportunity to expand business with WestRock’s 15,000+ customers SBS CNK ® CRB URB Virgin Linerboard / Medium White Top Linerboard Recycled Linerboard / Medium Semi - Chemical Medium Kraft Paper

8 Guidance - Q2 FY19 Sequential & Full Year 1) Non - GAAP Financial Measure. See Non - GAAP Financial Measures and Forward - looking Guidance in the Appendix. Q1 FY19 Adjusted Segment EBITDA (1) $733 million +$ 45 to +$50 million KapStone (closed Nov 2) • One additional month of ownership - $45 million Inflation, Primarily Wage and Benefit as well as Payroll Related Taxes • Approximately 2/3 rd Corrugated Packaging, 1/3 rd Consumer Packaging Q2 FY19 Adjusted Segment EBITDA (1) $700 - $735 million - $45 to - $20 million Corrugated Downtime and Other Items • 38k tons of incremental mill maintenance downtime • Range of impact on mill system to reduce inventory and match our supply with our customers’ demand Other Sequential Adjusting EPS Items: Negative approximately $( 0.19) per share - Increased depreciation & amortization expense of $( 0.08) - Higher interest expense of $( 0.10) - Adjusted t ax rate of approximately 24.5 % , up sequentially from 23.3 % +$10 to +$15 million Consumer Price / Volume / Mix / Downtime • Flow through of previously published Consumer price increases • 24k tons of incremental mill maintenance downtime Full Year FY19 Adjusted Segment EBITDA (1) Guidance Approximately $3.5 Billion

9 WestRock Has a Proven Business Model with a Clear Path to Value Creation OUTSTANDING EXECUTION & DELIVERY DISCIPLINED CAPITAL ALLOCATION BROAD PORTFOLIO OF DIFFERENTIATED SOLUTIONS We are building a leading paper and packaging company with the strategy and capabilities to generate attractive returns ✓ Delivering our broad portfolio of differentiated solutions to customers ✓ Executing on productivity opportunities and generating strong cash flow ✓ Reinvesting our cash flow back into the business and returning capital to stockholders

Appendix

11 Non - GAAP Financial Measures Adjusted Earnings Per Diluted Share We use the non - GAAP financial measure “adjusted earnings per diluted share,” also referred to as “adjusted earnings per share” o r “Adjusted EPS” because we believe this measure provides our board of directors, investors, potential investors, securities analysts and others with useful information to evaluate our performance si nce it excludes restructuring and other costs, net, and other specific items that we believe are not indicative of our ongoing operating results. Our management and board of directors use this information to ev aluate our performance relative to other periods. We believe the most directly comparable GAAP measure is Earnings per diluted share. Adjusted Operating Cash Flow We use the non - GAAP financial measure “adjusted operating cash flow” because we believe this measure provides our board of direc tors, investors, potential investors, securities analysts and others with useful information to evaluate our performance relative to other periods because it excludes restructuring and other costs, n et of tax, that we believe are not indicative of our ongoing operating results. While this measure is similar to adjusted free cash flow, we believe it provides greater comparability across periods when ca pit al expenditures are changing since it excludes an adjustment for capital expenditures. While this measure is similar to adjusted free cash flow, we believe it provides greater comparability across p eri ods when capital expenditures are changing since it excludes an adjustment for capital expenditures. We believe the most directly comparable GAAP measure is net cash provided by operating activities. Adjusted Segment EBITDA and Adjusted Segment EBITDA Margins We use the non - GAAP financial measures “adjusted segment EBITDA” and “adjusted segment EBITDA margins”, along with other factors , to evaluate our segment performance against our peers. We believe that investors also use these measures to evaluate our performance relative to our peers. We calculate adjusted segme nt EBITDA for each segment by adding that segment’s adjusted segment income to its depreciation, depletion and amortization. We calculate adjusted segment EBITDA margin for each segment by divid ing that segment’s adjusted segment EBITDA by its adjusted segment sales. Leverage Ratio and Net Leverage Ratio We use the non - GAAP financial measures “leverage ratio” and “net leverage ratio” as measurements of our operating performance an d to compare to our publicly disclosed target leverage ratio. We believe investors use each measure to evaluate our available borrowing capacity – in the case of “net leverage ratio”, adjusted for cash and cash equivalents. We define leverage ratio as our Total Funded Debt divided by our Credit Agreement EBITDA, each of which term is defined in our credit agreement, dated July 1, 2015. Borro win g capacity under our credit agreement depends on, in addition to other measures, the Credit Agreement Debt/EBITDA ratio or the leverage ratio. As of December 31, 2018, our leverage ratio was 2 .97 times. While the leverage ratio under our credit agreement determines the credit spread on our debt, we are not subject to a leverage ratio cap. Our credit agreement is subject to a Debt to Capitaliz ati on and Consolidated Interest Coverage Ratio, as defined therein. We define net leverage ratio as the product of our Total Funded Debt minus cash and cash equivalents divided by our Credit Agreement EB ITD A. As of December 31, 2018, our net leverage ratio was 2.89 times. Forward - looking Guidance We are not providing a reconciliation of forward - looking non - GAAP financial measures to the most directly comparable U.S. GAAP m easure because we are unable to predict with reasonable certainty the ultimate outcome of certain significant items without unreasonable effort. These items include, but are not limited to, merge r a nd acquisition - related expenses, restructuring expenses, asset impairments, litigation settlements, changes to contingent consideration and certain other gains or losses. These items are uncertain, dep end on various factors, and could have a material impact on U.S. GAAP reported results for the guidance period. Adjusted Tax Rate We use the non - GAAP financial measure “Adjusted Tax Rate”. We believe this non - GAAP financial measure is useful because it adjus ts our GAAP effective tax rate to exclude the impact of restructuring and other costs, net, and other specific items that management believes are not indicative of the ongoing operating results o f t he business. “Adjusted Tax Rate” is calculated as “Adjusted Tax Expense” divided by “Adjusted Pre - Tax Income”. We believe that the most directly comparable GAAP measures to Adjusted Tax Expense and Adj usted Pre - Tax Income are “Income tax (expense) benefit” and “Income before income taxes”, respectively.

12 FY19 Additional Guidance Assumptions Other Guidance Assumptions Depreciation & Amortization Approx. $1.5 billion Interest Expense Approx. $500 - $510 million Interest Income Approx. $50 - $60 million Effective Adjusted Book Tax Rate (1) 24% to 25% Adjusted Cash Tax Rate (1) Approx. 23% Share Count Approx. 260 million Capital Expenditures Approx. $1.4 billion North American Corrugated Packaging Consumer Packaging Mill Maintenance Schedule (2) (tons in thousands) Q1 Q2 Q3 Q4 Full Year FY19 50 88 133 1 272 FY18 73 35 125 0 233 Q1 Q2 Q3 Q4 Full Year FY19 17 41 60 3 121 FY18 28 11 8 0 47 1) Non - GAAP Financial Measure. 2) Q2, Q3 and Q4 FY19 amounts are forecasts.

13 Key Commodity Annual Consumption Volumes and FX by Currency Commodity Category Volume Recycled Fiber (tons millions) 5.9 Wood (tons millions) 44 Natural Gas (cubic feet billions) 83 Electricity (kwh billions) 6.7 Polyethylene (lbs millions) 48 Caustic Soda (tons thousands) 246 Starch (lbs millions) 582 Annual Consumption Volumes FX By Currency in Q1 FY19 Sensitivity Analysis Category Increase in Spot Price Annual EPS Impact Recycled Fiber (tons millions) +$10.00 / ton ($0.17) Natural Gas (cubic feet billions) +$0.25 / MMBTU ($0.06) FX Translation Impact +10% USD Appreciation ($0.07) Revenue by Transaction Currency 82% USD 7% CAD 3% EUR 3% BRL 2% GBP 3% Other

14 Adjusted Net Income and Adjusted Earnings Per Diluted Share Reconciliation 1) The GAAP results for Pre - Tax, Tax, Net of Tax and EPS are equivalent to the line items "Income before income taxes", "Income tax (expense) benefit“, "Consolidated net income“ and “Earnings per Diluted Share”, respectively, as reported on the statements of operations. ($ in millions, except per share data) Q1 FY19 Adjustments to Segment EBITDA Consolidated Results Corrugated Packaging Consumer Packaging L&D and Other Pre-Tax Tax Net of Tax EPS GAAP Results (1) $ 202.5 $ (62.7) $ 139.8 $ 0.54 Restructuring and other items n/a n/a n/a 54.4 (0.9) 53.5 0.21 Direct expenses from Hurricane Michael 39.8 - - 39.8 (9.8) 30.0 0.12 Inventory stepped-up in purchase accounting 24.7 - - 24.7 (6.0) 18.7 0.07 Gain on sale of certain closed facilities n/a n/a n/a (50.5) 12.4 (38.1) (0.15) Accelerated depreciation on major capital projects n/a n/a n/a 8.9 (2.3) 6.6 0.02 Interest accretion and other n/a n/a n/a (5.5) 1.3 (4.2) (0.02) Losses at closed plants 0.5 0.6 - 2.3 (0.6) 1.7 - Loss on extinguishment of debt n/a n/a n/a 1.9 (0.5) 1.4 0.01 Land and Development operating results - - (0.7) (0.7) 0.2 (0.5) - Impact of Tax Cuts and Jobs Act n/a n/a n/a - 4.1 4.1 0.02 Other 3.1 - 0.7 3.8 (0.9) 2.9 0.01 Adjustments / Adjusted Results $ 68.1 $ 0.6 $ - $ 281.6 $ (65.7) 215.9 $ 0.83 Noncontrolling interests (0.7) Adjusted Net Income $ 215.2

15 Adjusted Net Income and Adjusted Earnings Per Diluted Share Reconciliation 1) The GAAP results for Pre - Tax, Tax, Net of Tax and EPS are equivalent to the line items "Income before income taxes", "Income tax (expense) benefit“, "Consolidated net income“ and “Earnings per Diluted Share”, respectively, as reported on the statements of operations. ($ in millions, except per share data) Q1 FY18 Adjustments to Segment EBITDA Consolidated Results Corrugated Packaging Consumer Packaging L&D and Other Pre-Tax Tax Net of Tax EPS GAAP Results (1) $ 60.3 $ 1,073.2 $ 1,133.5 $ 4.38 Impact of Tax Cuts and Jobs Act n/a n/a n/a - (1,086.9) (1,086.9) (4.19) Multiemplyer pension withdrawal n/a n/a n/a 179.1 (46.6) 132.5 0.51 Restructuring and other items n/a n/a n/a 16.3 (4.0) 12.3 0.05 Acquisition inventory step-up 0.6 - - 0.6 (0.2) 0.4 - Land and Development operating results including impairments - - 0.6 25.9 (6.5) 19.4 0.07 Losses at closed plants and transition costs 7.8 4.7 n/a 13.2 (3.5) 9.7 0.04 Accelerated depreciation on major capital projects n/a n/a n/a 5.1 (1.3) 3.8 0.01 Loss on extinguishment of debt n/a n/a n/a 1.0 (0.2) 0.8 - Other n/a n/a 0.6 (1.4) 0.3 (1.1) - Adjusted Results $ 8.4 $ 4.7 $ 1.2 $ 300.1 $ (75.7) 224.4 $ 0.87 Noncontrolling interests 1.6 Adjusted Net Income $ 226.0

16 Adjusted Tax Rate Reconciliation Adjusted Operating Cash Flow ($ in millions, except percentages) Q1 FY19 Q1 FY18 Adjusted pre-tax income 281.6$ 300.1$ Adjusted tax expense (65.7) (75.7) 215.9$ 224.4$ Adjusted Tax Rate 23.3% 25.2% ($ in millions) Q1 FY19 Q1 FY18 Net cash provided by operating activities 303.1$ 245.4$ Plus: Retrospective accounting policy adoptions 118.1 Plus: Cash Restructuring and other costs, net of income tax benefit of $14.5 and $3.7 44.6 10.3 Adjusted Operating Cash Flow 347.7$ 373.8$

17 Adjusted Segment Sales, Adjusted Segment EBITDA and Adjusted Segment Income Q1 FY19 ($ in millions, except percentages) Corrugated Packaging Consumer Packaging Land and Development Corporate / Eliminations Consolidated Segment / Net Sales 2,733.8$ 0 1,618.8$ 13.9$ (39.1)$ 4,327.4$ Less: Trade Sales (100.0) - - - (100.0) Adjusted Segment Sales 2,633.8$ 1,618.8$ 13.9$ (39.1)$ 4,227.4$ Segment Income 246.8$ 76.9$ 0.7$ -$ 324.4$ Non-allocated Expenses - - - (19.0) (19.0) Depreciation and Amortization 218.5 138.6 - 2.0 359.1 Segment EBITDA 465.3 215.5 0.7 (17.0) 664.5 Adjustments 68.1 0.6 (0.7) 0.7 68.7 Adjusted Segment EBITDA 533.4$ 216.1$ -$ (16.3)$ 733.2$ Segment EBITDA Margins 17.0% 13.3% 15.4% Adjusted Segment EBITDA Margins 20.3% 13.3% 16.9% Segment Income 246.8$ 76.9$ 0.7$ -$ 324.4$ Non-allocated Expenses - - - (19.0) (19.0) Adjustments, including D&A Adjustments 77.8 1.0 (0.7) 0.7 78.8 Adjusted Segment Income 324.6$ 77.9$ -$ (18.3)$ 384.2$

18 Adjusted Segment Sales, Adjusted Segment EBITDA and Adjusted Segment Income Full Year FY18 ($ in millions, except percentages) Corrugated Packaging Consumer Packaging Land and Development Corporate / Eliminations Consolidated Segment / Net Sales 9,693.0$ 6,617.5$ 142.4$ (167.8)$ 16,285.1$ Less: Recycling Sales (461.6) - - 23.9 (437.7) 9,231.4 6,617.5 142.4 (143.9) 15,847.4 Less: Trade Sales (385.8) - - - (385.8) Adjusted Segment Sales 8,845.6$ 6,617.5$ 142.4$ (143.9)$ 15,461.6$ Segment Income 1,240.0$ 445.1$ 22.5$ -$ 1,707.6$ Non-allocated Expenses - - - (70.1) (70.1) Depreciation and Amortization 700.5 546.5 0.7 4.5 1,252.2 Segment EBITDA 1,940.5 991.6 23.2 (65.6) 2,889.7 Adjustments 16.6 (14.5) (23.2) 3.6 (17.5) Adjusted Segment EBITDA 1,957.1$ 977.1$ -$ (62.0)$ 2,872.2$ Segment EBITDA Margins 20.0% 15.0% 17.7% Adjusted Segment EBITDA Margins 22.1% 14.8% 18.1% Segment Income 1,240.0$ 445.1$ 22.5$ -$ 1,707.6$ Non-allocated Expenses - - - (70.1) (70.1) Adjustments, including D&A Adjustments 43.9 (14.0) (22.5) 3.6 11.0 Adjusted Segment Income 1,283.9$ 431.1$ -$ (66.5)$ 1,648.5$

19 Adjusted Segment Sales, Adjusted Segment EBITDA and Adjusted Segment Income Q1 FY18 ($ in millions, except percentages) Corrugated Packaging Consumer Packaging Land and Development Corporate / Eliminations Consolidated Segment / Net Sales 2,319.7$ 0 1,601.3$ 11.4$ (38.4)$ 3,894.0$ Less: Recycling Sales (121.2) - - 5.2 (116.0) 2,198.5 1,601.3 11.4 (33.2) 3,778.0 Less: Trade Sales (86.4) - - - (86.4) Adjusted Segment Sales 2,112.1$ 1,601.3$ 11.4$ (33.2)$ 3,691.6$ Segment Income (Loss) 269.9$ 94.2$ (0.7)$ -$ 363.4$ Non-allocated Expenses - - - (15.9) (15.9) Depreciation and Amortization 169.4 135.9 0.1 0.8 306.2 Segment EBITDA 439.3 230.1 (0.6) (15.1) 653.7 Adjustments 8.4 4.7 0.6 0.6 14.3 Adjusted Segment EBITDA 447.7$ 234.8$ -$ (14.5)$ 668.0$ Segment EBITDA Margins 18.9% 14.4% 16.8% Adjusted Segment EBITDA Margins 21.2% 14.7% 17.7% Segment Income (Loss) 269.9$ 94.2$ (0.7)$ -$ 363.4$ Non-allocated Expenses - - - (15.9) (15.9) Adjustments, including D&A Adjustments 13.7 5.2 0.7 0.6 20.2 Adjusted Segment Income 283.6$ 99.4$ -$ (15.3)$ 367.7$

20 Adjusted Segment Sales, Adjusted Segment EBITDA and Adjusted Segment Income Q2 FY18 ($ in millions, except percentages) Corrugated Packaging Consumer Packaging Land and Development Corporate / Eliminations Consolidated Segment / Net Sales 2,391.3$ 1,637.3$ 26.7$ (38.3)$ 4,017.0$ Less: Recycling Sales (116.3) - - 6.4 (109.9) 2,275.0 1,637.3 26.7 (31.9) 3,907.1 Less: Trade Sales (83.2) - - - (83.2) Adjusted Segment Sales 2,191.8$ 1,637.3$ 26.7$ (31.9)$ 3,823.9$ Segment Income 262.8$ 94.6$ 16.1$ -$ 373.5$ Non-allocated Expenses - - - (21.4) (21.4) Depreciation and Amortization 177.7 137.6 0.1 0.9 316.3 Segment EBITDA 440.5 232.2 16.2 (20.5) 668.4 Adjustments 4.2 (9.8) (16.2) 2.6 (19.2) Adjusted Segment EBITDA 444.7$ 222.4$ -$ (17.9)$ 649.2$ Segment EBITDA Margins 18.4% 14.2% 16.6% Adjusted Segment EBITDA Margins 20.3% 13.6% 16.6% Segment Income 262.8$ 94.6$ 16.1$ -$ 373.5$ Non-allocated Expenses - - - (21.4) (21.4) Adjustments, including D&A Adjustments 11.6 (9.8) (16.1) 2.6 (11.7) Adjusted Segment Income 274.4$ 84.8$ -$ (18.8)$ 340.4$

21 Adjusted Segment Sales, Adjusted Segment EBITDA and Adjusted Segment Income Q3 FY18 ($ in millions, except percentages) Corrugated Packaging Consumer Packaging Land and Development Corporate / Eliminations Consolidated Segment / Net Sales 2,444.6$ 1,669.6$ 64.8$ (41.5)$ 4,137.5$ Less: Recycling Sales (111.4) - - 5.7 (105.7) 2,333.2 1,669.6 64.8 (35.8) 4,031.8 Less: Trade Sales (97.9) - - - (97.9) Adjusted Segment Sales 2,235.3$ 1,669.6$ 64.8$ (35.8)$ 3,933.9$ Segment Income 321.9$ 126.1$ 9.9$ -$ 457.9$ Non-allocated Expenses - - - (13.0) (13.0) Depreciation and Amortization 177.6 136.1 0.4 1.3 315.4 Segment EBITDA 499.5 262.2 10.3 (11.7) 760.3 Adjustments 3.3 0.1 (10.3) 0.1 (6.8) Adjusted Segment EBITDA 502.8$ 262.3$ -$ (11.6)$ 753.5$ Segment EBITDA Margins 20.4% 15.7% 18.4% Adjusted Segment EBITDA Margins 22.5% 15.7% 18.7% Segment Income 321.9$ 126.1$ 9.9$ -$ 457.9$ Non-allocated Expenses - - - (13.0) (13.0) Adjustments, including D&A Adjustments 10.1 0.1 (9.9) 0.1 0.4 Adjusted Segment Income 332.0$ 126.2$ -$ (12.9)$ 445.3$
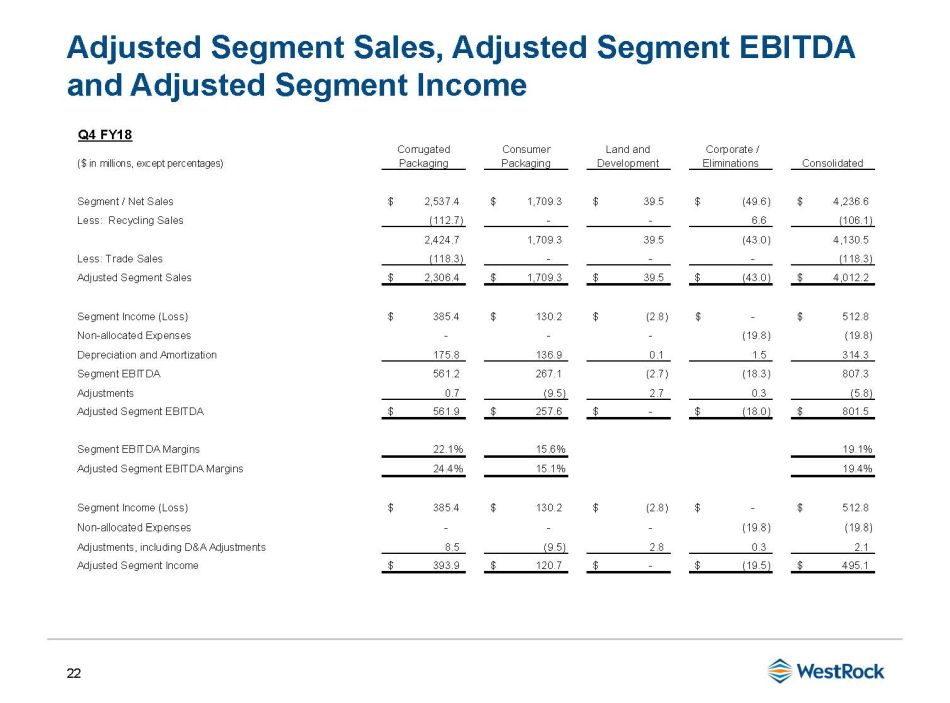
22 Adjusted Segment Sales, Adjusted Segment EBITDA and Adjusted Segment Income Q4 FY18 ($ in millions, except percentages) Corrugated Packaging Consumer Packaging Land and Development Corporate / Eliminations Consolidated Segment / Net Sales 2,537.4$ 1,709.3$ 39.5$ (49.6)$ 4,236.6$ Less: Recycling Sales (112.7) - - 6.6 (106.1) 2,424.7 1,709.3 39.5 (43.0) 4,130.5 Less: Trade Sales (118.3) - - - (118.3) Adjusted Segment Sales 2,306.4$ 1,709.3$ 39.5$ (43.0)$ 4,012.2$ Segment Income (Loss) 385.4$ 130.2$ (2.8)$ -$ 512.8$ Non-allocated Expenses - - - (19.8) (19.8) Depreciation and Amortization 175.8 136.9 0.1 1.5 314.3 Segment EBITDA 561.2 267.1 (2.7) (18.3) 807.3 Adjustments 0.7 (9.5) 2.7 0.3 (5.8) Adjusted Segment EBITDA 561.9$ 257.6$ -$ (18.0)$ 801.5$ Segment EBITDA Margins 22.1% 15.6% 19.1% Adjusted Segment EBITDA Margins 24.4% 15.1% 19.4% Segment Income (Loss) 385.4$ 130.2$ (2.8)$ -$ 512.8$ Non-allocated Expenses - - - (19.8) (19.8) Adjustments, including D&A Adjustments 8.5 (9.5) 2.8 0.3 2.1 Adjusted Segment Income 393.9$ 120.7$ -$ (19.5)$ 495.1$

23 Corrugated Packaging Adjusted Segment EBITDA ($ in millions, except percentages) North American Corrugated Brazil Corrugated Other (1) Corrugated Packaging Segment Sales 2,451.3$ 108.8$ 173.7$ 2,733.8$ Less: Trade Sales (100.0) - - (100.0) Adjusted Segment Sales 2,351.3$ 108.8$ 173.7$ 2,633.8$ Segment Income (Loss) 235.1$ 14.4$ (2.7)$ 246.8$ Depreciation and Amortization 197.0 15.7 5.8 218.5 Segment EBITDA 432.1 30.1 3.1 465.3 Adjustments 62.0 - 6.1 68.1 Adjusted Segment EBITDA 494.1$ 30.1$ 9.2$ 533.4$ Segment EBITDA Margins 17.6% 27.7% 17.0% Adj. Segment EBITDA Margins 21.0% 27.7% 20.3% Q1 FY19 1) The “Other” column includes our Victory Packaging and India corrugated operations.

24 Corrugated Packaging Adjusted Segment EBITDA ($ in millions, except percentages) North American Corrugated Brazil Corrugated Other (1) Corrugated Packaging Segment Sales 8,714.9$ 439.5$ 538.6$ 9,693.0$ Less: Recycling Sales - - (461.6) (461.6) 8,714.9 439.5 77.0 9,231.4 Less: Trade Sales (385.8) - - (385.8) Adjusted Segment Sales 8,329.1$ 439.5$ 77.0$ 8,845.6$ Segment Income 1,179.5$ 54.2$ 6.3$ 1,240.0$ Depreciation and Amortization 625.6 63.5 11.4 700.5 Segment EBITDA 1,805.1 117.7 17.7 1,940.5 Adjustments 14.0 2.7 (0.1) 16.6 Adjusted Segment EBITDA 1,819.1$ 120.4$ 17.6$ 1,957.1$ Segment EBITDA Margins 20.7% 26.8% 20.0% Adj. Segment EBITDA Margins 21.8% 27.4% 22.1% Full Year FY18 1) The “Other” column includes our Recycling and India corrugated operations.

25 Corrugated Packaging Adjusted Segment EBITDA ($ in millions, except percentages) North American Corrugated Brazil Corrugated Other (1) Corrugated Packaging Segment Sales 2,069.2$ 109.9$ 140.6$ 2,319.7$ Less: Recycling Sales - - (121.2) (121.2) 2,069.2 109.9 19.4 2,198.5 Less: Trade Sales (86.4) - - (86.4) Adjusted Segment Sales 1,982.8$ 109.9$ 19.4$ 2,112.1$ Segment Income 254.4$ 11.6$ 3.9$ 269.9$ Depreciation and Amortization 151.0 15.9 2.5 169.4 Segment EBITDA 405.4 27.5 6.4 439.3 Adjustments 9.1 - (0.7) 8.4 Adjusted Segment EBITDA 414.5$ 27.5$ 5.7$ 447.7$ Segment EBITDA Margins 19.6% 25.0% 18.9% Adj. Segment EBITDA Margins 20.9% 25.0% 21.2% Q1 FY18 1) The “Other” column includes our Recycling and India corrugated operations.

26 Corrugated Packaging Adjusted Segment EBITDA ($ in millions, except percentages) North American Corrugated Brazil Corrugated Other (1) Corrugated Packaging Segment Sales 2,143.3$ 112.8$ 135.2$ 2,391.3$ Less: Recycling Sales - - (116.3) (116.3) 2,143.3 112.8 18.9 2,275.0 Less: Trade Sales (83.2) - - (83.2) Adjusted Segment Sales 2,060.1$ 112.8$ 18.9$ 2,191.8$ Segment Income 249.5$ 13.1$ 0.2$ 262.8$ Depreciation and Amortization 158.1 17.1 2.5 177.7 Segment EBITDA 407.6 30.2 2.7 440.5 Adjustments 4.2 - - 4.2 Adjusted Segment EBITDA 411.8$ 30.2$ 2.7$ 444.7$ Segment EBITDA Margins 19.0% 26.8% 18.4% Adj. Segment EBITDA Margins 20.0% 26.8% 20.3% Q2 FY18 1) The “Other” column includes our Recycling and India corrugated operations.
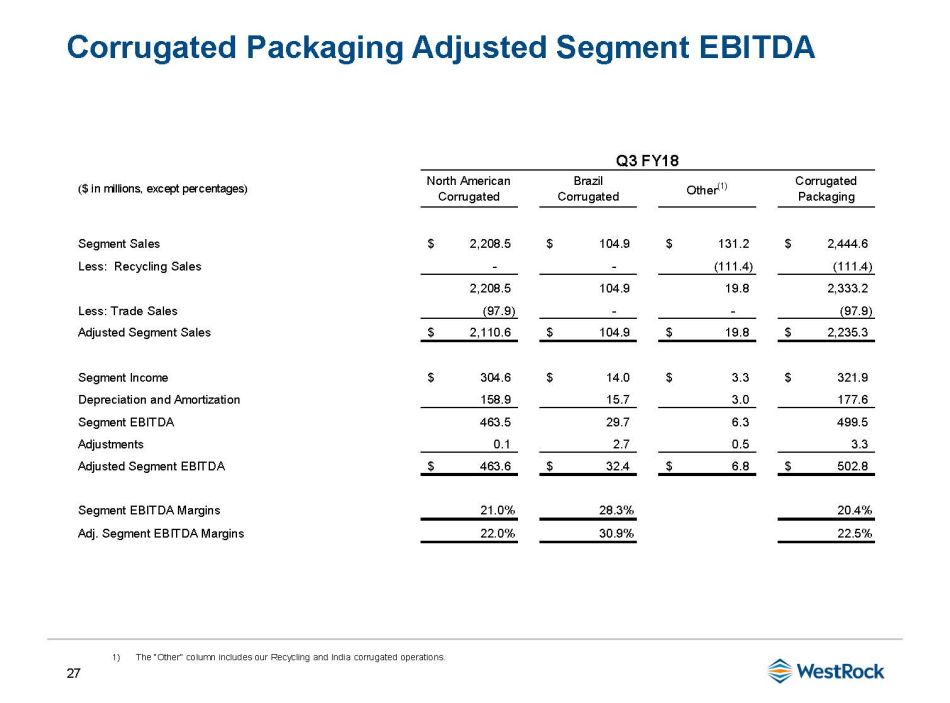
27 Corrugated Packaging Adjusted Segment EBITDA ($ in millions, except percentages) North American Corrugated Brazil Corrugated Other (1) Corrugated Packaging Segment Sales 2,208.5$ 104.9$ 131.2$ 2,444.6$ Less: Recycling Sales - - (111.4) (111.4) 2,208.5 104.9 19.8 2,333.2 Less: Trade Sales (97.9) - - (97.9) Adjusted Segment Sales 2,110.6$ 104.9$ 19.8$ 2,235.3$ Segment Income 304.6$ 14.0$ 3.3$ 321.9$ Depreciation and Amortization 158.9 15.7 3.0 177.6 Segment EBITDA 463.5 29.7 6.3 499.5 Adjustments 0.1 2.7 0.5 3.3 Adjusted Segment EBITDA 463.6$ 32.4$ 6.8$ 502.8$ Segment EBITDA Margins 21.0% 28.3% 20.4% Adj. Segment EBITDA Margins 22.0% 30.9% 22.5% Q3 FY18 1) The “Other” column includes our Recycling and India corrugated operations.

28 Corrugated Packaging Adjusted Segment EBITDA ($ in millions, except percentages) North American Corrugated Brazil Corrugated Other (1) Corrugated Packaging Segment Sales 2,293.9$ 111.9$ 131.6$ 2,537.4$ Less: Recycling Sales - - (112.7) (112.7) 2,293.9 111.9 18.9 2,424.7 Less: Trade Sales (118.3) - - (118.3) Adjusted Segment Sales 2,175.6$ 111.9$ 18.9$ 2,306.4$ Segment Income (Loss) 371.0$ 15.5$ (1.1)$ 385.4$ Depreciation and Amortization 157.6 14.8 3.4 175.8 Segment EBITDA 528.6 30.3 2.3 561.2 Adjustments 0.6 - 0.1 0.7 Adjusted Segment EBITDA 529.2$ 30.3$ 2.4$ 561.9$ Segment EBITDA Margins 23.0% 27.1% 22.1% Adj. Segment EBITDA Margins 24.3% 27.1% 24.4% Q4 FY18 1) The “Other” column includes our Recycling and India corrugated operations.
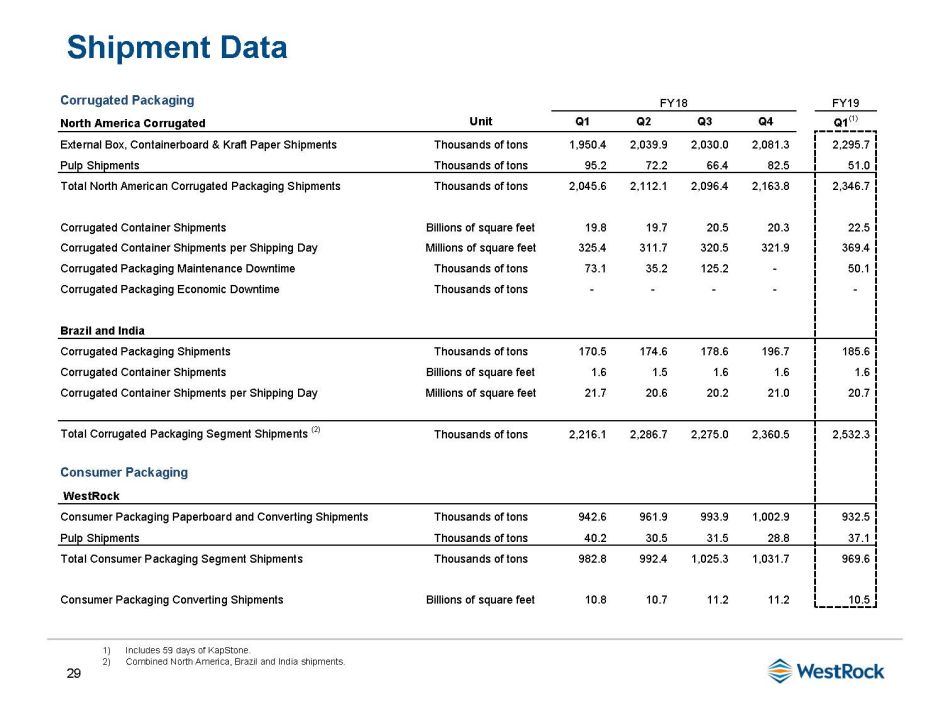
29 Shipment Data 1) Includes 59 days of KapStone. 2) Combined North America, Brazil and India shipments. Corrugated Packaging North America Corrugated Unit Q1 Q2 Q3 Q4 Q1 (1) External Box, Containerboard & Kraft Paper Shipments Thousands of tons 1,950.4 2,039.9 2,030.0 2,081.3 2,295.7 Pulp Shipments Thousands of tons 95.2 72.2 66.4 82.5 51.0 Total North American Corrugated Packaging Shipments Thousands of tons 2,045.6 2,112.1 2,096.4 2,163.8 2,346.7 Corrugated Container Shipments Billions of square feet 19.8 19.7 20.5 20.3 22.5 Corrugated Container Shipments per Shipping Day Millions of square feet 325.4 311.7 320.5 321.9 369.4 Corrugated Packaging Maintenance Downtime Thousands of tons 73.1 35.2 125.2 - 50.1 Corrugated Packaging Economic Downtime Thousands of tons - - - - - Brazil and India Corrugated Packaging Shipments Thousands of tons 170.5 174.6 178.6 196.7 185.6 Corrugated Container Shipments Billions of square feet 1.6 1.5 1.6 1.6 1.6 Corrugated Container Shipments per Shipping Day Millions of square feet 21.7 20.6 20.2 21.0 20.7 Total Corrugated Packaging Segment Shipments (2) Thousands of tons 2,216.1 2,286.7 2,275.0 2,360.5 2,532.3 Consumer Packaging WestRock Consumer Packaging Paperboard and Converting Shipments Thousands of tons 942.6 961.9 993.9 1,002.9 932.5 Pulp Shipments Thousands of tons 40.2 30.5 31.5 28.8 37.1 Total Consumer Packaging Segment Shipments Thousands of tons 982.8 992.4 1,025.3 1,031.7 969.6 Consumer Packaging Converting Shipments Billions of square feet 10.8 10.7 11.2 11.2 10.5 FY18 FY19
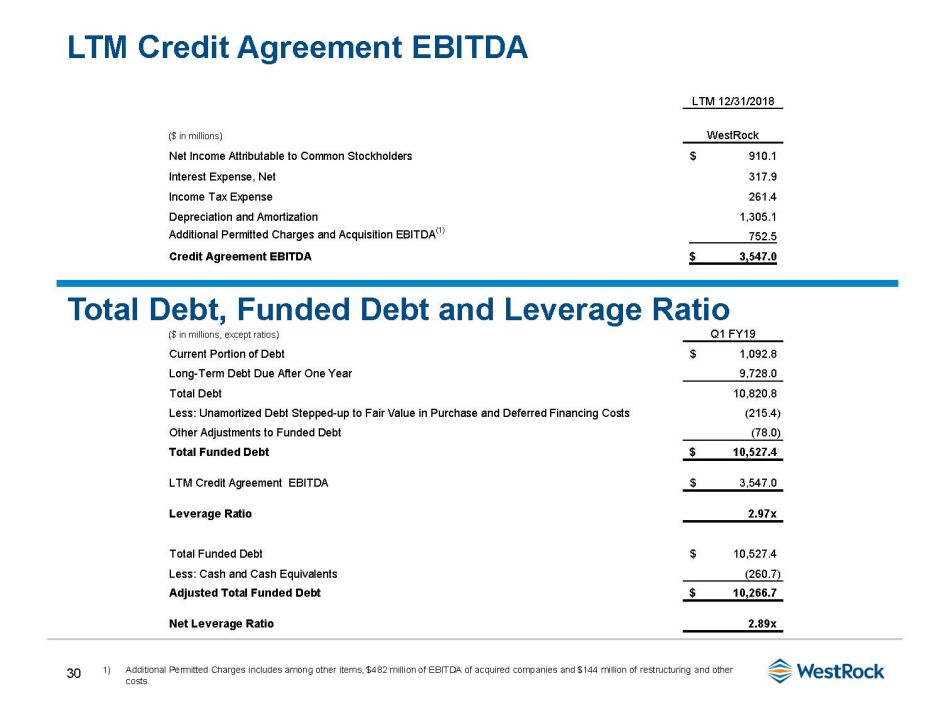
30 LTM Credit Agreement EBITDA 1) Additional Permitted Charges includes among other items, $482 million of EBITDA of acquired companies and $144 million of res tru cturing and other costs. Total Debt, Funded Debt and Leverage Ratio LTM 12/31/2018 ($ in millions) WestRock Net Income Attributable to Common Stockholders 910.1$ Interest Expense, Net 317.9 Income Tax Expense 261.4 Depreciation and Amortization 1,305.1 Additional Permitted Charges and Acquisition EBITDA (1) 752.5 Credit Agreement EBITDA 3,547.0$ ($ in millions, except ratios) Q1 FY19 Current Portion of Debt 1,092.8$ Long-Term Debt Due After One Year 9,728.0 Total Debt 10,820.8 Less: Unamortized Debt Stepped-up to Fair Value in Purchase and Deferred Financing Costs (215.4) Other Adjustments to Funded Debt (78.0) Total Funded Debt 10,527.4$ LTM Credit Agreement EBITDA 3,547.0$ Leverage Ratio 2.97x Total Funded Debt 10,527.4$ Less: Cash and Cash Equivalents (260.7) Adjusted Total Funded Debt 10,266.7$ Net Leverage Ratio 2.89x
