Attached files
| file | filename |
|---|---|
| 8-K - 8-K - GENERAL ELECTRIC CO | ge4q20188-k.htm |
GENERAL ELECTRIC COMPANY | ||||||||||||||||||||||||||||||||||
CONDENSED STATEMENT OF EARNINGS (LOSS) (UNAUDITED) | ||||||||||||||||||||||||||||||||||
Consolidated | GE(a) | Financial Services (GE Capital) | ||||||||||||||||||||||||||||||||
Three months ended December 31 | 2018 | 2017 | V% | 2018 | 2017 | V% | 2018 | 2017 | V% | |||||||||||||||||||||||||
Revenues | ||||||||||||||||||||||||||||||||||
Sales of goods and services | $ | 31,112 | $ | 30,512 | 2 | % | $ | 31,213 | $ | 30,571 | 2 | % | $ | 21 | $ | 29 | (28 | )% | ||||||||||||||||
GE Capital revenues from services | 2,166 | 1,091 | — | — | 2,455 | 1,516 | ||||||||||||||||||||||||||||
Total revenues | 33,278 | 31,603 | 5 | % | 31,213 | 30,571 | 2 | % | 2,476 | 1,545 | 60 | % | ||||||||||||||||||||||
Costs and expenses | ||||||||||||||||||||||||||||||||||
Cost of sales | 25,876 | 25,358 | 25,475 | 24,900 | 532 | 546 | ||||||||||||||||||||||||||||
Selling, general and administrative expenses | 4,565 | 4,389 | 4,329 | 4,207 | 354 | 316 | ||||||||||||||||||||||||||||
Interest and other financial charges | 1,252 | 1,324 | 714 | 834 | 686 | 772 | ||||||||||||||||||||||||||||
Investment contracts, insurance losses and | ||||||||||||||||||||||||||||||||||
insurance annuity benefits | 782 | 10,260 | — | — | 777 | 10,255 | ||||||||||||||||||||||||||||
Goodwill impairments | 162 | 1,603 | 162 | 217 | — | 1,386 | ||||||||||||||||||||||||||||
Non-operating benefit costs | 589 | 576 | 586 | 574 | 3 | 2 | ||||||||||||||||||||||||||||
Other costs and expenses | 178 | 498 | — | — | 231 | 357 | ||||||||||||||||||||||||||||
Total costs and expenses | 33,404 | 44,008 | (24 | )% | 31,266 | 30,732 | 2 | % | 2,584 | 13,634 | (81 | )% | ||||||||||||||||||||||
Other income | 984 | (566 | ) | 1,018 | (722 | ) | — | — | ||||||||||||||||||||||||||
GE Capital earnings (loss) from continuing operations | — | — | (86 | ) | (6,569 | ) | — | — | ||||||||||||||||||||||||||
Earnings (loss) from continuing operations | ||||||||||||||||||||||||||||||||||
before income taxes | 858 | (12,971 | ) | F | 880 | (7,452 | ) | F | (107 | ) | (12,088 | ) | 99 | % | ||||||||||||||||||||
Benefit (provision) for income taxes | 94 | 1,918 | (115 | ) | (3,784 | ) | 209 | 5,702 | ||||||||||||||||||||||||||
Earnings (loss) from continuing operations | 952 | (11,053 | ) | F | 765 | (11,237 | ) | F | 102 | (6,386 | ) | F | ||||||||||||||||||||||
Earnings (loss) from discontinued | ||||||||||||||||||||||||||||||||||
operations, net of taxes | (92 | ) | 182 | (92 | ) | 182 | (91 | ) | 182 | |||||||||||||||||||||||||
Net earnings (loss) | 860 | (10,872 | ) | F | 673 | (11,055 | ) | F | 10 | (6,204 | ) | F | ||||||||||||||||||||||
Less net earnings (loss) attributable to | ||||||||||||||||||||||||||||||||||
noncontrolling interests | 99 | (53 | ) | 99 | (52 | ) | — | (1 | ) | |||||||||||||||||||||||||
Net earnings (loss) attributable to the Company | 761 | (10,818 | ) | F | 574 | (11,003 | ) | F | 10 | (6,203 | ) | F | ||||||||||||||||||||||
Preferred stock dividends | (187 | ) | (184 | ) | — | — | (187 | ) | (184 | ) | ||||||||||||||||||||||||
Net earnings (loss) attributable to | ||||||||||||||||||||||||||||||||||
GE common shareowners | $ | 574 | $ | (11,003 | ) | F | $ | 574 | $ | (11,003 | ) | F | $ | (177 | ) | $ | (6,388 | ) | (97 | )% | ||||||||||||||
Amounts attributable to GE common shareowners: | ||||||||||||||||||||||||||||||||||
Earnings (loss) from continuing operations | $ | 952 | $ | (11,053 | ) | F | $ | 765 | $ | (11,237 | ) | F | $ | 102 | $ | (6,386 | ) | F | ||||||||||||||||
Less net earnings (loss) attributable | ||||||||||||||||||||||||||||||||||
to noncontrolling interests, continuing operations | 99 | (53 | ) | 99 | (52 | ) | — | (1 | ) | |||||||||||||||||||||||||
Earnings (loss) from continuing operations | ||||||||||||||||||||||||||||||||||
attributable to the Company | 853 | (11,000 | ) | F | 666 | (11,184 | ) | F | 101 | (6,385 | ) | F | ||||||||||||||||||||||
Preferred stock dividends | (187 | ) | (184 | ) | — | — | (187 | ) | (184 | ) | ||||||||||||||||||||||||
Earnings (loss) from continuing operations | ||||||||||||||||||||||||||||||||||
attributable to GE common shareowners | 666 | (11,184 | ) | F | 666 | (11,184 | ) | F | (86 | ) | (6,569 | ) | 99 | % | ||||||||||||||||||||
Earnings (loss) from discontinued | ||||||||||||||||||||||||||||||||||
operations, net of taxes | (92 | ) | 182 | (92 | ) | 182 | (91 | ) | 182 | |||||||||||||||||||||||||
Less net earnings (loss) attributable to | ||||||||||||||||||||||||||||||||||
noncontrolling interests, discontinued operations | — | — | — | — | — | — | ||||||||||||||||||||||||||||
Net earnings (loss) attributable to GE | ||||||||||||||||||||||||||||||||||
common shareowners | $ | 574 | $ | (11,003 | ) | F | $ | 574 | $ | (11,003 | ) | F | $ | (177 | ) | $ | (6,388 | ) | 97 | % | ||||||||||||||
Per-share amounts - earnings (loss) from | ||||||||||||||||||||||||||||||||||
continuing operations | ||||||||||||||||||||||||||||||||||
Diluted earnings (loss) per share | $ | 0.08 | $ | (1.29 | ) | F | ||||||||||||||||||||||||||||
Basic earnings (loss) per share | $ | 0.08 | $ | (1.29 | ) | F | ||||||||||||||||||||||||||||
Per-share amounts - net earnings (loss) | ||||||||||||||||||||||||||||||||||
Diluted earnings (loss) per share | $ | 0.07 | $ | (1.27 | ) | F | ||||||||||||||||||||||||||||
Basic earnings (loss) per share | $ | 0.07 | $ | (1.27 | ) | F | ||||||||||||||||||||||||||||
Total average equivalent shares | ||||||||||||||||||||||||||||||||||
Diluted | 8,701 | 8,676 | — | % | ||||||||||||||||||||||||||||||
Basic | 8,700 | 8,676 | — | % | ||||||||||||||||||||||||||||||
Dividends declared per common share | $ | 0.01 | $ | 0.12 | (92 | )% | ||||||||||||||||||||||||||||
(a) Represents the adding together of all affiliated companies except GE Capital, which is presented on a one-line basis.
Amounts may not add due to rounding. Dollar amounts and share amounts in millions; per-share amounts in dollars.
"GE Capital" means GE Capital Global Holdings, LLC (GECGH) and all of their affiliates and associated companies. Separate information is shown for "GE" and "Financial Services (GE Capital)." Transactions between GE and GE Capital have been eliminated from the "Consolidated" column. See Note 1 to the 2017 consolidated financial statements at www.ge.com/ar2017 for further information about consolidation matters.
4
GENERAL ELECTRIC COMPANY | |||||||||||||||||||||||||||||||||
CONDENSED STATEMENT OF EARNINGS (LOSS) (UNAUDITED) | |||||||||||||||||||||||||||||||||
Consolidated | GE(a) | Financial Services (GE Capital) | |||||||||||||||||||||||||||||||
Twelve months ended December 31 | 2018 | 2017 | V% | 2018 | 2017 | V% | 2018 | 2017 | V% | ||||||||||||||||||||||||
Revenues | |||||||||||||||||||||||||||||||||
Sales of goods and services | $ | 113,543 | $ | 110,968 | 2 | % | $ | 113,642 | $ | 111,255 | 2 | % | $ | 121 | $ | 130 | (7 | )% | |||||||||||||||
GE Capital revenues from services | 8,072 | 7,276 | — | — | 9,430 | 8,940 | |||||||||||||||||||||||||||
Total revenues | 121,615 | 118,243 | 3 | % | 113,642 | 111,255 | 2 | % | 9,551 | 9,070 | 5 | % | |||||||||||||||||||||
Costs and expenses | |||||||||||||||||||||||||||||||||
Cost of sales | 92,671 | 90,883 | 90,729 | 89,001 | 2,183 | 2,298 | |||||||||||||||||||||||||||
Selling, general and administrative expenses | 18,111 | 17,569 | 17,319 | 16,406 | 1,341 | 1,662 | |||||||||||||||||||||||||||
Interest and other financial charges | 5,059 | 4,869 | 2,708 | 2,753 | 2,982 | 3,145 | |||||||||||||||||||||||||||
Investment contracts, insurance losses and | |||||||||||||||||||||||||||||||||
insurance annuity benefits | 2,790 | 12,168 | — | — | 2,849 | 12,213 | |||||||||||||||||||||||||||
Goodwill impairments | 22,136 | 2,550 | 22,136 | 1,165 | — | 1,386 | |||||||||||||||||||||||||||
Non-operating benefit costs | 2,777 | 2,399 | 2,764 | 2,385 | 12 | 14 | |||||||||||||||||||||||||||
Other costs and expenses | 464 | 1,082 | — | — | 558 | 986 | |||||||||||||||||||||||||||
Total costs and expenses | 144,008 | 131,520 | 9 | % | 135,656 | 111,710 | 21 | % | 9,926 | 21,703 | (54 | )% | |||||||||||||||||||||
Other income | 2,259 | 2,126 | 2,255 | 1,937 | — | — | |||||||||||||||||||||||||||
GE Capital earnings (loss) from continuing operations | — | — | (489 | ) | (6,765 | ) | — | — | |||||||||||||||||||||||||
Earnings (loss) from continuing operations | |||||||||||||||||||||||||||||||||
before income taxes | (20,134 | ) | (11,151 | ) | (81 | )% | (20,248 | ) | (5,282 | ) | U | (375 | ) | (12,633 | ) | 97 | % | ||||||||||||||||
Benefit (provision) for income taxes | (583 | ) | 2,611 | (957 | ) | (3,691 | ) | 374 | 6,302 | ||||||||||||||||||||||||
Earnings (loss) from continuing operations | (20,717 | ) | (8,540 | ) | U | (21,205 | ) | (8,973 | ) | U | (1 | ) | (6,331 | ) | F | ||||||||||||||||||
Earnings (loss) from discontinued | |||||||||||||||||||||||||||||||||
operations, net of taxes | (1,726 | ) | (309 | ) | (1,726 | ) | (315 | ) | (1,670 | ) | (312 | ) | |||||||||||||||||||||
Net earnings (loss) | (22,443 | ) | (8,849 | ) | U | (22,931 | ) | (9,288 | ) | U | (1,672 | ) | (6,643 | ) | 75 | % | |||||||||||||||||
Less net earnings (loss) attributable to | |||||||||||||||||||||||||||||||||
noncontrolling interests | (89 | ) | (365 | ) | (129 | ) | (368 | ) | 40 | 4 | |||||||||||||||||||||||
Net earnings (loss) attributable to the Company | (22,355 | ) | (8,484 | ) | U | (22,802 | ) | (8,920 | ) | U | (1,712 | ) | (6,647 | ) | 74 | % | |||||||||||||||||
Preferred stock dividends | (447 | ) | (436 | ) | — | — | (447 | ) | (436 | ) | |||||||||||||||||||||||
Net earnings (loss) attributable to | |||||||||||||||||||||||||||||||||
GE common shareowners | $ | (22,802 | ) | $ | (8,920 | ) | U | $ | (22,802 | ) | $ | (8,920 | ) | U | $ | (2,159 | ) | $ | (7,083 | ) | 70 | % | |||||||||||
Amounts attributable to GE common shareowners: | |||||||||||||||||||||||||||||||||
Earnings (loss) from continuing operations | $ | (20,717 | ) | $ | (8,540 | ) | U | $ | (21,205 | ) | $ | (8,973 | ) | U | $ | (1 | ) | $ | (6,331 | ) | F | ||||||||||||
Less net earnings (loss) attributable | |||||||||||||||||||||||||||||||||
to noncontrolling interests, continuing operations | (89 | ) | (371 | ) | (129 | ) | (368 | ) | 40 | (3 | ) | ||||||||||||||||||||||
Earnings (loss) from continuing operations | |||||||||||||||||||||||||||||||||
attributable to the Company | (20,629 | ) | (8,169 | ) | U | (21,076 | ) | (8,605 | ) | U | (42 | ) | (6,328 | ) | 99 | % | |||||||||||||||||
Preferred stock dividends | (447 | ) | (436 | ) | — | — | (447 | ) | (436 | ) | |||||||||||||||||||||||
Earnings (loss) from continuing operations | |||||||||||||||||||||||||||||||||
attributable to GE common shareowners | (21,076 | ) | (8,605 | ) | U | (21,076 | ) | (8,605 | ) | U | (489 | ) | (6,765 | ) | 93 | % | |||||||||||||||||
Earnings (loss) from discontinued | |||||||||||||||||||||||||||||||||
operations, net of taxes | (1,726 | ) | (309 | ) | (1,726 | ) | (315 | ) | (1,670 | ) | (312 | ) | |||||||||||||||||||||
Less net earnings (loss) attributable to | |||||||||||||||||||||||||||||||||
noncontrolling interests, discontinued operations | — | 6 | — | — | — | 6 | |||||||||||||||||||||||||||
Net earnings (loss) attributable to GE | |||||||||||||||||||||||||||||||||
common shareowners | $ | (22,802 | ) | $ | (8,920 | ) | U | $ | (22,802 | ) | $ | (8,920 | ) | U | $ | (2,159 | ) | $ | (7,083 | ) | 70 | % | |||||||||||
Per-share amounts - earnings (loss) from | |||||||||||||||||||||||||||||||||
continuing operations | |||||||||||||||||||||||||||||||||
Diluted earnings (loss) per share | $ | (2.43 | ) | $ | (0.99 | ) | U | ||||||||||||||||||||||||||
Basic earnings (loss) per share | $ | (2.43 | ) | $ | (0.99 | ) | U | ||||||||||||||||||||||||||
Per-share amounts - net earnings (loss) | |||||||||||||||||||||||||||||||||
Diluted earnings (loss) per share | $ | (2.62 | ) | $ | (1.03 | ) | U | ||||||||||||||||||||||||||
Basic earnings (loss) per share | $ | (2.62 | ) | $ | (1.03 | ) | U | ||||||||||||||||||||||||||
Total average equivalent shares | |||||||||||||||||||||||||||||||||
Diluted | 8,691 | 8,687 | — | % | |||||||||||||||||||||||||||||
Basic | 8,691 | 8,687 | — | % | |||||||||||||||||||||||||||||
Dividends declared per common share | $ | 0.37 | $ | 0.84 | (56 | )% | |||||||||||||||||||||||||||
(a) Represents the adding together of all affiliated companies except GE Capital, which is presented on a one-line basis.
Amounts may not add due to rounding. Dollar amounts and share amounts in millions; per-share amounts in dollars.
"GE Capital" means GE Capital Global Holdings, LLC (GECGH) and all of their affiliates and associated companies. Separate information is shown for "GE" and "Financial Services (GE Capital)." Transactions between GE and GE Capital have been eliminated from the "Consolidated" column. See Note 1 to the 2017 consolidated financial statements at www.ge.com/ar2017 for further information about consolidation matters.
5
GENERAL ELECTRIC COMPANY | ||||||||||||||||||||||
SUMMARY OF OPERATING SEGMENTS (UNAUDITED) | ||||||||||||||||||||||
Three months ended December 31 | Twelve months ended December 31 | |||||||||||||||||||||
(Dollars in millions) | 2018 | 2017 | V% | 2018 | 2017 | V% | ||||||||||||||||
Revenues(a) | ||||||||||||||||||||||
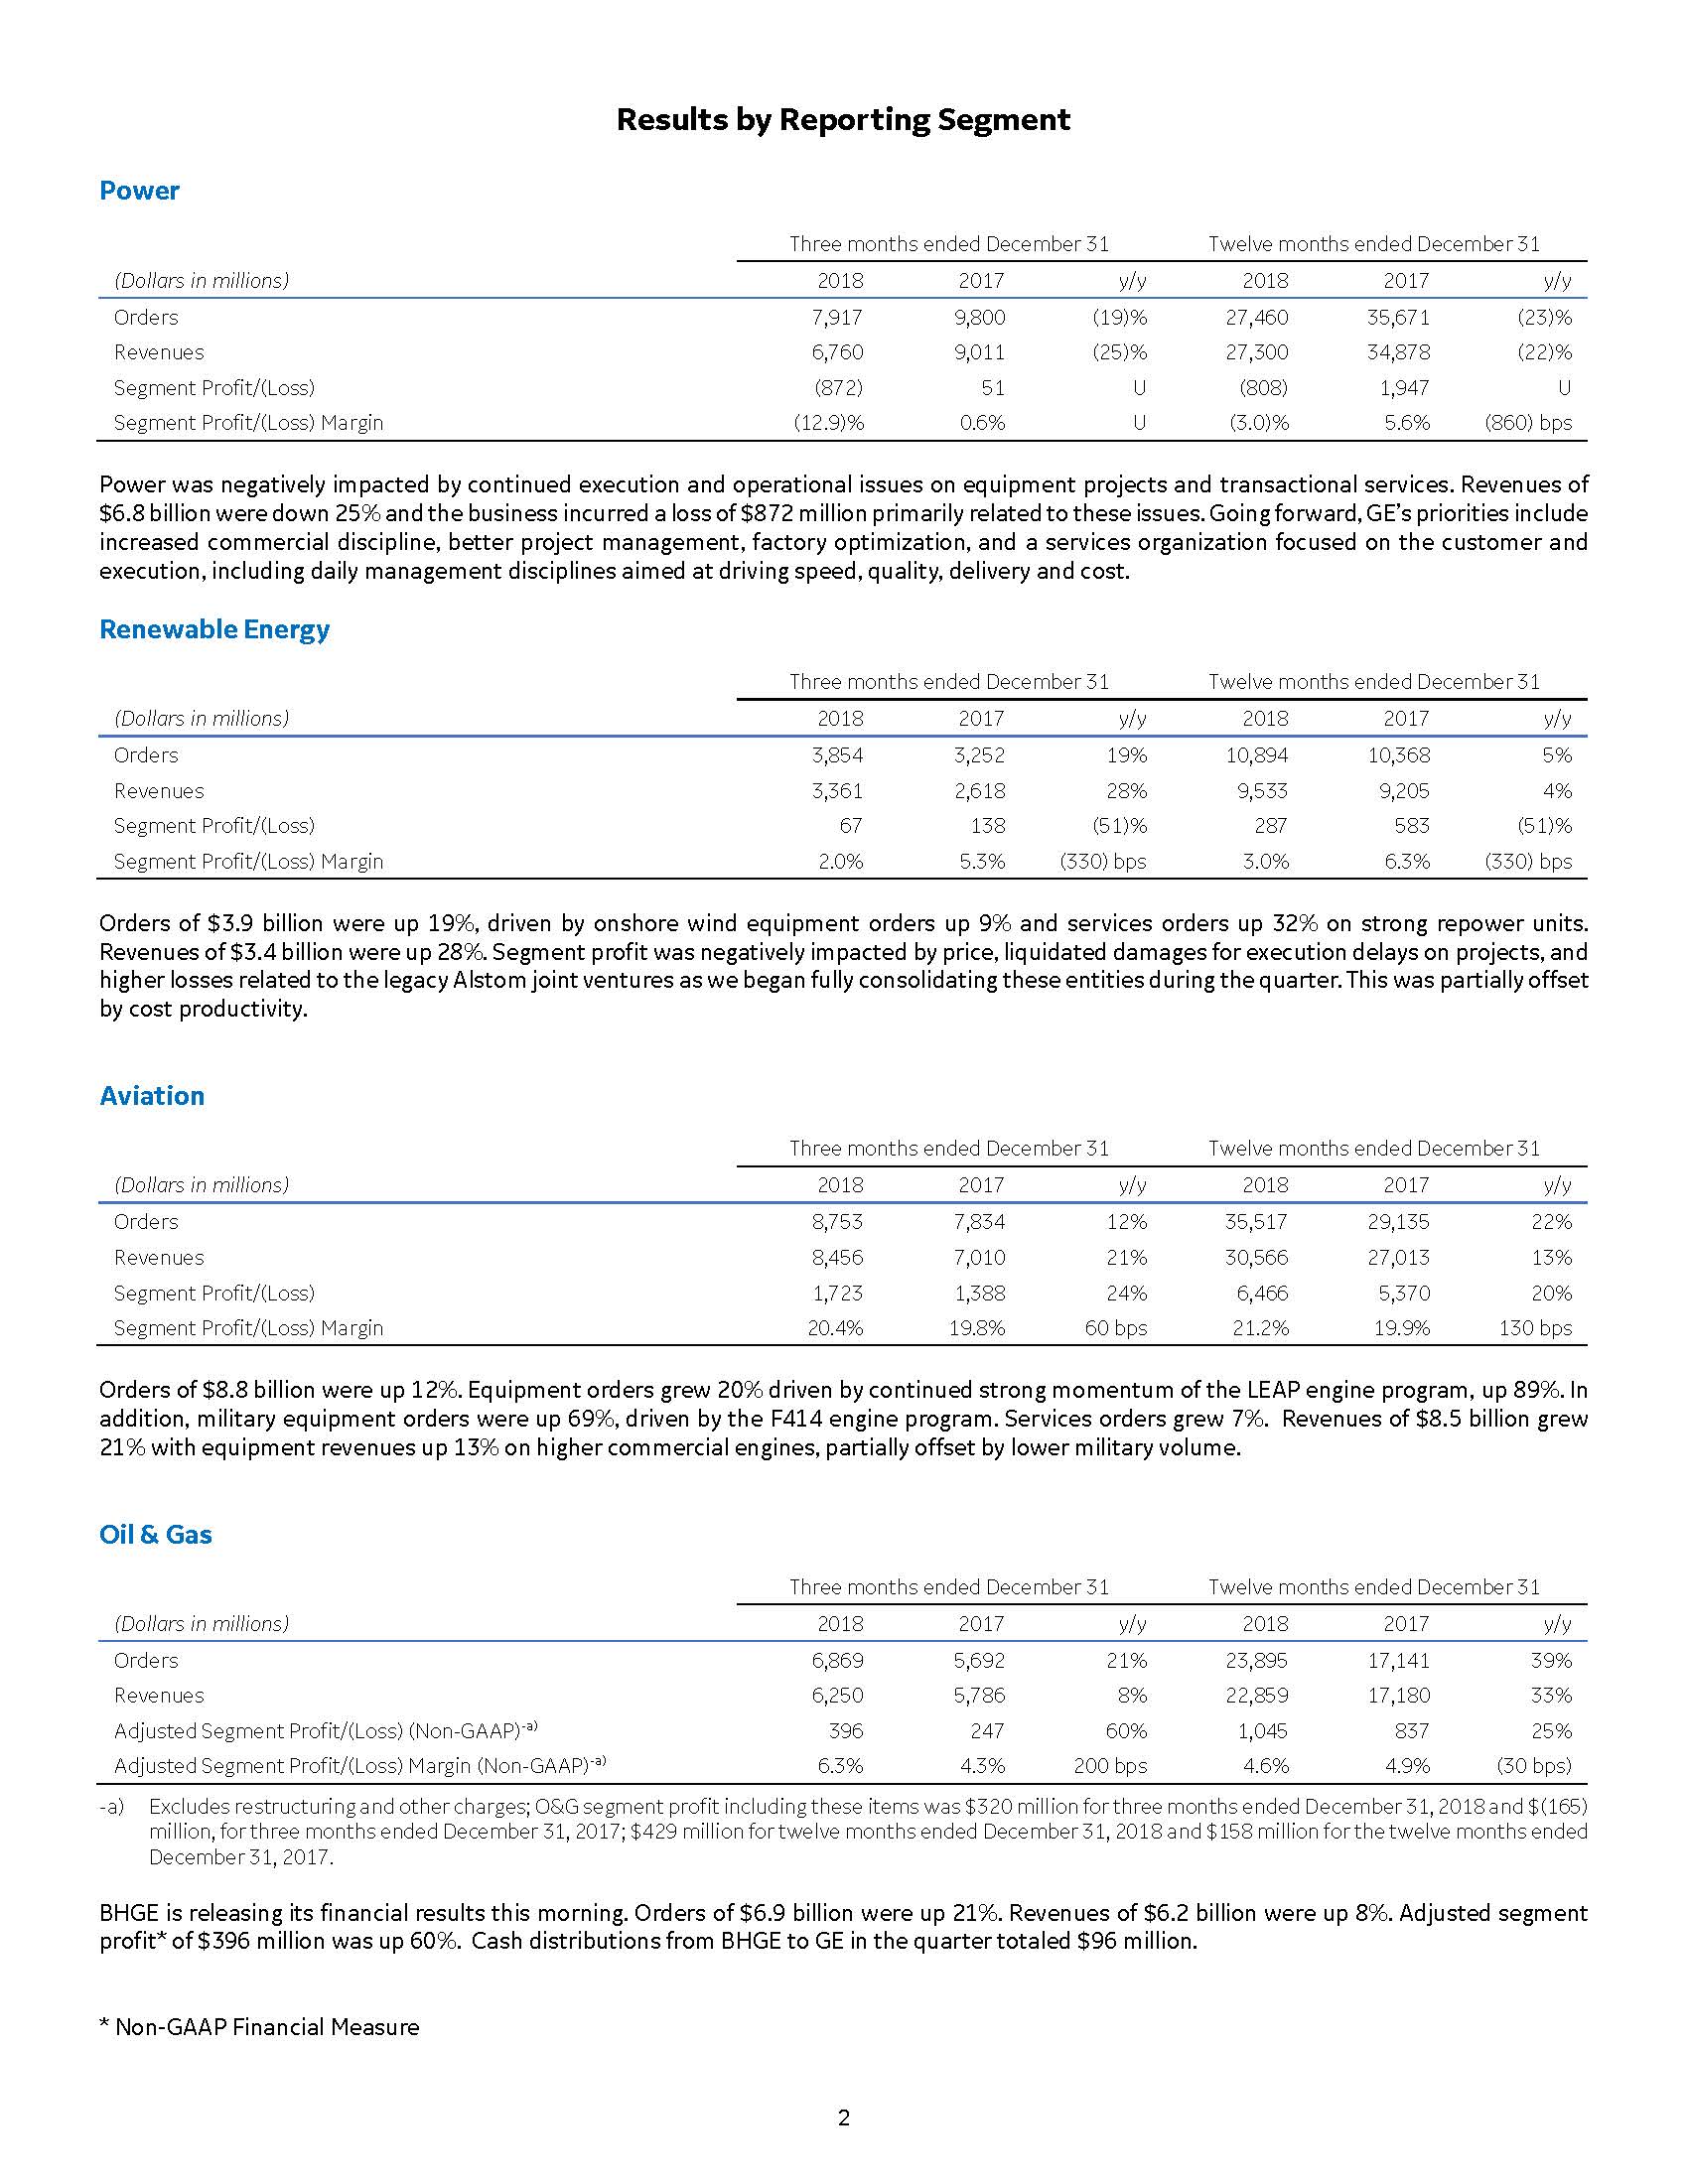
Power | $ | 6,760 | $ | 9,011 | (25 | )% | $ | 27,300 | $ | 34,878 | (22 | )% | ||||||||||
Renewable Energy | 3,361 | 2,618 | 28 | % | 9,533 | 9,205 | 4 | % | ||||||||||||||
Aviation | 8,456 | 7,010 | 21 | % | 30,566 | 27,013 | 13 | % | ||||||||||||||
Oil & Gas | 6,250 | 5,786 | 8 | % | 22,859 | 17,180 | 33 | % | ||||||||||||||
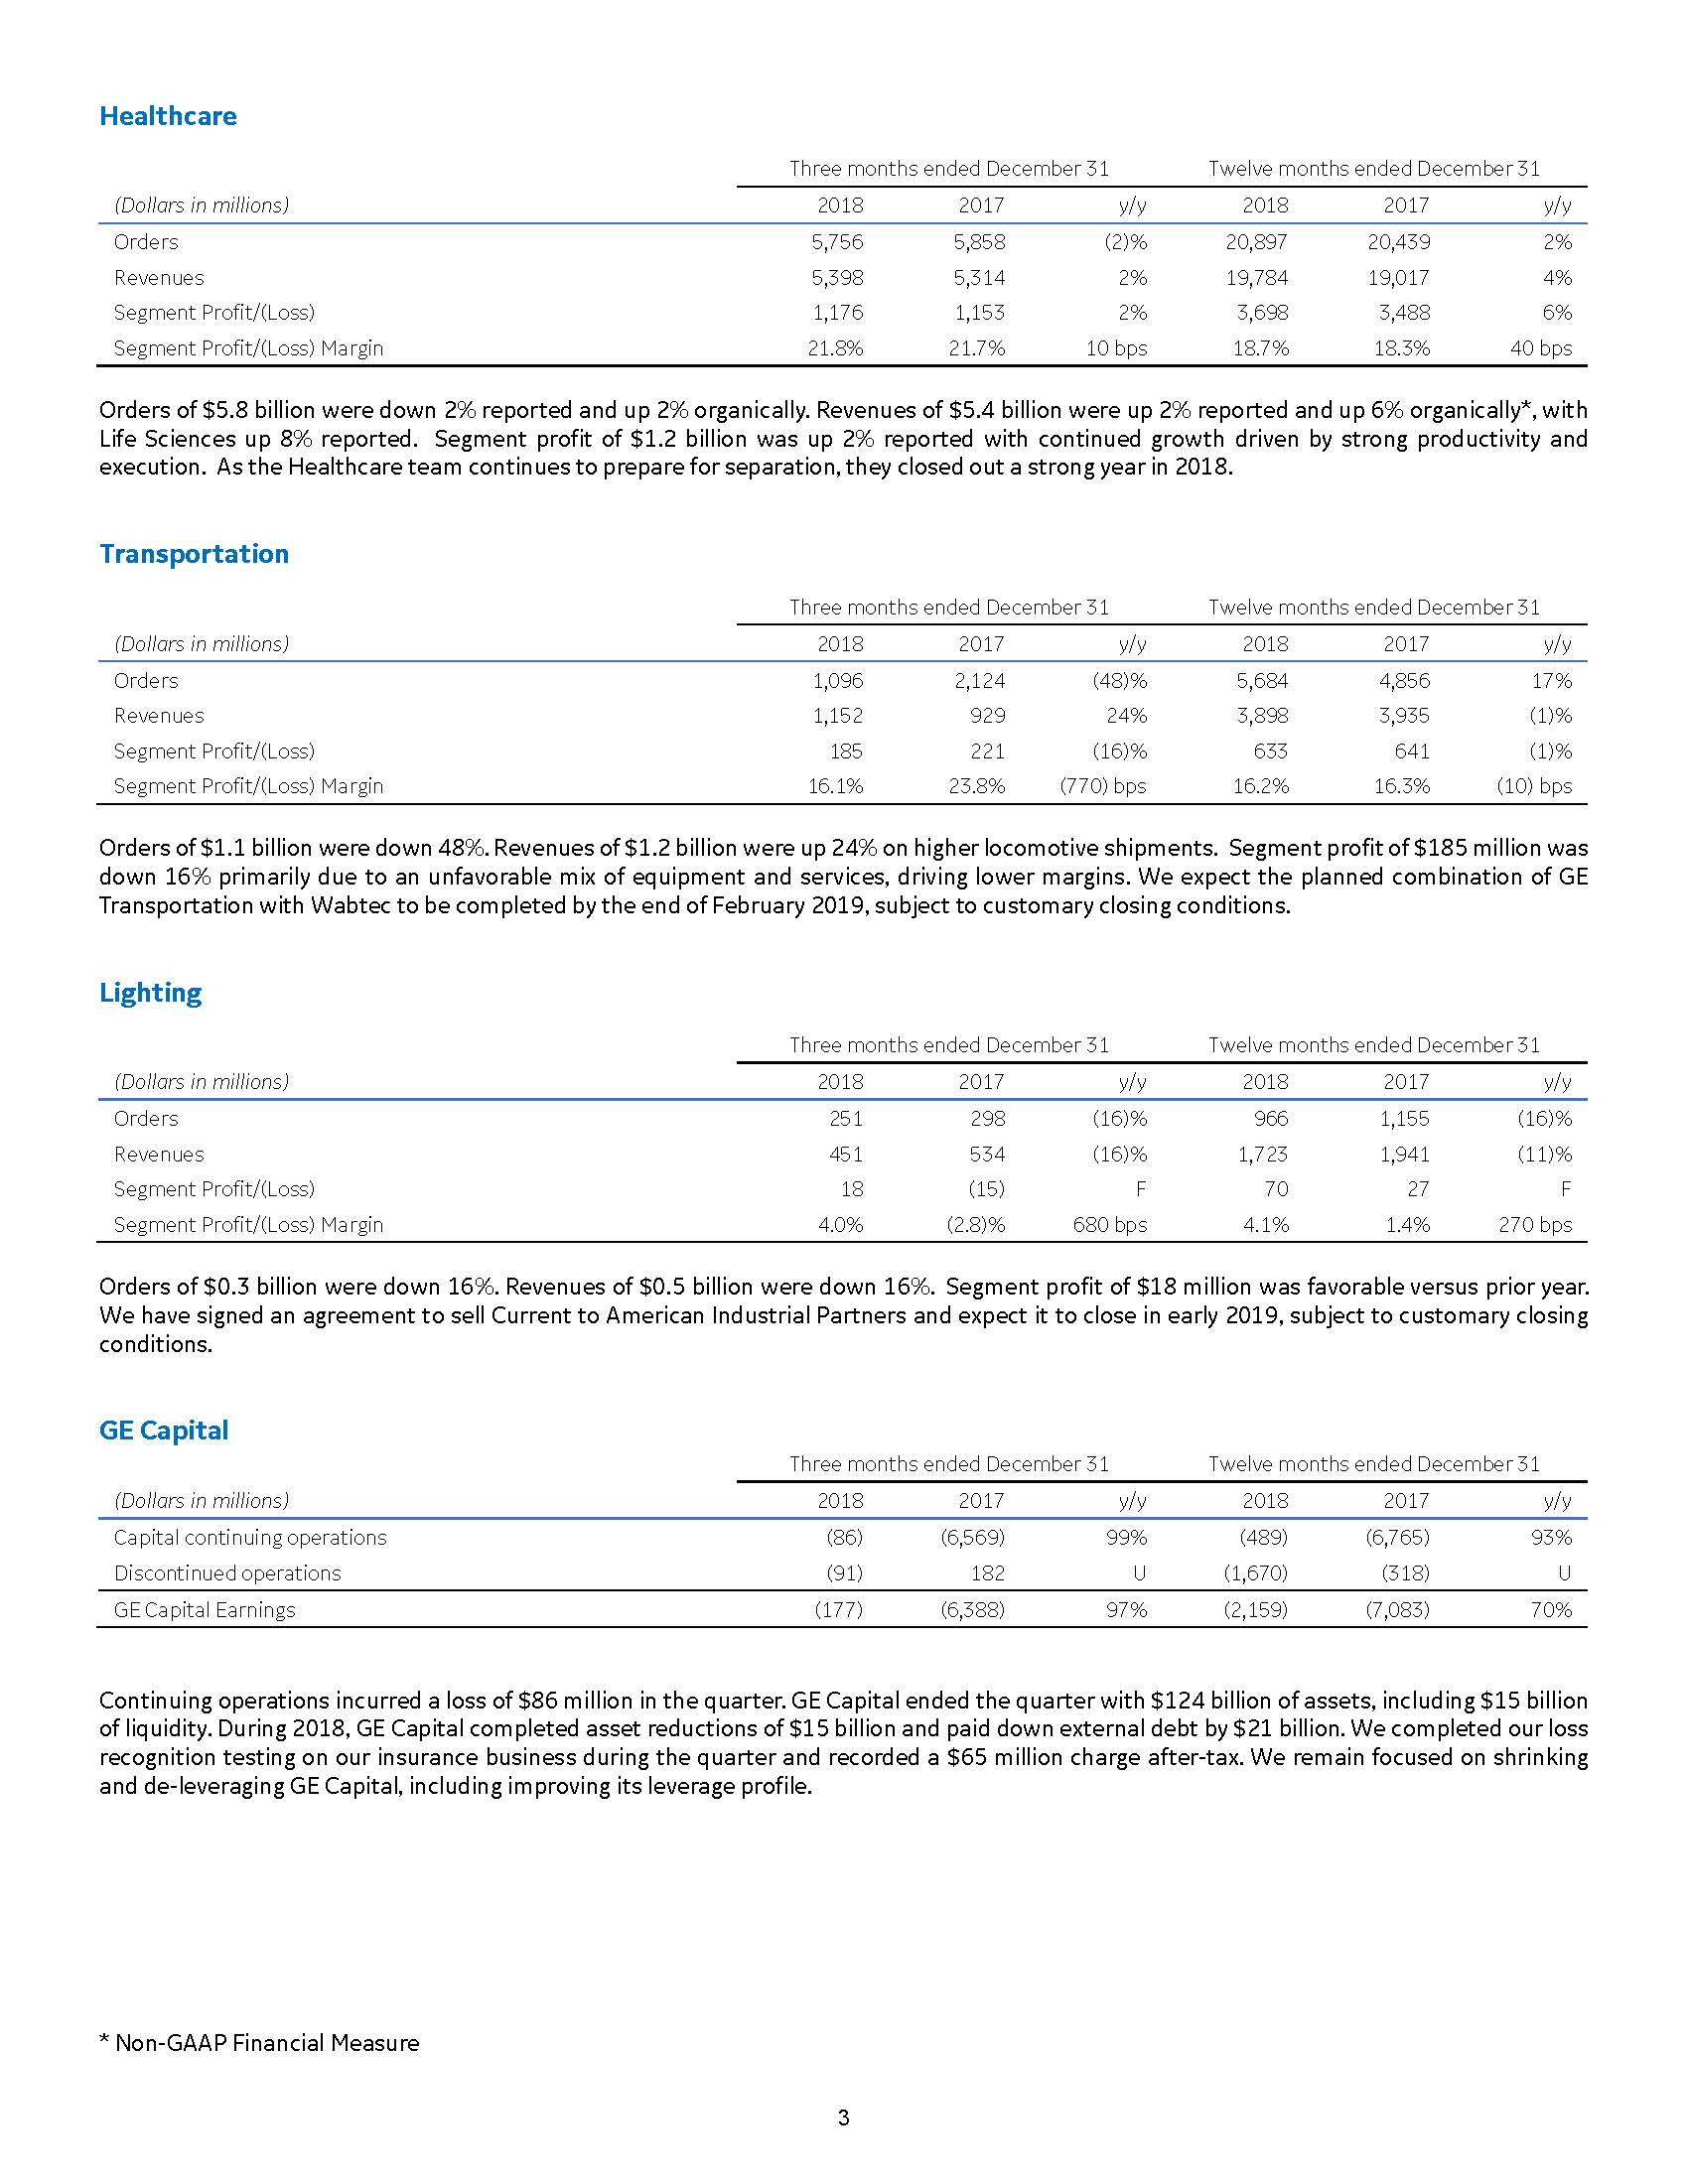
Healthcare | 5,398 | 5,314 | 2 | % | 19,784 | 19,017 | 4 | % | ||||||||||||||
Transportation | 1,152 | 929 | 24 | % | 3,898 | 3,935 | (1 | )% | ||||||||||||||
Lighting | 451 | 534 | (16 | )% | 1,723 | 1,941 | (11 | )% | ||||||||||||||
Total industrial segment revenues | 31,827 | 31,202 | 2 | % | 115,664 | 113,168 | 2 | % | ||||||||||||||
Capital | 2,476 | 1,545 | 60 | % | 9,551 | 9,070 | 5 | % | ||||||||||||||
Total segment revenues | 34,303 | 32,747 | 5 | % | 125,215 | 122,239 | 2 | % | ||||||||||||||
Corporate items and eliminations(a) | (1,025 | ) | (1,144 | ) | 10 | % | (3,600 | ) | (3,995 | ) | 10 | % | ||||||||||
Consolidated revenues | $ | 33,278 | $ | 31,603 | 5 | % | $ | 121,615 | $ | 118,243 | 3 | % | ||||||||||
Segment profit (loss)(a) | ||||||||||||||||||||||
Power | $ | (872 | ) | $ | 51 | U | $ | (808 | ) | $ | 1,947 | U | ||||||||||
Renewable Energy | 67 | 138 | (51 | )% | 287 | 583 | (51 | )% | ||||||||||||||
Aviation | 1,723 | 1,388 | 24 | % | 6,466 | 5,370 | 20 | % | ||||||||||||||
Oil & Gas | 320 | (165 | ) | F | 429 | 158 | F | |||||||||||||||
Healthcare | 1,176 | 1,153 | 2 | % | 3,698 | 3,488 | 6 | % | ||||||||||||||
Transportation | 185 | 221 | (16 | )% | 633 | 641 | (1 | )% | ||||||||||||||
Lighting | 18 | (15 | ) | F | 70 | 27 | F | |||||||||||||||
Total industrial segment profit | 2,617 | 2,772 | (6 | )% | 10,774 | 12,213 | (12 | )% | ||||||||||||||
Capital | (86 | ) | (6,569 | ) | 99 | % | (489 | ) | (6,765 | ) | 93 | % | ||||||||||
Total segment profit (loss) | 2,531 | (3,798 | ) | F | 10,285 | 5,448 | 89 | % | ||||||||||||||
Corporate items and eliminations(a) | (288 | ) | (1,977 | ) | 85 | % | (2,796 | ) | (4,060 | ) | 31 | % | ||||||||||
GE goodwill impairments | (162 | ) | (217 | ) | 25 | % | (22,136 | ) | (1,165 | ) | U | |||||||||||
GE interest and other financial charges | (714 | ) | (834 | ) | 14 | % | (2,708 | ) | (2,753 | ) | 2 | % | ||||||||||
GE non-operating benefit costs | (586 | ) | (574 | ) | (2 | )% | (2,764 | ) | (2,385 | ) | (16 | )% | ||||||||||
GE benefit (provision) for income taxes | (115 | ) | (3,784 | ) | 97 | % | (957 | ) | (3,691 | ) | 74 | % | ||||||||||
Earnings (loss) from continuing operations | ||||||||||||||||||||||
attributable to GE common shareowners | 666 | (11,184 | ) | F | (21,076 | ) | (8,605 | ) | U | |||||||||||||
Earnings (loss) from discontinued operations, | ||||||||||||||||||||||
net of taxes | (92 | ) | 182 | U | (1,726 | ) | (309 | ) | U | |||||||||||||
Less net earnings attributable to | ||||||||||||||||||||||
noncontrolling interests, discontinued operations | — | — | — | % | — | 6 | U | |||||||||||||||
Earnings (loss) from discontinued operations, | ||||||||||||||||||||||
net of tax and noncontrolling interests | (92 | ) | 182 | U | (1,726 | ) | (315 | ) | U | |||||||||||||
Consolidated net earnings (loss) | ||||||||||||||||||||||
attributable to GE common shareowners | $ | 574 | $ | (11,003 | ) | F | $ | (22,802 | ) | $ | (8,920 | ) | U | |||||||||
(a) | Segment revenues include sales of products and services related to the segment. Segment profit excludes results reported as discontinued operations and material accounting changes other than those applied retrospectively, goodwill impairment, restructuring and other charges (with the exception of Oil & Gas), the portion of earnings or loss attributable to noncontrolling interests of consolidated subsidiaries, and as such only includes the portion of earnings or loss attributable to our share of the consolidated earnings or loss of consolidated subsidiaries. Segment profit excludes or includes interest and other financial charges, non-operating benefit costs, income taxes, and preferred stock dividends according to how a particular segment's management is measured – excluded in determining segment profit for Power, Renewable Energy, Aviation, Oil & Gas, Healthcare, Transportation and Lighting; included in determining segment profit, which we sometimes refer to as "net earnings," for Capital. Other income is included in segment profit for the industrial segments. Certain corporate costs, such as shared services, employee benefits and information technology are allocated to our segments based on usage. A portion of the remaining corporate costs is allocated based on each segment's relative net cost of operations. Industrial segment revenues and profit include the sum of our seven industrial reporting segments without giving effect to the elimination of transactions among such segments and between these segments and our financial services segment. Total segment revenues and profit include the sum of our seven industrial segments and one financial services segment, without giving effect to the elimination of transactions among such segments. We believe that this provides investors with a view as to the results of all of our segments, without inter-segment eliminations and corporate items. |
Amounts may not add due to rounding
6
GENERAL ELECTRIC COMPANY | ||||||||||||||||||||||||
CONDENSED STATEMENT OF FINANCIAL POSITION (UNAUDITED) | ||||||||||||||||||||||||
Consolidated | GE(a) | Financial Services (GE Capital) | ||||||||||||||||||||||
December 31, | December 31, | December 31, | December 31, | December 31, | December 31, | |||||||||||||||||||
(Dollars in billions) | 2018 | 2017 | 2018 | 2017 | 2018 | 2017 | ||||||||||||||||||
Assets | ||||||||||||||||||||||||
Cash, cash equivalents and restricted cash and marketable securities(b)(c) | $ | 68.9 | $ | 82.7 | $ | 21.0 | $ | 19.4 | $ | 47.9 | $ | 63.4 | ||||||||||||
Receivables | 19.9 | 24.2 | 15.4 | 14.6 | — | — | ||||||||||||||||||
Inventories | 19.3 | 19.4 | 19.2 | 19.3 | — | 0.1 | ||||||||||||||||||
GE Capital financing receivables - net | 7.7 | 10.3 | — | — | 13.6 | 22.0 | ||||||||||||||||||
Property, plant & equipment - net | 50.7 | 53.9 | 22.0 | 24.0 | 29.5 | 30.6 | ||||||||||||||||||
Receivable from GE Capital(e)(f) | — | — | 22.5 | 39.8 | — | — | ||||||||||||||||||
Investment in GE Capital | — | — | 11.4 | 13.5 | — | — | ||||||||||||||||||
Goodwill & intangible assets | 77.8 | 104.2 | 76.6 | 103.0 | 1.1 | 1.2 | ||||||||||||||||||
Contract and other deferred assets | 20.0 | 20.4 | 20.0 | 20.4 | — | — | ||||||||||||||||||
Other assets | 38.7 | 44.1 | 20.8 | 21.4 | 27.1 | 33.5 | ||||||||||||||||||
Assets of businesses held for sale | 1.6 | 4.2 | 1.5 | 3.8 | — | — | ||||||||||||||||||
Assets of discontinued operations | 4.6 | 5.9 | — | — | 4.6 | 5.9 | ||||||||||||||||||
Total assets | $ | 309.1 | $ | 369.2 | $ | 230.5 | $ | 279.3 | $ | 123.9 | $ | 156.7 | ||||||||||||
Liabilities and equity | ||||||||||||||||||||||||
Borrowings(d)(f) | $ | 110.0 | $ | 134.6 | $ | 32.3 | $ | 34.5 | $ | 43.0 | $ | 55.4 | ||||||||||||
Borrowings assumed by GE(e) | — | — | 36.3 | 47.1 | 22.5 | 39.8 | ||||||||||||||||||
Investment contracts, insurance liabilities and | ||||||||||||||||||||||||
insurance annuity benefits | 35.6 | 38.1 | — | — | 36.0 | 38.6 | ||||||||||||||||||
Non-current compensation and benefits | 33.8 | 41.6 | 32.9 | 40.8 | 0.9 | 0.8 | ||||||||||||||||||
Other liabilities | 75.4 | 76.0 | 76.3 | 78.9 | 8.3 | 7.7 | ||||||||||||||||||
Liabilities of businesses held for sale | 0.7 | 1.2 | 0.7 | 1.2 | — | — | ||||||||||||||||||
Liabilities of discontinued operations | 1.9 | 0.7 | 0.1 | — | 1.8 | 0.7 | ||||||||||||||||||
Redeemable noncontrolling interests | 0.4 | 3.4 | 0.4 | 3.4 | — | — | ||||||||||||||||||
GE shareowners' equity | 31.0 | 56.0 | 31.0 | 56.0 | 11.4 | 13.5 | ||||||||||||||||||
Noncontrolling interests | 20.5 | 17.5 | 20.5 | 17.3 | — | 0.2 | ||||||||||||||||||
Total liabilities and equity | $ | 309.1 | $ | 369.2 | $ | 230.5 | $ | 279.3 | $ | 123.9 | $ | 156.7 | ||||||||||||
(a) | Represents the adding together of all affiliated companies except GE Capital, which is presented on a one-line basis. |
(b) | At December 31, 2018, GE Capital maintained liquidity sources of $15.0 billion that consisted of cash, cash equivalents and restricted cash of $14.5 billion for continuing operations, cash equivalents and restricted cash of $0.4 billion classified as discontinued operations. Additionally, at December 31, 2018, GE has $47.5 billion ($40.8 billion net of offset provisions) of committed credit lines, consisting primarily of a $20 billion unused syndicated credit facility extended by 36 banks expiring in 2021, a $19.8 billion unused syndicated credit facility extended by six banks expiring in 2020, and $3.6 billion of credit facilities extended by seven banks with expiration dates ranging from February 2019 to May 2019. GE Capital has the right to compel GE to borrow under certain of these credit lines and transfer the proceeds as loans to GE Capital, which would be subject to the same terms and conditions as those between GE and the lending banks. |
(c) | Balance included consolidated restricted cash of $0.5 billion and $0.7 billion at December 31, 2018 and December 31, 2017, respectively. GE restricted cash was $0.5 billion and $0.6 billion at December 31, 2018 and December 31, 2017, respectively, and GE Capital restricted cash was an insignificant amount and $0.1 billion at December 31, 2018 and December 31, 2017, respectively. |
(d) | GE borrowings includes commercial paper of $3 billion at both December 31, 2018 and December 31, 2017. GE Capital borrowings includes commercial paper of an insignificant amount and $5 billion at December 31, 2018 and December 31, 2017, respectively. |
(e) | At December 31, 2018, the remaining GE Capital borrowings that had been assumed by GE as part of the GE Capital Exit Plan was $36.3 billion, for which GE has an offsetting receivable from GE Capital of $22.5 billion, The difference of $13.7 billion represents the amount of borrowings GE Capital has funded with available cash to GE via an intercompany loan in lieu of issuing borrowings externally. |
(f) | At December 31, 2018, total GE borrowings is comprised of GE-issued borrowings of $32.3 billion and the $13.7 billion of borrowings from GE Capital as described in note (e) above for a total of $46.1 billion (including $6.3 billion BHGE borrowings). |
Amounts may not add due to rounding
"GE Capital" means GE Capital Global Holdings, LLC (GECGH) and all of their affiliates and associated companies. Separate information is shown for "GE" and "Financial Services (GE Capital)." Transactions between GE and GE Capital have been eliminated from the "Consolidated" column. See Note 1 to the 2017 consolidated financial statements at www.ge.com/ar2017 for further information about consolidation matters.
7
GENERAL ELECTRIC COMPANY
Financial Measures That Supplement GAAP
We sometimes use financial measures derived from consolidated financial information but not presented in our financial statements prepared in accordance with U.S. generally accepted accounting principles (GAAP). Certain of these data are considered "non-GAAP financial measures" under the U.S. Securities and Exchange Commission rules. The following non-GAAP financial measures supplement our GAAP disclosures and should not be considered an alternative to the GAAP measure.
• | Adjusted earnings (loss) |
• | Adjusted earnings (loss) per share (EPS) |
• | Adjusted GE Industrial profit and profit margin (excluding certain items) |
• | GE Industrial segment organic revenues |
• | Healthcare organic revenues |
• | Adjusted Oil & Gas segment profit and profit margin |
• | GE Industrial free cash flows (FCF) and adjusted GE Industrial FCF |
The reasons we use these non-GAAP financial measures and the reconciliations to their most directly comparable GAAP financial measures follow. Certain columns, rows or percentages within these reconciliations may not add or recalculate due to the use of rounded numbers. Totals and percentages presented are calculated from the underlying numbers in millions.
8
ADJUSTED EARNINGS (LOSS) (NON-GAAP) | |||||||||||||||||
Three months ended December 31 | Twelve months ended December 31 | ||||||||||||||||
(In millions) | 2018 | 2017 | V% | 2018 | 2017 | V% | |||||||||||
Consolidated earnings (loss) from continuing operations attributable to GE common shareowners (GAAP) | $ | 666 | $ | (11,184 | ) | F | $ | (21,076 | ) | $ | (8,605 | ) | U | ||||
Less: GE Capital earnings (loss) from continuing operations attributable to GE common shareowners (GAAP) | (86 | ) | (6,569 | ) | (489 | ) | (6,765 | ) | |||||||||
GE Industrial earnings (loss) (Non-GAAP) | 752 | (4,615 | ) | F | (20,587 | ) | (1,841 | ) | U | ||||||||
Non-operating benefits costs (pre-tax) (GAAP) | (586 | ) | (574 | ) | (2,764 | ) | (2,385 | ) | |||||||||
Tax effect on non-operating benefit costs(a) | 123 | 201 | 581 | 835 | |||||||||||||
Less: non-operating benefit costs (net of tax) | (463 | ) | (373 | ) | (2,184 | ) | (1,550 | ) | |||||||||
Gains (losses) and impairments for disposed or held for sale businesses (pre-tax) | 900 | (961 | ) | 1,350 | 926 | ||||||||||||
Tax effect on gains (losses) and impairments for disposed or held for sale businesses(b) | (186 | ) | (16 | ) | (375 | ) | (62 | ) | |||||||||
Less: gains (losses) and impairments for disposed or held for sale businesses (net of tax) | 714 | (977 | ) | 974 | 864 | ||||||||||||
Restructuring & other (pre-tax) | (706 | ) | (1,001 | ) | (3,440 | ) | (4,030 | ) | |||||||||
Tax effect on restructuring & other(b) | 95 | 299 | 492 | 1,252 | |||||||||||||
Less: restructuring & other (net of tax) | (611 | ) | (702 | ) | (2,948 | ) | (2,778 | ) | |||||||||
Goodwill impairments (pre-tax) | (162 | ) | (217 | ) | (22,136 | ) | (1,165 | ) | |||||||||
Tax effect on goodwill impairments(b) | 11 | 2 | (235 | ) | 9 | ||||||||||||
Less: goodwill impairments (net of tax) | (151 | ) | (215 | ) | (22,371 | ) | (1,156 | ) | |||||||||
Unrealized gains (losses) (pre-tax) | (193 | ) | — | — | — | ||||||||||||
Tax effect on unrealized gains (losses)(a) | 41 | — | — | — | |||||||||||||
Less: unrealized gains (losses) (net of tax) | (153 | ) | — | — | — | ||||||||||||
Less: GE Industrial U.S. tax reform enactment adjustment | 17 | (4,905 | ) | (38 | ) | (4,905 | ) | ||||||||||
Adjusted GE Industrial earnings (loss) (Non-GAAP) | $ | 1,399 | $ | 2,558 | (45 | )% | $ | 5,980 | $ | 7,685 | (22 | )% | |||||
GE Capital earnings (loss) from continuing operations attributable to GE common shareowners (GAAP) | (86 | ) | (6,569 | ) | 99 | % | (489 | ) | (6,765 | ) | 93 | % | |||||
EFS impairments and insurance charge (pre-tax) | — | (11,444 | ) | — | (11,444 | ) | |||||||||||
Tax effect on EFS impairments and insurance charge(b) | — | 3,501 | — | 3,501 | |||||||||||||
Less: EFS impairments and insurance charge (net of tax) | — | (7,943 | ) | — | (7,943 | ) | |||||||||||
Less: GE Capital U.S. tax reform enactment adjustment | (128 | ) | 206 | (173 | ) | 206 | |||||||||||
Adjusted GE Capital earnings (loss) (Non-GAAP) | $ | 43 | $ | 1,167 | (96 | )% | $ | (316 | ) | $ | 972 | U | |||||
Adjusted GE Industrial earnings (loss) (Non-GAAP) | $ | 1,399 | $ | 2,558 | (45 | )% | $ | 5,980 | $ | 7,685 | (22 | )% | |||||
Add: Adjusted GE Capital earnings (loss) (Non-GAAP) | 43 | 1,167 | (316 | ) | 972 | ||||||||||||
Adjusted earnings (loss) (Non-GAAP) | $ | 1,441 | $ | 3,725 | (61 | )% | $ | 5,664 | $ | 8,657 | (35 | )% | |||||
(a) The tax effect was calculated using a 21% and 35% U.S. federal statutory tax rate in 2018 and 2017, respectively, based on its applicability to such cost. | |||||||||||||||||
(b) The tax effect presented includes both the rate for the relevant item as well as other direct and incremental tax charges. | |||||||||||||||||
Adjusted earnings (loss)* excludes non-operating benefit costs, gains (losses) and impairments for disposed or held for sale businesses, restructuring and other, goodwill impairment, unrealized gains (losses) and GE Capital EFS impairments and insurance charge in 2017, after tax, excluding the effects of U.S. tax reform enactment adjustment. The service cost of our pension and other benefit plans are included in adjusted earnings*, which represents the ongoing cost of providing pension benefits to our employees. The components of non-operating benefit costs are mainly driven by capital allocation decisions and market performance, and we manage these separately from the operational performance of our businesses. Gains and restructuring and other items are impacted by the timing and magnitude of gains associated with dispositions, and the timing and magnitude of costs associated with restructuring activities. Prior to the third quarter of 2018, goodwill impairment was included as a component of restructuring and other charges; beginning in the third quarter of 2018, on a comparable basis, we reported it separately in the Statement of Earnings (Loss) because of the significance of the charge that quarter, and Adjusted earnings (loss)* continues to exclude amounts related to goodwill impairment separate from the ongoing operations of our businesses. We believe that the retained costs in Adjusted earnings (loss)* provides management and investors a useful measure to evaluate the performance of the total company, and increases period-to-period comparability. We believe that presenting Adjusted Industrial earnings (loss)* separately from our financial services businesses also provides management and investors with useful information about the relative size of our industrial and financial services businesses in relation to the total company. | |||||||||||||||||
*Non-GAAP Financial Measure
9
ADJUSTED EARNINGS (LOSS) PER SHARE (NON-GAAP) | |||||||||||||||||
Three months ended December 31 | Twelve months ended December 31 | ||||||||||||||||
2018 | 2017 | V% | 2018 | 2017 | V% | ||||||||||||
Consolidated EPS from continuing operations attributable to GE common shareowners (GAAP) | $ | 0.08 | $ | (1.29 | ) | F | (2.43 | ) | (0.99 | ) | U | ||||||
Less: GE Capital EPS from continuing operations attributable to GE common shareowners (GAAP) | (0.01 | ) | (0.76 | ) | (0.06 | ) | (0.78 | ) | |||||||||
GE Industrial EPS (Non-GAAP) | $ | 0.09 | $ | (0.53 | ) | F | $ | (2.37 | ) | $ | (0.21 | ) | U | ||||
Non-operating benefits costs (pre-tax) (GAAP) | (0.07 | ) | (0.07 | ) | (0.32 | ) | (0.27 | ) | |||||||||
Tax effect on non-operating benefit costs(a) | 0.01 | 0.02 | 0.07 | 0.10 | |||||||||||||
Less: non-operating benefit costs (net of tax) | (0.05 | ) | (0.04 | ) | (0.25 | ) | (0.18 | ) | |||||||||
Gains (losses) and impairments for disposed or held for sale businesses (pre-tax) | 0.10 | (0.11 | ) | 0.16 | 0.11 | ||||||||||||
Tax effect on gains (losses) and impairments for disposed or held for sale businesses(b) | (0.02 | ) | — | (0.04 | ) | (0.01 | ) | ||||||||||
Less: gains (losses) and impairments for disposed or held for sale businesses (net of tax) | 0.08 | (0.11 | ) | 0.11 | 0.10 | ||||||||||||
Restructuring & other (pre-tax) | (0.08 | ) | (0.12 | ) | (0.40 | ) | (0.46 | ) | |||||||||
Tax effect on restructuring & other(b) | 0.01 | 0.03 | 0.06 | 0.14 | |||||||||||||
Less: restructuring & other (net of tax) | (0.07 | ) | (0.08 | ) | (0.34 | ) | (0.32 | ) | |||||||||
Goodwill impairments (pre-tax) | (0.02 | ) | (0.03 | ) | (2.55 | ) | (0.13 | ) | |||||||||
Tax effect on goodwill impairments(b) | — | — | (0.03 | ) | — | ||||||||||||
Less: goodwill impairments (net of tax) | (0.02 | ) | (0.02 | ) | (2.57 | ) | (0.13 | ) | |||||||||
Unrealized gains (losses) (pre-tax) | (0.02 | ) | — | — | — | ||||||||||||
Tax effect on unrealized gains (losses)(a) | — | — | — | — | |||||||||||||
Less: unrealized gains (losses) (net of tax) | (0.02 | ) | — | — | — | ||||||||||||
Less: GE Industrial U.S. tax reform enactment adjustment | — | (0.56 | ) | — | (0.56 | ) | |||||||||||
Adjusted GE Industrial EPS (Non-GAAP) | $ | 0.16 | $ | 0.30 | (47 | )% | $ | 0.69 | $ | 0.88 | (22 | )% | |||||
GE Capital EPS from continuing operations attributable to GE common shareowners (GAAP) | (0.01 | ) | (0.76 | ) | 99 | % | (0.06 | ) | (0.78 | ) | 92 | % | |||||
EFS impairments and insurance charge (pre-tax) | — | (1.32 | ) | — | (1.32 | ) | |||||||||||
Tax effect on EFS impairments and insurance charge (b) | — | 0.40 | — | 0.40 | |||||||||||||
Less: EFS impairments and insurance charge (net of tax) | — | (0.91 | ) | — | (0.91 | ) | |||||||||||
Less: GE Capital U.S. tax reform enactment adjustment | (0.01 | ) | 0.02 | (0.02 | ) | 0.02 | |||||||||||
Adjusted GE Capital EPS (Non-GAAP) | $ | — | $ | 0.13 | (100 | )% | $ | (0.04 | ) | $ | 0.11 | U | |||||
Adjusted GE Industrial EPS (Non-GAAP) | $ | 0.16 | $ | 0.30 | (47 | )% | $ | 0.69 | $ | 0.88 | (22 | )% | |||||
Add: Adjusted GE Capital EPS (Non-GAAP) | — | 0.13 | (0.04 | ) | 0.11 | ||||||||||||
Adjusted EPS (Non-GAAP)(c) | $ | 0.17 | $ | 0.43 | (60 | )% | $ | 0.65 | $ | 1.00 | (35 | )% | |||||
(a) The tax effect was calculated using a 21% and 35% U.S. federal statutory tax rate in 2018 and 2017, respectively, based on its applicability to such cost. | |||||||||||||||||
(b) The tax effect presented includes both the rate for the relevant item as well as other direct and incremental tax charges. | |||||||||||||||||
(c) Earnings-per-share amounts are computed independently. As a result, the sum of per-share amounts may not equal the total. | |||||||||||||||||
Adjusted EPS* excludes non-operating benefit costs, gains (losses) and impairments for disposed or held for sale businesses, restructuring and other, goodwill impairment, unrealized gains (losses), and GE Capital EFS impairments and insurance charge in 2017, after tax, excluding the effects of U.S. tax reform enactment adjustment. The service cost of our pension and other benefit plans are included in adjusted earnings*, which represents the ongoing cost of providing pension benefits to our employees. The components of non-operating benefit costs are mainly driven by capital allocation decisions and market performance, and we manage these separately from the operational performance of our businesses. Gains and restructuring and other items are impacted by the timing and magnitude of gains associated with dispositions, and the timing and magnitude of costs associated with restructuring activities. Prior to the third quarter of 2018, goodwill impairment was included as a component of restructuring and other charges; beginning in the third quarter of 2018, on a comparable basis, we reported it separately in the Statement of Earnings (loss) because of the significance of the charge that quarter, and Adjusted EPS* continues to exclude amounts related to goodwill impairment separate from the ongoing operations of our businesses. We believe that the retained costs in Adjusted EPS* provides management and investors a useful measure to evaluate the performance of the total company, and increases period-to-period comparability. We also use Adjusted EPS* as a performance metric at the company level for our annual executive incentive plan for 2018. We believe that presenting Adjusted EPS* separately from our financial services businesses also provides management and investors with useful information about the relative size of our industrial and financial services businesses in relation to the total company. | |||||||||||||||||
*Non-GAAP Financial Measure
10
ADJUSTED GE INDUSTRIAL PROFIT AND PROFIT MARGIN (EXCLUDING CERTAIN ITEMS) (NON-GAAP) | |||||||||||||
Three months ended December 31 | Twelve months ended December 31 | ||||||||||||
(Dollars in millions) | 2018 | 2017 | 2018 | 2017 | |||||||||
GE total revenues (GAAP) | $ | 31,213 | $ | 30,571 | $ | 113,642 | $ | 111,255 | |||||
Costs | |||||||||||||
GE total costs and expenses (GAAP) | $ | 31,266 | $ | 30,732 | $ | 135,656 | $ | 111,710 | |||||
Less: GE interest and other financial charges | 714 | 834 | 2,708 | 2,753 | |||||||||
Less: non-operating benefit costs | 586 | 574 | 2,764 | 2,385 | |||||||||
Less: restructuring & other | 699 | 894 | 3,487 | 3,923 | |||||||||
Less: goodwill impairments | 162 | 217 | 22,136 | 1,165 | |||||||||
Add: noncontrolling interests | 99 | (52 | ) | (129 | ) | (368 | ) | ||||||
Adjusted GE Industrial costs (Non-GAAP) | $ | 29,204 | $ | 28,161 | $ | 104,432 | $ | 101,116 | |||||
Other Income | |||||||||||||
GE other income (GAAP) | $ | 1,018 | $ | (722 | ) | $ | 2,255 | $ | 1,937 | ||||
Less: unrealized gains (losses) | (193 | ) | — | — | — | ||||||||
Less: restructuring & other | (7 | ) | (107 | ) | (87 | ) | (107 | ) | |||||
Less: gains (losses) and impairments for disposed or held for sale businesses | 900 | (961 | ) | 1,350 | 926 | ||||||||
Adjusted GE other income (Non-GAAP) | $ | 319 | $ | 346 | $ | 992 | $ | 1,118 | |||||
GE Industrial profit (GAAP) | $ | 965 | $ | (883 | ) | $ | (19,759 | ) | $ | 1,482 | |||
GE Industrial profit margin (GAAP) | 3.1 | % | (2.9 | )% | (17.4 | )% | 1.3 | % | |||||
Adjusted GE Industrial profit (Non-GAAP) | $ | 2,328 | $ | 2,757 | $ | 10,203 | $ | 11,257 | |||||
Adjusted GE Industrial profit margin (Non-GAAP) | 7.5 | % | 9.0 | % | 9.0 | % | 10.1 | % | |||||
We have presented our Adjusted GE Industrial profit* and profit margin* excluding interest and other financial charges, non-operating benefit costs, restructuring & other, goodwill impairments, non-controlling interests, unrealized gains (loss) on Pivotal equity investment and gains (losses) and impairments for disposed or held for sale businesses. We believe that GE Industrial profit and profit margins adjusted for these items are meaningful measures because they increase the comparability of period-to-period results. | |||||||||||||
*Non-GAAP Financial Measure
11
GE INDUSTRIAL SEGMENT ORGANIC REVENUES (NON-GAAP) | |||||||||||||||||
Three months ended December 31 | Twelve months ended December 31 | ||||||||||||||||
(In millions) | 2018 | 2017 | V% | 2018 | 2017 | V% | |||||||||||
GE Industrial segment revenues (GAAP) | $ | 31,827 | $ | 31,202 | 2 | % | $ | 115,664 | $ | 113,168 | 2 | % | |||||
Adjustments: | |||||||||||||||||
Less: acquisitions | 1 | — | 5,589 | 92 | |||||||||||||
Less: business dispositions (other than dispositions acquired for investment) | 125 | 1,378 | 138 | 3,857 | |||||||||||||
Less: currency exchange rate(a) | (523 | ) | — | 597 | — | ||||||||||||
GE Industrial segment organic revenues (Non-GAAP) | $ | 32,224 | $ | 29,823 | 8 | % | $ | 109,340 | $ | 109,220 | — | % | |||||
(a) Translational foreign exchange | |||||||||||||||||
HEALTHCARE ORGANIC REVENUES (NON-GAAP) | |||||||||||||||||
Three months ended December 31 | Twelve months ended December 31 | ||||||||||||||||
(In millions) | 2018 | 2017 | V% | 2018 | 2017 | V% | |||||||||||
Healthcare segment revenues (GAAP) | $ | 5,398 | $ | 5,314 | 2 | % | $ | 19,784 | $ | 19,017 | 4 | % | |||||
Adjustments: | |||||||||||||||||
Less: acquisitions | — | — | 6 | 1 | |||||||||||||
Less: business dispositions (other than dispositions acquired for investment) | — | 113 | 13 | 267 | |||||||||||||
Less: currency exchange rate(a) | (91 | ) | — | 152 | — | ||||||||||||
Healthcare organic revenues (Non-GAAP) | $ | 5,489 | $ | 5,201 | 6 | % | $ | 19,613 | $ | 18,748 | 5 | % | |||||
(a) Translational foreign exchange | |||||||||||||||||
Organic revenues* measure revenues excluding the effects of acquisitions, business dispositions and currency exchange rates. We believe that this measure provides management and investors with a more complete understanding of underlying operating results and trends of established, ongoing operations by excluding the effect of acquisitions, dispositions and currency exchange, which activities are subject to volatility and can obscure underlying trends. We also believe that presenting organic revenues* separately for our industrial businesses provides management and investors with useful information about the trends of our industrial businesses and enables a more direct comparison to other non-financial businesses and companies. Management recognizes that the term "organic revenues" may be interpreted differently by other companies and under different circumstances. Although this may have an effect on comparability of absolute percentage growth from company to company, we believe that these measures are useful in assessing trends of the respective businesses or companies and may therefore be a useful tool in assessing period-to-period performance trends. | |||||||||||||||||
When comparing revenue growth between periods excluding the effects of acquisitions, business dispositions and currency exchange rates, those effects are different when comparing results for different periods. Revenues from acquisitions are considered inorganic from the date we complete an acquisition through the end of the fourth quarter following the acquisition and are therefore reflected as an adjustment to reported revenue to derive organic revenue for the period following the acquisition. In subsequent periods, the revenues from the acquisition become organic as these revenues are included for all periods presented. | |||||||||||||||||
*Non-GAAP Financial Measure
12
ADJUSTED OIL & GAS SEGMENT PROFIT AND PROFIT MARGIN (NON-GAAP) | |||||||||||||||||
Three months ended December 31 | Twelve months ended December 31 | ||||||||||||||||
(In millions) | 2018 | 2017 | V% | 2018 | 2017 | V% | |||||||||||
Reported Oil & Gas segment profit (GAAP) | $ | 320 | $ | (165 | ) | F | $ | 429 | $ | 158 | F | ||||||
Less: restructuring & other (GE share) | (76 | ) | (412 | ) | (616 | ) | (679 | ) | |||||||||
Adjusted Oil & Gas segment profit (Non-GAAP) | $ | 396 | $ | 247 | 60 | % | $ | 1,045 | $ | 837 | 25 | % | |||||
Reported Oil & Gas segment revenues (GAAP) | $ | 6,250 | $ | 5,786 | 8 | % | $ | 22,859 | $ | 17,180 | 33 | % | |||||
Reported Oil & Gas profit margin (GAAP) | 5.1 | % | (2.9 | )% | 8pts | 1.9 | % | 0.9 | % | 1pts | |||||||
Adjusted Oil & Gas profit margin (Non-GAAP) | 6.3 | % | 4.3 | % | 2pts | 4.6 | % | 4.9 | % | (0.3)pts | |||||||
Adjusted GE Oil & Gas segment profit* measures Oil & Gas reported segment profit excluding the effects of restructuring and other charges. We believe that this measure provides management and investors with a more complete understanding of underlying operating results and trends of established, ongoing operations of our Oil & Gas segment. | |||||||||||||||||
GE INDUSTRIAL FREE CASH FLOWS (FCF) AND ADJUSTED GE INDUSTRIAL FCF (NON-GAAP) | |||||||||||||||||||
Three months ended December 31 | Twelve months ended December 31 | ||||||||||||||||||
(Dollars in millions) | 2018 | 2017 | V$ | 2018 | 2017 | V$ | |||||||||||||
GE CFOA (GAAP) | $ | 6,385 | $ | 6,982 | $ | (597 | ) | $ | 2,258 | $ | 11,033 | $ | (8,776 | ) | |||||
Add: gross additions to property, plant and equipment | (882 | ) | (1,082 | ) | (3,302 | ) | (4,132 | ) | |||||||||||
Add: gross additions to internal-use software | (86 | ) | (123 | ) | (347 | ) | (518 | ) | |||||||||||
Less: common dividends from GE Capital | — | — | — | 4,016 | |||||||||||||||
Less: GE Pension Plan funding | — | (287 | ) | (6,000 | ) | (1,717 | ) | ||||||||||||
Less: taxes related to business sales | (90 | ) | (117 | ) | (180 | ) | (229 | ) | |||||||||||
GE Industrial Free Cash Flows (Non-GAAP) | $ | 5,507 | $ | 6,182 | $ | (675 | ) | $ | 4,789 | $ | 4,313 | $ | 476 | ||||||
Less: Oil & Gas CFOA | 1,094 | (234 | ) | 1,763 | (477 | ) | |||||||||||||
Less: Oil & Gas gross additions to property, plant and equipment | (334 | ) | (237 | ) | (964 | ) | (488 | ) | |||||||||||
Less: Oil & Gas gross additions to internal-use software | (8 | ) | (10 | ) | (31 | ) | (34 | ) | |||||||||||
Add: BHGE Class B shareholder dividend | 95 | 129 | 494 | 251 | |||||||||||||||
Adjusted GE Industrial Free Cash Flows (Non-GAAP) | $ | 4,850 | $ | 6,792 | $ | (1,942 | ) | $ | 4,515 | $ | 5,562 | $ | (1,047 | ) | |||||
In 2018, GE transitioned from reporting an Adjusted GE Industrial CFOA metric to measuring itself on a GE Industrial Free Cash Flows basis*. This metric includes GE CFOA plus investments in property, plant and equipment and additions to internal-use software; this metric excludes any dividends received from GE Capital and any cash received from dispositions of property, plant and equipment. | |||||||||||||||||||
We believe that investors may also find it useful to compare GE’s Industrial free cash flows* performance without the effects of cash used for taxes related to business sales and contributions to the GE Pension Plan. We believe that this measure will better allow management and investors to evaluate the capacity of our industrial operations to generate free cash flows. In addition, we report Adjusted GE Industrial Free Cash Flows* in order to provide a more fair representation of the cash that we are entitled to utilize in a given period. We also use Adjusted GE Industrial Free Cash Flows* as a performance metric at the company-wide level for our annual executive incentive plan for 2018. | |||||||||||||||||||
Management recognizes that the term free cash flows may be interpreted differently by other companies and under different circumstances. Although this may have an effect on comparability of absolute percentage growth from company to company, we believe that these measures are useful in assessing trends of the respective businesses or companies and may therefore be a useful tool in assessing period-to-period performance trends. | |||||||||||||||||||
*Non-GAAP Financial Measure
13