Attached files
| file | filename |
|---|---|
| 8-K - 8-K 4TH QTR 2018 EARNINGS PRESENTATION - FIRST MERCHANTS CORP | a8-k4q18earningsreleasesli.htm |

44ththQuarterQuarter 2018Earnings Earnings Highlights Highlights JanuaryJanuary 31, 31, 20192019
Forward-Looking Statement This presentation contains forward-looking statements made pursuant to the safe-harbor provisions of the Private Securities Litigation Reform Act of 1995. Such forward-looking statements can often, but not always, be identified by the use of words like “believe”, “continue”, “pattern”, “estimate”, “project”, “intend”, “anticipate”, “expect” and similar expressions or future or conditional verbs such as “will”, would”, “should”, “could”, “might”, “can”, “may”, or similar expressions. These forward-looking statements include, but are not limited to, statements relating to First Merchants’ goals, intentions and expectations; statements regarding the First Merchants’ business plan and growth strategies; statements regarding the asset quality of First Merchants’ loan and investment portfolios; and estimates of First Merchants’ risks and future costs and benefits. These forward-looking statements are subject to significant risks, assumptions and uncertainties that may cause results to differ materially from those set forth in forward-looking statements, including, among other things: possible changes in economic and business conditions; the existence or exacerbation of general geopolitical instability and uncertainty; the ability of First Merchants to integrate recent acquisitions and attract new customers; possible changes in monetary and fiscal policies, and laws and regulations; the effects of easing restrictions on participants in the financial services industry; the cost and other effects of legal and administrative cases; possible changes in the credit worthiness of customers and the possible impairment of collectability of loans; fluctuations in market rates of interest; competitive factors in the banking industry; changes in the banking legislation or regulatory requirements of federal and state agencies applicable to bank holding companies and banks like First Merchants’ affiliate bank; continued availability of earnings and excess capital sufficient for the lawful and prudent declaration of dividends; changes in market, economic, operational, liquidity, credit and interest rate risks associated with the First Merchants’ business; and other risks and factors identified in each of First Merchants’ filings with the Securities and Exchange Commission. First Merchants undertakes no obligation to update any forward-looking statement, whether written or oral, relating to the matters discussed in this presentation or press release. In addition, the company’s past results of operations do not necessarily indicate its anticipated future results. NON-GAAP FINANCIAL MEASURES These slides contain non-GAAP financial measures. For purposes of Regulation G, a non-GAAP financial measure is a numerical measure of the registrant’s historical or future financial performance, financial position or cash flows that excludes amounts, or is subject to adjustments that have the effect of excluding amounts, that are included in the most directly comparable measure calculated and presented in accordance with GAAP in the statement of income, balance sheet or statement of cash flows (or equivalent statements) of the issuer; or includes amounts, or is subject to adjustments that have the effect of including amounts, that are excluded from the most directly comparable measure so calculated and presented. In this regard, GAAP refers to generally accepted accounting principles in the United States. Pursuant to the requirements of Regulation G, First Merchants Corporation has provided reconciliations within the slides, as necessary, of the non-GAAP financial measure to the most directly comparable GAAP financial measure. 2

Additional Information Communications in this press release do not constitute an offer to sell or the solicitation of an offer to buy any securities or a solicitation of any proxy vote or approval. The proposed merger between First Merchants Corporation and MBT Financial Corporation will be submitted to MBT Financial Corporation shareholders for their consideration. In connection with the proposed merger, MBT Financial Corporation has provided its shareholders with a Proxy Statement, as well as other relevant documents concerning the proposed transaction. SHAREHOLDERS ARE URGED TO READ THE PROXY STATEMENT REGARDING THE MERGER, AS WELL AS ANY OTHER RELEVANT DOCUMENTS CONCERNING THE PROPOSED TRANSACTION, TOGETHER WITH ALL AMENDMENTS OR SUPPPLEMENTS TO THOSE DOCUMENTS, AS THEY CONTAIN IMPORTANT INFORMATION. MBT Financial Corporation and its directors and executive officers may be deemed to be participants in the solicitation of proxies from the shareholders of MBT Financial Corporation in connection with the proposed merger. Additional information regarding the interests of those participants and other persons who may be deemed participants in the transaction may be obtained by reading the Proxy Statement regarding the proposed merger. 3

Full Year 2018 Performance Record Net Income of $159.1 Million, a 65.6% increase over 2017 Earnings per share of $3.22, a 51.9% increase over 2017 Total Assets of $9.9 Billion; grew organically by 5.5% over 2017 1.64% ROAA; 11.84% ROAE; 50.21% Efficiency Ratio Organic Loan Growth of $471 Million, a 7.0% growth rate Organic Deposit Growth of $582 Million, an 8.1% growth rate Tangible Book Value increased to $19.12 per share, or 12.7% over year-end 2017 “Record Level Results” 4
4th Quarter 2018 Highlights Earnings Per Share of $.85, a 73.5% increase over 4Q2017 $41.7 Million of Net Income, a 71.1% increase over 4Q2017 Winning marketplace execution delivering growth Organic Loan Growth of $138 Million, a 7.8% annualized growth rate Organic Deposit Growth of $121 Million, a 6.4% annualized growth rate “Record Level Results” 5

Mark K. Hardwick EXECUTIVE VICE PRESIDENT CHIEF FINANCIAL OFFICER AND CHIEF OPERATING OFFICER 6

Total Assets ($ in Millions) 2016 2017 2018 1. Investments $1,305 $1,561 $1,633 2. Loans 5,143 6,758 1 7,229 3. Allowance (66) (75) (81) 4. Goodwill & Intangibles 259 477 470 5. BOLI 202 224 225 6. Other 369 422 409 7. Total Assets $7,212 $9,367 $9,885 Annualized Asset Growth 6.7% 29.9% 5.5% 1 2017 loans include acquired loans of $225 from The Arlington Bank and $725 from Independent Alliance Banks 7
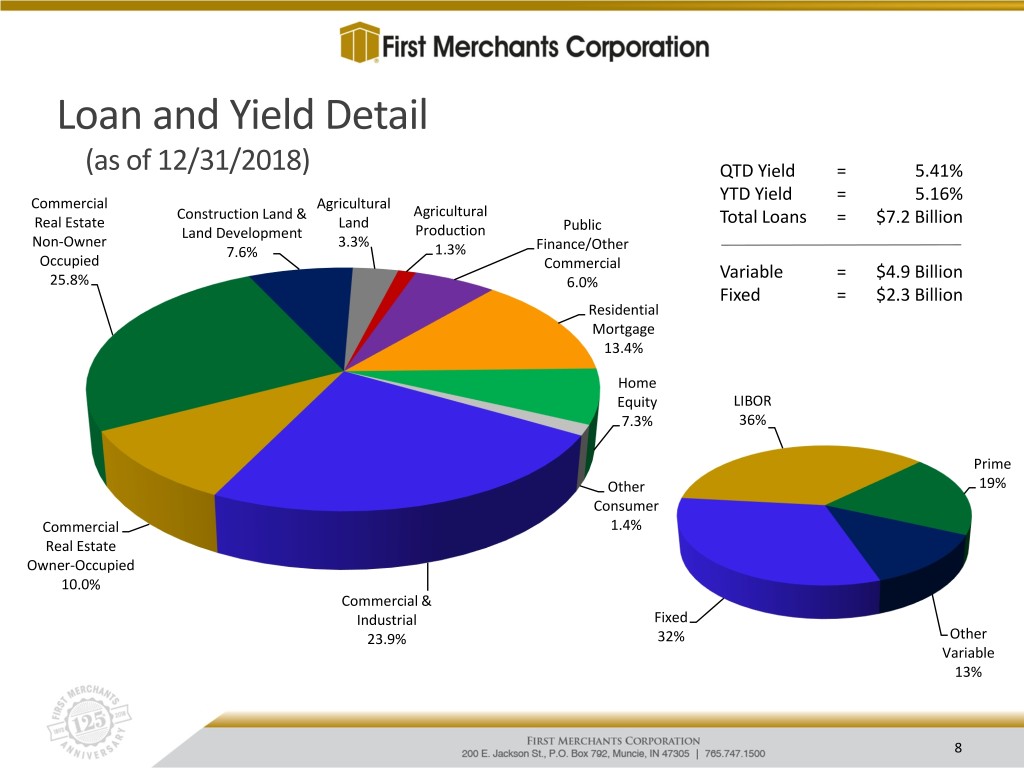
Loan and Yield Detail (as of 12/31/2018) QTD Yield = 5.41% Commercial Agricultural YTD Yield = 5.16% Construction Land & Agricultural Real Estate Land Public Total Loans = $7.2 Billion Land Development Production Non-Owner 3.3% Finance/Other 7.6% 1.3% Occupied Commercial Variable = $4.9 Billion 25.8% 6.0% Fixed = $2.3 Billion Residential Mortgage 13.4% Home Equity LIBOR 7.3% 36% Prime Other 19% Consumer Commercial 1.4% Real Estate Owner-Occupied 10.0% Commercial & Industrial Fixed 23.9% 32% Other Variable 13% 8

Investment Portfolio (as of 12/31/2018) Mortgage-Backed Securities Tax-Exempt 24% Municipals 48% $1.6 Billion Portfolio Modified duration of 5.6 years Tax equivalent yield of 3.54% Net unrealized loss of $8.0 Million Collateralized Mortgage Obligations Corporate 24% Obligations U. S. Agencies 2% 2% 9
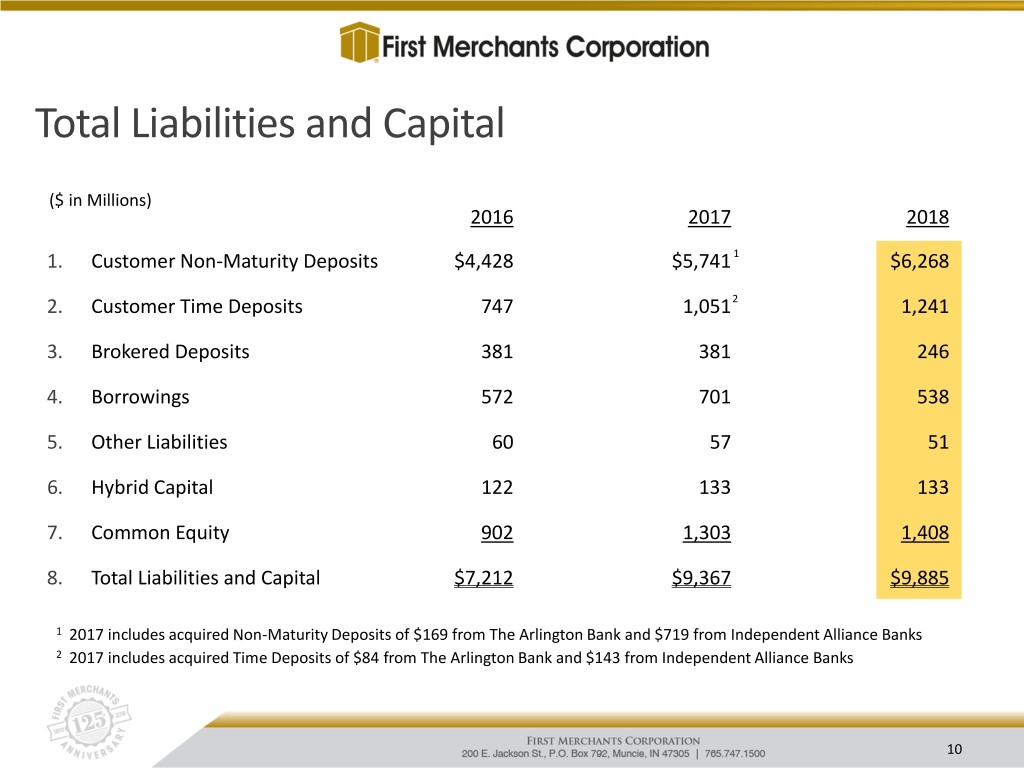
Total Liabilities and Capital ($ in Millions) 2016 2017 2018 1. Customer Non-Maturity Deposits $4,428 $5,741 1 $6,268 2. Customer Time Deposits 747 1,0512 1,241 3. Brokered Deposits 381 381 246 4. Borrowings 572 701 538 5. Other Liabilities 60 57 51 6. Hybrid Capital 122 133 133 7. Common Equity 902 1,303 1,408 8. Total Liabilities and Capital $7,212 $9,367 $9,885 1 2017 includes acquired Non-Maturity Deposits of $169 from The Arlington Bank and $719 from Independent Alliance Banks 2 2017 includes acquired Time Deposits of $84 from The Arlington Bank and $143 from Independent Alliance Banks 10

Deposit Detail (as of 12/31/2018) QTD Cost = 1.04% YTD Cost = .86% Total = $7.8 Billion Certificates & Certificates & Time Deposits Time Deposits >$100,000 <$100,000 Savings 8% 8% Deposits 29% Brokered Deposits 3% Demand Deposits 52% 11
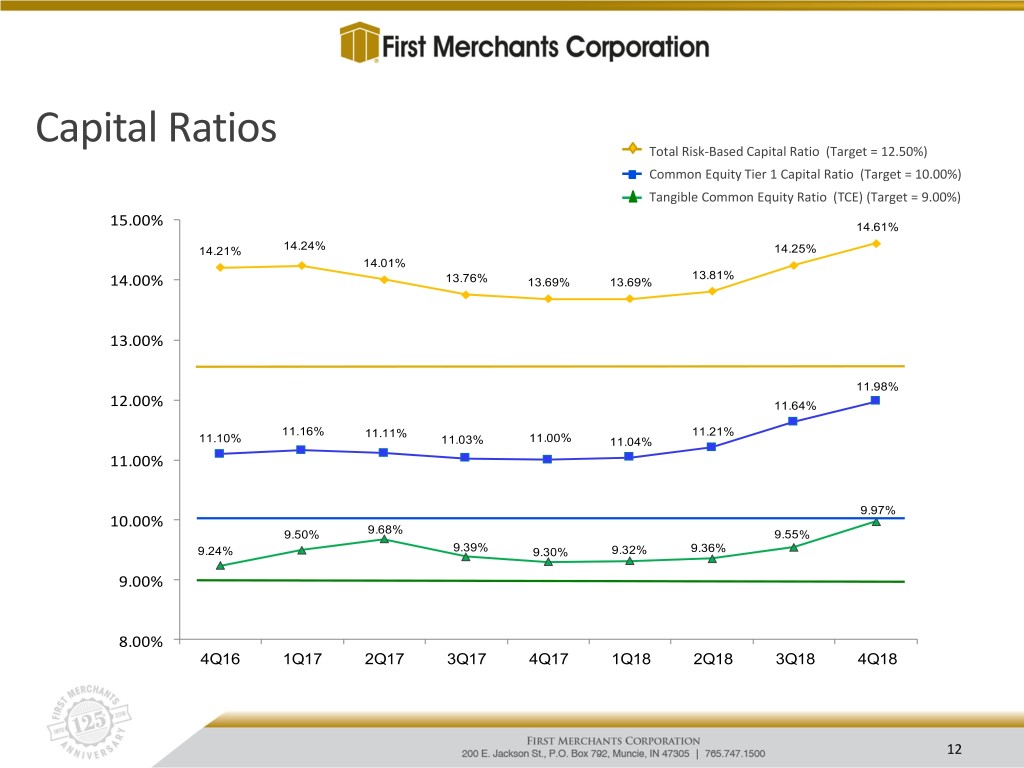
Capital Ratios Total Risk-Based Capital Ratio (Target = 12.50%) Common Equity Tier 1 Capital Ratio (Target = 10.00%) Tangible Common Equity Ratio (TCE) (Target = 9.00%) 15.00% 14.61% 14.21% 14.24% 14.25% 14.01% 13.81% 14.00% 13.76% 13.69% 13.69% 13.00% 11.98% 12.00% 11.64% 11.16% 11.11% 11.21% 11.10% 11.03% 11.00% 11.04% 11.00% 9.97% 10.00% 9.50% 9.68% 9.55% 9.24% 9.39% 9.30% 9.32% 9.36% 9.00% 8.00% 4Q16 1Q17 2Q17 3Q17 4Q17 1Q18 2Q18 3Q18 4Q18 12

Net Interest Margin Q4 - '16 Q1 - '17 Q2 - '17 Q3 - '17 Q4 - '17 Q1 - '18 Q2 - '18 Q3 - '18 Q4 - '18 Net Interest Income - FTE ($millions) $ 62.1 $ 64.9 $ 67.2 $ 78.9 $ 83.5 $ 82.5 $ 87.2 $ 89.2 $ 90.7 Fair Value Accretion $ 2.9 $ 4.3 $ 2.3 $ 3.2 $ 4.1 $ 3.2 $ 3.8 $ 3.2 $ 3.9 1 2 4 Tax Equivalent Yield on Earning Assets 4.32% 4.42% 4.44% 4.56% 4.67% 4.57% 4.74% 4.88%3 4.97% Interest Expense/Average Earning Assets 0.42% 0.44% 0.49% 0.53% 0.57% 0.65% 0.75% 0.83% 0.93% Net Interest Margin 3.90% 3.98% 3.95% 4.03% 4.10% 3.92% 3.99% 4.05% 4.04% Fair Value Accretion Effect 0.18% 0.26% 0.14% 0.17% 0.20% 0.15% 0.18% 0.15% 0.17% $94 3 4.04%4 4.20% 4.10% 2 4.05% 4.03% 3.99% $90 3.98% 3.95% 1 4.00% $86 3.90% 3.92% $82 3.80% $78 $74 3.60% $70 $66 3.40% $62 3.20% $58 $54 3.00% Q4 - '16 Q1 - '17 Q2 - '17 Q3 - '17 Q4 - '17 Q1 - '18 Q2 - '18 Q3 - '18 Q4 - '18 Net Interest Income - FTE ($millions) Net Interest Margin 1 Reflects 13 bps impact of Tax Cuts and Jobs Act 2 Reflects 12 bps impact of Tax Cuts and Jobs Act 3 Reflects 13 bps impact of Tax Cuts and Jobs Act 4 Reflects 13 bps impact of Tax Cuts and Jobs Act 13

Non-Interest Income ($ in Millions) 2016 2017 2018 1. Service Charges on Deposit Accounts $17.8 $ 18.7 $ 21.0 2. Wealth Management Fees 12.6 14.7 14.9 3. Card Payment Fees 15.0 16.1 18.0 4. Cash Surrender Value of Life Ins 4.3 6.6 4.2 5. Gains on Sales of Mortgage Loans 7.1 7.6 7.0 6. Gains on Sales of Securities 3.4 2.6 4.3 7. Other 5.0 4.7 7.1 8. Total Non-Interest Income $65.2 $71.0 $76.5 14

Non-Interest Expense ($ in Millions) 2016 2017 2018 1. Salary & Benefits $102.6 $119.8 $131.7 2. Premises & Equipment 29.5 30.1 32.7 3. Intangible Asset Amortization 3.9 5.6 6.7 4. Professional & Other Outside Services 6.5 12.8 8.2 5. OREO/Credit-Related Expense 2.9 1.9 1.5 6. FDIC Expense 3.0 2.6 2.9 7. Outside Data Processing 9.2 12.2 13.2 8. Marketing 3.0 3.7 4.7 9. Other 16.7 16.9 18.4 10. Total Non-Interest Expense $177.3 $ 205.6 1 $ 220.0 1 2017 includes acquisition-related expenses of $12.2 million 15

Earnings ($ in Millions) 2016 2017 2018 1. Net Interest Income $226.5 $ 277.3 $ 338.8 2. Provision for Loan Losses (5.7) (9.1) (7.2) 3. Net Interest Income after Provision 220.8 268.2 331.6 4. Non-Interest Income 65.2 71.0 76.5 5. Non-Interest Expense (177.3) (205.6) (220.0) 6. Income before Income Taxes 108.7 133.6 188.1 7. Income Tax Expense (27.6) (37.5) 1 (29.0) 2 8. Net Income Avail. for Distribution $ 81.1 $ 96.1 $ 159.1 9. EPS $ 1.98 $ 2.123 $ 3.22 10. Efficiency Ratio 56.51% 54.56% 50.21% 12017 includes $5.1 million of additional tax expense due to revaluing deferred taxes as a result of the Tax Cuts and Jobs Act 22018 reflects $1.8 million net reduction to income tax expense resulting from an increase in Indiana state tax liability offset by the release of a valuation allowance on state deferred tax assets 3Acquisition-related expenses, the impact of tax reform, and pension settlement accounting reduced EPS by $0.30 for 2017 16

Quarterly Earnings ($ in Millions) Q1-’18 Q2-’18 Q3-’18 Q4-’18 1. Net Interest Income $79.9 $84.6 $86.5 $87.8 2. Provision for Loan Losses (2.5) (1.7) (1.4) (1.6) 3. Net Interest Income after Provision 77.4 82.9 85.1 86.2 4. Non-Interest Income 19.6 18.2 19.5 19.2 5. Non-Interest Expense (53.7) (53.5) (55.0) (57.8) 6. Income before Income Taxes 43.3 47.6 49.6 47.6 1 7. Income Tax Expense (6.6) (8.0) (8.5) (5.9)1 8. Net Income Avail. for Distribution $ 36.7 $ 39.6 $ 41.1 $41.7 9. EPS $ 0.74 $ 0.80 $ 0.83 $ 0.85 10. Efficiency Ratio 51.33% 49.32% 49.25% 50.97% 12018 reflects $1.8 million net reduction to income tax expense resulting from an increase in Indiana state tax liability offset by the release of a valuation allowance on state deferred tax assets 17

Per Share Results 2017 Q1 Q2 Q3 Q4 Total 1. Earnings Per Share $ .56 $ .57 $ .50 $ .49 $ 2.12 2. Dividends $ .15 $ .18 $ .18 $ .18 $ .69 3. Tangible Book Value $16.49 $16.97 $16.62 $16.96 2018 Q1 Q2 Q3 Q4 Total 1. Earnings Per Share $ .74 $ .80 $ .83 $ .85 $ 3.22 2. Dividends $ .18 $ .22 $ .22 $ .22 $ .84 3. Tangible Book Value $17.14 $17.71 $18.16 $19.12 18

Dividends and Tangible Book Value Quarterly Dividends Tangible Book Value 0.22 .22 0.20 .18 $19.12 0.18 $16.96 0.16 .15 $15.85 .14 $14.68 0.14 $13.65 $12.17 0.12 .11 $10.95 0.10 $9.21 $9.64 .08 0.08 0.06 .05 0.04 .03 0.02 .01 0.00 2.57% Forward Dividend Yield Compound Annual Growth Rate of 9.56% Equals 26.1% Dividend Payout Ratio 19

John J. Martin EXECUTIVE VICE PRESIDENT AND CHIEF CREDIT OFFICER 20
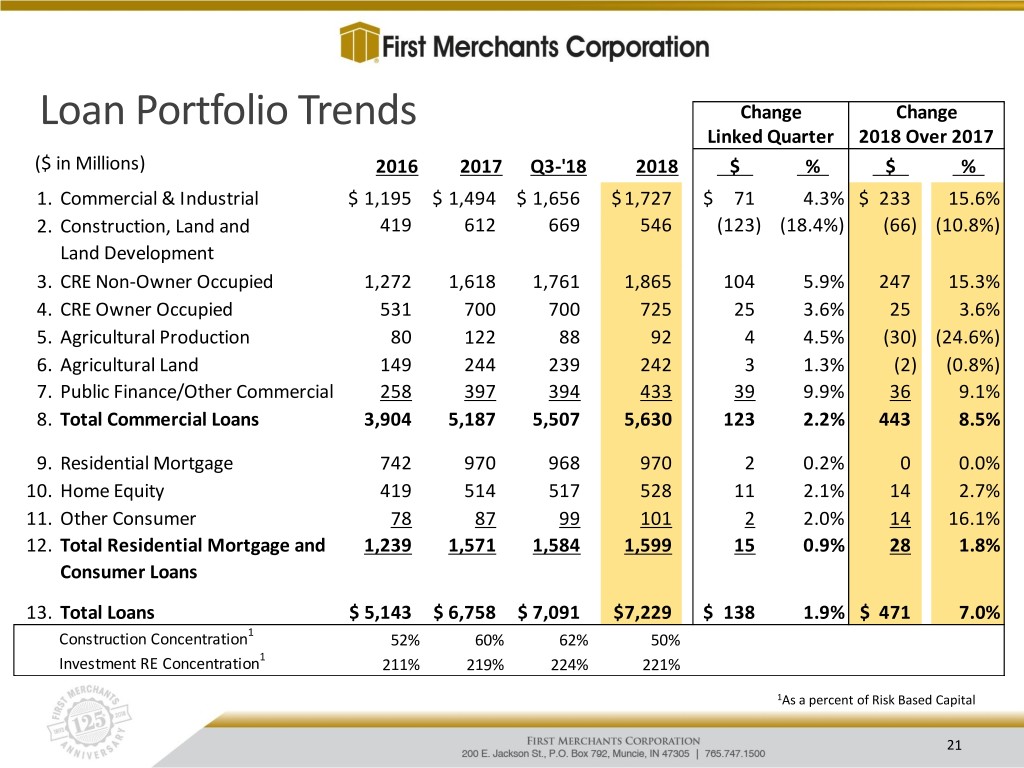
Loan Portfolio Trends Change Change Linked Quarter 2018 Over 2017 ($ in Millions) 2016 2017 Q3-'18 2018 $ % $ % 1. Commercial & Industrial $ 1,195 $ 1,494 $ 1,656 $ 1,727 $ 71 4.3% $ 233 15.6% 2. Construction, Land and 419 612 669 546 (123) (18.4%) (66) (10.8%) Land Development 3. CRE Non-Owner Occupied 1,272 1,618 1,761 1,865 104 5.9% 247 15.3% 4. CRE Owner Occupied 531 700 700 725 25 3.6% 25 3.6% 5. Agricultural Production 80 122 88 92 4 4.5% (30) (24.6%) 6. Agricultural Land 149 244 239 242 3 1.3% (2) (0.8%) 7. Public Finance/Other Commercial 258 397 394 433 39 9.9% 36 9.1% 8. Total Commercial Loans 3,904 5,187 5,507 5,630 123 2.2% 443 8.5% 9. Residential Mortgage 742 970 968 970 2 0.2% 0 0.0% 10. Home Equity 419 514 517 528 11 2.1% 14 2.7% 11. Other Consumer 78 87 99 101 2 2.0% 14 16.1% 12. Total Residential Mortgage and 1,239 1,571 1,584 1,599 15 0.9% 28 1.8% Consumer Loans 13. Total Loans $ 5,143 $ 6,758 $ 7,091 $7,229 $ 138 1.9% $ 471 7.0% Construction Concentration1 52% 60% 62% 50% Investment RE Concentration1 211% 219% 224% 221% 1As a percent of Risk Based Capital 21

Asset Quality Summary Change Change ($ in Millions) Linked Quarter 2018 Over 2017 2016 186.1 2017 Q3-'18 2018 $ % $ % 1. Non-Accrual Loans $ 30.0 $ 28.7 $ 20.4 $ 26.1 $ 5.7 27.9% $ (2.6) (9.1%) 2. Other Real Estate 9.0 10.4 8.9 2.2 (6.7) (75.3%) (8.2) (78.8%) 3. Renegotiated Loans 4.7 1.0 0.9 1.1 0.2 22.2% 0.1 10.0% 4. 90+ Days Delinquent Loans 0.1 0.9 0.1 1.9 1.8 1,800.0% 1.0 111.1% 5. Total NPAs & 90+ Days Delinquent $ 43.8 $ 41.0 $ 30.3 $ 31.3 $ 1.0 3.3% $ (9.7) (23.7%) 6. Total NPAs & 90+ Days/Loans & ORE 0.9% 0.6% 0.4% 0.4% 7. Classified Assets $ 174.1 $ 153.1 $ 174.2 $ 173.2 $ (1.0) (0.6%) $ 20.1 13.1% 8. Specific Reserves $ 0.9 $ 1.6 $ 0.4 $ 1.9 $ 1.5 375.0% $ 0.3 18.8% 22
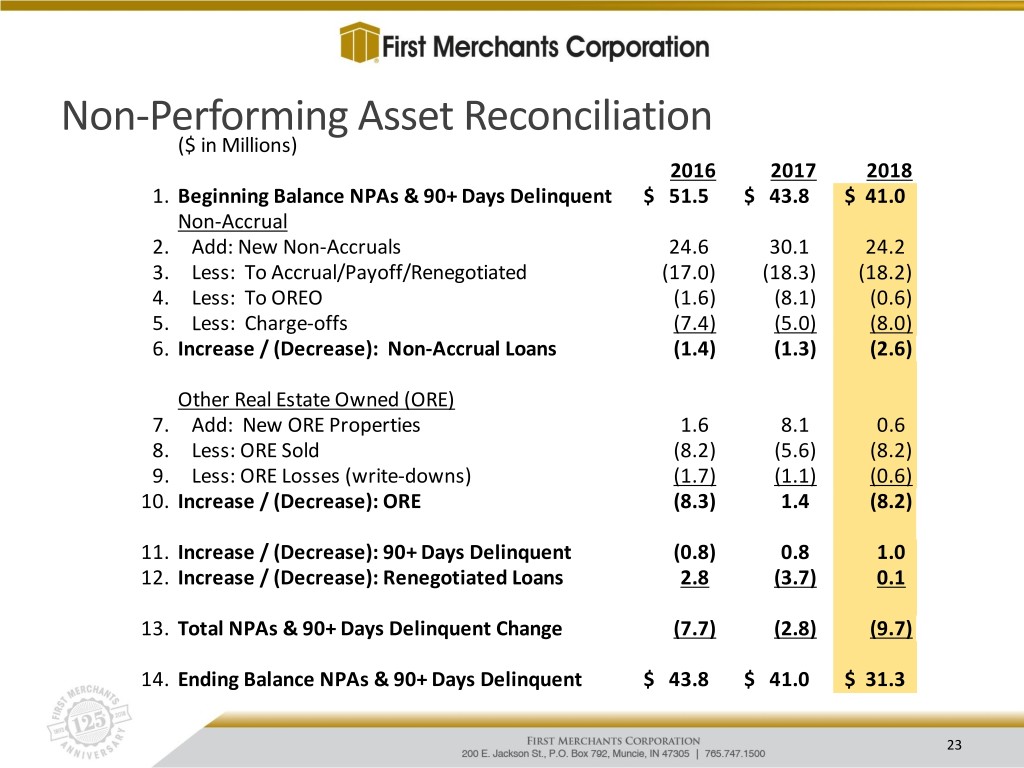
Non-Performing Asset Reconciliation ($ in Millions) 2016 2017 2018 1. Beginning Balance NPAs & 90+ Days Delinquent $ 51.5 $ 43.8 $ 41.0 Non-Accrual 2. Add: New Non-Accruals 24.6 30.1 24.2 3. Less: To Accrual/Payoff/Renegotiated (17.0) (18.3) (18.2) 4. Less: To OREO (1.6) (8.1) (0.6) 5. Less: Charge-offs (7.4) (5.0) (8.0) 6. Increase / (Decrease): Non-Accrual Loans (1.4) (1.3) (2.6) Other Real Estate Owned (ORE) 7. Add: New ORE Properties 1.6 8.1 0.6 8. Less: ORE Sold (8.2) (5.6) (8.2) 9. Less: ORE Losses (write-downs) (1.7) (1.1) (0.6) 10. Increase / (Decrease): ORE (8.3) 1.4 (8.2) 11. Increase / (Decrease): 90+ Days Delinquent (0.8) 0.8 1.0 12. Increase / (Decrease): Renegotiated Loans 2.8 (3.7) 0.1 13. Total NPAs & 90+ Days Delinquent Change (7.7) (2.8) (9.7) 14. Ending Balance NPAs & 90+ Days Delinquent $ 43.8 $ 41.0 $ 31.3 23

ALLL and Fair Value Summary ($ in Millions) Q4-'17 Q1-'18 Q2-'18 Q3-'18 Q4-'18 1. Beginning Allowance for Loan Losses (ALLL) $ 73.4 $ 75.0 $ 76.4 $ 77.5 $ 78.4 2. Net Charge-offs (Recoveries) 0.2 1.1 0.6 0.5 (0.5) 3. Provision Expense 1.8 2.5 1.7 1.4 1.7 4. Ending Allowance for Loan Losses (ALLL) $ 75.0 $ 76.4 $ 77.5 $ 78.4 $ 80.6 5. ALLL/Non-Accrual Loans 261.2% 277.9% 385.0% 383.9% 308.1% 6. ALLL/Non-Purchased Loans 1.36% 1.32% 1.28% 1.28% 1.26% 7. ALLL/Loans 1.11% 1.11% 1.09% 1.11% 1.11% 8. Fair Value Adjustment (FVA) $ 46.3 $ 43.1 $ 37.2 $ 33.9 $ 30.0 9. Total ALLL plus FVA 121.3 119.5 114.7 112.3 110.6 10. Purchased Loans plus FVA 1,304.7 1,179.8 1,059.1 979.2 874.3 11. FVA/Purchased Loans plus FVA 3.55% 3.65% 3.51% 3.46% 3.44% 24

Portfolio Summary 4th quarter loans increased 1.9%, or 7.8% annualized. Growth in CRE, C&I and public finance. NPAs & 90+ days remained low at 0.4% of loans and ORE. 4th quarter net recovery of $500,000. For the year, net charge-offs of $1.7 million with provision expense of $7.2 million supporting organic loan growth. ALLL of 1.11% and 1.26% to total loans and non-purchased loans, respectively. 25

Michael C. Rechin PRESIDENT AND CHIEF EXECUTIVE OFFICER 26
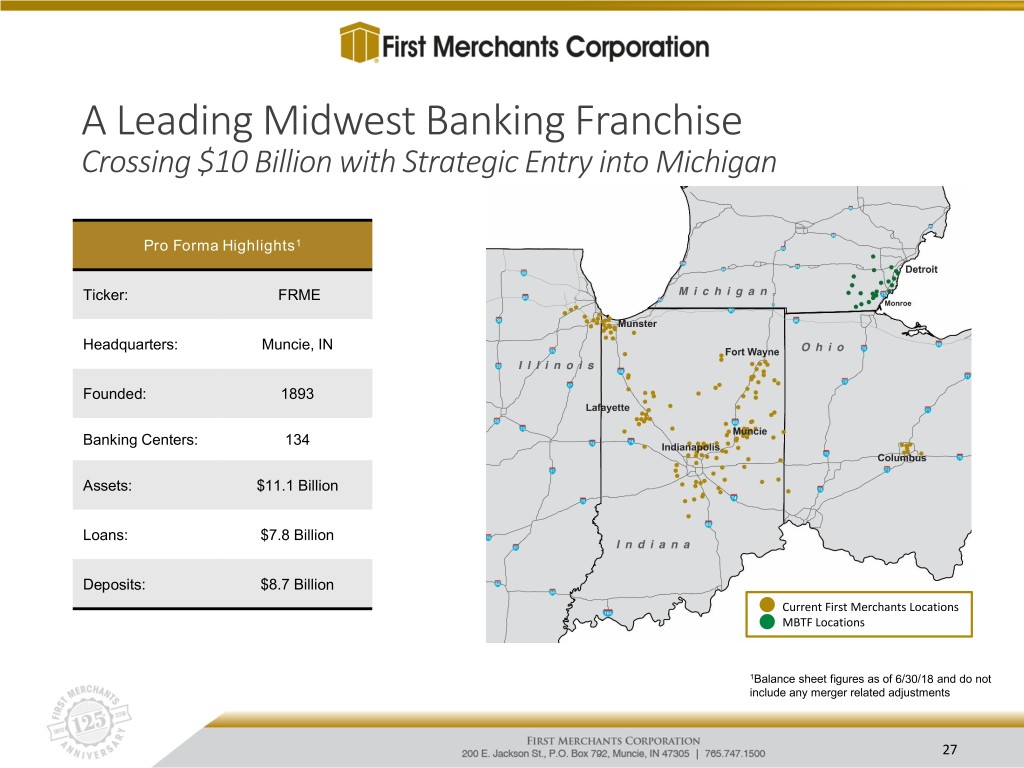
A Leading Midwest Banking Franchise Crossing $10 Billion with Strategic Entry into Michigan Pro Forma Highlights1 Ticker: FRME Headquarters: Muncie, IN Founded: 1893 Banking Centers: 134 Assets: $11.1 Billion Loans: $7.8 Billion Deposits: $8.7 Billion Current First Merchants Locations MBTF Locations 1Balance sheet figures as of 6/30/18 and do not include any merger related adjustments 27

Overview of MBT Financial Corporation Company Highlights Geographic FootprintFarmington Hills . Northville Headquartered in Monroe, Michigan Plymouth Redford Highland Park Livonia 75 . Westland Founded in 1858 Dearborn Ann Arbor 275 Allen Park . 94 Southgate Operates 20 Banking Centers 75 MICHIGAN Trenton . Flat Rock Balance Sheet as of June 30, 2018 Milan Rockwood • Assets: $1.3 Billion MICHIGAN Dundee • Loans: $741 Million 496 Monroe • Deposits: $1.1 Billion (89% non-maturity) Blissfield 75 94 Temperance • Loans / Deposits: 65% • 9.10% TCE/TA Deposit Market Share by County • 0.91% NPAs/Assets Market Deposits Mkt. Share % of . Income Statement for the quarter ending June 30, 2018 County Rank Branches ($000) (%) Franchise • ROAA: 1.51% / ROATCE: 16.59% Monroe, MI 1 15* $998,139 50.1% 86.9% • Efficiency Ratio: 61.8% Wayne, MI 14 6 $150,913 0.3% 13.1% • Net Interest Margin: 3.63% Source: S&P Global Market Intelligence and FDIC Summary of Deposits as of June 30, 2018. • Cost of Interest Bearing Deposits: 0.18% *Includes one non-banking center 28

FMC Strategy and Tactics Overview Looking Forward . . . Manage market presence and our core banking business. Continue organic growth protocol. Optimize our retail and commercial deposit strategy… products and pricing. Cross $10 Billion with the acquisition of MBT Financial Corporation and organic growth in the 1Q2019. Implement integration schedule and marketing plan for Michigan entry. Forbes Magazine recognition as #2 Ranking in “America’s Best Banks”. “Responsive, Knowledgeable, High-Performing” 29

Contact Information First Merchants Corporation common stock is traded on the NASDAQ Global Select Market under the symbol FRME. Additional information can be found at www.FIRSTMERCHANTS.COM Investor inquiries: Nicole M. Weaver Investor Relations Telephone: 765.521.7619 nweaver@firstmerchants.com 30
Appendix 31

Appendix – Non-GAAP Reconciliation CAPITAL RATIOS (dollars in thousands): 4Q16 1Q17 2Q17 3Q17 4Q17 1Q18 2Q18 3Q18 4Q18 Total Risk-Based Capital Ratio Total Stockholders' Equity (GAAP) 901,657 929,470 1,035,116 1,283,120 1,303,463 1,313,073 1,340,328 1,361,426 1,408,260 Adjust for Accumulated Other Comprehensive (Income) Loss 1 13,581 3,722 (1,384) 6,358 3,534 21,725 24,868 35,409 21,422 Less: Preferred Stock (125) (125) (125) (125) (125) (125) (125) (125) (125) Add: Qualifying Capital Securities 55,415 55,474 55,534 65,864 65,919 65,975 66,030 66,086 66,141 Less: Tier 1 Capital Deductions (376) (80) (166) - - - - - - Less: Disallowed Goodwill and Intangible Assets (249,104) (250,493) (300,307) (462,080) (464,066) (467,518) (466,063) (464,658) (463,525) Less: Disallowed Deferred Tax Assets (564) (320) (665) - - (2,594) (2,104) (1,111) - Total Tier 1 Capital (Regulatory) $ 720,484 $ 737,648 $ 788,003 $ 893,137 $ 908,725 $ 930,536 $ 962,934 $ 997,027 $ 1,032,173 Qualifying Subordinated Debentures 65,000 65,000 65,000 65,000 65,000 65,000 65,000 65,000 65,000 Allowance for Loan Losses includible in Tier 2 Capital 66,037 68,225 70,471 73,354 75,032 76,420 77,543 78,406 80,552 Total Risk-Based Capital (Regulatory) $ 851,521 $ 870,873 $ 923,474 $ 1,031,491 $ 1,048,757 $ 1,071,956 $ 1,105,477 $ 1,140,433 $ 1,177,725 Net Risk-Weighted Assets (Regulatory) $ 5,993,381 $ 6,114,112 $ 6,592,710 $ 7,497,321 $ 7,660,604 $ 7,831,727 $ 8,002,666 $ 8,001,191 $ 8,060,882 Total Risk-Based Capital Ratio (Regulatory) 14.21% 14.24% 14.01% 13.76% 13.69% 13.69% 13.81% 14.25% 14.61% Common Equity Tier 1 Capital Ratio Total Tier 1 Capital (Regulatory) $ 720,484 $ 737,648 $ 788,003 $ 893,137 $ 908,725 $ 930,536 $ 962,934 $ 997,027 $ 1,032,173 Less: Qualified Capital Securities (55,415) (55,474) (55,534) (65,864) (65,919) (65,975) (66,030) (66,086) (66,141) Add: Additional Tier 1 Capital Deductions 376 80 166 - - - - - - Common Equity Tier 1 Capital (Regulatory) $ 665,445 $ 682,254 $ 732,635 $ 827,273 $ 842,806 $ 864,561 $ 896,904 $ 930,941 $ 966,032 Net Risk-Weighted Assets (Regulatory) $ 5,993,381 $ 6,114,112 $ 6,592,710 $ 7,497,321 $ 7,660,604 $ 7,831,727 $ 8,002,666 $ 8,001,191 $ 8,060,882 Common Equity Tier 1 Capital Ratio (Regulatory) 11.10% 11.16% 11.11% 11.03% 11.00% 11.04% 11.21% 11.64% 11.98% 1 Includes net unrealized gains or losses on securities available for sale, net gains or losses on cash flow hedges, and amounts resulting from the application of the applicable accounting guidance for defined benefit and other postretirement plans. 32
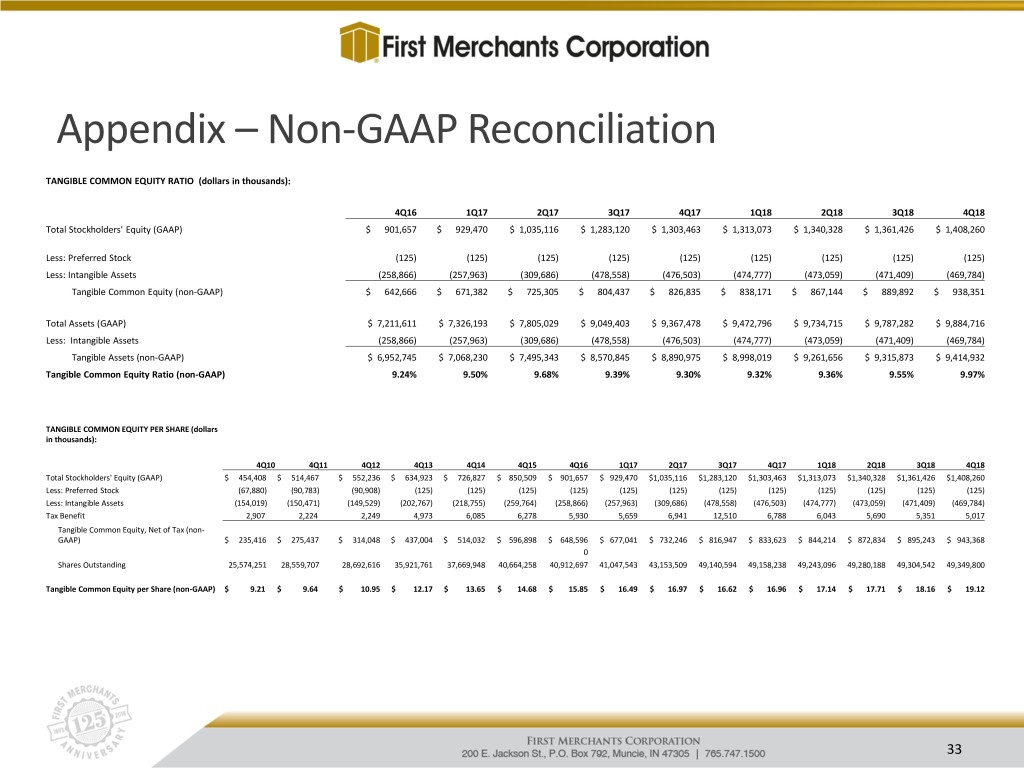
Appendix – Non-GAAP Reconciliation TANGIBLE COMMON EQUITY RATIO (dollars in thousands): 4Q16 1Q17 2Q17 3Q17 4Q17 1Q18 2Q18 3Q18 4Q18 Total Stockholders' Equity (GAAP) $ 901,657 $ 929,470 $ 1,035,116 $ 1,283,120 $ 1,303,463 $ 1,313,073 $ 1,340,328 $ 1,361,426 $ 1,408,260 Less: Preferred Stock (125) (125) (125) (125) (125) (125) (125) (125) (125) Less: Intangible Assets (258,866) (257,963) (309,686) (478,558) (476,503) (474,777) (473,059) (471,409) (469,784) Tangible Common Equity (non-GAAP) $ 642,666 $ 671,382 $ 725,305 $ 804,437 $ 826,835 $ 838,171 $ 867,144 $ 889,892 $ 938,351 Total Assets (GAAP) $ 7,211,611 $ 7,326,193 $ 7,805,029 $ 9,049,403 $ 9,367,478 $ 9,472,796 $ 9,734,715 $ 9,787,282 $ 9,884,716 Less: Intangible Assets (258,866) (257,963) (309,686) (478,558) (476,503) (474,777) (473,059) (471,409) (469,784) Tangible Assets (non-GAAP) $ 6,952,745 $ 7,068,230 $ 7,495,343 $ 8,570,845 $ 8,890,975 $ 8,998,019 $ 9,261,656 $ 9,315,873 $ 9,414,932 Tangible Common Equity Ratio (non-GAAP) 9.24% 9.50% 9.68% 9.39% 9.30% 9.32% 9.36% 9.55% 9.97% TANGIBLE COMMON EQUITY PER SHARE (dollars in thousands): 4Q10 4Q11 4Q12 4Q13 4Q14 4Q15 4Q16 1Q17 2Q17 3Q17 4Q17 1Q18 2Q18 3Q18 4Q18 Total Stockholders' Equity (GAAP) $ 454,408 $ 514,467 $ 552,236 $ 634,923 $ 726,827 $ 850,509 $ 901,657 $ 929,470 $1,035,116 $1,283,120 $1,303,463 $1,313,073 $1,340,328 $1,361,426 $1,408,260 Less: Preferred Stock (67,880) (90,783) (90,908) (125) (125) (125) (125) (125) (125) (125) (125) (125) (125) (125) (125) Less: Intangible Assets (154,019) (150,471) (149,529) (202,767) (218,755) (259,764) (258,866) (257,963) (309,686) (478,558) (476,503) (474,777) (473,059) (471,409) (469,784) Tax Benefit 2,907 2,224 2,249 4,973 6,085 6,278 5,930 5,659 6,941 12,510 6,788 6,043 5,690 5,351 5,017 Tangible Common Equity, Net of Tax (non- GAAP) $ 235,416 $ 275,437 $ 314,048 $ 437,004 $ 514,032 $ 596,898 $ 648,596 $ 677,041 $ 732,246 $ 816,947 $ 833,623 $ 844,214 $ 872,834 $ 895,243 $ 943,368 0 Shares Outstanding 25,574,251 28,559,707 28,692,616 35,921,761 37,669,948 40,664,258 40,912,697 41,047,543 43,153,509 49,140,594 49,158,238 49,243,096 49,280,188 49,304,542 49,349,800 Tangible Common Equity per Share (non-GAAP) $ 9.21 $ 9.64 $ 10.95 $ 12.17 $ 13.65 $ 14.68 $ 15.85 $ 16.49 $ 16.97 $ 16.62 $ 16.96 $ 17.14 $ 17.71 $ 18.16 $ 19.12 33

Appendix – Non-GAAP Reconciliation EFFICIENCY RATIO (dollars in thousands): 2016 2017 1Q18 2Q18 3Q18 4Q18 2018 Non Interest Expense (GAAP) $ 177,359 $ 205,556 $ 53,687 $ 53,504 $ 55,022 $ 57,738 $ 219,951 Less: Intangible Asset Amortization (3,910) (5,647) (1,726) (1,718) (1,650) (1,625) (6,719) Less: OREO and Foreclosure Expenses (2,877) (1,903) (402) (362) (455) (251) (1,470) Adjusted Non Interest Expense (non-GAAP) 170,572 198,006 51,559 51,424 52,917 55,862 211,762 Net Interest Income (GAAP) 226,473 277,284 79,916 84,571 86,486 87,884 338,857 Plus: Fully Taxable Equivalent Adjustment 13,541 17,270 2,584 2,625 2,726 2,796 10,732 Net Interest Income on a Fully Taxable Equivalent Basis (non-GAAP) 240,014 294,554 82,500 87,196 89,212 90,680 349,589 Non Interest Income (GAAP) 65,203 71,009 19,561 18,191 19,527 19,180 76,459 Less: Investment Securities Gains (Losses) (3,389) (2,631) (1,609) (1,122) (1,285) (253) (4,269) Adjusted Non Interest Income (non-GAAP) 61,814 68,378 17,952 17,069 18,242 18,927 72,190 Adjusted Revenue (non-GAAP) 301,828 362,932 100,452 104,265 107,454 109,607 421,779 Efficiency Ratio (non-GAAP) 56.51% 54.56% 51.33% 49.32% 49.25% 50.97% 50.21% FORWARD DIVIDEND YIELD 4Q18 Most recent quarter's dividend per share $ 0.22 Most recent quarter's dividend per share - Annualized $ 0.88 Stock Price at 12/31/18 $ 34.27 Forward Dividend Yield 2.57% DIVIDEND PAYOUT RATIO 2018 Dividends per share $ 0.84 Earnings Per Share $ 3.22 Dividend Payout Ratio 26.1% 34
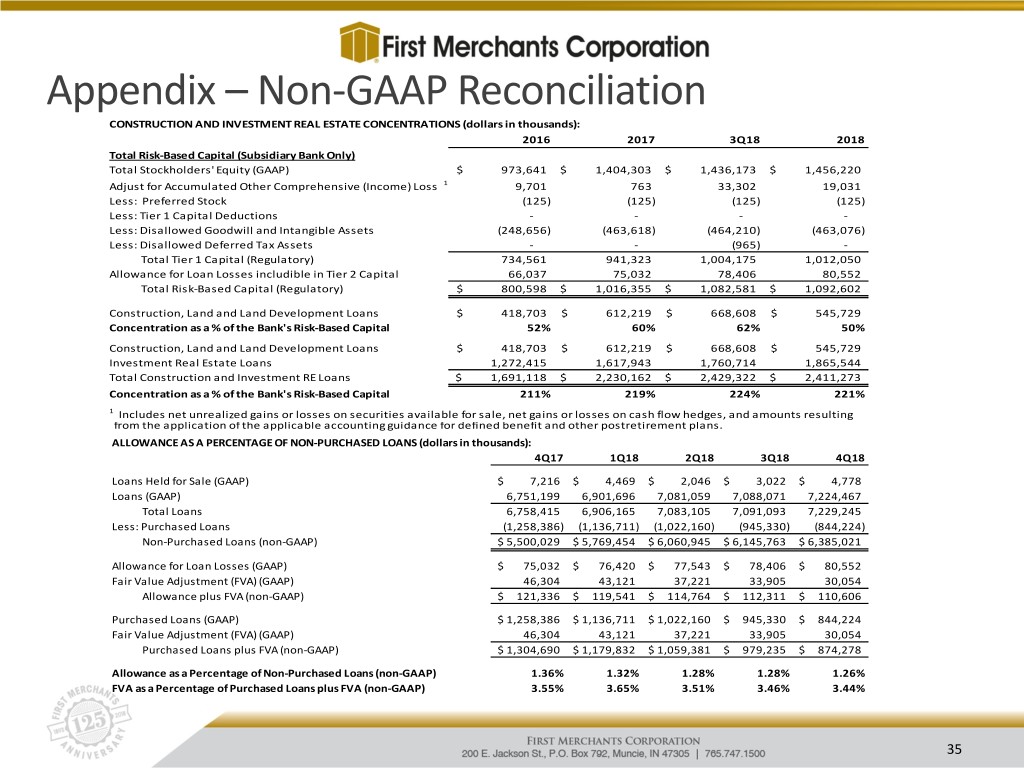
Appendix – Non-GAAP Reconciliation CONSTRUCTION AND INVESTMENT REAL ESTATE CONCENTRATIONS (dollars in thousands): 2016 2017 3Q18 2018 Total Risk-Based Capital (Subsidiary Bank Only) Total Stockholders' Equity (GAAP) $ 973,641 $ 1,404,303 $ 1,436,173 $ 1,456,220 Adjust for Accumulated Other Comprehensive (Income) Loss 1 9,701 763 33,302 19,031 Less: Preferred Stock (125) (125) (125) (125) Less: Tier 1 Capital Deductions - - - - Less: Disallowed Goodwill and Intangible Assets (248,656) (463,618) (464,210) (463,076) Less: Disallowed Deferred Tax Assets - - (965) - Total Tier 1 Capital (Regulatory) 734,561 941,323 1,004,175 1,012,050 Allowance for Loan Losses includible in Tier 2 Capital 66,037 75,032 78,406 80,552 Total Risk-Based Capital (Regulatory) $ 800,598 $ 1,016,355 $ 1,082,581 $ 1,092,602 Construction, Land and Land Development Loans $ 418,703 $ 612,219 $ 668,608 $ 545,729 Concentration as a % of the Bank's Risk-Based Capital 52% 60% 62% 50% Construction, Land and Land Development Loans $ 418,703 $ 612,219 $ 668,608 $ 545,729 Investment Real Estate Loans 1,272,415 1,617,943 1,760,714 1,865,544 Total Construction and Investment RE Loans $ 1,691,118 $ 2,230,162 $ 2,429,322 $ 2,411,273 Concentration as a % of the Bank's Risk-Based Capital 211% 219% 224% 221% 1 Includes net unrealized gains or losses on securities available for sale, net gains or losses on cash flow hedges, and amounts resulting from the application of the applicable accounting guidance for defined benefit and other postretirement plans. ALLOWANCE AS A PERCENTAGE OF NON-PURCHASED LOANS (dollars in thousands): 4Q17 1Q18 2Q18 3Q18 4Q18 Loans Held for Sale (GAAP) $ 7,216 $ 4,469 $ 2,046 $ 3,022 $ 4,778 Loans (GAAP) 6,751,199 6,901,696 7,081,059 7,088,071 7,224,467 Total Loans 6,758,415 6,906,165 7,083,105 7,091,093 7,229,245 Less: Purchased Loans (1,258,386) (1,136,711) (1,022,160) (945,330) (844,224) Non-Purchased Loans (non-GAAP) $ 5,500,029 $ 5,769,454 $ 6,060,945 $ 6,145,763 $ 6,385,021 Allowance for Loan Losses (GAAP) $ 75,032 $ 76,420 $ 77,543 $ 78,406 $ 80,552 Fair Value Adjustment (FVA) (GAAP) 46,304 43,121 37,221 33,905 30,054 Allowance plus FVA (non-GAAP) $ 121,336 $ 119,541 $ 114,764 $ 112,311 $ 110,606 Purchased Loans (GAAP) $ 1,258,386 $ 1,136,711 $ 1,022,160 $ 945,330 $ 844,224 Fair Value Adjustment (FVA) (GAAP) 46,304 43,121 37,221 33,905 30,054 Purchased Loans plus FVA (non-GAAP) $ 1,304,690 $ 1,179,832 $ 1,059,381 $ 979,235 $ 874,278 Allowance as a Percentage of Non-Purchased Loans (non-GAAP) 1.36% 1.32% 1.28% 1.28% 1.26% FVA as a Percentage of Purchased Loans plus FVA (non-GAAP) 3.55% 3.65% 3.51% 3.46% 3.44% 35
