Attached files
| file | filename |
|---|---|
| EX-32.2 - EXHIBIT 32.2 - China United Insurance Service, Inc. | tv511289_ex32-2.htm |
| EX-32.1 - EXHIBIT 32.1 - China United Insurance Service, Inc. | tv511289_ex32-1.htm |
| EX-31.2 - EXHIBIT 31.2 - China United Insurance Service, Inc. | tv511289_ex31-2.htm |
| EX-31.1 - EXHIBIT 31.1 - China United Insurance Service, Inc. | tv511289_ex31-1.htm |
UNITED STATES
SECURITIES AND EXCHANGE COMMISSION
WASHINGTON, D.C. 20549
FORM 10-Q
(Mark One)
| x | QUARTERLY REPORT UNDER SECTION 13 OR 15(d) OF THE SECURITIES EXCHANGE ACT OF 1934 |
For the quarterly period ended June 30, 2018
OR
| ¨ | TRANSITION REPORT UNDER SECTION 13 OR 15(d) OF THE SECURITIES EXCHANGE ACT OF 1934 |
For the transition period from __________ to __________
COMMISSION FILE NUMBER: 000-54884
CHINA UNITED INSURANCE SERVICE, INC.
(Exact name of registrant as specified in its charter)
| Delaware | 30-0826400 |
| (State or other jurisdiction of incorporation or organization) |
(IRS Employer Identification No.) |
7F, No. 311 Section 3
Nan-King East Road
Taipei City, Taiwan
(Address of principal executive offices)
+8862-87126958
(Registrant’s Telephone Number, Including Area Code)
Indicate by check mark whether the registrant (1) has filed all reports required to be filed by Section 13 or 15(d) of the Exchange Act during the preceding 12 months (or for such shorter period that the issuer was required to file such reports), and (2) has been subject to such filing requirements for the past 90 days.
Yes x No ¨
Indicate by check mark whether the registrant has submitted electronically every Interactive Data File required to be submitted pursuant to Rule 405 of Regulation S-T (§ 232.405 of this chapter) during the preceding 12 months (or for such shorter period that the registrant was required to submit such files).
Yes x No ¨
Indicate by check mark whether the registrant is a large accelerated filer, an accelerated filer, a non-accelerated filer, smaller reporting company, or an emerging growth company. See the definitions of “large accelerated filer,” “accelerated filer,” “smaller reporting company,” and “emerging growth company” in Rule 12b-2 of the Exchange Act.
| Large accelerated filer ¨ | Accelerated filer x |
| Non-accelerated filer ¨ | Smaller reporting company ¨ |
| Emerging growth company ¨ |
If an emerging growth company, indicate by check mark if the registrant has elected not to use the extended transition period for complying with any new or revised financial accounting standards provided pursuant to Section 13(a) of the Exchange Act. ¨
Indicate by check mark whether the registrant is a shell company as defined in Rule 12b-2 of the Exchange Act.
Yes ¨ No x
As of January 29, 2019, there are 29,452,669 shares of common stock issued and outstanding, and 1,000,000 preferred shares issued and outstanding.
TABLE OF CONTENTS
| 2 |
EXPLANATORY NOTE REGARDING RESTATEMENT
On January 23, 2018, the Audit Committee of the Board of Directors of China United Insurance Service, Inc., based on the recommendations of the company’s management and after consultation with, Simon & Edward LLP, our independent registered public accounting firm, concluded that our consolidated financial statements as of and for each of the interim period ended June 30, 2017 should no longer be relied upon.
Within this report, we have included the restated unaudited condensed consolidated financial information for the quarterly periods as of and for the interim period ended March 31, 2017, which we refer to as the Restatement.
The Restatement corrects a material error related to the accounting for the acquisition of Genius Holdings Financial Limited (the
“GHFL Acquisition”) in 2015 The GHFL Acquisition has been accounted for as the acquisition of a business but, upon
further analysis, we have come to the conclusion that it would be more accurately accounted for as an asset acquisition. Our independent
registered accounting firm has concurred with this revised approach.
The Company has determined that this change in accounting for the GHFL Acquisition had the impact set forth below as of and for the interim period ended June 30, 2017 (the “Restated Period”) on the following key balance sheet items included in the financial statements the Restated Period, which the Company believes are of particular significance for investors. Please note that the Key Balance Sheet Items in the Restated Period set forth below changed as a result of the Restatement.
For further information, please see the section titled “Explanatory Note Regarding Restatement” in our Annual Report, as amended and filed on form 10-K/A (the “Amended Annual Report”), as filed with the Securities and Exchange Commission ( the “SEC”) on January 24, 2019, which is incorporated by reference herein.
Key Balance Sheet Items
Goodwill: Reported Goodwill as of the interim reporting period ended June 30, 2017 of $2,071,491 has been restated to total $31,651 as at such date, representing a reduction of $2,039840 (or 98.5%).
Total Assets: Reported Total Assets as of June 30, 2017 of $48,983,681 has been restated to total $46,943,841 as at such date, representing a reduction of $2,039,840 (or 4.2%.)
Retained Earnings: Reported Retained Earnings as of June 30, 2017 of $5,804,053 has been restated to total $3,764,213 as at such date, representing a reduction of $2,039,840 (or 35.1%).
Stockholders’ Equity Attributable to Parent’s Shareholders: Reported Stockholders’ Equity Attributable to Parent’s Shareholders reported as of June 30, 2017 of $18,721,318 has been restated to total $16,681,478 as at such date, representing a reduction of $2,039,840 (or 10.9%).
CAUTIONARY STATEMENT REGARDING FORWARD-LOOKING INFORMATION
This report contains forward-looking statements. These statements involve known and unknown risks, uncertainties and other factors which may cause our actual results, performance or achievements to be materially different from any future results, performance or achievement expressed or implied by the forward-looking statements. These risks and uncertainties include, but are not limited to, the factors described under Part 1 Item 2 “Management’s Discussion and Analysis of Financial Condition and Results of Operations.” In some cases, you can identify forward-looking statements by terms such as “anticipates,” “believes,” “could,” “estimates,” “expects,” “intends,” “may,” “plans,” “potential,” “predicts,” “projects,” “should,” “would” and similar expressions intended to identify forward-looking statements. Forward-looking statements reflect our current views with respect to future events and are based on assumptions and subject to risks and uncertainties. Given these uncertainties, you should not place undue reliance on these forward-looking statements.
Forward-looking statements represent our estimates and assumptions only as of the date of this report. You should read this report and the documents that we reference in this report, or that we filed as exhibits to this report completely and with the understanding that our actual future results may be materially different from what we expect.
Except as required by law, we assume no obligation to update any forward-looking statements publicly, or to update the reasons actual results could differ materially from those anticipated in any forward-looking statements, even if new information becomes available in the future.
| 3 |
OTHER PERTINENT INFORMATION
References in this annual report to “we,” “us,” “our” and the “Company” and words of like import refer to China United Insurance Service, Inc., its subsidiaries and variable interest entities.
References to China or the PRC refer to the People’s Republic of China (excluding Hong Kong, Macao and Taiwan). References to Taiwan refer to Republic of China.
Unless context indicates otherwise, reference to the “Company” in this annual report refers to China United Insurance Service, Inc. and its subsidiaries. Reference to “AHFL” refers to the combined operations of Action Holdings Financial Limited and its Taiwan Subsidiaries. Reference to “Anhou” refers to the combined operations of Law Anhou Insurance Agency Co., Ltd. and its subsidiaries.
Our business is conducted in Taiwan and China using New Taiwanese Dollars (“NT$”), the currency of Taiwan, Hong Kong Dollars (“HK$”), the currency of Hong Kong, and RMB, the currency of China, respectively, and our financial statements are presented in United States dollars (“USD”, “US$” or “$”). In this annual report, we refer to assets, obligations, commitments and liabilities in our financial statements in USD. These dollar references are based on the exchange rate of NT$, HK$ and RMB to USD, determined as of a specific date. Changes in the exchange rate will affect the amount of our obligations and the value of our assets in terms of USD which may result in an increase or decrease in the amount of our obligations (expressed in USD) and the value of our assets, including accounts receivable (expressed in USD).
| 4 |
ITEM 1. CONDENSED CONSOLIDATED FINANCIAL STATEMENTS (UNAUDITED)
CHINA UNITED INSURANCE SERVICE, INC. AND SUBSIDIARIES
CONSOLIDATED BALANCE SHEETS
| June 30, 2018 | December 31, 2017 | |||||||
| (Unaudited) | ||||||||
| ASSETS | ||||||||
| Current assets | ||||||||
| Cash and cash equivalents | $ | 12,289,286 | $ | 15,473,949 | ||||
| Time deposits | 26,883,900 | 21,470,113 | ||||||
| Marketable securities | 30,894 | 33,381 | ||||||
| Structured deposits | 2,206,313 | 1,248,340 | ||||||
| Accounts receivable | 8,092,502 | 13,301,006 | ||||||
| Contract assets | 1,317,465 | - | ||||||
| Other current assets | 1,317,157 | 2,193,086 | ||||||
| Total current assets | 52,137,517 | 53,719,875 | ||||||
| Property, plant and equipment, net | 1,178,015 | 946,302 | ||||||
| Intangible assets | 670,033 | 775,778 | ||||||
| Long-term investments | 2,544,122 | 1,399,762 | ||||||
| Other assets | 2,081,394 | 2,431,526 | ||||||
| TOTAL ASSETS | $ | 58,611,081 | $ | 59,273,243 | ||||
| LIABILITIES AND STOCKHOLDERS’ EQUITY | ||||||||
| Current liabilities | ||||||||
| Short-term loans | $ | 3,028,417 | $ | 2,350,000 | ||||
| Income tax payable-short term | 2,360,169 | 3,508,790 | ||||||
| Convertible bonds | - | 200,000 | ||||||
| Commissions payable to sales professionals | 6,131,985 | 6,415,071 | ||||||
| Due to related parties | 785,712 | 801,017 | ||||||
| Other current liabilities | 5,624,586 | 6,163,765 | ||||||
| Total current liabilities | 17,930,869 | 19,438,643 | ||||||
| Long-term loans | 116,331 | 248,986 | ||||||
| Income tax payable-long term | 1,103,259 | - | ||||||
| Long-term liabilities | 2,699,833 | 4,842,240 | ||||||
| TOTAL LIABILITIES | 21,850,292 | 24,529,869 | ||||||
| COMMITMENTS AND CONTINGENCIES | ||||||||
| STOCKHOLDERS’ EQUITY | ||||||||
| Preferred stock, par value $0.00001, 10,000,000 authorized, 1,000,000 issued and outstanding | 10 | 10 | ||||||
| Common stock, par value $0.00001, 100,000,000 authorized, 29,452,669 issued and outstanding | 295 | 295 | ||||||
| Additional paid-in capital | 8,190,449 | 8,190,449 | ||||||
| Statutory reserves | 5,739,525 | 5,781,008 | ||||||
| Retained earnings | 7,831,381 | 6,419,937 | ||||||
| Accumulated other comprehensive income | (96,311 | ) | 616,019 | |||||
| Stockholders’ equity attribute to parent’s shareholders | 21,665,349 | 21,007,718 | ||||||
| Noncontrolling interests | 15,095,440 | 13,735,656 | ||||||
| TOTAL STOCKHOLDERS’ EQUITY | 36,760,789 | 34,743,374 | ||||||
| TOTAL LIABILITIES AND STOCKHOLDERS’ EQUITY | $ | 58,611,081 | $ | 59,273,243 | ||||
The accompanying notes are an integral part of these consolidated financial statements.
| 5 |
CHINA UNITED INSURANCE SERVICE, INC. AND SUBSIDIARIES
UNAUDITED CONSOLIDATED STATEMENTS OF OPERATIONS AND OTHER COMPREHENSIVE INCOME (LOSS)
| Three Months Ended June 30, | Six Months Ended June 30, | |||||||||||||||
| 2018 | 2017 | 2018 | 2017 | |||||||||||||
| Revenue | $ | 20,175,337 | $ | 18,518,822 | $ | 37,664,717 | $ | 33,874,350 | ||||||||
| Cost of revenue | 13,696,717 | 11,890,592 | 23,318,420 | 20,674,435 | ||||||||||||
| Gross profit | 6,478,620 | 6,628,230 | 14,346,297 | 13,199,915 | ||||||||||||
| Operating expenses: | ||||||||||||||||
| Selling | 789,400 | 312,122 | 1,427,398 | 698,303 | ||||||||||||
| General and administrative | 4,078,909 | 3,653,864 | 8,030,530 | 7,006,304 | ||||||||||||
| Total operating expense | 4,868,309 | 3,965,986 | 9,457,928 | 7,704,607 | ||||||||||||
| Income from operations | 1,610,311 | 2,662,244 | 4,888,369 | 5,495,308 | ||||||||||||
| Other income (expenses): | ||||||||||||||||
| Interest income | 127,171 | 95,210 | 224,792 | 167,260 | ||||||||||||
| Interest expenses | (28,395 | ) | (8,200 | ) | (51,249 | ) | (16,269 | ) | ||||||||
| Dividend income | 361,571 | 329,749 | 361,571 | 329,749 | ||||||||||||
| Other - net | 114,267 | 166,015 | 194,505 | 47,048 | ||||||||||||
| Total other income, net | 574,614 | 582,774 | 729,619 | 527,788 | ||||||||||||
| Income before income taxes | 2,184,925 | 3,245,018 | 5,617,988 | 6,023,096 | ||||||||||||
| Income tax expense | 369,380 | 755,990 | 2,487,921 | 1,513,269 | ||||||||||||
| Net income | 1,815,545 | 2,489,028 | 3,130,067 | 4,509,827 | ||||||||||||
| Net income attributable to noncontrolling interests | 791,238 | 500,640 | 1,760,106 | 1,185,094 | ||||||||||||
| Net income attributable to parent's shareholders | 1,024,307 | 1,988,388 | 1,369,961 | 3,324,733 | ||||||||||||
| Other comprehensive income | ||||||||||||||||
| Foreign currency translation (loss) gain | (1,308,006 | ) | 31,438 | (712,861 | ) | 744,941 | ||||||||||
| Other | 6 | 248 | 531 | 42,719 | ||||||||||||
| Other comprehensive (loss) income attributable to parent's shareholders | (1,308,000 | ) | 31,686 | (712,330 | ) | 787,660 | ||||||||||
| Other comprehensive (loss) income attributable to noncontrolling interests | (708,329 | ) | (18,230 | ) | (400,322 | ) | 617,406 | |||||||||
| Comprehensive (loss) income attributable to parent's shareholders | $ | (283,693 | ) | $ | 2,020,074 | $ | 657,631 | $ | 4,112,393 | |||||||
| Comprehensive income attributable to noncontrolling interests | $ | 82,909 | $ | 482,410 | $ | 1,359,784 | $ | 1,802,500 | ||||||||
| Weighted average shares outstanding: | ||||||||||||||||
| Basic | 29,452,669 | 29,452,669 | 29,452,669 | 29,452,669 | ||||||||||||
| Diluted | 29,452,669 | 29,500,746 | 29,452,669 | 29,452,669 | ||||||||||||
| Earnings per share attributable to parent's shareholders: | ||||||||||||||||
| Basic | $ | 0.034 | $ | 0.065 | $ | 0.045 | $ | 0.109 | ||||||||
| Diluted | $ | 0.034 | $ | 0.065 | $ | 0.045 | $ | 0.109 | ||||||||
The accompanying notes are an integral part of these consolidated financial statements.
| 6 |
CHINA UNITED INSURANCE SERVICE, INC. AND SUBSIDIARIES
UNAUDITED CONSOLIDATED STATEMENTS OF CASH FLOWS
| Six Months Ended June 30, | ||||||||
| 2018 | 2017 | |||||||
| Cash flows from operating activities: | ||||||||
| Net income | $ | 3,130,067 | $ | 4,509,827 | ||||
| Adjustments to reconcile net income to net cash provided by operating activities: | ||||||||
| Depreciation and amortization | 305,000 | 272,088 | ||||||
| Amortization of bond premium | 134 | 127 | ||||||
| Loss (gain) on valuation of financial assets | 119,441 | (2,124 | ) | |||||
| Loss on disposal of fixed assets | 5,419 | 39,138 | ||||||
| Loss on debt forgiveness | 12,908 | - | ||||||
| Deferred income tax | (43,980 | ) | (23,376 | ) | ||||
| Changes in operating assets and liabilities: | ||||||||
| Accounts receivable | 5,080,989 | 9,381,505 | ||||||
| Contract assets | (1,359,771 | ) | - | |||||
| Other current assets | (617,844 | ) | (220,497 | ) | ||||
| Other assets | 993,243 | (1,115,713 | ) | |||||
| Income tax payable | 83,705 | 13,007 | ||||||
| Commissions payable to sales professionals | (114,865 | ) | (5,193,516 | ) | ||||
| Other current liabilities | (2,416,502 | ) | (3,924,066 | ) | ||||
| Long-term liabilities | (176,123 | ) | (992,495 | ) | ||||
| Net cash provided by operating activities | 5,001,821 | 2,743,905 | ||||||
| Cash flows from investing activities: | ||||||||
| Purchases of time deposits | (25,537,004 | ) | (18,827,390 | ) | ||||
| Proceeds from maturities of time deposits | 18,876,553 | 7,690,359 | ||||||
| Purchases of structured deposits | (4,910,401 | ) | - | |||||
| Proceeds from maturities of structured deposits | 3,905,499 | - | ||||||
| Proceeds from sale of marketable securities | - | 7,417,572 | ||||||
| Purchase of marketable securities | - | (4,896,542 | ) | |||||
| Purchase of long-term investment - REITs | (1,355,038 | ) | - | |||||
| Proceeds from repayment of loan made to RFL | 1,517,316 | - | ||||||
| Purchase of property, plant and equipment | (442,932 | ) | (221,100 | ) | ||||
| Purchase of intangible assets | (43,537 | ) | (65,260 | ) | ||||
| Net cash used in investing activities | (7,989,544 | ) | (8,902,361 | ) | ||||
| Cash flows from financing activities: | ||||||||
| Repayment of convertible bonds | (200,000 | ) | ||||||
| Proceeds from short-term loans | 10,300,000 | - | ||||||
| Repayment of short-term loans | (9,750,000 | ) | - | |||||
| Proceeds from related party borrowing | 493,424 | 257,440 | ||||||
| Repayment to related party borrowing | (557,363 | ) | (559 | ) | ||||
| Net cash provided by financing activities | 286,061 | 256,881 | ||||||
| Foreign currency translation | (331,922 | ) | 1,559,382 | |||||
| Net decrease in cash, cash equivalents and restricted cash | (3,033,584 | ) | (4,342,193 | ) | ||||
| Cash, cash equivalents and restricted cash, beginning balance | 15,473,949 | 20,387,638 | ||||||
| Cash, cash equivalents and restricted cash, ending balance | $ | 12,440,365 | $ | 16,045,445 | ||||
| SUPPLEMENTARY DISCLOSURE: | ||||||||
| Interest paid | $ | 53,412 | $ | 17,699 | ||||
| Income tax paid | $ | 2,469,288 | $ | 1,494,425 | ||||
| SUPPLEMENTARY DISCLOSURE OF CASH FLOWS FOR NON-CASH TRANSACTION: | ||||||||
| Debt forgiveness - related party | $ | - | $ | 32,937 | ||||
The accompanying notes are an integral part of these consolidated financial statements.
| 7 |
NOTE 1 – ORGANIZATION AND PRINCIPAL ACTIVITIES
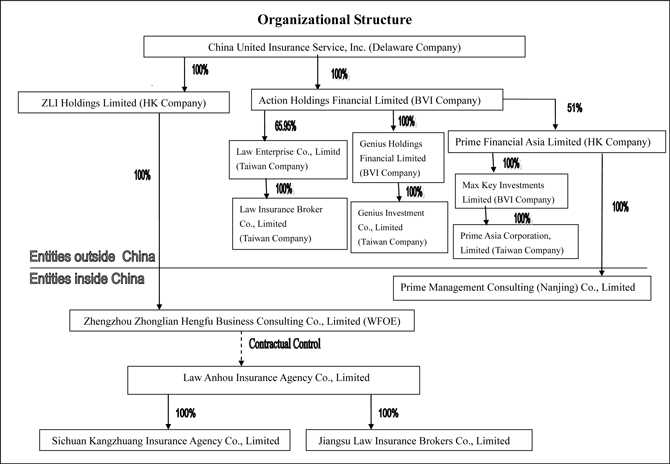
China United Insurance Service, Inc. (“China United”, “CUIS”, or the “Company”) is a Delaware corporation, organized on June 4, 2010 by Yi-Hsiao Mao, a Taiwan citizen, as a listing vehicle for both ZLI Holdings Limited (“CU Hong Kong”) and Action Holdings Financial Limited (“AHFL,” a company incorporated in the British Virgin Islands). The Company’s common stock currently trades over-the-counter under the ticker symbol “CUII” in the OTCQB marketplace.
The corporate structure as of June 30, 2018 is as follows:
| 8 |
NOTE 2 – SUMMARY OF SIGNIFICANT ACCOUNTING POLICIES
Principles of Consolidation
The unaudited consolidated financial statements include the accounts of China United, its subsidiaries and variable interest entities as shown in the corporate structure in Note 1. All significant intercompany transactions and balances have been eliminated in consolidation. Certain reclassifications have been made to the consolidated financial statements for prior years to the current year’s presentation.
Basis of Presentation
The unaudited consolidated financial statements presented herein have been prepared in accordance with accounting principles generally accepted in the United States (“GAAP”) for interim financial information and in accordance with the instructions to Form 10-Q and Regulation S-X. Accordingly, the financial statements do not include all of the information and notes required by GAAP for complete financial statements. In the opinion of management, all adjustments, including normal recurring adjustments, considered necessary for a fair statement of the financial statements have been included. Operating results for the three and six months ended June 30, 2018 are not necessarily indicative of the results that may be expected for the year ending December 31, 2018.
These unaudited consolidated financial statements and notes thereto should be read in conjunction with the Company’s audited consolidated financial statements and notes thereto for the year ended December 31, 2017, which were included in the Company’s 2017 Annual Report on Form 10-K (“2017 Form 10-K”). The accompanying consolidated balance sheet as of December 31, 2017, has been derived from the Company’s audited consolidated financial statements as of that date.
Use of Estimates
The preparation of the Company’s consolidated financial statements in conformity with GAAP requires management to make estimates, judgments and assumptions that affect the amounts reported in the consolidated financial statements and footnotes thereto. Actual results may differ from those estimates and assumptions.
Foreign Currency Transactions
The Company’s financial statements are presented in U.S. dollars ($), which is the Company’s reporting and functional currency. The functional currencies of the Company’s subsidiaries are NTD, RMB and HKD. The resulting translation adjustments are reported under other comprehensive income in accordance with Financial Accounting Standards Board (“FASB”) Accounting Standards Codification (“ASC”) Topic 220 (“ASC 220”), “Reporting Comprehensive Income”. Gains and losses resulting from the translation of foreign currency transactions are reflected in the consolidated statements of operations and other comprehensive income (loss). Monetary assets and liabilities denominated in foreign currency are translated at the functional currency using the rate of exchange prevailing at the balance sheet date. Any differences are taken to profit or loss as a gain or loss on foreign currency translation in the consolidated statements of operations and other comprehensive income (loss).
| 9 |
The Company translates the assets and liabilities into U.S. dollars using the rate of exchange prevailing at the balance sheet date and the statements of operations and cash flows are translated at an average rate during the reporting period. Adjustments resulting from the translation from NTD, RMB and HKD into U.S. dollars are recorded in stockholders’ equity as part of accumulated other comprehensive income. The exchange rates used for financial statements are as follows:
| Average Rate for the Six Months Ended June 30, | ||||||||
| 2018 | 2017 | |||||||
| New Taiwan dollar (NTD) | NTD | 29.519475 | NTD | 30.633866 | ||||
| China yuan (RMB) | RMB | 6.366551 | RMB | 6.837909 | ||||
| Hong Kong dollar (HKD) | HKD | 7.837374 | HKD | 7.773106 | ||||
| United States dollar ($) | $ | 1.000000 | $ | 1.000000 | ||||
| Exchange Rate at | ||||||||
| June 30, 2018 | December 31, 2017 | |||||||
| New Taiwan dollar (NTD) | NTD | 30.461500 | NTD | 29.65568 | ||||
| China yuan (RMB) | RMB | 6.619050 | RMB | 6.50638 | ||||
| Hong Kong dollar (HKD) | HKD | 7.845330 | HKD | 7.81493 | ||||
| United States dollar ($) | $ | 1.000000 | $ | 1.00000 | ||||
Earnings Per Share
Basic earnings per common share (“EPS”) is computed by dividing net income attributable to the common shareholders of the Company by the weighted-average number of common shares outstanding. Diluted EPS is computed in the same manner as basic EPS, except the number of shares includes additional common shares that would have been outstanding if potential common shares with a dilutive effect had been issued.
As the holders of preferred stock of the Company are entitled to share equally with the holders of common stock, on a per share basis, in such dividends and other distributions of cash, property or shares of stock of the Company as may be declared by the board of directors, the preferred stock is a participating security. When calculating the basic earnings per common share, the two-class method is used to allocate earnings to common stock and participating security as required by ASC Topic 260, “Earnings Per Share.” Potential common shares consist primarily of convertible bonds calculated using the if-converted method. However, convertible bonds were excluded from the calculation due to the antidilutive effect except for the three months ended June 30, 2017. The antidilutive common share equivalents excluded from the computation were 45,935 for the three months ended June 30, 2018, and were 54,369 and 45,078 for the six months ended June 30, 2018 and 2017, respectively.
The calculation for basic and diluted EPS is as follows:
| Three Months Ended June 30, | ||||||||
| 2018 | 2017 | |||||||
| Amounts attributable to CUIS common shareholders: | $ | 990,671 | $ | 1,923,094 | ||||
| Effect of dilution | - | 3,000 | ||||||
| Income attributable to CUIS common shareholders after dilution | $ | 990,671 | $ | 1,926,094 | ||||
| Basic weighted-average number of common shares outstanding | 29,452,669 | 29,452,669 | ||||||
| Effect of convertible bond | - | 48,077 | ||||||
| Diluted weighted-average number of common shares outstanding | 29,452,669 | 29,500,746 | ||||||
| Earnings per share attributable to CUIS common shareholders: | ||||||||
| Basic | $ | 0.034 | $ | 0.065 | ||||
| Diluted | $ | 0.034 | $ | 0.065 | ||||
| 10 |
| Six Months Ended June 30, | ||||||||
| 2018 | 2017 | |||||||
| Amounts attributable to CUIS common shareholders: | $ | 1,324,974 | $ | 3,215,556 | ||||
| Effect of dilution | - | - | ||||||
| Income attributable to CUIS common shareholders after dilution | $ | 1,324,974 | $ | 3,215,556 | ||||
| Basic weighted-average number of common shares outstanding | 29,452,669 | 29,452,669 | ||||||
| Effect of convertible bond | - | - | ||||||
| Diluted weighted-average number of common shares outstanding | 29,452,669 | 29,452,669 | ||||||
| Earnings per share attributable to CUIS common shareholders: | ||||||||
| Basic | $ | 0.045 | $ | 0.109 | ||||
| Diluted | $ | 0.045 | $ | 0.109 | ||||
Fair Value of Financial Instruments
Fair value accounting establishes a framework for measuring fair value and expands disclosure about fair value measurements. Fair value, which is defined as the price that would be received to sell an asset or paid to transfer a liability in an orderly transaction between market participants at the measurement date. This framework provides a fair value hierarchy that prioritizes the inputs to valuation techniques used to measure fair value into three levels as follows:
| · | Level 1 inputs to the valuation methodology are quoted prices (unadjusted) for identical assets or liabilities in active markets. |
| · | Level 2 inputs to the valuation methodology include quoted prices for similar assets and liabilities in active markets, and inputs that are observable for the assets or liabilities, either directly or indirectly, for substantially the full term of the financial instruments. |
| · | Level 3 inputs to the valuation methodology are unobservable and significant to the fair value. |
The following fair value hierarchy tables present information about the Company’s assets and liabilities measured at fair value on a recurring basis as of June 30, 2018 and December 31, 2017:
| June 30, 2018 | ||||||||||||||||
| Fair Value | Carrying | |||||||||||||||
| Level 1 | Level 2 | Level 3 | Value | |||||||||||||
| Assets | ||||||||||||||||
| Marketable securities (included in other current assets): | ||||||||||||||||
| Mutual fund | 30,894 | - | - | 30,894 | ||||||||||||
| Structured deposits | - | - | 2,206,313 | 2,206,313 | ||||||||||||
| Long-term investments: | ||||||||||||||||
| Government bonds (available-for-sale debt securities) | - | 100,548 | - | 100,548 | ||||||||||||
| REITs | 1,181,820 | - | - | 1,181,820 | ||||||||||||
| December 31, 2017 | ||||||||||||||||
| Fair Value | Carrying | |||||||||||||||
| Level 1 | Level 2 | Level 3 | Value | |||||||||||||
| Assets | ||||||||||||||||
| Marketable securities (included in other current assets): | ||||||||||||||||
| Mutual fund | 33,381 | - | - | 33,381 | ||||||||||||
| Structured deposits | - | - | 1,248,340 | 1,248,340 | ||||||||||||
| Long-term investments: | ||||||||||||||||
| Government bonds (available-for-sale debt securities) | - | 103,723 | - | 103,723 | ||||||||||||
The following table presents a reconciliation from the opening balances to the closing balances for recurring fair value measurements categorized within level 3 of the fair value hierarchy:
| Opening balance as of January 1, 2018 | $ | 1,248,340 | ||
| Transfer into/ out of Level 3 | - | |||
| Total gains (losses) for the period included in earnings | 17,718 | |||
| Total gains (losses) for the period included in other comprehensive income | - | |||
| Purchases | 4,910,401 | |||
| Settlements | (3,905,499 | ) | ||
| Foreign exchange gains (losses) | (64,647 | ) | ||
| Ending balance as of June 30, 2018 | $ | 2,206,313 |
Changes in unrealized losses for the period included in earnings for assets held at the end of the reporting period are $50,733 and $(19,015) , respectively, for the three and six months ended June 30, 2018.
During the three and six months ended June 30, 2018, there were no assets or liabilities that were transferred between any of the levels.
Marketable securities and long-term investments in REITs – The fair value of the mutual fund and REITs is valued based on quoted market prices in active markets.
Structured deposits – Structured deposits are hybrid instruments containing embedded derivatives. The valuation of the hybrid instruments is predominantly driven by the derivative features embedded within the instruments. The structured deposits as of June 30, 2018 and December 31, 2017 are based on discounted cash flow analyses that consider the embedded derivative and terms and payment structure of the deposits. The embedded derivative features are valued using Black & Scholes option pricing model that used significant unobservable inputs, i.e., volatility of options. The fair value is determined by using the counterparty’s pricing information.
The volatility mentioned above is a pricing input for options. Generally, the higher the volatility of the underlying, the riskier the instrument. Given a long position in an option, an increase in volatility, in isolation, would generally result in an increase in a fair value measurement.
Government bonds – The fair value of government bonds is valued based on theoretical bond price in Taipei Exchange.
The carrying amounts of financial assets and liabilities in the consolidated balance sheets for cash and cash equivalents, time deposits, accounts receivable, short-term loans, due to related parties and accrued expense approximate fair value due to the short-term duration of those instruments.
The amortized cost of the investment in government bonds is $99,200 and $102,029 as of June 30, 2018 and December 31, 2017, respectively. The government bonds will mature on March 17, 2021.
| 11 |
Concentration of Risk
The Company maintains cash with banks in the USA, People’s Republic of China (“PRC” or “China”), Hong Kong, and Taiwan. Should any bank holding cash become insolvent, or if the Company is otherwise unable to withdraw funds, the Company would lose the cash with that bank; however, the Company has not experienced any losses in such accounts and believes it is not exposed to any significant risks on its cash in bank accounts. In Taiwan, a depositor has up to NTD3,000,000 insured by Central Deposit Insurance Corporation (“CDIC”). In China, a depositor has up to RMB500,000 insured by the People’s Bank of China Financial Stability Bureau (“FSD”). In Hong Kong, a depositor has up to HKD500,000 insured by Hong Kong Deposit Protection Board (“DPB”). In the United States, the standard insurance amount is $250,000 per depositor in a bank insured by the Federal Deposit Insurance Corporation (“FDIC”).
Financial instruments that potentially subject the Company to significant concentrations of credit risk consist principally of cash and cash equivalents, time deposits, restricted cash, register capital deposits and accounts receivable. As of June 30, 2018 and December 31, 2017, approximately $1,798,000 and $1,512,000 of the Company’s cash and cash equivalents, time deposits, restricted cash and register capital deposits held by financial institutions, was insured, and the remaining balance of approximately $33,998,000 and $33,949,000, was not insured. With respect to accounts receivable, the Company generally does not require collateral and does not have an allowance for doubtful accounts.
For the three months ended June 30, 2018 and 2017, the Company’s revenues from sale of insurance policies underwritten by these companies were:
| Three Months Ended June 30, | ||||||||||||||||
| 2018 | 2017 | |||||||||||||||
| Amount | % of Total Revenue | Amount | % of Total Revenue | |||||||||||||
| Farglory Life Insurance Co., Ltd. | $ | 4,312,106 | 21 | % | $ | 4,563,775 | 25 | % | ||||||||
| TransGlobe Life Insurance Inc. | 2,533,169 | 13 | % | (* | ) | (* | ) | |||||||||
| Taiwan Life Insurance Co., Ltd. | 2,401,545 | 12 | % | 1,881,893 | 10 | % | ||||||||||
(*) Revenue for the three months ended had not exceeded 10% or more of the consolidated revenue.
For the six months ended June 30, 2018 and 2017, the Company’s revenues from sale of insurance policies underwritten by these companies were:
| Six Months Ended June 30, | ||||||||||||||||
| 2018 | 2017 | |||||||||||||||
| Amount | % of Total Revenue | Amount | % of Total Revenue | |||||||||||||
| Farglory Life Insurance Co., Ltd. | $ | 9,258,162 | 25 | % | $ | 8,774,002 | 26 | % | ||||||||
| Taiwan Life Insurance Co., Ltd. | 5,199,281 | 14 | % | 3,969,250 | 12 | % | ||||||||||
| TransGlobe Life Insurance Inc. | 4,362,188 | 12 | % | (* | ) | (* | ) | |||||||||
(*) Revenue for the six months ended had not exceeded 10% or more of the consolidated revenue.
As of June 30, 2018 and December 31, 2017, the Company’s accounts receivable from these companies were:
| June 30, 2018 | December 31, 2017 | |||||||||||||||
| Amount | % of Total Accounts Receivable | Amount | % of Total Accounts Receivable | |||||||||||||
| Farglory Life Insurance Co., Ltd. | $ | 1,657,179 | 21 | % | $ | 3,430,661 | 26 | % | ||||||||
| Taiwan Life Insurance Co., Ltd | 989,159 | 12 | % | 2,192,668 | 17 | % | ||||||||||
| TransGlobe Life Insurance Inc. | 1,095,948 | 14 | % | 1,811,401 | 14 | % | ||||||||||
The Company’s operations are in the PRC, Hong Kong and Taiwan. Accordingly, the Company’s business, financial condition and results of operations may be influenced by the political, economic, foreign currency exchange and legal environments in the PRC, Hong Kong and Taiwan, and by the state of each economy. The Company’s results may be adversely affected by changes in the political and social conditions in the PRC, Hong Kong and Taiwan, and by changes in governmental policies with respect to laws and regulations, anti-inflationary measures, and rates and methods of taxation, among other things.
| 12 |
New Accounting Pronouncements and Other Guidance
New Accounting Pronouncements Effective January 1, 2018:
Revenue from Contracts with Customers
In May 2014, the FASB issued new accounting guidance related to revenue from contracts with customers. The core principle of the guidance is that recognition of revenue occurs when a customer obtains control of promised goods or services in an amount that reflects the consideration to which the entity expects to be entitled in exchange for those goods or services. In addition, the new guidance requires that companies disclose the nature, amount, timing and uncertainty of revenue and cash flows arising from contracts with customers. The Company adopted the new guidance effective January 1, 2018, using the modified retrospective method, which applies the new guidance beginning in the year of adoption, with the cumulative effect of initially applying the guidance recognized as an adjustment to retained earnings at January 1, 2018. The Company elected to apply the modified retrospective method to all contracts.
The Company’s revenue is derived from insurance agency and brokerage services. The Company, through its subsidiaries, sells insurance products provided by insurance companies to individuals, and is compensated in the form of commissions from the respective insurance companies, according to the terms of each service agreement made by and between the Company and the insurance companies. The sale of an insurance product by the Company is considered complete when initial insurance premium is paid by an individual and the insurance policy is approved by the respective insurance company. When a policy is effective, the insurance company is obligated to pay the agreed-upon commission to the Company under the terms of its service agreement with the Company and such commission is recognized as revenue.
Upon adoption of the new revenue guidance, the timing of revenue recognition remains unchanged. However, the new guidance includes requirements to estimate variable or contingent consideration to be received and recognize variable consideration to the extent that a significant reversal of revenue will not probably occur in subsequent periods. Under the legacy GAAP, the Company recognized certain contingent commissions when fixed or determinable whereas the Company recognizes estimated contingent commissions when the policy has been submitted to insurance companies but yet effective under the new revenue guidance. This results in the revenue recognition accelerated from historical patterns and a shift in timing of quarterly revenue recognized. In addition, the Company recognizes the contingent commission as a contract asset when the performance obligation is fulfilled and the Company has not had the unconditional rights to the payment. As a result, the Company recognizes contract assets to distinguish from accounts receivable.
Since the majority of the Company’s fee arrangements involve contracts that cover a single year of services, the Company does not expect there will be a significant change in the amount of revenue recognized in an annual period.
The cumulative effect of adopting the new standard on January 1, 2018 is nil to the opening balance of retained earnings. The comparative information and prior periods were not restated and will continue to be reported under the legacy accounting standards.
The impact of adoption of the new revenue standard on the Company’s consolidated income statement was as follows:
| Three Months Ended June 30, 2018 | ||||||||||||
As Reported | Revenue Standard Impact | Legacy GAAP | ||||||||||
| Revenue | $ | 20,175,337 | $ | (981,162 | ) | $ | 19,194,175 | |||||
| Cost of revenue | 13,696,717 | - | 13,696,717 | |||||||||
| Gross profit | 6,478,620 | (981,162 | ) | 5,497,458 | ||||||||
| Income before income taxes | 2,184,925 | (981,162 | ) | 1,203,763 | ||||||||
| Income tax income | 369,380 | (191,482 | ) | 177,898 | ||||||||
| Net income | 1,815,545 | (789,680 | ) | 1,025,865 | ||||||||
| Net income attributable to noncontrolling interests | 791,238 | (260,799 | ) | 530,439 | ||||||||
| Net income attributable to parent’s shareholders | $ | 1,024,307 | $ | (528,881 | ) | $ | 495,426 | |||||
| 13 |
| Six Months Ended June 30, 2018 | ||||||||||||
As Reported | Revenue Standard Impact | Legacy GAAP | ||||||||||
| Revenue | $ | 37,664,717 | $ | (1,359,771 | ) | $ | 36,304,946 | |||||
| Cost of revenue | 23,318,420 | - | 23,318,420 | |||||||||
| Gross profit | 14,346,297 | (1,359,771 | ) | 12,986,526 | ||||||||
| Income before income taxes | 5,617,988 | (1,359,771 | ) | 4,258,217 | ||||||||
| Income tax expense | 2,487,921 | (264,888 | ) | 2,223,033 | ||||||||
| Net income | 3,130,067 | (1,094,883 | ) | 2,035,184 | ||||||||
| Net income attributable to noncontrolling interests | 1,760,106 | (360,778 | ) | 1,399,328 | ||||||||
| Net income attributable to parent’s shareholders | $ | 1,369,961 | $ | (734,105 | ) | $ | 635,856 | |||||
The impact of adoption of the new revenue standard on the Company’s consolidated balance sheet was as follows:
| June 30, 2018 | ||||||||||||
| As Reported | Revenue Standard Impact | Legacy GAAP | ||||||||||
| ASSETS | ||||||||||||
| Current assets: | ||||||||||||
| Contract assets | $ | 1,317,465 | $ | (1,317,465 | ) | $ | - | |||||
| Total current assets | 52,137,517 | (1,317,465 | ) | 50,820,052 | ||||||||
| TOTAL ASSETS | $ | 58,611,081 | $ | (1,317,465 | ) | $ | 57,293,616 | |||||
| LIABILITIES AND STOCKHOLDERS’ EQUITY | ||||||||||||
| Total liabilities | 21,850,292 | (256,696 | ) | 21,593,596 | ||||||||
| Total stockholders’ equity | 36,760,789 | (1,060,769 | ) | 35,700,020 | ||||||||
| TOTAL LIABILITIES AND STOCKHOLDERS’ EQUITY | $ | 58,611,081 | $ | (1,317,465 | ) | $ | 57,293,616 | |||||
The impact of adoption of the new revenue standard on the Company’s consolidated statement of cash flows was as follows:
| Six Months Ended June 30, 2018 | ||||||||||||
| As Reported | Revenue Standard Impact | Legacy GAAP | ||||||||||
| Cash flows from operating activities: | ||||||||||||
| Net income | $ | 3,130,067 | $ | (1,094,883 | ) | $ | 2,035,184 | |||||
| Adjustments to reconcile net income to net cash provided by operating activities | ||||||||||||
| Changes in operating assets and liabilities: | ||||||||||||
| Contract assets | (1,359,771 | ) | 1,359,771 | - | ||||||||
| Income tax payable | 83,705 | (256,696 | ) | (172,991 | ) | |||||||
| Net cash provided by operating activities | 5,001,821 | (34,115 | ) | (4,967,706 | ) | |||||||
| Foreign currency translation | (331,922 | ) | 34,115 | (297,807 | ) | |||||||
The adoption of the revenue recognition standard did not have an impact on the Company’s financing or investing cash flows.
| 14 |
Restricted Cash
In November 2016, the FASB issued an Accounting Standards Update (ASU) amending the presentation of restricted cash within the consolidated statements of cash flows. The new guidance requires that restricted cash be added to cash and cash equivalents on the consolidated statements of cash flows. The Company adopted this ASU in the first quarter of 2018 on a retrospective basis with the following impacts to the Company’s prior period consolidated statement of cash flows:
| Six Months Ended June 30, 2017 | ||||||||||||
| Previously Reported* | Adjustments | As Revised | ||||||||||
| Operating activities | $ | 2,527,098 | $ | 216,807 | $ | 2,743,905 | ||||||
| Investing activities | (8,902,361 | ) | - | (8,902,361 | ) | |||||||
| Financing activities | 256,881 | - | 256,881 | |||||||||
| Foreign currency translation | 1,559,382 | - | 1,559,382 | |||||||||
| Net change in cash, cash equivalents, and restricted cash | $ | (4,559,000 | ) | $ | 216,807 | $ | (4,342,193 | ) | ||||
| (*) | The reported amounts have been revised to incorporate the effect of reclassification made to prior year consolidated financial statements. Refer to Note 27 of 2017 Form 10-K. |
Financial Instruments – Recognition and Measurement
On January 1, 2018, the Company adopted, on a prospective basis, new accounting guidance that makes limited changes to the accounting for financial instruments. The changes primarily relate to (i) the requirement to measure equity investments (except those accounted for under the equity method of accounting, or those that result in consolidation of the investee) at fair value, with changes in the fair value recognized in net income, (ii) an alternative approach for the measurement of equity investments that do not have a readily determinable fair value, (iii) the elimination of the other-than-temporary impairment model and its replacement with a requirement to perform a qualitative assessment to identify the impairment of equity investments, and a requirement to recognize impairment losses in net income based on the difference between the fair value and the carrying value of the equity investment, (iv) the elimination of the requirement to disclose the methods and significant assumptions used to estimate the fair value of financial instruments measured at amortized cost, (v) the addition of a requirement to use the exit price concept when measuring the fair value of financial instruments for disclosure purposes and (vi) the addition of a requirement to present financial assets and financial liabilities separately in the notes to financial statements, grouped by measurement category (e.g., fair value, amortized cost, lower of cost or market) and by form of financial asset (e.g., loans, equity securities).
The equity investment without readily determinable fair value held by the Company is the investment in common stocks of Genius Insurance Broker Co., Ltd. The Company elects to measure the equity investment using measurement alternative and records the investment at cost minus impairment, if any, plus or minus changes resulting from qualifying observable prices changes. Adjustments resulting from impairments and observable prices changes are recorded in the income statement. Further, in accordance with the guidance, recurring fair value disclosures are no longer provided for equity securities measured using the measurement alternative. In addition, the existing impairment model has been replaced with a new one-step qualitative impairment model. No initial adoption adjustment was recorded for these instruments since the guidance is required to be applied prospectively for securities measured using the measurement alternative. For the three and six months ended June 30, 2018, there is no impairment indicator and no adjustment to the cost of the equity investment in Genius Insurance Broker Co., Ltd. As of June 30, 2018 and December 31, 2017, the equity investment in Genius Insurance Broker Co., Ltd. is classified under long-term investments and the carrying amount is $1,261,754 and $1,296,039, respectively.
Accounting Standards Issued but Not Yet Adopted
Leases
In February 2016, the FASB issued ASU 2016-02, Leases (Topic 842). The guidance in ASU No. 2016-02 supersedes the lease recognition requirements in ASC Topic 840, Leases (Statement of Financial Accounting Standards No. 13). ASU 2016-02 requires an entity to recognize assets and liabilities arising from a lease for both financing and operating leases, along with additional qualitative and quantitative disclosures. ASU No. 2016-02 is effective for fiscal years beginning after December 15, 2018, with early adoption permitted. The Company is currently evaluating the effect this standard will have on its consolidated financial statements.
Credit Losses
In June 2016, the FASB issued ASC Update No. 2016-13, (Topic 326), Financial Instruments – Credit Losses: Measurement of Credit Losses on Financial Instruments. This ASC update introduces new guidance for the accounting for credit losses on financial instruments within its scope. A new model, referred to as the current expected credit losses model, requires an entity to determine credit-related impairment losses for financial instruments held at amortized cost and to estimate these expected credit losses over the life of an exposure (or pool of exposures). The estimate of expected credit losses should consider both historical and current information, reasonable and supportable forecasts, as well as estimates of prepayments. The estimated credit losses and subsequent adjustment to such loss estimates, will be recorded through an allowance account which is deducted from the amortized cost of the financial instrument, with the offset recorded in current earnings. ASC No. 2016-13 also modifies the impairment model for available-for-sale debt securities. The new model will require an estimate of expected credit losses only when the fair value is below the amortized cost of the asset, thus the length of time the fair value of an available-for-sale debt security has been below the amortized cost will no longer affect the determination of whether a credit loss exists. In addition, credit losses on available-for-sale debt securities will be limited to the difference between the security’s amortized cost basis and its fair value. The updated guidance is effective for interim and annual periods beginning after December 15, 2019. Early adoption is permitted for periods beginning after December 15, 2018. The Company is evaluating the impact of the adoption of ASC Update No. 2016-13 on its financial position and results of operations.
| 15 |
There were other updates recently issued. The management does not believe that other than disclosed above, the recently issued, but not yet adopted, accounting pronouncements will have a material impact on its financial position results of operations or cash flows.
NOTE 3 – CASH, CASH EQUIVALENTS AND RESTRICTED CASH
Cash, cash equivalents and restricted cash consisted of the following as of June 30, 2018 and December 31, 2017:
| June 30, 2018 | December 31, 2017 | |||||||
| Cash and cash equivalents: | ||||||||
| Cash in banks and on hand | $ | 5,986,248 | $ | 11,774,489 | ||||
| Cash equivalent – re-purchase bonds | 4,431,824 | 2,697,628 | ||||||
| Time deposits – with original maturities less than three months | 1,871,214 | 1,001,832 | ||||||
| 12,289,286 | 15,473,949 | |||||||
| Restricted cash – noncurrent (included in other assets) | 151,079 | - | ||||||
| Total cash, cash equivalents and restricted cash shown in the statements of cash flows | $ | 12,440,365 | $ | 15,473,949 | ||||
On December 22, 2017, the Company and China Bills Finance Corporation entered into a repurchase agreement to purchase re-purchase bonds of $2,697,628 (NTD 80,000,000) and with 0.38% interest rate per annum. The re-purchase bonds were due in January and February 2018. During the six months ended June 30, 2018, the Company purchased another re-purchase bonds of $4,431,824 (NTD 135,000,000) and with 0.38% interest rate per annum. The re-purchase bonds are due from time to time during July of 2018.
Restricted cash - noncurrent was a certificate of deposit in the bank by the Company in conformity with Provisions of the Supervision and Administration of Specialized Insurance Agencies, which is not allowed to be withdrawn without the permission of the regulatory commission.
NOTE 4 – TIME DEPOSITS AND STRUCTURED DEPOSITS
| June 30, 2018 | December 31, 2017 | |||||||
| Time deposits – with original maturities less than three months | $ | 1,871,214 | $ | 1,001,832 | ||||
| Time deposits – with original maturities over three months but less than one year | 26,883,900 | 21,470,113 | ||||||
| Total time deposits | $ | 28,755,114 | $ | 22,471,945 | ||||
| Structured deposits | $ | 2,206,313 | $ | 1,248,340 | ||||
Time deposits
As of June 30, 2018 and December 31, 2017, the Company had time deposits of approximately $3,611,116 (NTD 110,000,000) and $1,686,017 (NTD 50,000,000) out of the total $28,755,114 and $22,471,945 time deposits, respectively, pledged as collateral for short-term loans. See Note 5. The amount was recorded in time deposits with original maturities over three months but less than one year.
Structured deposits
On July 7, 2017, the Company entered into an agreement with Cathay United Bank to purchase a 185-day structured deposit in effective on July 7, 2017 and mature on January 8, 2018, with principal approximately $1,229,563 (RMB8,000,000). The structured deposit has an embedded foreign exchange option linked to US Dollar to China Yuan offshore exchange rate (“USDCNH”). Strike price of the structured deposit is set at 7.3 USDCNH and the fixing date is on January 4, 2018. Yield rate will be at 4.1% per annum when the USDCNH is above or equal strike price on the fixing date, or at 3.9% per annum when below.
On February 9, 2018, the Company entered into an agreement with CTBC Bank Co., Ltd. (CTBC) to purchase a one-month FX Swap and Forward Linked structured product in effective on February 13, 2018 and mature on March 29, 2018, with principal approximately $1,273,855 (RMB8,000,000). The structured deposit has an embedded foreign exchange forward linked to USDCNH.
In May and June of 2018, the Company entered into agreements with CTBC to purchase dual currency investment structured products which are embedded a foreign exchange option linked to USDCNH. The settlement amount on the maturity date is referring to the USDCNH on a valuation date which is compared with a pre-determined USDCNH (i.e., strike price). The Company might receive the original investment amount in original currency back or might receive investment amount exchanged into another currency at the strike price back depending on the appreciation or depreciation between US dollar and offshore China Yuan. The Company bears the risk of exchange losses of the investment amount. In addition, the Company will receive interest income at the maturities and the coupon rate ranges from 4.03% to 4.62% per annum.
As of June 30, 2018 and December 31, 2017, the Company had structured deposits of $2,206,313 and $1,248,340, respectively. The loss on valuation of structured deposits was both $6,648 for the three and six months ended June 30, 2018 and was both nil for the three and six months ended June 30, 2017.
| 16 |
NOTE 5 – SHORT-TERM LOANS
The Company’s short-term loans consisted of the following as of June 30, 2018 and December 31, 2017:
| June 30, 2018 | December 31, 2017 | |||||||
| Credit facility, FEIB | $ | 1,500,000 | $ | - | ||||
| Credit facility, O-Bank | 1,400,000 | 1,400,000 | ||||||
| Credit facility, CTBC | - | 950,000 | ||||||
| Subtotal | $ | 2,900,000 | $ | 2,350,000 | ||||
| Current portion of long-term loans (Note 9) | 128,417 | - | ||||||
| Total short-term loans | 3,028,417 | 2,350,000 | ||||||
The Company entered into three credit agreements with several commercial banks as follows:
| · | O-Bank Co., Ltd. (“O-Bank”): The Company entered into a line of credit agreement with O-Bank for a $1,500,000 revolving credit facility from June 22, 2017 to June 21, 2018. The line of credit was renewed on September 4, 2018 and matures on September 3, 2019, with a revolving credit limit raised to $4,000,000. Borrowings under the agreement bear interest at the O-Bank’s cost of fund plus a margin of 0.5%. On December 11, 2017, the Company draw down a borrowing of $600,000 with interest at a rate of 2.35% per annum. On December 26, 2017, the Company borrowed $800,000 with interest at a rate of 2.70% per annum. These amounts were paid off in March of 2018. On June 12, 2018, the Company draw down borrowings of $1,400,000 with interest at rates of 2.89% per annum. The credit facility is secured by a total amount of approximately $1,641,416 (NTD50,000,000) of time deposits. |
| · | Far Eastern International Bank (“FEIB”): On September 21, 2017, the Company entered into a line of credit agreement with FEIB for a revolving credit facility of $2,000,000 from September 21, 2017 to September 21, 2018. Borrowings under the agreement bear interest at the higher of the LIBOR rate plus a margin of 1.3% or the TAIFX3 rate plus a margin of 1.25%. On June 15 and June 22, 2018, the Company draw down borrowings of $1,000,000 and $500,000, respectively, with an annum interest rate of 3.45%. These amounts were paid off in July of 2018.The credit facility is secured by a total amount of approximately $1,969,700 (NTD60,000,000) of time deposits. |
| · | CTBC Bank Co., Ltd. (“CTBC”): On November 17, 2017, the Company entered into a line of credit agreement with CTBC, pursuant to which the Company has a revolving credit facility of $1,000,000 from November 17, 2017 to July 31, 2018. This line of credit was renewed on September 12, 2018 and matures on August 31, 2019, with a revolving credit limit raised to $1,500,000. Borrowings under the agreement bear interest at the CTBC’s cost of fund plus a margin of 1%. On December 28, 2017, the Company draw down a borrowing of $950,000 with interest at a rate of 3.30% per annum. Law Broker is the guarantor of the credit facility. On January 29, 2018, the Company paid off the entire principal and interest of the borrowing. |
Total interest expenses of short-term loans were $17,689 and nil for the three months ended June 30, 2018 and 2017, and were $36,705 and nil for the six months ended June 30, 2018 and 2017.
NOTE 6 – INCOME TAX PAYABLE
The Company’s income tax payable consisted of the following as of June 30, 2018 and December 31, 2017:
| June 30, 2018 | December 31, 2017 | |||||||
| Taiwan Tax | $ | 2,263,277 | $ | 3,232,996 | ||||
| U.S.A. Tax (Note 13) | 1,199,195 | - | ||||||
| PRC Tax | 956 | 270,267 | ||||||
| Hong Kong Tax | - | 5,527 | ||||||
| Total Income tax payable | $ | 3,463,428 | $ | 3,508,790 | ||||
| Income tax payable-short term | $ | 2,360,169 | $ | 3,508,790 | ||||
| Income tax payable-long term (Note 13) | $ | 1,103,259 | $ | - | ||||
| 17 |
NOTE 7 – COMMISSIONS PAYABLE TO SALES PROFESSIONALS
Commissions payable to sales professionals consisted of the following as of June 30, 2018 and December 31, 2017:
| June 30, 2018 | December 31, 2017 | |||||||
| Taiwan | $ | 5,388,495 | $ | 6,206,269 | ||||
| PRC | 743,490 | 208,802 | ||||||
| Hong Kong | - | - | ||||||
| Total commissions payable to sales professionals | $ | 6,131,985 | $ | 6,415,071 | ||||
Commissions payable to sales professionals, salary payable to administrative staff and accrued bonus are usually settled within 12 months.
As of June 30, 2018 and December 31, 2017, the company had the commissions payable obligation to sale professionals amounted $6,131,985 and $6,415,071, respectively.
NOTE 8 – OTHER CURRENT LIABILITIES
Other current liabilities consisted of the following as of June 30, 2018 and December 31, 2017:
| June 30, 2018 | December 31, 2017 | |||||||
| Unearned revenue - current (Note 10) | 1,376,944 | 1,237,684 | ||||||
| Salary payable to administrative staff | 1,082,200 | 1,194,725 | ||||||
| Accrued bonus | 1,052,094 | 1,730,278 | ||||||
| Due to previous shareholders of AHFL | 480,559 | - | ||||||
| Accrued business tax | 616,552 | 487,586 | ||||||
| Withholding tax for others | 390,330 | 347,824 | ||||||
| Accrued labor, health insurance and employee retirement plan | 114,803 | 114,556 | ||||||
| Other accrued liabilities | 511,104 | 1,051,112 | ||||||
| Total other current liabilities | $ | 5,624,586 | $ | 6,163,765 | ||||
Due to previous shareholders of AHFL is the remaining balance payable of the acquisition cost. The Company and the selling shareholders of AHFL entered into a third Amendment to the Acquisition Agreement, pursuant to which, the Company committed to distribute the cash payment in the amount approximately $676,466 (NTD22.5 million) to the selling shareholders of AHFL on or prior to June 30, 2016. On July 21, 2016, the Company arranged for the payment of $153,097 (NTD4,830,514) to the selling shareholders. On March 12, 2017, the Company and the selling shareholders of AHFL entered into a fifth amendment to the acquisition agreement, pursuant to which, the Company agreed to make the cash payment in the amount of $480,559 (NTD15 million) on or prior to March 31, 2019. As such, the amount was reclassified to other current liabilities as of June 30, 2018.
On June 23, 2016, the Company issued two units of the convertible bonds with an aggregate principal amount of $200,000 to a non-US person. On June 22, 2018, the bondholder did not exercise the conversion option and the convertible bonds were paid off. Total interest expense was $2,637 and $3,000 for the three months ended June 30, 2018 and 2017, respectively, and was $5,637 and $6,000 for the six months ended June 30, 2018 and 2017, respectively.
| 18 |
NOTE 9 – LONG-TERM LOANS
The Company’s long-term loans consisted of the following as of June 30, 2018 and December 31, 2017:
| June 30, 2018 | December 31, 2017 | |||||||
| Loan A, interest at 8% per annum, maturity date May 15, 2019 | $ | 128,417 | $ | 130,641 | ||||
| Loan B, interest at 8% per annum, maturity date July 20, 2019 | 116,331 | 118,345 | ||||||
| Total loans | 244,748 | 248,986 | ||||||
| Less: current portion (Note 5) | (128,417 | ) | - | |||||
| Total long-term loans | $ | 116,331 | $ | 248,986 | ||||
Law Anhou Insurance Agency Co., Limited (“Anhou”) in Nanjing City, PRC is a variable interest entity (VIE) of which the Company is the primary beneficiary. The Company contractually control Anhou through CU Hong Kong.
On May 15, 2016, Anhou entered into a loan agreement (“Loan A”) with an individual third party. The loan agreement provided for approximately $128,417 (RMB 850,000) and $130,641 (RMB 850,000) as of June 30, 2018 and December 31, 2017, respectively, loan to the Company. The Loan A bears an interest rate of 8% per annum and interest is payable annually. The principal and the accrued interest will be due on May 15, 2019. As of June 30, 2018, the principal amount was reclassified to current liabilities.
On July 20, 2016, Anhou entered into a loan agreement (“Loan B”) with an individual third party. The loan agreement provided for approximately $116,331 (RMB 770,000) and $118,345 (RMB 770,000) as of June 30, 2018 and December 31, 2017, respectively, loan to the Company. The Loan B bears an interest rate of 8% per annum and interest is payable annually. The principal and the accrued interest will be due on July 20, 2019.
Total interest expenses for the Loan A and Loan B were $5,069 and $5,200, respectively, for the three months ended June 30, 2018 and 2017, and were $8,907 and $10,269, respectively, for the six months ended June 30, 2018 and 2017.
| 19 |
NOTE 10 – LONG-TERM LIABILITIES
The Company’s long-term liabilities consisted of the following as of June 30, 2018 and December 31, 2017:
| June 30, 2018 | December 31, 2017 | |||||||
| Unearned revenue – AIATW | $ | 2,579,368 | $ | 4,239,130 | ||||
| Due to previous shareholders of AHFL (Note 8) | - | 480,559 | ||||||
| Deferred tax liabilities | 120,465 | 122,551 | ||||||
| Total long-term liabilities | $ | 2,699,833 | $ | 4,842,240 | ||||
Unearned revenue – AIATW
On June 10, 2013, AHFL entered into a Strategic Alliance Agreement (the “Alliance Agreement”) with AIA International Limited Taiwan Branch (“AIATW”), the purpose to which is to promote life insurance products provided by AIATW within Taiwan by insurance agencies or brokerage companies affiliated with AHFL or CUIS. The original term of the Alliance Agreement was from June 1, 2013 to May 31, 2018. Pursuant to the terms of the Alliance Agreement, AIATW paid AHFL an execution fee approximately $8,326,700 (NTD250,000,000, including the tax of NTD11,904,762, the “Execution Fee”), which is to be recorded as revenue upon fulfilling sales targets and the 13-month persistency ratio, as defined, over the next five years. The Execution Fee may be required to be recalculated if certain performance targets are not met by AHFL.
On September 30, 2014, AHFL entered into a Strategic Alliance Supplemental Agreement (the “Supplemental Agreement”) with AIATW. In the Supplemental Agreement, the performance targets and the provision about refunding the Execution Fee on a pro rata basis when the performance targets are not met were revised.
On January 6, 2016, AHFL entered into an Amendment 2 to Strategic Alliance Agreement (the “Amendment No. 2”) with AIATW to further revise certain provisions in the Strategic Alliance Agreement and the previous amendment entered into by and between AHFL and AIATW. To the extent permitted by applicable laws and regulations, AHFL shall assist and encourage any insurance agency company or insurance brokerage company duly approved by the competent government authorities of Taiwan (the “Appointed Broker/Agent”), to cooperate with AIATW for the promotion of life insurance products of AIATW. Pursuant to the Amendment No. 2, the expiration date of the Strategic Alliance Agreement was extended from May 31, 2018 to December 31, 2021, and the effect of the Strategic Alliance Agreement during the period from October 1, 2014 to December 31, 2015 was suspended. In addition, both AHFL and AIATW agreed to adjust certain terms and conditions set forth in the Strategic Alliance Agreement, among which: (i) expand the scope of services to be provided by AHFL to AIATW to include, without limitation, assessment and advice on suitability of cooperative partners, advice on product strategies suitable for promotion channel development, advice on promotion/sales channel improvement, advice on promotion channel marketing and strategic planning, and promotion channel talent training; and (ii) remove certain provisions related to performance milestones and refund of Execution Fees. On March 15, 2016, AHFL issued a promise letter (the “2016 Letter”) to AIATW that AHFL is required to (i) fulfill sales targets and (ii) the 13-month persistency ratio.
On June 14, 2017, with AIATW’s consent, the 2016 Letter was revoked in order to conform with the latest terms and conditions regarding the cooperation between AHFL and AIATW as set forth in a third amendment (Amendment No. 3). Pursuant to the Amendment No. 3, both AHFL and AIATW agreed to adjust certain terms and conditions set forth this amendment, among which (i) except the first contract year (April 15th, 2013 to September 30th, 2014), the sales target of the alliance between the parties shall be changed to (a) value of new business (“VONB”) and (b) the 13-month persistency ratio; and (ii) AIATW will calculate and recognize the VONB and 13-month persistency ratio each contract year and inform the Company the result; and (iii) the Company agrees to return the basic business promotion fees to AIATW within thirty (30) days of receipt of the notice sent by AIATW if the Company fails to meet the targets set forth in Amendment No. 3, AIATW reserves the right to offset such amount against the amount payable by it to the Company; and (iv) upon the termination of the Alliance Agreement and its amendments pursuant to the Section 8.2 of the Alliance Agreement, both parties agreed to calculate the amount to be returned or repaid, as applicable, based on the past and current contract years. The Company shall return the basic business promotion fees at NTD 33,000,000 for each contract years within one month after the termination.
| 20 |
The following table presents the amounts recognized as revenue and refund for each contract year:
| Contract Year | Period | Execution Fees | Revenue
Amount |
Revenue
VAT Amount | Refund Amount |
Refund
VAT Amount | ||||||||||||||||
| First | 4/15/2013 ~ 9/30/2014 | NTD | 50,000,000 | NTD | 27,137,958 | (1) | NTD | 1,356,898 | NTD | 20,481,090 | (1) | NTD | 1,024,054 | |||||||||
| Second | 1/1/2016 ~ 12/31/2016 | NTD | 35,000,000 | NTD | 12,855,000 | (2) | NTD | 642,750 | NTD | 20,478,333 | (2) | NTD | 1,023,917 | |||||||||
| Third | 1/1/2017 ~ 12/31/2017 | NTD | 33,000,000 | NTD | 12,628,201 | (3) | NTD | 631,410 | NTD | 18,800,370 | (3) | NTD | 940,019 | |||||||||
| Fourth | 1/1/2018 ~ 12/31/2018 | NTD | 33,000,000 | NTD | 9,838,513 | (4) | NTD | 491,926 | NTD | 21,590,059 | (4) | NTD | 1,079,502 | |||||||||
| Fifth | 1/1/2019 ~ 12/31/2019 | NTD | 33,000,000 | NTD | - | NTD | - | NTD | - | |||||||||||||
| Sixth | 1/1/2020 ~ 12/31/2020 | NTD | 33,000,000 | NTD | - | NTD | - | NTD | - | |||||||||||||
| Seventh | 1/1/2021 ~ 12/31/2021 | NTD | 33,000,000 | NTD | - | NTD | - | NTD | - | |||||||||||||
| TOTAL | NTD | 250,000,000 | NTD | 62,459,672 | NTD | 3,122,984 | NTD | 81,349,852 | NTD | 4,067,492 | ||||||||||||
| (1) | The revenue recognition for the first contract year is based on the annual first year premium (“AFYP”) set in Alliance Agreement, which is different from other contract years. From the second contract year to the seventh contract year, the revenue calculation is based on VONB. The Company recognized the first contract year’s revenue amount of $892,742 (NTD27,137,958), net of Value-Added Tax (“VAT”) in 2017 due to uncertainty resolved after Amendment 3 went effective. Besides, on December 3, 2015 and February 23, 2016, the Company refunded the amounts of $160,573 (NTD4,761,905), net of VAT, and $530,056 (NTD15,719,185), net of VAT, to AIATW, respectively, due to the portion of performance sales targets not met during the first contract year based on original agreement and earlier amendments. |
| (2) | For the year ended December 31, 2017, the Company recognized the second contract year’s revenue amount of $422,883 (NTD12,855,000), net of VAT, and refunded the amount of $690,537 (NTD20,478,333), net of VAT, due to uncertainty resolved after Amendment 3 went effective. |
| (3) | For the year ended December 31, 2017, the Company recognized the third contract year’s revenue amount of $415,423 (NTD12,628,201), net of VAT, and estimated refund amount of $633,955 (NTD18,800,370), net of VAT, for the same contract period based on the calculation of VONB and 13-month persistency. The revenue recorded and refund amounts were trued up to $412,230 (NTD12,068,571) and $661,286 (NTD19,360,000), respectively, in the six months ended June 30, 2018 based on notice received from AIATW. |
| (4) | The Company estimates VONB and 13-month persistency ratio for the year ending December 31, 2018 and calculated the revenue amount to be $336,058 (NTD9,838,513) for the year. The amounts will be reassessed every quarter until receiving AIATW’s notice. |
The Company recognized revenue of $87,330 (NTD2,599,536) and $1,305,514 (NTD39,992,958), net of VAT, for the three months ended June 30, 2018 and 2017, and $157,008 (NTD4,639,443) and $1,305,514 (NTD39,992,958), net of VAT, for the six months ended June 30, 2018 and 2017 related to this agreement. As of June 30, 2018 and December 31, 2017, the Company had non-current portion of unearned revenue of $2,579,368 and $4,239,130, respectively, and amounts in other current liabilities of $1,376,944 and $633,955, respectively, related to the Alliance Agreement.
Unearned revenue – Farglory
On April 20, 2016, the Company entered into a service agreement (“Service Agreement”) with Farglory. The Company was to provide consulting services to Farglory for NTD4,000,000 per year and the aggregate consulting services fee was NTD20,000,000 from May 1, 2016 to April 30, 2021. On January 2, 2018, both parties reached the final agreement and the Company received termination notice from Farglory. Pursuant to the termination notice, the Company should refund approximately $603,729 (NTD17,904,000) to Farglory which was paid off in January 2018.
NOTE 11 – REVENUE
The Company’s revenue is derived from insurance agency and brokerage services. The Company, through its subsidiaries, sells insurance products provided by insurance companies to individuals, and is compensated in the form of commissions from the respective insurance companies, according to the terms of each service agreement made by and between the Company and the insurance companies. The sale of an insurance product by the Company is considered complete when initial insurance premium is paid by an individual and the insurance policy is approved by the respective insurance company. When a policy is effective, the insurance company is obligated to pay the agreed-upon commission to the Company under the terms of its service agreement with the Company and such commission is recognized as revenue.
The Company considers the contracts with insurance companies contain one performance obligation and consideration should be recorded when performance obligation is satisfied at point in time. The amount of revenue to be recognized when the insurance policy is effective includes first year commission and other contingent commission that a significant reversal of revenue would not occur in the subsequent periods. When other contingent commission that could not be determined if a significant reversal of revenue would occur, the Company recognizes the commission after receiving insurance companies’ notice. The revenue by segment is disaggregated as below:
| Three Months Ended June 30, | ||||||||
| 2018 | 2017 | |||||||
| Geographical Areas | ||||||||
| Revenue | ||||||||
| Taiwan | $ | 16,998,019 | $ | 15,956,177 | ||||
| PRC | 3,166,721 | 2,543,599 | ||||||
| Hong Kong | 41,085 | 29,999 | ||||||
| Elimination adjustment | (30,488 | ) | (10,593 | ) | ||||
| Total revenue | $ | 20,175,337 | $ | 18,518,822 | ||||
| Six Months Ended June 30, | ||||||||
| 2018 | 2017 | |||||||
| Geographical Areas | ||||||||
| Revenue | ||||||||
| Taiwan | $ | 31,738,791 | $ | 28,377,258 | ||||
| PRC | 5,875,342 | 5,435,531 | ||||||
| Hong Kong | 81,072 | 72,514 | ||||||
| Elimination adjustment | (30,488 | ) | (10,953 | ) | ||||
| Total revenue | $ | 37,664,717 | $ | 33,874,350 | ||||
| 21 |
The prior year information in the above table has not been adjusted under the modified retrospective method of adoption of the new revenue recognition guidance.
Contract Assets and Unearned Revenue
| June 30, 2018 | December 31, 2017 | |||||||
| Contract assets – current | $ | 1,317,465 | $ | - | ||||
| Unearned revenue – current (Note 8) | 1,376,944 | 1,237,684 | ||||||
| Unearned revenue – noncurrent (Note 10) | 2,579,368 | 4,239,130 | ||||||
Contract assets are the Company’s conditional rights to consideration for completed performance obligation. The Company recognizes the contingent commission as a contract asset when the performance obligation is fulfilled, and the Company has not had the unconditional rights to the payment.
Unearned revenue relates to advances received prior to performance under the contract. The related contracts are the Alliance Agreement with AIATW and the Service Agreement with Farglory which are disclosed in Note 10 to the consolidated financial statements.
NOTE 12 – NONCONTROLLING INTERESTS
Noncontrolling interests consisted of the following as of June 30, 2018 and December 31, 2017:
| Name of Controlled Entity | % of Non- controlling Interests | As of December 31, 2017 | Net Income (Loss) of Non-Controlling Interests | Other Comprehensive Income (Loss) of Non-Controlling Interests | As of June 30, 2018 | |||||||||||||||
| Law Enterprise | 34.05 | % | $ | (243,240 | ) | $ | 260,256 | $ | (24,137 | ) | $ | (7,121 | ) | |||||||
| Law Broker | 34.05 | % | 13,900,341 | 1,524,228 | (374,889 | ) | 15,049,680 | |||||||||||||
| PFAL | 49.00 | % | 228,079 | (26,365 | ) | (467 | ) | 201,247 | ||||||||||||
| MKI | 49.00 | % | (2,117 | ) | (514 | ) | - | (2,631 | ) | |||||||||||
| PA Taiwan | 49.00 | % | (145,442 | ) | 2,525 | (697 | ) | (143,614 | ) | |||||||||||
| PTC Nanjing | 49.00 | % | (1,965 | ) | (24 | ) | (132 | ) | (2,121 | ) | ||||||||||
| Total | $ | 13,735,656 | $ | 1,760,106 | $ | (400,322 | ) | $ | 15,095,440 | |||||||||||
| Name of Controlled Entity | % of Non- controlling Interests | As of December 31, 2016 | Net Income (Loss) of Non-Controlling Interests | Other Comprehensive Income (Loss) of Non-Controlling Interests | As of December 31, 2017 | |||||||||||||||
| Law Enterprise | 34.05 | % | $ | 17,386 | $ | (307,217 | ) | $ | 46,591 | $ | (243,240 | ) | ||||||||
| Law Broker | 34.05 | % | 9,621,159 | 3,387,038 | 892,144 | 13,900,341 | ||||||||||||||
| PFAL | 49.00 | % | 232,414 | (3,817 | ) | (518 | ) | 228,079 | ||||||||||||
| MKI | 49.00 | % | (1,569 | ) | (548 | ) | - | (2,117 | ) | |||||||||||
| PA Taiwan | 49.00 | % | (95,448 | ) | (52,169 | ) | 2,175 | (145,442 | ) | |||||||||||
| PTC Nanjing | 49.00 | % | (2,400 | ) | (60 | ) | 495 | (1,965 | ) | |||||||||||
| Total | $ | 9,771,542 | $ | 3,023,227 | $ | 940,887 | $ | 13,735,656 | ||||||||||||
| 22 |
NOTE 13 – INCOME TAX
The following table reconciles the Company’s statutory tax rates to effective tax rates for the three and six months ended June 30, 2018 and 2017:
| Three Months Ended June 30, | ||||||||
| 2018 | 2017 | |||||||
| US statutory rate | 21 | % | 34 | % | ||||
| Tax rate difference | (1 | )% | (19 | )% | ||||
| Tax base difference | 1 | % | 1 | % | ||||
| Income tax on undistributed earnings | 4 | % | - | % | ||||
| Loss in subsidiaries | (1 | )% | 4 | % | ||||
| Un-deductible and non-taxable items | (4 | )% | 3 | % | ||||
| True up of prior year income tax | (44 | )% | - | % | ||||
| Withholding tax | 41 | % | ||||||
| Effective tax rate | 17 | % | 23 | % | ||||
| Six Months Ended June 30, | ||||||||
| 2018 | 2017 | |||||||
| US statutory rate | 21 | % | 34 | % | ||||
| Tax rate difference | (1 | )% | (18 | )% | ||||
| Tax base difference | 1 | % | 1 | % | ||||
| Income tax on undistributed earnings | 4 | % | - | % | ||||
| Loss in subsidiaries | - | % | 4 | % | ||||
| Un-deductible and non-taxable items | (1 | )% | 4 | % | ||||
| True up of prior year income tax | 4 | % | - | % | ||||
| Withholding tax | 16 | % | - | % | ||||
| Effective tax rate | 44 | % | 25 | % | ||||
The Company’s income tax expense is mainly contributed by its subsidiaries in Taiwan and PRC.
The Company’s subsidiaries in Taiwan are governed by the Income Tax Law of Taiwan which was amended in February 2018. The major change is to increase the statutory tax rate on income reported in the statutory financial statements after appropriate adjustments from 17% to 20% starting from the beginning of 2018. In the meanwhile, Income Tax Law of Taiwan provides that a company is taxed at additional 10% on any undistributed earnings which was reduced to 5% by the amended Income Tax Law of Taiwan. The Company has recorded the income tax expense of $21,878 for remeasuring the Company’s deferred tax as a result of increase in tax rate in the six months ended June 30, 2018.
In June 2018, the shareholders of Law Enterprise Co., Limited (Law Enterprise), the Company’s majority owned subsidiary and is incorporated in Taiwan approved to distribute accumulated earnings to shareholders including Action Holdings Financial Limited (AHFL), the Company’s wholly owned subsidiary. Under the Income Tax Law of Taiwan, the distributed earning is not subject to the undistributed earning tax and the foreign shareholders of a Taiwan company will bear 21% of withholding tax after deducting certain tax credits as allowed by the Income Tax Law of Taiwan for the dividend received. As a result of the earning distribution of Law Enterprise, Law Enterprise reversed $921,196 of the undistributed earning tax liability accrued in prior years and AHFL accrued $880,726 of the withholding tax liability that cannot be deducted in its tax jurisdiction.
CU WFOE and the VIE in the PRC are governed by the Income Tax Law of the PRC concerning the private-run enterprises, which are generally subject to tax at 25% on income reported in the statutory financial statements after appropriated adjustments, except for Jiangsu. For Jiangsu, according to the requirement of local tax authorities, the tax basis is deemed as 10% of total revenue, instead of net income.
As of December 31, 2017, Anhou and its branches elected to file joint tax returns under PRC tax jurisdiction. Due to the adoption of this filing method, operating loss in the branches from the year 2016 and prior years can no longer deduct earnings beginning in the year 2017. However, any loss incurred in any of the branches in the joint tax return will be consolidated and any further loss in the joint tax return can be carried over to the five years from the year 2017.
The Company’s subsidiaries in Hong Kong are governed by the Inland Revenue Ordinance Tax Law of Hong Kong and are generally subject to a profit tax at the rate of 16.5% on the estimated assessable profits.
The 2017 Tax Cuts and Jobs Act (the “2017 Tax Act”) was enacted into law on December 22, 2017. The 2017 Tax Act significantly revised the U.S. corporate income tax by, among other things, lowering the statutory corporate tax rate from 35% to 21%, eliminating certain deductions, imposing a mandatory one-time tax on accumulated earnings of foreign subsidiaries, introducing new tax regimes, and changing how foreign earnings are subject to U.S. tax. The Company has determined the implication of the tax rate reduction which does not have any impact on the consolidated financial statements. One-time transition tax is based on the Company’s total post-1986 earnings and profits (“E&P”) that it previously deferred from U.S. income taxes. The Company completed its calculation and recorded $1,199,195 of the transition tax on undistributed earnings of non-U.S. subsidiaries during the six months ended June 30, 2018. The Company recorded $95,936 and $1,103,259 of income tax payable as current liabilities and long-term liabilities based on the statutory due date as of June 30, 2018.
In addition, the 2017 Tax Act also creates a new requirement that certain income (i.e., GILTI) earned by controlled foreign corporations (“CFCs”) must be included currently in the gross income of the CFCs’ U.S. shareholder. GILTI is the excess of the shareholder’s net CFC tested income over the net deemed tangible income return, which is currently defined as the excess of (1) 10 percent of the aggregate of the U.S. shareholder’s pro rata share of the qualified business asset investment of each CFC with respect to which it is a U.S. shareholder over (2) the amount of certain interest expense taken into account in the determination of net CFC-tested income. The FASB Staff Q&A, Topic 740 No. 5, Accounting for Global Intangible Low-Taxed Income, states that an entity can make an accounting policy election to either recognize deferred taxes for temporary differences expected to reverse as GILTI in future years or provide for the tax expense related to GILTI in the year that tax is incurred. The Company has elected to recognize the tax on GILTI as a period expense in the period the tax is incurred. For the three months and six months ended June 30, 2018, no GILTI tax obligation existed, nil GILTI tax expense was recorded.
| 23 |
NOTE 14 – RELATED PARTY TRANSACTIONS
Due to related parties
The following summarizes the Company’s loans payable to related parties as of June 30, 2018 and December 31, 2017:
| June 30, 2018 | December 31, 2017 | |||||||
| Due to Mr. Mao (Principal shareholder of the Company)* | $ | 403,300 | $ | 409,054 | ||||
| Due to Ms. Lu (Shareholder of Anhou)* | 113,309 | 161,380 | ||||||
| Due to I Health Management Corp** | - | 17,703 | ||||||
| Accrued bonus for Ms. Chao*** | 266,730 | 210,752 | ||||||
| Others | 2,373 | 2,128 | ||||||
| Total | $ | 785,712 | $ | 801,017 | ||||
*Amounts due to Mr. Mao and Ms. Lu bear no interest and are payable on demand.
**25% of I Health Management Corp’s shares are owned by Multiple Capital Enterprise, and 24% of Multiple Capital Enterprise’s shares are owned by members of the Company’s management level.
***On May 10, 2016, Law Broker entered into an engagement agreement (“Engagement Agreement”) with Hui-Hsien Chao (“Ms. Chao”), pursuant to which, she serves as the general manager of Law Broker from December 29, 2015 to December 28, 2018. Ms. Chao’s primary responsibilities are to assist Law Broker in operating and managing insurance agency business. According to the Engagement Agreement, Ms. Chao’s Bonus plans include: 1) execution, 2) long-term service fees, 3) pension and 4) non-competition. The payment of such bonuses will only occur upon satisfaction of certain condition and subject to the terms in the Engagement Agreement. Ms. Chao acts as the general manager or equivalent position of Law Broker for a term of at least three years. On March 13, 2017, Law Broker and Ms. Chao entered into an amendment to the Engagement above-mentioned Agreement to specify 1) Ms. Chao’s pension calculation assumptions and start date, and 2) the non-competition provision start date. As of June 30, 2018 and December 31, 2017, the Company had current liabilities amounted $266,730 and $210,752, respectively, related to accrued bonus for Ms. Chao.
Lease Agreements
On February 1, 2018, Prime Asia Corporation, Limited, the Company’s majority owned subsidiary entered into a lease agreement with Apex Biz Solution Limited (“Apex,” was formerly known as Prime Technology Corp.) Apex is a related party of the Company because it is affiliated to the Company’s management. The lease is to lease the office space in Taipei City to Apex. The lease term is for 10 months commencing on February 1, 2018, with a monthly base rent of approximately $678 (NTD 20,000). The Company recorded rent income of $2,022 and $3,388 for the three and six months ended June 30, 2018.
On July 1, 2016, the Company entered into lease agreements with Yuli Broker and Yuli Investment separately, to lease their Nan-King East Road office space in Taipei City. The lease terms were both for one year commencing on July 1, 2016 and ending on June 30, 2017, with an annual base rent approximately of $610 (NTD18,000). On June 30, 2017, these lease agreements were extended automatically to June 30, 2018. The Company recorded rent income of $288 and $284, respectively, for the three months ended June 30, 2018 and 2017, and$580 and $560, respectively, for the six months ended June 30, 2018 and 2017.
Yuli Broker and Yuli Investment are owned by Ms. Lee who is the Director of Law Broker. The Company plans to invest in Yuli Broker and the application of the investment was approved by Investment Commission of the Ministry of Economic Affairs in Taiwan in January 2018. As of June 30, 2018, the Company has not commenced the investment.
Advisory Agreements
On May 2, 2016, the Company entered into an advisory agreement with I Health who is contracted to provide 10,000 Taiwan citizen’s health information to the Company. The total advisory fee was approximately $42,000 (NTD1,275,000). For the three and six months ended June 30, 2017, the Company had cost of revenue related to I Health amounted $3,436 and $13,213, respectively. The Company had due to I Health $17,703 as of December 31, 2017.
On December 7, 2016, the Company entered into an advisory agreement with Mr. Fu Chang Li, the Director of the Company. Pursuant to this Advisory Agreement, Mr. Li provided investment consulting services to the Company from December 7, 2016 to December 6, 2017. On December 7, 2017, both parties agreed to extend this advisory agreement from December 7, 2017 to December 6, 2018. The total advisory fee was approximately $60,977 (NTD1,800,000). For the three and six months ended June 30, 2018 and 2017, the Company recognized $30,006 and $28,273, respectively, general and administrative expenses in connection to this advisory agreement.
Consulting Agreement
On November 1, 2016, the Company entered into a consulting agreement with Apex pursuant to which the Company would provide administrative operational consulting services to Apex from November 1, 2016 through December 31, 2021. As of June 30, 2018 and December 31, 2017, the Company had accounts receivable amounted $7,973 and $17,231, respectively. The Company also had revenue amounted $8,089 and $6,051 for the three months ended June 30, 2018 and 2017, respectively, and $24,842 and $16,633 for the six months ended June 30, 2018 and 2017, respectively.
| 24 |
NOTE 15 – COMMITMENTS AND CONTINGENCIES
Operating Leases
The Company has operating leases for its offices. Rental expenses for the three months ended June 30, 2018 and 2017 were $735,916 and $666,035, respectively, and for the six months ended June 30, 2018 and 2017 were $1,399,331 and $1,237,058, respectively. On June 30, 2018, total future minimum annual lease payments under operating leases were as follows, by 12-month trailing period:
| Twelve months ending June 30, 2019 | $ | 2,176,430 | ||
| Twelve months ending June 30, 2020 | 1,044,433 | |||
| Twelve months ending June 30, 2021 | 497,484 | |||
| Twelve months ending June 30, 2022 | 35,340 | |||
| Twelve months ending June 30, 2023 | 5,023 | |||
| Thereafter | - | |||
| Total | $ | 3,758,710 |
Legal Proceedings
On December 20, 2018, the Company and one of the Company’s former employees, agreed to settle fraud charges brought by the SEC relating to a scheme to manipulate the Company's trading volume for the purpose of obtaining a listing on Nasdaq. Neither the Company nor the former employee realized financial gain from the scheme. Both the Company and the former employee agreed to the entry of a final judgment that enjoins them from violating the charged provisions of the federal securities laws, orders the Company to comply with its undertaking to retain an independent compliance monitor for a period of not less than one year. The SEC did not seek a monetary penalty against the Company and there is no financial impact to the Company. For further information, please see the Company’s current report, as amended, filed on Form 8-K/A on January 22, 2019 (the “Amended Current Report”). The Amended Current Report and exhibits thereto are incorporated by reference into this Quarterly Report.
NOTE 16 – SEGMENT REPORTING
The Company managed and reviewed its business as three operating segments. The business of CU WFOE, CU Hong Kong and the Company’s Consolidated Affiliated Entities (“CAE”) in PRC was managed and reviewed as the PRC segment. The business of AHFL and its subsidiaries in Taiwan was managed and reviewed as Taiwan segment. The business of PFAL was managed and reviewed as Hong Kong segment. The PRC and Taiwan segments are substantially all of the reported consolidated amounts.
The geographical distributions of the Company’s financial information for the three months ended June 30, 2018 and 2017 were as follows:
| Three Months Ended June 30, | ||||||||
| 2018 | 2017 | |||||||
| Geographical Areas | ||||||||
| Revenue | ||||||||
| Taiwan | $ | 16,998,019 | $ | 15,956,177 | ||||
| PRC | 3,166,721 | 2,543,599 | ||||||
| Hong Kong | 41,085 | 29,999 | ||||||
| Elimination adjustment | (30,488 | ) | (10,953 | ) | ||||
| Total revenue | $ | 20,175,337 | $ | 18,518,822 | ||||
| Income (loss) from operations | ||||||||
| Taiwan | $ | 1,413,390 | $ | 2,747,948 | ||||
| PRC | 208,513 | (86,560 | ) | |||||
| Hong Kong | (42,698 | ) | (32,371 | ) | ||||
| Elimination adjustment | 31,106 | 33,227 | ||||||
| Total income from operations | $ | 1,610,311 | $ | 2,662,244 | ||||
| Net income (loss) | ||||||||
| Taiwan | $ | 1,638,309 | $ | 2,648,304 | ||||
| PRC | 220,936 | (128,350 | ) | |||||
| Hong Kong | (42,756 | ) | (32,356 | ) | ||||
| Elimination adjustment | (944 | ) | 1,430 | |||||
| Total net income | $ | 1,815,545 | $ | 2,489,028 | ||||
The geographical distributions of the Company’s financial information for the six months ended June 30, 2018 and 2017 were as follows:
| Six Months Ended June 30, | ||||||||
| 2018 | 2017 | |||||||
| Geographical Areas | ||||||||
| Revenue | ||||||||
| Taiwan | $ | 31,738,791 | $ | 28,377,258 | ||||
| PRC | 5,875,342 | 5,435,531 | ||||||
| Hong Kong | 81,072 | 72,514 | ||||||
| Elimination adjustment | (30,488 | ) | (10,953 | ) | ||||
| Total revenue | $ | 37,664,717 | $ | 33,874,350 | ||||
| Income (loss) from operations | ||||||||
| Taiwan | $ | 4,593,112 | $ | 5,304,129 | ||||
| PRC | 281,703 | 163,028 | ||||||
| Hong Kong | (52,782 | ) | (38,296 | ) | ||||
| Elimination adjustment | 66,336 | 66,447 | ||||||
| Total income from operations | $ | 4,888,369 | $ | 5,495,308 | ||||
| Net income (loss) | ||||||||
| Taiwan | $ | 2,893,777 | $ | 4,505,169 | ||||
| PRC | 289,404 | 54,608 | ||||||
| Hong Kong | (53,805 | ) | (52,941 | ) | ||||
| Elimination adjustment | 691 | 2,991 | ||||||
| Total net income | $ | 3,130,067 | $ | 4,509,827 | ||||
| 25 |
The geographical distribution of the Company’s financial information as of June 30, 2018 and December 31, 2017 were as follows:
| June 30, 2018 | December 31, 2017 | |||||||
| Geographical Areas | ||||||||
| Long-lived assets | ||||||||
| Taiwan | $ | 1,049,915 | $ | 836,347 | ||||
| PRC | 127,057 | 109,597 | ||||||
| Hong Kong | 1,043 | 358 | ||||||
| Elimination adjustment | - | - | ||||||
| Total long-lived assets | $ | 1,178,015 | $ | 946,302 | ||||
| Reportable assets | ||||||||
| Taiwan | $ | 95,787,654 | $ | 96,399,321 | ||||
| PRC | 12,668,105 | 11,140,124 | ||||||
| Hong Kong | 502,740 | 643,881 | ||||||
| Elimination adjustment | (50,347,418 | ) | (48,910,083 | ) | ||||
| Total reportable assets | $ | 58,611,081 | $ | 59,273,243 | ||||
| Capital Investment | ||||||||
| Taiwan | $ | 391,598 | $ | 348,028 | ||||
| PRC | 50,337 | 34,445 | ||||||
| Hong Kong | 997 | - | ||||||
| Elimination adjustment | - | - | ||||||
| Total capital investment | $ | 442,932 | $ | 382,473 | ||||
NOTE 17 – SUBSEQUENT EVENTS
The Company has evaluated subsequent events through the date these consolidated financial statements were issued and determine that there were no subsequent events or transactions that require recognition or disclosures in the consolidated financial statements except for the followings:
In July of 2018 the Company acquired Joint Broker Co., Limited (“JIB”), previously known as Kao Te Insurance Broker (KT Broker), through Genius Investment Co., Limited (“GIC”). On July 1, 2018, GIC entered into an acquisition agreement (“KT Broker Acquisition Agreement”) with the selling shareholder of KT Broker, Ms. Ma Xiu Lan. Pursuant to the KT Broker Acquisition Agreement, GIC agreed to pay $29,545 (NTD 900,000) in exchange for the insurance brokerage licenses issued to KT Broker by the Taiwanese government, along with right to the KT Broker company name and $13,131 (NTD 400,000) of legal deposits. The Company has no intention of operating the KT Broker existing brokerage business nor retain any of its sales personnel, therefore the Company recognized only the acquisition of assets as part of this transaction. Under Taiwanese law, the brokerage license is undetachable from the KT Broker legal entity and the entity itself cannot be dissolved, so the Company renamed KT Broker to Joint Insurance Broker Co., Limited (“JIB”) to serve as a holding entity for the brokerage licenses.
On September 21, 2017, the Company entered into a line of credit agreement with FEIB (Far Eastern International Bank Co., Ltd.) for a revolving credit facility of $2,000,000. It was renewed on October 26, 2018, with the revolving credit limit raised to $2,500,000. Borrowing under the agreement bear interest with respect to US Dollars, interest rate shall be at the higher of LIBOR or TAIFX3 for a period equal to the term of the utilization or the next longer tenor for which rates are quoted, plus 0.85%, with margin to be adjusted every three months and may be negotiated on a case-by-case basis based on the Bank’s funding status.
On September 19, 2018, the Company entered into a line of credit agreement with KGI (KGI Commercial Bank Co., Ltd.) for a revolving credit facility of $1,600,000. Borrowing under the agreement bear interest according to one business day before borrowing, with Reuters provide LIBOR’s three months Fixing Rate, every three months is interest rate period plus 0.9% annual interest rate, plus tax and renew when it’s due. KGI has the right to negotiate case-by-case basis based on Bank’s funding status.
| 26 |
ITEM 2. MANAGEMENT’S DISCUSSION AND ANALYSIS OF FINANCIAL CONDITIONS AND RESULTS OF OPERATIONS.
The following discussion of the results of operations and financial condition should be read in conjunction with our condensed consolidated financial statements and notes thereto included in Item 1 of this report. This report, including the information incorporated by reference, contains forward-looking statements as defined in the Private Securities Litigation Reform Act of 1995. The use of any of the words “believe,” “expect,” “anticipate,” “plan,” “estimate,” and similar expressions are intended to identify such statements. Forward-looking statements include statements concerning our possible or assumed future results. The actual results that we achieve may differ materially from those discussed in such forward-looking statements due to the risks and uncertainties described in the Risk Factors section of this report, in Management’s Discussion and Analysis of Financial Condition and Results of Operations, and in other sections of this report, as well as in our annual report on Form 10-K. We undertake no obligation to update any forward-looking statements.
Overview
The Company primarily provides insurance brokerage and agency services pertaining to two broad categories of insurance products, life insurance products and property and casualty insurance products, in Taiwan and People’s Republic of China (“PRC”). The Company also provides reinsurance brokerage services in Hong Kong. The percent contribution of reinsurance brokerage to our total revenue is less than 1%. Insurance products that the Company’s subsidiaries sell are underwritten by some of the leading insurance companies in Taiwan and PRC.
| (1) | Life Insurance Products |
Total net revenue from Taiwan life insurance products accounted for 77.90% and 80.69% of total net revenue for the three months ended June 30, 2018 and 2017, respectively. Total net revenue from PRC life insurance products accounted for 15.37% and 13.24% of total net revenue for the three months ended June 30, 2018 and 2017, respectively.
Total net revenue from Taiwan life insurance products accounted for 77.81% and 78.08% of total net revenue for the six months ended June 30, 2018 and 2017, respectively. Total net revenue from PRC life insurance products accounted for 15.17% and 15.18% of total net revenue for the six months ended June 30, 2018 and 2017, respectively.
Most individual life insurance products we distribute provide policyholders the options of making one single, lump-sum premium payment at the beginning of the policy term, or making periodic premium payments. If a periodic payment schedule is adopted by the policyholder, a life insurance policy will generate periodic payment of fixed premiums to the insurance company for a specified period of time. Therefore, once a life insurance policy with a periodic premium payment schedule is sold, the Company is able to derive steady commission and fee income from that policy for an extended period of time, sometimes up to 25 years. Because of this feature and the expected growth in demand for life insurance products in PRC and Taiwan, the Company has devoted significant resources and efforts to develop its distribution capability for individual life insurance products with periodic payment schedules. We expect that sales of life insurance products will continue to be the predominant source of revenue for the Company in the next several years.
| (2) | Property and Casualty Insurance Products |
Total net revenue from Taiwan property and casualty insurance products accounted for 5.69% and 5.38% of total net revenue for the three months ended June 30, 2018 and 2017, respectively. Total net revenue from Taiwan property and casualty insurance products accounted for 5.87% and 5.61% of total net revenue for the six months ended June 30, 2018 and 2017, respectively.
Consolidated Affiliated Entities (“CAE”) in PRC commenced selling commercial property insurance in 2009, and developed its automobile insurance business in 2010. Total net revenue from PRC property and casualty insurance products accounted for 0.32% and 0.50% of total net revenue for the three months ended June 30, 2018 and 2017, respectively. Total net revenue from PRC property and casualty insurance products accounted for 0.43% and 0.87% of total net revenue for the six months ended June 30, 2018 and 2017, respectively.
Critical Accounting Policies and Estimates
A critical accounting policy is one that is both important to the portrayal of our financial condition and results of operation and requires our management’s most difficult, subjective or complex judgments, often as a result of the need to make estimates about the effect of matters that are inherently uncertain. Our significant accounting policies are described in Note 2, “Summary of Significant Accounting Policies”, to the Notes to the Consolidated Financial Statements appearing in our Annual Report on Form 10-K for the year ended December 31, 2017. Following is a discussion of the accounting policies that we believe involve the most difficult, subjective or complex judgments and estimates.
| 27 |
Accrued Expenses
As part of the process of preparing our financial statements, we are required to estimate accrued expenses. The estimation basis of the majority of the accrued expenses is dependent on our salesforce’s achievement of the sales targets identified by the management team. Examples of estimated accrued expenses include brokerage commission bonus, such as bonus payable to our sales agents, and incentive program rewards, such as the estimated expenditures to fund the reward programs. We develop estimates of liabilities using our judgment based upon the facts and circumstances known at the time.
Revenue Recognition
We adopted the new revenue standard ASC 606, Revenue from Contracts with Customers, at the beginning of 2018, which requires that recognition of revenue occurs when a customer obtains control of promised goods or services in an amount that reflects the consideration to which the entity expects to be entitled in exchange for those goods or services. We recognize revenue when control over services provided by the Company is transferred to the respective insurance company, whereby the transfer of control is considered complete when a policyholder pays the initial insurance premium and when the respective insurance company approves the insurance policy. The new guidance includes requirements to estimate variable or contingent consideration to be received and recognize variable consideration to the extent that a significant reversal of revenue will not probably occur in subsequent periods. Applying the new revenue standard requires significant judgment and estimate to be made by the Company.
Recent Accounting Pronouncements
Leases
In February 2016, the FASB issued ASU 2016-02, Leases (Topic 842). The guidance in ASU No. 2016-02 supersedes the lease recognition requirements in ASC Topic 840, Leases (Statement of Financial Accounting Standards No. 13). ASU 2016-02 requires an entity to recognize assets and liabilities arising from a lease for both financing and operating leases, along with additional qualitative and quantitative disclosures. ASU No. 2016-02 is effective for fiscal years beginning after December 15, 2018, with early adoption permitted. The Company is currently evaluating the effect this standard will have on its consolidated financial statements.
Credit Losses
In June 2016, the FASB issued ASC Update No. 2016-13, (Topic 326), Financial Instruments – Credit Losses: Measurement of Credit Losses on Financial Instruments. This ASC update introduces new guidance for the accounting for credit losses on financial instruments within its scope. A new model, referred to as the current expected credit losses model, requires an entity to determine credit-related impairment losses for financial instruments held at amortized cost and to estimate these expected credit losses over the life of an exposure (or pool of exposures). The estimate of expected credit losses should consider both historical and current information, reasonable and supportable forecasts, as well as estimates of prepayments. The estimated credit losses and subsequent adjustment to such loss estimates, will be recorded through an allowance account which is deducted from the amortized cost of the financial instrument, with the offset recorded in current earnings. ASC No. 2016-13 also modifies the impairment model for available-for-sale debt securities. The new model will require an estimate of expected credit losses only when the fair value is below the amortized cost of the asset, thus the length of time the fair value of an available-for-sale debt security has been below the amortized cost will no longer affect the determination of whether a credit loss exists. In addition, credit losses on available-for-sale debt securities will be limited to the difference between the security’s amortized cost basis and its fair value. The updated guidance is effective for interim and annual periods beginning after December 15, 2019. Early adoption is permitted for periods beginning after December 15, 2018. The Company is evaluating the impact of the adoption of ASC Update No. 2016-13 on its financial position and results of operations.
| 28 |
Overview of the three months ended June 30, 2018 and 2017
The following table shows the results of operations for the three months ended June 30, 2018 and 2017:
| Three Months Ended June 30, | ||||||||||||||||
| 2018 | 2017 | |||||||||||||||
| (Unaudited) | (Unaudited) | Change | Percent | |||||||||||||
| Revenue | $ | 20,175,337 | $ | 18,518,822 | $ | 1,656,515 | 9 | % | ||||||||
| Cost of revenue | 13,696,717 | 11,890,592 | 1,806,125 | 15 | % | |||||||||||
| Gross profit | 6,478,620 | 6,628,230 | (149,610 | ) | -2 | % | ||||||||||
| Gross profit margin | 32 | % | 36 | % | -4 | % | -11 | % | ||||||||
| Operating expenses: | ||||||||||||||||
| Selling | 789,400 | 312,122 | 477,278 | 153 | % | |||||||||||
| General and administrative | 4,078,909 | 3,653,864 | 425,045 | 12 | % | |||||||||||
| Total operating expenses | 4,868,309 | 3,965,986 | 902,323 | 23 | % | |||||||||||
| Income from operations | 1,610,311 | 2,662,244 | (1,051,933 | ) | -40 | % | ||||||||||
| Other income (expenses): | ||||||||||||||||
| Interest income | 127,171 | 95,210 | 31,961 | 34 | % | |||||||||||
| Interest expenses | (28,395 | ) | (8,200 | ) | (20,195 | ) | 246 | % | ||||||||
| Dividend income | 361,571 | 329,749 | 31,822 | 10 | % | |||||||||||
| Other - net | 114,267 | 166,015 | (51,748 | ) | -31 | % | ||||||||||
| Total other income, net | 574,614 | 582,774 | (8,160 | ) | -1 | % | ||||||||||
| Income before income taxes | 2,184,925 | 3,245,018 | (1,060,093 | ) | -33 | % | ||||||||||
| Income tax expense | 369,380 | 755,990 | (386,610 | ) | -51 | % | ||||||||||
| Net income | 1,815,545 | 2,489,028 | (673,483 | ) | -37 | % | ||||||||||
| Net income attributable to the noncontrolling interests | 791,238 | 500,640 | 290,598 | 58 | % | |||||||||||
| Net income attributable to parent’s shareholders | $ | 1,024,307 | $ | 1,988,388 | $ | (964,081 | ) | -48 | % | |||||||
| 29 |
Revenue
As a distributor of insurance products, we derive our revenue primarily from commissions and fees paid by insurance companies, typically calculated as a percentage of premiums paid by our customers to the insurance companies in Taiwan, People’s Republic of China (“PRC”) and Hong Kong. We generate revenue primarily through our sales force, which consists of individual sales agents in our distribution and service network. For the three months ended June 30, 2018 and 2017, the revenue generated respectively from Taiwan, PRC and Hong Kong is as follows:
| Geographical Areas | Three months ended June 30, 2018 | Three months ended June 30, 2017 | ||||||
| Revenue | ||||||||
| Taiwan | $ | 16,998,019 | $ | 15,956,177 | ||||
| PRC | 3,166,721 | 2,543,599 | ||||||
| Hong Kong | 41,085 | 29,999 | ||||||
| Elimination adjustment | (30,488 | ) | (10,953 | ) | ||||
| Total Revenue | $ | 20,175,337 | $ | 18,518,822 | ||||
During the three months ended June 30, 2018, 84.3%, 15.7% and 0.2% of the revenue in our unaudited consolidated financial statements were derived from Taiwan, PRC and Hong Kong, respectively. During the three months ended June 30, 2017, 86.2%, 13.7% and 0.2% of the revenue in our unaudited consolidated financial statements were derived from Taiwan, PRC and Hong Kong, respectively. The percentages of geographical revenue for the three months ended June 30, 2018 and 2017 were relatively consistent.
Total revenue increased by $1,656,515, or 9%, from $18,518,822 for the three months ended June 30, 2017 to $20,175,337 for the three months ended June 30, 2018 due mainly to the following reasons:
| a) | The Company adopted the new accounting guidance ASC 606, Revenue from Contracts with Customers, for revenue recognition at the beginning of 2018 and elected to apply the modified retrospective method as disclosed in Note 2 to the condensed consolidated financial statements. Under the modified retrospective method, our revenue recognized for the three months ended June 30, 2017 was based on legacy GAAP as compared with the revenue recognized for the three months ended June 30, 2018 based on the new guidance. If we had recognized revenue for the three months ended June 30, 2018 on the same basis as that of the three months ended June 30, 2017, our revenue would have decreased by $981,162. The new guidance allowed us to accelerate the recognition of certain contingent commissions, thereby increasing our revenue recognition for the three months ended June 30, 2018. However, since the majority of our fee arrangements involve contracts that cover a single year of services, the difference of applying different GAAPs would not have a significant impact on an annual basis. |
| b) | Our commission revenue mainly consists of first year commission and bonus based on persistency ratio, specifically the 13th month persistency ratio, which is based on whether a policyholder renews the insurance policy and continues to pay premium at the 13th month after the effective date of his policy. Our business performance in the fourth quarter of 2016 was fairly successful and we continued to receive bonuses from the policies solicited in the fourth quarter of 2016 from the insurance companies. Starting from the first quarter of 2018, we have been benefited by the 13th month persistency ratio based bonus associated with new policies solicited in the fourth quarter of 2016. Among those commissions and fees received from the insurance companies, the bonus ratio from the 13th month persistency ratio is notably higher than other types of commissions and fees. Therefore, whether we are capable of successfully maintaining high persistency ratio has a significant impact on our revenue for an extended period of time. |
Furthermore, the increase in our total revenue was mainly contributed by our Taiwan segment for the following reasons:
| a) |
The revenue earned from AIA International Limited Taiwan Branch (“AIATW”) increased significantly in the three months ended June 30, 2018. In December 2017, we recruited a group of sales professionals who are especially knowledgeable of AIATW’s products. This group of new recruits has begun to contribute to our revenue from AIATW since the first quarter of 2018. In addition, there was a boost in the sale of foreign currency life insurance products denominated in US dollars offered by AIATW that began in the first quarter of 2018 and continued through the second quarter of 2018, as the depreciation of US dollars against NT dollars attracted customers to purchase US dollars linked products when compared with stronger US dollars during the first half of 2017.
However, in the three months ended June 30, 2018, the increase of revenue driven by the increased sales of AIATW products was offset by the decrease of revenue in connection with our Strategic Alliance Agreement (“Alliance Agreement”) with AIATW entered into in 2013. The Alliance Agreement had been amended several times over the past years to better align the interests of both parties. After Amendment No.3 took effect in June 2017, we were able to recognize Alliance Agreement revenue in accordance with GAAP, which allowed us to recognize deferred Alliance Agreement revenue since 2013, explaining why there was a significant increase in the Alliance Agreement revenue for the three months ended June 30, 2017. Whereas, for the three months ended June 30, 2018, we only recognized Alliance Agreement revenue for the current quarter. During the three months ended June 30, 2018 and 2017, we recognized the Alliance Agreement revenue for $87,330 and $1,305,514, respectively. The apparent discrepancy in the Alliance Agreement revenues for the three months ended June 30, 2018 and 2017 was the direct result of the way in which revenue was recognized as opposed to operational inefficiencies. |
| b) | The revenue earned from TransGlobe Life Insurance Inc. (“TransGlobe”) also experienced a visible increase because TransGlobe offered health insurance products with greater affordability and more favorable terms that appealed to the market, thereby boosting the sales of health insurance products for the three months ended June 30, 2018. |
| c) | The revenue earned from Taiwan Life Insurance Co., Ltd. (“Taiwan Life”) continued to increase. A phenomenon explained by the launching of Taiwan Life’s stellar product in 2017 with comprehensive long-term disability insurance coverage at an affordable price. This package drew more attention from our customers and boosted our sales performance for the three months ended June 30, 2018. As explained previously, once we have successfully solicited insurance policies and are able to retain our customers to have them pay periodic premiums, we will continue to receive commission bonuses, including the 13th month persistency ratio based bonuses from Taiwan Life. This coupling effect led to a greater increase in our revenue in the three months ended June 30, 2018. |
Cost of revenue and gross profit
The cost of revenue mainly consists of commissions paid to our sales professionals. The cost of revenue for the three months ended June 30, 2018 increased by $1,806,125 or 15%, to $13,696,717, as compared to $11,890,592 of the same period in 2017, mainly due to the increase of direct commission cost as a result of first year commission earned from insurance companies, and the restructuring of the commission program. The Company launched Commission 2.0 in September 2017, featuring new incentive schemes and performance measures that are more aligned with the company’s long-term objectives. Under Commission 2.0, sales targets are divided into smaller and more attainable targets to improve the achievement rate. Therefore, the commissions paid to our sales professionals increased for the three months ended June 30, 2018 despite the fact that our sales professionals generated similar level of revenue as compared with the three months ended June 30, 2017.
The gross profit for the three months ended June 30, 2018 decreased by $149,610 or 2%, to $6,478,620 compared to $6,628,230 for the three months ended June 30, 2017. The gross profit ratio decreased to 32% for the three months ended June 30, 2018 from 36% for the three months ended June 30, 2017. The decrease was a result of increased commissions paid to our sales professionals under the new commission program.
| 30 |
Selling expenses
Selling expenses mainly occurred in Law Broker, and represent expenses associated with marketing and brand promotion activities. The selling expense for the three months ended June 30, 2018 increased by $477,278 or 153%, to $789,400 compared with $312,122 for the three months ended June 30, 2017. The increase is mainly attributed to the increased advertising expenses and the donation to a charity organization to promote our brand name. We launched an online reality show in the second half of 2017 to facilitate deeper brand engagement and to attract youngsters to join our salesforce. The advertising expenses related to the show were mainly incurred in 2018 and will continue to grow along with our promotional plans.
General and administrative expenses
The general and administrative (“G&A”) expenses principally comprise salaries and benefits for our administrative staff, office rental expenses, travel expenses, depreciation and amortization, entertainment expenses, and professional service fees to the auditor and attorney.
For the three months ended June 30, 2018, G&A expenses were $4,078,909, increased by $425,045, or 12%, compared with $3,653,864 for the three months ended June 30, 2017. The increase is attributed to the expansion of our online business for which we recruited more administrative staff, leading to an increase in salary and office remodeling expense.
Other income (expenses)
Net other income for the three months ended June 30, 2018 and 2017 was $574,614 and $582,774, respectively. Other income (expense) mainly consists of interest income, interest expenses, dividend income, gain or loss on valuation of financial assets and foreign exchange gain or loss. Compared with the three months ended June 30, 2017, net other income decreased slightly due to recognition of valuation loss on the long-term investment in REITs but partially offset by the increase of dividend income, interest income, and foreign exchange gain.
Income tax expense
For the three months ended June 30, 2018, the income tax expense was $369,380, decreased by $386,610, or 51%, compared with $755,990 for the three months ended June 30, 2017. The decrease in our income tax expense was mainly contributed by our Taiwan segment for the following reasons:
| a) | The Company’s subsidiaries in Taiwan are governed by the Income Tax Law of Taiwan, and are generally subject to tax at 17% on income reported in the statutory financial statements after appropriate adjustments. In addition, the Income Tax Law of Taiwan provides that a company is taxed an additional 10% on any undistributed earnings to its shareholders. Effective January 1, 2018, the income tax rate has been raised to 20% but the undistributed earnings tax rate has been reduced to 5%. |
For the three months ended June 30, 2018, the income before income tax of Taiwan segment decreased significantly and therefore, the income tax expense decreased as compared with the three months ended June 30, 2017. However, the increase of the income tax rate slightly offset the decrease of the income tax expense. Moreover, the undistributed earnings tax rate decreased from 10% to 5% further decreased the current quarter income tax expense on undistributed earnings.
| b) | In June 2018, the shareholders of Law Enterprise Co., Limited (Law Enterprise), the Company’s majority owned subsidiary and is incorporated in Taiwan approved to distribute accumulated earnings to shareholders including Action Holdings Financial Limited (AHFL), the Company’s wholly owned subsidiary. Under the Income Tax Law of Taiwan, the distributed earning is not subject to the undistributed earning tax and the foreign shareholders of a Taiwan company will bear 21% of withholding tax after deducting certain tax credits as allowed by the Income Tax Law of Taiwan for the dividend received. As a result of the earning distribution of Law Enterprise, Law Enterprise reversed $921,196 of the undistributed earning tax liability accrued in prior years and AHFL accrued $880,726 of the withholding tax liability that cannot be deducted in its tax jurisdiction. Therefore, the income tax expense was further decreased due to the reversal of the prior year accrued undistributed earnings liability. |
CU WFOE and the Consolidated Affiliated Entities (“CAEs”) in the PRC are governed by the Income Tax Law of the PRC concerning the private enterprises, which are generally subject to tax at 25% on income reported in the statutory financial statements after appropriated adjustments, except for Jiangsu. For Jiangsu, according to the requirement of local tax authorities, the tax basis is deemed as 10% of total revenue, rather than of net income.
| 31 |
Liquidity and Capital Resources
The following table presents a comparison of the net cash provided by operating activities, net cash used in investing activities, and net cash provided by financing activities for the six months ended June 30, 2018 and 2017:
| Six Months Ended June 30, | ||||||||||||||||
| 2018 | 2017 | Change | Percent | |||||||||||||
| Net cash provided by operating activities | $ | 5,001,821 | $ | 2,743,905 | $ | 2,257,916 | 82 | % | ||||||||
| Net cash used in investing activities | (7,989,544 | ) | (8,902,361 | ) | 912,817 | (10 | )% | |||||||||
| Net cash provided by financing activities | 286,061 | 256,881 | 29,180 | 11 | % | |||||||||||
| 32 |
Operating activities
Net cash provided by operating activities during the six months ended June 30, 2018 was $5,001,821, representing an increase in comparison with net cash of $2,743,905 provided by operating activities during the six months ended June 30, 2017. The increase was mainly due to the fact that our business performance at the end of 2016 was better than it was at the end of 2017. During the first half of 2017 we received more commissions from the insurance companies as compared with the first half of 2018; however, during the first half of 2017, we also paid more commissions to our sales professionals than we did during the first half of 2018, causing our cash outflow from operating activities during the first half of 2017 to exceed the outflow during the first half of 2018. As the result, cash provided by operating activities increased during the first half of 2018.
Investing activities
Net cash used in investing activities was $7,989,544 during the six months ended June 30, 2018, compared with $8,902,361 net cash used in investing activities for the six months ended June 30, 2017. Our successful business performance in 2016 generated excess cash that we used to make short-term investments in time deposits and marketable securities in the first half of 2017. We continued to reinvest in short-term investments in time deposits and structured deposits when these investments became mature during the first half of 2018. We made additional investment in REITs during the first half of 2018.
Financing activities
Net cash provided by financing activities was $286,061 during the six months ended June 30, 2018, a result of increased third party borrowings. However, net cash provided by financial activities was partially offset by repayment of borrowings from Company’s related parties and third parties. Net cash provided by financing activities was $256,881 for the six months ended June 30, 2017, a result of proceeds received from Company’s related party borrowings.
Related Party Loan and Loans to Unrelated Third Parties
Anhou Registered Capital Increase
On April 27, 2013, the China Insurance Regulatory Commission (“CIRC”) issued the Decision on Revising the Provisions of the Supervision and Administration of Specialized Insurance Agencies (the “Decision on Revising the Agency Provisions”), pursuant to which, CIRC mandated any insurance agency established subsequent to the Decision on Revising the Agency Provisions to meet a minimum registered capital requirement of RMB50 million (approximately $8 million). On May 16, 2013, CIRC issued Notice for Further Clarification on Related Issues of Access to Professional Insurance Intermediary Market (the “Notice”), pursuant to which, professional insurance agencies established prior to the issuance of the Decision on Revising the Agency Provisions, with registered capital less than RMB50 million (approximately $8 million) can continue to operate its existing business within the provinces where they have a registered office or branch office, but shall not set up any new branches in any provinces where it has no registered office or a branch office.
Prior to the capital increase, Anhou, a professional insurance agency with a PRC nationwide license, had a registered capital of RMB10 million (approximately $1.6 million). To better implement its expansion strategies, Anhou intended to increase its registered capital to RMB50 million (approximately $8 million) to meet the requirement of CIRC so that it can set up new branches in any province beyond its current operations in the PRC.
Due to certain restrictions on direct foreign investment in insurance agency business under current PRC legal regime, Anhou had sought certain investments made by the Investor Borrowers through individual loans. Upon the completion of the contemplated increase of registered capital of Anhou, each Investor Borrower shall, or cause their designated persons to, enter into the Variable Interest Entities Agreement with CU WFOE, Anhou and other parties so as to consolidate any additional variable interest entities generated from the said registered capital increase into the Company.
On June 9, 2013, AHFL entered into a Loan Agreement (the “Company Loan Agreement”) with ZLI Holdings Limited (“ZLI Holdings”), its wholly-owned Hong Kong subsidiary.
| 33 |
Under the Company Loan Agreement, AHFL agreed to provide a loan to ZLI Holdings with the principal amount equal to the US Dollar equivalent of RMB40,000,000 ($6,389,925). The term for such was ten years which could be extended upon the agreement of the parties. The amount of such loan was remitted to the account of ZLI Holdings on August 30, 2013.
In August 2013, ZLI Holdings entered into several loan agreements (collectively, the “Investor Loan Agreements”) with the following unrelated parties: Able Capital Holding Co., Ltd., a limited liability company established and registered in Hong Kong, Mr. Chen Li and Ms. Yue Jing, both PRC citizens (collectively, the “Investor Borrowers”).
Under the Investor Loan Agreements, the Investor Borrowers borrowed cash from ZLI Holdings for their investment in Anhou, and ZLI Holdings agreed to provide certain loans to each of the Investor Borrowers with an aggregate principal amount of RMB40,000,000 ($6,389,925). The term for such loans was ten years which could be extended upon the agreement of the parties. Pursuant to the Investor Loan Agreements, each of the Investor Borrowers agreed to enter into certain Variable Interest Entities Agreements with Anhou, CU WFOE and certain existing shareholders of Anhou. The proceeds received from the said loans by the Investor Borrowers shall be solely used to increase the registered capital of Anhou, and ZLI Holdings may determine the repayment methods, including transferring of the Investor Borrowers’ corresponding registered capital in Anhou or through other manner as full payment of the loans subject to the terms and conditions therein in the event that the Investor Borrowers fail to repay the loan in currency to ZLI Holdings.
The specific amounts loaned to the Investor Borrowers are as follows:
Able Capital Holding Co., Ltd.: RMB29,500,000 ($4,712,570)
Mr. Chen: RMB3,000,000 ($479,244)
Ms. Yue: RMB7,500,000 ($1,198,111)
On October 20, 2013, the Investor Borrowers, through certain nominees, increased Anhou’s registered capital by RMB 40 million ($6,389,925).
Loan Receivable
On October 24, 2016, our Company entered into a loan agreement with a third party, Rich Fountain Limited (“RFL”), a company incorporated under the laws of Samoa. We provided a short-term loan amount of NTD 48,000,000 ($1,486,846) to RFL. The short-term loan bears an interest rate of 4.5% per annum and the principal and interest are due on April 23, 2017. On April 21, 2017, the Company and RFL entered into a supplemental agreement to extend this loan to October 23, 2017. The principal amounts of the loan was paid off on March 7, 2018. On March 9, 2018, our Company further entered into another supplemental agreement with RFL to waive unpaid portion of interest and penalties from RFL and RFL settled all the obligation with us.
| 34 |
Due to related parties
The following summarizes the Company’s payable to related parties as of June 30, 2018 and December 31, 2017:
| June 30, 2018 | December 31, 2017 | |||||||
| Due to Mr. Mao (Principal shareholder of the Company) | $ | 403,300 | $ | 409,054 | ||||
| Due to Ms. Lu (Shareholder of Anhou) | 113,309 | 161,380 | ||||||
| Due to I Health Management Corp* | - | 17,703 | ||||||
| Others | 2,373 | 2,128 | ||||||
| Total | $ | 518,982 | $ | 590,265 | ||||
| * | 25% of I Health Management Corp’s shares are owned by Multiple Capital Enterprise, and 24% of Multiple Capital Enterprise’s shares are owned by members of the Company’s management level. |
Amounts due to Mr. Mao and Ms. Lu are loan payable on demand and bear no interest.
Long-term loan
The Company’s long-term loans consisted of the following as of June 30, 2018 and December 31, 2017:
| June 30, 2018 | December 31, 2017 | |||||||
| Loan A, interest at 8% per annum, maturity date May 15, 2019 | $ | 128,417 | $ | 130,641 | ||||
| Loan B, interest at 8% per annum, maturity date July 20, 2019 | 116,331 | 118,345 | ||||||
| Total loans | 244,748 | 248,986 | ||||||
| Less: current portion (Note 5) | (128,417 | ) | - | |||||
| Total long-term loans | $ | 116,331 | $ | 248,986 | ||||
Law Anhou Insurance Agency Co., Limited (“Anhou”) in Nanjing City, PRC is a variable interest entity (VIE) of which the Company is the primary beneficiary. The Company contractually control Anhou through CU Hong Kong.
On May 15, 2016, Anhou entered into a loan agreement (“Loan A”) with an individual third party. The loan agreement provided for approximately $128,417 (RMB 850,000) and $130,641 (RMB 850,000) as of June 30, 2018 and December 31, 2017, respectively, loan to the Company. The Loan A bears an interest rate of 8% per annum and interest is payable annually. The principal and the accrued interest will be due on May 15, 2019. As of June 30, 2018, the principal amount was reclassified to current liabilities.
On July 20, 2016, Anhou entered into a loan agreement (“Loan B”) with an individual third party. The loan agreement provided for approximately $116,331 (RMB 770,000) and $118,345 (RMB 770,000) as of June 30, 2018 and December 31, 2017, respectively, loan to the Company. The Loan B bears an interest rate of 8% per annum and interest is payable annually. The principal and the accrued interest will be due on July 20, 2019.
Total interest expenses for the Loan A and Loan B were $5,069 and $5,200, respectively, for the three months ended June 30, 2018 and 2017, and were $8,907 and $10,269, respectively, for the six months ended June 30, 2018 and 2017.
Contractual Obligations
Operating Leases
The Company has operating leases for its offices. Rental expenses for the three months ended June 30, 2018 and 2017 were $735,916 and $666,035, respectively, and for the six months ended June 30, 2018 and 2017 were $1,399,331 and $1,237,058, respectively. On June 30, 2018, total future minimum annual lease payments under operating leases were as follows, by 12-month trailing period:
| Twelve months ending June 30, 2019 | $ | 2,176,430 | ||
| Twelve months ending June 30, 2020 | 1,044,433 | |||
| Twelve months ending June 30, 2021 | 497,484 | |||
| Twelve months ending June 30, 2022 | 35,340 | |||
| Twelve months ending June 30, 2023 | 5,023 | |||
| Thereafter | - | |||
| Total | $ | 3,758,710 |
| 35 |
AHFL Acquisition Agreement
The Company and the selling shareholders of AHFL entered into a third Amendment to the Acquisition Agreement (the “Third Amendment”), pursuant to which, the Company committed to distribute the cash payment in the amount approximately $676,466 (NTD 22.5 million) to the selling shareholders of AHFL on or prior to June 30, 2016. On July 21, 2016, the Company arranged for the payment of $153,097 (NTD4,830,514) to the selling shareholders. On March 12, 2017, the Company and the selling shareholders of AHFL entered into a fifth amendment to the acquisition agreement (the “Fifth Amendment”), pursuant to which, the Company agreed to make the cash payment in the amount of $480,559 (NTD15 million) on or prior to March 31, 2019. As such, the amount was reclassified to other current liabilities as of June 30, 2018.
Engagement Agreement with Ms. Chao
On May 10, 2016, Law Broker entered into an engagement agreement (“Engagement Agreement”) with Hui-Hsien Chao (“Ms. Chao”), pursuant to which, she serves as the general manager of Law Broker from December 29, 2015 to December 28, 2018. Ms. Chao’s primary responsibilities are to assist Law Broker in operating and managing insurance agency business. According to the Engagement Agreement, Ms. Chao’s Bonus plans include: 1) execution, 2) long-term service fees, 3) pension and 4) non-competition. The payment of such bonuses will only occur upon satisfaction of certain condition and subject to the terms in the Engagement Agreement. Ms. Chao acts as the general manager or equivalent position of Law Broker for a term of at least three years. On March 13, 2017, Law Broker and Ms. Chao entered into an amendment to the Engagement above-mentioned Agreement to specify 1) Ms. Chao’s pension calculation assumptions and start date, and 2) the non-competition provision start date. As of June 30, 2018 and December 31, 2017, the Company had current liabilities amounted $266,730 and $210,752, respectively, related to accrued bonus for Ms. Chao.
Lease Agreements
On February 1, 2018, Prime Asia Corporation, Limited, the Company’s majority owned subsidiary entered into a lease agreement with Apex Biz Solution Limited (“Apex,” was formerly known as Prime Technology Corp.) Apex is a related party of the Company because it is affiliated to the Company’s management. The lease is to lease the office space in Taipei City to Apex. The lease term is for 10 months commencing on February 1, 2018, with a monthly base rent of approximately $678 (NTD 20,000). The Company recorded rent income of $2,022 and $3,388 for the three and six months ended June 30, 2018.
On July 1, 2016, the Company entered into lease agreements with Yuli Broker and Yuli Investment separately, to lease their Nan-King East Road office space in Taipei City. The lease terms were both for one year commencing on July 1, 2016 and ending on June 30, 2017, with an annual base rent approximately of $610 (NTD18,000). On June 30, 2017, these lease agreements were extended automatically to June 30, 2018. The Company recorded rent income of $288 and $284, respectively, for the three months ended June 30, 2018 and 2017 and $580 and $560, respectively, for the six months ended June 30, 2018 and 2017.
Yuli Broker and Yuli Investment are owned by Ms. Lee who is the Director of Law Broker.
Advisory Agreements
On May 2, 2016, the Company entered into an advisory agreement with I Health who is contracted to provide 10,000 Taiwan citizen’s health information to the Company. The total advisory fee was approximately $42,000 (NTD1,275,000). For the three and six months ended June 30, 2017, the Company had cost of revenue related to I Health amounted $3,436 and $13,213, respectively. The Company had due to I Health $17,703 as of December 31, 2017.
On December 7, 2016, the Company entered into an advisory agreement with Mr. Fu Chang Li, the Director of the Company. Pursuant to this Advisory Agreement, Mr. Li provided investment consulting services to the Company from December 7, 2016 to December 6, 2017. On December 7, 2017, both parties agreed to extend this advisory agreement from December 7, 2017 to December 6, 2018. The total advisory fee was approximately $60,977 (NTD1,800,000). For the three and six months ended June 30, 2018 and 2017, the Company recognized $30,006 and $28,273, respectively, general and administrative expenses in connection to this advisory agreement.
Consulting Agreement
On November 1, 2016, the Company entered into a consulting agreement with Apex, pursuant to which the Company would provide administrative operational consulting services to Apex from November 1, 2016 through December 31, 2021. As of June 30, 2018 and December 31, 2017, the Company had accounts receivable amounted $7,973 and $17,231, respectively. The Company also had revenue amounted $8,089 and $6,051 for the three months ended June 30, 2018 and 2017, respectively, and $24,842 and $16,633 for the six months ended June 30, 2018 and 2017, respectively.
| 36 |
Off Balance Sheet Arrangements
We have not engaged in off balance sheet arrangements that required disclosures.
| 37 |
ITEM 3. QUANTITATIVE AND QUALITATIVE DISCLOSURE ABOUT MARKET RISK
We are exposed to market risk in the ordinary course of our business. Market risk represents the risk of loss that may impact our financial position due to adverse changes in financial market prices and rates. Our market risk exposure is primarily a result of fluctuations in interest rates and foreign currency exchange rates.
Interest Rate Sensitivity
As of June 30, 2018, we had cash and cash equivalents of $12,289,286, including cash of USD $121,851, cash of RMB12,821,654 (approximately $1,937,084), cash of HKD517,307 (approximately $65,938), and cash of NTD309,622,271 (approximately $10,164,413). We hold our cash for working capital purposes. Declines in interest rates would reduce future interest income. For the six months ended June 30, 2018, the effect of a hypothetical 10% increase or decrease in overall interest rates would not have had a material impact on our interest income.
Foreign Currency Risk
The functional currency for the subsidiaries in Taiwan is NTD, the functional currency for the subsidiaries in Hong Kong is HKD and the functional currency for the subsidiaries and CAE in PRC is RMB. The financial statements of the Company are in USD. The fluctuation of NTD and RMB will affect our operating results expressed in USD. The Company reviews its foreign currency exposures. To date, we have not entered into any hedging arrangements with respect to foreign currency risk or other derivative financial instruments. The management does not consider its present foreign exchange risk to be significant.
| 38 |
ITEM 4. CONTROLS AND PROCEDURES
Evaluation of Disclosure Controls and Procedures
As required by SEC Rule 13a-15(b) under the Securities Exchange Act of 1934, as amended (the “Exchange Act”), we conducted an evaluation, under the supervision and with the participation of our management, including our Chief Executive Officer and Chief Financial Officer, of the effectiveness of the design and operation of our disclosure controls and procedures (as defined in Rule 13a-15(e) under the Exchange Act) as of June 30, 2018, to ensure that information required to be disclosed by us in the reports filed or submitted by us under the Exchange Act is recorded, processed, summarized and reported, within the time periods specified in the Securities Exchange Commission’s rules and forms, including to ensure that information required to be disclosed by us in the reports filed or submitted by us under the Exchange Act is accumulated and communicated to our management, including our principal executive and principal financial officer, or persons performing similar functions, as appropriate to allow timely decisions regarding required disclosure. Based on that evaluation, our Chief Executive Officer and Chief Financial Officer have concluded that as of June 30, 2018, our disclosure controls and procedures were not effective at the reasonable assurance level due to the deficiencies and material weaknesses identified and described in Part II, Items 9A(a) and 9A(c) of the Company’s Amended Annual Report. For further information, please see the above mentioned items in Company’s Amended Annual Report, which is incorporated by reference herein.
Changes in Disclosure Controls and Procedures
There were no changes in our disclosure controls and procedures as defined under Rule 13a-15(b) in the Exchange Act that occurred during the six months ended June 30, 2018, that have materially affected, or are reasonably likely to materially affect our disclosure controls, other than as described below under the caption “Management’s Remediation Efforts Regarding Disclosure Controls and Procedures.”
Management’s Remediation Efforts Regarding Disclosure Controls and Procedures
As previously described in Part II, Item 9A of the Company’s Amended Annual Report, we have retained an independent corporate monitor who will help us implement changes and improvements in the internal control over disclosure controls and procedures for remediating the control deficiencies. For further information, please see the above mentioned items in Company’s Amended Annual Report, which is incorporated by reference herein.
Changes in Internal Control Over Financial Reporting
There were no changes in our internal control over financial report as defined in Exchange Act Rules 13a-15(f) and 15d-15(f) that occurred during the six months ended June 30, 2018, that have materially affected, or are reasonably likely to materially affect our internal control over financial reporting, other than as described below under the caption “Remediation Efforts.”
Remediation Efforts
As previously described in Part II, Item 9A of the Company’s Form 10-K/A for the period ended December 31, 2017, we began implementing a remediation plan to address the control deficiency that led to the material weaknesses identified. As part of our plan, we had engaged a qualified financial consultant with substantial accounting and public company financial expertise to assist the Company in improving the overall recording and reporting processes, and strengthening the overall capabilities of our financial department. Our financial consultant holds CPA certification in the United States, and is proficient in US GAAP and financial reporting.
Although we had begun our remediation process during the six months ended June 30, 2018 by engaging a new financial consultant, we have yet to complete all of the corrective processes, procedures and related evaluation or remediation that we believe are necessary. As we continue to evaluate and work to remediate the material weaknesses, we may determine to take additional measures to address the control deficiencies. The material weaknesses cannot be considered remediated until the control has operated for a sufficient period of time and until the management has concluded, through testing, that the control is operating effectively. Our goal is to remediate the material weaknesses by the end of fiscal 2018.
| 39 |
On December 20, 2018, the Company and Cheng-Hsiung Huang (“Mr. Huang”), one of the Company’s former employees, agreed to settle fraud charges brought by the SEC relating to a scheme to manipulate the Company's trading volume. Neither the Company nor Mr. Huang realized financial gain from the scheme and both the Company and Mr. Huang substantially cooperated with the SEC’s investigation into the activities that led the SEC to bring the fraud charges. For further information, please see the Company’s current report, as amended, filed on Form 8-K/A on January 22, 2019 (the “Amended Current Report”). The Amended Current Report and exhibits thereto are incorporated by reference into this Quarterly Report.
There have been no material changes from the risk factors disclosed in our Amended Annual Report for the fiscal year ended December 31, 2017.
ITEM 2. UNREGISTERED SALES OF EQUITY SECURITIES AND USE OF PROCEEDS.
None.
ITEM 3. DEFAULTS UPON SENIOR SECURITIES.
None.
ITEM 4. MINE SAFETY DISCLOSURES
Not applicable.
Please see our Amended Current Report, which is incorporated by reference herein.
| 40 |
| 101.INS | XBRL Instance Document | |
| 101.SCH | XBRL Taxonomy Extension Schema Document | |
| 101.CAL | XBRL Taxonomy Extension Calculation Linkbase Document | |
| 101.DEF | XBRL Taxonomy Extension Definition Linkbase Document | |
| 101.LAB | XBRL Taxonomy Extension Label Linkbase Document | |
| 101.PRE | XBRL Taxonomy Extension Presentation Linkbase Document |
*The certifications attached as Exhibits 32.1 and 32.2 accompany this quarterly report on Form 10-Q pursuant to 18 U.S.C. Section 1350, as adopted pursuant to Section 906 of the Sarbanes-Oxley Act of 2002, and shall not be deemed “filed” by the Registrant for purposes of Section 18 of the Securities Exchange Act of 1934, as amended.
| 41 |
SIGNATURES
Pursuant to the requirements of the Securities Exchange Act of 1934, the Registrant has duly caused this report to be signed on its behalf by the undersigned thereunto duly authorized.
| China United Insurance Service, Inc. | ||
| Date: January 31, 2019 | By: | /s/ Yi Hsiao Mao |
| Name: | Yi Hsiao Mao | |
| Its: | Chief Executive Officer | |
| (Principal Executive Officer) | ||
| Date: January 31, 2019 | By: | /s/ Yung Chi Chuang |
| Name: | Yung Chi Chuang | |
| Its: | Chief Financial Officer | |
| (Principal Financial and Accounting Officer) | ||
| 42 |