Attached files
| file | filename |
|---|---|
| 8-K - 8-K - Tesla, Inc. | tsla-8k_20190130.htm |
Exhibit 99.1
|
|
Tesla Fourth Quarter & Full Year 2018 Update
• Q4 operating income stable compared to Q3 at $414M, operating margin of 5.7% • Operating cash flow less capex improved from Q3 to $910M in Q4 • Cash and cash equivalents of $3.7B at Q4-end, increased by $718M in Q4 • Q4 GAAP net income of $139M impacted by $54M non-cash charge • Model 3 GAAP and non-GAAP gross margin remained stable at >20% in Q4 |

|
Last year was the most pivotal year in Tesla’s history. During our Model 3 production ramp, we went through significant challenges with the battery module line at Gigafactory 1 in Nevada, and later with our general assembly line in Fremont. Thanks to the hard work and ingenuity of our manufacturing teams, by mid-2018 we successfully overcame these challenges and stabilized Model 3 production at high volumes. Model 3 then went on to become the best-selling passenger car in the US in terms of revenue in both Q3 and Q4. With nearly 140,000 units sold, Model 3 was also the best-selling premium vehicle (including SUVs) in the US for 2018 – the first time in decades an American carmaker has been able to secure the top spot. |
Premium vehicle sales in the US (2018) |

|
Operating (EBIT) margin of premium carmakers |
Model 3’s success has carried over to our financial performance in Q3 and Q4 of 2018. Operating income in Q4 remained stable at $414 million despite a sequential decline in revenue from the sale of regulatory credits, higher import duties on components from China, a price reduction for Model S and Model X in China, and the introduction of a lower-priced mid-range version of Model 3. Our operating margin also improved significantly in the second half of 2018, changing from being negative to on-par with other premium carmakers. Despite margins in the automotive industry typically being lower in Q4, that was not true for us as our operating margin remained strong at 5.7% in Q4. Our GAAP net income of $139 million was impacted by a non-cash charge of $54 million attributable to non-controlling interests. Free cash flow (operating cash flow less capital expenditures) also improved sequentially in Q4 to $910 million. In the second half of 2018, our cash position improved by $1.45 billion despite the scheduled repayment of a $230 million convertible bond in Q4. We have sufficient cash on hand to comfortably settle in cash our convertible bond that will mature in March 2019. |

In 2019, full-year Model 3 volumes will grow substantially over 2018 due to a full year of high production rates at our Fremont facility. Also, by the end of this year we are expecting to start producing Model 3 vehicles at our Gigafactory Shanghai using a complete vehicle production line. We expect the capital spend per unit of capacity for this factory to be less than half of that of our Model 3 line in Fremont. Additionally, this year we will start tooling for Model Y to achieve volume production by the end of 2020, most likely at Gigafactory 1. All of these activities are setting us up for very significant annual growth in 2019 and beyond.
AUTOMOTIVE PRODUCTS
Model 3’s production rate progressively improved through Q4, with December 2018 being our highest volume month ever. In our Fremont facility, we are now past the steep portion of the production S-curve, and we expect our production rate to continue to gradually improve. Every part of the Model 3 production process has demonstrated over a 24-hour period the ability to produce at an extrapolated rate of 7,000 vehicles per week. By the end of this year, we expect to be able to produce Model 3 at this rate on a sustained basis.
As we improve the production rate of Model 3, the cost per vehicle continues to decline. It is critical that we continue this trend so that we can keep increasing the affordability of Model 3 while retaining a sustainable level of profitability. The labor hours per Model 3 vehicle declined yet again by roughly 20% compared to Q3 and by about 65% in the second half of 2018 alone. Despite introducing a lower-priced mid-range variant and other headwinds, Model 3’s gross margin remained stable in Q4 at over 20%.
Our delivery and logistics systems continued to progress in Q4, but there remains room for more improvement. In order to reduce vehicle transportation time and improve the timeliness of scheduled deliveries, we have purchased and are continuing to purchase our own car-hauling truck capacity for vehicle shipments. This gives us far more control while lowering costs and improving customer satisfaction.
|
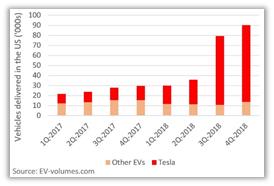
In the past two years, Tesla vehicles have accounted for all of the electric vehicle (EV) volume growth in the US. Even with the radical EV growth in the second half of 2018, EVs still account for just 2% of the total US market, and there remains a substantial opportunity for EVs to continue to gain market share in the US and globally. Consumer purchases have demonstrated that EVs are becoming a preferred option, as EVs in Q4 2018 outsold hybrid electric vehicles (HEVs) in the US for the first time in history. |
EV sales in the US |
|
Model 3 trade-ins by vehicle type |
The appeal of Model 3 continues to go far beyond the mid-sized premium sedan market. Our trade-in data suggests that consumers are significantly changing their purchasing habits in order to buy a Model 3. Of all trade-ins we’ve ever received from customers buying a Model 3, only 17% are other mid-sized premium sedans. Perhaps more surprisingly, almost 60% of these trade-ins are non-premium vehicles. We are also seeing that a significant number of Model 3 buyers are trading down in size from a larger car or a SUV to a Model 3. Designed from the ground up to be electric, Model 3 has more interior space than its gas-powered equivalents. Interestingly, Model S accounted for only a small portion (4%) of total Model 3 trade-ins. |

|
In Q4, we delivered 63,359 Model 3 vehicles to customers in North America. In January 2019, we started to produce Model 3 vehicles for Europe and China, and the car is now fully certified for sale in these markets. The market opportunity for Model 3 in Europe and China exceeds North America based on the most recent sales of mid-sized premium sedans. Model 3 was designed from the outset for a global market, and shares more than 98% of its parts in common across its regional variants. |
Model 3 vs other premium sedans in 2018 |

In January 2019, we started construction of Gigafactory Shanghai. Local manufacturing is an essential component of our ability to provide to customers in the region a truly affordable version of Model 3. Most other mid-sized premium sedans in China are locally produced, which allows them to have a lower average selling price. In the initial phase of Gigafactory Shanghai, we expect to have stamping, paint shop, body joining, and general assembly shops in operation by the end of 2019. This accelerated timeframe should be possible due to the radical simplification of our manufacturing layout and processes compared to our first-generation production line in Fremont. Higher-spec models such as our long-range all-wheel drive (AWD) and Performance versions will continue to be shipped to China from the US.
In Q4, we delivered 27,607 Model S and Model X vehicles to customers. For the full year, we delivered 99,475 Model S and Model X vehicles, which was in line with our guidance. We recently stopped taking orders for the 75 kWh versions of Model S and Model X and will focus on the longer-range versions of these flagship products instead, with the recent introduction of a 310 mile range base Model S and 270 mile range base Model X. Over the years, we have been gradually simplifying options for Model S and Model X by standardizing options such as the air suspension, AWD, premium package, and glass roof. This is yet another step towards increased standardization, which results in significantly lower manufacturing cost. Additionally, we believe this will provide more differentiation between Model S and Model 3. As a result of this change and improving efficiencies in our production lines, we have reduced Model S
and Model X production hours accordingly. Last year alone, Model S and X production efficiencies improved 15%. Our objective is to continue to achieve further efficiencies, which will reduce the manufacturing cost while providing us the flexibility to increase output as necessary.
Our Autopilot team recently publicly launched “Navigate on Autopilot”, a feature that allows, on most controlled-access roads such as highways, any Tesla vehicle with Enhanced Autopilot to change lanes, transition from one highway to another, and ultimately exit the highway when approaching the final destination. We expect to increase the functionality of Autopilot to navigate increasingly complex environments and situations.
During Q4, we opened 27 new store and service locations, resulting in 378 locations worldwide at the end of the quarter. Our largely electrified Mobile Service fleet continued to grow further to 411 service vehicles on the road at the end of Q4. In 2018, the total Tesla vehicle fleet grew by 85%, mainly due to the steep Model 3 production ramp. We see upgrading our service capacity and improving customer service as a top priority at the moment. Where needed, our service centers are moving to two-shift operations in order to double service capacity quickly, and we are simplifying processes in order to increase service throughput. We are also increasing the functionality of the Tesla App for scheduling service in order to improve responsiveness and convenience for our customers. Furthermore, we are changing our parts distribution approach to ensure that spare parts are available in a timely manner at all our service centers globally.
In Q4, we opened 69 new Supercharger locations for a total of 1,421 Supercharger stations globally. In 2018, we opened 293 Supercharger locations, many of which have 20 to 50 stalls per location. To date, we have approximately 12,000 dedicated Supercharging connectors and over 21,000 Destination Charging connectors globally. In addition to our continued investment in global charging infrastructure, our engineering team is finalizing plans for the rollout of our V3 Supercharger technology early this year, which will enable significantly faster charge times. We anticipate V3 to not only provide a better customer experience for Tesla vehicle owners, but to also significantly lower Tesla’s operational and capital expenditures.
ENERGY PRODUCTS
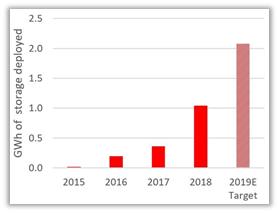
While 2018 was predominantly the year of Model 3, our Energy business also reached a significant milestone. In 2018, we deployed 1.04 GWh of energy storage, nearly tripling our energy storage deployments compared to 358 MWh deployed in 2017. In Q4, energy storage deployments reached 225 MWh, a decrease of 6% sequentially, and up 57% compared to Q4 2017. A new manufacturing line made by Tesla Grohmann is further increasing production of Powerwall and Powerpack modules at Gigafactory 1. With a better supply of cells and new manufacturing equipment, we are aiming to more than double energy storage deployments to over 2 GWh in 2019. Through various operational efficiencies, our average sale-to-installation time also decreased by about 50% in 2018.
|
GWh of energy storage deployed |
We see growth opportunities for Powerwall not only in North America, but also in Australia and Europe where electricity rates are high and solar panels combined with Powerwall units will help reduce electricity bills. South Australia has recently initiated a Virtual Power Plant program where the plan is to install 50,000 interconnected Powerwall units that will provide increased grid reliability and lower cost for all customers. The profitability of our energy products continued to improve partially due to the increased efficiency of Powerwall installations. Each Powerwall is an internet connected device, enabling us to continue to introduce new functionality and improvements over time, just like we do with our vehicles. |
While the Hornsdale battery that we built in South Australia is still the largest battery in the world, we have recently received multiple requests to build significantly larger battery projects. The Hornsdale project has generated substantial savings and is likely to pay for itself within a few years. This has generated interest from governments and municipalities to invest in large battery storage projects rather than in conventional peak energy generation. In addition to providing backup generation and cost savings to businesses, Powerpack units are now used in over 100 microgrid projects across 32 countries.
We deployed 73 MW of retrofit solar systems in Q4, a 21% decrease sequentially. We are still in the process of transitioning our sales channel from former partners to our Tesla stores and training our sales team to sell solar systems in addition to vehicles. Cash and loan sales made up 75% of residential deployments in Q4, up from 51% in Q4 2017. Likewise, while total deployments decreased by 38% to 326 MW in 2018, cash and loan residential deployments increased from 39% in 2017 to 71% in 2018. This was an important contributor to improving the cash generation and profitability of the solar business.
We plan to ramp up the production of Solar Roof with significantly improved manufacturing capabilities during 2019, based on the design iterations and testing underway. In the meantime, we are continuing to install Solar Roofs at a slow pace to gather further learnings from our design changes, as well as about the viability of our installation processes by implementing them in areas around the U.S. that are experiencing inclement weather.
Q4 2018 RESULTS
Revenue & Gross Margin
|
|
Three Months Ended |
|
|
Change |
|
|||||||||||||||
|
|
December 31, |
|
|
September 30, |
|
|
|
|
December 31, |
|
|
|
|
|
|
|
|
|||
|
|
2018 |
|
|
2018 |
|
|
|
|
2017 |
|
|
QoQ |
|
YoY |
|
|||||
|
Automotive revenue ($000) |
$ |
6,323,219 |
|
|
$ |
6,098,766 |
|
|
|
|
$ |
2,702,195 |
|
|
|
4 |
% |
|
134 |
% |
|
Automotive gross margin – GAAP |
|
24.3 |
% |
|
|
25.8 |
% |
|
|
|
|
18.9 |
% |
|
|
-149 |
bp |
|
540 |
bp |
|
Automotive gross margin excluding SBC and ZEV credit – non-GAAP |
|
24.7 |
% |
|
|
25.5 |
% |
|
|
|
|
13.8 |
% |
|
|
-85 |
bp |
|
1,086 |
bp |
|
• |
Automotive revenue in Q4 increased by 4% sequentially over Q3 and by 134% compared to Q4 2017, primarily due to a sharp increase in Model 3 deliveries. In Q4, we recognized less than $1 million in ZEV credit sales compared to $52 million in Q3. |
|
• |
With the adoption of the new revenue recognition standard starting January 1, 2018, lease accounting generally applies only to vehicles directly leased by us without using bank partners. As a result, only 4% of vehicles delivered in Q4 were subject to lease accounting. |
|
• |
GAAP Automotive gross margin slightly decreased to 24.3% in Q4 from 25.8% in Q3 primarily due to lower regulatory credit sales in Q4. Non-GAAP Automotive gross margin decreased to 24.7% in Q4 from 25.5% in the prior quarter due to a $43 million decline in non-ZEV credit revenue and negative impact from Chinese import duties. |
|
• |
Model 3 gross margin stayed flat compared to Q3, remaining above 20% despite the headwinds described above. The mix of the Performance versions of Model 3 remained only slightly above the percentage mix of Performance versions of Model S and X. |
|
• |
Gross margin of Model S and Model X declined very slightly compared to Q3, which was in line with our guidance. Further cost reductions partially offset lowered prices in China as well as other negative factors. For full year 2018, Model S and Model X non-GAAP gross margin improved by over 500 bp and GAAP gross margin improved by over 300 bp compared to 2017, mainly due to significant cost reductions. |
|
|
Three Months Ended |
|
|
Change |
|
|||||||||||||
|
|
December 31, |
|
|
September 30, |
|
|
December 31, |
|
|
|
|
|
|
|
|
|||
|
|
2018 |
|
|
2018 |
|
|
2017 |
|
|
QoQ |
|
YoY |
|
|||||
|
Energy generation and storage revenue ($000) |
$ |
371,497 |
|
|
$ |
399,317 |
|
|
$ |
298,037 |
|
|
|
-7 |
% |
|
25 |
% |
|
Energy generation and storage gross margin |
|
11.5 |
% |
|
|
17.2 |
% |
|
|
5.5 |
% |
|
|
-570 |
bp |
|
604 |
bp |
|
• |
Energy generation and storage revenue in Q4 decreased by 7% over Q3 and increased by 25% compared to Q4 2017. This year-over-year increase was mainly driven by a substantial growth in energy storage deployments. |
|
• |
GAAP gross margin of the Energy business in Q4 dropped significantly to 11.5% compared to Q3 mainly due to the typical seasonal decline in solar energy production and correspondingly lower lease revenue in the winter months, Solar Roof ramp cost, and a higher mix of lower margin energy storage business. |
Other Highlights
|
• |
Service and Other revenue in Q4 increased by 63% compared to Q3. This was mainly due to increased used car sales and higher revenue from service and merchandise sales. |
|
• |
Service and Other gross margin in Q4 improved sequentially to negative 26%. Total gross loss of Service and Other increased compared to Q3. |
|
• |
Our total GAAP operating expenses decreased to $1.03 billion in Q4, which was 7% less than in Q3. Excluding one-time restructuring and other costs, operating expenses decreased by 5% sequentially. |
|
• |
Income attributable to non-controlling interests impacted our income statement negatively by $71 million in Q4. The asset backed securitization (ABS) of auto leases completed in Q4 resulted in a change of ownership structure of those leased vehicles. This required a non-cash charge of $54 million attributable to non-controlling interests. |
|
• |
Interest and Other expenses, net were $182 million in Q4 compared to $145 million in Q3. Non-cash items accounted for $87 million of total interest expense in Q4. |
|
• |
There were approximately 172 million basic shares outstanding at the end of Q4. |
Cash Flow and Liquidity
|
• |
Our cash position increased by $718 million in Q4, despite the scheduled repayment of our $230 million convertible bonds. |
|
• |
Cash flow from operating activities in Q4 was $1.23 billion. Operating cash flow remained strong although our days payable outstanding decreased significantly, partially limiting the positive impact of working capital. |
|
• |
Customer deposits decreased sequentially by $113 million in Q4 to $793 million as we continue to work through our Model 3 backlog. |
OUTLOOK
Model 3 production volumes in Fremont should gradually continue to grow throughout 2019 and reach a sustained rate of 7,000 units per week by the end of the year. We are planning to continue to produce Model 3 vehicles at maximum production rates throughout 2019. Inclusive of Gigafactory Shanghai, where we are initially aiming for 3,000 Model 3 vehicles per week, our goal is to be able to produce 10,000 vehicles per week on a sustained basis. Barring unexpected challenges with Gigafactory Shanghai, we are targeting annualized Model 3 output in excess of 500,000 units sometime between Q4 of 2019 and Q2 of 2020.
While the number of Model 3 vehicles produced should increase sequentially in Q1, deliveries in North America during Q1 will be lower than the prior quarter as we start delivering cars in Europe and China for the first time. As a result of the start of Model 3 expansion into Europe and China, deliveries will be lower than production by about 10,000 units due to vehicle transit times to these markets.
Because of the first scheduled reduction of the federal EV tax credit on January 1, 2019, we likely saw a pull-forward of demand in the US for Model S and Model X into 2018. Both Model S and Model X reached all-time high market shares in the US in the second half of 2018. Model S, for example, accounted for 38% of its segment in the US. Because this high level of demand presumably represented a pull-forward, we are expecting our Model S and Model X deliveries in Q1 2019 to be slightly below Q1 2018.
We continue to target a 25% Model 3 non-GAAP gross margin at some point in 2019. While there are many moving parts that will ultimately determine gross margin, we believe that significant cost reductions combined with better fixed-cost absorption and careful management of mix should enable us to get to this profit level. We expect that gross margin for Model S and Model X should remain relatively stable compared to 2018.
Energy generation and storage revenue should increase significantly in 2019, mainly due to the storage business. We expect that the deployment of retrofit solar systems in Q1 will be slightly lower than in Q4 due to seasonality. The gross margin of our Energy business should grow as the energy storage margin continues to improve from its current level.
We expect our Services and Other business to continue to grow, mainly due to projected used car sales volumes in 2019. We should continue to see further sequential improvements in gross margin throughout this year.
Our operating expenses will grow by less than 10% in 2019, thus creating massive leverage given the top line growth in 2019. This year, we will continue to implement more automation projects, and our ongoing cost reduction efforts will also make an impact. Since about 70% of Model 3 customers made a purchase without a test drive in the second half of 2018, we believe we can leverage our retail network further.
We expect that the restructuring actions taken in Q1 will reduce our costs by about $400 million annually. Our Q1 financials will reflect a one-time restructuring cost. The gap between production and deliveries in Q1 will create a temporary but predictable dip in our revenues and earnings. As a result, our optimistic target is to achieve a very small GAAP net income in Q1, but that will require us to successfully execute on many fronts including handling logistics and delivery challenges in Europe and China. The higher in-transit inventory will also negatively impact operating cash flows in Q1.
In total, we are expecting to deliver 360,000 to 400,000 vehicles in 2019, representing a growth of approximately 45% to 65% compared to 2018. In this range, we are expecting to have positive GAAP net income and to generate positive free cash flow (operating cash flow less capex) in every quarter beyond Q1 2019. We believe these results will be substantially driven by our restructuring action and the ongoing financial discipline with which we are managing the business.
Our 2019 capex, the vast majority of which will be to grow our capacity and develop new vehicles, is expected to be about $2.5 billion. We believe this amount should be sufficient to continue to develop our main projects, such as Gigafactory Shanghai, Model Y and Tesla Semi, as well as for the further expansion of our Supercharger, service and retail networks. We expect to arrange financing through local banks in China to fund most of the capex for Gigafactory Shanghai.
Since Model Y will be built on the Model 3 platform and is designed to share about 75% of its components with Model 3, the cost of the Model Y production line should be substantially lower than the Model 3 line in Fremont, and the production ramp should also be faster.
This year should be a truly exciting one for Tesla. Model 3 will become a global product, the profitability of our business should become sustainably positive, our new Gigafactory Shanghai should start producing cars, and we will start tooling for Model Y production. Our growth opportunities are massive. Our accomplishments have been possible thanks to the exceptional effort of our employees and the support of our customers, suppliers and investors. We hope you’re as excited as we are about 2019.
|
|
|
|
|
Elon Musk |
|
Deepak Ahuja |


Tesla will provide a live webcast of its fourth quarter and full year 2018 financial results conference call beginning at 2:30 p.m. PT on January 30, 2019, at ir.tesla.com. This webcast will also be available for replay for approximately one year thereafter.
NON-GAAP FINANCIAL INFORMATION
Consolidated financial information has been presented in accordance with GAAP as well as on a non-GAAP basis to supplement our consolidated financial results. Our non-GAAP financial measures include non-GAAP gross margin, non-GAAP net income (loss) attributable to common stockholders, non-GAAP net income (loss) attributable to common stockholders on a per share basis, and operating cash flows plus change in collateralized lease borrowing. Management believes that it is useful to supplement its GAAP financial statements with this non-GAAP information because management uses such information internally for its operating, budgeting and financial planning purposes. These non-GAAP financial measures also facilitate management’s internal comparisons to Tesla’s historical performance as well as comparisons to the operating results of other companies. Management also believes that presentation of the non-GAAP financial measures provides useful information to our investors regarding our financial condition and results of operations because it allows investors greater transparency to the information used by Tesla management in its financial and operational decision-making so that investors can see through the eyes of Tesla management regarding important financial metrics that Tesla management uses to run the business as well as allows investors to better understand Tesla’s performance. Non-GAAP information is not prepared under a comprehensive set of accounting rules and therefore, should only be read in conjunction with financial information reported under U.S. GAAP when understanding Tesla’s operating performance. A reconciliation between GAAP and non-GAAP financial information is provided below.
FORWARD-LOOKING STATEMENTS
Certain statements in this letter, including statements in the “Outlook” section; statements relating to the development, production, production rates, ramp and timing of existing and future Tesla products and technologies such as Model 3, Autopilot, Solar Roof, Model Y, Tesla Semi and Supercharger; statements regarding growth in the number of Tesla store, service center, Supercharger and Destination Charger locations and in other service and repair capabilities; statements regarding growth of our energy business and the means to achieve such growth; statements regarding growing market opportunities for Tesla products and the catalysts for that growth; statements regarding the ability to achieve our targets with respect to product demand, volume, production, delivery, leasing, market share, inventory and deployment; statements regarding revenue, cash availability and generation, cash flow, gross margin, product pricing, spending, capital expenditure and profitability targets; statements regarding productivity improvements, cost reductions and capacity expansion plans, such as for customer deliveries, logistics and vehicle servicing; statements regarding our Fremont factory, Gigafactory 1 and Gigafactory Shanghai, including cost, project financing and timing, plans and output expectations, including those related to vehicle, battery and other production; and statements regarding our investment in and the impact of changes to our customer delivery infrastructure, are “forward-looking statements” that are subject to risks and uncertainties. These forward-looking statements are based on management’s current expectations, and as a result of certain risks and uncertainties, actual results may differ materially from those projected. The following important factors, without limitation, could cause actual results to differ materially from those in the forward-looking statements: the risk of delays in the manufacture, production, delivery and/or completion of our vehicles and energy products, particularly Model 3; the ability of Tesla to design and grow simultaneous and separate market acceptance of and demand for Model S, Model X, Model 3 and their variants, as well as new vehicle models such as Model Y; the ability of suppliers to meet quality and part delivery expectations at increasing volumes, especially with respect to Model 3 parts; adverse foreign exchange movements; any failures by Tesla products to perform as expected or if product recalls occur; Tesla’s ability to continue to reduce or control manufacturing and other costs; consumers’ willingness to adopt electric vehicles; competition in the automotive and energy product markets generally and the alternative fuel vehicle market and the premium sedan, premium SUV and small to medium-sized sedan markets in particular; Tesla’s ability to establish, maintain and strengthen the Tesla brand; Tesla’s ability to manage future growth effectively as we rapidly grow, especially internationally; the unavailability, reduction or elimination of government and economic incentives for electric vehicles and energy products; Tesla’s ability to establish, maintain and strengthen its relationships with strategic partners such as Panasonic; potential difficulties in performing and realizing potential benefits under definitive agreements for our existing and future manufacturing facilities; Tesla’s ability to maintain schedules, output and cost estimates for our manufacturing facilities; and Tesla’s ability to execute on our strategy for new store, service center, Supercharger and other locations and capabilities. More information on potential factors that could affect our financial results is included from time to time in our Securities and Exchange Commission filings and reports, including the risks identified under the section captioned “Risk Factors” in our quarterly report on Form 10-Q filed with the SEC on November 2, 2018. Tesla disclaims any obligation to update information contained in these forward-looking statements whether as a result of new information, future events, or otherwise.
|
Investor Relations Contact: Martin Viecha Investor Relations ir@tesla.com |
|
|
|
Press Contact: Dave Arnold Communications press@tesla.com
|
Condensed Consolidated Statements of Operations
(Unaudited)
(In thousands, except per share data)
|
|
|
Three Months Ended |
|
|
Year Ended |
|
||||||||||||||
|
|
|
December 31, |
|
|
September 30, |
|
|
December 31, |
|
|
December 31, |
|
|
December 31, |
|
|||||
|
|
|
2018 |
|
|
2018 |
|
|
2017 |
|
|
2018 |
|
|
2017 |
|
|||||
|
Revenues |
|
|
|
|
|
|
|
|
|
|
|
|
|
|
|
|
|
|
|
|
|
Automotive sales |
|
$ |
6,073,471 |
|
|
$ |
5,878,305 |
|
|
$ |
2,409,109 |
|
|
$ |
17,631,522 |
|
|
$ |
8,534,752 |
|
|
Automotive leasing |
|
|
249,748 |
|
|
|
220,461 |
|
|
|
293,086 |
|
|
|
883,461 |
|
|
|
1,106,548 |
|
|
Total automotive revenue |
|
|
6,323,219 |
|
|
|
6,098,766 |
|
|
|
2,702,195 |
|
|
|
18,514,983 |
|
|
|
9,641,300 |
|
|
Energy generation and storage |
|
|
371,497 |
|
|
|
399,317 |
|
|
|
298,037 |
|
|
|
1,555,244 |
|
|
|
1,116,266 |
|
|
Services and other |
|
|
531,157 |
|
|
|
326,330 |
|
|
|
288,017 |
|
|
|
1,391,041 |
|
|
|
1,001,185 |
|
|
Total revenues |
|
|
7,225,873 |
|
|
|
6,824,413 |
|
|
|
3,288,249 |
|
|
|
21,461,268 |
|
|
|
11,758,751 |
|
|
Cost of revenues |
|
|
|
|
|
|
|
|
|
|
|
|
|
|
|
|
|
|
|
|
|
Automotive sales |
|
|
4,658,517 |
|
|
|
4,405,919 |
|
|
|
1,999,631 |
|
|
|
13,685,572 |
|
|
|
6,724,480 |
|
|
Automotive leasing |
|
|
127,731 |
|
|
|
119,283 |
|
|
|
191,541 |
|
|
|
488,425 |
|
|
|
708,224 |
|
|
Total automotive cost of revenues |
|
|
4,786,248 |
|
|
|
4,525,202 |
|
|
|
2,191,172 |
|
|
|
14,173,997 |
|
|
|
7,432,704 |
|
|
Energy generation and storage |
|
|
328,706 |
|
|
|
330,554 |
|
|
|
281,715 |
|
|
|
1,364,896 |
|
|
|
874,538 |
|
|
Services and other |
|
|
668,019 |
|
|
|
444,992 |
|
|
|
376,576 |
|
|
|
1,880,354 |
|
|
|
1,229,022 |
|
|
Total cost of revenues |
|
|
5,782,973 |
|
|
|
5,300,748 |
|
|
|
2,849,463 |
|
|
|
17,419,247 |
|
|
|
9,536,264 |
|
|
Gross profit |
|
|
1,442,900 |
|
|
|
1,523,665 |
|
|
|
438,786 |
|
|
|
4,042,021 |
|
|
|
2,222,487 |
|
|
Operating expenses |
|
|
|
|
|
|
|
|
|
|
|
|
|
|
|
|
|
|
|
|
|
Research and development |
|
|
356,297 |
|
|
|
350,848 |
|
|
|
354,637 |
|
|
|
1,460,370 |
|
|
|
1,378,073 |
|
|
Selling, general and administrative |
|
|
667,452 |
|
|
|
729,876 |
|
|
|
682,290 |
|
|
|
2,834,491 |
|
|
|
2,476,500 |
|
|
Restructuring and other |
|
|
5,615 |
|
|
|
26,184 |
|
|
|
— |
|
|
|
135,233 |
|
|
|
— |
|
|
Total operating expenses |
|
|
1,029,364 |
|
|
|
1,106,908 |
|
|
|
1,036,927 |
|
|
|
4,430,094 |
|
|
|
3,854,573 |
|
|
Income (loss) from operations |
|
|
413,536 |
|
|
|
416,757 |
|
|
|
(598,141 |
) |
|
|
(388,073 |
) |
|
|
(1,632,086 |
) |
|
Interest income |
|
|
7,348 |
|
|
|
6,907 |
|
|
|
6,280 |
|
|
|
24,533 |
|
|
|
19,686 |
|
|
Interest expense |
|
|
(174,723 |
) |
|
|
(175,220 |
) |
|
|
(146,363 |
) |
|
|
(663,071 |
) |
|
|
(471,259 |
) |
|
Other (expense) income, net |
|
|
(14,205 |
) |
|
|
22,876 |
|
|
|
(41,677 |
) |
|
|
21,866 |
|
|
|
(125,373 |
) |
|
Income (loss) before income taxes |
|
|
231,956 |
|
|
|
271,320 |
|
|
|
(779,901 |
) |
|
|
(1,004,745 |
) |
|
|
(2,209,032 |
) |
|
Provision (benefit) for income taxes |
|
|
21,878 |
|
|
|
16,647 |
|
|
|
(9,094 |
) |
|
|
57,837 |
|
|
|
31,546 |
|
|
Net income (loss) |
|
|
210,078 |
|
|
|
254,673 |
|
|
|
(770,807 |
) |
|
|
(1,062,582 |
) |
|
|
(2,240,578 |
) |
|
Net income (loss) attributable to noncontrolling interests and redeemable noncontrolling interests |
|
|
70,595 |
|
|
|
(56,843 |
) |
|
|
(95,457 |
) |
|
|
(86,491 |
) |
|
|
(279,178 |
) |
|
Net income (loss) attributable to common stockholders |
|
$ |
139,483 |
|
|
$ |
311,516 |
|
|
$ |
(675,350 |
) |
|
$ |
(976,091 |
) |
|
$ |
(1,961,400 |
) |
|
Net income (loss) per share of common stock attributable to common stockholders – basic and diluted |
|
|
|
|
|
|
|
|
|
|
|
|
|
|
|
|
|
|
|
|
|
Basic |
|
$ |
0.81 |
|
|
$ |
1.82 |
|
|
$ |
(4.01 |
) |
|
$ |
(5.72 |
) |
|
$ |
(11.83 |
) |
|
Diluted |
|
$ |
0.78 |
|
|
$ |
1.75 |
|
|
$ |
(4.01 |
) |
|
$ |
(5.72 |
) |
|
$ |
(11.83 |
) |
|
Weighted average shares used in computing net income (loss) per share of common stock – basic and diluted |
|
|
|
|
|
|
|
|
|
|
|
|
|
|
|
|
|
|
|
|
|
Basic |
|
|
172,026 |
|
|
|
170,893 |
|
|
|
168,314 |
|
|
|
170,525 |
|
|
|
165,758 |
|
|
Diluted |
|
|
179,026 |
|
|
|
178,196 |
|
|
|
168,314 |
|
|
|
170,525 |
|
|
|
165,758 |
|
Condensed Consolidated Balance Sheets
(Unaudited)
(In thousands)
|
|
|
December 31, |
|
|
December 31, |
|
||
|
|
|
2018 |
|
|
2017 |
|
||
|
Assets |
|
|
|
|
|
|
|
|
|
Current assets |
|
|
|
|
|
|
|
|
|
Cash and cash equivalents |
|
$ |
3,685,618 |
|
|
$ |
3,367,914 |
|
|
Restricted cash |
|
|
192,551 |
|
|
|
155,323 |
|
|
Accounts receivable, net |
|
|
949,022 |
|
|
|
515,381 |
|
|
Inventory |
|
|
3,113,446 |
|
|
|
2,263,537 |
|
|
Prepaid expenses and other current assets |
|
|
365,671 |
|
|
|
268,365 |
|
|
Total current assets |
|
|
8,306,308 |
|
|
|
6,570,520 |
|
|
Operating lease vehicles, net |
|
|
2,089,758 |
|
|
|
4,116,604 |
|
|
Solar energy systems, leased and to be leased, net |
|
|
6,271,396 |
|
|
|
6,347,490 |
|
|
Property, plant and equipment, net |
|
|
11,330,077 |
|
|
|
10,027,522 |
|
|
Goodwill and intangible assets, net |
|
|
350,651 |
|
|
|
421,739 |
|
|
MyPower customer notes receivable, net of current portion |
|
|
421,548 |
|
|
|
456,652 |
|
|
Restricted cash, net of current portion |
|
|
398,219 |
|
|
|
441,722 |
|
|
Other assets |
|
|
571,657 |
|
|
|
273,123 |
|
|
Total assets |
|
$ |
29,739,614 |
|
|
$ |
28,655,372 |
|
|
Liabilities and Equity |
|
|
|
|
|
|
|
|
|
Current liabilities |
|
|
|
|
|
|
|
|
|
Accounts payable |
|
$ |
3,404,451 |
|
|
$ |
2,390,250 |
|
|
Accrued liabilities and other |
|
|
2,094,253 |
|
|
|
1,731,366 |
|
|
Deferred revenue |
|
|
630,292 |
|
|
|
1,015,253 |
|
|
Resale value guarantees |
|
|
502,840 |
|
|
|
787,333 |
|
|
Customer deposits |
|
|
792,601 |
|
|
|
853,919 |
|
|
Current portion of long-term debt and capital leases (1) |
|
|
2,567,699 |
|
|
|
896,549 |
|
|
Total current liabilities |
|
|
9,992,136 |
|
|
|
7,674,670 |
|
|
Long-term debt and capital leases, net of current portion (1) |
|
|
9,403,672 |
|
|
|
9,418,319 |
|
|
Deferred revenue, net of current portion |
|
|
990,873 |
|
|
|
1,177,799 |
|
|
Resale value guarantees, net of current portion |
|
|
328,926 |
|
|
|
2,309,222 |
|
|
Other long-term liabilities |
|
|
2,710,403 |
|
|
|
2,442,970 |
|
|
Total liabilities |
|
|
23,426,010 |
|
|
|
23,022,980 |
|
|
Redeemable noncontrolling interests in subsidiaries |
|
|
555,964 |
|
|
|
397,734 |
|
|
Convertible senior notes (1) |
|
|
— |
|
|
|
70 |
|
|
Total stockholders' equity |
|
|
4,923,243 |
|
|
|
4,237,242 |
|
|
Noncontrolling interests in subsidiaries |
|
|
834,397 |
|
|
|
997,346 |
|
|
Total liabilities and equity |
|
$ |
29,739,614 |
|
|
$ |
28,655,372 |
|
|
|
|
|
- |
|
|
|
- |
|
|
|
|
|
|
|
|
|
|
|
|
(1) Breakdown of our debt is as follows: |
|
|
|
|
|
|
|
|
|
Recourse debt |
|
$ |
7,080,584 |
|
|
$ |
6,755,376 |
|
|
Non-recourse debt |
|
$ |
3,551,891 |
|
|
$ |
2,873,458 |
|
Condensed Consolidated Statement of Cash Flows
(Unaudited)
(In thousands)
|
|
|
Three Months Ended |
|
|
Year Ended |
|
||||||||||||||
|
|
|
December 31, |
|
|
September 30, |
|
|
December 31, |
|
|
December 31, |
|
|
December 31, |
|
|||||
|
|
|
2018 |
|
|
2018 |
|
|
2017 |
|
|
2018 |
|
|
2017 |
|
|||||
|
Cash Flows from Operating Activities |
|
|
|
|
|
|
|
|
|
|
|
|
|
|
|
|
|
|
|
|
|
Net income (loss) |
|
$ |
210,078 |
|
|
$ |
254,673 |
|
|
$ |
(770,807 |
) |
|
$ |
(1,062,582 |
) |
|
$ |
(2,240,578 |
) |
|
Adjustments to reconcile net income (loss) to net cash provided by (used in) operating activities: |
|
|
|
|
|
|
|
|
|
|
|
|
|
|
|
|
|
|
|
|
|
Depreciation, amortization and impairment |
|
|
496,737 |
|
|
|
502,825 |
|
|
|
469,606 |
|
|
|
1,901,050 |
|
|
|
1,636,003 |
|
|
Stock-based compensation |
|
|
205,313 |
|
|
|
204,728 |
|
|
|
134,348 |
|
|
|
749,024 |
|
|
|
466,760 |
|
|
Losses related to the SolarCity acquisition |
|
|
— |
|
|
|
— |
|
|
|
27,950 |
|
|
|
— |
|
|
|
57,746 |
|
|
Other |
|
|
123,385 |
|
|
|
77,737 |
|
|
|
151,756 |
|
|
|
452,359 |
|
|
|
516,018 |
|
|
Changes in operating assets and liabilities, net of effect of business combinations |
|
|
199,048 |
|
|
|
351,318 |
|
|
|
497,038 |
|
|
|
57,951 |
|
|
|
(496,603 |
) |
|
Net cash provided by (used in) operating activities |
|
|
1,234,561 |
|
|
|
1,391,281 |
|
|
|
509,891 |
|
|
|
2,097,802 |
|
|
|
(60,654 |
) |
|
Cash Flows from Investing Activities |
|
|
|
|
|
|
|
|
|
|
|
|
|
|
|
|
|
|
|
|
|
Capital expenditures |
|
|
(324,978 |
) |
|
|
(510,271 |
) |
|
|
(786,688 |
) |
|
|
(2,100,724 |
) |
|
|
(3,414,814 |
) |
|
Payments for the cost of solar energy systems, leased and to be leased |
|
|
(28,923 |
) |
|
|
(49,494 |
) |
|
|
(119,455 |
) |
|
|
(218,792 |
) |
|
|
(666,540 |
) |
|
Business combinations, net of cash acquired |
|
|
(11,108 |
) |
|
|
(1,200 |
) |
|
|
(5,376 |
) |
|
|
(17,912 |
) |
|
|
(114,523 |
) |
|
Net cash used in investing activities |
|
|
(365,009 |
) |
|
|
(560,965 |
) |
|
|
(911,519 |
) |
|
|
(2,337,428 |
) |
|
|
(4,195,877 |
) |
|
Cash Flows from Financing Activities |
|
|
|
|
|
|
|
|
|
|
|
|
|
|
|
|
|
|
|
|
|
Net cash flows from debt activities |
|
|
(184,099 |
) |
|
|
(195,760 |
) |
|
|
28,056 |
|
|
|
37,202 |
|
|
|
2,414,896 |
|
|
Collateralized lease (repayments) borrowings |
|
|
(216,081 |
) |
|
|
(142,568 |
) |
|
|
94,894 |
|
|
|
(559,167 |
) |
|
|
511,321 |
|
|
Net borrowings under Warehouse Agreements and automotive asset-backed notes |
|
|
193,086 |
|
|
|
114,942 |
|
|
|
116,820 |
|
|
|
596,125 |
|
|
|
283,811 |
|
|
Net cash flows from noncontrolling interests - Auto |
|
|
37,575 |
|
|
|
17,224 |
|
|
|
31,763 |
|
|
|
111,753 |
|
|
|
43,417 |
|
|
Net cash flows from noncontrolling interests - Solar |
|
|
(18,567 |
) |
|
|
27,070 |
|
|
|
(5,479 |
) |
|
|
92,120 |
|
|
|
484,070 |
|
|
Proceeds from issuances of common stock in public offerings |
|
|
— |
|
|
|
— |
|
|
|
— |
|
|
|
— |
|
|
|
400,175 |
|
|
Other |
|
|
75,777 |
|
|
|
94,874 |
|
|
|
19,788 |
|
|
|
295,722 |
|
|
|
277,174 |
|
|
Net cash (used in) provided by financing activities |
|
|
(112,309 |
) |
|
|
(84,218 |
) |
|
|
285,842 |
|
|
|
573,755 |
|
|
|
4,414,864 |
|
|
Effect of exchange rate changes on cash and cash equivalents and restricted cash |
|
|
(3,821 |
) |
|
|
(6,370 |
) |
|
|
3,990 |
|
|
|
(22,700 |
) |
|
|
39,726 |
|
|
Net increase (decrease) in cash and cash equivalents and restricted cash |
|
|
753,422 |
|
|
|
739,728 |
|
|
|
(111,796 |
) |
|
|
311,429 |
|
|
|
198,059 |
|
|
Cash and cash equivalents and restricted cash at beginning of period |
|
|
3,522,966 |
|
|
|
2,783,238 |
|
|
|
4,076,755 |
|
|
|
3,964,959 |
|
|
|
3,766,900 |
|
|
Cash and cash equivalents and restricted cash at end of period |
|
$ |
4,276,388 |
|
|
$ |
3,522,966 |
|
|
$ |
3,964,959 |
|
|
$ |
4,276,388 |
|
|
$ |
3,964,959 |
|
Reconciliation of GAAP to Non-GAAP Financial Information
(Unaudited)
(In thousands, except per share data)
|
|
|
Three Months Ended |
|
|
Year Ended |
|
||||||||||||||
|
|
|
December 31, |
|
|
September 30, |
|
|
December 31, |
|
|
December 31, |
|
|
December 31, |
|
|||||
|
|
|
2018 |
|
|
2018 |
|
|
2017 |
|
|
2018 |
|
|
2017 |
|
|||||
|
Automotive gross profit – GAAP |
|
$ |
1,536,971 |
|
|
$ |
1,573,564 |
|
|
$ |
511,023 |
|
|
$ |
4,340,986 |
|
|
$ |
2,208,596 |
|
|
Stock-based compensation expense in automotive cost of revenue |
|
|
22,566 |
|
|
|
20,955 |
|
|
|
16,182 |
|
|
|
71,797 |
|
|
|
43,845 |
|
|
ZEV credit revenue recognized |
|
|
(768 |
) |
|
|
(52,269 |
) |
|
|
(179,142 |
) |
|
|
(103,351 |
) |
|
|
(279,717 |
) |
|
Automotive gross profit excluding SBC and ZEV credit – non-GAAP |
|
$ |
1,558,769 |
|
|
$ |
1,542,250 |
|
|
$ |
348,063 |
|
|
$ |
4,309,432 |
|
|
$ |
1,972,724 |
|
|
|
|
|
|
|
|
|
|
|
|
|
|
|
|
|
|
|
|
|
|
|
|
Automotive gross margin – GAAP |
|
|
24.3 |
% |
|
|
25.8 |
% |
|
|
18.9 |
% |
|
|
23.4 |
% |
|
|
22.9 |
% |
|
Stock-based compensation expense |
|
|
0.4 |
% |
|
|
0.3 |
% |
|
|
0.6 |
% |
|
|
0.4 |
% |
|
|
0.5 |
% |
|
ZEV credit revenue recognized |
|
|
0.0 |
% |
|
|
-0.6 |
% |
|
|
-5.7 |
% |
|
|
-0.4 |
% |
|
|
-2.3 |
% |
|
Automotive gross margin excluding SBC and ZEV credit – non-GAAP |
|
|
24.7 |
% |
|
|
25.5 |
% |
|
|
13.8 |
% |
|
|
23.4 |
% |
|
|
21.1 |
% |
|
|
|
|
|
|
|
|
|
|
|
|
|
|
|
|
|
|
|
|
|
|
|
Net income (loss) attributable to common stockholders – GAAP |
|
$ |
139,483 |
|
|
$ |
311,516 |
|
|
$ |
(675,350 |
) |
|
$ |
(976,091 |
) |
|
$ |
(1,961,400 |
) |
|
Stock-based compensation expense |
|
|
205,313 |
|
|
|
204,728 |
|
|
|
134,348 |
|
|
|
749,024 |
|
|
|
466,760 |
|
|
Losses related to the SolarCity acquisition |
|
|
— |
|
|
|
— |
|
|
|
27,950 |
|
|
|
— |
|
|
|
57,746 |
|
|
Net income (loss) attributable to common stockholders – non-GAAP |
|
$ |
344,796 |
|
|
$ |
516,244 |
|
|
$ |
(513,052 |
) |
|
$ |
(227,067 |
) |
|
$ |
(1,436,894 |
) |
|
|
|
|
|
|
|
|
|
|
|
|
|
|
|
|
|
|
|
|
|
|
|
Net income (loss) per share attributable to common stockholders, basic – GAAP |
|
$ |
0.81 |
|
|
$ |
1.82 |
|
|
$ |
(4.01 |
) |
|
$ |
(5.72 |
) |
|
$ |
(11.83 |
) |
|
Stock-based compensation expense |
|
|
1.19 |
|
|
|
1.20 |
|
|
|
0.80 |
|
|
|
4.39 |
|
|
|
2.82 |
|
|
Losses related to the SolarCity acquisition |
|
|
— |
|
|
|
— |
|
|
|
0.17 |
|
|
|
— |
|
|
|
0.35 |
|
|
Net income (loss) per share attributable to common stockholders, basic – non-GAAP |
|
$ |
2.00 |
|
|
$ |
3.02 |
|
|
$ |
(3.04 |
) |
|
$ |
(1.33 |
) |
|
$ |
(8.66 |
) |
|
Shares used in per share calculation, basic – GAAP and non-GAAP |
|
|
172,026 |
|
|
|
170,893 |
|
|
|
168,314 |
|
|
|
170,525 |
|
|
|
165,758 |
|
|
|
|
|
|
|
|
|
|
|
|
|
|
|
|
|
|
|
|
|
|
|
|
Net income (loss) per share attributable to common stockholders, diluted - GAAP |
|
$ |
0.78 |
|
|
$ |
1.75 |
|
|
$ |
(4.01 |
) |
|
$ |
(5.72 |
) |
|
$ |
(11.83 |
) |
|
Stock-based compensation expense |
|
|
1.15 |
|
|
|
1.15 |
|
|
|
0.80 |
|
|
|
4.39 |
|
|
|
2.82 |
|
|
Losses related to the SolarCity acquisition |
|
|
— |
|
|
|
— |
|
|
|
0.17 |
|
|
|
— |
|
|
|
0.35 |
|
|
Net income (loss) per share attributable to common stockholders, diluted - non-GAAP |
|
$ |
1.93 |
|
|
$ |
2.90 |
|
|
$ |
(3.04 |
) |
|
$ |
(1.33 |
) |
|
$ |
(8.66 |
) |
|
Shares used in per share calculation, diluted - GAAP and non-GAAP |
|
|
179,026 |
|
|
|
178,196 |
|
|
|
168,314 |
|
|
|
170,525 |
|
|
|
165,758 |
|